epidemiology of lbp causes of low back pain
TRANSCRIPT

1
Patient Selection In The Era Of Interventional Spine Care:
Differentiating Acute And Chronic Pain
Stanley A. Herring, MD Medical Director Spine Care University of Washington
Co-Medical Director UW Medicine/Harborview Medical Center/Seattle Children’s
Sports Concussion Program Team Physician Seattle Seahawks Team Physician Seattle Mariners
Seattle, Washington
Disclosures
I, Stanley A. Herring MD, nor any family member(s), have any relevant financial relationships to be discussed, directly or indirectly, referred to or illustrated with or without recognition within the presentation
Epidemiology of LBP
• 2nd most common neurologic illness in the U.S.1
• Affects 15%-20% of adults each year2
• Onset usually at 30-50 years, but older adults are also affected3
• Recurrence occurs in 60%-80% within 2 years2
Sources: 1National Center for Health Statistics. Health, United States, 2006. http://www.ncbi.nlm.nih.gov/books/ bookres.fcgi/healthus06/healthus06.pdf; 2UMHS. Acute low back pain; 2005. http://cme.med.umich.edu/pdf/guideline/ backpain03.pdf; 3Deyo RA, Weinstein JN. N Engl J Med 2001;344:363-370; 4Pai S, Sundaram LJ. Orthop Clin North Am 2004;35:1-5.
LBP is the 2nd most common symptomatic reason for physician office visits.4
Approximately 40% of patients with LBP initially seek help from a primary care provider.2
Causes of Low Back Pain
Compression fracture Symptomatic herniated disc
Ankylosing spondylitis Spinal stenosis Cancer Cauda equina syndrome Spinal infection
Source: Chou R, Qaseem A, Snow V, et al. Ann Intern Med 2007;147:478-491.
4% 0.3%-5%
3%
0.01%
4%
0.04%
Nonspecific LBP >85%
0.7%
Increased Use of Interventions, But Not Improved Outcomes
Sources: 1Deyo RA, Gray DT, et al. Spine 2005;30:1441-1445; 2Friedly J, Chan L, et al. Spine 2007;32:1754-1760; 3Boswell MV, Trescot AM, et al. Pain Physician 2007;10:7-111; 4Martin BI, Mirza SK, et al. Spine 2007;32:2119-2126.
0%
100%
200%
300%
Incr
ease
Lumbar Spine Interventions
Extrapolation suggests that 4 times as many are performed in general U.S. population3
• Newer fusion technologies – Not associated with
improved outcomes1
– Associated with higher rates of reoperation4
• <50% of lumbosacral injections are done for radicular pain or radiculopathy, conditions where greatest evidence of benefit is available2
220%
Fusion surgeries
U.S. 1990-20011
Epidural injections
Facet injections
Medicare 1994-20012
271%
123%
Deyo and Mirza. CORR 2006;443:139-146
Lumbar Spine Surgery Utilization

2
Weinstein, Lurie et al. Spine 2006;31:2707-14.
Per 1000 Medicare Enrollees 2002-2003
Lumbar Spine Surgery Utilization
Lumbar Spine Surgery Utilization
• Eight fold variation in regional rates of lumbar discectomy and laminectomy in 2002 and 2003
• Twenty fold variation in regional rates of lumbar fusion in 2002 and 2003
• Largest coefficient of variation of any surgical procedure in the USA
– Weinstein, Lurie et al. Spine 2006;31:2707-14.
Lumbar Spine Surgery Reoperation Rates
• Retrospective analysis of two matched cohorts who had undergone an initial surgery for lumbar degeneration (disc degeneration, disc herniation, stenosis, spondylolisthesis)
• 1990-1993 (24,882) 1997-2000 (25,209) • 4 year follow up
– Martin et al. Spine 2007 ;19:2119-2126
Lumbar Spine Surgery Reoperation Rates
• The fusion rate for initial surgery more than doubled (19.1%) in the 1997-2000 cohort as compared to the 1990-1993 cohort (9.4%)
• The 4-year reoperation rate was higher in the 1997-2000 cohort (14.0%) as compared to the 1990-1993 cohort (12.4%)
• Among fusion patients, those in the 1997-2000 cohort were 40% more likely to have a reoperation within the first year as compared to the 1990-1993 cohort
– Martin et al. Spine 2007 ;19:2119-2126
Lumbar Spine Surgery Reoperation Rates
• For initial surgery for lumbar spine degenerative disease, a high proportion of fusion procedures and use of new spinal implants did not decrease reoperation rates – Martin et al. Spine 2007 ;19:2119-2126
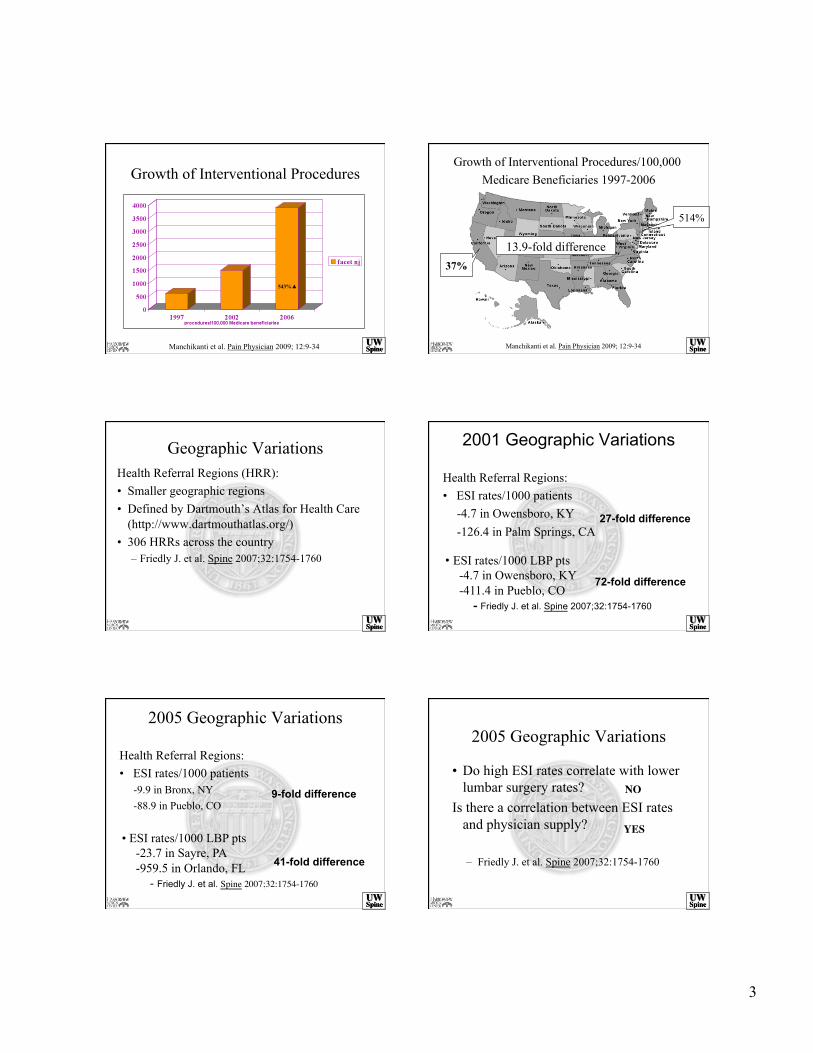
Growth of Interventional Procedures
Manchikanti et al. Pain Physician 2009; 12:9-34
197%▲
3
Growth of Interventional Procedures
Manchikanti et al. Pain Physician 2009; 12:9-34
543%▲
Growth of Interventional Procedures/100,000 Medicare Beneficiaries 1997-2006
Manchikanti et al. Pain Physician 2009; 12:9-34
37%
514%
13.9-fold difference
Geographic Variations Health Referral Regions (HRR): • Smaller geographic regions • Defined by Dartmouth’s Atlas for Health Care
(http://www.dartmouthatlas.org/) • 306 HRRs across the country
– Friedly J. et al. Spine 2007;32:1754-1760
2001 Geographic Variations
Health Referral Regions: • ESI rates/1000 patients
-4.7 in Owensboro, KY -126.4 in Palm Springs, CA
• ESI rates/1000 LBP pts -4.7 in Owensboro, KY -411.4 in Pueblo, CO
- Friedly J. et al. Spine 2007;32:1754-1760
27-fold difference
72-fold difference
2005 Geographic Variations
Health Referral Regions: • ESI rates/1000 patients
-9.9 in Bronx, NY -88.9 in Pueblo, CO
• ESI rates/1000 LBP pts -23.7 in Sayre, PA -959.5 in Orlando, FL
- Friedly J. et al. Spine 2007;32:1754-1760
9-fold difference
41-fold difference
2005 Geographic Variations
• Do high ESI rates correlate with lower lumbar surgery rates?
Is there a correlation between ESI rates and physician supply?
– Friedly J. et al. Spine 2007;32:1754-1760
NO
YES
4
Expenditures and Health Status Among Adults With Back and Neck Problems
• Age- and sex-adjusted analysis of the nationally representative Medical Expenditure Panel Survey (MEPS) from 1997 to 2005
• The estimated proportion of persons with back or neck problems who self-reported physical functioning limitations increased from 20.7% to 24.7% from 1997 to 2005
– Martin et al. JAMA2008;299(6):656-664
Expenditures and Health Status Among Adults With Back and Neck Problems
• Total estimated expenditures among respondents with spine problems increased 65% (adjusted for inflation) from 1997 to 2005, more rapidly than overall health expenditures
• Self-reported measures of mental health, physical functioning, work or school limitations, and social limitations among adults with spine problems were worse in 2005 than in 1997
– Martin et al. JAMA 2008;299(6):656-664
Expenditures and Health Status Among Adults With Back and Neck Problems
• From 1997 to 2005, the mean annual physical therapy expenditures among respondents with spine problems increased from $115 (95% CI, $71 to $160) to $129 (95% CI, $105 to $154). Among respondents without spine problems, physical therapy expenditures decreased from $45 (95% CI, $29 to $61) in 1997 to $33 (95% CI, $25 to $40) in 2005.
– Martin et al. JAMA 2008;299(6):656-664
Expenditures and Health Status Among Adults With Back and Neck Problems
• From 1997 to 2005, there was an estimated 111% increase in total national spine-related expenditures for chiropractor visits.
• National expenditures for spine-related physical therapy increased by an estimated 78%. – Martin et al. JAMA 2008;299(6):656-664
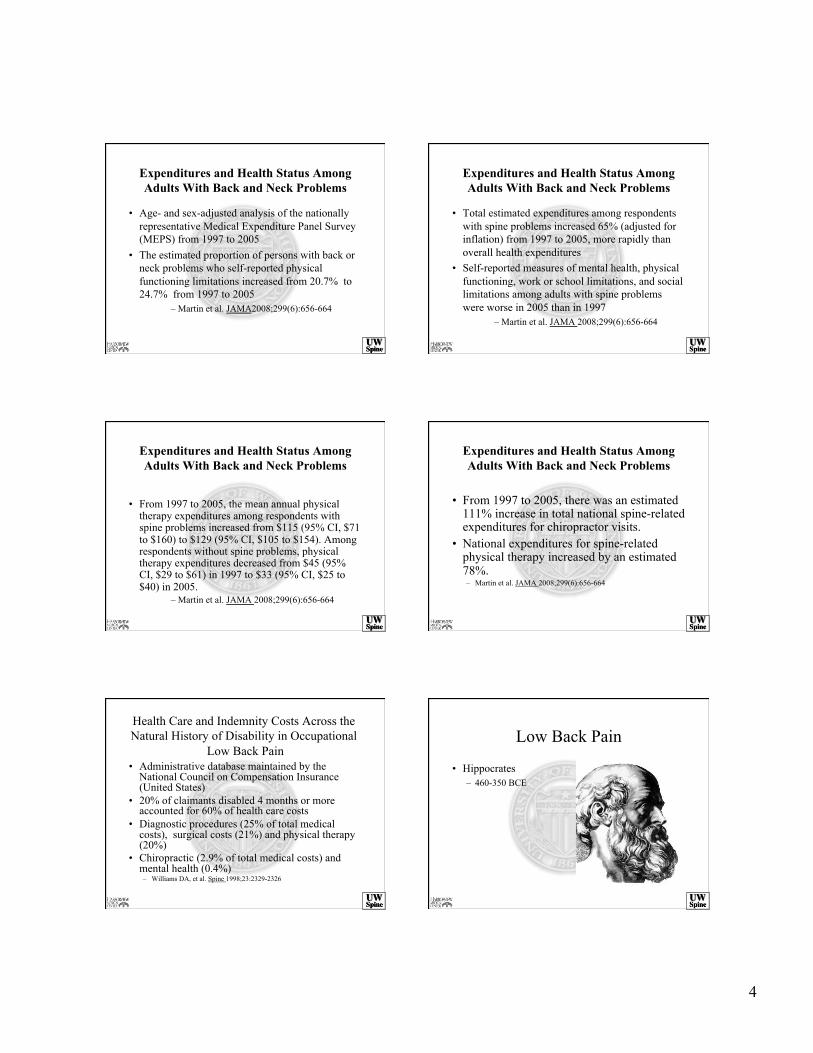
Health Care and Indemnity Costs Across the Natural History of Disability in Occupational
Low Back Pain • Administrative database maintained by the
National Council on Compensation Insurance (United States)
• 20% of claimants disabled 4 months or more accounted for 60% of health care costs
• Diagnostic procedures (25% of total medical costs), surgical costs (21%) and physical therapy (20%)
• Chiropractic (2.9% of total medical costs) and mental health (0.4%) – Williams DA, et al. Spine 1998;23:2329-2326
Low Back Pain
• Hippocrates – 460-350 BCE

5
Low Back Pain
• Hippocrates – 460-350 BCE
• Galen – 129-210 CE
Low Back Pain
• Hippocrates – 460-350 BCE
• Galen – 129-210 CE
• Jacob and Esau’s Angel – 1556 BCE – Genesis 32: 25-29
Low Back Pain
• Hippocrates – 460-350 BCE
• Galen – 129-210 CE
• Jacob and Esau’s Angel – 1556BCE – Genesis 32: 25-29
• St. Laurence – Martyred 258 CE
• Each year, LBP accounts for1
– 149 million lost workdays – $8.8 billion in worker’s compensation costs – $28 billion in productivity losses
• Annual cost of LBP in U.S.2
– Direct: $40 billion – Indirect: >$100 billion
• Rapidly increasing utilization and cost of invasive interventions3,4
Sources: 1Pai S, Sundaram LJ. Orthop Clin North Am 2004;35:1-5; 2UMHS. Acute low back pain; 2005. http://cme.med.umich.edu/pdf/guideline/backpain03.pdf; 3Weinstein JN, Lurie JD, et al. Spine 2006;31:2707-2714; 4Friedly J, Chan L, et al. Spine 2007;32:1754-1760.
LBP: Disability and Cost
Low Back Pain
• The pain is old • The disability is new • Little correlation of disability with objective
findings
Low Back Disability
“Culture makes pain tolerable by interpreting its necessity; only pain perceived as curable is intolerable.”
Ivan Illich, Medical Nemesis 1976

6
Low Back Pain
• Pain – Acute verses
chronic
• Neurological findings
• Instability • Trauma
Pain
An unpleasant sensory and emotional experience associated with actual or potential tissue damage, or described in terms of such damage.
– International Association for the Study of Pain 1994
Pain
An unpleasant sensory and emotional experience associated with actual or potential tissue damage, or described in terms of such damage.
– International Association for the Study of Pain 1994
Pain
• 1 part nociception • 3 parts anxiety
Acute Pain
• Biologically useful • Better-defined
mechanisms • Expectation of
resolution • Social, cultural,
personality issues
– Wilson 1995
Chronic Pain
• Not biologically useful • Less well-defined
mechanisms • By definition does not
resolve • Social, cultural,
personality issues
– Wilson 1995

7
Lumbar Spine Pain
• Find the pain generator
Lumbar Spine Pain
• Find the pain generator – Facet joint
Lumbar Spine Pain
• Find the pain generator – Facet joint – Selective ESI
Lumbar Spine Pain
• Find the pain generator – Facet joint – Selective ESI – Sacro-iliac joint
Lumbar Spine Pain
• Find the pain generator – Facet joint – Selective ESI – Sacro-iliac joint – Discogram
Lumbar Spine Pain
• Find the pain generator – Facet joint – Selective ESI – Sacro-iliac joint – Discogram
• Painfully simplistic

8
Acute Lumbar Spine Pain Convergence
• Skin • Muscle • Fascia • Periosteum • Disc • Facet
Dorsal Horn 2o Neuron
Hogan, Regional Anesthesia, 1997
Overlapping Sensory Input
“Sensory input from the lumbar and pelvic regions is not likely to have sufficient detailed sensory cortical representation for a patient to reliably distinguish discogenic from non-discogenic pain or from one level to another.”
Carragee et al. Diagnostic evaluation of low back pain. Orthop Clinics of North America. 2004
Lumbar Spine Pain Chronic Pain and Brain Function
• 3 pt groups:11 CLBP,16 FM, 11 Controls • CLBP pts screened (med/psych/imaging) • Stimulus of equal pressure (2kg) to the
thumb • Functional MRI of the brain
– Giesecke et al. Arthritis & Rheumatism2004;50(2);613-623
Lumbar Spine Pain Chronic Pain and Brain Function
Giesecke et al. Arthritis & Rheumatism, 2004
Lumbar Spine Pain Chronic Pain and Brain Function
Is CLBP due to augmented central pain processing versus damage or inflammation of peripheral structures? - Giesecke et al. 2004
Lumbar Spine Pain Chronic Pain and Brain Morphology
• CLBP patients (26) and controls (26) • Neuropathic and non-neuropathic CLBP • Brain MRI and automated analysis
techniques – Apkarian et al. J of Neuroscience 2004; 24(46):
10410-10415
9
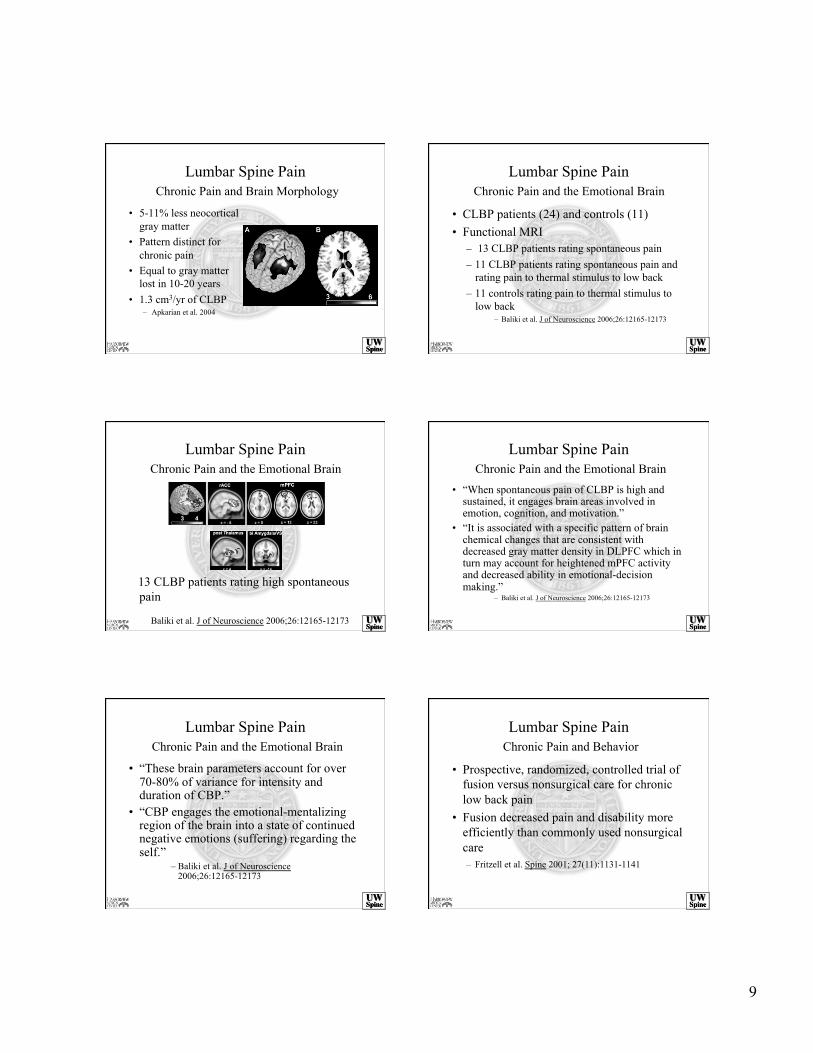
Lumbar Spine Pain Chronic Pain and Brain Morphology
• 5-11% less neocortical gray matter
• Pattern distinct for chronic pain
• Equal to gray matter lost in 10-20 years
• 1.3 cm3/yr of CLBP – Apkarian et al. 2004
Lumbar Spine Pain Chronic Pain and the Emotional Brain
• CLBP patients (24) and controls (11) • Functional MRI
– 13 CLBP patients rating spontaneous pain – 11 CLBP patients rating spontaneous pain and
rating pain to thermal stimulus to low back – 11 controls rating pain to thermal stimulus to
low back – Baliki et al. J of Neuroscience 2006;26:12165-12173
Lumbar Spine Pain Chronic Pain and the Emotional Brain
13 CLBP patients rating high spontaneous pain
Baliki et al. J of Neuroscience 2006;26:12165-12173
Lumbar Spine Pain Chronic Pain and the Emotional Brain
• “When spontaneous pain of CLBP is high and sustained, it engages brain areas involved in emotion, cognition, and motivation.”
• “It is associated with a specific pattern of brain chemical changes that are consistent with decreased gray matter density in DLPFC which in turn may account for heightened mPFC activity and decreased ability in emotional-decision making.”
– Baliki et al. J of Neuroscience 2006;26:12165-12173
Lumbar Spine Pain Chronic Pain and the Emotional Brain
• “These brain parameters account for over 70-80% of variance for intensity and duration of CBP.”
• “CBP engages the emotional-mentalizing region of the brain into a state of continued negative emotions (suffering) regarding the self.”
– Baliki et al. J of Neuroscience 2006;26:12165-12173
Lumbar Spine Pain Chronic Pain and Behavior
• Prospective, randomized, controlled trial of fusion versus nonsurgical care for chronic low back pain
• Fusion decreased pain and disability more efficiently than commonly used nonsurgical care – Fritzell et al. Spine 2001; 27(11):1131-1141

10
Lumbar Spine Pain Chronic Pain and Behavior
• Prospective, randomized, controlled trials of fusion versus nonsurgical care for chronic low back pain
• Equal improvement in fusion and nonsurgical patients – Brox et al. Spine 2003;28(17):2551–60 – Fairbank et al BMJ 2005; 330:1233
Lumbar Spine Pain Chronic Pain and Behavior
• Why the difference? • Nonsurgical groups
– Usual care (Fritzell) – Cognitive behavioral
intervention (Brox and Fairbank)
Lumbar Spine Pain Chronic Pain and Behavior
• 100 pts with mild, nondisabling LBP with high risk factors for serious LBP
• Prospective, longitudinal, observational study (q6 month follow up for 5years)
• Baseline physical exam, X-ray, MRI, psychometrics, and selected discography – Carragee et. al., The Spine Journal 5:24-35, 2005
Lumbar Spine Pain Chronic Pain and Behavior
• Degenerative disk disease
• Disk herniation • Annular disruption • Endplate changes • Discography
Lumbar Spine Pain Chronic Pain and Behavior
“Baseline psychosocial variables strongly predicted both long- and short -term disability events, duration, and health-care visits for LBP problems. (p<0.0001-0.004)” - Carragee et al. 2005
Lumbar Spine Pain Treatment Plan
• Before ordering diagnostic tests • Before prescribing medications, physical
therapy, selective injections • Before offering surgical intervention • Learn to ask different questions

11
Lumbar Spine Pain Pain Is Influenced By
• Life experiences – Severity and chronicity of symptoms – Mental illness – Abuse – Family dynamics
“It’s your mother. She is calling to remind you of how painful your birth was. “
Lumbar Spine Pain Pain Is Influenced By
• Beliefs regarding: – Physicians – Medications – System – Work – Activity
Beliefs and Lumbar Spine Pain
• Cross-national comparison of workers’ compensation claims for LBP in Japan and the state of Washington (1995-1999)
• Similar wage compensation for time loss • Study controlled for
– Prevalence of back pain among workers – Income per capita
– Volinn et al. Spine, 2005;V30(6): 697-704
Beliefs and Lumbar Spine Pain
• The low back claim rate was 60 times higher in Washington than in Japan (1999)
Volinn et al. 2005
Chronic Disability: Health and Economic Consequences • Randomized controlled trial of 213 LBP
patients with self perceived risk of disability – Treatment as usual +
• Pamphlet • Information packet once per week for 6 weeks • Cognitive behavioral therapy 2 hour session once a
week for 6 weeks
– Linton et al. Spine 25:2825-2831, 2000

12
Chronic Disability: Health and Economic Consequences • One year follow up • Cognitive behavioral group
– Long term sick leave decreased nine fold – Fewer visits to physicians (P<0.001) and
physical therapists (P<0.01) – Significant decrease in perceived risk (P<0.05)
– Linton et al. Spine 25:2825-2831, 2000
Chronic Disability: Health and Economic Consequences • Five year follow up • Cognitive behavioral group
– Long term sick leave decreased threefold – No difference in healthcare use – Less pain (P<0.05) and were more active
(P<0.001) – Better quality of life
– Linton and Nordin Spine 31:853-858, 2006
Acute Low Back Pain
• Randomized clinical trial of 66 acute low back pain patients
• Fear-avoidance-based physical therapy verses standard care
• Oswestry Disability and Fear Avoidance Belief Questionnaires and Pain Intensity – George et. al. Spine 2003;28:2551-2560
Acute Low Back Pain
• At 4 week and 6 month follow-up, patients with elevated fear-avoidance beliefs who received fear-avoidance-based physical therapy (including de-emphasizing anatomical findings) : – Had less disability – Showed a positive shift in fear-avoidance
beliefs - George et. al. Spine, 2003
“For every serious problem, there is a solution that is elegant, succinct, definitive,
and wrong.” H.L. Mencken 1880-1956
Low Back Pain
Pain is a complex perception- an experience- not a thing that can be surgically excised or pharmacologically “killed.”
– Sinclair 2003

13
Chronic Low Back Pain A painful situation is modified by numerous factors inherent to a given individual as well as their greater psycho-social environment.
Suffering is the psychological response and is more clinically relevant.
– Sinclair 2003
Brief Psychological Report
Patient’s Name: ________________
Date: ______________
Diagnosis (check one):
______Nuts _____Not Nuts
Low Back Pain • Disabling chronic low back pain is a
different disease than acute low back pain, and it requires different treatment.
Disabling Chronic Low Back Pain
• Even with awareness of psychosocial issues – Patients may not display overt pain behaviors – It takes time – It often takes a team – It takes an advocate
Low Back Pain
• The mystery is in the history • The solution for most patients is not to be
found in new technologies or at the tip of a needle
• Until treatment decisions are based on better patient selection, we often do not best serve our patients
• The costs rise and the outcomes fall
Low Back Pain
“Of several remedies, the physician should choose the least sensational.” -Hippocrates
460-350BCE

14