epidemiology of tuberculosis in northeastern united states, 1993-2005 kenneth g. castro, m.d....
TRANSCRIPT

Epidemiology of Tuberculosis in Northeastern United States, 1993-2005
Kenneth G. Castro, M.D.Assistant Surgeon General, USPHS
Director, Division of Tuberculosis EliminationNational Center for HIV, Hepatitis, STD, and TB Prevention*
Coordinating Center for Infectious Diseases* Proposed
Northeast TB Controllers MeetingPrinceton, New Jersey
October 24, 2006

Acknowledgements• United States TB controllers, state and local health
departments
• CDC, DTBE, SEOIB and FSEB– Lori Armstrong − Sandy Althomsons– Elvin Magee − Val Robison– Tom Navin − Dave Crowder– Dan Ruggiero − John Jereb– Mark Lobato − Margaret Oxtoby– Edwin Rodriguez − Tracy Agerton– Farah Parvez − Sonal Munsiff– Vernard Green − Tom Privett– Zach Taylor

TB Cases Analyzed
• National TB Surveillance System
• Reported 1993 to 2005
• Northeastern States: Maine, New Hampshire, Vermont, Connecticut, Massachusetts, Rhode Island, New York, New Jersey
• Compared to all other states in the U.S.

TB Case Rates,* United States, 2005
< 3.5 (year 2000 target)
3.6–4.8
> 4.8 (national average)
D.C.
*Cases per 100,000.
NE states

Reported TB Case Rates in U.S.,NE vs. Other States, 1993-2005
Year
Ra
te T
B C
as
es/
10
0,0
00
0.0
1.0
2.0
3.0
4.0
5.0
6.0
7.0
8.0
2000 2001 2002 2003 2004 2005
NE States All other states Nationwide
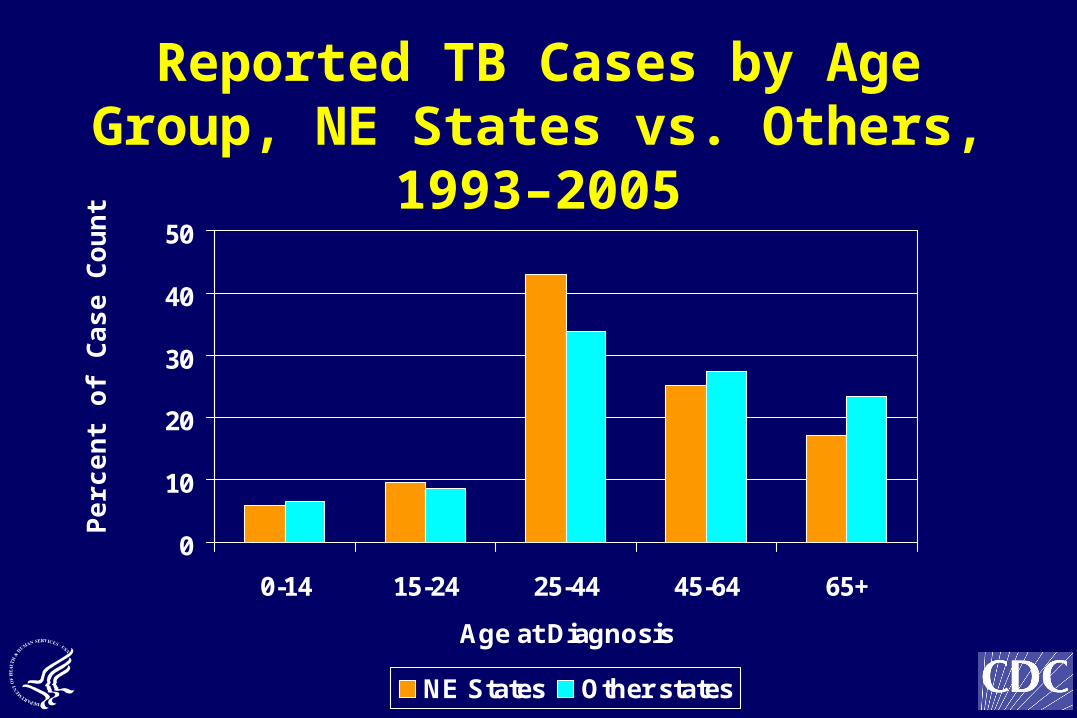
Reported TB Cases by Age Group, NE States vs. Others, 1993–2005
0
10
20
30
40
50
0-14 15-24 25-44 45-64 65+
Age at Diagnosis
NE States Other states
Pe
rce
nt
of
Cas
e C
ou
nt

Reported TB Cases by Race/Ethnicity,*NE States vs. Others, 1993–2005
Hispanic(25%) Black
(36%)
Asian(20%)
White(18%)
Amer Indian/Nat Alaskan(<1%)
Nat Hawaiian/
Pacific (<1%)
*All races are non-Hispanic. Persons reporting two or more races accounted for less than 1% of all cases. Unknown not included.
Hispanic(23%)
Black(31%)
Asian(19%)
White(25%)
NE States Other States
Amer Indian/Nat Alaskan(1%)
Nat Hawaiian/
Pacific (<1%)

Reported TB Cases by Birth Origin,NE States vs. Others, U.S., 1993–2005*
Note: Unknown not included
Birth Origin NE States
n (%)
Other States
n (%)
US-Born 21,051 (49.2) 116,601 (59.7)
Foreign-born 21,769 (50.8) 78,741 (40.3)

TB Cases, by Previous Diagnosis, NE States vs. Others, U.S., 1993–2005*
Note: Unknown and missing not included*Updated as of March 29, 2006.
NE States
n (%)
Other states
n (%)
Previous diagnosis of TB
1,695 (4.0) 10,785 (5.5)
No previous diagnosis of TB
41,153 (96.0) 183,777 (94.5)

HIV Test Results of TB Cases,NE States vs. Others, U.S., 1993–2005*
HIV Status NE States
n (%)
Other states
n (%)
HIV Positive 8,357 (19.4) 18,025 (9.2)
HIV Negative 15,180 (35.3) 64,023 (32.6)
Missing or Unknown
19,456 (45.3) 114,511 (58.2)

* Excludes unknown and missing.Directly observed therapy (DOT); Self-administered therapy (SA)
Mode of Treatment Administration in Persons Reported with TB,
NE States vs. Others, U.S., 1993–2003*
0%
20%
40%
60%
80%
100%
NE States OtherStates
DOT only DOT + SA SA only

Percent Completion of TB Therapy,* NE States vs. Others, U.S., 1993-2005
0
20
40
60
80
100
1993 1994 1995 1996 1997 1998 1999 2000 2001 2002 2003
NE States Other US
*Healthy People 2010 target: 90% completed in 1 yr or less.Note: Excludes persons with initial isolate resistant to rifampin and children <15 years old with meningeal, bone or joint, or miliary disease excluded.
Percent
Year

Reason Therapy Stopped in TB Cases, NE States vs. Others, U.S., 1993–2005*
010
203040
5060
7080
NE States Other States
Completed Moved Lost Uncoop/Refused Died Other Missing/Unk
Percent

MDR TB* in NE States vs. Others,U.S., 1993-2005
0
1
2
3
4
5
6
7
8
NE States Other US
% M
DR
TB
Year of Reporting
%MDR TB cases = no. of TB cases with Mycobacterium tuberculosis isolatesresistant to isoniazid and rifampin, among all cases tested to isoniazid and rifampin

MDR TB by Birth Origin, NE States vs. Others, U.S., 1993-2005
Birth Origin NE States
n (%)
Other US
n (%)
Foreign-born 390 (34.5) 1082 (64.2)
U.S.-born 735 (65.1) 589 (35.0)
Unknown origin 4 (0.4) 13 (0.8)
Total 1129 (100.0) 1684 (100.0)

TB Epidemiology Summary in NE States*• Heterogeneous states (high, medium, low incidence)
• Consistently higher rates
• Majority (58.6%) younger than 44 years
• Most (82%) racial/ethnic minorities
• Lower proportion (49.2%) U.S.-born
• Higher prevalence (19.2%) HIV infection
• Larger proportion on DOT+SA and SA only treatment
• COT improving (82%), room for improvement
• MDR decreased 1993-2000, recent stagnation
* Compared with other states, U.S., 1993-2005
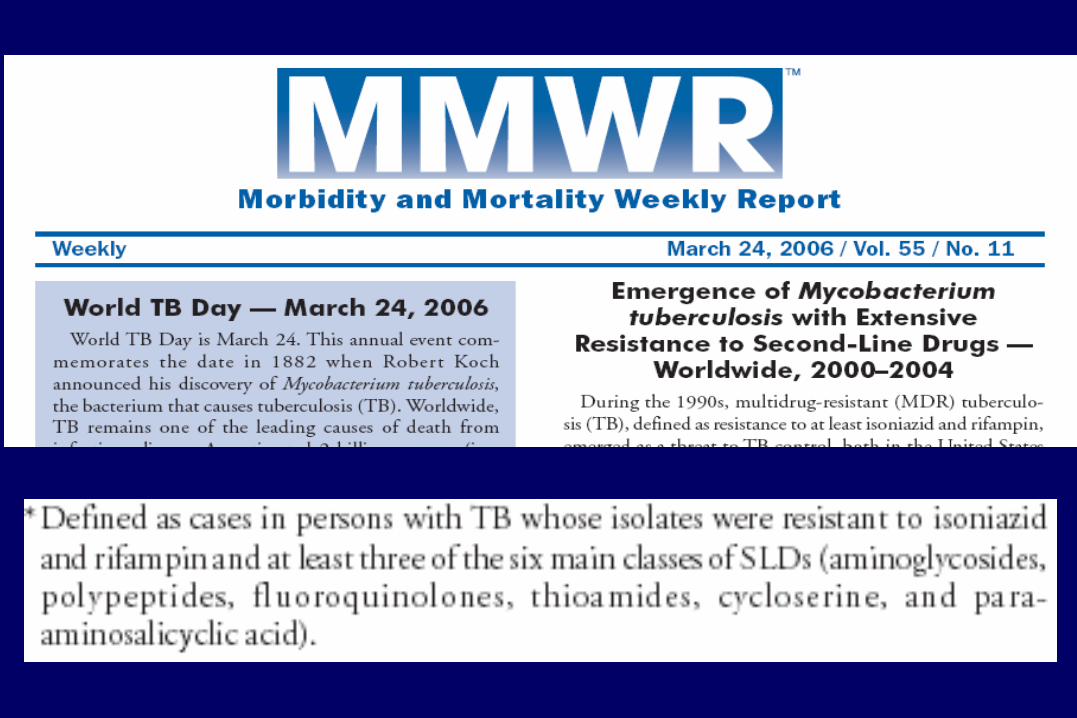

Second-Line Drug Classes for MDR TB Treatment
Amikacin, Kanamycin
Ciprofloxacin, Ofloxacin
Ethionamide, ProthionamideThioamides
PAS
Polypeptides
Serine analogues
Capreomycin
WHO. Guidelines for the programmatic management of drug-resistant tuberculosis. 2006.
Aminoglycosides
Fluoroquinolones
Cycloserine
First line drugs +

Characteristics of KZN XDRTB PatientsCharacteristics No. (%)
• No prior TB Treatment 26 (51)
• Prior TB treatment– Cure or Completed treatment 14 (28)– Treatment Default or Failure 7 (14)
• HIV-infected (44 tested) 44 (100)
• Dead (Includes 34% on ARV) 52 (98)
• Identical M. tb spoligotype 26/30
* Moll A, Gandhi NR, Pawinski R, Lalloo U, Sturm AW, Zeller K, Andrews J, Friedland G.HIV associated Extensively Drug-Resistant TB (XDR-TB) in Rural KwaZulu-Natal (South Africa MRC Expert Consultation Sept 8, 2006)

Hospital
Total Cases
% HIV Infected
% Deaths
Median Wks
Dx to Death
A 65 93 72 7
B 51 100 89 16
C 70 95 77 4
D 29 91 83 4
E 7 14 43 4
F 16 82 82 4
I 13 100 85 4
J 28 96 93 4
Prison 42 98 79 4
HIV-related MDR TB Outbreak Investigations by CDC & Health Departments, USA, 1988–92

U.S. Response to TB ResurgenceNational MDR-TB Action Plan
& New ResourcesImproved Case
Identification & Training
Updated Diagnostic Labs, Real-time Drug Resistance,
& Strain Fingerprinting
Updated Infection Controland Rx Recommendations
DOT & Improved Rx CompletionRebuilt Research Capacity
AJRCCM 1994;149:1359-74

Global 7-point Action Plan to Combat XDR TBEmphasizes Essentials of Proper TB Control
1. Conduct rapid surveys of XDR-TB (determine burden)2. Enhance laboratory capacity (emphasis on rapid DST)3. Improve technical capacity of clinical and public
health practitioners to effectively respond to XDR-TB outbreaks and manage patients
4. Implement infection control precautions (PLHA focus) 5. Increase research support for anti-TB drug
development 6. Increase research support for rapid diagnostic test
development 7. Promote universal access to ARVs under joint TB/HIV
activities MRC Consultation, Johannesburg, South Africa. Sept 7, 2006

Revised WHO Case Definition for XDR TB (Oct 10, 2006)
Goals
• Public health surveillance
• Reliable DST methodology
• Clinical relevance
• Relatively simple
Resistance to at least isoniazid and rifampin(MDR) plus resistance to fluoroquinolonesand one of the second-line injectable drugs(amikacin, kanamycin, or capreomycin)

TB Treatment Outcomes, by Selected Drug Resistance Patterns, Latvia, 2000-2003*
0 10 20 30 40 50 60 70
MDR-TB All
HR+3SLD
HR+INJ+FQ
HR+AG+FQ
Cure Completion Death Default Failed Continue Tx HIV+
* Leimane V, et al. WHO XDR TB Task Force Meeting. Oct 9, 2006 (from N = 820 evaluated)
Percent

XDR(WHO) TB Cases in U.S.,Northeast vs. Other States, 1993-2005
0
2
4
6
8
10
12
14
1993 1995 1997 1999 2001 2003 2005
Other States
NE States
No. XDR TB Cases
Year of Report

XDR(WHO) TB Cases in U.S.,Foreign-born vs. U.S.-born, 1993-2005
0
2
4
6
8
10
12
14
1993 1995 1997 1999 2001 2003 2005
Foreign-born
US-born
No. XDR TB Cases
Year of Report

XDR(WHO) TB Cases in Northeast States, Foreign-born vs. U.S.-born,1993-2005
0
2
4
6
8
10
12
14
1993 1995 1997 1999 2001 2003 2005
Foreign-born
US-born
Year of Report
No. XDR TB Cases

XDR(WHO) TB Cases in Other States, Foreign-born vs. U.S.-born,1993-2005
0
2
4
6
8
10
12
14
1993 1995 1997 1999 2001 2003 2005
Foreign-born
US-born
Year of Report
No. XDR TB Cases

XDR(WHO) TB Cases in U.S.-born vs. Foreign-born Persons, 1993-2005
1993-1998 2000-2005
U.S.-born 19 3
Foreign-born 12 12

TB Clinical Development PipelineCompound Development Stage Sponsor / Coordinator
Gatifloxacin Phase IIIEC / OFLOTUB Consortium; IRD*; WHO TDR; Lupin Ltd.
Moxifloxacin Phase II / III
Bayer; TB Alliance; CDC; University College of London; Johns Hopkins University
Early Bactericidal Activity Johnson & Johnson (Tibotec)
Early Bactericidal Activity Otsuka Pharmaceutical Co., Ltd.
Phase I TB Alliance
Phase I Lupin Ltd.
* Institut de Recherche pour le Developement World Health Organization, Tropical Disease Research Centers for Disease Control and Prevention
Novel compounds, highlighted in blue boxes, are active against MDR/XDR TB
Diarylquinoline TMC207
Nitroimidazo-oxazoleOPC-67683
Nitroimidazole PA-824
Pyrrole LL-3858

Examples of Rapid Drug Resistance Methods
Test GenoType® MTBDR
INNO-LiPA Rif.TB
Company Hain Lifescience
Innogenetics
M. tuberculosis detection Yes Yes
Detection RMP resistance Yes Yes
Detection INH resistance Yes No
Strip Assay Yes Yes
DNA basis: PCR Yes Yes
Direct assay No Yes (modified version)
RMP resistance:rpoB gene Yes Yes
INH resistance:katG gene Yes No

Microscopic-Observation Drug SusceptibilityAssay for the Diagnosis of TB*
Moore DAJ, et al. N Engl J Med 2006;355:1539-50

Actual and BRDPI-Adjusted Federal Funds for TB*, CDC, 1990-2006
$0
$50
$100
$150
$200
1990
1992
1994
1996
1998
2000
2002
2004
2006
Fu
nd
ing
($ x
mil
lio
n)
112
112
Actual $
BRDPI Adjuste
d
* Adjusted to 1990 US$ by Biomedical Research & Development Price Index
** Includes TB/HIV and lab dollars