eppe paper 5
TRANSCRIPT

A Longitudinal Study funded by the DfEE 1997-2003
department for
education and skills
Technical Paper 5 – June 1999
Characteristics of the Centres in the EPPE Sample: Interviews
Th
e Effectiv
e Pro
visio
n o
f Pre-Sch
oo
l Ed
ucatio
n (E
PP
E) P
roject
The Effective Provision of Pre-School
Education [EPPE] Project
A longitudinal Study funded by the DfES
(1997 – 2003)
Technical Paper 5
Characteristics of the Centres in the EPPE Sample: Interviews
Address for correspondence: EPPE Project University of London Institute of Education Tel:+44 (0) 207 612 6219 20 Bedford Way Fax:+44 (0) 207 612 6230 London WC1H 0AL Email: [email protected]

Technical Paper 5
CHARACTERISTICS OF THE CENTRES IN THE EPPE SAMPLE: INTERVIEWS
AUTHORS :
Brenda Taggart Kathy Sylva
Iram Siraj-Blatchford Edward Melhuish Pam Sammons
James Walker-Hall
ACKNOWLEDGEMENT The EPPE project is a major five year study funded by the DfES. The research would not be possible without the support and co-operation of the six Local Authorities (LAs) and the many pre-school centres, primary schools, children and parents participating in the research. The important contribution of the Regional Research Officers Anne Dobson, Isabella Hughes, Marjorie Jeavons, Margaret Kehoe, Katie Lewis, Maria Morahan, Sharon Sadler and our part-time Research Assistants especially, Chris Speed and Ursula Barton, has been vital to the project's completion. We are grateful to both the project's Steering and Consultative Committee for their helpful advice on the study.

THE EPPE RESEARCH TEAM
Principal Investigators Professor Kathy Sylva Department of Educational Studies, University of Oxford
Professor Edward Melhuish Birkbeck, University of London
Professor Pam Sammons Institute of Education, University of London
Professor Iram Siraj-Blatchford Institute of Education, University of London
Research Co-ordinator Brenda Taggart Institute of Education, University of London
Regional Research Officers Anne Dobson Isabella Hughes Marjorie Jeavons Margaret Kehoe Katie Lewis Maria Morahan Sharon Sadler
First Published in December 2000 by the Institute of Education University of London 20 Bedford Way, London WC1H OAL
Pursuing Excellence in Education
ISBN 085473 595 X
Printed by Formara Ltd. Southend on Sea. Essex.
The views expressed in this report are the authors’ and do not necessarily reflect those of the Department for Education and Skills.
© IoE

Contents Page number
Overview of the Project 110
Executive Summary iiii
Introduction 1
Section One: Centre Characteristics 3
1.1 Age, opening times and fees 3
1.2 Number and age of children 3
1.3 Staffing levels 4
1.4 Ratios and quality characteristics 6
1.5 Occasional unpaid helpers 6
1.6 Building facilities 6
1.7 Staff recruitment 7
1.8 Staff turnover 8
1.9 Reasons for staff turnover 10
1.10 Staff development 11
a) Appraisal 11
b) Availability of in-service training 12
c) Content areas of training 12
d) Payment for training 13
e) Books for staff training 14
1.11 Staff working conditions 15
a) Written contracts and job descriptions 15
b) Benefits 16
Summary 17
Section Two: Characteristics of the Work Force 19
2.1 Age profile and gender of managers and their staff 19
2.2 Ethnicity 20
2.3 Years of service 22
2.4 Hours worked per week 23
2.5 Contact time with children 23
2.6 Qualifications – Managers 24
2.7 Qualifications – Staff 26
2.8 Salary 27
2.9 Other professional staff 28
Summary 29

Section Three: The Centres’ Programmes and Activities 31
3.1 Views on objectives 31
3.2 Views of the quality of care and education 32
3.3 Perceived importance and performance of aspects of pre-school 32
3.4 Discrepancy between importance and performance 34
3.5 Relationship between manager ratings of quality and the
ECERS-R and ECERS-E 36
3.6 Assessing children 37
a) entry assessments 37
b) regular assessments 38
c) child assessment training 40
3.7 Planning 41
a) use of timetables and curriculum 41
b) personnel who plan 42
c) materials used in planning learning activities 42
d) use of assessment information in planning 43
e) paid planning time 44
f) payment for staff meetings 45
3.8 Provision for children with special needs 45
a) number of children with special needs 45
b) the identification of special needs 46
c) strategies for special needs 47
Summary 49
Section Four: Centres and parents 50
4.1 Parental access and interaction with staff 50
4.2 Parent/staff meetings 51
4.3 Availability of a parents’ room 52
4.4 Other areas of centre – parent contact 52
4.5 Settling children in 53
4.6 Assessment Feedback to Parents 54
4.7 Educational support for parents 54
Summary 56
References 57
Appendices 5871

1
Effective Provision of Pre-school Education
“EPPE”
Overview of the Project
This series of 12 reports describes the research on effective pre-school provision funded by the UK Department for Education & Employment (DfEE). Further details appear in Technical Paper 1 (Sylva, Sammons, Melhuish, Siraj-Blatchford & Taggart 1999). This longitudinal study assesses the attainment and development of children followed longitudinally between the ages of 3 and 7 years. Three thousand children were recruited to the study over the period January 1997 to April 1999 from 141 pre-school centres. Initially 114 centres from four types of provision were selected for the study but in September 1998 an extension to the main study was implemented to include innovative forms of provision, including ‘combined education and care’ (Siraj-Blatchford et al. 1997). Both qualitative and quantitative methods (including multilevel modelling) have been used to explore the effects of individual pre-school centres on children's attainment and social/behavioural development at entry to school and any continuing effects on such outcomes at the end of Key Stage 1 (age 7). In addition to centre effects, the study investigates the contribution to children’s development of individual and family characteristics such as gender, ethnicity, language, parental education and employment. This overview describes the research design and discusses a variety of research issues (methodological and practical) in investigating the impact of pre-school provision on children’s developmental progress. A parallel study is being carried out in Northern Ireland. There have been many initiatives intended to improve educational outcomes for young children. Will these initiatives work? Will they enable children to enter school ‘more ready’ to learn, or achieve more at the end of Key Stage 1? Which are the most effective ways to educate young children? The research project described in this paper is part of the new emphasis on ensuring ‘a good start’ for children.
PREVIOUS RESEARCH ON THE EFFECTS OF EARLY EDUCATION IN THE UK There has been little large-scale, systematic research on the effects of early childhood education in the UK. The ‘Start Right’ Enquiry (Ball 1994; Sylva 1994) reviewed the evidence of British research and concluded that small-scale studies suggested a positive impact but that large-scale research was inconclusive. The Start Right enquiry recommended more rigorous longitudinal studies with baseline measures so that the ‘value added’ to children’s development by pre-school education could be established. Research evidence elsewhere on the effects of different kinds of pre-school environment on children's development (Melhuish et al. 1990; Melhuish 1993; Sylva & Wiltshire 1993; Schweinhart & Weikart 1997; Borge & Melhuish, 1995; National Institute of Child Health Development 1997) suggests positive outcomes. Some researchers have examined the impact of particular characteristics, e.g. gender and attendance on children's adjustment to nursery classes (Davies & Brember 1992), or adopted cross-sectional designs to explore the impact of different types of pre-school provision (Davies & Brember 1997). Feinstein, Robertson & Symons (1998) attempted to evaluate the effects of pre-schooling on children’s subsequent progress but birth cohort designs may not be appropriate for the study of the influence of pre-school education. The absence of data about children’s attainments at entry to pre-school means that neither the British Cohort Study (1970) nor the National Child Development Study

2
(1958) can be used to explore the effects of pre-school education on children’s progress. These studies are also limited by the time lapse and many changes in the nature of pre-school provision which have occurred. To date no research using multilevel models (Goldstein 1987) has been used to investigate the impact of both type of provision and individual centre effects. Thus little research in the UK has explored whether some forms of provision have greater benefits than others. Schagen (1994) attempted multilevel modelling but did not have adequate control at entry to pre-school. In the UK there is a long tradition of variation in pre-school provision both between types (e.g. playgroup, local authority or private nursery or nursery classes) and in different parts of the country reflecting Local Authority funding and geographical conditions (i.e. urban/rural and local access to centres). A series of reports (House of Commons Select Committee 1989; DES Rumbold Report 1990; Ball 1994) have questioned whether Britain's pre-school education is as effective as it might be and have urged better co-ordination of services and research into the impact of different forms of provision (Siraj-Blatchford 1995). The EPPE project is thus the first large-scale British study on the effects of different kinds of pre-school provision and the impact of attendance at individual centres.
OVERVIEW OF RESEARCH METHODS The EPPE project is a major study instituted in 1996 to investigate three issues which have important implications for policy and practice:
• the effects on children of different types of pre-school provision, • the ‘structural’ (e.g. adult-child ratios) and ‘process’ characteristics (e.g. interaction styles) of more
effective pre-school centres, and • the interaction between child and family characteristics and the kind of pre-school provision a
child experiences. An educational effectiveness research design was chosen to investigate these topics because this enabled the research team to investigate the progress and development of individual children (including the impact of personal, socio-economic and family characteristics), and the effect of individual pre-school centres on children's outcomes at both entry to school (the start of Reception which children can enter between the ages of 4 and 5 plus) and at the end of Key Stage 1 (age 7 plus). Such research designs are well suited to social and educational research with an institutional focus (Paterson & Goldstein 1991). The growing field of school effectiveness research has developed an appropriate methodology for the separation of intake and school influences on children's progress using so called 'value added' multilevel models (Goldstein 1987, 1995). As yet, however, such techniques have not been applied to the pre-school sector, although recent examples of value added research for younger ages at the primary level have been provided by Tymms et al. 1997; Sammons & Smees 1998; Jesson et al. 1997; Strand 1997; and Yang & Goldstein 1997. These have examined the relationship between baseline assessment at reception to infant school through to Key Stage 1 (age 7 plus years). School effectiveness research during the 1970s and 1980s addressed the question "Does the particular school attended by a child make a difference?" (Mortimore et al. 1988; Tizard et al. 1988). More recently the question of internal variations in effectiveness, teacher/class level variations and stability in effects of particular schools over time have assumed importance (e.g. Luyten 1994; 1995; Hill & Rowe 1996; Sammons 1996). This is the first research to examine the impact of individual pre-school centres using multilevel approaches. The EPPE project is designed to examine both the impact of type of pre-school provision as well as allow the identification of particular pre-school characteristics which have longer term effects. It is also designed to establish whether there are differences in the effects of individual pre-school centres on children's progress and development. In addition, the project explores the impact of pre-school provision for different groups of children and the extent to which pre-schools are effective in promoting different kinds of outcomes (cognitive and social/behavioural).
3
The 8 aims of the EPPE Project
• To produce a detailed description of the 'career paths' of a large sample of children and their
families between entry into pre-school education and completion (or near completion) of Key Stage 1.
• To compare and contrast the developmental progress of 3,000+ children from a wide range of
social and cultural backgrounds who have differing pre-school experiences including early entry to Reception from home.
• To separate out the effects of pre-school experience from the effects of education in the period
between Reception and Year 2. • To establish whether some pre-school centres are more effective than others in promoting
children's cognitive and social/emotional development during the pre-school years (ages 3-5) and across Key Stage 1 (5-7 years).
• To discover the individual characteristics (structural and process) of pre-school education in those
centres found to be most effective. • To investigate differences in the progress of different groups of children, e.g. second language
learners of English, children from disadvantaged backgrounds and both genders. • To investigate the medium-term effects of pre-school education on educational performance at
Key Stage 1 in a way which will allow the possibility of longitudinal follow-up at later ages to establish long-term effects, if any.
• To relate the use of pre-school provision to parental labour market participation.
The sample: regions, centres and children
In order to maximise the likelihood of identifying the effects of individual centres and also the effects of various types of provision, the EPPE sample was stratified by type of centre and geographical location.
• Six English Local Authorities (LAs) in five regions were chosen strategically to participate in the research. These were selected to cover provision in urban, suburban and rural areas and a range of ethnic diversity and social disadvantage. (Another related project covering Northern Ireland was instituted in April 1998 [Melhuish et al. 1997]. This will enable comparison of findings across different geographical contexts.)
• Six main types of provision are included in the study (the most common forms of current
provision; playgroups, local authority or voluntary day nurseries, private day nurseries, nursery schools, nursery classes, and centres combining care and education. Centres were selected randomly within each type of provision in each authority.
In order to enable comparison of centre and type of provision effects the project was designed to recruit 500 children, 20 in each of 20-25 centres, from the six types of provision, thus giving a total sample of approximately 3000 children and 140 centres1. In some LAs certain forms of provision are less common and others more typical. Within each LA, centres of each type were selected by stratified random sampling and, due to the small size of some centres in the project (e.g. rural playgroups), more of these
1 The nursery school and combined centre samples were added in 1998 and their cohorts will be assessed somewhat later;
results will be reported separately and in combined form.

4
centres were recruited than originally proposed, bringing the sample total to 141 centres and over 3000 children. Children and their families were selected randomly in each centre to participate in the EPPE Project. All parents gave written permission for their children to participate. In order to examine the impact of no pre-school provision, it was proposed to recruit an additional sample of 500 children pre-school experience from the reception classes which EPPE children entered. However in the five regions selected a sample of only 200+ children was available for this ‘home’ category. The progress and development of pre-school children in the EPPE sample is being followed over four years until the end of Key Stage 1. Details about length of sessions, number of sessions normally attended per week and child attendance have been collected to enable the amount of pre-school education experienced to be quantified for each child in the sample. Two complicating factors are that a substantial proportion of children have moved from one form of pre-school provision to another (e.g. from playgroup to nursery class) and some will attend more than one centre in a week. Careful records are necessary in order to examine issues of stability and continuity, and to document the range of pre-school experiences to which individual children can be exposed.
Child assessments
Around the third birthday, or up to a year later if the child entered pre-school provision after three, each child was assessed by a researcher on four cognitive tasks: verbal comprehension, naming vocabulary, knowledge of similarities seen in pictures, and block building. A profile of the child’s social and emotional adjustment was completed by the pre-school educator who knew the child best. If the child changed pre-school before school entry, he or she was assessed again. At school entry, a similar cognitive battery was administered along with knowledge of the alphabet and rhyme/alliteration. The Reception teacher completed the social emotional profile. Further assessments were made at exit from Reception and at the end of Years 1 and 2. In addition to standardised tests of reading and mathematics, information on National Assessments will be collected along with attendance and special needs. At age 7, children will also be invited to report themselves on their attitudes to school.
Measuring child/family characteristics known to have an impact on children’s development
1) Information on individual ‘child factors’ such as gender, language, health and birth order was
collected at parent interview. 2) Family factors were investigated also. Parent interviews provided detailed information about parent
education, occupation and employment history, family structure and attendance history. In addition, details about the child's day care history, parental attitudes and involvement in educational activities (e.g. reading to child, teaching nursery rhymes, television viewing etc) have been collected and analysed.

5
Pre-school Characteristics and Processes
Regional researchers liaised in each authority with a Regional Coordinator, a senior local authority officer with responsibility for Early Years who arranged ‘introductions’ to centres and key staff. Regional researchers interviewed centre managers on: group size, child staff ratio, staff training, aims, policies, curriculum, parental involvement, etc. ‘Process’ characteristics such as the day-to-day functioning within settings (e.g. child-staff interaction, child-child interaction, and structuring of children's activities) were also studied. The Early Childhood Environment Rating Scale (ECERS) which has been recently adapted (Harms, Clifford & Cryer 1998) and the Caregiver Interaction Scale (Arnett 1989) were also administered. The ECERS includes the following sub-scales:
• Space and furnishings • Personal care routines • Language reasoning • Activities • Interaction • Programme structure • Parents and staffing
In order that the more educational aspects of English centres could be assessed, Sylva, Siraj-Blatchford, Taggart & Colman (unpublished) developed four additional ECERS sub-scales describing educational provision in terms of: Language, Mathematics, Science and the Environment, and Diversity.
Setting the centres in context
In addition to describing how each centre operated internally, qualitative interviews were conducted with centre managers to find out the links of each setting to local authority policy and training initiatives. Senior local authority officers from both Education and Social Services were also interviewed to find out how each local authority implemented Government early years policy, especially the Early Years Development Plans which were established to promote education and care partnerships across providers in each local authority.
Case Studies
In addition to the range of quantitative data collected about children, their families and their pre-school centres, detailed qualitative data will be collected using case studies of several “effective” pre-school centres (chosen retrospectively as ‘more effective’ on the basis of the multilevel analyses of intake and outcome measures covering the period baseline to entry into reception). This will add the fine-grained detail to how processes within centres articulate, establish and maintain good practice. The methodology of the EPPE project is thus mixed. These detailed case studies will use a variety of methods of data gathering, including documentary analysis, interviews and observations and the results will help to illuminate the characteristics of more successful pre-school centres and assist in the generation of guidance on good practice. Particular attention will be paid to parent involvement, teaching and learning processes, child-adult interaction and social factors in learning. Inevitably there are difficulties associated with the retrospective study of process characteristics of centres identified as more or less effective after children in the EPPE sample have transferred to school and it will be important to examine field notes and pre-school centre histories to establish the extent of change during the study period.

6
ANALYTIC STRATEGY
The EPPE research was designed to enable the linking of three sets of data: information about children's attainment and development (at different points in time), information about children's personal, social and family characteristics (e.g. age, gender, SES etc), and information about pre-school experience (type of centre and its characteristics).
Identifying individual centre effects and type of provision at entry to school
Longitudinal research is essential to enable the impact of child characteristics (personal, social and family) to be disentangled from any influence related to the particular pre-school centre attended. Multilevel models investigate the clustered nature of the child sample, children being nested within centres and centres within regions. The first phase of the analysis adopts these three levels in models which attempt to identify any centre effects at entry to reception class. Given the disparate nature of children's pre-school experience it is vital to ensure that the influences of age at assessment, amount and length of pre-school experience and pre-school attendance record are accounted for when estimating the effects of pre-school education. This information is also important in its own right to provide a detailed description of the range of pre-school provision experienced by different children and any differences in the patterns of provision used by specific groups of children/parents and their relationship to parents' labour market participation. Predictor variables for attainment at entry to reception will include prior attainment (verbal and non-verbal sub scales), social/emotional profiles, and child characteristics (personal, social and family). The EPPE multilevel analyses will seek to incorporate adjustment for measurement error and to examine differences in the performance of different groups of children at entry to pre-school and again at entry to reception classes. The extent to which any differences increase/decrease over this period will be explored, enabling equity issues to be addressed. After controlling for intake differences, the estimated impact of individual pre-school centres will be used to select approximately 12 ‘outlier’ centres from the 141 in the project for detailed case studies (see ‘Case Studies’ above). In addition, multilevel models will be used to test out the relationship between particular process quality characteristics of centres and children's cognitive and social/behavioural outcomes at the end of the pre-school period (entry to school). The extent to which it is possible to explain (statistically) the variation in children's scores on the various measures assessed at entry to reception classes will provide evidence about whether particular forms of provision have greater benefits in promoting such outcomes by the end of the pre-school period. Multilevel analyses will test out the impact of measures of pre-school process characteristics, such as the scores on various ECERS scales and Pre-School Centre structural characteristics such as ratios. This will provide evidence as to which measures are associated with better cognitive and social/behavioural outcomes in children.
Identifying continuing effects of pre-school centres at KS1
Cross-classified multilevel models have been used to examine the long term effects of primary schools on later secondary performance (Goldstein & Sammons, 1997). In the EPPE research it is planned to use such models to explore the possible mid-term effects of pre-school provision on later progress and attainment at primary school at age 7. The use of cross classified methods explicitly acknowledges that children's educational experiences are complex and that over time different institutions may influence cognitive and social/behavioural development for better or worse. This will allow the relative strength of any continuing effects of individual pre-school centre attendance to be ascertained, in comparison with the primary school influence.

7
THE LINKED STUDY IN NORTHERN IRELAND 1998-2003 The Effective Pre-school Provision in Northern Ireland (EPPNI) is part of EPPE and is under the directorship of Professor Edward Melhuish, Professor Kathy Sylva, Dr. Pam Sammons, and Dr. Iram Siraj-Blatchford. The study explores the characteristics of different kinds of early years provision and examines children’s development in pre-school, and influences on their later adjustment and progress at primary school up to age 7 years. It will help to identify the aspects of pre-school provision which have a positive impact on children’s attainment, progress, and development, and so provide guidance on good practice. The research involves 70 pre-school centres randomly selected throughout Northern Ireland. The study investigates all main types of pre-school provision attended by 3 to 4 year olds in Northern Ireland: playgroups, day nurseries, nursery classes, nursery schools and reception groups and classes. The data from England and Northern Ireland offer opportunities for potentially useful comparisons.
SUMMARY This “educational effectiveness” design of the EPPE research study enables modelling of the complicated effects of amount and type of pre-school provision (including attendance) experienced by children and their personal, social and family characteristics on subsequent progress and development. Assessment of both cognitive and social/behavioural outcomes has been made. The use of multilevel models for the analysis enables the impact of both type of provision and individual centres on children's pre-school outcomes (at age 5 and later at age 7) to be investigated. Moreover, the relationships between pre-school characteristics and children's development can be explored. The results of these analyses and the findings from the qualitative case studies of selected centres can inform both policy and practice. A series of 12 technical working papers will summarise the findings of the research. .

8
EPPE Technical Papers in the Series Technical Paper 1 – An Introduction to the Effective Provision of Pre-School Education (EPPE) Project ISBN: 0 85473 591 7 Published: Autumn 1999 Price £3.50 Technical Paper 2 – Characteristics of the Effective Provision of Pre-School Education (EPPE) Project sample at entry to the study ISBN: 0 85473 592 5 Published: Autumn 1999 Price £4.00 Technical Paper 3 – Contextualising EPPE: Interviews with Local Authority co-ordinators and centre managers ISBN: 0 85473 593 3 Published: Autumn 1999 Price £3.50 Technical Paper 4 – Parent, family and child characteristics in relation to type of Pre-School and socio-economic differences ISBN: 0 85473 594 1 Published: Autumn 1999 Price £4.00 Technical Paper 5 – Report on centre characteristics in the EPPE Study : (Interviews) ISBN: 0 85473 595 X Published: Autumn 2000 Price £5.00 Technical Paper 6 – Characteristics of the Centres in the EPPE Sample: Observational Profiles
ISBN: 0 85473 596 8 Published: Autumn 1999 Price £5.00 Technical Paper 6A – Characteristics of Pre-School Environments
ISBN: 0 85473 597 6 Published: Autumn 1999 Price £3.50 Technical Paper 7 – Social/behavioural and cognitive development at 3–4 years in relation to family background ISBN: 0 85473 598 4 Published: Spring 2001 Price £5.00 Technical Paper 8a – Measuring the Impact of Pre-School on Children's Cognitive Progress over the Pre-School Period ISBN: 0 85473 599 2 Published : Autumn 2002 Price £8.00 Technical Paper 8b – Measuring the Impact of Pre-School on Children's Social Behavioural Development over the Pre-School Period ISBN: 0 85473 684 2 Publication Date: Spring 2003 Technical Paper 9 – Report on age 6 assessment ISBN: 0 85473 600 X Publication Date: Summer 2003 Technical Paper 10 – Case Studies ISBN: 0 85473 601 8 Publication Date: Summer 2003 Technical Paper 11 – Report on the continuing effects of pre-school education at age 7
ISBN: 0 85473 602 6 Publication Date: Autumn 2003 Technical Paper 12 – The final report ISBN: 0 85473 603 4 Publication Date: Spring 2004 The Early Years Transition and Special Educational Needs (EYTSEN) is a linked project which draws on data from the EPPE study . EYTSEN Papers : Technical Paper 1 – Special needs across the Pre-School Period ISBN 085473 680 8
Published Autumn -2002 Price £6.00 Technical Paper 2 – Special needs in the Early Years at Primary School ISBN 085473 681 6
Publication Date Summer 2003. Technical Paper 3 – Special needs in the Early Years : The Parents’ Perspective ISBN 085473 682 4
Publication Date Summer 2003. Ordering information The Bookshop at the Institute of Education. 20, Bedford Way. London WC1H OAL.
Tel: 00 44 (0) 207 612 6050 Fax: 0207 612 6407 Email: [email protected]
website: www.johnsmith.co.uk/ioe
or The EPPE Office. The University of London, Institute of Education. 20 Bedford Way, London. WC1H OAL. U.K. Tel: 00
44 (0) 207 612 6219 Fax: 00 44 (0) 207 612 6230 Email: [email protected]
Website: http://www.ioe.ac.uk/projects/eppe
Please note : Prices will vary according to size of publication and quantities ordered.

9
REFERENCES
Arnett, J. (1989) Caregivers in Day-Care Centres: Does training matter? Journal of Applied Developmental Psychology, 10, 541-552.
Ball, C. (1994) Startright: The Importance of Early Learning, London: RSA. Borge, A., & Melhuish, E., (1995) A Longitudinal Study of Childhood Behaviour Problems, Maternal Employment
and Day-care in Rural Norwegian Community, International Journal of Behavioural Development, 18, 23-42.
Davies, J. & Brember, I. (1992) The Effects of Gender, Attendance Period and Age on Children's Adjustment to
Nursery Classes, Research in Education, 47, 89-103. Davies, J, & Brember, I. (1997) The Effects of Pre-School Experience on Reading Attainment: a four year cross-
sectional study, Educational Psychology, 178, 3, 255-266. Department of Education & Science (1990) The Report of the Committee of Inquiry into the Quality of the
Educational Experience offered to 3- and 4-year olds (Rumbold, A), London: HMSO. Feinstein, L., Robertson, D. & Symons, J. (1998) Pre-school Education and Attainment in the NCDS and BCSI
Centre for Economic Performance, London Goldstein, H. (1987) Multilevel Models in Educational and Social Research, London: Charles Griffin and Co. Goldstein, H. (1995) Multilevel Statistical Models (2nd Edition), London: Edward Arnold. Goldstein, H. & Sammons, P. (1997) The Influence of Secondary and Junior Schools on Sixteen Year
Examination Performance: A Cross-Classified Multilevel Analysis, School Effectiveness and School Improvement, 8, (2): 219-230.
Harms, T., Clifford, R. & Cryer, D. (1998) Early Childhood Environment Rating Scale Revised, New York and
London: Teachers' College Press. Hill, P. & Rowe, K. (1996) Multilevel Modelling in School Effectiveness Research, School Effectiveness and
School Improvement, 7, (1): 1-34. House of Commons Select Committee (1989) The Education of Children 3-5, London: HMSO. Jesson, D., Bartlett, D., & Machon, C., (1997) Baseline Assessment and School Improvement - the use of data
from the assessment of children on entry to school to support the raising of standards, paper presented to the annual conference of the British Educational Research Association, University of York, September 1997.
Luyten, H. (1994) Stability of School Effects in Dutch Secondary Education: The impact of variance across
subjects and years, International Journal of Educational Research, 21, (2): 197-216. Luyten, H. (1995) Teacher Change and Instability Across Grades, School Effectiveness and School Improvement,
1, (1): 67-89. Melhuish, E.C. (1993) Pre-school care and education: Lessons from the 20th and the 21st century, International
Journal of Early Years Education, 1, 19-32. Melhuish, E.C., Lloyd, E., Martin, S. & Mooney, A. (1990) Type of day-care at 18 months: ii Relations with
Cognitive and Language Development, Journal of Child Psychology and Psychiatry, 31, 861-870. Melhuish, E.C., Sylva, K., Sammons, P. & Siraj-Blatchford, I. (1997) Effective Pre-School Provision in Northern
Ireland, proposal to the DfEE for research linked to the Effective Provision of Pre-school Education Project.

10
Mortimore, P., Sammons, P., Stoll, L., Lewis, D. & Ecob, R. (1988) School Matters: The Junior Years, Wells: Open Books.
National Institute of Child Health & Development (1997) The effects of infant child care on infant-mother
attachment security: Restuls of the NICHD study of early child care, Child Development, 68, (5): 860-879. Paterson, L. & Goldstein H. (1991) New statistical methods of analysing social structures: an introduction to
multilevel models, British Educational Research Journal, 17, (4): 387-393. Sammons, P. (1996) Complexities in the judgement of school effectiveness. Educational Research and Evaluation,
Vol. 2 113 – 149 Sammons, P. & Smees, R. (1998) Measuring Pupil Progress at Key Stage 1: using baseline assessment to
investigate value added. School Leadership and Management, Vol. 18, No. 3, pp.389 – 407 Schweinhart, L.J. & Weikart, D.P., (1997) Lasting Differences, The High/Scope preschool curriculum comparison
through age 23. High/Scope Press, Ypsilanti, Michigan. Siraj-Blatchford, I. (1995) Expanding Combined Nursery Provision: Bridging the gap between care and
education, in P Gammage and J Meighan The Early Years: The Way Forward, Nottingham: Education New Books.
Siraj-Blatchford, I., Sylva, K., Melhuish, E. & Sammons, P. (1997) Studying the Effects of Innovations in Nursery
School Provision, a proposal to the DfEE for research linked to the Effective Provision of Pre-school Education Project
Strand, S. (1997) Pupil Progress during Key Stage 1: A value added analysis of school effects, British
Educational Research Journal, 23, (4): 471-487. Sylva, K., Sammons, P., Melhuish, E., Siraj-Blatchford, I. & Taggart, B. (unpublished) Technical Paper 1. An
Introduction to the EPPE Project Sylva, K., Siraj-Blatchford, I., Taggart, B. & Colman, P. (forthcoming) The Early Childhood Environment Rating
Scales: 4 Curricular Subscales, London: Institute of Education. Sylva, K. (1994) A Curriculum for Early Learning. In Ball, C. (Ed.) Startright: The Importance of Early Learning,
London: RSA. Sylva, K. & Wiltshire, J. (1993) The Impact of Early Learning on Children's Later Development. A review
prepared for the RSA enquiry 'Start Right', European Early Childhood Education Research Journal, 1, (1): 17-40.
Tizard, P., Blatchford, P, Burke, J., Farquhar, C. & Plewis, I. (1988) Young Children at School in the Inner City,
Hove: Lawrence Erlbaum Associates Ltd. Tymms, P., Merrell, C. & Henderson, B. (1997) The First Year at School: A quantitative Investigation of the
Attainment and Progress of Pupils, Educational Research and Evaluation, 3, (2): 101-118. Yang, M. & Goldstein, H. (1997) Report on Value Added Analysis for Primary Schools in Hampshire County,
Mathematical Sciences, Institute of Education, University of London, August 1997.

i
Technical Paper 5 Characteristics of the Centres in the EPPE Study:
Interviews Executive Summary This paper reports on interviews conducted with the managers of the EPPE pre-school centres which took place between October 1997 and July 1998 (the main sample) and October 1998 and December 1998 (the EPPE-extension). In total, 140 centre managers in 5 regions (six local authorities) in England were interviewed. The numbers of managers interviewed in each pre-school type were as follows: 24 in nursery classes, 20 in nursery schools, 24 in local authority day care centres, 34 in playgroups, 31 in private day nurseries and 7 in local authority combined centres. The definition of a centre manager in this paper is the member of staff who has overall day-to-day responsibility for the pre-school setting. In nursery schools it was usually the head teacher. In nursery classes it would usually be the teacher in charge of the nursery unit rather than the head teacher of the primary or infant school. In private day care settings the interviews were conducted with the manager who was usually, though not always, the senior worker. In playgroups the senior worker was interviewed, often speaking on behalf of a management group. In local authority day care and combined centres the interviews were conducted with the head/manager of the centre. This interview was designed to provide information likely to help differentiate effectiveness in pre-school settings by contextualising information from observational profiles (reported in Technical Paper 6 in this series), other interviews with centre managers (reported in Technical Paper 3) and case studies (to be reported in Technical Paper 10).
The interview schedule explored the following areas: general information i.e. age of centre, opening times, major objectives etc., centres and parents i.e. opportunities for parent/staff contact, written materials provided to parents, parent education etc., the staff i.e. conditions and benefits, qualifications, turnover etc., the children i.e. numbers, provision for special educational needs etc. perceptions of quality in child care and education, and organisational practices i.e. planning and record-keeping etc.
The paper reports on wide differences in provision across the sectors. The local education authority (LEA) sectors (nursery classes, nursery schools and combined centres) had superior resources, training, professional facilities and support, plus better staff pay and conditions and lower rates of staff turn-over. The emergence of combined centres means that younger children are now cared for in settings where the standard of working conditions are high for staff on a year round, full time basis. The playgroups and private day nurseries were lagging behind in terms of many fewer resources. Staffing Recruitment of regular staff posed few problems across the providers; however, there were difficulties across the sector as a whole for the recruitment of suitable ‘substitute/supply’ cover. Overall, full-time staff have access to better staff development
opportunities than parttime staff. This has implications for types of pre-schools employing more part-time than full-time staff such as the playgroups and private day nurseries.

ii
The longest hours worked by centre managers was reported to be in combined centres which may reflect the extended hours of opening. The longest hours worked by staff however were reported in private day nurseries.
The private day nurseries had the youngest staff profile of all, while the oldest staff were found in nursery classes. The most ethnically diverse staff are employed by local authority day care and combined centres both of which are normally found in inner-city areas.
All sectors benefited from help from unpaid workers. Providers were able to meet or better the statutory requirements for adult/child ratios without the help of unpaid workers, except for some playgroups where unpaid workers are essential to maintaining statutory ratios. Both nursery classes and nursery schools appeared to offer ratios that were notably lower than the statutory requirements for their sector. Qualifications and Training Training opportunities for staff working in playgroups were poorer than for staff working in any other types of pre-school provision. Playgroup staff had fewer opportunities to be appraised, fewer secure training resources, less access to training materials and fewer opportunities to have their training paid for by their centres. The most highly qualified staff (for childcare qualifications) were in the LEA settings, where the highest salaries were also to be found. The centre managers with the highest childcare qualifications e.g. B.Ed. or PGCE appeared to be predominately in the ‘education’ rather than ‘care’ provision i.e. nursery schools and nursery classes. Combined centres also had high levels of staff with higher childcare qualifications. Playgroups had the least qualified centre managers with over 50 per cent with NVQ Level 2 or below. The most commonly held childcare qualification amongst pre-school staff was the NNEB with the second most common category being ‘no qualifications’. Overall there was a descending order of high/low childcare qualification ratios amongst managers and staff across the different types of provision. Nursery classes and nursery schools had very similar proportions of qualified staff and could be summarised as most highly qualified, followed by combined centres, then private day nurseries and local authority centres together, and finally playgroups, who have the lowest proportion of qualified staff.
Quality and Programmes When considering issues of ‘quality’ in care and education, managers sought staff who had relevant experience and training, with personal attributes appropriate to working with young children. They wanted staff who could meet the individual needs of children, helping them to develop social skills, self-confidence and independence, in a happy environment. They also thought it important to nurture an environment that encouraged parental involvement and was ‘child friendly’. Managers of pre-schools, in addition to providing care, rated the development in children of language and reasoning, friendship and sharing and encouraging positive self-concepts as the most important objectives of their centres.
There was widespread use of daily timetables and collegiate planning but the maintained sector was more likely to refer to aspects of the curriculum when planning activities. There was good use made of the Desirable Learning Outcomes (DLOs), with only playgroups making less use of this document in their planning than other forms of

iii
provision. This may be because some playgroups had very few four year olds at whom the DLOs were targeted in 1998.
Staff working in the maintained rather than the voluntary sector were more likely to have been trained to assess and monitor children’s development. They conducted assessments more regularly and used a wider repertoire of assessment strategies.
Centre managers in the maintained sector reported higher numbers of children with special needs and were unanimous in having systems for early identification. The use of the Code of Practice was much more common in the maintained sector, as was a named person responsible for special needs.
Centres and parents The maintained sector, especially the LEA settings, reported more meetings for parents, sharing of assessment information and helping parents in their roles as ‘educators’ of their own children.

1
Introduction The Effective Provision of Pre-school Education (EPPE) study seeks to explore the relationship between children’s developmental and cognitive progress and the characteristics of different pre-school settings. Descriptions of the characteristics of the six types of pre-schools within the study (nursery classes, nursery schools, local authority day care, playgroups, private day nurseries and local authority combined centres) have been derived from the following sources: a) Observational profiles b) Case studies c) Semi-structured interviews with centre managers. a) The observational profiles Technical Papers 6 and 6A (Sylva et al., 1999) in this series describe the environmental quality profiles for different pre-school types measured by the Early Childhood Environment Rating Scales (ECERS-R and ECERS-E). These scales explore ‘process’ characteristics such as the
day-to-day functioning within settings (e.g. childstaff interaction, childchild interaction, and structuring of children’s activities) as well as educational provision in terms of language, mathematics, science and the environment and diversity. b) Case studies In addition to the range of quantitative data collected about pre-school centres, detailed in-depth qualitative research has been carried out in twelve selected centres to illustrate ‘good practice’ related to child outcome measures. Technical Paper 10 (forthcoming) reports on this element of the research. b) Semi-structured interviews with centre managers.
During the period of the EPPE research (1997 2003) the managers of 140 (one unavailable) pre-school centres were interviewed. The first interview, which is reported in Technical Paper 3 (Siraj-Blatchford et al., 1999), describes the impact of changes in under-fives provision and the implementation of national and local policy initiatives as experienced by the pre-school providers in our study. The main changes reported in Paper 3 were the impact of introducing the local authority Early Years Care and Development Partnership Plans and increased collaboration across pre-school services, the introduction of the Desirable Learning Outcomes, inspection arrangements, new funding arrangements and plans for training. This paper is concerned with a second interview which took place between October 1997 and July 1998 (the main sample) and October 1998 and December 1998 (the EPPE-extension) with 140 centre managers in 5 regions (six local authorities) in England. The numbers of managers interviewed were as follows: 24 in nursery classes, 20 in nursery schools, 24 in local authority day care centres, 34 in playgroups, 31 in private day nurseries and 7 in local authority combined centres. (See Appendix H for schedule). This interview was designed to provide information relevant to effectiveness in pre-school settings by contextualising information gained from the other sources described above. Each interview was conducted face-to-face by a trained regional Research Officer who was fully familiar with the setting, having made numerous visits to assess the EPPE children. The interviews lasted approximately 1 hour and were always arranged well in advance to prevent disruption during the course of the interview. In recognition of the fact that some questions needed a longer response time (i.e. budget and staffing information) a selection of questions was left with the centre manager in the form of a questionnaire to be returned at a later date. It should be noted that for some managers this section was the most difficult to complete. Full budget information including staffing costs etc. was not always available to the operational centre manager.

2
The interview schedule explored the following areas: general information i.e. age of centre, opening times, major objectives etc., centres and parents i.e. opportunities for parent/staff contact, written materials provided to parents, parent education etc., the staff i.e. conditions and benefits, qualifications, turnover etc., the children i.e. numbers, provision for special education needs etc. perceptions of quality in child care and education, and organisational practices i.e. planning and record-keeping etc. The definition of a centre manager in this paper is the member of staff who has overall day-to-day responsibility for the pre-school setting. In nursery schools it was usually the head teacher. In nursery classes it would usually be the teacher in charge of the nursery unit rather than the head teacher of the primary or infant school. In private day care settings the interviews were conducted with the manager who was usually, though not always, the senior worker. In playgroups the senior worker was interviewed, often speaking on behalf of a management group. In local authority day care and combined centres the interviews were conducted with the head/manager of the centre. This paper is divided into four sections. Section One deals with the characteristics of the centre and the facilities available to staff. Section Two describes the people who work in the centres. Section Three looks at programmes and issues of quality and practices for assessing children, planning and the provision for children with special needs. Section Four reports on
centreparent contacts.

3
1. Centre Characteristics 1.1 Age, opening times and fees Centre managers were asked about how long their centres had been established, their opening hours and any charges made to parents (if appropriate). Table 1.1 shows this information for different types of pre-schools. TABLE 1.1 – CENTRE AGE, OPENING HOURS AND FEE (BY PRE-SCHOOL TYPE)
Nursery
class Playgroup
Private day
nursery
LA Nursery school
Combined centres
Mean age of centre (yrs) 18.9 24.1 7.6 18.6 43.8 18.0
Response 24 / 24 34 / 34 31 / 31 24 / 24 20 / 20 7 / 7
Mean opening hours/day 5.4 3.9 9.1 10.0 6.0 8.9
Response 24 / 24 34 / 34 31 / 31 24 / 24 20 / 20 7 / 7
Mean parental fee/session n/a £2.26 £9.63 £5.40 n/a n/a
Response 24 / 24 32 / 34 25 / 31 12 / 24 20 / 20 7 / 7
Private day nurseries were usually the most recently established centres in the study, while nursery schools had usually been established for the longest. The ages given for the combined centres are those for the institution, and not for when they started to operate as combined centres. Some have been combined centres from the start while others were originally nursery schools which have extended their provision to include full day care for the under-threes and flexible opening hours which are not restricted to school term times; thus they have fully integrated care and education. 1.2 Number and age of children The average number of children per centre is shown in Figure 1.1. FIGURE 1.1 – NUMBER OF CHILDREN (BY PRE-SCHOOL TYPE)
In four out of six types of provision (nursery classes, playgroups, private day nurseries and nursery schools) there were more part-time children (attending either mornings or afternoons) than full-timers. Children attending full-time (10 sessions) were in the majority in local authority centres and combined centres. Children attending full-time were only 37 per cent of private day nursery clients, 11 per cent of nursery class clients and 1 per cent of playgroup clients.

4
Table 1.2 illustrates the age profile for children attending different types of pre-schools. TABLE 1.2 – DISTRIBUTION OF CHILDREN’S AGE (BY PRE-SCHOOL TYPE)
Nursery class %
Playgroup %
Private day nursery %
LA %
Nursery school %
Combined centre %
% Part time 89.0 98.8 62.8 26.3 71.2 36.2
under 1 year 3.5 2.7 0.3
12yrs 5.7 5.1 0.5
23yrs 20.4 18.6 7.4 4.9
34yrs 28.5 59.4 23.8 8.0 34.3 25.5
45yrs 60.5 19.0 11.2 3.1 36.9 5.0
Full time 11.0 1.1 37.3 73.7 28.8 63.8
Under 1 year 3.2 2.8 0.5
12yrs 5.7 9.1 1.2
23yrs 7.5 18.1 1.8 12.7
34yrs 2.8 0.3 9.5 27.5 14.4 26.2
45yrs 8.2 0.8 11.4 16.2 12.6 23.2
100 100 100 100 100 100
Response 24 / 24 34 / 34 29 / 31 21 / 24 17 / 20 6 / 7
Only private day nurseries, local authority day care and combined centres were used
substantially for children under three. The highest percentage of older children (the 45-year-olds) attending part-time was in nursery classes (60.5%) and the highest percentage of older children attending full-time was in combined centres (23.3%). Playgroups had the lowest
percentage of full time 45-year-olds (0.8%). 1.3 Staffing levels The study compared three sources of information on staffing levels: i) The statutory minimum levels The minimum staffing level across the six types of pre-school provision in the EPPE sample was not uniform. In playgroups, private day nurseries, local authority day care and the combined
centres the ratios of 1 adult to 8 children in the age group 35 are laid down by the 1989 Children Act. This sets out the statutory levels of staffing which would enable a pre-school setting to comply with the appropriate Children Act inspection framework, which historically was undertaken by Social Services. All settings with children under three are required to have this inspection of care. In addition, after the introduction of the Desirable Learning Outcomes (1996)
(now the Early Learning Goals, 1999 for children 35) the Government introduced an education inspection conducted by the Office for Standards in Education (OFSTED). In the other ‘educational’ forms of provision, nursery classes and nursery schools, the ratios are 1 adult to 13 three to five year-olds, although in nursery schools it can quite often be as low as 1:10 because the head teacher has a major teaching function in addition to administration. These government ratios are determined by the Nursery Education Act (1996). Inspections are conducted by OFSTED but they are the similar to school inspections. The combined centres may differ from these arrangements. If their local authority considers them as nursery schools, they can have the ‘education’ ratios. However, most combined centre heads have negotiated lower ratios with their Local Authorities because they argue they need lower ratios to carry out the family support aspects of their work. They are inspected under both social services and education frameworks. In an effort to standardise the inspection arrangements the government now intends bringing all childcare and education inspections under an early years branch of OFSTED.

5
ii) Interview data from the centre managers’ interviews It was possible to calculate staffing levels from the managers’ reports of the number of children and staff in their centre. These figures did not necessarily reflect the usual number of children and adults in the centre at any one time and thus provide only a very limited guide to actual ratios experienced by children in the centres. Figure 1.2 below shows the number of paid employees as reported by managers during the interview across pre-school types. FIGURE 1.2 – MEAN NUMBER OF PAID EMPLOYEES PER SETTING (BY PRE- SCHOOL TYPE)
0
5
10
15
20
Nursery class Playgroup Private day nursery LA Nursery school Combined ctr
No. of em
plo
yees
Work with children Other staff
iii) Observational data from research officers visits Independent observations on ‘usual’ staffing levels were made over a period of time by research officers during their visits to centres to assess children. In these time-point observations, the number of children in the centre, the number of paid staff, and also the number of voluntary staff were observed. Volunteer staff were only included in the staffing levels if they attended the centre on a regular basis over a substantial period of time sufficient to serve as ‘unpaid workers’ rather than casual visitors.
Shown in figure 1.3 below are the government required ratios as well as the observed staffchild ratios with and without unpaid workers, collected through systematic observation. (Note that the legal requirement of 1:8 staff to children usually applies to combined centres.) FIGURE 1.3 – MEAN NUMBER OF CHILDREN TO STAFF (BY PRE- SCHOOL TYPE)
123456789
101112131415
Nursery class Playgroup Private day nursery LA Nursery school Combined ctr
Childre
n to s
taff
Required by government Paid staff Staff including unpaid workers
Across all centres the average ratio observed (for 3-and 4-year-old children) without unpaid workers was 1:8 (sd 2.80), with unpaid workers the average ratio was lower at 1:79 (sd 2.7). Analysis of the observed ratios reported by research officers shows clear differences by pre-school type, both with and without unpaid workers, (paid staff only, F(4,140)=8.8, p<.001; paid staff and unpaid workers, F(4,140)=7.3, p<.001). The difference between the two ratios was

6
compared across pre-school type, and this also revealed significant differences, (H(5)=35.5, p<.001). Providers were able to meet or improve on statutory requirements without the help of unpaid workers except for some playgroups, where unpaid workers are essential to maintain statutory ratios. In practice the average figures suggest that both nursery classes and nursery schools appeared to offer ratios which were notably lower than the statutory requirements for their sector. 1.4 Ratios and quality characteristics We examined the relationship between the Early Childhood Environment Rating Scales [(ECERS-E (Sylva et al. forthcoming) and ECERS-R (Harms et al., 1998)], an observational assessment of pedagogy, facilities and programmes, and ratios. There is little evidence of associations between centre ratios and quality characteristics as measured by ECERS-R. However, the ECERS-E, which has a more educational focus, showed a significant though weak positive correlation between observed ratio including volunteers and average total score on ECERS-E (r=0.21 , p<0.02, n = 141). This indicates a tendency for quality scores on this measure to be higher in centres with higher ratios. This may reflect the higher ECERS scores to be found in the Local Education Authority sector (with ratios of 1:13, see Technical paper 6 and 6a in this series). The relationship between ratios and the ECERS quality measures are notably weaker than those found between quality and centre managers’ childcare/education qualification levels (see Appendix G). 1.5 Occasional unpaid helpers The analysis above included unpaid workers who worked in the centres on a regular basis with sufficient regularity to act as unpaid staff. As well as this type of help most centres in each type of provision benefited from other unpaid helpers on a less regular basis. Helpers in this category were students, young people on work placement and members of the local community (e.g. members of local church groups or community liaison workers. The incidence of occasional
unpaid helpers differed across type of pre-school (2(5, n=139)=22.0, p<.01) as shown in Table 1.4 below. TABLE 1.4 – CENTRES REPORTING UNPAID HELP (%, BY PRE-SCHOOL TYPE)
Nursery class %
Playgroup %
Private day nursery %
LA %
Nursery school %
Combined centres %
% Occasional unpaid helpers
16.7 8.8 0.0 4.2 15.8 57.1
Response 24 / 24 34 / 34 31 / 31 24 / 24 19 / 20 7 / 7
Students (2(5, n=139)=8.1, p=.15)
Others (2(5, n=139)=2.2, p=.82)
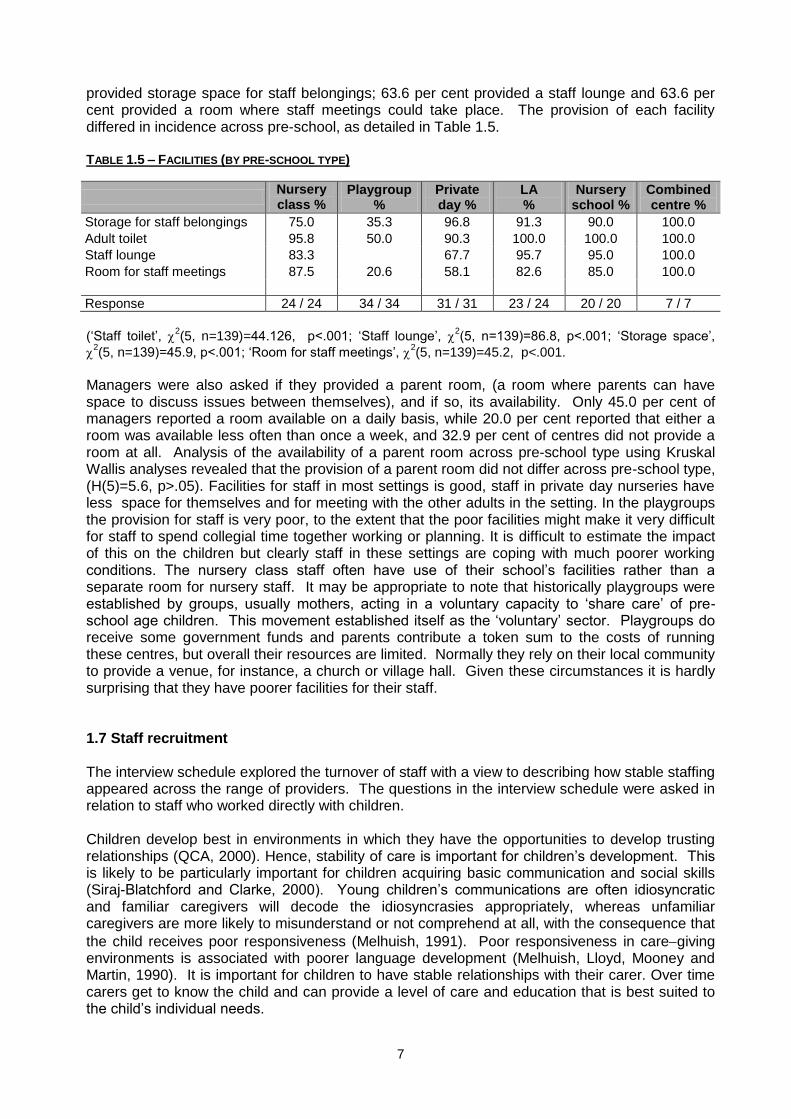
Combined centres appeared to benefit most from occasional unpaid helpers and private day nurseries the least. Nursery classes and nursery schools had broadly similar amounts of occasional unpaid help. 1.6 Building facilities The EPPE centre managers’ interview provides a ‘snapshot’ in time regarding the characteristics of pre-school centres. In Technical Paper 6 in this series, we reported on the facilities and resources available to children. It is therefore appropriate in a centre managers’ interview to study the type and range of facilities available to staff. Whilst later sections in this report will deal with pay and conditions we report in this section about basic building facilities for staff. When asked about staff facilities, overall, 84.3 per cent of centres had a staff toilet; 75.7 per cent
7
provided storage space for staff belongings; 63.6 per cent provided a staff lounge and 63.6 per cent provided a room where staff meetings could take place. The provision of each facility differed in incidence across pre-school, as detailed in Table 1.5. TABLE 1.5 – FACILITIES (BY PRE-SCHOOL TYPE)
Nursery class %
%
Playgroup %
Private day %
LA %
Nursery school %
Combined centre %
Storage for staff belongings 75.0 35.3 96.8 91.3 90.0 100.0
Adult toilet 95.8 50.0 90.3 100.0 100.0 100.0
Staff lounge 83.3 67.7 95.7 95.0 100.0
Room for staff meetings 87.5 20.6 58.1 82.6 85.0 100.0
Response 24 / 24 34 / 34 31 / 31 23 / 24 20 / 20 7 / 7
(‘Staff toilet’, 2(5, n=139)=44.126, p<.001; ‘Staff lounge’,
2(5, n=139)=86.8, p<.001; ‘Storage space’,
2(5, n=139)=45.9, p<.001; ‘Room for staff meetings’,
2(5, n=139)=45.2, p<.001.
Managers were also asked if they provided a parent room, (a room where parents can have space to discuss issues between themselves), and if so, its availability. Only 45.0 per cent of managers reported a room available on a daily basis, while 20.0 per cent reported that either a room was available less often than once a week, and 32.9 per cent of centres did not provide a room at all. Analysis of the availability of a parent room across pre-school type using Kruskal Wallis analyses revealed that the provision of a parent room did not differ across pre-school type, (H(5)=5.6, p>.05). Facilities for staff in most settings is good, staff in private day nurseries have less space for themselves and for meeting with the other adults in the setting. In the playgroups the provision for staff is very poor, to the extent that the poor facilities might make it very difficult for staff to spend collegial time together working or planning. It is difficult to estimate the impact of this on the children but clearly staff in these settings are coping with much poorer working conditions. The nursery class staff often have use of their school’s facilities rather than a separate room for nursery staff. It may be appropriate to note that historically playgroups were established by groups, usually mothers, acting in a voluntary capacity to ‘share care’ of pre-school age children. This movement established itself as the ‘voluntary’ sector. Playgroups do receive some government funds and parents contribute a token sum to the costs of running these centres, but overall their resources are limited. Normally they rely on their local community to provide a venue, for instance, a church or village hall. Given these circumstances it is hardly surprising that they have poorer facilities for their staff. 1.7 Staff recruitment The interview schedule explored the turnover of staff with a view to describing how stable staffing appeared across the range of providers. The questions in the interview schedule were asked in relation to staff who worked directly with children. Children develop best in environments in which they have the opportunities to develop trusting relationships (QCA, 2000). Hence, stability of care is important for children’s development. This is likely to be particularly important for children acquiring basic communication and social skills (Siraj-Blatchford and Clarke, 2000). Young children’s communications are often idiosyncratic and familiar caregivers will decode the idiosyncrasies appropriately, whereas unfamiliar caregivers are more likely to misunderstand or not comprehend at all, with the consequence that
the child receives poor responsiveness (Melhuish, 1991). Poor responsiveness in caregiving environments is associated with poorer language development (Melhuish, Lloyd, Mooney and Martin, 1990). It is important for children to have stable relationships with their carer. Over time carers get to know the child and can provide a level of care and education that is best suited to the child’s individual needs.

8
As shown in Figure 1.4, managers were asked about several potential problems in recruiting staff. Figure 1.4 indicates the percent of managers who said they had a problem of some kind in each area, and Table 1.6 presents a breakdown by pre-school type and problem of severity. FIGURE 1.4 - PROBLEMS IN STAFF RECRUITMENT
Only ‘finding trained staff’ differed significantly by pre-school type (H(5)=11.6)=11.6, p<.05), and is presented shown in Table 1.6. This Table suggests that the majority of pre-schools across all sectors do not experience major difficulties in finding staff. The only real area of concern in staffing pre-schools appears to be in finding ‘substitute’ staff. These are staff whom the pre-school can call upon to cover permanent staff away on sick leave or attending an ‘offsite’ course. The difficulties of finding ‘cover’ staff in the school setting has long been recognised, and difficulties in providing this service has only been solved by the formation of dedicated agencies who provide ‘substitute’ cover, often at very short notice. The provision of such a service across the range of pre-school providers is underdeveloped. TABLE 1.6 - PROBLEMS IN STAFF RECRUITMENT (BY PRE-SCHOOL TYPE)
Nursery class %
Playgroup %
Private day nursery %
LA %
Nursery school %
Combined centre %
Finding trained staff
Not a problem 79.2 72.7 48.4 91.7 68.4 71.4
Minor problem 4.2 6.1 25.8 4.2 14.3
Problem but not major 4.2 6.1 12.9 4.2 21.1 14.3
Major problem 12.5 15.2 12.9 10.5
Response 24 / 24 33 / 34 31 / 31 24 / 24 19 / 20 7 / 7
Filling staff vacancies (H(5)=9.4, p>.05, n=136)
Finding substitutes (H(5)=7.5, p>.05, n=138)
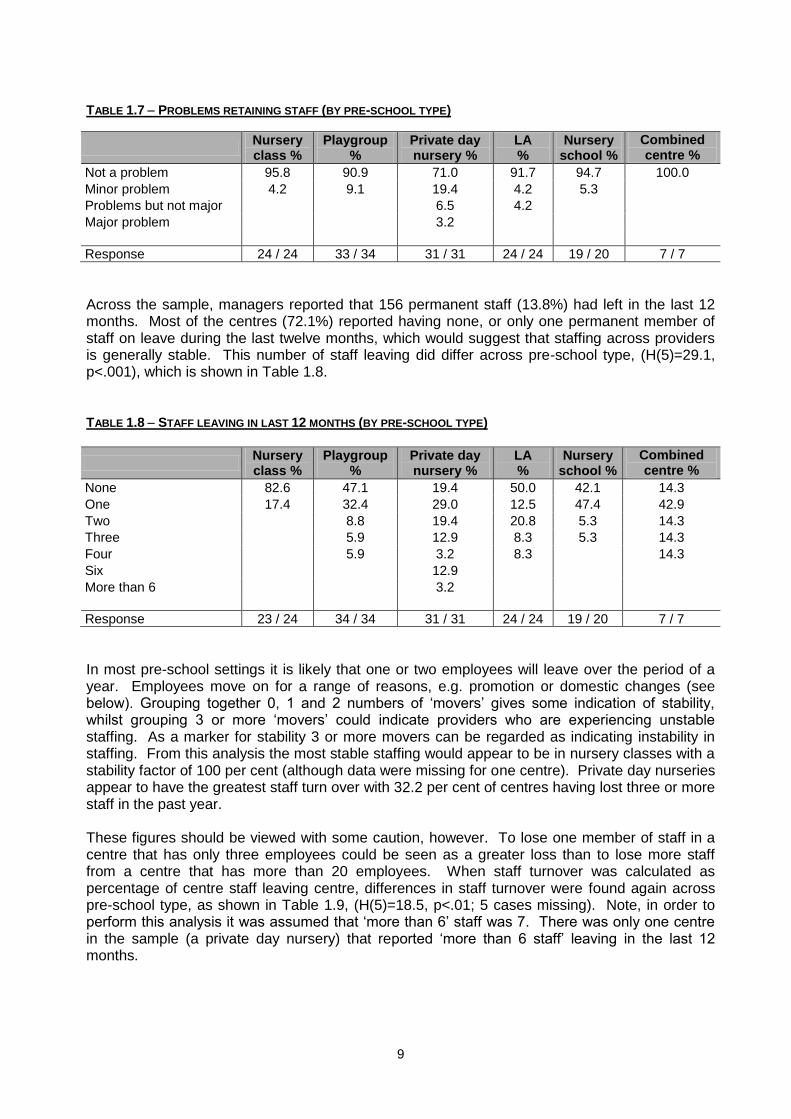
1.8 Staff turnover Managers were asked if they experienced problems retaining staff. Overall, the majority (87.1%) of managers felt this was ‘not a problem’, and only 1 centre overall (0.7%) felt it was a ‘major problem’. However, this did differ across pre-school type (H(5)=12.9, p<.05). As Table 1.8 shows, the managers of private day nurseries reported the most difficulties in this area; with 29.0 per cent of those managers reporting it was a problem.
9
TABLE 1.7 PROBLEMS RETAINING STAFF (BY PRE-SCHOOL TYPE)
Nursery class %
Playgroup %
Private day nursery %
LA %
Nursery school %
Combined centre %
% Not a problem 95.8 90.9 71.0 91.7 94.7 100.0
Minor problem 4.2 9.1 19.4 4.2 5.3
Problems but not major 6.5 4.2
Major problem 3.2
Response 24 / 24 33 / 34 31 / 31 24 / 24 19 / 20 7 / 7
Across the sample, managers reported that 156 permanent staff (13.8%) had left in the last 12 months. Most of the centres (72.1%) reported having none, or only one permanent member of staff on leave during the last twelve months, which would suggest that staffing across providers is generally stable. This number of staff leaving did differ across pre-school type, (H(5)=29.1, p<.001), which is shown in Table 1.8. TABLE 1.8 STAFF LEAVING IN LAST 12 MONTHS (BY PRE-SCHOOL TYPE)
Nursery class %
Playgroup %
Private day nursery %
LA %
Nursery school %
Combined centre %
None 82.6 47.1 19.4 50.0 42.1 14.3
One 17.4 32.4 29.0 12.5 47.4 42.9
Two 8.8 19.4 20.8 5.3 14.3
Three 5.9 12.9 8.3 5.3 14.3
Four 5.9 3.2 8.3 14.3
Six 12.9
More than 6 3.2
Response 23 / 24 34 / 34 31 / 31 24 / 24 19 / 20 7 / 7
In most pre-school settings it is likely that one or two employees will leave over the period of a year. Employees move on for a range of reasons, e.g. promotion or domestic changes (see below). Grouping together 0, 1 and 2 numbers of ‘movers’ gives some indication of stability, whilst grouping 3 or more ‘movers’ could indicate providers who are experiencing unstable staffing. As a marker for stability 3 or more movers can be regarded as indicating instability in staffing. From this analysis the most stable staffing would appear to be in nursery classes with a stability factor of 100 per cent (although data were missing for one centre). Private day nurseries appear to have the greatest staff turn over with 32.2 per cent of centres having lost three or more staff in the past year. These figures should be viewed with some caution, however. To lose one member of staff in a centre that has only three employees could be seen as a greater loss than to lose more staff from a centre that has more than 20 employees. When staff turnover was calculated as percentage of centre staff leaving centre, differences in staff turnover were found again across pre-school type, as shown in Table 1.9, (H(5)=18.5, p<.01; 5 cases missing). Note, in order to perform this analysis it was assumed that ‘more than 6’ staff was 7. There was only one centre in the sample (a private day nursery) that reported ‘more than 6 staff’ leaving in the last 12 months.

10
TABLE 1.9 – PERCENTAGE OF CENTRE STAFF LEAVING IN LAST 12 MONTHS (BY PRE-SCHOOL TYPE)
0%
10%
20%
30%
40%
50%
Nursery class Playgroup Private day
nursery
Local authority Nursery school Combined ctr
Perc
ent of centr
e s
taff leavin
g
Analysed in this way, playgroups and private day nurseries tend to experience higher rates of staff turnover than other providers, with both experiencing about 1 in 5 of their staff leaving in the last year. However, post hoc comparison found no difference between the percentage of centre staff leaving playgroups and private day nurseries, (U (63)=481.0, p=.70). 1.9 Reasons for staff turnover The managers were also asked why they thought the staff in question had left the centres. Table 1.10 shows the frequency of reasons given by managers; clearly the single largest reason was ‘voluntarily’. TABLE 1.10 – REASONS FOR STAFF LEAVING
Top half Bottom half
Voluntarily 100 Pregnant 9
Moved away 21 Sickness 6
Dismissed 11 Redundant due to low enrolment 1
Don't know 1
The first three items in Table 1.10 were analysed by pre-school type. Both ‘voluntarily’ (H(5)=6.6, p=>.05) and ‘moved away’ (H(5)=1.6, p>.05) appeared stable across type, but the number dismissed did differ significantly (H(5)=12.31, p<.05). Only two forms of provision reported having staff dismissed for inadequate performance – nursery classes and private day nurseries. The average number of staff dismissals per pre-school is presented in Figure 1.5 overleaf.

11
FIGURE 1.5 – MEAN NUMBER OF STAFF DISMISSALS PER YEAR (BY PRE-SCHOOL TYPE)
0
0.5
1
Nursery class Playgroup Private day nursery LA Nursery school Combined ctr
Sta
ff d
ism
issals
per
year
This analysis suggests that dismissal for inadequate performance occurs more in the private day nurseries than in any other type of provision. The reasons for this are unclear, it might be that privately owned nurseries can dismiss staff easily and therefore they do, or it might be that with a younger population (see later) they attract some unsuitable employees who are just embarking upon a first career which is not suited to their abilities. 1.10 Staff development
a) Appraisal Staff appraisal is becoming increasingly viewed as an important element of staff development. When we asked whether staff were regularly appraised, (‘Do you provide regular staff appraisal/staff development sessions?’), the majority of providers (72.8%) reported that a system of appraisal existed in their centres. However, when viewed by pre-school type (Table 1.12), it is revealed that playgroups show a markedly different practice with regard to staff appraisal (H(10)=73.3, p<.001). Generally Table 1.11 also shows a similar pattern in the appraisal of part time staff (again significant by type, H(10)=64.8, p<.001), although nursery classes showed a marked distinction between appraisal of full-time and part-time staff. TABLE 1.11STAFF APPRAISAL (BY PRE-SCHOOL TYPE)
Nursery class %
Playgroup %
Private day nursery %
LA %
Nursery school %
Combined centre %
Full-time
Yes 83.3 24.2 80.6 95.7 100.0 100.0
No 16.7 24.2 16.1 4.3
Not applicable 51.5 3.2
Part-time
Yes 25.0 27.3 74.2 87.3 80.0 100.0
No 20.8 57.6 16.1 4.3 5.0
Not applicable 54.2 15.2 9.7 8.7 15.0
Response 24 / 24 33 / 34 31 / 31 23 / 24 20 / 20 7 / 7
12
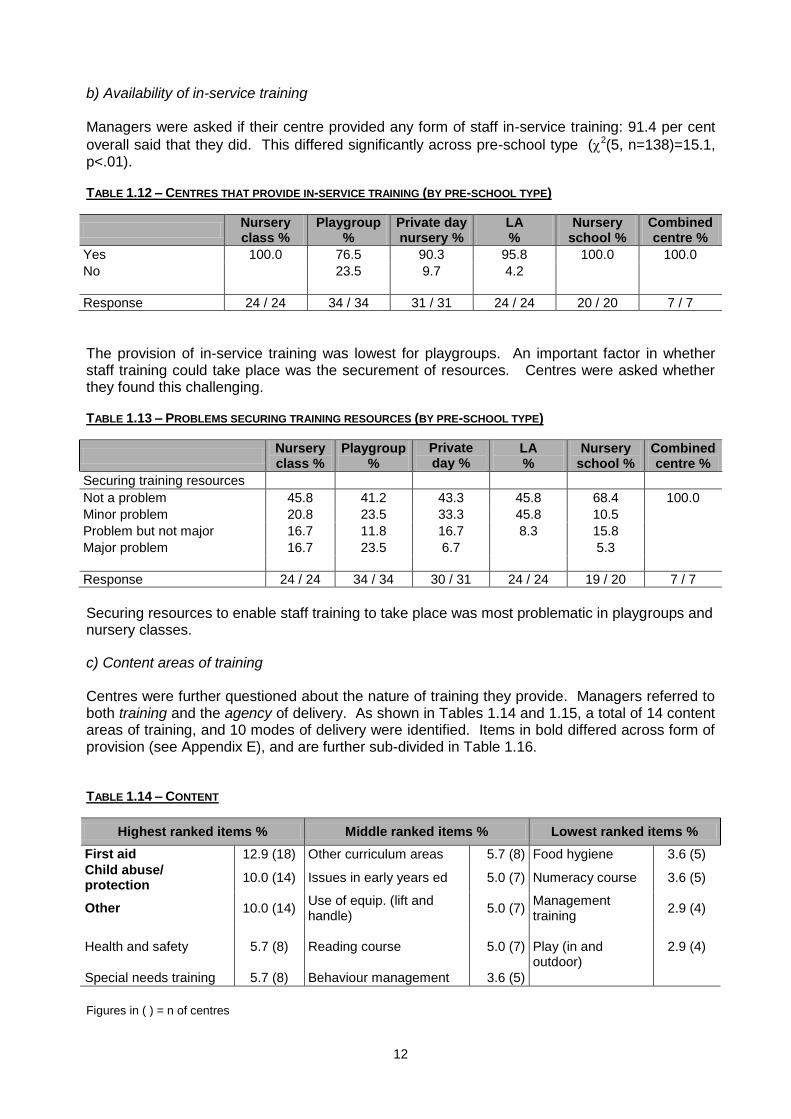
b) Availability of in-service training Managers were asked if their centre provided any form of staff in-service training: 91.4 per cent
overall said that they did. This differed significantly across pre-school type (2(5, n=138)=15.1, p<.01). TABLE 1.12 – CENTRES THAT PROVIDE IN-SERVICE TRAINING (BY PRE-SCHOOL TYPE)
Nursery class %
Playgroup %
Private day nursery %
LA %
Nursery school %
Combined centre %
Yes 100.0 76.5 90.3 95.8 100.0 100.0
No 23.5 9.7 4.2
Response 24 / 24 34 / 34 31 / 31 24 / 24 20 / 20 7 / 7
The provision of in-service training was lowest for playgroups. An important factor in whether staff training could take place was the securement of resources. Centres were asked whether they found this challenging. TABLE 1.13 – PROBLEMS SECURING TRAINING RESOURCES (BY PRE-SCHOOL TYPE)
Nursery class %
Playgroup %
Private day %
nursery
LA %
Nursery school %
Combined centre %
Securing training resources
Not a problem 45.8 41.2 43.3 45.8 68.4 100.0
Minor problem 20.8 23.5 33.3 45.8 10.5
Problem but not major 16.7 11.8 16.7 8.3 15.8
Major problem 16.7 23.5 6.7 5.3
Response 24 / 24 34 / 34 30 / 31 24 / 24 19 / 20 7 / 7
Securing resources to enable staff training to take place was most problematic in playgroups and nursery classes.
c) Content areas of training Centres were further questioned about the nature of training they provide. Managers referred to both training and the agency of delivery. As shown in Tables 1.14 and 1.15, a total of 14 content areas of training, and 10 modes of delivery were identified. Items in bold differed across form of provision (see Appendix E), and are further sub-divided in Table 1.16. TABLE 1.14 – CONTENT
Highest ranked items % Middle ranked items % Lowest ranked items %
First aid 12.9 (18) Other curriculum areas 5.7 (8) Food hygiene 3.6 (5)
Child abuse/ protection
10.0 (14) Issues in early years ed 5.0 (7) Numeracy course 3.6 (5)
Other 10.0 (14) Use of equip. (lift and handle)
5.0 (7) Management training
2.9 (4)
Health and safety 5.7 (8) Reading course 5.0 (7) Play (in and outdoor)
2.9 (4)
Special needs training 5.7 (8) Behaviour management 3.6 (5)
Figures in ( ) = n of centres

13
TABLE 1.15 – DELIVERY
Highest ranked items % Middle ranked items % Lowest ranked items %
Specific inset days 30.7 (43) On the job training 12.9(18) Organised by PLA 6.4 (9)
Provided by LEA / LA 28.6 (40) Non specific ext. 9.3 (13) Certified qualif. (e.g. NVQ) 5.7 (8)
Non specific internal 17.9 (25) Appraisal system 6.4 (9) Provided by Social Serv. 4.3( 6)
Visits to other centres 2.1 (3) Figures in ( ) = n of centres
TABLE 1.16 – CONTENT AND DELIVERY (BY PRE-SCHOOL TYPE)
Nursery class%
Playgroup %
Private day nursery %
LA %
Nursery school %
Combined centre %
First aid * 8.7 5.9 31.0 13.0 10.0
Child abuse/protection* 2.9 24.1 17.4 5.0 14.3
Other 10.3 8.7 35.0 28.6
Specific inset days 62.5 11.8 3.4 25.2 25.0 85.7
Provided by LEA/LA 54.2 17.6 6.9 39.1 40.0 28.6
Non specific internal 12.5 2.9 10.3 13.0 50.0 71.4
On the job training 5.9 17.2 13.0 40.0
Appraisal system 17.2 20.0
Organised by PLA 23.5 3.4
Response 23 / 24 26/26 26/28 22/23 20 / 20 7 / 7
All items significant at p<.01, unless denoted by an asterix (p<.05)
Private day nurseries were much more likely to provide training for their staff in ‘child care’ issues (first aid and child protection). The maintained sector were able to dedicate specific days to in-service training with combined centres and nursery classes reporting the highest occurrence of this. Unsurprisingly the maintained, state centres were most likely to draw on in-service training for staff from the Local Education Authority whereas both playgroups and private day nurseries used services provided by the Pre-School Learning Alliance with playgroups making most use of this provision. This might well change with responsibility for training now located more with the Early Years Partnerships. d) Payment for training Overall, 57.1 per cent (80) of managers said that they provided payment for full-time staff to go on training courses; 30.0 per cent did not, and the remaining 12.9 per cent thought the question was ‘not applicable’. For part-time staff 39.3 per cent of centres provided paid training, 42.1 per cent did not, and 18.6 per cent thought the question was ‘not applicable’. The provision of paid
training differed by pre-school type for both full-time (2(10, n=140)=71.8, p<.001), and part-time
staff (2(10, n=140)=57.3, p<.001), as detailed in Table 1.17.

14
TABLE 1.17 – PAID TRAINING (BY PRE-SCHOOL TYPE)
Nursery class %
Playgroup %
Private day nursery %
LA %
Nursery school %
Combined centre %
Full-time
Yes 79.2 23.5 77.4 95.8 95.0 100.0
No 20.8 26.5 19.4 4.2 5.0
Not applicable 50.0 3.2
Part-time
Yes 37.5 23.5 51.6 83.3 70.0 100.0
No 8.3 58.8 38.7 8.3 15.0
Not applicable 54.2 17.6 9.7 8.3 15.0
Response 24 / 24 34 / 34 31 / 31 24 / 24 20 / 20 7 / 7
Playgroups were least likely to provide paid training for their staff, but they also had the highest number of centre managers who considered this question ‘not applicable’. This could reflect the nature of the contracts under which staff in playgroups work. e) Books for staff training Attending courses can be both expensive and time consuming for any pre-school. However there are other methods by which staff can be supported in their professional development. Books and other materials can be a source of ideas for enhancing practice. Over 80 per cent of centre managers (88.6%) said they had books or other materials available for staff training. The
response differed significantly by pre-school type however (2(10, n=139)=18.5, p<.01), and as shown in Table 1.18. Playgroups were least likely to have such materials available to support staff in this area. TABLE 1.18 – PROVISION OF BOOKS FOR STAFF TRAINING (BY PRE-SCHOOL TYPE)
Nursery class %
Playgroup %
Private day nursery %
LA %
Nursery school %
Combined centre %
Yes 91.7 70.6 90.3 100 100.0 100.0
No 8.3 29.4 9.7
Response 24 / 24 34 / 34 31 / 31 23 / 24 20 / 20 7 / 7

15
1.11 Staff working conditions a) Written contracts and job descriptions In a sector which is moving towards greater regulation and the application of agreed standards, having staff who are clear about their roles and responsibilities is important. The questions about written contracts and job descriptions aimed to explore the extent to which centre managers communicated their expectations to the staff. The majority of providers used job descriptions
when recruiting staff80.6 per cent for full-time staff, and 71.4 per cent for part-time. Similarly 85.0 per cent, and 71.4 per cent of all centres provided written contracts for full-time and part-time staff respectively. Playgroups were more likely to consider this question not applicable to their recruitment (50%), and were therefore less likely to provide this (Table 1.19).
TABLE 1.18 WRITTEN CONTRACTS AND JOB DESCRIPTIONS (BY PRE-SCHOOL TYPE)
Nursery class %
Playgroup %
Private day nursery %
LA %
Nursery school %
Combined centre %
Written contracts (full-time)
Yes 95.8 47.1 93.5 100.0 100.0 100.0
No 4.2 2.9 3.2
Not applicable 50.0 3.2
Response 24 / 24 34 / 34 31 / 31 24 / 24 20 / 20 7 / 7
Written contracts (part-time)
Yes 41.7 55.9 80.6 91.7 85.0 100.0
No 4.2 29.4 9.7
Not applicable 54.2 14.7 9.7 8.3 15.0
Response 24 / 24 34 / 34 31 / 31 24 / 24 20 / 20 7 / 7
Written job description (full-time)
Yes 95.8 47.1 80.6 95.8 94.7 100.0
No 4.2 2.9 16.1 4.2 5.3
Not applicable 50.0 3.2
Response 24 / 24 34 / 34 31 / 31 24 / 24 19 / 20 7 / 7
Written job description (part-time)
Yes 39.1 61.8 67.7 87.5 78.9 100.0
No 4.3 23.5 22.6 4.2 5.3
Not applicable 56.5 14.7 9.7 8.3 15.8
Response 23 / 24 34 / 34 31 / 31 24 / 24 19 / 20 7 / 7
All four items shown in Table 1.19 show significant differences according to type of provision.
(‘Written contracts’ for full-time staff showed significant differences, 2(10, n=140)=57.9, p<.001
as did ‘written contracts’ for part-time staff, 2(10, n=140)=46.7, p<.001; ‘Written job descriptions’
for full-time staff showed significant differences, 2(10, n=139)=60.8, p<.001; as did ‘written
contracts’ for part-time staff, 2(10, n=138)=37.2, p<.001.) Playgroups were more likely to consider this question not applicable to their recruitment (50%), and were therefore less likely to provide this element of employment (Table 1.19). Thus the majority of full-time staff could
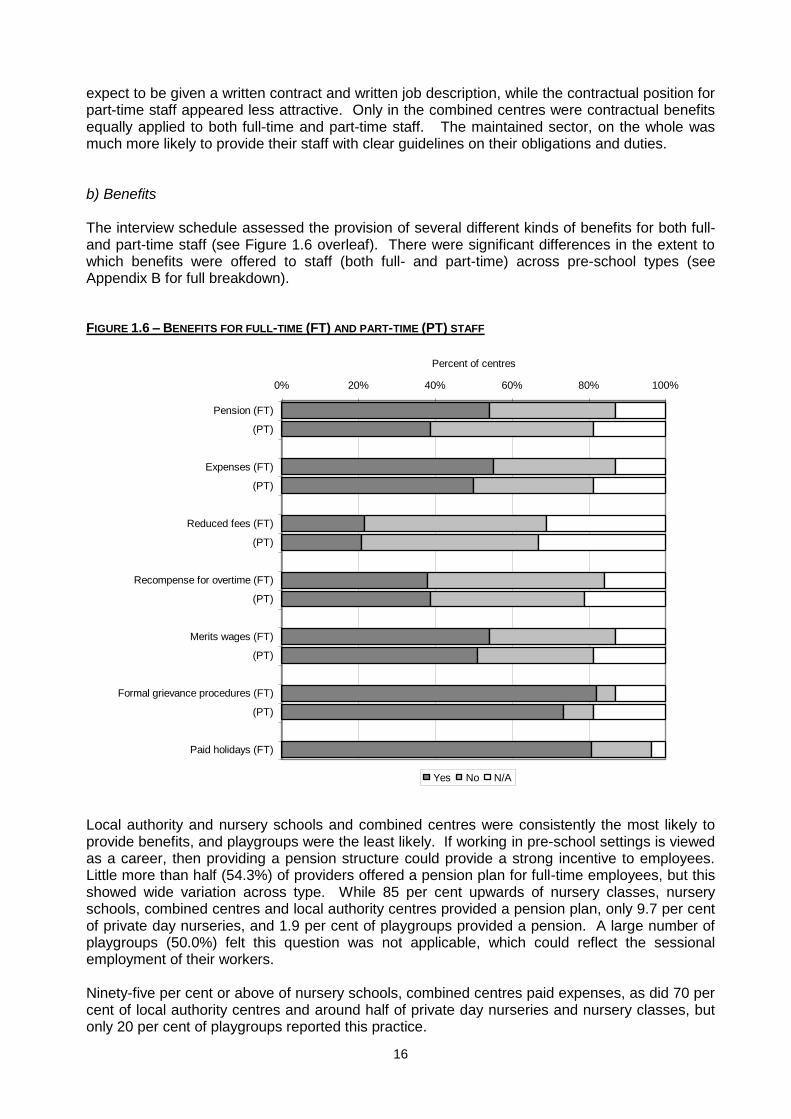
16
expect to be given a written contract and written job description, while the contractual position for part-time staff appeared less attractive. Only in the combined centres were contractual benefits equally applied to both full-time and part-time staff. The maintained sector, on the whole was much more likely to provide their staff with clear guidelines on their obligations and duties. b) Benefits The interview schedule assessed the provision of several different kinds of benefits for both full- and part-time staff (see Figure 1.6 overleaf). There were significant differences in the extent to which benefits were offered to staff (both full- and part-time) across pre-school types (see Appendix B for full breakdown). FIGURE 1.6 – BENEFITS FOR FULL-TIME (FT) AND PART-TIME (PT) STAFF
0% 20% 40% 60% 80% 100%
Pension (FT)
(PT)
Expenses (FT)
(PT)
Reduced fees (FT)
(PT)
Recompense for overtime (FT)
(PT)
Merits wages (FT)
(PT)
Formal grievance procedures (FT)
(PT)
Paid holidays (FT)
Percent of centres
Yes No N/A
Local authority and nursery schools and combined centres were consistently the most likely to provide benefits, and playgroups were the least likely. If working in pre-school settings is viewed as a career, then providing a pension structure could provide a strong incentive to employees. Little more than half (54.3%) of providers offered a pension plan for full-time employees, but this showed wide variation across type. While 85 per cent upwards of nursery classes, nursery schools, combined centres and local authority centres provided a pension plan, only 9.7 per cent of private day nurseries, and 1.9 per cent of playgroups provided a pension. A large number of playgroups (50.0%) felt this question was not applicable, which could reflect the sessional employment of their workers. Ninety-five per cent or above of nursery schools, combined centres paid expenses, as did 70 per cent of local authority centres and around half of private day nurseries and nursery classes, but only 20 per cent of playgroups reported this practice.

17
One perceived benefit of working in an early years setting is that employees may be entitled to reduced childcare for their own children. In a sector that recruits mostly women, this can be an attractive recruitment incentive. Overall 21.4 per cent of centres offered this benefit for full-time staff. Analysis by pre-school type indicates it was mainly private day nurseries (with 61.3% which did so), with the second most likely being local authority centres (25.0%). Around 70 per cent of private day nurseries, local authority centres and combined centres
provided recompense for overtime (either pay or time off in lieu) whereas only 815 per cent of nursery classes, playgroups and nursery schools did so. With the exception of 84 per cent of private day nurseries and 35 per cent of playgroups, around half of all centres paid merits wages. Having procedures for formal grievances was high (90% and above) in centres in all sectors except in playgroups (38%), and similarly 90 per cent and above of centres in all sectors provided paid holiday, with the exception of only 32 per cent of playgroups. Summary Part One has revealed wide differences in provision across the sectors. The LEA sector (nursery classes, nursery schools and combined centres) had superior resources, professional facilities and support, plus better pay and conditions and lower rates of staff turn-over. The emergence of combined centres means that younger children are now provided for in settings where the standard of working conditions can be high for staff on a year-round, full-time basis. The playgroups and private day nurseries are ‘struggling’ with many fewer resources for staff. Better facilities in the physical environment in which staff work were reported for combined
centres, followed by nursery schools, with playgroups offering a more limited range of physical facilities.
Staffing within the sector as a whole was fairly stable, with most children experiencing a fair
degree of continuity in care and education in most centres. Both playgroups and private day nurseries tended to experience higher rates of staff turnover than other providers. Only two forms of provision reported having staff dismissed for inadequate performance (nursery classes and private day nurseries) although the numbers were relatively small.
Staff recruitment posed no real problems for all pre-school providers, however there were
difficulties across the sector as a whole, for the recruitment of suitable ‘substitute/supply’ cover.
Overall full-time staff have access to better staff development opportunities than part-time
staff. This has implications for playgroups and private day nurseries which employ more part-time than full-time staff.
Training opportunities for staff working in playgroups were poorer than for staff working in any
other type of pre-school provision. Playgroup staff had less opportunities to be appraised, fewer secure training resources, less access to training materials and fewer opportunities to have their training paid for by their centres.
Benefits available to staff working with pre-school children (access to appraisal, in-service
training etc.) were on the whole more generous for those working in the maintained rather than the voluntary sector. There was a similar pattern in reporting on conditions of employment i.e. pensions, paid holidays etc. In interpreting these results the reader needs to bear in mind the traditions from which different types of pre-school provision have grown and the part-time, sessional nature of those employed to work in the sector.

18
All sectors benefited from outside, additional unpaid help. All providers were able to meet or better statutory requirements for adult/child ratios without the help of volunteers except for playgroups, where having volunteers was essential to maintain statutory ratios. Both nursery classes and nursery schools appeared to offer ratios that were notably lower than the statutory requirements for their sector.
Children attending full-time (10 sessions) were in the majority in local authority day care and
combined centres. Only private day nurseries, local authority day care and combined centres were used significantly by children under three. The majority of 4–5 year-olds were to be found in either nursery classes (part-time) or combined centres (full-time). Playgroups had the lowest percentage of full-time 4–5-year-olds.

19
2. Characteristics of the Workforce This section describes the characteristics of the people who work in pre-school settings. From the 140 centres, data were available on 1306 staff in total. Of this there were 142 managers (3 centres had joint managerial roles making up an additional 5 managers, offset by the fact that data were not available on the managers of 3 centres). Of the remaining 1164 staff, 961 worked with children. The 157 who did not work with children were excluded from this analysis, as were the 46 whose direct involvement with children was not clear. 2.1 Age profile and gender of managers and their staff Age data were available for 126 of the 142 managers, with the average age of managers in the sample being 44.5 years. Age data were available for 756 staff who worked with children, and their average age was 34.4 years. TABLE 2.1 AGE OF MANAGERS AND STAFF (BY PRE-SCHOOL TYPE)
Combined ctr
Nursery school
LA
Pr ivate day nursery
Playgroup
Nursery class
70
60
50
40
30
20
10
Staff
Managers
Analysis of variance of age by staff type (manager/staff) and pre-school type revealed, unsurprisingly, managers were significantly older than their staff (F(1, 881)=79.1, p<.001), and that age of managers differed significantly across provision (F(5, 881)=9.4, p<.001). Considering managers and staff together, the single largest age group for nursery classes and nursery schools was the 41–50 years category. The single largest category for playgroups and
combined centres was 3140 years; whilst for both private day nurseries and local authority
centres it was 2130 years. Nursery classes have the oldest age profile with 48.1 per cent of staff over 40. Playgroups and nursery schools have a similar age profile with 37.1 per cent and 40.2 per cent of their workforce being over 40. In comparison, combined centres, local authority centres and private day nurseries have relatively young workforces with only around a fifth of their staff over 40 years of age.

20
The gender profile of staff, unsurprisingly, showed a predominately female profession. For a workforce of 1306 a total of 13 men were reported to be in post. This was distributed as shown in Table 2.2 below. TABLE 2.2 – MEN WORKING IN PRE-SCHOOL SETTINGS
East Anglia Inner London North-east Shire Counties West Midland
1 teacher (full-time also deputy head)
1 teacher (full-time also deputy head)
1 joint manager (full-time)
Nil 2 nursery teacher (full-time)
1 nursery teacher (full-time)
1 teacher (full-time and deputy head)
Nil 1 teacher (part-time)
1 under fives worker (full-time)
2 NNEB (full-time) Nil 2 NNEB (full-time)
Seven of the thirteen men working in pre-schools were in the maintained ‘educational’ sector being qualified teachers. Ten out of thirteen worked full-time. 2.2 Ethnicity Managers were asked about the ethnic background of their staff. It was found that across the sample, the average percentage of white UK staff in centres was 84.5 per cent. The ethnic composition of the remaining 15.5 per cent is shown in Figure 2.1. FIGURE 2.1 – MEAN PERCENTAGE OF MINORITY ETHNIC STAFF
0% 5% 10% 15% 20%
White Euro
Black Caribbean
Pakistan
Mixed race
Other minorities
Indian
Black African
Black other
Chinese
Bangladeshi
When analysed by pre-school type, it was found that the proportion of White UK workers differed significantly across type, as shown in Figure 2.2 (H(5)=20.1, p<.001).

21
FIGURE 2.2 – MEAN PERCENTAGE OF WHITE UK AND MINORITY ETHNIC STAFF (BY PRE-SCHOOL TYPE)
0%
20%
40%
60%
80%
100%
Nursery class Playgroup Private day nursery LA Nursery school Combined ctr
Pe
rce
nt o
f sta
ff
White UK Other
Further, the proportion of Black Caribbean (H(5)=48.8, p<.001); Black African (H(5)=21.9, p<.001); Indian (H(5)=11.4, p<.05); Mixed race (H(5)=21.2, p<.001); and Bangladeshi staff (H(5)=12.6, p<.05) all varied significantly by type (Figure 2.3). As seen in Figures 2.3 and 2.4, the staff of local authority centres and combined centres in particular were more ethnically diverse. The proportion of White European (H(5)=10.3, p>.05); Black other (H(5)=8.3, p>.05); Pakistani (H(5)=3.5, p>.05); Chinese (H(5)=2.3, p>.05); and staff from other minorities (H(5)=6.1, p>.05) did not differ across pre-school type. FIGURE 2.3 – PERCENTAGE OF MINORITY ETHNIC STAFF (BY PRE-SCHOOL TYPE)
0% 2% 4% 6% 8% 10% 12% 14% 16% 18% 20%
Nursery class
Playgroup
Private day nursery
LA
Nursery school
Combined ctr
Mean percent of ethnic staff in centres
Black Caribbean Black African Indian Mixed race Bangladeshi
Ethnicity was also considered by area. The child ethnicity data presented in figure 2.4 below are taken from the child background database and allow a comparison between the ethnic diversity of the staff working in centres with the ethnic diversity of the centre’s child population.

22
FIGURE 2.4 – PERCENTAGE OF MINORITY ETHNIC STAFF AND CHILDREN (BY AREA)
Figure 2.4 suggests that in all areas, especially in those in which children are more ethnically diverse, the ethnic composition of staff is not fully representative of the area in which they provide pre-school education. It is positive that children in the most ethnically diverse areas also have a more ethnically diverse staff. Young children need strong role models in their own image (Siraj-Blatchford and Clarke, 2000) and it would be particularly important to reflect diversity across the management team as well as among staff. However, it is also important for children in mainly white areas to see the wider society reflected in their centre. In recent years some centres have actively sought to recruit under-represented groups such as men and minority ethnic staff. Full details of ethnicity by area are in Appendix C. 2.3 Years of service We asked managers about the length of time they and their staff had spent working in their centres. Across managers and staff, the average number of years spent in a centre was 5.8. This differed significantly by pre-school type (H(5)=47.9, p<.001). TABLE 2.3 – AVERAGE YEARS SERVICE IN CENTRE (BY PRE-SCHOOL TYPE)
Nursery
class Playgroup
Private day nursery
LA Nursery school
Combined centre
Years in centre 6.5 7.1 4.1 5.6 7.8 6.5
n 75 141 293 277 145 91
Overall staff stayed longest in nursery schools and playgroups. The shortest periods recorded were for private day nurseries and this triangulates with data on staff turnover reported in Section One of this report where private day nurseries reported the highest incidence of staff turnover. The 140 managers interviewed were also asked how long they had been managers in their centres. The average number of years was 6.5, and this did not differ across pre-school type (H(5)=6.6, p=>0.5).

23
2.4 Hours worked per week The mean number of hours worked by managers a week was 34.5, while for staff it was 29.4. Analysis of variance by pre-school type and staff type (i.e. manager or staff) revealed that managers worked more hours a week than staff (F(1, 1006)=78.6, p<.001), that the average number of hours a week differed across pre-school type (F(5, 1006)=45.38), p<.001), and that the ratio of manager-to-staff hours also differed across pre-school type (F(5, 1006)=4.7, p<.001). TABLE 2.4 – HOURS WORKED PER WEEK (BY PRE-SCHOOL TYPE)
Nursery
class Playgroup
Private day nursery
LA Nursery school
Combined centre
Manager hours/ week 38.7 20.6 41.1 37.2 42.7 43.5
n 17 35 27 24 16 5
Staff hours/ week 23.3 16.2 33.0 32.4 26.0 31.2
n 49 98 254 255 124 103
In the context of this question it should be noted that managers were asked about the number of hours they and their staff worked approximately each week and not their actual contractual hours. If centres had reported contractual hours then those employing teachers (with teachers contracts and conditions of service) would have reported the 1,265 hours per year DfES agreement. These data therefore report on actual rather than contractual hours. The longest hours worked for managers appeared to be in combined centres, which may reflect the extended hours of opening which is a characteristic of this form of provision. Staff however appear to work the longest hours in private day nurseries. Playgroup staff worked less hours than other forms of provision, reflecting their sessional nature. 2.5 Contact time with children As well as the hours worked, managers were also asked how much time they spent working directly with children. The majority (75.2%) spent more than 6 hours a week with the children in their centre, but this did differ across pre-school type (H(5)=20.2, 5, p<.01). See Table 2.5. TABLE 2.5 – TIME MANAGERS SPEND WITH CHILDREN (BY PRE-SCHOOL TYPE)
Nursery class %
Playgroup %
Private day nursery %
LA %
Nursery school %
Combined centre %
Less than 1 hour 13.0 6.1 16.1 26.1 5.0 57.1
12 hours 3.0 6.5 8.7 5.0
34 hours 3.2 4.3
56 hours 3.0 6.5 4.3 14.3
6+ hours 87.0 87.9 67.7 56.5 90.0 28.6
Response 23 / 24 33 / 34 31 / 31 23 / 24 20 / 20 7 / 7

24
The managers of nursery schools spent the most time in contact with children (90%) whilst managers in combined centres appeared to spend the least (28.6%) time. With the exception of combined centres all other managers spend over 50 per cent of their time in direct contact with the children in their centres. This may be influenced by centre size as well as type, combined centres are larger, more complex in structure and offer a wider number of services for parents, community and wider training than any of the other centres. This question raises issues around administration and delegation and the extent to which different providers need to devote time to the administrative demands of their centres.
2.6 Qualifications managers Childcare qualifications have traditionally been something of a ‘hotch-potch’. The past lack of a national framework has meant that institutions of further education, higher education and national awarding bodies have offered a complex range of awards. The distinction between care and education qualifications has compounded differences. Whilst it could be argued that diversity can be beneficial, the lack of comparability across qualifications has led to difficulties in establishing national qualification standards. The most recent initiatives by the Qualifications and Curriculum Authority (QCA, 1999)) to provide a framework for nationally accredited qualifications in early years education is a welcome development. We asked centre managers about their highest childcare/education qualification and highest academic qualification. TABLE 2.6 – MANAGERS’ HIGHEST CHILDCARE/EDUCATION QUALIFICATIONS
Highest frequency qualifications %
Middle frequency qualifications %
Lowest frequency qualifications %
NNEB 21.9 (30) PPA 5.8 (8) PA Level II 2.9 (4)
Cert. Ed. 21.9 (30) NVQ(III) 5.1 (7) NVQ(II) 2.2 (3)
B.Ed. 11.7 (16) BTEC 2.9 (4) B.A. 1.5 (2)
DPP Level III 8.0 (11) Montessori diploma 2.9 (4) Dip.Ed. 1.5 (2)
PGCE 8.0 (11) No qualifications 2.9 (4) Overseas/misc 0.7 (1) Figures in ( ) = n of centres
Highest childcare qualification information was available for 137 managers. Table 2.6 above reveals that the most frequently held childcare/education qualifications were the Nursery Nursing Education Board (NNEB – now the Diploma in Childcare and Education awarded by Council for Awards in Childcare Education CACHE), and the Cert. Ed. Only a small percent (2.9% or 4) of managers had no qualifications at all. A six-point scale was used in further statistical analyses of the distribution of childcare qualifications and training. This was adapted from the QCA framework referred to above. A summary of the six-point scale is shown in Table 2.7 below (for full break down see Appendix D). Note that Level 1 cannot apply to childcare qualifications as it requires constant supervision by a supervisor, i.e. Level 1 does not apply nationally to childcare. TABLE 2.7 – CHILDCARE QUALIFICATION SIX-POINT RATING SCALE
Level Description Example
Level 0 Unqualified
Level 1 (No childcare qualification equivalent)
Level 2 Childcare certificates BTEC Certificate in Childcare
Level 3 Childcare diplomas NNEB
Level 4 Childcare advanced diplomas Advanced NNEB
Level 5 Professional teaching qualification BA (QTS), PGCE

25
Due to the small numbers of level 4 qualified managers, levels 3 and 4 were combined in our sample (Table 2.8). Manager’s level of childcare qualifications differed significantly by pre-school type (H(5)=82.5, p<.001) as shown in Table 2.8. TABLE 2.8 – MANAGERS’ HIGHEST CHILDCARE/EDUCATION QUALIFICATIONS (BY PRE-SCHOOL TYPE)
Nursery class %
Playgroup %
Private day nursery %
LA %
Nursery school %
Combined centre %
Unqualified 8.3 3.6 4.2
Level 2 41.7 10.7 4.2
Level 3/4 8.7 50.0 57.1 66.7 33.3
Level 5 91.3 28.6 25.0 100.0 66.7
n 23 36 28 24 20 6
The centre managers with the highest childcare qualifications were found predominately in the ‘education’ rather than ‘care’ sector i.e. nursery schools and nursery classes. A third type of maintained provision, combined centres, also had high levels of staff with Level 5 childcare qualifications. Playgroups had the least qualified centre managers with 50 per cent at Level 2 or below. Almost one in ten playgroup managers had no childcare qualification at all. The relationship between managerial childcare qualifications and quality environmental profiles has been described in Appendix G. When quality environmental profiles are grouped according to manager’s childcare qualification level there is a clear trend which shows that the quality of the environment increases with the manager’s childcare qualification. As might be expected, given the link with type, the centre manager’s qualification level was also associated with a ratio category. For example, 60 per cent of centre managers who had qualifications at Level 2 were in centres which had the lowest observed ratios (under 5). By contrast 28 per cent of managers had Level 2 qualifications in centres in centres with ratios of over 8. Moreover, 24 per cent of managers in centres with ratios of under 1:5 had Level 5 qualifications compared with 61 per cent of managers in centres with observed ratios of above 1:8. Managers were also asked about their highest academic qualifications. The overall distribution of academic qualifications across the sample of managers is shown in table 2.9. TABLE 2.9 – MANAGERS’ HIGHEST ACADEMIC QUALIFICATIONS
Highest frequency qualifications %
Middle frequency qualifications %
Lowest frequency qualifications %
NNEB 20.4 (28) PGCE 4.4 (6) NVQ(II) 2.2 (3)
Cert. Ed. 19.0 (26) NVQ(III) 3.6 (5) Dip.Ed. 1.5 (2)
B.Ed. 10.2 (14) Montesori diploma 2.9 (4) No qualifications 1.5 (2)
B.A. 6.6 (9) PA Level II 2.9 (4) O Levels 0.7 (1)
DPP Level III 6.6 (9) B.Sc. 2.2 (3) Overseas/misc 0.7 (1)
PPA 5.1 (7) BTEC 2.2 (3) Social Work Diploma 0.7 (1)
M.A. 4.4 (6) City and Guilds 2.2 (3) Figures in ( ) = n of centres
To allow comparison of academic qualifications by pre-school type, academic qualifications were coded according to the scale described in table 2.10. Note that no manager’s fell into Levels 1, 2 or 4.

26
TABLE 2.10 – GENERAL QUALIFICATIONS RATING SCALE
Level Description Example
Level 0 No qualifications -
Level 1 16 Vocational NVQ(I), NVQ(II)
Level 2 16 Academic GCSE, O-levels
Level 3 18 Vocational NNEB
Level 4 18 Academic A-Levels, GNVQ advanced
Level 5 Degree B.Sc., B.Ed., PGCE, Cert. Ed.
Level 6 Higher degree M.Sc., PhD.
Level 7 Other professional qualification Accountancy
As with childcare qualifications, general qualifications differed significantly by pre-school type, (table 2.11; H(5)=69.4, p<.001), with a similar pattern emerging – managers working in the ‘education’ sector tended to hold higher qualifications. However, over a third of local authority managers held degrees (or Cert. Ed’s); a slightly different picture to that seen with their childcare qualifications (where only 25% fell into the highest category). TABLE 2.11 – MANAGERS’ HIGHEST GENERAL QUALIFICATION (BY PRE-SCHOOL TYPE)
Nursery class %
Playgroup %
Private day nursery %
LA %
Nursery school %
Combined centre %
No qualifications 5.7 0.0
Level 3 4.3 88.6 71.4 62.5 16.7
Level 5 91.3 2.9 25.0 33.3 90.0 83.3
Level 6 4.3 2.9 3.6 4.2 10.0
n 23 35 28 24 20 6
In order to calculate how many managers held higher academic than childcare qualifications, childcare qualifications were also coded into the framework detailed in table 2.10. Across the sample, only 11 of the 137 managers had a general academic qualification which was higher than their childcare qualification. The breakdown by pre-school type shown in table 2.12 confirms that the lower qualified managers do not tend to hold higher general academic qualifications, with the exception of 20 per cent of local authority managers. TABLE 2.12 – HIGHER ACADEMIC THAN CHILDCARE QUALIFICATIONS
Nursery class %
Playgroup %
Private day nursery %
LA %
Nursery school %
Combined centre %
Percent 4.3 (1) 5.6 (2) 7.6 (2) 20.8 (5) 10.0 (2) 0.0 (0)
n 23 36 28 24 20 6
2.7 Qualifications staff Of the 961 staff, childcare course and qualification data were available for 870. As seen in Table 2.13, by far the most commonly held childcare qualification was the NNEB, and interestingly the second most common category was ‘no qualifications’. When staff courses and qualifications were compared across pre-school type using the five-point scheme differences were found (H(5)=104.0, p<.001). The distribution across pre-school type is shown in Table 2.14.

27
TABLE 2.13 – STAFF HIGHEST CHILDCARE QUALIFICATION AND TRAINING (WHOLE SAMPLE)
Highest frequency qualifications %
Middle frequency qualifications %
Lowest frequency qualifications %
NNEB 42.9 (373) ADCE 1.3 (11) MA 0.2 (2)
No qualifications 11.0 (96) Montessori 1.3 (11) Other CC qualification 0.2 (2)
BTEC Certificate 7.0 (61) PLA Learning / Play 1.1 (10) Modular Course in CC 0.2 (2)
NVQ Level 2 5.1 (44) City and Guilds II 0.9 (8) CSE 0.1 (1)
NVQ Level 3 3.8 (33) BTEC Certificate 0.8 (7) NVQ Level 1 0.1 (1)
DPP Level III 3.7 (32) First aid 0.8 (7) DCC 0.1 (1)
Cert. Ed 3.1 (27) NNEB with Portage 0.6 (5) Overseas CC qualif. 0.1 (1)
B. Ed 3.0 (26) HN Diploma 0.5 (4) British Sign Language 0.1 (1)
PGCE 2.9 (25) BA 0.5 (4) State Registered Nurse 0.1 (1)
PPA Found. Level 2.9 (25) HN Certificate 0.2 (2) Classroom assistant 0.1 (1)
BTEC Diploma 2.8 (24) Dip. Ed 0.2 (2) Registered Child Minder 0.1 (1)
PA Level II 1.8 (16) Overseas 0.2 (2) Other miscellaneous 0.1 (1) Figures in ( ) = n of staff
TABLE 2.14 – STAFF CHILDCARE QUALIFICATIONS (BY PRE-SCHOOL TYPE)
Nursery class %
Playgroup %
Private day nursery %
LA %
Nursery school %
Combined centre %
Unqualified 9.6 20.6 11.7 8.7 5.0 12.0
Level 2 5.8 43.3 25.8 21.3 7.6 9.6
Level 3/4 67.3 35.1 58.9 65.2 59.7 61.4
Level 5 17.3 1.0 3.6 4.7 27.7 16.9
n 52 97 248 253 119 83
Overall, there is a descending order of high/low childcare qualification ratios amongst managers and staff across the different forms of provision. Nursery classes and nursery schools have very similar qualifications and could be considered the most highly qualified, followed by combined centres, then private day nurseries and local authority centres together, and finally, playgroups who have the lowest proportion of qualified staff. One in five playgroup staff had no childcare qualifications at all. 2.8 Salary Salary data were available for 943 of the 1103 managers and childcare staff, and it was found that salaries differed significantly by pre-school type (H(5)=347.6, p<.001). Table 2.15 shows that generally nursery school and combined centre staff are the highest paid, followed by nursery classes and local authority centres, private day nurseries and then playgroups. As shown in Table 2.15 playgroups show a markedly different pay structure from the other pre-school types, with 71.6 per cent of their staff earning wages less than £4,000 (this might be anticipated from a sector which grew from a voluntary movement). It should be noted that interviews were mainly conducted during 1998, before the minimum wage was introduced.

28
TABLE 2.15 – SALARY DISTRIBUTION (BY PRE-SCHOOL TYPE)
Nursery class %
Playgroup %
Private day nursery %
LA %
Nursery school %
Combined centre %
£03,999 8.7 71.6 8.4 3.5 4.8 7.6
£4,0007,999 14.5 21.3 35.1 11.8 9.7 10.9
£8,00011,999 30.4 5.7 34.0 40.8 19.4 6.5
£12,00015,999 13.0 1.4 14.9 23.1 26.6 27.2
£16,00019,999 4.3 5.3 12.9 4.0 21.7
£20,00024,999 24.6 1.5 5.1 12.9 13.0
£25,000 + 4.3 0.8 2.7 22.6 13.0
n 69 141 262 255 124 92
TABLE 2.16 – MEAN (AND STANDARD DEVIATION) HOURS PER WEEK BY SALARY (BY PRE-SCHOOL TYPE)
Nursery
class Playgroup
Private day nursery
LA Nursery school
Combined centre
£03,999 6.6 (2.7) 12.5 (5.9) 15.8 (9.5) 17.4 (9.0) 8.6 (5.7) 10.9 (9.3)
£4,0007,999 14.6 (6.1) 27.2 (9.9) 32.5 (9.0) 25.1 (8.7) 17.1 (5.9) 23.1 (5.6)
£8,00011,999 30.7 (9.8) 32.8 (12.1) 36.5 (7.7) 35.7 (7.2) 27.2 (7.3) 26.0 (9.5)
£12,00015,999 26.6 (11.9) 24.0 (8.5) 36.3 (7.3) 32.4 (7.4) 28.4 (8.3) 33.1 (4.9)
£16,00019,999 37.5 (9.0) 39.0 (4.5) 35.6 (4.6) 35.0 (3.5) 36.7 (2.8)
£20,00024,999 34.9 (11.4) 46.3 (10.9) 29.9 (9.0) 28.4 (14.5) 35.0 (5.9)
£25,000 + 47.5 (3.5) 45.0 (7.1) 36.4 (2.8) 41.2 (7.4) 40.9 (7.0)
Table 2.15 gives an indication of the overall career structure available in the six forms of provision. Table 2.16 indicates hours per week in relation to salary by pre-school type. 2.9 Other professional staff Generally most centres (61.8% across the sample) said that some kind of external professional staff had direct contact with the children, and this figure did not vary significantly across type
(2(5, n=136)=8.2, p>.05). These staff should not be confused with volunteer and helper personnel referred to in Section One of this report. Table 2.17 below lists the specific forms of external staff which centres had contact with. TABLE 2.17 – OTHER STAFF
Top half % Bottom half %
Psychology related roles 22.1 (30) Language related teachers 9.6 (13)
Teachers for special needs 22.1 (30) Other 7.4 (10)
Health related roles 14.7 (20) Outside agencies 5.9 (8)
Teacher for aspects of curriculum (e.g. music)
19.9 (27) Social services 1.5 (2)
Church related 0.7 (1) Figures in ( ) = n of staff
Of these, ‘Psychology related roles’ (2(5, n=136)=36.8, p<.001), ‘Health related roles’ (2(5,
n=136)=26.8, p<.001), ‘Teacher for aspects of curriculum’ (2(5, n=136)=11.3, p<.05), ‘Language
teachers’ (2(5, n=136)=17.1, p<.01), and ‘Outside agencies’ (2(5, n=136)=16.5, p<.01) all differed significantly by type (in bold above) and are presented in Table 2.18.
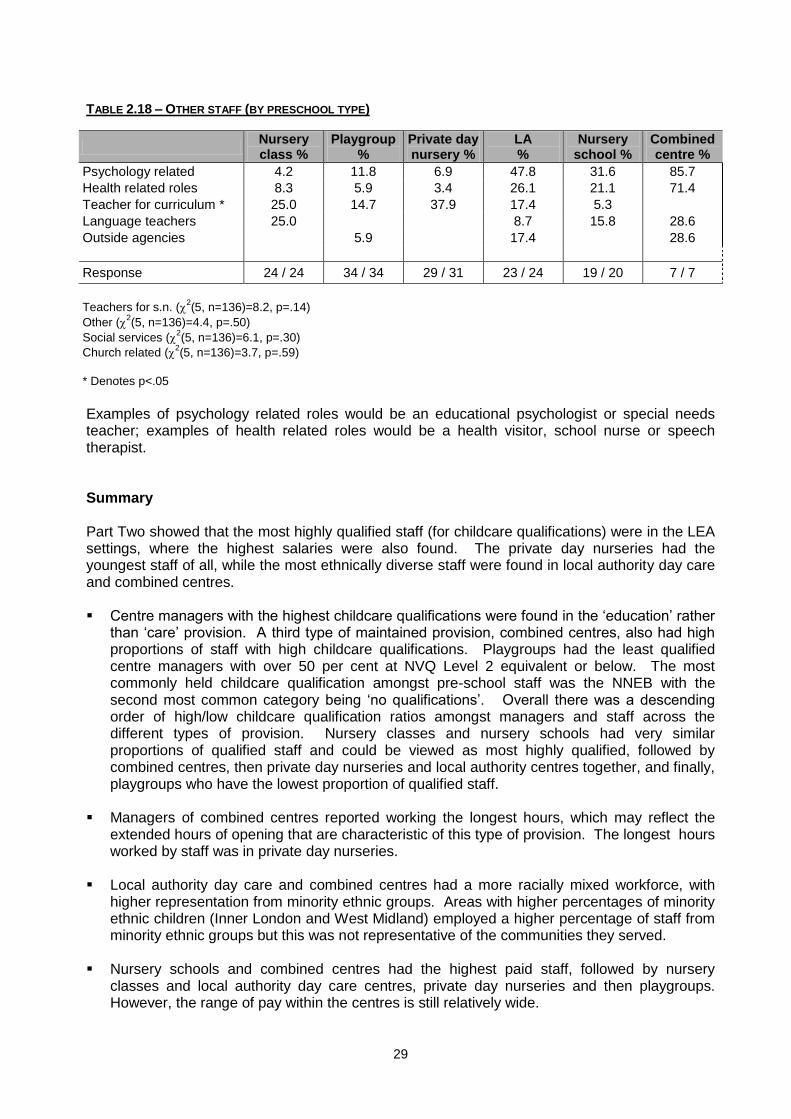
29
TABLE 2.18 – OTHER STAFF (BY PRESCHOOL TYPE)
Nursery class %
Playgroup %
Private day nursery %
LA %
Nursery school %
Combined centre %
Psychology related 4.2 11.8 6.9 47.8 31.6 85.7
Health related roles 8.3 5.9 3.4 26.1 21.1 71.4
Teacher for curriculum * 25.0 14.7 37.9 17.4 5.3
Language teachers 25.0 8.7 15.8 28.6
Outside agencies 5.9 17.4 28.6
Response 24 / 24 34 / 34 29 / 31 23 / 24 19 / 20 7 / 7
Teachers for s.n. (2(5, n=136)=8.2, p=.14)
Other (2(5, n=136)=4.4, p=.50)
Social services (2(5, n=136)=6.1, p=.30)
Church related (2(5, n=136)=3.7, p=.59)
* Denotes p<.05
Examples of psychology related roles would be an educational psychologist or special needs teacher; examples of health related roles would be a health visitor, school nurse or speech therapist. Summary Part Two showed that the most highly qualified staff (for childcare qualifications) were in the LEA settings, where the highest salaries were also found. The private day nurseries had the youngest staff of all, while the most ethnically diverse staff were found in local authority day care and combined centres. Centre managers with the highest childcare qualifications were found in the ‘education’ rather
than ‘care’ provision. A third type of maintained provision, combined centres, also had high proportions of staff with high childcare qualifications. Playgroups had the least qualified centre managers with over 50 per cent at NVQ Level 2 equivalent or below. The most commonly held childcare qualification amongst pre-school staff was the NNEB with the second most common category being ‘no qualifications’. Overall there was a descending order of high/low childcare qualification ratios amongst managers and staff across the different types of provision. Nursery classes and nursery schools had very similar proportions of qualified staff and could be viewed as most highly qualified, followed by combined centres, then private day nurseries and local authority centres together, and finally, playgroups who have the lowest proportion of qualified staff.
Managers of combined centres reported working the longest hours, which may reflect the
extended hours of opening that are characteristic of this type of provision. The longest hours worked by staff was in private day nurseries.
Local authority day care and combined centres had a more racially mixed workforce, with
higher representation from minority ethnic groups. Areas with higher percentages of minority ethnic children (Inner London and West Midland) employed a higher percentage of staff from minority ethnic groups but this was not representative of the communities they served.
Nursery schools and combined centres had the highest paid staff, followed by nursery
classes and local authority day care centres, private day nurseries and then playgroups. However, the range of pay within the centres is still relatively wide.

30
Nursery classes had the oldest profile of staff (48.1% aged over 40) with private day nurseries employing a much younger workforce (only 18% of staff aged over 40). Staff appeared to stay longest in nursery schools and playgroups with the shortest periods of service recorded for private day nurseries.
Managers in nursery schools reported having the most direct ‘contact’ time with children, with
managers in combined centres reporting the least. This may be influenced by centre size as well as type and raises issues about the administrative demands on managers working in different types of pre-school provision.

31
3. The Centres’ Programmes and Activities
3.1 Views on objectives We investigated centre managers’ views on what was important in early years care and education. To this end managers were asked to rank eight items in response to the question ‘what are the major objectives of your centre in addition to caring for children while their parents work?’ Managers were asked to rank the items on a three-point rating scale (‘not important’, ‘quite important’, ‘very important’). Figure 3.1 below shows the mean scores for each item. When this was analysed by type of provision, no differences were found for any item. (‘Language and reasoning’, H(5) =7.1, p=.21; ‘Friendship and sharing’, H(5)=4.3, p=.50; ‘Reading / maths’, H(5)=9.0, p=.11; ‘Physical’ H(5)=6.7, p=.24; ‘Self concept’ H(5)=7.9, p=.16; ‘Religion / culture’ H(5)=8.3, p=.14; ‘Manners’ H(5)=2.6, p=.77; and ‘Other’ H(5)=5.2, p=.39. Four cases were missing for all items, except 5 missing for ‘other skills’.) FIGURE 3.1 – MANAGERS’ PERCEPTIONS OF THE IMPORTANCE OF 7 GOALS FOR CHILDREN
Managers were also asked to identify their three most important goals. Table 3.1 below shows the percentage of centres that rated a given goal as one of their three most important ones. It would appear that in addition to providing care itself, language and reasoning, friendship and sharing and encouraging a positive self-concept are managers’ highest priorities. TABLE 3.1 – PERCENTAGE OF MANAGERS WHO RATED A GOAL AS ONE OF THEIR THREE MOST IMPORTANT (BY
PRE-SCHOOL TYPE)
Nursery class %
Playgroup %
Private day %
LA %
Nursery school %
Combined centre %
Language and reasoning 91.7 70.6 55.2 73.9 80.0 80.0
Friendship and sharing 58.3 67.6 72.4 47.8 45.0
Reading/Maths 8.8
Physical co-ordination 15.0
Positive self-concept 91.7 64.7 60.9 95.0
Values religions and cultures
Manners and self-discipline 35.3
Other skills 10.0
Response 24 / 24 34 / 34 29 / 31 23 / 24 20 / 20 5 / 7

32
3.2 Views of the quality of care and education Managers were asked an open-ended question: ‘What do you think is important in good quality child care and education?’ The responses given into items relating to staff, children and curriculum/planning. The staff In terms of staff the most commonly mentioned items were relevant experience or training (35%) and staff having appropriate personal attributes (32%). While a range of other staff items were mentioned, these two were mentioned far more often than any other. The children Of the child-related items, meeting individual needs was the most commonly mentioned (27%). Several items related to social development (15–19% each), i.e. developing social skills,
selfconfidence, independence and feeling happy and secure, were also commonly mentioned. The curriculum/planning Within the curriculum/planning area the most frequently mentioned items were parental involvement and a child-friendly environment, both reported as being 38 per cent. Other often mentioned items were adequate funding, safety and the ability for children to choose activities. While a large range of other items were mentioned in each of the three areas, especially
staffchild ratio, staff development, play-based curriculum, structured learning environment, none of these other items were mentioned by more than 20 per cent of managers. 3.3 Perceived importance and performance of aspects of pre-school The managers were then asked to rank 31 quality items (see Appendix E for items) for their perceived importance on a 5 point scale. The scale ranged from ‘Extremely important’ (scoring 5) to ‘Not at all important’ (scoring 1). In all cases, all 31 items were rated as ‘Extremely’, ‘Very’, or of ‘Some importance’. That is, not one manager considered any of the items to be of ‘Little’ or ‘No importance’. Table 3.2 below lists the 31 items in their overall order of importance. Items
in bold were rated significantly differently by preschool type (see Appendix E for full Kruskall Wallis results). Data were not available from four centres for this section. TABLE 3.2 – ITEMS RANKED BY OVERALL PERCEIVED IMPORTANCE
Highest ranked items Middle ranked items Lowest ranked items
Staff warmth 2.87 Pupilteacher ratio 2.56 Cultural differences 2.26 Safety 2.84 Children see staff regularly 2.52 Cleanliness 2.26 Attention 2.82 Reg. child devt. evaluation 2.51 Parents drop-in 2.17 Learning opportunities 2.80 Staff training 2.50 Children often see friends 2.15 Comm. with parents 2.76 Support for parents 2.49 Close staff/parents relation 2.11 Settling in process 2.76 Care always available 2.48 Preparation for school 2.05 Get along together 2.69 Staff experience 2.46 Culture 2.04 Licensed child care 2.68 Discipline 2.43 Nutrition 2.04 Day to day activities 2.58 No. of children in a group 2.34 Sharing parents values 1.91 Health 2.57 Equipt., toys and materials 2.34 Religion 1.73 Prefer home to school 1.65
Table 3.3 below presents a breakdown of the items on which there were significant differences by type (shown in bold above). The ‘Agreement’ column gives a numerical indication of how much agreement exists between managers of different types of pre-school about the importance of a given item. This is the sum of the absolute difference between the overall mean for an item, and a given type of pre-school mean rating of that item. Thus, a score of 0 would indicate that the mean importance of the item is the same for each pre-school type.

33
TABLE 3.3 ITEMS THAT DIFFERED BY PERCEIVED IMPORTANCE (BY PRE-SCHOOL TYPE)
Nursery
class Playgroup
Private day
nursery LA
Nursery school
Combined centre
Agreement
Safety * 2.79 2.94 2.77 2.91 2.85 2.40 0.75
Learning opportunities * 2.88 2.65 2.77 2.91 2.95 2.60 0.72
Settling in process * 2.58 2.79 2.67 2.96 2.85 2.80 0.62
Licensed child care 2.33 2.71 2.90 2.91 2.40 3.00 1.42
Day to day activities 2.46 2.29 2.63 2.78 2.90 2.60 1.00
Health 2.33 2.62 2.80 2.65 2.25 3.00 1.34
Regular child devt. evaluation 2.50 2.12 2.50 2.78 2.85 2.80 1.31
Staff training 2.17 2.38 2.43 2.87 2.75 2.60 1.24
Care always available 2.25 2.74 2.66 2.65 2.10 1.60 2.09
Staff experience * 2.13 2.65 2.43 2.57 2.60 1.80 1.45
Cleanliness 1.96 2.62 2.43 2.22 2.05 1.40 1.95
Cultural differences 2.08 1.97 2.30 2.65 2.40 2.60 1.37
Nutrition 1.63 1.88 2.43 2.52 1.75 1.80 1.99
Culture * 1.96 1.76 2.07 2.22 2.30 2.40 1.17
Sharing parents values 1.50 2.12 1.97 1.91 1.75 2.80 1.72
Religion 1.83 1.35 1.73 1.61 2.20 2.40 1.75
Prefer home to school 1.08 1.94 1.83 1.61 1.50 2.00 1.58
Response 24 / 24 34 / 34 30 / 31 23 / 24 20 / 20 5 / 7
* Denotes p<.05, otherwise p<.01
There appears a trend in which agreement is higher in the important items ranked overall as more important, and lower in the items ranked overall as less important. This could be taken to indicate that there is consensus amongst managers of different forms of pre-schools as to what the most important aspects of pre-school are. Often, but not always, the increased discrepancies in the lower ranked items are due to the local authority centre managers rating the items as more important than other managers (i.e. local authority centres show a tendency to rate all characteristics as ‘extremely important’). Centre managers were also asked to consider the same 31 characteristics in terms of how well their centre fulfilled those characteristics. Again a 5-point scale was used to assess performance, ranging from ‘Extremely well’ (scoring 5) to ‘Badly’ (scoring 1). As with perceived importance, all managers rated their performance in the highest 3 of the 5 options, (‘Extremely’, ‘Very’, or ‘Moderately well’.) Table 3.4 below shows the overall ranked scores of the 31 items.
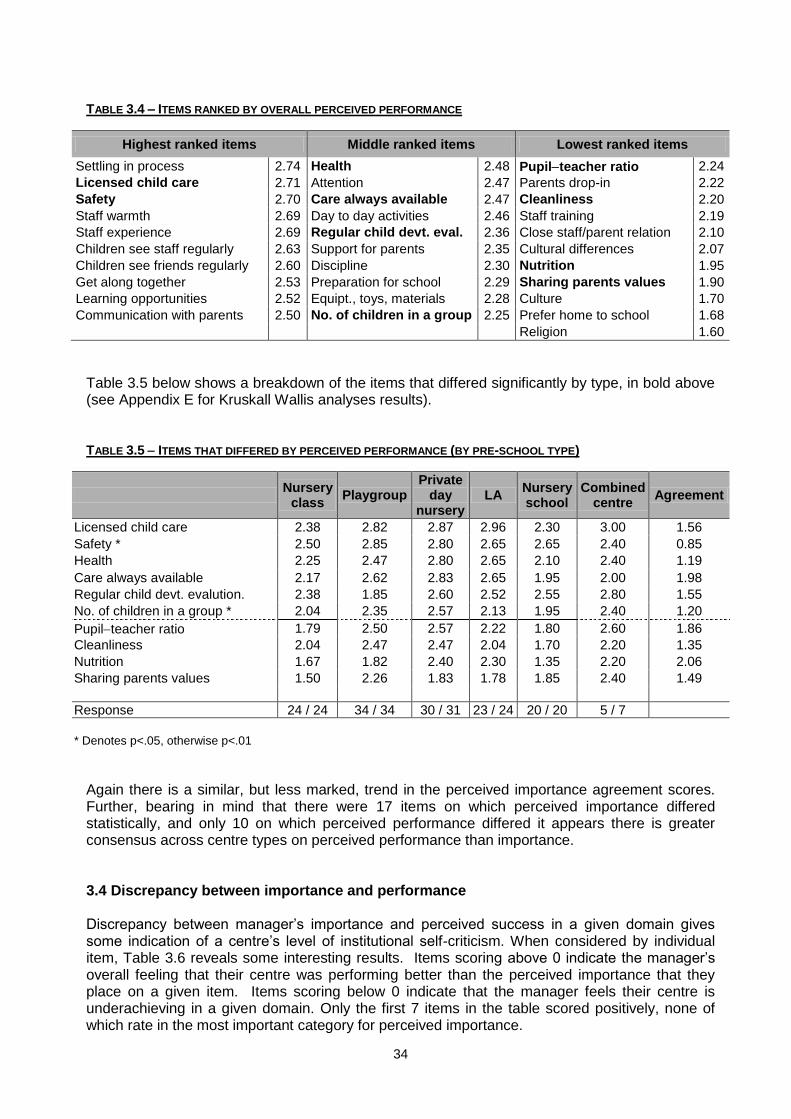
34
TABLE 3.4 – ITEMS RANKED BY OVERALL PERCEIVED PERFORMANCE
Highest ranked items Middle ranked items Lowest ranked items
Settling in process 2.74 Health 2.48 Pupilteacher ratio 2.24
Licensed child care 2.71 Attention 2.47 Parents drop-in 2.22
Safety 2.70 Care always available 2.47 Cleanliness 2.20
Staff warmth 2.69 Day to day activities 2.46 Staff training 2.19
Staff experience 2.69 Regular child devt. eval. 2.36 Close staff/parent relation 2.10
Children see staff regularly 2.63 Support for parents 2.35 Cultural differences 2.07
Children see friends regularly 2.60 Discipline 2.30 Nutrition 1.95
Get along together 2.53 Preparation for school 2.29 Sharing parents values 1.90
Learning opportunities 2.52 Equipt., toys, materials 2.28 Culture 1.70
Communication with parents 2.50 No. of children in a group 2.25 Prefer home to school 1.68
Religion 1.60
Table 3.5 below shows a breakdown of the items that differed significantly by type, in bold above (see Appendix E for Kruskall Wallis analyses results). TABLE 3.5 ITEMS THAT DIFFERED BY PERCEIVED PERFORMANCE (BY PRE-SCHOOL TYPE)
Nursery
class Playgroup
Private day
nursery LA
Nursery school
Combined centre
Agreement
Licensed child care 2.38 2.82 2.87 2.96 2.30 3.00 1.56
Safety * 2.50 2.85 2.80 2.65 2.65 2.40 0.85
Health 2.25 2.47 2.80 2.65 2.10 2.40 1.19
Care always available 2.17 2.62 2.83 2.65 1.95 2.00 1.98
Regular child devt. evalution. 2.38 1.85 2.60 2.52 2.55 2.80 1.55
No. of children in a group * 2.04 2.35 2.57 2.13 1.95 2.40 1.20
Pupilteacher ratio 1.79 2.50 2.57 2.22 1.80 2.60 1.86
Cleanliness 2.04 2.47 2.47 2.04 1.70 2.20 1.35
Nutrition 1.67 1.82 2.40 2.30 1.35 2.20 2.06
Sharing parents values 1.50 2.26 1.83 1.78 1.85 2.40 1.49
Response 24 / 24 34 / 34 30 / 31 23 / 24 20 / 20 5 / 7
* Denotes p<.05, otherwise p<.01
Again there is a similar, but less marked, trend in the perceived importance agreement scores. Further, bearing in mind that there were 17 items on which perceived importance differed statistically, and only 10 on which perceived performance differed it appears there is greater consensus across centre types on perceived performance than importance. 3.4 Discrepancy between importance and performance Discrepancy between manager’s importance and perceived success in a given domain gives some indication of a centre’s level of institutional self-criticism. When considered by individual item, Table 3.6 reveals some interesting results. Items scoring above 0 indicate the manager’s overall feeling that their centre was performing better than the perceived importance that they place on a given item. Items scoring below 0 indicate that the manager feels their centre is underachieving in a given domain. Only the first 7 items in the table scored positively, none of which rate in the most important category for perceived importance.
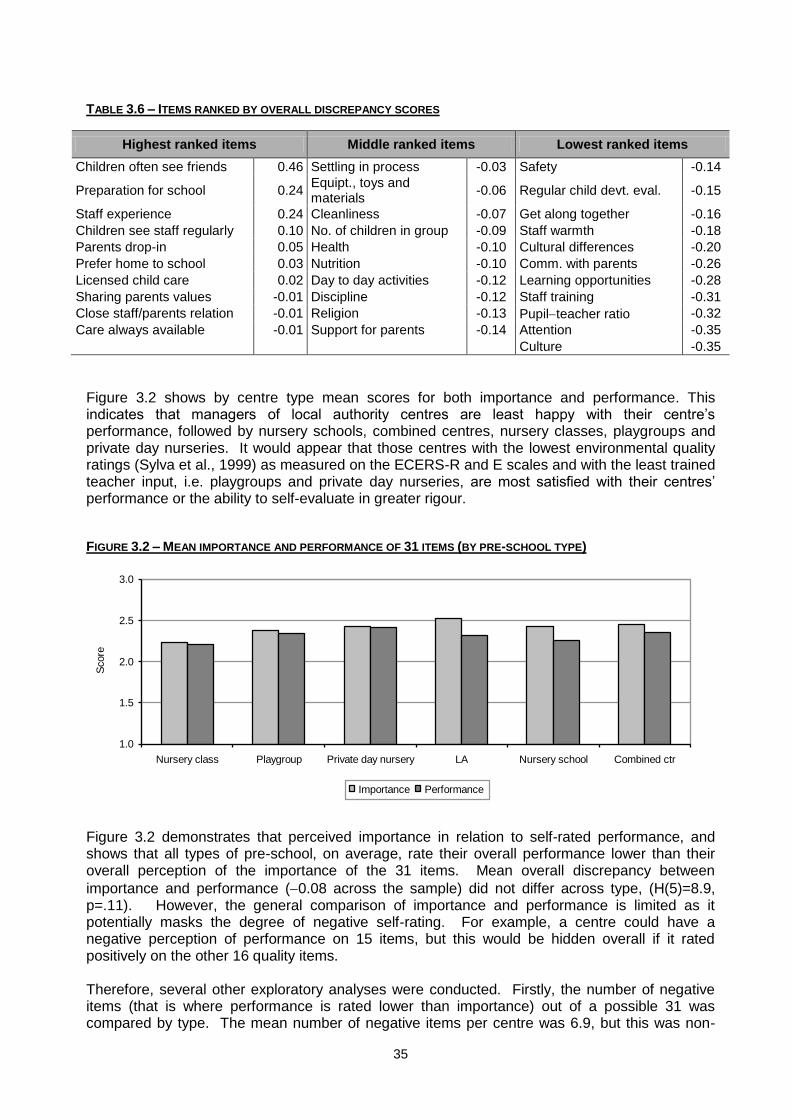
35
TABLE 3.6 – ITEMS RANKED BY OVERALL DISCREPANCY SCORES
Highest ranked items Middle ranked items Lowest ranked items
Children often see friends 0.46 Settling in process -0.03 Safety -0.14
Preparation for school 0.24 Equipt., toys and materials
-0.06 Regular child devt. eval. -0.15
Staff experience 0.24 Cleanliness -0.07 Get along together -0.16
Children see staff regularly 0.10 No. of children in group -0.09 Staff warmth -0.18
Parents drop-in 0.05 Health -0.10 Cultural differences -0.20
Prefer home to school 0.03 Nutrition -0.10 Comm. with parents -0.26
Licensed child care 0.02 Day to day activities -0.12 Learning opportunities -0.28
Sharing parents values -0.01 Discipline -0.12 Staff training -0.31
Close staff/parents relation -0.01 Religion -0.13 Pupilteacher ratio -0.32
Care always available -0.01 Support for parents -0.14 Attention -0.35
Culture -0.35
Figure 3.2 shows by centre type mean scores for both importance and performance. This indicates that managers of local authority centres are least happy with their centre’s performance, followed by nursery schools, combined centres, nursery classes, playgroups and private day nurseries. It would appear that those centres with the lowest environmental quality ratings (Sylva et al., 1999) as measured on the ECERS-R and E scales and with the least trained teacher input, i.e. playgroups and private day nurseries, are most satisfied with their centres’ performance or the ability to self-evaluate in greater rigour. FIGURE 3.2 – MEAN IMPORTANCE AND PERFORMANCE OF 31 ITEMS (BY PRE-SCHOOL TYPE)
1.0
1.5
2.0
2.5
3.0
Nursery class Playgroup Private day nursery LA Nursery school Combined ctr
Score
Importance Performance
Figure 3.2 demonstrates that perceived importance in relation to self-rated performance, and shows that all types of pre-school, on average, rate their overall performance lower than their overall perception of the importance of the 31 items. Mean overall discrepancy between
importance and performance (0.08 across the sample) did not differ across type, (H(5)=8.9, p=.11). However, the general comparison of importance and performance is limited as it potentially masks the degree of negative self-rating. For example, a centre could have a negative perception of performance on 15 items, but this would be hidden overall if it rated positively on the other 16 quality items. Therefore, several other exploratory analyses were conducted. Firstly, the number of negative items (that is where performance is rated lower than importance) out of a possible 31 was compared by type. The mean number of negative items per centre was 6.9, but this was non-

36
significant across type, (H(5)=6.5, p=.26). Secondly, for each centre the sum of negative scores was divided by the number of negative items, to give a index of negative ratings weighted by
degree of negativity. Across the sample the mean of this index was 1.04, but again this did not differ by pre-school type, (H(5)=9.0, p=.11). Thirdly, a general index of absolute discrepancy (not just negative items) was calculated. That is, for each centre, the sum of absolute difference between the 31 items was obtained, and the mean score on this index across the sample was 12.86. Again there was no difference by type found here (H(5)=5.0, p=.41). Thus, on the current data there was no evidence to suggest that self-criticism differs across pre-school type. 3.5 Relationship between manager ratings of quality and the ECERS-R and ECERS-E All 141 centres were independently rated using the ECERS-R and ECERS-E observational measures (see Technical Paper 6 for full report). In brief, the ECERS-R measures quality of the centre environment and care provision, while the ECERS-E measures the quality of educational provision and sensitivity to diversity within centres. Taking the mean of the 31 items rating importance and the mean of the 31 items rating performance, Pearson correlations found that neither of these indexes were significantly related to the centres overall ECERS-R or ECERS-E ratings (Table 3.7). As the ECERS-R is more concerned with quality of provision of care, the finding that managers’ centre performance self-rating was not associated to the ECERS-R suggests that managers judgement of performance is not based on similar criteria. TABLE 3.7 – CORRELATIONS BETWEEN MANAGER RATINGS OF PERFORMANCE AND INDEPENDENT OBSERVATIONS
OF CENTRE
It should be noted that as the 31 items addressing performance in the manager interview do not correspond wholly to the items in the ECERS-R, the finding that the two are not correlated is only of limited interest. With this in mind, items were picked from the 31 items that corresponded more closely with the ECERS-R subscales (Table 3.8). The results of Spearman correlations (due to non-parametric distributions) between these items and the relevant ECERS-R subscales are shown below in Table 3.9.
TABLE 3.8 – SELECTED ITEMS AND CORRESPONDING ECERS-R SUBSCALE
Personal care routines
Interaction Activities Language reasoning
Space and furnishings
Cleanliness Staff warmth Day to day Learning Equipt., toys, materials
Nutrition Attention
Safety Discipline
Health
Care always available
Manager rated
Observationally rated ECERS-R -0.01
ECERS-E -0.10
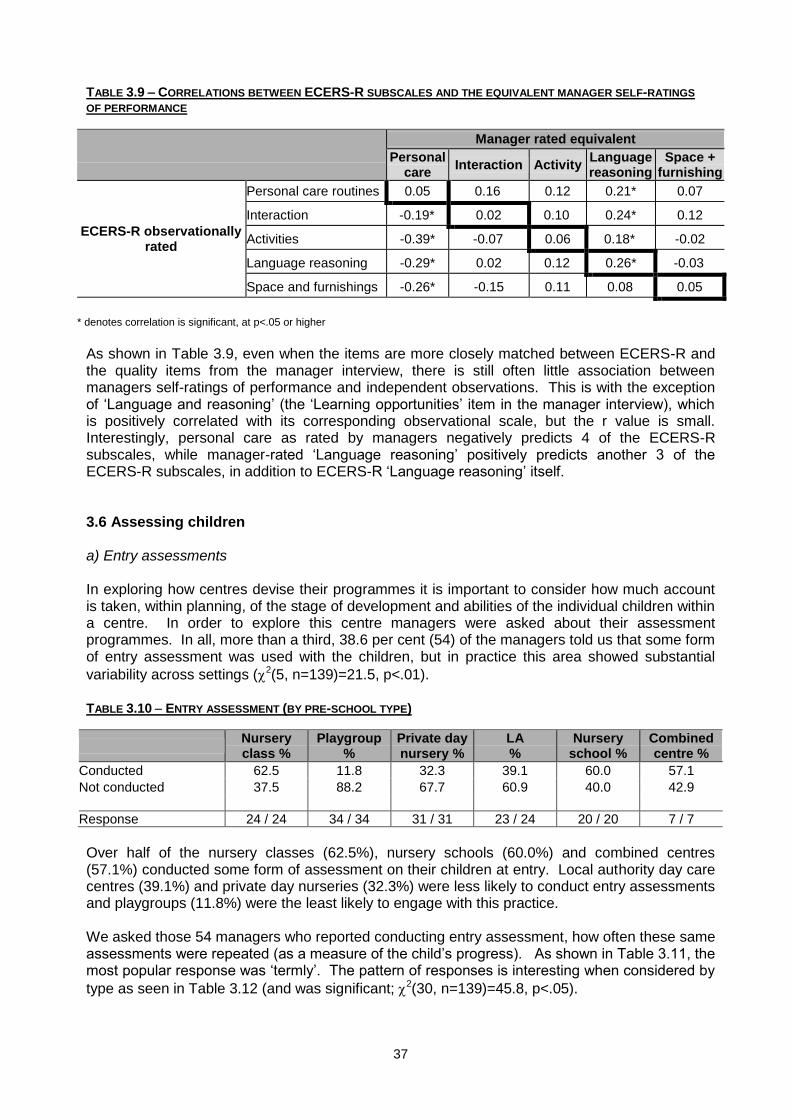
37
TABLE 3.9 – CORRELATIONS BETWEEN ECERS-R SUBSCALES AND THE EQUIVALENT MANAGER SELF-RATINGS OF PERFORMANCE
Manager rated equivalent
Personal care
Interaction Activity Language reasoning
Space + furnishing
ECERS-R observationally rated
Personal care routines 0.05 0.16 0.12 0.21* 0.07
Interaction -0.19* 0.02 0.10 0.24* 0.12
Activities -0.39* -0.07 0.06 0.18* -0.02
Language reasoning -0.29* 0.02 0.12 0.26* -0.03
Space and furnishings -0.26* -0.15 0.11 0.08 0.05
* denotes correlation is significant, at p<.05 or higher
As shown in Table 3.9, even when the items are more closely matched between ECERS-R and the quality items from the manager interview, there is still often little association between managers self-ratings of performance and independent observations. This is with the exception of ‘Language and reasoning’ (the ‘Learning opportunities’ item in the manager interview), which is positively correlated with its corresponding observational scale, but the r value is small. Interestingly, personal care as rated by managers negatively predicts 4 of the ECERS-R subscales, while manager-rated ‘Language reasoning’ positively predicts another 3 of the ECERS-R subscales, in addition to ECERS-R ‘Language reasoning’ itself. 3.6 Assessing children a) Entry assessments In exploring how centres devise their programmes it is important to consider how much account is taken, within planning, of the stage of development and abilities of the individual children within a centre. In order to explore this centre managers were asked about their assessment programmes. In all, more than a third, 38.6 per cent (54) of the managers told us that some form of entry assessment was used with the children, but in practice this area showed substantial
variability across settings (2(5, n=139)=21.5, p<.01). TABLE 3.10 ENTRY ASSESSMENT (BY PRE-SCHOOL TYPE)
Nursery class %
Playgroup %
Private day nursery %
LA %
Nursery school %
Combined centre %
Conducted 62.5 11.8 32.3 39.1 60.0 57.1
Not conducted 37.5 88.2 67.7 60.9 40.0 42.9
Response 24 / 24 34 / 34 31 / 31 23 / 24 20 / 20 7 / 7
Over half of the nursery classes (62.5%), nursery schools (60.0%) and combined centres (57.1%) conducted some form of assessment on their children at entry. Local authority day care centres (39.1%) and private day nurseries (32.3%) were less likely to conduct entry assessments and playgroups (11.8%) were the least likely to engage with this practice. We asked those 54 managers who reported conducting entry assessment, how often these same assessments were repeated (as a measure of the child’s progress). As shown in Table 3.11, the most popular response was ‘termly’. The pattern of responses is interesting when considered by
type as seen in Table 3.12 (and was significant; 2(30, n=139)=45.8, p<.05).

38
TABLE 3.11 FREQUENCY OF REPEATING ENTRY ASSESSMENTS
Top half % Bottom half %
Not conducted 61.2 (85) Yearly 1.4 (2)
Termly 18.7 (26) Not applicable 1.4 (2)
Daily 10.8 (15) Weekly 0.7 (1)
Monthly 5.8 (8)
Figures in ( ) = n of centres
TABLE 3.12 - FREQUENCY OF SUBSEQUENT ASSESSMENTS (BY PRE-SCHOOL TYPE)
Nursery
class %
Playgroup %
Private day nursery %
LA %
Nursery school %
Combined centre
% Not conducted 37.5 88.2 67.7 60.9 40.0 42.9
Daily 16.7 5.9 6.5 8.7 25.0
Weekly 5.0
Monthly 4.2 2.9 6.5 8.7 5.0 14.3
Termly 29.2 19.4 21.7 25.0 42.9
Yearly 4.2 2.9
Not applicable 8.3
Response 24 / 24 34 / 34 31 / 31 23 / 24 20 / 20 7 / 7
Five of our six types of provision favoured repeating the entry assessment with children at the end of their first term, the exception being playgroups. Combined centres were most likely to reassess children within the first term (42.9%) and private day nurseries the least likely (19.4%). b) Regular assessments In addition an entry assessment we asked managers if their staff conducted other regular assessments of their children. The vast majority of centres reported that they did conduct regular assessments of children stages of development and abilities (89.3%). This did differ by type
(2(5, n=140)=29.3, p<.001) and, as Table 3.13 shows, it was playgroups which showed the most marked variation. TABLE 3.13 – REGULAR CHILD ASSESSMENT (BY PRE-SCHOOL TYPE)
Nursery class %
Playgroup %
Private day nursery %
%
LA %
Nursery school %
Combined centre %
Yes 100 64.7 93.5 95.8 100 100
No 35.3 6.5 4.2
Response 24 / 24 34 / 34 31 / 31 24 / 24 20 / 20 7 / 7
Over 50 per cent of all providers made regular assessments of children but reports were highest for nursery classes, nursery schools and combined centres who were unanimous in their approach to assessment. Playgroups, whilst still being over 50 per cent, were the least likely type of provision to make regular assessments (64.7%) of children development and abilities. We explored the issues of assessment further by asking centre managers in what areas did they assess. As shown in Figure 3.3, there were also variations in the areas that managers told us were assessed by their staff.

39
FIGURE 3.3 – AREAS OF CHILD ASSESSMENT
0% 25% 50% 75% 100%
Other
Imaginative play
Cultural
Spiritual, religious and moral
Artistic
Physical and fine/gross motor
Social, emotional and personal
Understanding of world
General child profile
Numeracy
Linguistics, listening and reading
percent of centres
There was no variation across pre-school types for assessing children in linguistics, listening and reading, numeracy, understanding of the world, physical and fine/gross motor, spiritual, religious and moral, cultural and imaginative play. It is interesting to note that a number of these areas are covered by the Early Learning Goals (QCA, 1999). Analysis by pre-school type revealed that the assessment of 3 of these 11 areas varied across type of pre-school. Namely, ‘General child
profile’ (2(5, n=140)=21.5, p<.01), ‘Artistic’ (2(5, n=140)=13.1, p<.05), and ‘Other’ (2(5, n=140)=11.4, p<.05). ‘Social, emotional and personal’ also approached statistical significance
(2(5, n=140)=11.0, p=.051). These items are broken down by form of provision as shown in Table 3.14 below.
TABLE 3.14 – AREAS OF CHILD ASSESSMENT (BY PRE-SCHOOL TYPE)
Nursery class %
Playgroup %
Private day nursery %
LA %
Nursery school %
Combined centre %
General child profile 66.7 14.7 45.2 45.8 60.0 14.3
Social, emotional, personal 58.3 32.4 54.8 62.5 40.0 85.7
Artistic 20.8 11.8 22.6 33.3 20.0 71.4
Other 4.2 5.9 25.8 12.5 30.0 28.6
Response 24/24 34/34 30/31 24/24 20/20 7/7
Linguistics, listening and reading (2(5, n=140)=6.7, p>.05)
Numeracy (2(5, n=140)=4.4, p>.05)
Understanding of world (2(5, n=140)=8.8, p>.05)
Physical and fine/gross motor (2(5, n=140)=2.3, p>.05)
Spiritual, religious and moral (2(5, n=140)=6.3, p>.05)
Cultural (2(5, n=140)=9.8, p>.05)
Imaginative play (2(5, n=140)=4.1, p>.05)
The group ‘other’ covers a range from 4.2 per cent in nursery classes to 30 per cent in nursery schools. Examples of this group are ‘staff monitoring each other in making assessments’, ‘other aspects of development outside of the DLOs but not specified’ and ‘developed own approaches’. Combined centres were much more likely to give attention to assessing children’s progress in social, emotional and personal development as well as their artistic talents.

40
c) Child assessment training Overall 80.6 per cent of managers stated that their staff had undergone some form of training in
child assessment. This varied significantly by pre-school type (2(5, n=139)=17.54, p<.01), and as shown in Table 3.15. TABLE 3.15 – CHILD ASSESSMENT TRAINING (BY PRE-SCHOOL TYPE)
Nursery class %
Playgroup %
Private day nursery %
LA %
Nursery school %
Combined centre %
Yes 91.7 58.8 76.7 87.5 95.0 100.0
No 8.3 41.2 23.3 12.5 5.0
Response 24 / 24 34 / 34 30 / 31 24 / 24 20 / 20 7 / 7
The reporting of staff training in assessment procedures was highest for the maintained sector. Playgroups scored lower than other forms of provision but were still above 50 per cent. No clear patterns emerged from our questions regarding the form of training staff received (Table 3.16). Thirty two per cent of managers said their staff had attended specific courses on assessment. A further 16 per cent said that any assessment training for their staff would have been undertaken as part of their initial childcare qualification course e.g. B.Ed., NNEB (referred to as initial training in the Table below). Only 3.6 per cent of centres reported that they employed staff who were trained in conducting baseline assessments.
TABLE 3.16 – THE DIFFERENT FORMS OF STAFF TRAINING IN CHIILD ASSESSMENT USED BY THE CENTRES
Highest ranked items % Middle ranked items % Lowest ranked items %
Specific course on assessment
32.4 (45) Other written assess info
5.8 (8) Baseline assessment training
3.6 (5)
Initial training 16.5 (23) Non-specific courses/inset
5.8 (8) Assess part of other courses
3.6 (5)
Specific person/training
10.8 (15) Policy 4.3 (6) Portage 0.7 (1)
On the job training 9.4 (13) Part of qualification e.g. NVQ
3.6 (5) Part of social services training
0.7 (1)
Other 8.6 (12) Liaise with other schools/ctrs.
3.6 (5) Experience of staff 0.7 (1)
Figures in ( ) = n of centres
Table 3.17 shows those items which differed significantly across pre-school type (in bold, ‘Initial
training’, 2(5)=20.3, p<.01; ‘Specific person/training’, 2(5)=11.38, p<.05; ‘On the job training’,
2(5)=12.35, p<.05; and ‘Baseline assessment training’, 2(5)=12.6, p<.05).

41
TABLE 3.17 – THE DIFFERENT FORMS OF STAFF TRAINING (IN CHILD ASSESSMENT) USED BY THE CENTRES (BY
PRE-SCHOOL TYPE)
Nursery class %
Playgroup %
Private day nursery %
LA %
Nursery school %
Combined centre %
Initial training 25.0 5.9 16.7 41.7
Specific person/training * 4.2 5.9 3.3 25.0 15.0 28.6
On the job training * 20.8 0.0 3.3 8.3 15.0 28.6
Baseline assessment training 8.3 0.0 0.0 0.0 15.0 0.0
Response 24 / 24 34 / 34 30 / 31 24 / 24 20 / 20 7 / 7
Specific course on assessment (2(5, n=139)=10.3, p>.05)
Other (2(5, n=139)=9.8, p>.05)
Other written assess info (2(5, n=139)=2.8, p>.05)
Non-specific courses/inset (2(5, n=139)=6.2, p>.05)
Policy (2(5, n=139)=5.8, p>05)
Part of qualification e.g. NVQ (2(5, n=139)=4.9, p>.05)
Liaise with other schools/centres (2(5, n=139)=5.0, p>.05)
Assess part of other courses (2(5, n=139)=9.3, p>.05)
Portage (2(5, n=139)=4.8, p>.05)
Part of social services training (2(5, n=139)=3.7, p>.05)
Experience of staff, observe child (2(5, n=139)=3.7, p>.05)
In this analyses only staff in mainstream educational establishments had training in the administration of ‘baseline’ assessments. It is most likely that these members of staff had access to the training package provided by the local education authorities in all schools following the introduction of statutory baseline assessment, at entry to school. All children in state schools are now given a baseline assessment on entry to school, setting a baseline by which later value-added can be measured by national assessment at age 7. Although assessment schemes vary across local education authorities they all assess language, maths, personal and social education. Many schemes assess children on the whole curriculum. The pre-school staff in the state education sector, like nursery teachers, are usually trained alongside their colleagues in primary schools. Baseline assessment relies on the teacher’s assessment of the child’s capabilities. 3.7 Planning a) Use of timetables and a curriculum Managers were asked whether the centre had a daily timetable, and the vast majority (95.7%) did. At least 90 per cent of centres in each form of provision used a timetable with the exception of private day nurseries, where 83.9 per cent did, but this difference was not statistically
significant (2(5, n=139)=9.5, p>.05). The use of a curriculum was almost as widespread as a
whole (88.5%), but this did vary significantly across pre-school type (2(5, n=139)=22.3, p<.001) as shown below in Table 3.18. TABLE 3.18 – CURRICULUM PLANS (BY PRE-SCHOOL TYPE)
Nursery class %
Playgroup %
Private day nursery %
LA %
Nursery school %
Combined centre %
Yes 100.0 67.6 87.1 95.8 100.0 100.0
No 32.4 12.9 4.2
Response 24 / 24 34 / 34 31 / 31 24 / 24 19 / 20 7 / 7

42
Nursery classes and schools were unanimous in their use of a curriculum, which is unsurprising given their educational underpinning. All combined centres reported using a curriculum when planning. The majority of the other forms of provision also reported using a curriculum with playgroups being the least likely to refer to a curriculum when planning their activities. This may be because the playgroups have a lower intake of 4–5-year-olds. b) Personnel who plan Given that the majority of centres reported using a timetable for planning we explored with the managers which members of their staff were involved in the planning process. In the majority of
centres (80.4%), staff shared the planning, collegiately for each of the rooms involving 35-year-olds. In 10.8 per cent of centres planning was done by one individual alone (either the manager or some other designated individual), and for the remaining 8.7 per cent of centres some other arrangement was in operation. Table 3.19 shows the breakdown by type which was statistically
significant (2(15, n=137)=38.0, p<.01). TABLE 3.19 – RESPONSIBILITY FOR PLANNING (BY PRE-SCHOOL TYPE)
Nursery class %
Playgroup %
Private day nursery %
LA %
Nursery school %
Combined centre %
Manager alone 12.5 18.2
Designated person 8.3 3.0 6.7 14.3
All staff collegiately 70.8 75.8 66.7 100.0 100.0 71.4
Others 8.3 3.0 26.7 14.3
Response 24 / 24 33 / 34 30 / 31 24 / 24 19 / 20 7 / 7
In the majority of centres, staff worked together to plan children’s activities. Private day nurseries were the least likely to operate this system with 26.7 per cent (8) of these centres making arrangements which did not fall into the most popular category. In 18.2 per cent of playgroups the planning was done by one person. This may be due to the manager being the only full-time worker in a sector with many part-time, sessional staff, which can make time for collegiate planning difficult. c) Materials used in planning learning activities Ninety six per cent of centres used some form of structured or published materials to aid their
planning (2(5)=5.2, p>.05). The types of materials used varied a great deal and are listed in rank order in Table 3.20. Clearly the material which pre-school workers used most when planning their learning activities were the Desirable Learning Outcomes (QCA 1996). The Desirable Learning Outcomes were the precursor of the Early Learning Goals (QCA 2000), and identify six areas of development for young children. These are: Language and Literacy, Mathematics, Personal and Social Development, Knowledge and Understanding of the World, Physical Development and Creative Development.

43
TABLE 3.20 – MATERIALS USED IN PLANNING
Highest ranked items % Middle ranked items % Lowest ranked items %
Desirable outcomes 68.6(96) Staff/colleagues 7.2(10) Local forums/other centres
2.2(3)
Magazines/journals 15.8(22) Development plan 6.5(9) Specific festivals/religion
1.4(2)
Own materials unspecified 13.6(19) Social services guidelines
5.0(7) Parents 1.4(2)
Other materials 12.9(18) Library resources 5.0(7) Nursery project materials
1.4(2)
Local authority schemes 12.9(18) PLA materials 3.6(5) Children – interests 1.4(2)
Published schemes 10.8(15) DfES materials 2.9(4) Childcare Act 0.7(1)
OFSTED materials 8.6 (12) Montessori materials 2.2(3) Baseline assessment schemes
0.7(1)
National Curriculum guidelines
7.9 (11) INSET/Training courses materials
2.2(3)
Of the types of structured, published materials used for planning children’s learning activities only the use of the ‘Desirable outcomes’, ‘Other materials’, ‘Development plan’, and ‘Children’s interests’, differed significantly by pre-school type (in bold above). In addition, ‘Social service guidelines’, and ‘Montessori materials’, approached statistical significance, and these 6 items are shown in Table 3.21. (See Appendix F for full details of statistical analysis.) TABLE 3.21 – MATERIALS USED IN PLANNING (BY PRE-SCHOOL TYPE)
Nursery class %
Playgroup %
Private day nursery %
LA %
Nursery school %
Combined centre %
Desirable outcomes * 87.5 47.1 67.7 70.8 80.0 71.4
Other materials 12.5 2.9 6.5 12.5 40.0 14.3
Development plan 3.2 4.2 20.0 42.9
Social services guidelines ** 14.7 6.5
Montessori materials ** 9.7
Children – interests * 10.0
Response 24 / 24 34 / 34 30 / 31 24 / 24 20 / 20 7 / 7
As shown in Table 3.21, the ‘Desirable Outcomes’ were used in all sectors, although noticeably less often in playgroups, maybe because of their low intake of children over 4 (the DLOs were only applicable to 4-year-olds). ‘Development plans’ were used in 20 per cent of nursery schools and 42.9 per cent of combined centres, but rarely in other forms of provision. Also, ‘Montessori materials’ were only used by private day nurseries, whereas the response, ‘Children’s interests’ was only given in nursery schools. d) Use of assessment information in planning In the previous section it was reported that 89.3 per cent of centres conducted regular assessment of some kind. When we asked these 125 centres if their assessments were used in planning classroom activities 96.6 per cent of those who answered said ‘yes, they did’, 3 centres answered ‘no, they did not’ (2.5%) and 1 private day nursery felt the question was ‘not applicable’
(0.8%). The use of assessment in planning did not differ across type (2(10, n=133)=8.6, p>.05).
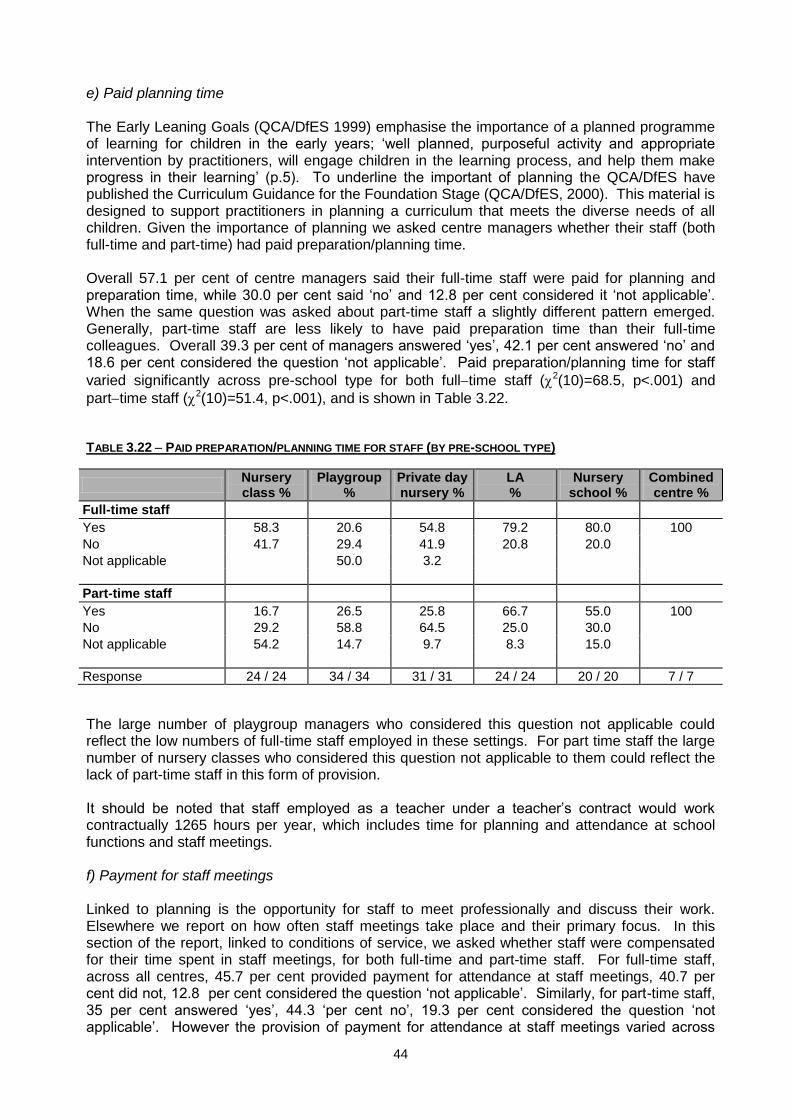
44
e) Paid planning time The Early Leaning Goals (QCA/DfES 1999) emphasise the importance of a planned programme of learning for children in the early years; ‘well planned, purposeful activity and appropriate intervention by practitioners, will engage children in the learning process, and help them make progress in their learning’ (p.5). To underline the important of planning the QCA/DfES have published the Curriculum Guidance for the Foundation Stage (QCA/DfES, 2000). This material is designed to support practitioners in planning a curriculum that meets the diverse needs of all children. Given the importance of planning we asked centre managers whether their staff (both full-time and part-time) had paid preparation/planning time. Overall 57.1 per cent of centre managers said their full-time staff were paid for planning and preparation time, while 30.0 per cent said ‘no’ and 12.8 per cent considered it ‘not applicable’. When the same question was asked about part-time staff a slightly different pattern emerged. Generally, part-time staff are less likely to have paid preparation time than their full-time colleagues. Overall 39.3 per cent of managers answered ‘yes’, 42.1 per cent answered ‘no’ and 18.6 per cent considered the question ‘not applicable’. Paid preparation/planning time for staff
varied significantly across pre-school type for both fulltime staff (2(10)=68.5, p<.001) and
parttime staff (2(10)=51.4, p<.001), and is shown in Table 3.22.
TABLE 3.22 PAID PREPARATION/PLANNING TIME FOR STAFF (BY PRE-SCHOOL TYPE)
Nursery class %
Playgroup %
Private day nursery %
LA %
Nursery school %
Combined centre %
Full-time staff
Yes 58.3 20.6 54.8 79.2 80.0 100
No 41.7 29.4 41.9 20.8 20.0
Not applicable 50.0 3.2
Part-time staff
Yes 16.7 26.5 25.8 66.7 55.0 100
No 29.2 58.8 64.5 25.0 30.0
Not applicable 54.2 14.7 9.7 8.3 15.0
Response 24 / 24 34 / 34 31 / 31 24 / 24 20 / 20 7 / 7
The large number of playgroup managers who considered this question not applicable could reflect the low numbers of full-time staff employed in these settings. For part time staff the large number of nursery classes who considered this question not applicable to them could reflect the lack of part-time staff in this form of provision. It should be noted that staff employed as a teacher under a teacher’s contract would work contractually 1265 hours per year, which includes time for planning and attendance at school functions and staff meetings. f) Payment for staff meetings Linked to planning is the opportunity for staff to meet professionally and discuss their work. Elsewhere we report on how often staff meetings take place and their primary focus. In this section of the report, linked to conditions of service, we asked whether staff were compensated for their time spent in staff meetings, for both full-time and part-time staff. For full-time staff, across all centres, 45.7 per cent provided payment for attendance at staff meetings, 40.7 per cent did not, 12.8 per cent considered the question ‘not applicable’. Similarly, for part-time staff, 35 per cent answered ‘yes’, 44.3 ‘per cent no’, 19.3 per cent considered the question ‘not applicable’. However the provision of payment for attendance at staff meetings varied across

45
pre-school type for both full-time (2(10, n=139)=70.7, p<.001) and part-time staff (2(10, n=138)=52.7, p<.001), as detailed in Table 3.23 below.
TABLE 3.23 PAYMENT FOR ATTENDANCE AT STAFF MEETINGS (BY PRE-SCHOOL TYPE)
Nursery class %
Playgroup %
Private day nursery %
LA %
Nursery school %
Combined centre %
Full-time staff
Yes 50.0 8.8 41.9 73.9 65.0 85.7
No 50.0 41.2 54.8 26.9 35.0 14.3
Not applicable 50.0 3.2
Response 24 / 24 34 / 34 31 / 31 23 / 24 20 / 20 7 / 7
Part-time staff
Yes 8.3 17.6 30.0 62.5 50.0 100
No 37.5 64.7 60.0 26.1 35.0
Not applicable 54.2 17.6 10.0 8.7 15.0
Response 24 / 24 34 / 34 30 / 31 23 / 24 20 / 20 7 / 7
Of those who considered the question applicable, local authority, nursery schools and combined centres were most likely to fund attendance at staff meetings. This could reflect the larger number of staff employed in these types of provision and the greater need for more formal methods of communication. In centres that employ fewer staff, formal staff meetings may not be such regular events with more informal methods of communication perhaps being more common. This may be reflected in the 50 per cent of playgroups who felt payment for full-time staff to attend meetings was not an issue applicable to them. Part-time staff were less likely to be paid for attendance at staff meetings than their full-time colleagues. Part-time staff, often amongst the lowest paid, may often be faced with the decision either not to attend staff meetings or suffer financially for attending. 3.8 Provision for children with special needs a) Number of children with special needs The importance of early detection of developmental (both physical and cognitive) delays in children cannot be over-emphasised. Early intervention strategies, on special needs, are generally recognised as cost effective and have been shown to be crucial to the future wellbeing of children (Owen and Smith, 2000; Slavin, 1996; Wolfendale, 1997). Given the importance of early intervention strategies for children who may have some form of special educational or health need, we explored with centre managers the types of programmes they had in place to detect and monitor children who may fall within this category. We asked the managers if they had children in their centres who they considered had a ‘special need’. Overall 77.1 per cent of centres reported that they had children with some type of ‘special need’. This differed across
type (2(10)=25.1, p<.01) and is shown in Table 3.24.

46
TABLE 3.24 – ENROLMENT OF SPECIAL NEEDS CHILDREN (BY PRE-SCHOOL TYPE)
Nursery class %
Playgroup %
Private day nursery %
%
LA %
Nursery school %
Combined centre %
Yes 83.3 52.9 67.7 91.7 100.0 100.0
No 8.3 32.4 22.6 8.3
Response 24 / 24 34 / 34 31 / 31 24 / 24 20 / 20 7 / 7
Centre managers in the maintained sector reported higher incidences of having children with some type of special need (80 % plus). The rates of reporting were less in playgroups (52.9 %) and private day nurseries (67.7 %). These figures suggest two explanations: either there are more children with special needs being catered for in maintained provision or the maintained sector’s staff were more alert to the detection of special needs in their children. The parent interview data reveals that for the children enrolled in EPPE there are not fewer children with developmental or behaviour problems in playgroups and private day nurseries. b) The identification of special needs The 130 centres that accept children with special needs were also asked whether they had a system for identifying these children. The maintained sector was unanimous in having in place systems for identifying children who had special needs. Private day nurseries (75 per cent) and playgroups (86.2 per cent) were less likely to have identification systems in place.
TABLE 3.25 SYSTEM FOR IDENTIFYING SPECIAL NEEDS (BY TYPE PRE-SCHOOL TYPE)
Nursery class %
Playgroup %
Private day nursery %
LA %
Nursery school %
Combined centre %
Yes 100.0 86.2 75.0 100.0 100.0 100.0
No 13.8 25.0
Response 22 / 22 29 / 29 28 / 28 24 / 24 20 / 20 7 / 7 NA excluded
For centres which had some type of system for the identification of special needs in place we explored with them how their systems worked in practice. TABLE 3.26 - METHODS FOR IDENTIFYING CHILDREN WITH SPECIAL NEEDS
Top group % Bottom group %
Observation schedule 54.6 (71) Specific person responsible 19.2 (25)
Consult professionals 43.1 (56) Development charts 13.1 (17)
Consult parent 38.5 (50) Policy on special needs 6.9 (9)
Code of practice 30.0 (39) Procedure for special needs 5.4 (7)
Checklists 20.8 (27) Any other 3.8 (5)
Liaise with special school 2.3 (3)
Figures in ( ) = n of centres NA excluded
Three of these items differed across pre-school type (in bold above): use of the Code of Practice,
(2(5)=23.7, p<.001), having a ‘specific person responsible (SENCO)’ for special needs
(2(5)=17.9, p<.01), and having agreed ‘procedure for special needs’ (2(5)=11.7, p<.05). These are shown in Table 3.27.

47
TABLE 3.27 METHODS FOR IDENTIFYING CHILDREN WITH SPECIAL NEEDS (BY PRE-SCHOOL TYPE)
Nursery class %
Playgroup %
Private day %
%%nursery
LA %
Nursery school %
Combined centre %
Code of practice 27.3 13.8 7.1 50.0 55.0 57.1
Specific person responsible 22.7 3.4 17.9 25.0 15.0 71.4
Procedure for special needs * 6.9 3.6 20.0
Response 22 / 22 29 / 29 28 / 28 24 / 24 20 / 20 7 / 7 NA excluded
Observation schedule (2(5, n=130)=8.8, p=.12)
Consult professionals (2(5, n=130)=7.0, p=.22)
Consult parent (2(5, n=130)=3.4, p=.64)
Checklists (2(5, n=130)=7.5, p=.17)
Development charts (2(5, n=130)=2.1, p=.84)
Policy on special needs (2(5, n=130)=2.5, p=.78)
Any other (2(5, n=130)=6.2, p=.28)
Liaise with special school (2(5, n=130)=2.2, p=.80)
The use of the Code of Practice was much more common in the maintained sector, as was the incidence of a centre having a named person responsible for special needs (Special Educational Needs Co-ordinator or SENCO). c) strategies for special needs We asked those 130 centres who cater for children with special needs which strategies they employ to meet the needs of these children. A range of strategies were mentioned, and the incidence of these across the sample is shown in Table 3.28. Four strategies differed in their incidence across pre-school type and these are shown in Table 3.29. (‘Liaise with other
professionals’, 2(5, n=130)=13.4, p<.05; ‘Individual Education Plan / Code of practice’, 2(5,
n=130)=21.5, p<.01; ‘Other specially trained staff’, 2(5, n=130)=18.6, p<.01; ‘Designated
SENCO’, 2(5, n=130)=16.7, p<.01.)
TABLE 3.28 – STRATEGIES FOR DEALING WITH SPECIAL NEEDS
Top group % Bottom group %
Liaise other professionals 66.0 (66) Designated SENCO 13.0 (13)
IEP/Code of practice 45.0 (45)
Other 44.0 (44) Checklist/record concern 11.0 (11)
Regular meetings with parents 41.0 (41) Specialised equipment 9.0 (9)
Extra help/carer available 19.0 (19) Special needs/equal ops. policy 3.0 (3)
Observation/supervision 17.0 (17) Awareness (courses) for staff 3.0 (3)
Other specially trained staff 15.0 (15) Use role play/play to promote equal ops. 1.0 (1)
Figures in ( ) = n of centres NA excluded

48
TABLE 3.29 STRATEGIES FOR DEALING WITH SPECIAL NEEDS (BY PRE-SCHOOL TYPE)
Nursery class %
Playgroup %
Private day %
nursery
LA %
Nursery school %
Combined centre %
Liaise other professionals * 54.5 51.7 35.7 70.8 30.0 85.7
IEP/Code of practice 31.8 13.8 17.9 50.0 60.0 71.4
Other specially trained staff 13.6 0.0 3.6 8.3 35.0 28.6
Designated SENCO 27.3 0.0 7.1 0.0 15.0 28.6
Response 22/22 29/29 28/28 24 / 24 20 / 20 7 / 7
NA excluded
Other (2(5, n=130)=7.7, p=.17)
Regular meetings with parents (2(5, n=130)=1.1, p=.95)
Extra help/carer available (2(5, n=130)=10.5, p=.06)
Observation/supervision (2(5, n=130)=3.0, p=.70)
Check list/record concern (2(5, n=130)=7.7, p=.17)
Specialised equipment (2(5, n=130)=1.9, p=.87)
Special needs/equal ops. policy (2(5, n=130)=3.0, p=.70)
Awareness (courses) for staff (2(5, n=130)=7.4, p.(5, n=130)=19)
Use role play/play to promote equal ops. (2(5, n=130)=4.5, p=.49)
Over 50 per cent of combined centres (85.7 per cent), local authority day care (70.8 per cent), nursery classes (54.5 per cent) and playgroups (51.7 per cent) reported liaising with other professionals about children in their centres who had special needs. Only private day nurseries (35.7 per cent) and nursery schools (30 per cent) dropped below the 50 per cent figure. The pre-schools which fell into the maintained sector reported much higher incidence of use of individual education plans, or the Code of Practice than the voluntary sector. The maintained sector also reported a much higher incidence of staff who had been specifically trained to address the needs of children with special needs.

49
Summary In Part Three there was consensus amongst staff on the goals of pre-school education. The maintained sector, however, was better trained to assess children, carry out curricular planning, and make adequate provision for children with special needs. There was consensus amongst managers of different types of pre-schools as to what the
most important aspects of pre-school are. When considering issues of ‘quality’ in care and education, managers wanted staff who had relevant experience and training, with personal attributes appropriate to working with young children. They wanted staff who could meet the individual needs of children, helping them to develop social skills, self-confidence and independence, in a happy environment. They also thought it important to nurture an environment which encouraged parental involvement and was ‘child-friendly’.
Managers of pre-schools, in addition to providing care, rated the development in children of
language and reasoning, friendship and sharing and encouraging positive self-concepts as the most important objectives of their centres.
There was widespread use of daily timetables and collegiate planning but the maintained
sector was more likely to refer to aspects of the curriculum when planning activities. There was good use made of the Desirable Leaning Outcomes, with only playgroups making less use of this document in their planning than other forms of provision. The use of assessment information in planning did not differ by pre-school type.
Staff working in the maintained rather than the voluntary sector were more likely to have
been trained to assess and monitor children’s development. They conducted assessments more regularly and used a wider repertoire of assessment strategies.
Centre managers in the maintained sector reported higher incidence of having children with
special needs and were unanimous in having systems for early identification. The use of the Code of Practice was much more common in the maintained sector, as was the incidence of a centre having a named person responsible for special needs.
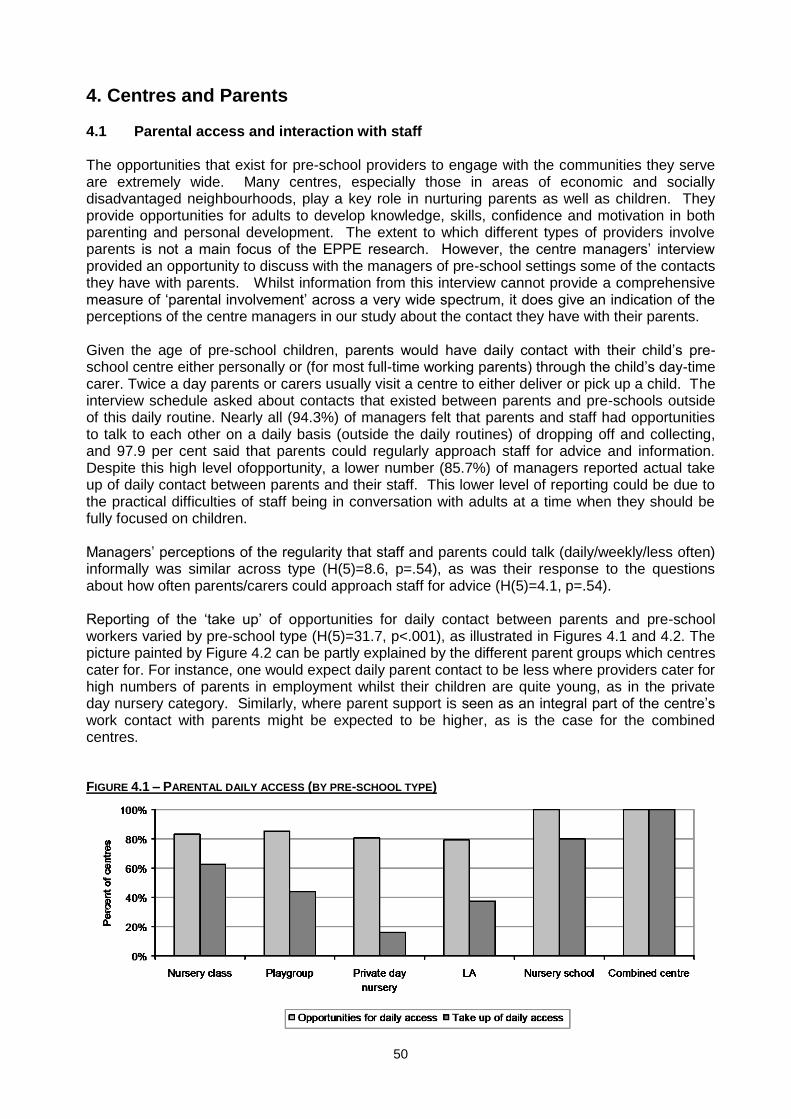
50
4. Centres and Parents 4.1 Parental access and interaction with staff The opportunities that exist for pre-school providers to engage with the communities they serve are extremely wide. Many centres, especially those in areas of economic and socially disadvantaged neighbourhoods, play a key role in nurturing parents as well as children. They provide opportunities for adults to develop knowledge, skills, confidence and motivation in both parenting and personal development. The extent to which different types of providers involve parents is not a main focus of the EPPE research. However, the centre managers’ interview provided an opportunity to discuss with the managers of pre-school settings some of the contacts they have with parents. Whilst information from this interview cannot provide a comprehensive measure of ‘parental involvement’ across a very wide spectrum, it does give an indication of the perceptions of the centre managers in our study about the contact they have with their parents. Given the age of pre-school children, parents would have daily contact with their child’s pre-school centre either personally or (for most full-time working parents) through the child’s day-time carer. Twice a day parents or carers usually visit a centre to either deliver or pick up a child. The interview schedule asked about contacts that existed between parents and pre-schools outside of this daily routine. Nearly all (94.3%) of managers felt that parents and staff had opportunities to talk to each other on a daily basis (outside the daily routines) of dropping off and collecting, and 97.9 per cent said that parents could regularly approach staff for advice and information. Despite this high level ofopportunity, a lower number (85.7%) of managers reported actual take up of daily contact between parents and their staff. This lower level of reporting could be due to the practical difficulties of staff being in conversation with adults at a time when they should be fully focused on children. Managers’ perceptions of the regularity that staff and parents could talk (daily/weekly/less often) informally was similar across type (H(5)=8.6, p=.54), as was their response to the questions about how often parents/carers could approach staff for advice (H(5)=4.1, p=.54). Reporting of the ‘take up’ of opportunities for daily contact between parents and pre-school workers varied by pre-school type (H(5)=31.7, p<.001), as illustrated in Figures 4.1 and 4.2. The picture painted by Figure 4.2 can be partly explained by the different parent groups which centres cater for. For instance, one would expect daily parent contact to be less where providers cater for high numbers of parents in employment whilst their children are quite young, as in the private day nursery category. Similarly, where parent support is seen as an integral part of the centre’s work contact with parents might be expected to be higher, as is the case for the combined centres. FIGURE 4.1 – PARENTAL DAILY ACCESS (BY PRE-SCHOOL TYPE)

51
All providers reported lower levels of ‘take-up’ of access compared to the extent to which manager reported having ‘opportunities’ for access to pre-school staff. Private day nurseries reported having the lowest incidence of parent’s ‘take-up’ of opportunities to talk to pre-school workers on a daily basis, as shown above, but had higher levels of reporting weekly contact with staff, as reported in the Table 4.1 below. The extent to which different pre-school centres consider parents having regular contact with their staff may be related to the proportions of working parents in each type of centre. Private day nurseries, with a higher level of professional parents who work full-time, are unlikely to experience parents wishing to talk to staff during the working day
FIGURE 4.2 – CENTRES WHERE PARENTS COME IN TO TALK TO STAFF WEEKLY [EXCLUDES DROPPING OFF AND
COLLECTING (BY PRE-SCHOOL TYPE)]
4.2 Parent/staff meetings Managers were asked about formal meetings between parents and staff. Overall 69.3 per cent of managers reported parent/staff meetings were scheduled with some regularity. The most popular pattern for formal meetings was termly 37.1 per cent, closely followed by some ‘other’ frequency (26.4% which tended to refer to more informal arrangements). The frequency of parent/staff meetings varied across type (H(5)=17.63, p<.01) and is shown in Table 4.1. Again the variation in involvement in meetings by parents may depend on their employment status. TABLE 4.1 – PARENT/STAFF MEETINGS (BY PRE-SCHOOL TYPE)
Nursery class %
Playgroup %
Private day nursery %
LA %
Nursery school %
Combined centre %
Not scheduled 25.0 44.1 41.9 12.5 25.0 14.3
Weekly 5.0
Monthly 17.6 4.2
Termly 33.3 35.3 29.0 45.8 35.0 71.4
Other 41.7 2.9 29.0 37.5 35.0 14.3
Response 24 / 24 34 / 34 31 / 31 24 / 24 20 / 20 7 / 7
The voluntary sector reported fewer scheduled formal meetings with parents (Table 4.1 above). When meetings were scheduled most centres favoured termly meetings, with combined centres reporting the highest incidence (71.4%) and private day nurseries the lowest (29.0%). In all cases of reporting parental contact the availability of working parents must be borne in mind.

52
4.3 Availability of a parents’ room If managers are encouraging parents to have a larger presence in their centres, the availability of a room where parents can meet together can be an asset. The interview asked managers whether they had a room or area in their centres where parents could meet together to discuss issues between themselves. Only 45.0 per cent of managers reported a room available on a daily basis, while 20.0 per cent reported that either a room was available less often than once a week, and 32.9 per cent of centres did not provide a room at all. Provision of a parent room did not differ across pre-school type (H(5)=5.6, p=.35, all interviewees answered this question).
4.4 Other areas of centreparent contact This report has referred in earlier sections to the adult/child ratios in operation in pre-school centres (see Part One) which include those adults who act as unpaid workers. This section of the interview schedule asked specifically about parents who come into school and ‘help out’ under the direction of paid staff on a less regular basis and are therefore ‘helpers’ rather than unpaid staff. They do not have timetables and do not have a regular time commitment to the centre. It cannot be assumed that parents who ‘help out’ in pre-school settings are all directly involved with children. Many parents offer their time, skills and expertise in both domestic and administrative roles. Overall 26.6 per cent of centres benefited from regular help from parents.
As shown in Table 4.3, in three of the six forms of provision, this was fairly regular (2(5, n=139)=32.3, p<.001). FIGURE 4.3 – PARENT HELP (BY PRE-SCHOOL TYPE)
0%
20%
40%
60%
80%
100%
Nursery class Playgroup Private day
nursery
LA Nursery school Combined ctr
Perc
ent of centr
es
The low percentage of parent help in private day nurseries may be related to the number of full-time working parents. The low percentage in combined centres could reflect their larger number of staff, many of whom are employed to work in domestic and administrative/clerical roles. Moreover, many combined centres have structured activities for parents, which might preclude their more casual involvement.

53
Managers were asked if parents were involved in other aspects of pre-school life. FIGURE 4.4 – OTHER AREAS OF CENTRE–PARENT CONTACT
Again, the particular methods applied varied according to the type of setting, as shown in Table
4.2 below. (‘Some time spent in children’s room each week’, 2(5, n=138)=47.4, p<.001; ‘Some
time spent out of children’s room each week’, 2(5, n=138)=41.6, p<.001; ‘Fundraising’, 2(5,
n=140)=20.5, p<.01; ‘Help with physical setting’, 2(5, n=140)=22.5, p<.001; ‘Meetings’,
2(5)=26.1, p<.001; and ‘Policy making’, 2(5, n=140)=28.6, p<.001.)
TABLE 4.2 – OTHER AREAS OF CENTRE–PARENT CONTACT BY (BY PRE-SCHOOL TYPE)
Nursery class %
Playgroup %
Private day nursery %
LA %
Nursery school %
Combined centre %
Time spent in children’s room Response
58.3 24/24
48.5 33/34
9.7 31/31
30.4 23/24
98.0 20/20
100.0 7/7
Time out of children’s room Response
54.2 24/24
51.5 33/34
16.1 31/31
43.5 23/24
100.0 20/20
100.0 7/7
Fundraising Response
91.7 24/24
91.2 34/34
67.7 31/31
95.8 24/24
100.0 20/20
57.1 7/7
Meetings Response
54.2 24/24
38.2 34/34
12.9 31/31
29.2 24/24
80.0 20/20
42.9 7/7
Physical settings Response
87.5 24/24
55.9 34/34
71.0 31/31
95.8 24/24
95.0 20/20
100.0 7/7
Policy setting Response
4.2 24/24
63.6 33/34
35.5 31/31
41.7 24/24
60.0 20/20
85.7 7/7
Fundraising seemed to be a major preoccupation for most types of centres. The private day nurseries were less concerned about fundraising than the nursery classes and schools, local authority day care and the voluntary sector. Perhaps this is because they receive more fees from parents and are therefore reluctant to ask for additional revenue. The combined centres were the least likely to engage in fundraising although this might be a skewed figure because 4 of our 7 combined centres are deemed Early Excellence Centres and have more generous funding. 4.5 Settling children in We asked the managers about the procedures they employed for ‘settling’ new children into their settings. In all 82.1 per cent told us they employed a set procedure for ‘settling in’, 72.9 per cent said that the process involves a pre-visit to the pre-school, and 65.7 per cent said that the time to settle is ‘built up’, that is, the parent gradually reduces the time they stay with the child. The occurance of each strategy varied by pre-school type, as shown in Table 4.3. (‘Procedure of
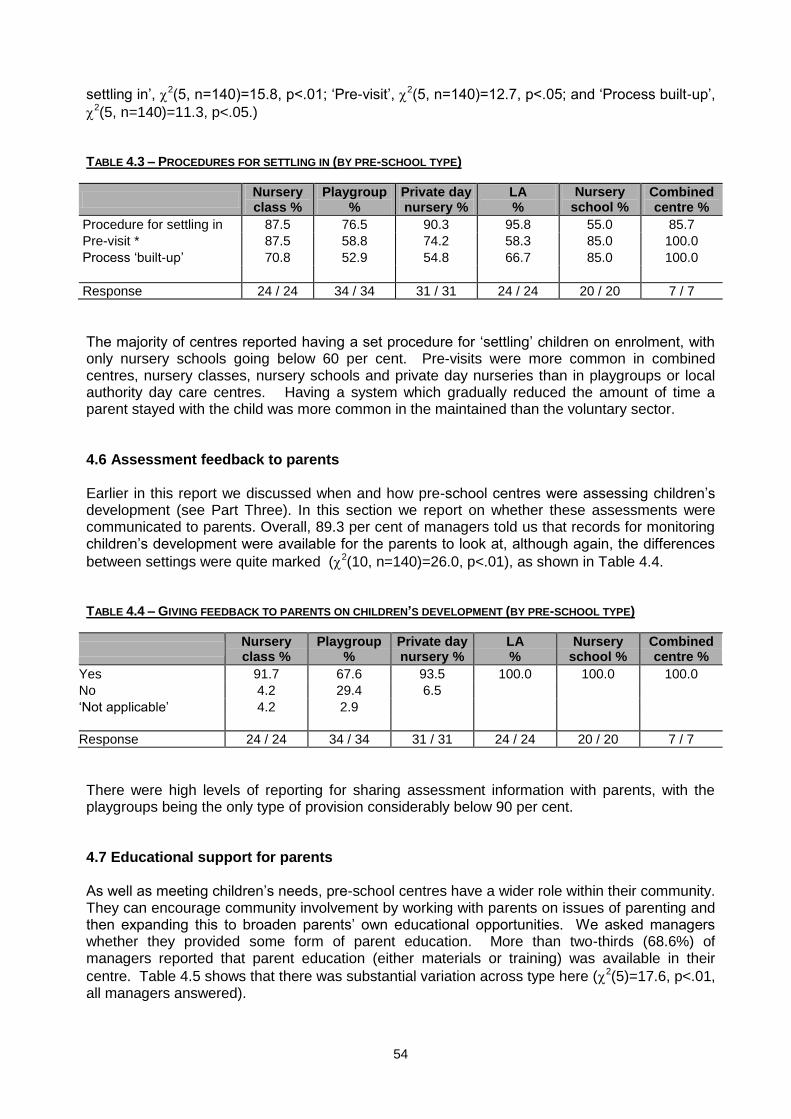
54
settling in’, 2(5, n=140)=15.8, p<.01; ‘Pre-visit’, 2(5, n=140)=12.7, p<.05; and ‘Process built-up’,
2(5, n=140)=11.3, p<.05.)
TABLE 4.3 – PROCEDURES FOR SETTLING IN (BY PRE-SCHOOL TYPE)
Nursery class %
Playgroup %
Private day nursery %
LA %
Nursery school %
%
Combined centre %
Procedure for settling in 87.5 76.5 90.3 95.8 55.0 85.7
Pre-visit * 87.5 58.8 74.2 58.3 85.0 100.0
Process ‘built-up’ 70.8 52.9 54.8 66.7 85.0 100.0
Response 24 / 24 34 / 34 31 / 31 24 / 24 20 / 20 7 / 7
The majority of centres reported having a set procedure for ‘settling’ children on enrolment, with only nursery schools going below 60 per cent. Pre-visits were more common in combined centres, nursery classes, nursery schools and private day nurseries than in playgroups or local authority day care centres. Having a system which gradually reduced the amount of time a parent stayed with the child was more common in the maintained than the voluntary sector. 4.6 Assessment feedback to parents Earlier in this report we discussed when and how pre-school centres were assessing children’s development (see Part Three). In this section we report on whether these assessments were communicated to parents. Overall, 89.3 per cent of managers told us that records for monitoring children’s development were available for the parents to look at, although again, the differences
between settings were quite marked (2(10, n=140)=26.0, p<.01), as shown in Table 4.4. TABLE 4.4 – GIVING FEEDBACK TO PARENTS ON CHILDREN’S DEVELOPMENT (BY PRE-SCHOOL TYPE)
Nursery class %
Playgroup %
Private day nursery %
LA %
Nursery school %
Combined centre %
Yes 91.7 67.6 93.5 100.0 100.0 100.0
No 4.2 29.4 6.5
‘Not applicable’ 4.2 2.9
Response 24 / 24 34 / 34 31 / 31 24 / 24 20 / 20 7 / 7
There were high levels of reporting for sharing assessment information with parents, with the playgroups being the only type of provision considerably below 90 per cent. 4.7 Educational support for parents As well as meeting children’s needs, pre-school centres have a wider role within their community. They can encourage community involvement by working with parents on issues of parenting and then expanding this to broaden parents’ own educational opportunities. We asked managers whether they provided some form of parent education. More than two-thirds (68.6%) of managers reported that parent education (either materials or training) was available in their
centre. Table 4.5 shows that there was substantial variation across type here (2(5)=17.6, p<.01, all managers answered).

55
FIGURE 4.5 – PROVISION OF EDUCATIONAL SUPPORT TO PARENTS (BY PRE-SCHOOL TYPE)
0%
20%
40%
60%
80%
100%
Nursery class Playgroup Private day
nursery
LA Nursery school Combined ctr
Perc
ent of centr
es
Overall seven areas of parental education were identified, as shown in Table 4.5. TABLE 4.5 – AREAS OF PARENTAL EDUCATION PROVIDED BY CENTRES
Top group % Bottom group %
Basic school skills 32.9 (46) Parenting education/training 20.0 (28)
Written info 25.7 (36) Regular parent groups 15.0 (21)
Health education/first aid 21.4 (30) One off meetings various 7.9 (11)
Course run by adult education 5.7 (8)
Figures in ( ) = n of centres
The most common type of parental education provided by pre-school centres was grouped under ‘basic school skills’. This category included helping parents learn about early oracy, literacy and numeracy. They might run a short course on ‘the importance of reading to children’ or ‘sharing books with young children’ or ‘using shopping trips to develop early numeracy’. Written information, which 25.7 per cent of centres provided, was a non-intensive form of parental education with centres simply sending home pamphlets, leaflets and letters on a range of childcare issues. Just over twenty per cent (21.4 %) of centres reporting holding parent meetings to discuss issues of child health, e.g. meningitis or first aid. Twenty per cent of centres reported running parenting classes, often covering the management of children’s behaviour and issues of child abuse. Fifteen per cent of centres ran regular parent groups with no specific theme. During these sessions parents could meet regularly together to discuss items of interest ranging from beauty therapies to fundraising activities. A small number of centres hosted courses in their centres which were targeted directly at their parents but which were run by the local Adult Education institution. The provision of 5 of the 7 categories of education differed across pre-school type, as shown in
Table 4.5. (‘Basic school skills’, 2(5, n=140)=38.5, p<.001; ‘Written info’, 2(5, n=140)=11.5,
p<.05; ‘Parenting education/training’, 2(5, n=140)=39.3, p<.001; ‘Regular parent groups’, 2(5,
n=140)=13.6, p<.05; ‘Course run by adult education’, 2(5, n=140)=38.6, p<.001.)
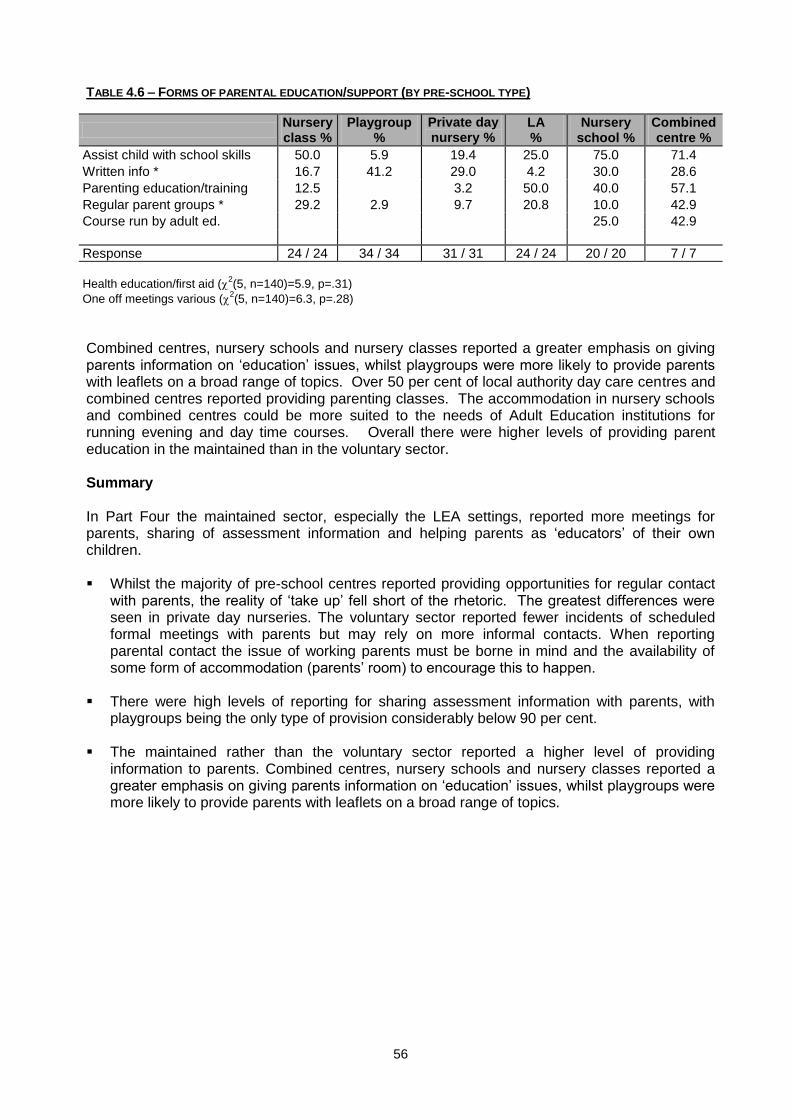
56
TABLE 4.6 – FORMS OF PARENTAL EDUCATION/SUPPORT (BY PRE-SCHOOL TYPE)
Nursery class %
Playgroup %
Private day nursery %
LA %
Nursery school %
Combined centre %
Assist child with school skills 50.0 5.9 19.4 25.0 75.0 71.4
Written info * 16.7 41.2 29.0 4.2 30.0 28.6
Parenting education/training 12.5 3.2 50.0 40.0 57.1
Regular parent groups * 29.2 2.9 9.7 20.8 10.0 42.9
Course run by adult ed. 25.0 42.9
Response 24 / 24 34 / 34 31 / 31 24 / 24 20 / 20 7 / 7
Health education/first aid (2(5, n=140)=5.9, p=.31)
One off meetings various (2(5, n=140)=6.3, p=.28)
Combined centres, nursery schools and nursery classes reported a greater emphasis on giving parents information on ‘education’ issues, whilst playgroups were more likely to provide parents with leaflets on a broad range of topics. Over 50 per cent of local authority day care centres and combined centres reported providing parenting classes. The accommodation in nursery schools and combined centres could be more suited to the needs of Adult Education institutions for running evening and day time courses. Overall there were higher levels of providing parent education in the maintained than in the voluntary sector. Summary In Part Four the maintained sector, especially the LEA settings, reported more meetings for parents, sharing of assessment information and helping parents as ‘educators’ of their own children. Whilst the majority of pre-school centres reported providing opportunities for regular contact
with parents, the reality of ‘take up’ fell short of the rhetoric. The greatest differences were seen in private day nurseries. The voluntary sector reported fewer incidents of scheduled formal meetings with parents but may rely on more informal contacts. When reporting parental contact the issue of working parents must be borne in mind and the availability of some form of accommodation (parents’ room) to encourage this to happen.
There were high levels of reporting for sharing assessment information with parents, with
playgroups being the only type of provision considerably below 90 per cent. The maintained rather than the voluntary sector reported a higher level of providing
information to parents. Combined centres, nursery schools and nursery classes reported a greater emphasis on giving parents information on ‘education’ issues, whilst playgroups were more likely to provide parents with leaflets on a broad range of topics.
57
References Harms, T., Clifford, R. and Cryer, D. (1998) Early Childhood Environment Rating Scale, Revised Edition. New York, Teachers College Press Melhuish, E. C. (1991) Research on day care for young children in the United Kingdom. In Melhuish, E.C., and Moss. P. (Eds) Day Care for Young Children: International Perspectives. London: Routledge. Melhuish, E. C., Lloyd, E., Mooney, A. and Martin, S. (1990) Type of day care at 18 months: Relations with cognitive and language development. Journal of Child Psychology & Psychiatry,
31, 861870. Owen, C. Smith. M. (2000) The Effectiveness of Early Interventions. London: Institute of Education, University of London. QCA and DfES (1999). The Early Learning Goals London QCA Sammons, P., Sylva, K., Melhuish, T., Siraj-Blatchford I. and Taggart. B. (1999) Technical Paper
2 Characteristics of the Effective Provision of Pre-School Education (EPPE) Project sample at entry to the study. London: Institute of Education, University of London. Siraj-Blatchford, I., Sylva, K., Melhuish, T., Sammons, P. and Taggart, B. (1999). Technical
Paper 3 Contextualising EPPE: Interviews with Local Authority co-ordinators and centre managers. London: Institute of Education, University of London. Siraj-Blatchford, I. and Clarke, P. (2000) Supporting Identity, Diversity and Language. Buckingham: Open University Press Slavin, R.E. (1996) Education for All. Lisse: Swets & Zeitlinger. Sylva, K., Siraj-Blatchford, I., Melhuish, T., Sammons, P. and Taggart, B. (1999) Technical Paper
1 An Introduction to the Effective Provision of Pre-school Education (EPPE) Project. London: Institute of Education, University of London. Sylva, K., Siraj-Blatchford, I., Melhuish, T., Sammons, P. and Taggart, B. (1999). Technical
Paper 6 Characteristics of the Centres in the EPPE Sample: Observational Profiles. London: Institute of Education, University of London. Sylva, K., Siraj-Blatchford, I., Melhuish, T., Sammons, P. and Taggart, B. (1999). Technical
Paper 6A Characteristics of Pre-School Environments London: Institute of Education, University of London. Sylva, K., Siraj-Blatchford, I., Taggart, B. and Colman, P. (In progress) The Early Childhood Environment Rating Scale – Extension. London: Institute of Education, University of London. Wolfendale S. (Ed.) (1997) Meeting Special Needs in the Early Years: Directions in Policy and Practice. London: David Fulton.

58
Appendix A – Results of chi-square analysis of ‘Training content and delivery’ Tables A.1 and A.2 below summarise chi-square analysis of staff training content and delivery by pre-school type. TABLE A.1 – CONTENT AREAS OF TRAINING
First aid * x2(5, n=136)=11.3, p<.05
Child abuse/protection * x2(5, n=136)=12.6, p<.05
Other x2(5, n=136)=22.4, p<.001
Health and safety x2(5, n=136)=7.1, p=.21 Special needs training x2(5, n=136)=6.8, p=.24 Other curriculum areas x2(5, n=136)=7.9, p=.16 Issues in early years ed x2(5, n=136)=4.1, p=.53 Use of equipment (lift and handle) x2(5, n=136)=6.3, p=.28 Reading course x2(5, n=136)=10.2, p=.07 Behaviour management x2(5, n=136)=5.0, p=.42 Food hygiene x2(5, n=136)=9.8, p=.08 Numeracy course x2(5, n=136)=6.1, p=.29 Management training x2(5, n=136)=5.6, p=.35 Play (in and outdoor) x2(5, n=136)=5.1, p=.40
TABLE A.1 – DELIVERY OF TRAINING
Specific inset days x2(5, n=136)=43.2, p<.001
Provided by LEA/LA x2(5, n=136)=19.6, p<.01
Non specific internal x2(5, n=136)=34.0, p<.001
On the job training x2(5, n=136)=19.1, p<.01
Non specific x2(5, n=136)=34.0, p<.001
Appraisal system x2(5, n=136)=17.3, p<.01
Organised by PLA x2(5, n=136)=21.4, p<.01
Certified qualification (e.g. NVQ) x2(5, n=136)=8.2, p=.15 Provided by Social Services x2(5, n=136)=4.9, p=.42 Visits to other centres x2(5, n=136)=7.9, p=.16
* denotes p<.05, (otherwise significance is at p<.01)
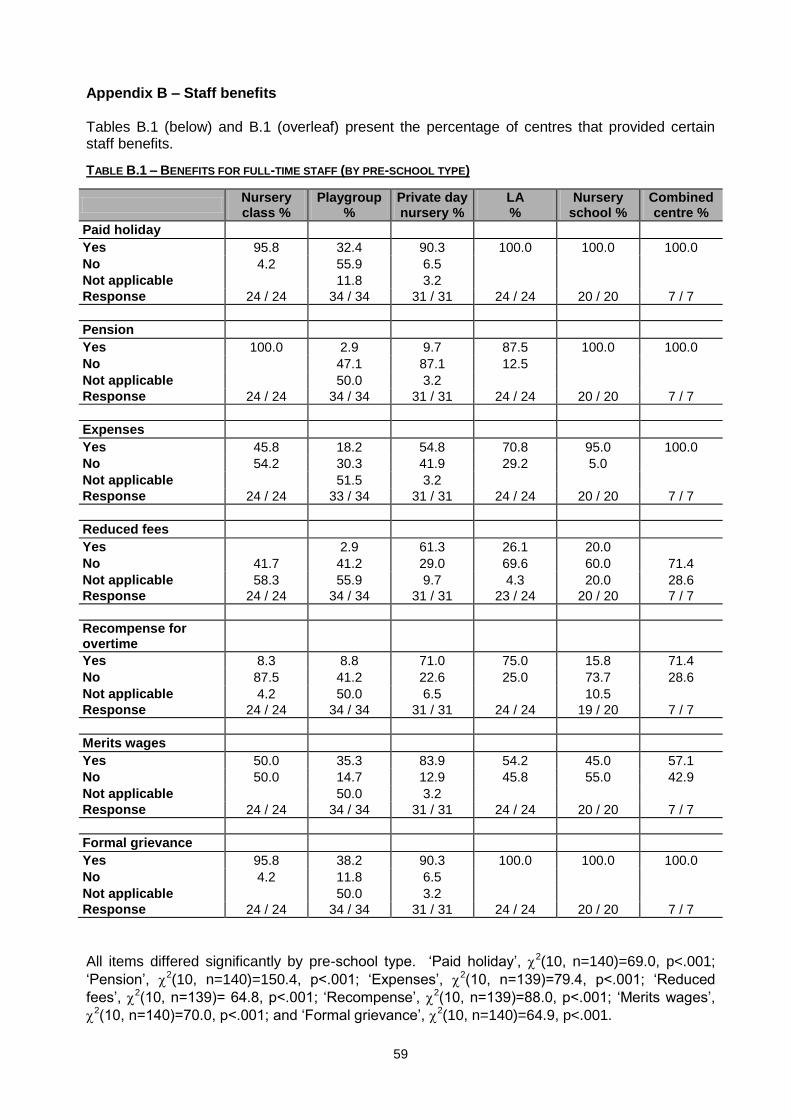
59
Appendix B – Staff benefits Tables B.1 (below) and B.1 (overleaf) present the percentage of centres that provided certain staff benefits.
TABLE B.1 – BENEFITS FOR FULL-TIME STAFF (BY PRE-SCHOOL TYPE)
Nursery class %
Playgroup %
Private day nursery %
LA %
Nursery school %
Combined centre %
Paid holiday
Yes 95.8 32.4 90.3 100.0 100.0 100.0
No 4.2 55.9 6.5
Not applicable 11.8 3.2
Response 24 / 24 34 / 34 31 / 31 24 / 24 20 / 20 7 / 7
Pension
Yes 100.0 2.9 9.7 87.5 100.0 100.0
No 47.1 87.1 12.5
Not applicable 50.0 3.2
Response 24 / 24 34 / 34 31 / 31 24 / 24 20 / 20 7 / 7
Expenses
Yes 45.8 18.2 54.8 70.8 95.0 100.0
No 54.2 30.3 41.9 29.2 5.0
Not applicable 51.5 3.2
Response 24 / 24 33 / 34 31 / 31 24 / 24 20 / 20 7 / 7
Reduced fees
Yes 2.9 61.3 26.1 20.0
No 41.7 41.2 29.0 69.6 60.0 71.4
Not applicable 58.3 55.9 9.7 4.3 20.0 28.6
Response 24 / 24 34 / 34 31 / 31 23 / 24 20 / 20 7 / 7
Recompense for overtime
Yes 8.3 8.8 71.0 75.0 15.8 71.4
No 87.5 41.2 22.6 25.0 73.7 28.6
Not applicable 4.2 50.0 6.5 10.5
Response 24 / 24 34 / 34 31 / 31 24 / 24 19 / 20 7 / 7
Merits wages
Yes 50.0 35.3 83.9 54.2 45.0 57.1
No 50.0 14.7 12.9 45.8 55.0 42.9
Not applicable 50.0 3.2
Response 24 / 24 34 / 34 31 / 31 24 / 24 20 / 20 7 / 7
Formal grievance
Yes 95.8 38.2 90.3 100.0 100.0 100.0
No 4.2 11.8 6.5
Not applicable 50.0 3.2
Response 24 / 24 34 / 34 31 / 31 24 / 24 20 / 20 7 / 7
All items differed significantly by pre-school type. ‘Paid holiday’, 2(10, n=140)=69.0, p<.001;
‘Pension’, 2(10, n=140)=150.4, p<.001; ‘Expenses’, 2(10, n=139)=79.4, p<.001; ‘Reduced
fees’, 2(10, n=139)= 64.8, p<.001; ‘Recompense’, 2(10, n=139)=88.0, p<.001; ‘Merits wages’,
2(10, n=140)=70.0, p<.001; and ‘Formal grievance’, 2(10, n=140)=64.9, p<.001.
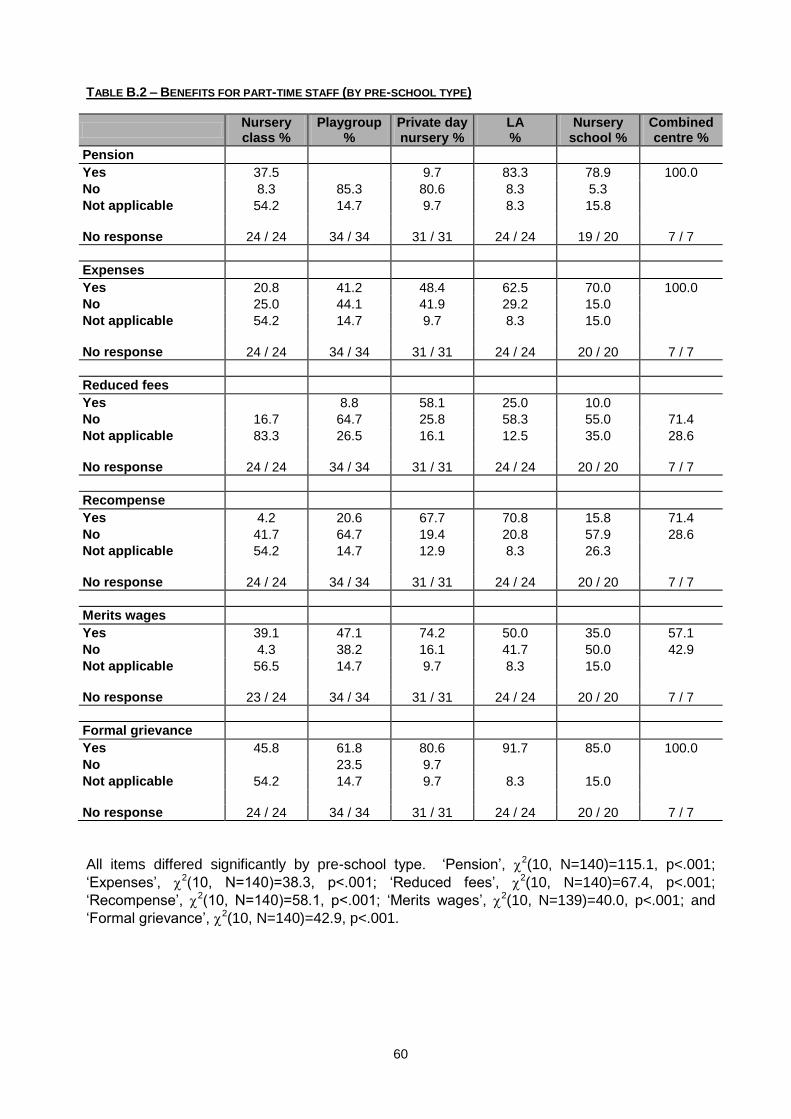
60
TABLE B.2 – BENEFITS FOR PART-TIME STAFF (BY PRE-SCHOOL TYPE)
Nursery class %
Playgroup %
Private day nursery %
LA %
Nursery school %
Combined centre %
Pension
Yes 37.5 9.7 83.3 78.9 100.0
No 8.3 85.3 80.6 8.3 5.3
Not applicable 54.2 14.7 9.7 8.3 15.8
No response 24 / 24 34 / 34 31 / 31 24 / 24 19 / 20 7 / 7
Expenses
Yes 20.8 41.2 48.4 62.5 70.0 100.0
No 25.0 44.1 41.9 29.2 15.0
Not applicable 54.2 14.7 9.7 8.3 15.0
No response 24 / 24 34 / 34 31 / 31 24 / 24 20 / 20 7 / 7
Reduced fees
Yes 8.8 58.1 25.0 10.0
No 16.7 64.7 25.8 58.3 55.0 71.4
Not applicable 83.3 26.5 16.1 12.5 35.0 28.6
No response 24 / 24 34 / 34 31 / 31 24 / 24 20 / 20 7 / 7
Recompense
Yes 4.2 20.6 67.7 70.8 15.8 71.4
No 41.7 64.7 19.4 20.8 57.9 28.6
Not applicable 54.2 14.7 12.9 8.3 26.3
No response 24 / 24 34 / 34 31 / 31 24 / 24 20 / 20 7 / 7
Merits wages
Yes 39.1 47.1 74.2 50.0 35.0 57.1
No 4.3 38.2 16.1 41.7 50.0 42.9
Not applicable 56.5 14.7 9.7 8.3 15.0
No response 23 / 24 34 / 34 31 / 31 24 / 24 20 / 20 7 / 7
Formal grievance
Yes 45.8 61.8 80.6 91.7 85.0 100.0
No 23.5 9.7
Not applicable 54.2 14.7 9.7 8.3 15.0
No response 24 / 24 34 / 34 31 / 31 24 / 24 20 / 20 7 / 7
All items differed significantly by pre-school type. ‘Pension’, 2(10, N=140)=115.1, p<.001;
‘Expenses’, 2(10, N=140)=38.3, p<.001; ‘Reduced fees’,
2(10, N=140)=67.4, p<.001;
‘Recompense’, 2(10, N=140)=58.1, p<.001; ‘Merits wages’, 2(10, N=139)=40.0, p<.001; and
‘Formal grievance’, 2(10, N=140)=42.9, p<.001.

61
Appendix C – Ethnicity by area Looking particularly at the two most diverse areas, Inner London and the West Midlands, White UK, White European and Chinese children are sufficiently represented (or over represented) by staff, and also Black Caribbean children in Inner London and White Non-European children in the West Midlands. (Table C.1.) TABLE C.1 – ETHNICITY OF STAFF AND CHILDREN BY AREA
East
Anglia %
Shire County
%
Inner London
%
N.East %
West Midlands
%
White UK (staff) 98.6 92.7 63.6 94.6 74.2
White UK (children) 96.8 88.8 45.3 93.3 55.6
White European (staff) 0.3 4.2 9.1 0.9 4.8
White European (children) 1.3 3.6 8.5 2.6 4.2
Black Caribbean (staff) 9.7 1.7
Black Caribbean (children) 5.4 0.2 14.0
Black African (staff) 0.3 3.3 0.2
Black African (children) 0.3 8.7 0.6
Black other (staff) 1.0 0.2
Black other (children) 3.0 0.4
Indian (staff) 0.2 1.8 0.2 4.7
Indian (children) 0.2 1.2 3.0 5.5
Pakistani (staff) 2.5 0.5 1.4 4.9
Pakistani (children) 0.2 1.9 0.6 2.6 8.7
Bangladeshi (staff) 1.0
Bangladeshi (children) 0.7 3.0 0.2 0.4
Chinese (staff) 0.7 0.5
Chinese (children) 0.2 0.2 0.4 0.2
Other minorities (staff) 0.2 5.7 0.5
Other minorities (children) 0.8 7.3 1.5
Mixed race (staff) 0.3 3.9 2.5 1.7
Mixed race (children) 1.4 3.2 15.3 1.2 9.3
White non-European (staff)
White non-European (children) 0.4

62
Appendix D – Coding scheme for the 5-point childcare scale TABLE D.1 – CODING SCHEME FOR THE 5-POINT CHILDCARE SCALE
Childcare vocational courses Childcare degrees
GNVQ Foundation 2 BA 4
GNVQ Intermediate 3 BA Hons + NNEB 5
GNVQ Advanced 3 BSc 4
NVQ Level 1 2 BSocSc 4
NVQ Level 2 2 Other degree 4
NVQ Level 3 3 MA 4
NVQ Level 4 4 M Ed 4
NVQ Level 5 5 D Phil 4
BTEC Certificate 2 PhD 4
BTEC Diploma 3 Other higher degree 4
National Certificate 2
National Diploma 3 Miscellaneous
HN Certificate 2 Health and safety certificate 0
HN Diploma 3 Food handling certificate 0
City and Guilds I 2 First aid 0
City and Guilds II 2 British Sign Language 0
City and Guilds III 3 NESW (Social Work) 3
NNEB 3 Social Work degree 4
CECS 2 State Registered Nurse 3
PPA Foundation Level 2 State Registered Nurse (BSc) 4
PA Level II 2 State Registered Children's Nurse 4
PA Advanced 3 Dip Social Care 3
DPP Level III 3 Classroom assistant 3
NNEB with Portage 3 Registered Child Minder 2
ADCE 4 Registered Child Minder 3
DCC 3
Montessori 3 Courses uncertified
Montessori (degree length) 4 Modular Course in CC 2
Education / Teaching
Dip. Ed 3
Cert. Ed 5 No qualifications 0
B. Ed 5
PGCE 5

63
Appendix E – Results of Kruskall Wallis analysis of the 31 quality items After being split by whether significant by pre-school type or not, items in the Table below are ranked in order of mean rating by centre managers, with higher scored items first. TABLE E.1 – RESULT OF KRUSKALL WALLIS ANALYSIS OF MANAGER-RATED IMPORTANCE AND PERFORMANCE OF
THE 31 QUALITY ITEMS
Importance Performance
Safety * H(5)=11.6, p<.05 Licensed child care H(5)=16.1, p<.01
Learning opportunities * H(5)=11.9, p<.05 Safety * H(5)=13.0, p<.05
Settling in process * H(5)=11.3, p<.05 Health H(5)=23.8, p<.01
Licensed child care H(5)=16.7, p<.01 Care available H(5)=23.6, p<.01
Day to day activities H(5)=21.1, p<.01 Regular child devt. eval. H(5)=22.2, p<.01
Health H(5)=18.5, p<.01 No. of children in a group* H(5)=11.6, p<.05
Regular child devt. evaluation H(5)=23.5, p<.01 Pupilteacher ratio H(5)=25.7, p<.01
Staff training H(5)=20.1, p<.01 Cleanliness H(5)=21.0, p<.01
Care available H(5)=21.1, p<.01 Nutrition H(5)=31.4, p<.01
Staff experience * H(5)=13.5, p<.05 Sharing parents values H(5)=20.0, p<.01
Cultural differences H(5)=18.1, p<.01 Settling in process H(5)=5.0, p=.42
Cleanliness H(5)=23.1, p<.01 Staff warmth H(5)=5.0, p=.42
Culture * H(5)=11.7, p<.05 Staff experience H(5)=5.4, p=.36
Nutrition H(5)=27.4, p<.01 Children often see staff H(5)=4.7, p=.46
Sharing parents values H(5)=17.0, p<.01 Children often see friends H(5)=8.2, p=.15
Religion H(5)=21.6, p<.01 Get along together H(5)=2.2, p=.83
Prefer home to school H(5)=21.2, p<.01 Learning opportunities H(5)=6.4, p=.27
Staff warmth H(5)=2.3, p=.80 Comm. with parents H(5)=10.7, p=.06
Attention H(5)=9.3, p=.10 Attention H(5)=9.5, p=.09
Communication with parents H(5)=9.7, p=.08 Day to day activities H(5)=1.3, p=.94
Get along together H(5)=4.7, p=.45 Support for parents H(5)=2.3, p=.80
Pupilteacher ratio H(5)=9.4, p=.09 Discipline H(5)=3.3, p=.66
Children see staff regularly H(5)=1.0, p=.97 Preparation for school H(5)=4.9, p=.43
Support for parents H(5)=4.4, p=.49 Equipment H(5)=1.1, p=.96
Discipline H(5)=7.3, p=.20 Parents drop-in H(5)=6.6, p=.25
No. of children in a group H(5)=9.6, p=.09 Staff training H(5)=4.3, p=.51
Equipment H(5)=3.9, p=.57 Close staffparent relation H(5)=5.6, p=.35
Parents drop-in H(5)=5.9, p=.32 Cultural differences H(5)=5.0, p=.42
Children see friends regularly H(5)=8.0, p=.16 Culture H(5)=9.1, p=.10
Close staffparents relationships H(5)=7.1, p=.21 Prefer home to school H(5)=9.0, p=.11
Preparation for school H(5)=6.8, p=.24 Religion H(5)=10.5, p=.06

64
Appendix F – Results of chi-square analysis of ‘Materials used in planning’ After being split by whether significant by pre-school type or not, items in the Table below are ranked in order of percentage of centre managers that used them, with higher incidence items first. TABLE F.1 – RESULTS OF CHI-SQUARE ANALYSIS OF MATERIALS USED IN PLANNING
Desirable outcomes * 2(5, n=140)=12.6, p<.05
Other materials 2(5, n=140)=17.3, p<.01
Development plan 2(5, n=140)=12.2, p<.05
Social services guidelines ** 2(5, n=140)=10.8, p<.06
Montessori materials ** 2(5, n=140)=10.8, p<.06
Children – interests * 2(5, n=140)=12.2, p<.05
Magazines / journals 2(5, n=140)=4.2, p=.52
Own materials unspecified 2(5, n=140)=10.1, p=.07
Local authority schemes 2(5, n=140)=3.3, p=.66
Published schemes 2(5, n=140)=9.4, p=.09
OFSTED materials 2(5, n=140)=8.1, p=.15
National Curriculum 2(5, n=140)=4.0, p=.55
Staff / colleagues 2(5, n=140)=8.1, p=.15
Library resources 2(5, n=140)=2.2, p=.82
PLA materials 2(5, n=140)=9.4, p=.09
DfES 2(5, n=140)=6.5, p=.26
INSET/Training courses 2(5, n=140)=4.9, p=.42
Local forums colleges 2(5, n=140)=4.5, p=.48
Specific festivals / religion 2(5, n=140)=3.0, p=.70
Parents 2(5, n=140)=7.1, p=.21
Nursery project materials 2(5, n=140)=7.1, p=.21
Childcare act 2(5, n=140)=4.9, p=.43
** Denotes p<.06, * denotes p<.05, (otherwise significance is at p<.01)
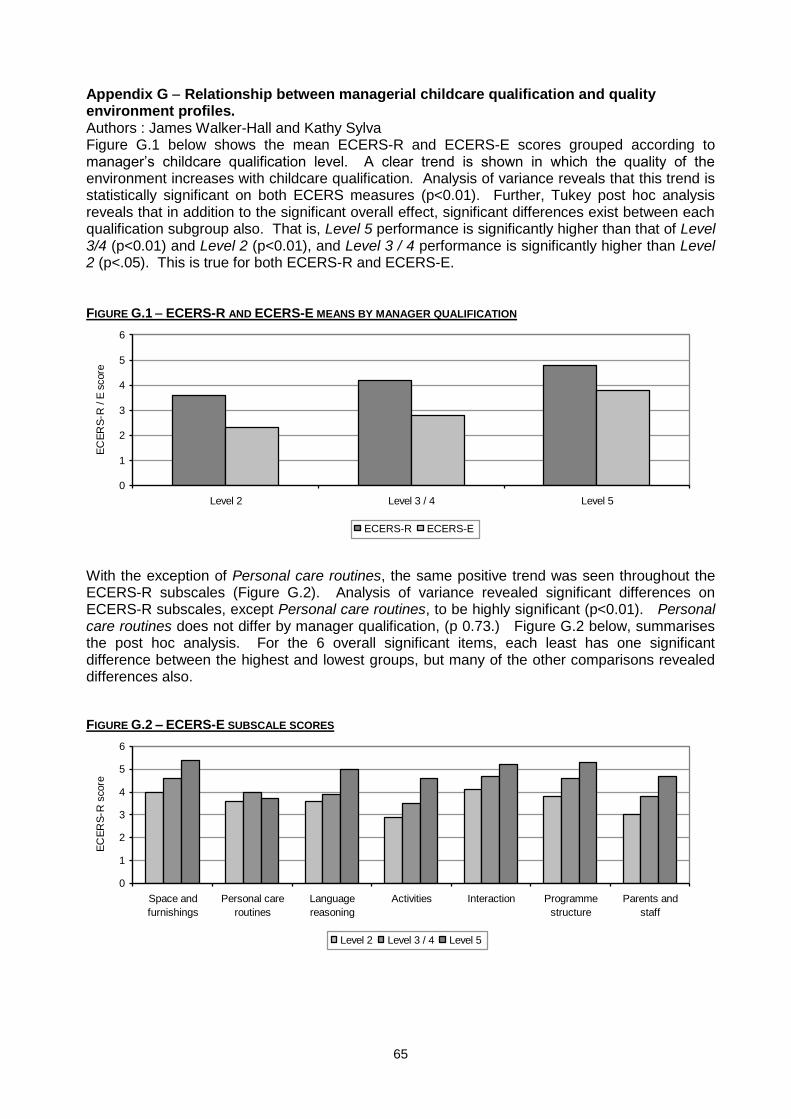
65
Appendix G Relationship between managerial childcare qualification and quality environment profiles. Authors : James Walker-Hall and Kathy Sylva Figure G.1 below shows the mean ECERS-R and ECERS-E scores grouped according to manager’s childcare qualification level. A clear trend is shown in which the quality of the environment increases with childcare qualification. Analysis of variance reveals that this trend is statistically significant on both ECERS measures (p<0.01). Further, Tukey post hoc analysis reveals that in addition to the significant overall effect, significant differences exist between each qualification subgroup also. That is, Level 5 performance is significantly higher than that of Level 3/4 (p<0.01) and Level 2 (p<0.01), and Level 3 / 4 performance is significantly higher than Level 2 (p<.05). This is true for both ECERS-R and ECERS-E. FIGURE G.1 ECERS-R AND ECERS-E MEANS BY MANAGER QUALIFICATION
0
1
2
3
4
5
6
Level 2 Level 3 / 4 Level 5
EC
ER
S-R
/ E
score
ECERS-R ECERS-E
With the exception of Personal care routines, the same positive trend was seen throughout the ECERS-R subscales (Figure G.2). Analysis of variance revealed significant differences on ECERS-R subscales, except Personal care routines, to be highly significant (p<0.01). Personal care routines does not differ by manager qualification, (p 0.73.) Figure G.2 below, summarises the post hoc analysis. For the 6 overall significant items, each least has one significant difference between the highest and lowest groups, but many of the other comparisons revealed differences also. FIGURE G.2 – ECERS-E SUBSCALE SCORES
0
1
2
3
4
5
6
Space and
furnishings
Personal care
routines
Language
reasoning
Activities Interaction Programme
structure
Parents and
staff
EC
ER
S-R
score
Level 2 Level 3 / 4 Level 5

66
TABLE G.1 – SUMMARY OF POST HOC TESTS OF ECERS-R SUBSCALES
Level 5 vs Level 2 Level 5 vs Level 3 / 4 Level 3 / 4 vs Level 2
Space and furnishings p < .01 p < .01 p < .05
Language reasoning p < .01 p < .01 p < .01
Activities p < .01 p < .01 p < .05
Interaction p < .01
Programme structure p < .01 p < .05
Parents and staff p < .01 p < .01 p < .01
The factor analysis reported in Technical Paper 6 (Sylva et al. 1999) found two major factors in the ECERS-R data from the EPPE sample; these were ‘Activities and facilities’ and ‘Communication and supervision’. The latter is very similar to ‘teaching style’ while the former is more clearly related to materials, facilities and resources. Both differed significantly overall by ANOVA (p<.01). Table G.2 presents the results of post hoc tests – all but one were significant.
FIGURE G.3 ECERSR FACTORS BY MANAGER QUALIFICATIONS
0
1
2
3
4
5
6
'Activities and facilities' factor 'Communication and supervision' factor
EC
ER
S-E
score
Level 2 Level 3 / 4 Level 5
TABLE G.2 – SUMMARY OF POST HOC TESTS OF THE 2 MAJOR ECERS-R SUB FACTORS
Level 5 vs Level 2 Level 5 vs Level 3 / 4 Level 3 / 4 vs Level 2
Activities and facilities p < .01 p < .01 p < .01
Communication and supervision
p < .01 p < .01
ECERS-E subscales As shown in Figure G.4, a similar pattern of results was observed in the ECERS-E subscales. Each scale again differed significantly by manager qualification. As shown in Table 6, all post hoc comparisons between Level 5 and Level 2 managers were significant, as were all comparisons between Level 5 and Level 3 /4.
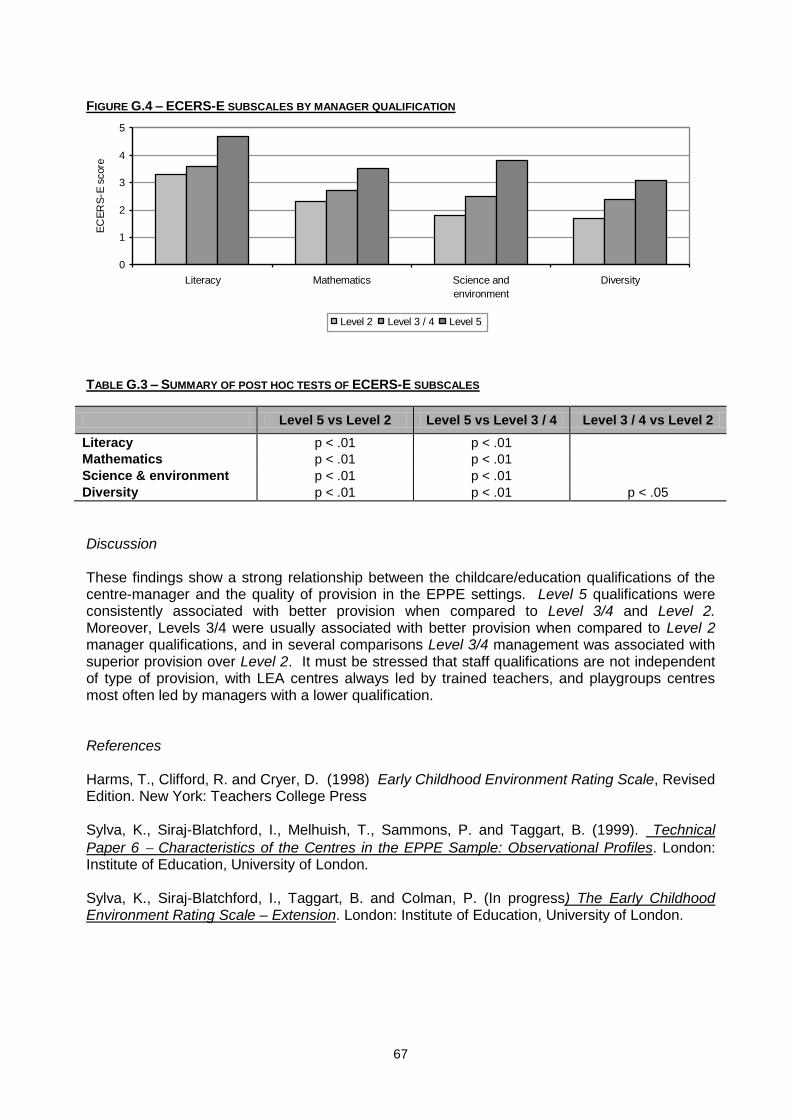
67
FIGURE G.4 – ECERS-E SUBSCALES BY MANAGER QUALIFICATION
0
1
2
3
4
5
Literacy Mathematics Science and
environment
Diversity
EC
ER
S-E
score
Level 2 Level 3 / 4 Level 5
TABLE G.3 – SUMMARY OF POST HOC TESTS OF ECERS-E SUBSCALES
Level 5 vs Level 2 Level 5 vs Level 3 / 4 Level 3 / 4 vs Level 2
Literacy p < .01 p < .01
Mathematics p < .01 p < .01
Science & environment p < .01 p < .01
Diversity p < .01 p < .01 p < .05
Discussion These findings show a strong relationship between the childcare/education qualifications of the centre-manager and the quality of provision in the EPPE settings. Level 5 qualifications were consistently associated with better provision when compared to Level 3/4 and Level 2. Moreover, Levels 3/4 were usually associated with better provision when compared to Level 2 manager qualifications, and in several comparisons Level 3/4 management was associated with superior provision over Level 2. It must be stressed that staff qualifications are not independent of type of provision, with LEA centres always led by trained teachers, and playgroups centres most often led by managers with a lower qualification. References Harms, T., Clifford, R. and Cryer, D. (1998) Early Childhood Environment Rating Scale, Revised Edition. New York: Teachers College Press Sylva, K., Siraj-Blatchford, I., Melhuish, T., Sammons, P. and Taggart, B. (1999). Technical
Paper 6 Characteristics of the Centres in the EPPE Sample: Observational Profiles. London: Institute of Education, University of London. Sylva, K., Siraj-Blatchford, I., Taggart, B. and Colman, P. (In progress) The Early Childhood Environment Rating Scale – Extension. London: Institute of Education, University of London.

68
Appendix H Manager Interview schedule Section A: General Centre Information A1. Name of Centre: A2. Date when current centre started to operate A3. Date when current manager came to the centre (in any capacity) A4. Has the centre operated continuously since opening (excluding holiday periods?) A5. Date when you began work as the manager of this centre A6. a. Daily hours of centre b. Days of week open c. Scheduled times centre is closed A7. What are the major objectives of your centre in addition to caring for children Indicate 1 = very important 2 = quite important 3 = not very important a. To help children develop language and problem solving skills b. To help children build strong friendships and learn to share c. To help children master concepts needed for reading and arithmetic d. To help children develop physical co-ordination e. To help children develop a positive self-concept f. To help children value those of different religions, cultures and abilities g. To help children learn manners and self-discipline h. To help children learn other culturally important skills (describe) Of the objectives above rated very important, which is 1 = Most important 2 = Second most important 3 = Third most important -------------------------------------------------------------------------------------------------------------------------------- Section B: Centres and parents B1.a) Are parents allowed to come in to visit? (outside the ‘dropping off/picking up’ period’ b. Do parents visit the centre? c. Do parents and staff have a chance to talk with each other ? d. Can parents approach staff for advice/information ? e. Is there a room/space for parents to use at centre? B2. When children start at the centre, do you follow a set procedure for settling-in children? (pre-visits, parent expected to stay, how long, how flexible) B3. What kinds of written materials do you or your staff provide to parents? B4. Do you provide any parent education (either materials or training)? Please give examples: B5. Are there regularly scheduled parent/staff meetings? If yes, how often are they scheduled? B6. Does your centre involve parents in any of the following ways? a. Some time spent in a children’s room each week (in addition to drop-off and pick-up) b. Some time spent in the centre but not in a children’s room each week (in addition to drop-off and pick-up) c. Assistance with fund raising d. Help with maintaining the physical setting e. Attendance at parent meetings on a group or individual basis f. Involvement in policy-setting g. Other involvement ------------------------------------------------------------------------------------------------------------------------------- Section C: Staff Turnover The questions in this section ask about your turnover rates and causes of staff turnover. These questions only apply to staff who work with children. C1. How many of the centre’s permanent staff have left in the last 12 months? C2. Of those who have left within the last 12 months, how many fall into each of the following categories.
a. Fired or dismissed for inadequate performance b. Laid off/redundant because of low enrolment c. Laid off/redundant for reasons other than low enrolment d. Left voluntarily (employee chose to leave) e. Don't know f. Other: Specify C3. Are any of the following problems in your centre? a. Retaining staff a. Finding substitutes

69
c. Filling staff vacancies
d. Finding trained staff e. Securing training resources Rate - This is not a problem - This is a minor problem - This is a problem but not a major - This is a major problem
--------------------------------------------------------------------------------------------------------------------------------- Section D: - Working Conditions The questions in this section ask about your working conditions and benefits. D1. Which of the following do you provide for your paid full-time and paid part-time staff? a. Paid preparation/planning time b. Payment for attendance at staff meetings c. Paid release time for training and workshops d. Written job descriptions e. Formal grievance procedure f. Written contract g. Periodic merit increases in wages h. Recompense (either financial or time off) for overtime i. Reduced fee or free child care j. Expenses to cover workshops, conferences, etc. k. Retirement/pension plan l. Regular staff appraisal/staff development sessions D2. Do you provide paid holidays (when the centre is closed) to full-time employees?
Section E: Costs and Budget The questions in this section ask about fees, costs, and how you divide up your budget. E1. We'd like to get some idea of the total annual cost to run your centre (amount budgeted and % of budget) for :- . a) Personnel costs including salaries, payroll taxes , and benefits for staff who work with children. b) Personnel costs including salaries, payroll taxes and benefits for staff who do not work with children. c) Rent & Bills
d) Equipment costs E2. How many of the children in your centre have fees paid fully by their parents? E3. What is the average fee, for 3-5 year old children, for a half-day session? (circle) 1 2 3 4 5 6 7
<£5 £6-£10 £11-£20 £21-£30 £31-£40 £41-£50 £50+ Please state exact amount £____________ --------------------------------------------------------------------------------------------------------------------------------- Section F: Clients F1. How many children does your centre serve in each of the following age groups? Part time and full time a. under 1 year b. 1 year - under 2 years c.2 years - under 3 years / d. 3 years - under 4 years e. 4 years - under 5 years F2. Subsidised Child Care. Some families get full or partial assistance with their child care expenses. Roughly what percentage of children in your nursery have subsidised childcare? Include, regardless of source of subsidy. (overall percentages are OK) a. Full subsidy b. Partial subsidy c. No subsidy d. Don't know
F3. Do you currently have any children with special needs (with or without SEN statement) enrolled in your programme? If no, do you have any plans to admit children with special needs?
F4. Do you have a system for identifying children with special needs? Please give details: F5. How do or would you meet the needs of children with special needs in your programme?
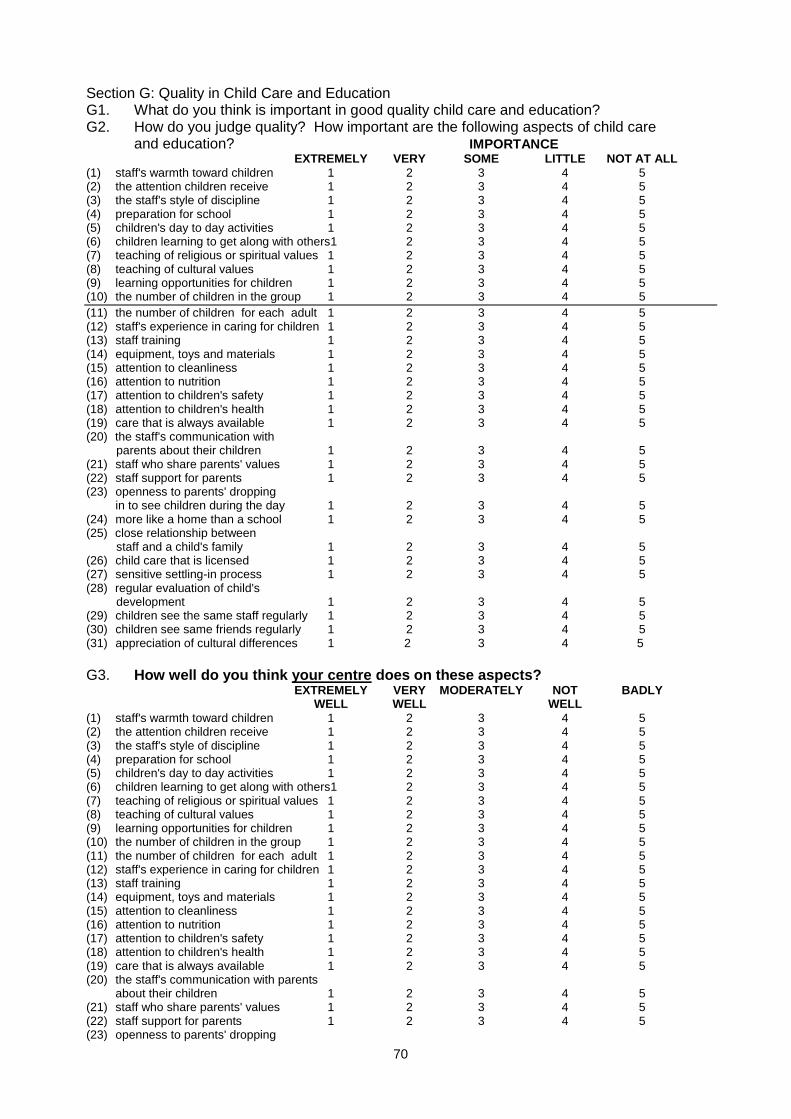
70
Section G: Quality in Child Care and Education G1. What do you think is important in good quality child care and education? G2. How do you judge quality? How important are the following aspects of child care and education? IMPORTANCE EXTREMELY VERY SOME LITTLE NOT AT ALL
(1) staff's warmth toward children 1 2 3 4 5 (2) the attention children receive 1 2 3 4 5 (3) the staff's style of discipline 1 2 3 4 5 (4) preparation for school 1 2 3 4 5 (5) children's day to day activities 1 2 3 4 5 (6) children learning to get along with others1 2 3 4 5 (7) teaching of religious or spiritual values 1 2 3 4 5 (8) teaching of cultural values 1 2 3 4 5 (9) learning opportunities for children 1 2 3 4 5 (10) the number of children in the group 1 2 3 4 5
(11) the number of children for each adult 1 2 3 4 5 (12) staff's experience in caring for children 1 2 3 4 5 (13) staff training 1 2 3 4 5 (14) equipment, toys and materials 1 2 3 4 5 (15) attention to cleanliness 1 2 3 4 5 (16) attention to nutrition 1 2 3 4 5 (17) attention to children's safety 1 2 3 4 5 (18) attention to children's health 1 2 3 4 5 (19) care that is always available 1 2 3 4 5 (20) the staff's communication with parents about their children 1 2 3 4 5 (21) staff who share parents' values 1 2 3 4 5 (22) staff support for parents 1 2 3 4 5 (23) openness to parents' dropping in to see children during the day 1 2 3 4 5 (24) more like a home than a school 1 2 3 4 5 (25) close relationship between staff and a child's family 1 2 3 4 5 (26) child care that is licensed 1 2 3 4 5 (27) sensitive settling-in process 1 2 3 4 5 (28) regular evaluation of child's development 1 2 3 4 5 (29) children see the same staff regularly 1 2 3 4 5 (30) children see same friends regularly 1 2 3 4 5 (31) appreciation of cultural differences 1 2 3 4 5
G3. How well do you think your centre does on these aspects? EXTREMELY VERY MODERATELY NOT BADLY WELL WELL WELL
(1) staff's warmth toward children 1 2 3 4 5 (2) the attention children receive 1 2 3 4 5 (3) the staff's style of discipline 1 2 3 4 5 (4) preparation for school 1 2 3 4 5 (5) children's day to day activities 1 2 3 4 5 (6) children learning to get along with others1 2 3 4 5 (7) teaching of religious or spiritual values 1 2 3 4 5 (8) teaching of cultural values 1 2 3 4 5 (9) learning opportunities for children 1 2 3 4 5 (10) the number of children in the group 1 2 3 4 5 (11) the number of children for each adult 1 2 3 4 5 (12) staff's experience in caring for children 1 2 3 4 5 (13) staff training 1 2 3 4 5 (14) equipment, toys and materials 1 2 3 4 5 (15) attention to cleanliness 1 2 3 4 5 (16) attention to nutrition 1 2 3 4 5 (17) attention to children's safety 1 2 3 4 5 (18) attention to children's health 1 2 3 4 5 (19) care that is always available 1 2 3 4 5 (20) the staff's communication with parents about their children 1 2 3 4 5 (21) staff who share parents' values 1 2 3 4 5 (22) staff support for parents 1 2 3 4 5 (23) openness to parents' dropping

71
in to see children during the day 1 2 3 4 5 (24) more like a home than a school 1 2 3 4 5 (25) close relationship between staff and a child's family 1 2 3 4 5 (26) child care that is licensed 1 2 3 4 5 (27) sensitive settling-in process 1 2 3 4 5 (28) regular evaluation of child's development 1 2 3 4 5 (29) children see the same staff regularly 1 2 3 4 5 (30) children see same friends regularly 1 2 3 4 5 (31) appreciation of cultural differences 1 2 3 4 5
Section H: Meeting staff needs: H1. Are the following available in your centre? a. staff lounge b. separate adult toilet c. a place to store staff belongings outside the classroom d. a separate room available for staff meetings e. books or other materials available for staff training H2. Is there any in-service training for staff? If yes, what kinds of training do you provide? H3. Do you have regular formal meetings with your staff? How often? H4. Do you have formal staff discussions regularly about individual children? How often? H5. Do you have formal staff discussions about child care and education practice? How often? H6.How many hours a week of scheduled time with children do you have? Does this include? a) Caring for children when staff absent b) Involvement in time tabled curriculum activities c) Involvement in daily routines -------------------------------------------------------------------------------------------------------------------------------- Section J: Planning and Record Keeping J1. Is there a daily timetable? J2. Does your staff have written curriculum plans? Can you show a copy to the interviewer? J3. Who does the planning for each of the rooms involving 3-5 year olds in your centre? J4. What guidelines and other materials are used in preparing learning activities? J5. Do staff conduct regular assessments of the children ? a. If yes, please list the aspects of development which are included: b. If yes, what kind of training do staff have in assessments? c. If yes, are these assessments used in planning activities for children? J6. Is an entry assessment performed on the children? If yes, how often are subsequent assessments done? J7. Are records for monitoring children's development available for parents to look at? -------------------------------------------------------------------------------------------------------------------------------- Section K: Staff Characteristics K1. What job titles do you use in your centre and what are their responsibilities? K2. List your staff (include cook, cleaner, visiting support workers etc.) Age / Highest childcare qualification / Highest qualification / Job / Hours/week / Time in centre Salary Categories A= 0 - £3999, B=£4,000 - £7,999 C=£8,000 - £11,999 D=£12,000 - £15,999 E=£16,000 - £19,999 F=£20,000 - £24,999 G £25,000 + K3. Are there any other staff who work directly with children? If yes, who? Title Hours/Week K4. Do unpaid workers help in your centre If yes, how many in the last month / average hours/week per volunteer K5. Indicate the cultural/ethnic background of staff in your centre Cultural/ethnic background and Number 1.White UK heritage 2.White European heritage 3.Black Caribbean heritage 4.Black African heritage 5.Black other 6.Indian 7.Pakistani 8.Bangladeshi 9.Chinese 10.Any other minority ethnic group 11.Mixed race

Ordering Information: The Bookshop at the Institute of Education,
20, Bedford Way, London, WC1H 0AL
Telephone: 020 7612 6050 Facsimile: 020 7612 6407 Email: [email protected] website: www.johnsmith.co.uk/ioe
Price £8.50
ISBN 0 85473595-X
Address for correspondence:
EPPE Project University of London Institute of Education 20 Bedford Way London WC1H 0AL
Tel: +44 (0) 207 612 6219 Fax: +44 (0) 207 612 6230
Email: [email protected]