epubs.surrey.ac.ukepubs.surrey.ac.uk/813371/1/rhodocodon paper final dec... · web...
TRANSCRIPT
Phytochemical Investigations of Three Rhodocodon (Hyacinthaceae Sensu APG II) Species
Sianne Schwikkard,*†,‡ Alaa Alqahtani,† Walter Knirsch,§ Wolfgang Wetschnig,§ Andrius
Jaksevicius,‡ Elizabeth I. Opara,‡ Moses K. Langat,†,⊥ Jackie L. Andriantiana,∥ and Dulcie A.
Mulholland†,⊥†Natural Products Research Group, Department of Chemistry, Faculty of Engineering and
Physical Sciences, University of Surrey, Guildford, GU2 7XH, United Kingdom
‡School of Life Sciences, Pharmacy and Chemistry, Faculty of Science, Engineering and
Computing, Kingston University, Penrhyn Road, Kingston Upon Thames, KT1 2EE, United
Kingdom
§Institute of Plant Sciences, NAWI Graz, Karl-Franzens-University Graz, Holteigasse 6, A-
8010, Graz, Austria
⊥School of Chemistry and Physics, University of KwaZulu-Natal, Durban, 4041, South Africa
∥Parc Botanique et Zoologique de Tsimbazaza, Rue Kasanga Fernand, Antananarivo 101,
Madagascar
ABSTRACTThe genus Rhodocodon (Hyacinthaceae sensu APG II) is endemic to Madagascar and its
phytochemistry has not been described previously. The phytochemistry of three species in
this genus has been investigated and eight compounds, including three bufadienolides
(compounds 1, 4, and 5), a norlignan (2), and four homoisoflavonoids (compounds 3 and 6-
8) have been isolated and identified. Compounds 1-3 and 6-8 have not been described
previously. The COX-2 inhibitory activity of compound 6 and compound 7 acetate
(compound 7A) were investigated on isolated colorectal cancer cells. Compounds 6 and 7A
inhibited COX-2 by 10% and 8%, respectively, at a concentration of 12.5 M compared to
12% for 1 mM aspirin (the positive control).
Rhodocodon Baker has recently been reinstated as a genus1 within the Urgineoideae
subfamily of the Hyacinthaceae (sensu APG II). Taxonomic and phylogenetic work1-3 has
shown that all species of Rhodocodon, a genus endemic to Madagascar, form a well
supported monophyletic clade.
Homoisoflavonoids isolated from the Hyacinthaceae family (sensu APG II) have been
shown to have anti-inflammatory effects using a mouse edema test.4 In addition,
homoisoflavonoids with a benzylidene group at C-3 together with a 3’,4’-disubstituted B-
ring and a 5,7-disubstituted A-ring have been shown to exhibit inhibitory activity against
cyclooxygenase 2 (COX-2), which is a key mediator of the inflammatory response.5 COX-2 is
induced in the early stages of a number of cancers and is known to be over-expressed in
patients with one of the most common cancers in high-income countries, colorectal cancer
(CRC).6-13 Furthermore, this over-expression is linked to poor prognosis in those with CRC.14,15
Thus, targeting this enzyme is considered to be of importance in the prevention and
treatment of CRC.16
The phytochemistry of members of this genus has not been reported previously and the
phytochemical investigations of three Rhodocodon species are reported herein:
Rhodocodon calcicola Knirsch, Mart.-Azorín & Wetschnig, Rhodocodon campanulatus
Knirsch, Mart-Azorín & Wetschnig, and Rhodocodon aff. intermedius Knirsch, Mart.-Azorín &
Wetschnig. Investigations into the COX-2 inhibitory activity of the compounds isolated were
conducted on colorectal cancer cells in vitro. These species grow in deciduous, seasonally
dry western forest at low elevation.
RESULTS AND DISCUSSION
An ethanol extract of the bulbs of R. campanulatus yielded three previously unreported
compounds: a bufadienolide glycoside (1), a norlignan (2), a class of compounds rarely
reported from the Hyacinthaceae,17 and a homoisoflavonoid (3). While bufadienolides are
the expected constituents of a member of the Urgineoideae, homoisoflavonoids are rarely
found in this subfamily.18 The homoisoflavonoid was found to have the rare (3S)
configuration.
Compound 1, 3β-(O-β-ᴅ-glucopyranosyl)-14β-hydroxy-5,19-oxobufa-20,22-dienolide,
was found to be the 3β-O-ᴅ-glucoside derivative of 19-oxo-bufalin, which was isolated
previously from the Chinese traditional medicine “Ch’an Su”, produced from the skin
secretions of the toads Bufo gargarizans Cantor or Bufo melanostrictus Schneider.19
HRESIMS indicated a molecular formula of C30H42O10. The FTIR spectrum showed bands at
3419 (OH-stretch), 1732, and 1715 cm-1 (aldehyde and α,β-unsaturated carbonyl stretches,
respectively). The characteristic 1H NMR resonances for α-pyrone ring protons of a
bufadienolide occurred at δH 7.47 (H-21, dd, J = 0.9 Hz, 2.5 Hz), 8.01 (H-22, dd, J = 2.5 Hz, 9.7
Hz) and 6.29 (H-23, dd, J = 9.7 Hz, 0.9 Hz). The H-21 and H-22 resonances showed
correlations in the HMBC spectrum with a methine carbon resonance (δC 52.2) that could be
assigned to C-17. The HMBC spectrum showed correlations between the C-17 resonance
and the only methyl group proton resonance, which was assigned as CH3-18 (δH 0.68, s) and
between the corresponding H-17 resonance (δH 2.56, dd, J = 6.4 Hz, 9.5 Hz) and an
oxygenated carbon resonance (δC 85.6), which was assigned as C-14, and hence a hydroxy
group was placed at this position. Thus, the usual CH3-19 methyl group was oxidized to an
aldehyde. The H-19 resonance (δH 10.02, s) showed correlations with the C-1 (δC 32.3), C-5
(δC 44.2), and C-10 (δC 53.0) resonances. The C-5 resonance showed a correlation with the
H-3 resonance (δH 3.79, m). A NOESY experiment showed correlations between the
aldehyde proton resonance and the H-1 (H 2.45), H-2β (H 2.02), H-4β (H 1.32), and H-8
(H 1.64) resonances. No correlation was seen between the H-5 and H-19 resonances.
Correlations were observed between the H-3/H-5, H-3/H-4 (H 1.96), H-3/H-2 (H 2.02),
and H-3/H-1 (H 1.06) resonances, confirming both H-3 and H-5 to be in the
configuration and the sugar residue to be located at the 3-position (Figure 2).
The sugar was identified as β-ᴅ-glucose due to the chemical shifts of the sugar proton
resonances and J1’,2’ and J3’,4’ coupling constants (9.0 Hz and 9.5 Hz respectively), indicating a
trans-diaxial relationship in each case. This was supported by correlations seen in the
NOESY spectrum between the H-1’/H-3’ and H-2’/H-4’/2H-6’ resonances.20 The glycoside
derivative of 19-oxobufalin has not been reported previously.
Compound 2 is a new norlignan, with a previously unreported skeleton, isolated as its di-
acetyl derivative, compound 2A, after acetylation of a complex mixture to aid separation.
The HRESIMS gave a [M + Na]+ ion at m/z 479.1253, indicating a molecular formula of
C24H24O9 for 2A. The FTIR spectrum exhibited a broad C=O absorption band at 1769 cm-1.21
The 1H NMR spectrum showed the presence of six aromatic proton resonances due to two
1,3,4-trisubstituted aromatic rings. Resonances could be assigned to the H-2 (δH 6.71, d, J =
1.9 Hz), H-5 (δH 6.87, d, J = 8.1 Hz), H-6 (δH 6.64, dd, J = 1.9 Hz, 8.1 Hz), H-2’ (δH 7.43, d, J =
1.9 Hz), H-5’ (δH 7.10, d, J = 8.1 Hz), and H-6’ (δH 7.20, dd, J = 1.9 Hz, 8.1 Hz) protons and

carbon resonances for the two rings using the HSQC and HMBC spectra. Two methoxy
groups (δH 3.66 and δH 3.87) were placed at C-3 and C-3’ due to correlations seen in the
NOESY spectrum with H-2 and H-2’ resonances, respectively, and the two acetate groups (δH
2.29 and δH 2.33) were placed at the remaining C-4 and C-4’ positions on the aromatic rings
based on correlations seen in the HMBC spectrum. The HMBC spectrum showed
correlations between a keto group carbon resonance (δC 195.3, C-7’) and the H-2’, H-6’ and
2H-9’ proton resonances (δH 4.44, t, J = 8.1 Hz, 4.11, t, J = 8.1 Hz). The COSY spectrum
showed a coupled system incorporating the two H-9’ protons, H-8’ (δ3.07, dd, J = 9.1 Hz,
16.7 Hz), H-7 (δ 3.56, dt, J-= 6.1 Hz, 9.1 Hz) and two H-8 (δH 3.07, d, J = 6.2 Hz) resonances.
The two H-9’, H-7 and two H-8 resonances showed a correlation in the HMBC spectrum with
a lactone carbonyl resonance at δC 176.9, which was assigned as C-9.
The NOESY spectrum was used to assign the relative configuration of compound 2A.
Correlations were seen between the H-7 signal and one of the H-9’ proton resonances (δH
4.11), and between the second H-9’ (δH 4.44) resonance and the H-8’ resonance. The large
J7,8’ coupling constant (9.1 Hz) confirmed a trans relationship between H-7 and H-8’. Two
structures, (X: 7R, 8’S) or (Y: 7S, 8’R), were now possible.
ECD studies were used to determine the absolute stereostructure of compound 2A. A
conformational analysis using molecular mechanics force fields (MMFF) on SPARTAN08
software was undertaken for X and Y and the conformers with energy of less than 2
kcal/mol were subjected to TDDFT calculations employing B3LYP, 6-31G basis in Gaussian09
software. The calculated ECD curves were compared to the experimental ECD for
compound 2A (Figure 2). The experimental ECD curve gave a positive Cotton effect at 267
nm (+1.6) and negative Cotton effects at 219 nm (-3.9) and 304 (-1.3) for compound 2A,
confirming that it has the (7S, 8’R) configuration. Compound 2 was identified as (7S,8’R)-
3,3’-dimethoxy-4,4’-diacetoxy-7’-ketolignano-9,9’-lactone.
Compound 3, C17H16O6, gave the same molecular formula and NMR spectra as the
homoisoflavonoid, 5,7-dihydroxy-3-(3-hydroxy-4-methoxybenzyl) chroman-4-one, isolated
previously from Scilla kraussi and Muscari comosum.22 However, the specific rotation for
this compound ([]D20 +5.1, CHCl3) did not agree with literature value ([]D
23.6 -51, CHCl3),22
so an ECD study was undertaken. The measured ECD spectrum showed Cotton effects of
+1.54 at 290 nm and -0.9 at 240 nm for the unusual S-configuration.23 In all
homoisoflavonoids reported from the Hyacinthoideae subfamily, where the configuration at
C-3 has been determined, it has been reported as R, with the exception of only three
homoisoflavonoids isolated by Nishida et al.24 from Barnardia japonica (Thunb.) Wijnands
(investigated as Scilla scilloides (Lind.) Druce), which also showed the S-configuration, as
determined by an ECD study. The unusual 3S-configuration has been reported once from the
Urginiodeae subfamily, from Urginea depressa.25 The isolation of compound 3 was
facilitated by acetylation yielding two products, the 3’-acetate, (3A) and the 5,7-diacetate,
(3B).
The ethanol extract of the bulbs of R. calcicola yielded two known bufadienolide
glycosides, hellebrigenin-3-O-β-ᴅ-glucopyranoside (4) and gamabufotalin-3-O-α-L-
rhamnoside (5). The structures of the compounds were identified using NMR spectroscopy
and confirmed by comparison against literature values. Hellebrigenin-3-O-β-ᴅ-
glucopyranoside (4) has been isolated previously from Urginea altissima,26 Helleborus
orientalis, and H. thibetanus (Ranunuclaceae).27,28 Gamabufotalin-3-O-α-L-rhamnoside (5)
has been isolated previously from Urginea altissima.29
The dichloromethane extract of the bulbs of Rhodocodon aff. intermedius yielded a
complex mixture of homoisoflavonoids. Three new homoisoflavonoids, compounds 6-8
were isolated while the presence of further homoisoflavonoids, not containing any acetate
groups, was clear from the NMR spectra of the mixtures. In order to facilitate separation of
these complex mixtures of homoisoflavonoids, some of the initial fractions obtained via
column chromatography were acetylated. Compounds 6A, 6B, and 7A were isolated as the
acetylated products of compounds 6 and 7, respectively.
The 1H NMR spectrum of compound 6 indicated it to be a benzylidene-type
homoisoflavonoid (H2-2 at H5.32, d, J = 2.5 Hz; H-9 at H 7.60, bs).30 A single methoxy
group was indicated by a three-proton resonance at H 3.93 (s). The B-ring was 3’, 4’-
disubstituted (H-2’, H 6.87, d, J = 1.5 Hz; H-5’, H 7.05, d, J = 7.5 Hz; H-6’, H 6.91, dd, J = 7.5
Hz, 1.5 Hz) and the methoxy group was placed at C-4’ due to a correlation seen in the NOESY
spectrum between the H-5’ and methoxy group proton resonances. A hydroxy group was
placed at C-3’. An H-bonded hydroxy group was present at C-5 (H 12.85, s) and the NOESY
spectrum showed a correlation between this resonance and an additional hydroxy group
resonance at H 9.45 (s), indicating the presence of an OH group at C-6. The biosynthesis
requires substitution at C-7, in this case a hydroxy group. H-8 was clearly visible as a single
proton singlet at H 5.82 and showed correlations in the HMBC spectrum with the C-4a (C

102.64), C-6 (C 96.80), C-7 (C 168.75), and C-8a (C 162.91) resonances. The geometry
around the C-3/C-9 double bond was assigned as E, due to the correlation seen in the
NOESY spectrum between the H2-2 and H-2’ resonances and the chemical shift of H-9 at H
7.60. Z-geometry results in a lower chemical shift of approximately H 6.70 - H 7.07.31
HRESIMS gave a peak at m/z [M+-OCH3-OH] of 281.0508 daltons for compound 6. Two
acetylated products of compound 6 were identified as the 7, 3’-diacetate 6A and the 6, 3’-
diacetate 6B.
HRESIMS of compound 7 gave a [M-1]+ ion at m/z 313.0722, indicating a molecular
formula of C17H13O6. Compound 7 was also structurally assigned as a benzylidene
homoisoflavonoid (H2-2, H 5.24, bs; H-9, H 7.69, bs). The 1H NMR spectrum indicated a
3’,4’-substituted B-ring with H-2’ at H 6.81, d (J = 2.1 Hz), H-5’ H 6.85, d (J = 8.1 Hz) and H-6’
at H 6.78, dd (J = 8.1 Hz, 2.1 Hz). A methoxy group (H 3.92) was placed at C-4’ due to a
correlation seen with the H-5’ resonance in the NOESY spectrum. A hydroxy group was
placed at C-3’ as in compound 6. A downfield singlet proton resonance found at H 12.70
indicated the presence of a hydroxy group at C-5. A pair of meta-coupled peaks at H5.93
(J = 2.2 Hz) and H5.84 (J = 2.2 Hz) were assigned to H-6 and H-8, respectively, with the
remaining hydroxy group, as indicated by the molecular formula, at C-7. The geometry
around the C-3/C-9 double bond was assigned as E due to the NOESY correlations seen
between the H2-2 and H-2’ resonances and the chemical shift of H-9.31 Acetylation yielded
the 3’-acetate, 7A.
Compound 8, a yellow powder, that has not been isolated previously from natural
sources, was synthesized previously as the racemate.32 HRESIMS gave a [M+Na]+ peak at
m/z 369.0946 indicating an elemental formula of C18H18O7 for this compound. Compound 8
was found to differ from the previous homoisoflavonoids isolated from R. aff. intermedius in
that a benzyl group (H-3, H2.74, m; H-9, H3.16, dd, J =13.2 Hz, 3.9 Hz; H-9, H2.66,
dd, J =13.2 Hz, 12.5 Hz; H-2, H4.25, dd, J =10.9 Hz, 3.9 Hz; H-2 H4.09, dd, J =10.9 Hz,
12.5 Hz) was found at C-3 as opposed to a benzylidene group. The proton spectrum
indicated the presence of two methoxy groups (H3.88 and H3.94). As in compounds 6
and 7, a 3’,4’-substitution pattern was present in ring B, and a NOESY correlation between
one of the methoxy groups and the H-5’ resonance was used to place one of these at C-4’.
The HMBC spectrum showed correlations between the C-4’ resonance and the H-2’
(H6.65), H-6’ (H6.60) and H-5’ (H6.79) resonances. A hydroxy group was placed at the
remaining C-3’ position on ring B. The NOESY spectrum also showed a correlation between
a hydroxy group proton resonance at H8.90 and the C-5 hydroxy group proton resonance
(H12.23), so a further hydroxy group was placed at C-6. The C-7 (C137.11resonance
showed a correlation with the methoxy group three-proton singlet and the H-8 resonance in
the HMBC spectrum. The ECD spectrum indicated a positive Cotton effect at 291 nm and as
such the absolute configuration at C-3 was assigned as S (H-).23 This configuration appears
to be characteristic of the Rhodocodon homoisoflavonoids, although not common among
homoisoflavonoids.
Compounds 6 and 7A and the crude plant extracts were screened for COX-2 expression,
and PGE-2 release. To gain some idea of their therapeutic potential, the effects of
compounds 6 and 7A on COX-2 expression and activity (determined based on PGE-2 release
from HCA-7 cells) was compared to that of aspirin, which has been demonstrated to reduce
the incidence and also the mortality of colorectal cancer,33,34 and when at the concentration
used in the present study (1 mM) has been shown to inhibit induced COX-2 expression in
CRC cells in vitro.35 The western blotting results for the COX-2 expression experiments,
showed that both compounds 6 and 7A slightly inhibited COX-2 expression compared to the
untreated control by 10% (12 M) and 8% (12 M), respectively (Figures S1 and S2,
Supporting Information), whereas aspirin (1 mM) inhibited COX-2 expression by 12%. The
DMSO control had no effect on expression (Figure S3, Supporting Information). The effect of
whole plant extracts of plant material was investigated but for all concentrations tested (20
g/mL – 9 mg/mL) all cells were killed after a 48 h period of incubation so it was not possible
to determine the effects of these extracts on COX-2 expression.
In tests for PGE-2 release from HCA-7 cells, some inhibition was seen (11% and 20% for
compounds 7A and 6, respectively, at 12 M), the effect of compound 6 being statistically
significant (Table 5). These results suggest that these compounds have a greater effect on
COX-2 activity than expression. Aspirin (1 mM) inhibited PGE-2 release by 19% but DMSO
showed no inhibition compared to the control (Table 5). For the reasons given above, it was
not possible to determine the effect of the whole plant extracts on PGE-2 release.
It is well established that some phenolic compounds, and plants rich in them, may
possess anti-inflammatory activity via their inhibitory effect on a wide range of key
inflammatory mediators, including COX-2.36-41 The effect of the homoisflavonoids 6 and 7A
on COX-2 expression and activity is consistent with these findings and those of Waller et al .5
who reported that homoisoflavones from Ledebouria socialis and L. ovatifolia inhibited COX-
2 activity based on an in vitro assay. However, the findings of the present study suggest
that in terms of their therapeutic potential, with regard to CRC cells, the target may be COX-
2 activity rather than its expression. When compared to the effect of aspirin (1 mM) on COX-
2 activity (as indicated by PGE-2 release) the data suggest that at the concentrations used,
compounds 6 and 7A at 12.5 M were as effective at inhibiting COX-2 activity as aspirin at a
concentration of 1 mM. It is possible that at higher concentrations, especially for compound
6, which inhibited COX-2 activity by 20%, compared to 19% for aspirin, the inhibitory effect
would have been greater. However, it must be borne in mind that aspirin is not a selective
COX-2 inhibitor16 and so for future studies a comparison of these and other
homoisoflavanoids against a more appropriate inhibitor such as the NSAID celecoxib, which
is considered by some to be clinically relevant in the treatment of colorectal cancer, is
required.16,42
The effect of these compounds on CRC cells in vitro should not be limited to COX-2, as
the development and progression of colorectal cancer occurs via several molecular
mechanisms,43-46 and so future studies will be needed to further investigate and characterize
the effect of these compounds on the growth of HCA-7, and other types of colorectal cancer
cells to gain greater insight into their therapeutic potential.
EXPERIMENTAL
General Experimental Procedures. Optical rotations were recorded in CHCl3 on a JASCO
P-1020 polarimeter (University of Surrey), the UV spectra were recorded using a Biochrom
libraS60 in MeOH or acetonitrile in a 1 cm cell (University of Surrey), and the ECD spectra
were recorded using a Chirascan spectropolarimeter at room temperature in a 1 cm cell in
MeOH (University of Surrey). The IR spectra were recorded on a Perkin-Elmer 2000
spectrometer (University of Surrey). NMR spectra were recorded on a 500MHz Bruker
AVANCE NMR instrument in either CDCl3 or CD3OD at room temperature. All chemical shifts
() are in ppm and referenced to the relevant solvent references, 7.26 ppm (CDCl3) and 4.87
ppm (CD3OD) for 1H NMR spectra and 77.23 ppm (CDCl3) and 49.15 ppm (CD3OD) for 13C
NMR spectra. ESIMS were either recorded on a Bruker MicroToF mass spectrometer using
an Agilent 1100 HPLC to introduce samples (University of Oxford; compounds 1, 3, 6, 6A, 7,
7A and 8) or a Micromass Quattro Ultima mass spectrometer using a Waters Alliance HPLC
to introduce samples (University of Surrey; compounds 2A, 3A and 3B).

Plant Material. Rhodocodon bulbs, collected in Madagascar in collaboration with J. L.
Andriantiana from the Parc Botanique et Zoologique de Tsimbazaza (Permit:
XXX/13/MEF/SG/DGF/DCB.SAP/SCB (valid three months from 23/10/2013) Phyto for export:
1036/13/11-IV/RL/MAG), were cultivated and determined by one of us (W. K.). Voucher
specimens have been retained at Karl-Franzens-University, Graz. Collection sites:
Rhodocodon calcicola Knirsch, Mart.-Azorín & Wetschnig (collection 04476: north of
Mahajanga, collection 04480: a few km north east of the Mahajanga Forest Station),
Rhodocodon campanulatus Knirsch, Mart-Azorín & Wetschnig (collection 02446: south of
Mahaboboka), Rhodocodon aff. intermedius Knirsch, Mart.-Azorín & Wetschnig (collection
04474: south of Ankarana National Park; collection 05052: south of Ankarana, this collection
differed from the type specimen by having longer filaments).
Extraction and Isolation. The bulbs of R. campanulatus (0.4 kg) and R. calcicola (1.23 kg)
were chopped and successively extracted on a shaker for 24 h with ethanol, yielding extracts
of 29.6 g and 75 g, respectively. Separation of the extracts was carried out using column
chromatography over silica gel (Merck art. 9385). Gradient elution was employed using a
gradient starting with dichloromethane and methanol, where 304 x 75 mL and 197 x 75 mL
fractions were collected for R. campanulatus and R. calcicola, respectively. Further
separation of R. campanulatus over Sephadex LH-20 (Sigma Aldrich) using 1:1 CH2Cl2 and
MeOH, yielded 1 (50 mg) and purification over silica gel using column chromatography,
compound 3 (10 mg). Acetylation of further fractions yielded 2A (10 mg), 3A (10 mg) and 3B
(10 mg). Further separation of R. calcicola over Sephadex LH-20 (with CH2Cl2 and MeOH,
1:1) followed by preparative TLC (Macherey-Nagel Ref 818133, pre-coated TLC sheets
Alugram SIL G/UV254, 88% CH2Cl2 and 12% MeOH), yielded bufadienolides 4 (18 mg) and 5 (6
mg). A detailed separation protocol is shown in Schemes S1 and S2 (Supporting
Information).
Rhodocodon aff. intermedius bulbs (1.25 kg) were chopped and successively extracted on
a shaker for 24 h with dichloromethane and ethanol yielding extracts of 3.30 g and 58.3 g,
respectively. Initial separation of the dichloromethane extract using a Reveleris® iES flash
chromatography system over silica gel and increasing solvent polarity from hexane, to
hexane/ CH2Cl2, to MeOH yielded 115 fractions of 15 mL each. Further separation over silica
gel using column chromatography (Merck 9385, 1:4:5 MeOH-hexane-CH2Cl2) yielded the
homoisoflavonoids 6 (5.6 mg), 7 (1.0 mg) and 8 (4.1 mg). Acetylation of further fractions
yielded 6A and 6B (4.4 mg) and 7A (5.4 mg).
3-(-O--D-Glucopyranosyl)-14-hydroxy-5α-19-oxobufa-20,22-dienolide (1): Yellow gum;
[]D23.6 +320 (c 0.1, CHCl3); IR (NaCl) max 3419, 2917, 1732, 1715 cm-1; 1H NMR (CDCl3, 500
MHz) and 13C NMR (CDCl3, 125 MHz) are given in Table 1; HRESIMS m/z 585.2675 [M+Na]+
(calcd for C30H42O10Na, 585.2670)
(3S)-5,7-Dihydroxy-3S-(3’-hydroxy-4’-methoxybenzyl)-4-chromanone (3): White powder;
[]D23.6 +5.2 (c 0.6, CHCl3); ECD (c 0.03, MeOH) 291 nm (+1.54), 240 nm (-0.9); IR (NaCl) max
3445, 2917, 2849, 1635, 1105 cm-1; 1H NMR (CDCl3, 500 MHz) and 13C NMR (CDCl3, 125 MHz)
data are given in Tables 3 and 4; HRESIMS m/z 315.0863 [M-H]+ (calcd for C17H15O6,
315.0874).
(E)-5,6,7-Trihydroxy-3-(3’-hydroxy-4’-methoxybenzylidene)-4-chromanone (6): Yellow
gum; UV (CH3CN) max (log ) 258 (3.59), 372 (3.92) nm; IR (NaCl) max 3336, 2961, 2918,
1732, 1642, 1593, 1512, 1259, 1090, 1027, 798 cm -1; 1H NMR (CDCl3, 500 MHz) and 13C NMR
(CDCl3, 125 MHz) data are given in Tables 3 and 4; HRESIMS m/z 281.0508 [M+-OCH3-H2O]
(calcd for C17H14O7, 330.0745, M+ not seen).
(E)-5,7-Dihydroxy-3-(3’-hydroxy-4’-methoxybenzylidene)-4-chromanone (7): Yellow gum;
UV (CH3OH) max (log ) 273 (3.87), 365 (3.85) nm; IR (NaCl) max 2958, 2929, 2859, 1727,
1579, 1462, 1380, 1274, 1123, 1072 cm-1; 1H NMR (CDCl3, 500 MHz) and 13C NMR (CDCl3, 125
MHz) data are given in Tables 3 and 4; HRESIMS m/z 313.0722 [M-1] (calcd for C17H13O6,
313.07176).
(3S)-5,6-Dihydroxy-7-methoxy-3-(3’-hydroxy-4’-methoxybenzyl)-4-chromanone (8): Yellow
gum; []D23.6 +29.4 (c 0.2, CHCl3); ECD (c 3.6 x 10⁻³, MeOH) 291 nm (+1.9), 253 nm (-0.7); UV
(CH3CN) max (log ) 290 (4.63), 338 (3.63) nm; IR (NaCl) max 3392, 2918, 1727, 1644, 1587,
1512, 1469, 1454, 1274, 1160, 1101, 1028, 801, 739 cm -1; 1H NMR (CDCl3, 500 MHz) and 13C
NMR (CDCl3, 125 MHz) data are given in Tables 3 and 4; HRESIMS m/z 369.0946 [M+Na]+
(calcd for C18H18O7Na, 369.09477).
Acetylation Procedure. Compounds or fractions to be acetylated were dissolved in
pyridine (2 mL) in a round-bottomed flask, acetic anhydride (2 mL) was added, and the
reaction was left to stand overnight. Methanol (10 mL) was added to the reaction mixture
to remove unreacted acetic anhydride. Toluene (4 x 10 mL) was added in order to remove
the pyridine, and was removed using a rotary evaporator. Thereafter, methanol (5 x 10 mL)
was added and evaporated off to remove the remaining toluene. The fractions were
subjected to column chromatography over silica gel (Merck 9385, 4:1 ether-hexane) to yield
3A then preparative TLC was used to yield 2A and 3B (Scheme S1, Supplementary
Information). Column chromatography over silica gel (Merck 9385, 1:4:5, MeOH-Hexane-
DCM) yielded 7A and a mixture of 6A and 6B.
3,3’-Dimethoxy-4,4’-diacetoxy-7’-ketolignano-9,9’-lactone (2A): White powder; []D23.6
+5.1 (c 0.5, CHCl3); ECD (c 0.02, MeOH) 267 nm (+1.6), 219 nm (-3.9), 304 (-1.3); IR (NaCl)
max 3445, 2918, 2849, 1769, 1508, 1267, 1158 cm -1; 1H NMR (CDCl3, 500 MHz) and 13C NMR
(CDCl3, 125 MHz) data are given in Table 2; HRESIMS m/z 479.1253 [M+Na]+ (calcd for
C24H24O9, 479.1318).
(3S)-5,7-Dihydroxy-3S-(3’-acetoxy-4’-methoxybenzyl)-4-chromanone (3A): White powder;
[]D23.6 +4.6 (c 0.39, CHCl3); ECD (c 0.04, MeOH) 290 nm (+0.5), 235 nm (-0.2); IR (NaCl) max
3445, 2918, 2849, 1739, 1635 cm-1; 1H NMR (CDCl3, 500 MHz) and 13C NMR (CDCl3, 125 MHz)
data are given in Tables 3 and 4.; HRESIMS m/z 381.0941 [M+Na]+ (calcd for C19H18O7Na,
381.0951).
(3S)-5,7-Diacetoxy-3S-(3’-hydroxy-4’-methoxybenzyl)-4-chromanone (3B): White powder;
[]D23.6 +5.1 (c 7.0, CHCl3); ECD (c 0.03, MeOH) 278 nm (+0.7), 238 nm (-1.8); IR (NaCl) max
3444, 2916, 2848, 1738, 1766, 1618, 1158 cm -1; 1H NMR (CDCl3, 500 MHz) and 13C NMR
(CDCl3, 125 MHz) data are given in Tables 3 and 4; HRESIMS m/z 423.0999 [M+Na]+ (calcd for
C21H20O8Na, 423.1056).
(E)-7-Acetoxy-5-hydroxy-3-(3’-hydroxy-4’-methoxybenzylidene)-4-chromanone (7A):
Yellow gum; UV (CH3CN) max (log ) 365 (4.09) nm; IR (NaCl) max 3364, 2962, 2927, 1767,
1732, 1644, 1634, 1592, 1511, 1469, 1445, 1366, 1261, 1160, 1026, 811 cm -1; 1H NMR
(CDCl3, 500 MHz) and 13C NMR (CDCl3, 125 MHz) data are given in Tables 3 and 4; HRESIMS
m/z 379.0788 [M+Na]+ (calcd for C19H16O7 Na, 379.07882).
COX-2 Expression and PGE-2 Release. For COX-2 expression tests, HCA-7 cells obtained
by Sigma-Aldrich, UK from Culture Collections Public Health England, UK (www.PHE-
Culturecollections.org.uk/) were seeded into 6-well plates (Nunclone Delta, Fisher, UK) with
Dulbecco's modified Eagle's medium (DMEM) (Sigma-Aldrich, UK, D5796 500 mL) in 10%
fetal bovine serum (FBS) (Sigma-Aldrich, UK F7524) and incubated at 37 C and 5% CO2. After
48 h, when cells were almost 80% confluent, each whole plant extract (in % DMSO) (20

g/mL – 9 mg/mL) or homoisoflavonoid compounds 6 and 7A (12.5 M) in 100% DMSO was
added and left for another 48 h. Controls were also set up and were “no treatment” (cell
culture medium only), a DMSO control (HCA-7 cells in 0.3% DMSO) and a positive control (1
mM aspirin, (Sigma-Aldrich, UK A5376-100 g). Compounds 6 and 7A were selected for this
part of the investigation as the amounts in DMSO were known. After the second 48 h
incubation, cells were lysed using LDS NuPAGE lysis buffer (Fisher, UK 10718414) and the
western blotting was performed using equal amounts of sample (lysed cells) based on
protein content, (30 g).
PGE-2 is a product of COX-2 and thus PGE-2 release by cells expressing COX-2 is
commonly used as a marker of COX-2 activity,16 thus the effect of compounds 6 and 7A on
PGE-2 release by HCA-7 cells was investigated. HCA-7 cells were seeded and incubated as
described above. After the second 48 h period, the cell culture medium was collected and
stored at -20 C. For the PGE-2 assay, the samples were defrosted, centrifuged at 1000 rpm
for 4 min, and then assayed using a PGE-2 ELISA kit, according to the manufacturer’s
instructions (RND Systems, UK KGE004B). This assay is based on the forward sequential
competitive binding technique in which PGE2 present in a sample competes with
horseradish peroxidase (HRP)-labelled PGE2 for a limited number of binding sites on a
mouse monoclonal antibody. PGE2 in the sample is allowed to bind to the antibody in the
first incubation. During the second incubation, HRP-labelled PGE2 binds to the remaining
antibody sites. Following a wash to remove unbound materials, a substrate solution is added
to the wells to determine the bound enzyme activity. The color development was stopped,
and the absorbance was read at 450 nm. The intensity of the color is inversely proportional
to the concentration of PGE2 in the sample.
ASSOCIATED CONTENT
Supporting Information. Copies of spectra for all new compounds and isolation flow
charts for each plant species
AUTHOR INFORMATION
Corresponding Author. *Tel: +44 2087146634. E-mail: [email protected]
ACKNOWLEDGEMENTS. Sianne Schwikkard would like to gratefully acknowledge support
from the Daphne Jackson Trust and the Royal Society of Chemistry as well as assistance
from Dr. Julian Swindon for the running of some of the HRMS and Dr. Jean-Marie Peron for
providing access to the NMR facility at Kingston University.
REFERENCES
(1) Knirsch, W.; Martínez-Azorín, M.; Pfosser, M.; Wetschnig, W. Phytotaxa 2015, 195, 101-134.(2) Pfosser, M.; Wetschnig, W.; Speta, F. Linzer Biologische Beiträge 2006, 38, 1731-1739.(3) Pfosser, M.; Knirsch, W.; Pinter, M.; Ali, A.; Dutta, S.; Wetschnig, W. Plant Ecol. Evol. 2012, 145, 65-72.(4) Della Loggia, R.; Del Negro, P.; Tubaro, A.; Barone, G.; Parrilli, M. Planta Med. 1989, 55, 587-588.(5) Waller, C. P.; Thumser, A. E.; Langat, M. K.; Crouch, N. R.; Mulholland, D. A. Phytochemistry 2013, 95, 284-290.(6) Aggarwal, B. B.; Shishodia, S.; Sandur, S. K.; Pandey, M. K.; Sethi, G. Biochem. Pharmacol. 2006, 72, 1605-1621.(7) Brown, J. R.; DuBois, N. J. Clin. Oncol. 2005, 23, 2840-2855.(8) Eberhart, C. E.; Coffey, R. J.; Radhika, A.; Giardiello, F. M.; Ferrenbach, S.; DuBois, R. N. Gastroenterology 1994, 107, 1183-1188.(9) Soslow, R. A.; Dannenberg, A. J.; Rush, D.; Woerner, B. M.; Khan, K. N.; Masferrer, J.; Koki, A. T. Cancer 2000, 89, 2637-2645.(10) Wang, M.-T.; Honn, K. V.; Nie, D. Cancer Metast. Rev. 2007, 26, 525-534.(11) Wiese, F. W.; Thompson, P. A.; Warneke, J.; Einspahr, J.; Alberts, D. S.; Kadlubar, F. F. Mol. Carcinog. 2003, 37, 25-31.(12) Ferlay, J.; Shin, H.-R.; Bray, F.; Forman, D.; Mathers, C.; Parkin, D. M. Int. J. Cancer 2010, 127, 2893-2917.(13) Jemal, A.; Siegel, R.; Xu, J.; Ward, E. CA Cancer J. Clin. 2010, 60, 277-300.(14) Ogino, S.; Kirkner, G. J.; Nosho, K.; Irahara, N.; Kure, S.; Shima, K.; Hazra, A.; Chan, A. T.; Dehari, R.; Giovannucci, E. L.; Fuchs, C. S. Clin. Cancer Res. 2008, 14, 8221-8227.(15) Sheehan, K. M.; Sheahan, K.; O'Donoghue, D. P.; MacSweeney, F.; Conroy, R. M., Fitzgerald, D. J.; Murray, F. E. JAMA 1999, 282, 1254-1257.(16) Greenborough, A.; Smartt, H. J. M.; Moore, A. Roberts, H. R.; Williams, A. C.; Parakeva, C.; Kaidi, A. Carcinogenesis 2009, 30, 377-386.(17) Koorbanally C.; Mulholland, D. A. Crouch, N.R. Biochem. System. Ecol. 2006, 34, 588-592.(18) Mulholland, D. A.; Schwikkard, S. L.; Crouch, N. R. Nat. Prod. Rep. 2013, 30, 1153-1266.(19) Nogawa, T.; Kamano, Y.; Yamashita, A.; Pettit, G. R. J. Nat. Prod. 2004, 67, 1960-1960.(20) Agrawal, P. K. Phytochemistry 1992, 31, 3307-3330.(21) Silverstein, R. M.; Webster, F. X. Spectrometric Identification of Organic Compounds; 6th ed.; Wiley: New York, 1998, p482.(22) Adinolfi, M.; Barone, G.; Belardini, M.; Lanzetta, R.; Laonigro, G.; Parrilli, M. Phytochemistry 1985, 24, 2423-2426.(23) Adinolfi, M.; Barone, G.; Corsaro, M. M.; Mangoni, L.; Lanzetta, R.; Parrilli, M. Tetrahedron 1988, 44, 4981-4988.(24) Nishida, Y.; Eto, M.; Miyashita, H.; Ikeda, T.; Yamaguchi, K.; Yoshimitsu, H.; Nohara, T.; Ono, M. Chem. Pharm. Bull. 2008, 56, 1022-1025.(25) Dai, Y.; Harinantenaina, L.; Brodie, P.; Goetz, M.; Young, S.; Dyk, K. T.; Kingston, D.G. I. J. Nat. Prod. 2013, 76, 865-872.(26) Shimada, K.; Umezawa, E.; Nambara, T.; Kupchan, S. M. Chem. Pharm. Bull. 1979, 27, 3111-3114.(27) Watanabe, K.; Mimaki, Y.; Sakagami, H.; Sashida, Y. J. Nat. Prod. 2003, 66, 236-241.
(28) Yang, F.-Y.; Su, Y.-F.; Wang, Y.; Chai, X.; Han, X.; Wu, Z.-H.; Gao, X.-M. Biochem. System. Ecol. 2010, 38, 759-763.(29) Dagne, E.; Mammo, W.; Alemu, M.; Casser, I. Bull. Chem. Soc. Ethiopia 1994, 8, 85-89.(30) Masterova, I.; Suchy, V.; Uhrin, D.; Ubik, K.; Grancaiova, Z.; Bobovnicky, B. Phytochemistry 1991, 30, 713-714.(31) Siddaiah, V.; Rao, C. V.; Venkateswarlu, S.; Krishnaraju, A. V.; Subbaraju, G. V. Bioorg. Med. Chem. 2006, 14, 2545-2551.(32) Lee, B.; Basavarajappa, H. D.; Sulaiman, R. S.; Fei, X.; Seo, S.-Y.; Corson, T. W. Org. Biomol. Chem. 2014, 12, 7673-7677.(33) Giovannucci, E.; Rimm, E. B.; Stampfer, M. J.; Colditz, G. A.; Ascherio, A.; Willett, W. C. Ann. Intern. Med. 1994, 121, 241-246.(34) Thun, M.; Namboodiri, M.; Heath, C. N. Engl. J. Med. 1991, 325, 1593-1596.(35) Shtivelband, M. L.; Juneja, H. S.; Lee, S.; Wu, K. K. J. Throm. Haemost. 2003, 1, 2225-2233.(36) Baker, I.; Chohan, M.; Opara, E. Plant Foods Hum. Nutr. 2013, 68, 364-369.(37) Chohan, M.; Naughton, D.; Jones, L.; Opara, E. Oxid. Med. Cell. Long. 2012, 2012, 1942-1951.(38) Goel, A.; Boland, C. R.; Chauhan, D. P. Cancer Lett. 2001, 172, 111-118.(39) Li, F.; Nitteranon, V.; Tang, X.; Liang, J.; Zhang, G.; Parkin, K. L.; Hub, Q. Food Chem. 2012, 135, 332-337.(40) Mueller, M.; Hobiger, S.; Jungbauer, A. Food Chem. 2010, 122, 987-996.(41) Van Breemen, R. B.; Tao, Y.; Li, W. Fitoterapia 2011, 82, 38-43.(42) Rahman, M.; Selvarajan, K.; Hasan, M. R.; Chan, A. P.; Jin, C.; Kim, J.; Chan, S. K.; Le, N. D.; Kim, Y.-B. Neoplasia 2012, 14, 624-633.(43) Tachibana, M.; Kawamata, H.; Fujimori, T.; Omotehara, F.; Horiuchi, H.; Ohkura, Y.; Kubota, K. Int. J. Oncol. 2004, 25, 913-920.(44) Fearon, E. R. Ann. Rev. Pathol.: Mechan. Disease 2011, 6, 479-507.(45) Muzny, D. M.; Bainbridge, M. N.; Chang, K.; Dinh, H. H.; Drummond, J. A.; Fowler, G.; Newsham, I. F. Nature 2012, 487, 330-337.(46) Valkenburg, K. C.; Graveel, C. R.; Zylstra-Diegel, C. R.; Zhong, Z.; Williams, B. O. Cancer 2011, 3, 2050-2079.
Table 1. 1H NMR (500 MHz) and 13C NMR (125 MHz) Data for Compound 1 (in CD3OD)
position δC δH (J in Hz) HMBC (H→C) 1α 32.3, CH2 1.06, m 2, 3, 5, 101β 2.45, m 2, 9, 19, 102α 31.7, CH2 1.34, m 3, 102β 2.02, m -3α 78.6, CH 3.79, m 1’4α 36.9, CH2 1.32, ma 54β 1.96, m -5 44.2, CH 1.42, m 96α 28.9, CH2 2.30, m 5, 106β 2.17, m -7α 23.3, CH2 1.23, m -7β 1.72, m 9, 148β 44.4, CH 1.64, m -9α 50.0, CH 1.31, ma 5, 1010 53.0, C - -11α 32.7, CH2 1.69, m -11β 2.02, m -12α 41.5, CH2 1.41, m 1312β 1.53, m 1313 49.8, C - -14 85.6, C - -15α 32.7, CH2 1.69, m 13, 1615β 2.02, m -16α 29.8, CH2 2.19, m 13, 14, 15, 20 16β 1.67, m -17α 52.2, CH 2.56, dd (6.4, 9.5) 12, 13, 14, 16, 20, 21
18 17.2, CH3 0.68,s 12, 13, 14, 1719 210.6, CH 10.02, s 1, 5, 1020 125.0, С - -21 150.7, СH 7.47, dd (0.9, 2.5) 17, 21, 2422 149.4, CH 8.01, dd (2.5, 9.7) 17, 21, 2423 115.6, СH 6.29, dd (0.9, 9.7) 17, 2424 164.9, С - -1’ 102.5, СH 4.41, d (7.8) 32’ 72.2, CH 3.14, dd (7.8, 9.0) 1’, 3’3’ 78.2, CH 3.36, dd (9.0, 9.5) 2’, 4’4’ 71.8, CH 3.26, dd (9.5, 9.6) 5’, 6’5’ 78.1, CH 3.23, dd (9.6, 5.4) -6’A 63.0, CH2 3.87, dd (1.0, 11.6) 4’6’B 3.66, dd (5.4, 11.6) 3’, 4’
a Overlapped proton resonances.
Table 2.. 1H NMR (500 MHz) and 13C NMR (125 MHz) Data for Compound 2A (in CDCl3)
position δC type δH (J in Hz) HMBC (H→C)1 136.1, C - -2 113.5, CH 6.71, d (1.9) 1, 43 151.5, C - -4 139.0, C - -5 123.3, CH 6.87, d (8.1) 1, 3, 46 121.6, CH 6.64, dd (1.9, 8.1) 1, 27β 44.5, CH 3.56, dt (6.1, 9.1) 1, 9, 7’8 34.6, CH2 3.07, d (6.1) 1, 2, 7, 8’, 99 176.9, C - -1’ 134.4, C - -2’ 111.9, CH 7.43, d (1.9) 3’, 4’, 6’, 7’3’ 152.2, C - -4’ 145.2, C - -5’ 123.2, CH 7.10, d (8.1) 1’, 3’, 4’6’ 121.7, CH 7.20, dd (8.1, 1.9) 2’, 4’, 7’7’ 195.4, C - -8’α 47.2, CH 4.07, dt (9.1, 16.7) 7’, 9’9’α 68.2, CH2 4.44, t (9.1) 7, 99’β 4.11, t (9.1) 7, 9OMe-3 55.9, CH3 3.66, s 3OMe -3’ 56.3, CH3 3.87, s 3’OAc -4 20.9, CH3 2.29, s OAc-4OAc -4 169.1, C - -OAc -4’ 20.9, CH3 2.33, sOAc -4’ 168.5, C - -

Table 3.. 1H NMR (500 MHz) Data for Compounds 3, 3A, 3B, 6, 7, 7A and 8 (in CDCl3, J in Hz)
position 3 3A 3B 6 7 7A 82 4.27, dd (4.3, 11.5) 4.11, dd
(7.5, 11.5)4.29, dd (4.5, 11.5) 4.11, dd (7.5, 11.5)
4.31, dd (4.5, 11.5) 4.14, dd (7.5, 11.5)
5.32, d (2.5) 5.24, bs 5.21, d (1.8) 4.25, dd (10.9, 3.9); 4.09, dd (10.9, 12.5)
3 2.82, m 2.81, m 2.72, m 2.74, mOH-5 12.13, s 12.09, s 12.85, s 12.70, s 12.64, s 12.23, s6 5.97, d (2.0) 5.98, d (2.2) 6.81, d (2.2) 5.93, d (2.2) 5.92, d (2.2)OH-6 9.45, s 8.90, sOH-7 5.29, s 5.29, s8 5.91, d (2.0) 5.91, d (2.2) 6.27, d (2.2) 5.82, s 5.84, d (2.2) 5.81, d (2.2) 5.91, s9 2.65, dd (10.4, 13.9)
3.15, dd (4.6, 13.9)2.69, dd (10.4, 13.9)3.16, dd (4.6, 13.9)
2.58, dd (10.7, 14.0)3.15, dd (4.2, 14.0)
7.60, bs 7.69, bs 7.68, bs 2.66, dd (12.5, 13.2); 3.16, dd (13.2, 3.9)
2’ 6.81, bs 6.91, d (2.2) 6.87, d (2.2) 6.87, d (1.5) 6.81, d (2.1) 6.92, d (2.1) 6.65, d (2.0)OH-3’ 5.59, s 5.59, s5’ 6.80, d J = 8.1 6.92, d (8.4) 6.91, d (8.4) 7.05, d J = 7.5 6.85, d (8.1) 6.94, d (8.5) 6.79, d (8.3)6’ 6.71, brd J = 8.1 7.05, dd (2.2, 8.4) 7.02, dd (8.4, 2.2) 6.91, dd J = 1.5,
7.56.78, dd (8.1, 2.1) 7.10, dd (8.5, 2.1) 6.60, dd (8.3, 2.0)
OCH3 3.88, s 3.82, s 3.81, s 3.93, s 3.92, s 3.80, s 3.88, sOCH3 3.94, sOAc-3’ 2.31, s 2.26, sOAc-7 2.39, sOAc-5 2.3,1 s
Table 4.. 13C NMR (125 MHz) Data for Compounds 3, 3A, 3B, 6, 7, 7A and 8 (in CDCl3)
position 3 3A 3B 6 7 7A 82 69.1, CH2 69.1, CH2 69.4, CH2 67.50, CH2 67.45, CH2 67.59, CH2 69.77, CH2
3 46.7, CH 46.9, CH 48.3, CH 127.38, C 125.26, C 47.03, CH4 197.9, C 200.3, C 190.9, C 185.49, C 184.76, C 207.14, C4a 102.8, C 102.9, C 102.6, C 102.64, C 104.22, C 108.19, C5 163.7, C 163.4, C 152.9, C 165.15, C 163.75, C 163.37, C6 96.6, CH 96.9, CH 105.6, CH 96.80, C 96.79, CH 96.84, C 110.85, C7 164.0, C 164.4, C 150.6, C 168.75, C 165.50, C 137.11, C8 94.9, CH 95.3, CH 101.7, CH 94.52, CH 95.05, CH 95.37, CH 94.45, CH8a 164.9, C 164.9, C 164.3, C 162.91, C 163.75, C 166.87, C9 32.2, CH2 32.0, CH2 31.7, CH2 136.84, CH 137.32, CH 136.12, CH 32.74, CH2
1’ 131.4, C 131.0, C 131.0, C 123.78, C 130.49, C 126.60, C2’ 115.2, CH 112.9, CH 123.9, CH 111.87, CH 115.94, CH 124.91, CH 111.35, CH3’ 145.8, C 150.6, C 152.7, C 146.72, C 139.24, C 138.80, C4’ 145.5, C 150.2, C 150.1, C 150.31, C 151.49, C 154.62, C5’ 111.0, CH 123.8, CH 112.9, CH 122.59, CH 110.62, CH 112.66, CH 116.54, CH6’ 120.4, CH 127.6, CH 127.6, CH 116.74, CH 123.59, CH 129.95, CH 121.74, CHOCH3 56.0, CH3 56.2, CH3 56.4, CH3 56.12, CH3 56.06, CH3 56.17, CH3 56.13, CH3
OCH3 61.97, CH3
OAc 20.9, CH3
168.2, C21.4, CH3 169.8, C
20.67, CH3
169.00, COAc 20.9, CH3
169.3, C
Table 5. The Effects of Compounds 6 and 7A on PGE2 Release from HCA7 Cells
compound PGE2 (pg/ml) (n = 3) SD(±) % inhibition (%)control/no treatment 3800 330compound 6 3026 170c 20a
compound 7A 3384 164c 11a
aspirin (1 mM) 3074 152c 19a
DMSO (0.3%)b 4013 119 no inhibitiond
a In comparison to control; mean SD n = 3 representing three separate experiments, samples run in duplicate. b Vehicle control. c Statistically significant difference (p < 0.05) in comparison to the control/no treatment. For statistical analysis One-way ANOVA with post hoc LSD test was performed. d PGE-2 release greater than the control by 6%; meanSD n=1, sample run in duplicate.
Figure 1. Selected NOESY correlations for compound 1
Figure 2. Modelled and experimental ECD spectra of compound 2A
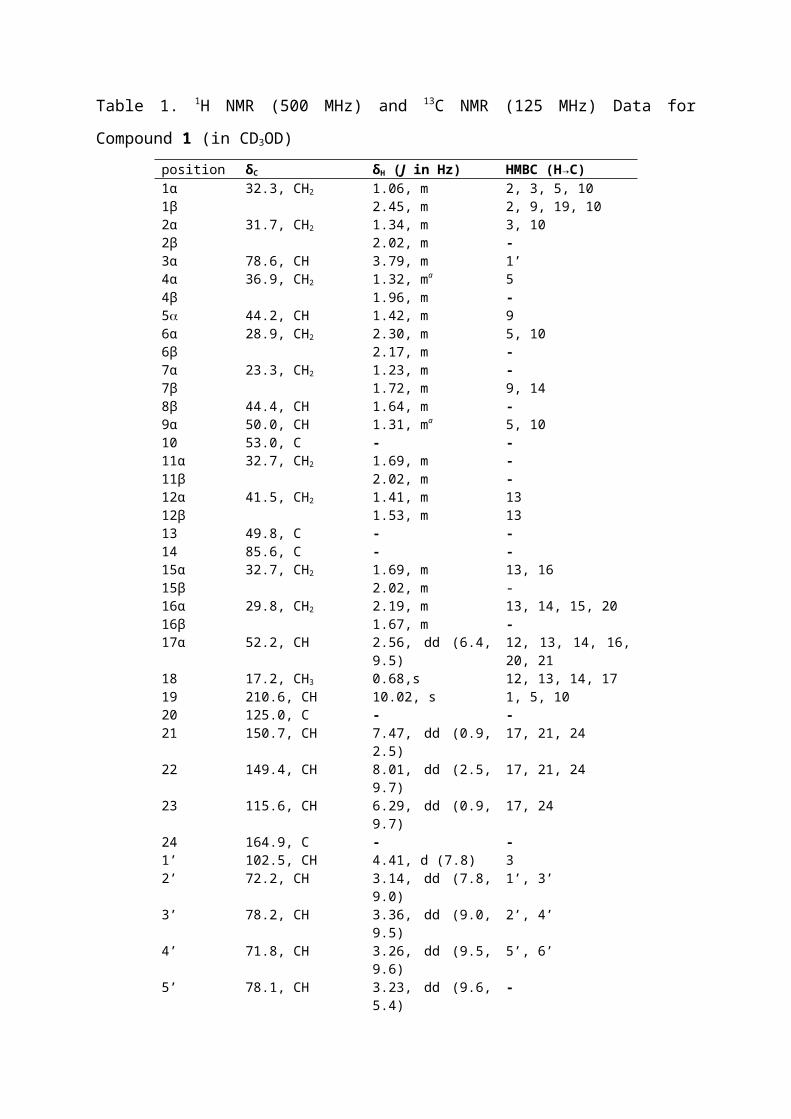
Table of Contents/Abstract Graphic