epubs.surrey.ac.ukepubs.surrey.ac.uk/812346/1/6105467_final_thesis_2016_10... · web viewkey...
TRANSCRIPT

University Of Surrey
Commercialising Zero Carbon Housing Design: Towards an
Economic and Socio-Technically Informed Approach
By
Rehan Ayoob Khodabuccus
Academic Supervisors: Dr K. Burningham and Dr J. Lee
Industrial Supervisor: Bill Dunster, OBE
This Report constitutes the Final Thesis Submission in fulfilment of
the ENG D Program
(URN: 6105467)
© Rehan Ayoob Khodabuccus 2016
i

Declaration of Originality
This thesis and the work to which it refers are the results of my own efforts. Any
ideas, data, images or text resulting from the work of others (whether published or
unpublished) are fully identified as such within the work and attributed to their
originator in the text, bibliography or in footnotes. This thesis has not been
submitted in whole or in part for any other academic degree or professional
qualification.
I agree that the University has the right to submit my work to the plagiarism
detection service TurnitinUK for originality checks. Whether or not drafts have
been so-assessed, the University reserves the right to require an electronic
version of the final document (as submitted) for assessment as above.
Signed:
Rehan Ayoob Khodabuccus
ii

Acknowledgments
The doctorate forms part of the’ Industrial Doctorate Centre’ awards and is funded
by the ‘EPSRC’, ‘The University of Surrey’ and Zedfactory Europe Ltd (sponsor
organisation).
The author would like to acknowledge the contribution of the academic and
industrial supervisors as well as the ‘Centre for Environmental Strategy’ and the
‘Industrial Doctorate Centre’ team.
The author of this thesis would also like to acknowledge to contribution of
Zedfactory Europe Ltd and HiminZED Ltd. IPR referenced in this thesis remain the
property of HiminZED Clean Energy Holdings Ltd, Zedfactory Europe Ltd and the
University of Surrey as per the IDC contract.
iii

Table of Contents
Title Page i
Declaration of Originality ii
Acknowledgements iii
Table of Contents iv
List of Tables and Figures xiii
Abstract xiv
Executive Summary xv
Chapter 1
Introduction to the Research and Thesis
1.0 Background: defining the problem space and establishing its importance 1
1.1 Structuring the research: ‘Diagnose, Design and Evaluate’ 3
1.2 Research aims and objectives 6
1.2.1 Research aim 6
1.2.2 Research objectives 8
1.3 Chapter Guide 8
Chapter 2Literature Review
2.1 Introduction 11
2.2 Socio-technical innovation and transitions theory: Developing a framework for understanding the challenges of decarbonising the new build housing sector 11
iv

2.2.1 Introduction 11
2.2.2 Socio-technical systems theory 12
2.2.3 The sociology of technology and socio-technical systems 12
2.2.4 Major socio-technical changes 13
2.2.5 Technical Innovation Systems (TIS) 17
2.3 The MLP: Understanding radical socio-technical change and spheres of interaction in socio-technical systems 20
2.3.1 Radical and systemic socio-technical change 21
2.3.2 The role of transitions planning 23
2.4 An analytical tool: The MLP 24
2.5 Technical niches 25
2.5.1 Processes and success at the niche level 27
2.5.2 Patterns of breakthrough 28
2.5.3 Strategic actor related patterns 31
2.5.4 Zero carbon homes at the niche level 31
2.6 Socio-technical regimes (the meso level) 33
2.6.1 Actor groups within the regime 33
2.6.2 Development trajectories 34
2.6.3 Problems faced by niche housing innovations at the regime
level 35
2.6.4 Challenges for decarbonisation at the regime level 39
2.7 The macro-level landscape 40
2.7.1 Macro level as a stimulus for innovation 41
2.8 Criticisms of the MLP in relation to this research 42
v

Chapter 3
Applying the Socio-Technical Review to the Housing Regime
3.1 Introduction 48
3.2 Imagining the future system and contrasting the existing one 48
3.3 Analysing the house building regime 53
3.3.1 Identifying the sub-regimes and actors 54
3.3.2 Defining the housing market sub-regime 55
3.4 Understanding the processes in the sub regime: The new build development process 57
3.4.1 Commercial residential property development process and its
actors 58
3.4.2 Stage 1: Initiation 59
3.4.3 Stage 2: Evaluation 60
3.4.5 Stage 3: Acquisition 61
3.4.6 Stage 4: Design and Costing 61
3.4.7 Stage 5: Permissions 62
3.4.8 Stage 6: Commitment 64
3.4.9 Stage 7: Implementation 64
3.4.10 Stage 8: Disposal 65
3.5 Specific issues relating to zero carbon development 65
3.5.1 Cost based issues 67
3.5.2 Market potential and demand 68 3.5.3 Development risk
69
3.6 Policy sub- regime: Housing policy and renewable energy 69
3.6.1 Energy in buildings policy 70
3.6.2 The ‘Code for Sustainable Homes’ 71vi

3.6.3 The reality of the CfSH 73
3.6.4 Other policy drivers 76
3.7 Challenges for a decarbonised residential development sector 77
3.7.1 Costs 77
3.7.2 Demand 78
3.7.3 Construction techniques 78
3.7.4 Existing research and knowledge gaps 79
3.8 Current methods of designing sustainable buildings 82
3.8.1 Problems in current methods of designing sustainable buildings
86
3.9 Optimising the design of sustainable buildings from a key stakeholder perspective 87
3.10 Conclusion to literature review 88
Chapter 4
Methodology: Optimising a Zero Carbon Home
4.0 Introduction 92
4.1 Developing an enhanced methodology 93
4.2 House type design96
4.3 Building physics 98
4.3.1 Thermal and electrical load modelling 98
4.3.2 Internal gains 98
4.3.3 Heat Loss, insulation and thermal bridges 100
4.3.4 Ventilation heat loss 102
4.3.5 Thermal mass 103
4.3.6 Hot water consumption and energy demand 105
vii
4.3.7 Appliance and electrical loads 105
4.4 Optimising the zero carbon design using the key design parameters 106
4.4.1 Renewable energy technology outputs 107
4.4.2 Model data, parametric analysis and verification 107
4.5 Techno-economic performance109
4.5.1 Introduction to the techno-economic model 110
4.5.2 Technological inputs/ assumptions to generate cash flow
forecasts 110
4.5.3 Inflation, CAGR and Cash flow projections 112
4.5.4 The net benefits or deficits model 113
4.5.5 Self-funding calculation 113
4.5.6 Additional calculations: funding methods 113
4.5.7 Self-funding net zero energy bills 114
4.5.8 Standard investment appraisal analysis 114
4.5.9 Simple payback 115
4.5.10 Net Present Value (NPV) 115
4.5.11 Internal Rate of Return (IRR) 118
Chapter 5
Social Research Methodology
5.1 Introduction 119
5.1.1 Research aim and objectives 119
5.1.2 Research design 120
5.1.3 Qualitative research design 121
5.1.4 Data Treatment 125
5.1.5 Sample selection 126viii

5.1.6 Data recording 130
5.1.7 Ethics and safety 130
5.2 Case study research 131
5.3 Case study design 132
Chapter 6
The Optimised Zero Carbon Home and Stakeholder Opinions on its Viability
6.1 Introduction 134
6.2 Section 1: Energy balances, cost savings and life cycle costing of the optimised design 134
6.2.1 Format and data presentation 134
6.3 House type and dimensions 135
6.4 Construction system 136
6.4.1 Discounting SIPS systems from the study 136
6.4.2 Discounting ICF wall systems from the study 139
6.4.3 Using the timber framing method to overcome issues with ICF and
SIPS 141
6.4.4 Timber System 143
6.5 Insulation strategy147
6.6 Thermal bridging 149
6.7 Thermal mass 149
6.8 Windows 150
6.9 Renewable energy platforms 151
6.9.1 Outputs from system 4: PV system 153
6.9.2 Heating and hot water demand 154
6.9.3 Hot Water Energy Usage 154
ix
6.9.4 Unregulated energy load data 155
6.9.5 Peak load calculations 156
6.9.6 Seasonal loads 157
6.9.7 Summary table 159
6.9.8 Verification 159
6.10 Economic Modelling: Wall construction 160
6.11 Economic Modelling: Cost benefit analysis of the building fabric optimisation161
6.12 Economic Modelling: Energy systems 163
6.12.1 Integrated PV systems 165
6.13 Optimised cost summary168
6.13.1 Total building costs 168
6.14 Lifetime Cost benefits 169
6.15 Financial Analysis 176
6.15.1 Traditional Investment Appraisal Tools 177
6.15.2 Key Findings 182
6.15.3 Investment Appraisal - NPV, IRR 184
6.15.4 Mortgage funded Investment Appraisal - NPV, IRR 185
6.16 Discussion 185
6.16.1 Decarbonisation must be maximised to include all carbon
emissions 186
6.16.2 Reduction and Simplification of Technologies 187
6.16.3 Cost Reduction 190
6.16.4 Economic justification of additional costs 191
6.16.5 Conclusion 193
x

Chapter 7
Ethnographic Research Relating to the Feasibility of the Design
7.1 Cost based issues: Economics and investment returns 196
7.1.1 Exceptions to cost based issues 204
7.1.2 Issues with tariff backed models 205
7.1.3 Issues with traditional funding and other methods of investment
206
7.2 Market Potential and Demand 209
7.2.1 Innovation and demand 209
7.2.2 Improvements in usability 214
7.3 Instances where lower returns are acceptable 215
7.4 Development Risk 216
7.5 Additional policy based issues 222
7.6 Issues with skill sets, roles and responsibilities 225
7.7 Structural barriers 228
7.7.1 Banking and valuation 228
7.8 Illustrating the research findings 233
Chapter 8
Case Study Research: Contextualising the Results within the Development Process
8.1 Introduction 234
8.1.1 Initiation phase 234
8.1.2 Project evaluation phase 235
xi

8.1.3 Acquisition 237
8.1.4 Detailed design and costing 237
8.1.5 Permissions 240
8.1.6 Commitment 241
8.1.7 Implementation 243
8.1.8 Disposal stage 244
Chapter 9
Discussions and Conclusions
9.0 Concluding the empirical research phase 247
9.1 Revisiting the MLP: how did the MLP help and what are the future implications of using the MLP in this way? 252
9.2 What was learnt from using the MLP to inform design decisions: Use of the MLP 252
9.3 Using the MLP to inform design decisions: Macro-level drivers and barriers 255
9.4 Using the MLP to inform design decisions: Meso-level (regime level) drivers and barriers 256
9.4.1 Using the MLP to inform design decisions: Niche level 260
9.4.2 Evaluating the MLP for informing design 261
9.5 Conclusion: How the MLP was used in this Research 264
9.5.1 Conclusion: How this Research informs the literature 269
9.6 Further research developments272
9.6.1 Alternative routes to market 273
9.6.2 Evolution of the optimised design 273
10 References 278
xii

xiii

Table 3.1: Socio-Technical System for Domestic Energy Generation 49Table 3.2: UK Build Costs for Zero Carbon Homes 77Table 4.1: Solar Irradiance 99Table 4.2: FITs Rates 111Table 4.3: Compound Annual Growth Rates (CAGR) 112Table 5.1: Respondent List 128Table 6.1: Wall and Roof Build-up 144Table 6.2: Fourteen Energy Systems 151Table 6.3: Energy Systems 153Table 6.4: PVGIS Outputs 153Table 6.5: Hot Water Usage 155Table 6.6 Hot Water Usage Per Person 155Table 6.7: Electrical Appliance Loads 156Table 6.8: Peak Thermal Load 156Table 6.9: Annual Load Profiles for the Optimised Design 158Table 6.10: Energy Summary 159Table 6.11: TRNSYS Model 160Table 6.12: Insulation Cost Benfit Analysis 162Table 6.13: Technology Platforms 163Table 6.14: Costs of the Complete Building 169Table 6.15: Net Benefit Calculation including Mortgage Costs and Avoided Costs 170Table 6.16: Net Benefit Calculation Excluding Avoided Costs 171Table 6.17: Net Benefit Calculation Excluding FITs 172Table 6.18: CAGR 178Table 6.19: NPV and IRR for Capital Funded Model 184Table 6.20: NPVand IRR for Mortgage Funded Model 185Table 6.21: Comparative Costs 190
Figure 1.1 ‘Diagnose, design and evaluate’ methodology 4Figure 2.1: Nesting of the Levels in the MLP 24 & 53Figure 3.1: Regression of the Zero Carbon Standard 75Figure 6.1: Typical Wall build up 144Figure 6.2: Wall and Roof Build-up under Integrated PV panels 145Figure 6.3 : Wall and Floor Build-up under North Roof 145Figure 6.4 : Spaces Underneath the Integrated PV Roof 146Figure 6.5: Insulated Floor Slab and Foundation Build up 148Figure 6.6: Section Through Foundation Detail 148Figure 6.7: Energy Production Versus Energy Demand 159Figure 6.8: Integrated Roofing Panel and System Installation Details 167Figure 6.9: Monthly cash flows and avoided costs. 173Figure 6.10:Contribution to net monthly benefit from income/cost savings 173Figure 6.11. Short, mid and long term viability under different income scenarios. 174Figure 6.12: Capital Funded 8% Price Escalator 179Figure 6.13: Capital Funded 5% Price Escalator 179Figure 6.14: Capital Funded 3% Price Escalator 179Figure 6.15: Mortgage Funded 8% Price Escalator 181Figure 6.16: Mortgage Funded 5% Price Escalator 181Figure 6.17: Mortgage Funded 3% Price Escalator 181Figure 6.18: Capital Funded without Policy Support 183Figure 6.19: Mortgage Funded without Policy Support 183Figure 9.0: MVHR and Space Heating Distribution 274Figure 9.1: Detailed Wall Build-up 275Figure 9.2: Detailed Wall Plan 275Figure 9.3: Typical Floor Build-Up 276
List of Figures Page
List of Tables
xiv
Abstract
Implementing zero carbon homes within commercial housing developments has
proven difficult. This has resulted in a stagnated zero carbon housing sector and a
lack of truly innovative designs within national house builder portfolios. Key
industry stakeholders justify this by reference to a number of economic,
regulatory, market, technological and structural based issues. This research
develops an approach to zero carbon homes that brings design and commercial
perspectives together to address these major issues. Out of this approach, an
optimised design with a unique economic model has been developed. The
economics of this design challenge the widely accepted notions of house price
and affordability in traditional builds. The research findings are presented through
a life cycle cost analysis. A significant finding from this research is that zero
carbon homes could be better marketed on economic rather than environmental
benefits so long as the user practice, technological and structural barriers are also
addressed at the design stage.
An exploration of stakeholder attitudes towards the mainstream take up is also
carried out. It identifies and positions the key stakeholders involved in the
implementation process using the Multi-Level Perspective (MLP) and Transitions
Theory, generating a better understanding of what and who is required to
transition the sector towards decarbonisation. In depth interviews and an
observation study were conducted with these participants. This section of the
research examines stakeholders opinions on whether the optimised zero carbon
home is commercially viable. New insights are generated and existing insights
from the literature are contextualised using the optimised design. This creates an
analysis of its commercial potential. The research concludes by demonstrating the
need to conduct further studies into wider systemic issues and to explore
alternative routes to market.
xv

Executive Summary
1.1 Defining the Problem
The background to this research arises from the specific need to reduce domestic
sector carbon emissions in the UK. The sector is of particular importance to
developing a low carbon economy as, according to the ‘DUKE’S 2012, over 25%
of all carbon emissions can be attributed to this sector. Electricity consumption by
the domestic sector is the highest of all, with 32% of the total demand attributed
here.
A core component of the domestic emission sector is the new build market as
each additional new home exacerbates the problem. The new build subsector is
the focus of this research. In this subsector zero carbon homes offer a solution to
the problem, however, the diffusion of zero carbon homes has been too slow to
make a meaningful impact on reducing emissions (Callcutt, 2007; Mlecnik, 2010;
Osmani and O’Reilly, 2009). Creating viable markets for commercial house
builders has been regularly cited as the core problem but creating solutions to this
have proven more difficult than first envisaged by policy makers (Miles and
Whitehouse, 2013). Many of these problems can be traced back to the lack of
defined plans for delivering the zero carbon targets in new build homes (Goodchild
and Walshaw, 2011).
The Government and the ‘Green Building Council’ wanted architects, designers
and builders to create new thinking that broke away from incremental changes but
did not define how this was to happen (House of Commons, 2008; Goodchild and
Walshaw, 2011). These actors envisaged that radical changes in technology and
design would be industry led and change would occur based on target setting
alone (Goodchild and Walshaw, 2011). The result of this thinking was that
ambitious targets were set but ways of achieving them were ill defined (Goodchild
and Walshaw, 2011). This problem is widely accepted in both the literature and
industry and has manifested itself in the barriers to mainstreaming zero carbon
homes (Goodchild and Walshaw, 2011; Osmani and O’Reilly, 2009; Seyfang,
2009). This has created a lack of standardisation of zero carbon design which has
xvi

hampered economic improvements and their commercial viability (Goodchild and
Walshaw, 2011). Consequently, many zero carbon homes are still locked into
green niches with little prospect of breaking through to the mainstream market.
Issues identified by researchers affecting the mainstreaming of these green niches
point towards political, financial, technical, market and cultural barriers (Callcutt,
2007; Mlecnik, 2010; Ball, 2010; Osmani and O’Reilly, 2009; Goodier and Pan,
2010).
1.2 Designing Zero Carbon Homes
When designing zero carbon homes it is the responsibility of the architect and the
engineer to design a building that optimises the electrical, heating and cooling
loads (Lechner, 2008; Dunster et al., 2008). As such there is an implicit design
challenge to address commercial barriers as much as possible at the design
phase. If architects and engineers are educated in this design challenge from
commercial stakeholder perspectives it may be possible to develop niche zero
carbon homes with a greater chance of breaking through to the commercial
market. Lechner (2008) and Dunster et al. (2008) develop the two most
comprehensive design methods to tackle zero carbon design, however, they do so
from a technical perspective. This means that neither of their approaches develop
solutions to the commercial stakeholder objections inhibiting commercial roll outs
of zero carbon homes.
This study proposes that incorporating key commercial barriers and stakeholder
objections into the design choices that architects and engineers make may help
improve implementation rates. The goal is to bridge the design-knowledge gap
between the commercial residential development sector and technical design so
that more commercially viable zero carbon homes can be created.
1.3 Thesis format
This thesis is divided into three sections following a ‘Diagnose, design and
evaluate’ methodology. This format firstly identifies problems to diagnose the
issues in the research field. It then creates a design methodology and empirically
xvii

tests a commercially optimised zero carbon home, evaluating it with commercial
stakeholders.
The first component focuses on diagnosing the problem. It does this by developing
an understanding of the main issues within the problem area through a review of
the literature. It starts with a review of relevant socio-technical change theory and
then applies this to the house building sector. The theory is then used to develop
an understanding of the problem from both the practical commercial perspective
and the conceptual academic perspective.
The second component of the research focuses on design aspects of the problem.
It identifies critical design objectives required to develop an optimised housing
model based on the socio-technical review findings. Critical to this research was
the development of a techno-economic model which was used to shape design
through integration and substitution of building materials and the incorporation of
life cycle costing. The techno-economic model for the reduced energy demand
was then capitalised and an allowance made for the bought in energy requirement
during times of insufficient renewable production as well as a cost saving for the
produced electricity. This was used to calculate the annual net benefit for the zero
carbon design. A further calculation was also made in order to see if removing
avoided costs from the equation could create a model that was effectively net of
energy costs and self-funding.
The final component of the research is an evaluation of the design with the
commercial stakeholders identified in the first part of the research. Thirty four
respondents were interviewed across a number of key stakeholder groups
including commercial builders, architects, estate agents, funders, investors and
lenders. The aim was to develop a rich understanding of potential inhibitors,
drivers and attitudes towards commercialising the optimised housing design from
their perspectives, contrasting them with the literature findings.
1.4 Using socio-technical theory to shape design
Socio-technical theory was used to develop a set of design objectives which would
augment existing best practice in zero carbon design. It did this by identifying and
xviii

positioning stakeholders within an analytical framework and incorporating
perspectives from a wide pool of stakeholders. This enabled the identification of
additional barriers and drivers to improve the design process and create the
potential to optimise a niche zero carbon home.
The main benefits from using a socio-technical framework prior to designing the
optimised home were rooted in identifying wider stakeholder issues. This
prevented the design from taking a slightly myopic view of the market barriers or
from failing to leverage the main drivers available. It also assisted in identifying
additional barriers to commercial roll-outs present in the wider systemic
environment. The result of this process was the development of an optimised zero
carbon home.
1.5 Development of the optimised design objectives
Lechner (2008) and Dunster et al. (2008) state that architects should take the lead
on developing houses that are super-insulated, airtight, have properly oriented
windows, use correct U-value assumption, utilise passive gains and solar gains,
have highly efficient appliances, low energy lighting and maximise the use of
renewable technologies (Lechner, 2008; Dunster et al., 2008).
To achieve the aims of this research an enhanced design philosophy was
developed to enhance Lechner (2008) and Dunster et al. (2008) models of zero
carbon design by integrating findings from the socio-technical review. The design
philosophy incorporated the principles of good residential property development,
addressing socio-technical barriers and adopting best practice in zero carbon
design. The design philosophy was used to create design objectives to optimise a
zero carbon home. The design objectives are detailed below;
1.) Maximise decarbonisation above regulatory standards. Zero carbon homes
should offset the entire annual energy load of the building via grid connected
microgeneration technologies to make maximum impact in decarbonising the
sector by avoiding unaccounted for emissions. It is important to offset all carbon
emissions and exceed minimum regulatory standards because unregulated
energy loads account for approximately one third of domestic carbon emissions.
xix

As such, a zero carbon home under regulatory standards would still emit around
one tonne or carbon per annum. Clearly this is not carbon neutral.
2.) Reduce and Simplify. The number of additional technologies required to create
the zero carbon home should be minimised to reduce both costs and the
requirement for user practice change. Technologies that are easy to use when
compared to traditional heating and electrical systems, and have a documented
history of reliability should be prioritised. The literature review highlighted that zero
carbon homes often require technologies that users are not comfortable using or
that require significant user practice change. Thus, in addition to meeting
commercial objects, simplification of technology will place user practice at the
forefront of design. The end house type must be as simple to use or more
automated then traditional control systems.
3.) Cost reduction. Keeping costs in line with a building built to current building
regulations is essential to attract commercial developers. Any over and above
costs greater than this benchmark much be kept as low as possible. Whilst
eliminating over and above costs is an ultimate aim, due to zero carbon homes
requiring additional technologies and materials it is acknowledged that a zero
carbon home is likely to still be more expensive, even after cost reduction has
taken place.
4.) Justifying additional costs. Any additional costs that cannot be offset must be
economically justified against running costs reductions or incomes generated.
Designs should seek to balance additional costs with income generating
microgeneration technologies supported by government initiatives either in the
form of FITs or grants. A microgeneration led approach is proposed for this
purpose in order to develop zero carbon homes that could function on a single unit
basis that also generate maximum investment returns for the owner. There are
two methods for achieving this. The first is based on offsetting operational costs
such as reducing heating bills through additional insulation and reducing electrical
bills through renewable energy generation. This second method is based on
utilising renewable energy policy designed to provide a return on investment and
excluding technologies that cannot justify their additional capital expenditure.
xx
1.6 Optimising a zero carbon home using the design objectives
A detached 4 bedroom home was chosen as the basis for comparison. This was
due to the fact that larger detached houses are more difficult to design to zero
carbon standards due to the lack of party walls and increased envelope area.
They are also likely to be the most costly building typology due to the structural
requirements. As such successfully developing a detached model would better
inform the design of other typologies then vice-versa. An existing zero carbon
housing design created by Zedfactory architects using the ZED standards
approach was chosen as the baseline for optimisation. The house type selected
for optimisation was considered economically unviable by some developers in the
past so offered a good opportunity to observe the potential of the optimisation
process for improving commercial uptake.
A systematic and methodical approach was taken to the optimisation process.
Firstly the building fabric was optimised to identify the most cost effective methods
for the wall, roof and floor construction. This included optimising the:
o Construction system
o Insulation strategy for wall construction
o Thermal bridging reduction
o Incorporating thermal mass
Secondly, renewable energy systems were developed to satisfy the building
energy loads. The aim was to use as few technologies as possible to reduce costs
and simplify the systems developed. Fourteen renewable energy platforms were
developed and these were rationalised to four technically and economically viable
solutions.
The effect of changing an element on thermal and energy performance was
observed alongside the implementation cost and the life cycle cost. Different
permutations were used to establish technically viable options and a design freeze
imposed when the building met the zero carbon criteria. This enabled the
development of the fourteen technically viable solutions to be determined. These
xxi

solutions were then listed and ranked in terms of implementation costs and life
cycle costing. Different ways of achieving the same performance using different
materials or combinations of technologies and materials were used to further
optimise the building elements by interchanging key attributes from each solution.
The effect on energy performance was then noted alongside the effect on life
cycle costs. This enabled the interplays between performance, implementation
cost and life cycle cost to be observed and the trade-offs between reducing
energy consumption below a certain level against increasing renewable energy
production observed. This created the final four design solutions. From these
technically and economically optimised designs a final design was selected. This
final design was used in the empirical interview and observation study with
commercial stakeholders.
1.7 Summary of findings: The contribution of socio-technical theory
The use of a socio-technical framework was instrumental to optimising the design
by enabling a wider selection of stakeholder issues to be included. The use of
socio-technical theory identified that initialising a commercial roll out of an
optimised zero carbon home will be more problematic than just incorporating
stakeholder barriers into design. There were many critical issues identified in the
wider actors that needed addressing before the design can be commercially
accepted. This includes changes within many of the actor group norms to create
an environment that enables the additional benefits from the optimised design to
be realised by both developers and consumers. Without development in these
areas of the socio-technical environment zero carbon housing markets will
continue to stagnate.
The use of socio-technical theory in the research process was instrumental in
identifying how to approach zero carbon design from a different perspective and
where deep rooted systemic change is required. This research should thus help
future design iterations, policy makers and socio-technical transition practitioners
focus their efforts on addressing systemic barriers so that a decarbonised sector
xxii

could become a commercial reality. Addressing these barriers will require
assisting the main actor groups to adapt to new ways of thinking.
1.8 Summary of findings: Optimisation the process
Addressing commercial barriers to zero carbon homes to improve the potential for
developer buy in is essential to developing a zero carbon new build sector. Cost is
a major barrier and whilst it is inherent to zero carbon design that costs are higher,
through adopting the material substitution, simplification and tariff backed
methodology in this research it is possible to significantly reduce costs. By
following a policy backed approached to design, the reduced costs can be justified
by additional incomes generated by the technologies. The optimised design
developed in this study goes further still by demonstrating that these residual over
and above costs can be offset entirely. As such not only is it possible to develop
lower cost zero carbon homes, it is also possible to develop homes that do not
financially impact home buyers as the running costs would be used to pay down
the mortgage cost attributable to the zero carbon design choices. These benefits
are demonstrated through a techno-economic model. The outcomes of the model
confirm that adopting an optimised design philosophy creates more economically
efficient zero carbon homes.
An additional benefit of the model assists developers. The model shows that the
potential exists to pass all additional costs of building to the higher standard on to
the purchaser without negatively impacting the purchaser. This enables the
developer to build these homes without reducing their bottom line profit. However,
issues identified in the interview and observation study demonstrated that the
current housing market set-up makes this difficult to achieve.
1.9 Summary of findings: The interview and observation process
Based on the responses from stakeholders, most of the major barriers to zero
carbon design observed in the literature will continue to be a problem. Cost will
continue to be the major hurdle because respondents almost unilaterally agreed
that the solution to initiating a zero carbon roll-out is to build high environmental
specification homes for the same cost as building regulation homes. Cost parity xxiii

appeared to be the only way to offset the risk concerns of national builders.
Unfortunately cost parity was not achieved by the optimised design. To achieve
cost parity, economies of scale will be needed but without buy-in from large
national builders it will be near impossible to drive sufficient volume through the
sector to obtain them. When combined with the industry cost structures, this
means it is unlikely the optimised design will become commercially viable before
2016.
This issue was further impacted by policy based concerns. A number of
respondents noted a lack of consistency and clarity in the regulations and
standards. This led many commercial respondents to believe that regulatory
changes would enable them to be able to meet future standards in an easier way,
negating the need for radical departures from established ways of delivering
homes. Regulation was also used by many respondents as a way of justifying a
more cautious approach to innovation, citing the fact that in real terms code 4
regulations will not affect them until 2016 and zero carbon regulations will not
affect them until around 2020. This means that even though low carbon regulation
could be considered imminent, the effect of legislation is not. When the recent
scaling back of the zero carbon definition is also incorporated it seems to provide
justification to this industry perspective. Since the conclusion of the research this
has been borne out in reality with the removal of the code for sustainable homes
in 2015 and a reworking of the zero carbon definition to make it easier to meet.
It is therefore possible to conclude that, given current national builder attitudes
towards zero carbon design and innovation, the market is likely to continue to
stagnate. More worryingly, given the changes in zero carbon definition, best
practice may never be achieved at a commercial scale as national builders will
almost always revert to the regulatory definition. Thus the role for the optimised
design beyond the remit of small scale development is limited as neither current
commercial stakeholder attitudes nor policy support such a design.
This research also identified wider systemic concerns, particularly in the valuation
system. A major concern identified from the analysed empirical data showed that
xxiv

the premiums required by developer respondents were considered unobtainable
due to:
The fact that the optimised design was considered a non-standard product
so it was not considered possible for them to be offered to the market at the
same price point
The fact energy efficiency is limited to the impact it can have on pricing and
purchasing decisions
A lack of understanding in the market about life cycle cost benefits
An inability to capitalise on life cycle costs based on the current valuation
system
Local limits to house prices placing a ceiling on achievable values
The fact new homes are bench marked against existing house prices in a
region
A lack of desire to build innovative homes
Whilst cost and policy based issues were the most prevalent barriers cited across
respondent groups, when the combined responses were analysed, it was possible
to conclude that the real issues relate to conservatism and risk. Firstly, National
builder respondents alluded wanting to build what they have been building
historically and not wanting to innovate. Secondly, lending and funding criteria are
based on existing models and this serves to protect the established designs,
crowding out innovation. As a result new ways of justifying costs and developing
new approaches to business models are not being embraced. This significantly
inhibits the desire to commercialise the optimised design. As such, until policy
mandates change or the mindsets of national builder’s change to allow different
risk profiles to be pursued, the market will not make a step change towards
decarbonisation. Instead incremental change along traditional approaches only
will be achieved.
2.0 Conclusion
What the research conducted in this study set out to achieve was to establish if
commercial barriers could be overcome by innovation in design. What has been
xxv

shown is that even though designs can be optimised to reduce cost barriers,
residual cost uplifts can be justified and impacts on consumers minimised, the
market is not prepared to innovate to this level.
Removing commercial barriers from an optimised design approach alone is thus
not feasible given the resistance in the stakeholder groups and the inertia created
by tried and tested ways of doing. This is not to say that change is not possible but
the speed of change and level of innovation will be far more incremental than
anticipated when developing the optimised the design.
The wider systemic issues in the lending, funding and valuation sectors both
restrict innovation and allow developers to persist with cautious approaches to
innovation. This means that even when commercial barriers are overcome a new
set of issues allow the national house builders to slow down the rate of adoption.
These issues are beyond the scope of an improved design philosophy. These
barriers, that span the political, economic and socio-technical context, create
significant inertia that will prevent the optimised design being commercialised in
the short to midterm as barriers exist in all facets of deliverability. Issues affecting
the commercial roll-out of the optimised design can be summarised as:
Lower predicted levels of return to standard housing developments
Current industry cost structures preventing the cost methodology being
accepted
Risk management practices inhibiting innovation in design and economic
models
A lack of desire to become a market leader in innovation
A lack of research to support commercial levels of demand for the design
An aversion to influencing consumer choice in cost and pricing methods
Inability to price homes beyond current market rates even though the cost
can be justified
xxvi

A lack of understanding of the economic benefits of life cycle costing within
the market actors
A lack of ability to commercialise innovation in life cycle costing within the
finance and banking sectors
As a consequence of these findings the commercialised pursuit of a large scale
zero carbon housing market via the traditional market routes seems improbable at
best. The most likely outcome for the market is that policy will adapt to support
less radical approaches to solving the carbon issues in new build homes. This is
unfortunate given that the market requires clear and consistent regulation in order
to drive innovation through it.
xxvii

Chapter 1
Introduction to the Research and Thesis
1.0 Background: Defining the problem space and establishing its importance
Mitigating climate change is considered one of the greatest challenges facing
modern society as it has the potential to cause significant environmental, social
and economic disruption (Stern, 2007; Mackay, 2009). Mackay (2009) defines
climate change as essentially a carbon problem and carbon as predominantly a
product of energy generation and consumption. Under this logic, the answer to
mitigating climate change must lie in reducing emissions associated with energy
(Mackay, 2009; Jackson, 2009). The UK contribution to carbon reduction across
all sectors is a reduction on the 1990 levels by 34% by 2020 and 80% by 2050
(Climate Change Act, 2008; DECC, 2010(c)). As part of the reduction strategy, the
UK has committed to the EU ‘Renewable Energy Directive 2009’ which requires
15% of UK energy production to be from renewable sources by 2020 (The UK
Renewable Energy Strategy 2009).
The background to this research arises from the specific need to reduce domestic
carbon emissions in the UK. The sector is of particular importance to developing a
low carbon economy as over 25% of all carbon emissions can be attributed to this
sector. According to the ‘DUKE’S report for 2012 electricity consumption by the
domestic sector is the highest of all, with 32% of the total demand attributed here.
The report also attributes 13% of domestic sector emissions to space and water
heating requirements alone (DUKES, 2012). The ‘Renewable Energy Strategy’
(2009) also states that 12% of total energy requirements will need to be supplied
by renewable heat energy, the equivalent of supplying 4 million homes heating
needs using only renewable heat sources (UK Renewables Strategy, 2009).
1

A major component of the domestic emission sector is the new build market and
this subsector is the focus of this research. In this sub-sector the diffusion of zero
carbon homes has been too slow to make a meaningful impact on reducing
emissions (Callcutt, 2007; Mlecnik, 2010; Osmani and O’Reilly, 2009). Creating
viable markets for commercial house builders has been regularly cited as the core
problem but creating solutions to this have proven more difficult than first
envisaged by the policy makers who introduced the Code for Sustainable Homes
in 2007 (Mlecnik, 2010; Osmani and O’Reilly, 2009; Miles and Whitehouse, 2013).
Many of the problems can be traced back to the lack of defined plans for
delivering the zero carbon targets in new build homes (Goodchild and Walshaw,
2011). The Government and the Green Building Council wanted architects,
designers and builders to create new thinking that broke away from incremental
changes but did not define how this was to happen (House of Commons, 2008;
Goodchild and Walshaw, 2011).
Goodchild and Walshaw (2011) state that key actors envisaged radical changes in
technology and design would be industry led and change would happen based on
target setting alone. They also envisioned that innovation and development would
be UK led and did not seek to transfer knowledge from other European schemes
such as Passivhaus, effectively starting from a blank page. The result was that
ambitious targets were set but achieving them was ill defined (Goodchild and
Walshaw, 2011). This ill-defined space in both the definition and prescription of
how to achieve targets created a widely accepted problem, in both the literature
and industry, regarding how to mainstream zero carbon homes (Goodchild and
Walshaw, 2011; Osmani and O’Reilly, 2009; Seyfang, 2009). It ultimately created
a lack of standardisation of zero carbon design which has hampered economic
improvements and their commercial viability (Goodchild and Walshaw, 2011).
Consequently many zero carbon homes are still locked into the green niches they
carved out for themselves with little prospect of breaking through to the
mainstream market. Major issues identified by researchers such as Callcutt
(2007), Mlecnik (2010), Ball (2010), Osmani and O’Reilly (2009), and Goodier and
Pan (2010) affecting the mainstreaming of these green niches point towards
political, financial, technical, market and cultural barriers. Unfortunately there is a
2

distinct lack of appreciation of economic and socio-technical change issues
surrounding zero carbon design in niche market sectors.
When designing sustainable buildings it is the responsibility of the architect and
the engineer to design a building that optimises the electrical, heating and cooling
loads. They select the type of equipment that is used to satisfy the building’s
energy demands (Lechner, 2008; Dunster et al., 2008). Consequently there is an
implicit design challenge to address commercial barriers as much as possible at
the design phase. If architects and engineers are educated in this design
challenge it may be possible to develop niche zero carbon designs with a greater
chance of breaking through to the commercial market.
Lechner (2008) and Dunster et al. (2008) perhaps develop the most
comprehensive design methods which aim to tackle some of the objections to zero
carbon design, however, they do so from a technical and implementation
perspective. Neither fully develop a solution to many of key stakeholder objections
identified by Callcutt (2007), Mlecnik (2010), Ball (2010), Osmani and O’Reilly
(2009), or Goodier and Pan (2010). Also neither takes a socio-technically informed
perspective to commercialisation.
This study proposes that incorporating the main commercial barriers and
stakeholder issues into the design choices of architects and engineers may help
improve implementation rates. The background to this research is therefore to
bridge the design-knowledge gap between the commercial residential
development sector, architects, and engineers so that more commercially viable
sustainable buildings can be created.
1.1 Structuring the research: ‘Diagnose, design and evaluate’
This thesis is divided into three sections following a ‘Diagnose, design and
evaluate’ methodology to firstly identify research problems, create a methodology
and empirically test a commercially optimised zero carbon home. This ‘Diagnose,
design and evaluate’ methodology is detailed in figure 1.1 below.
3

Figure 1.1: ‘Diagnose, design and evaluate’ methodology
The first component focuses on diagnosing the problem. It does this by developing
an understanding of the main issues within the problem area through a review of
the literature. It starts with a review of relevant socio-technical change theory and
then applies this to the house building sector. The theory is then used to develop
an understanding of the problem from both the practical commercial perspective
and the conceptual academic perspective. This creates an in-depth understanding
4
When the optimised design is evaluated do the responses from key stakeholders indicative it is more likely to be adopted. What other issues are
identified from the evaluation phase than can apply to future designs
Design
Evaluate
Diagnose
How does technology in a society change and can understanding the issues regarding social and
technical change better inform achitects, designers and house builders in order to facilitate the
decarbonisation of the new build residential sector
How do we address the socio-technical issues to commercialisation in the design phase? Can an
optimised design be developed based on the findings from the diagnose phase address these
issues
of the problems faced by leading practitioners in the field. This understanding is
then used to build the vocabulary of the research proposal and shapes the
empirical research.
The second component of the research focuses on design aspects of the problem.
It identifies the critical design objectives required to develop an optimised housing
model based on the socio-technical review findings. These main objectives were
used to develop four key components of zero carbon design that should be
incorporated into the design stage of any zero carbon project. These four
components were cost reduction, offsetting the additional ‘over and above costs’
by maximising the use of tariff backed technologies, reduction and simplification of
renewable technologies used to meet demand, and maximising the
decarbonisation of the home over the minimum regulatory requirements.
Critical to this research was the development of a techno-economic model which
was used to shape design through integration and substitution of building
materials and the incorporation of life cycle costing. A technical model was
developed and used to calculate and compare the energy losses of the zero
carbon design with those of a Part L building regulations home. Potential energy
savings were then translated into a monetary benefit which could be attributed to
elements such as the extra insulation, heat recovery technology and improved air
tightness levels. The balances from energy generated via renewable technologies
were then linked to tariff incomes derived from either FITS and/or predicted RHI
returns (accounting for inflation and predicted fuel price escalation). The economic
model developed also assumed that the extra capital costs for zero carbon design
would be passed to the consumer via a higher purchase price. To account for this
the cost uplift for the initial capital outlay was modelled through an extension to the
mortgage payments.
The techno-economic model for the reduced energy demand was then capitalised
and an allowance made for the bought in energy requirement during times of
insufficient renewable production as well as a cost saving for the produced
electricity. This was used to calculate the annual net benefit for the zero carbon
design. This was achieved by capitalising energy flows, comparing energy costs
5

and incomes and comparing energy expenditures to a building regulations home.
A further calculation was also made in order to see if removing avoided costs from
the equation could create a model that was effectively net of energy costs and
self-funding.
The final component of the research is an evaluation of the design with the key
stakeholders identified in first part of the research in order to validate the design
from a commercial stakeholder perspective. This part of the research is based on
a mixed method qualitative approach informed by ethnography conducted with
strategic actors. Thirty four respondents were included in the study involving a
number of key stakeholder actor groups such as commercial builders, architects,
estate agents, funders, investors and lenders. Follow-up meetings were also
attended with some stakeholders. The aim was to develop a rich understanding of
potential inhibitors, drivers and attitudes towards the commercialising the
optimised housing design from a key stakeholder perspective. This part of the
research used the author’s unique position within the sponsor organisation and
development process to gain access to stakeholders and to follow the
development of a potential zero carbon housing project. This generates unique
insights into the research area.
1.2 Research aims and objectives
This section of the thesis defines the research aims and objectives.
1.2.1 Research aim
The aim of this research was to explore the question: ‘How can the commercial
uptake of zero carbon homes be increased?’ This was achieved by looking at how
best to incorporate commercial stakeholder objectives, policy, economics and
socio-technical factors into the design process.
The premise of this research is that zero carbon designs could better meet
commercial stakeholder objectives by integrating socio-technical and commercial
stakeholder perspectives into an optimised housing design. A design methodology
and an optimised design would be developed. This optimised design would then
6

be reviewed by appropriate industry stakeholders to generate discussion to
understand if/ how it could be incorporated into national house builder portfolios.
This research is unique in the way it incorporates three separate bodies of work
into an enhanced design philosophy to progress the field closer to standardisation
and commercial viability, thus helping to mainstream niche zero carbon designs
(Goodchild and Walshaw, 2011; Osmani and O’Reilly, 2009; Seyfang, 2009).
Firstly it examines how innovation occurs in society and applies this to zero
carbon homes. It then furthers research on sustainable building design by Lechner
(2008) and Dunster et al. (2008) to enhance sustainable building design
methodologies. Finally It combines this with work by authors such as Mlecnik
(2010), Goodchild and Walshaw (2011) Osmani and O’Reilly (2009; 2012), Carter
(2007), Miles and Whitehouse (2013), Ball (2010) focused on better definition of
the current barriers to a commercialised zero carbon housing sector.
This research does not compare or contrast different design standards such as
Passive house, nearly zero or zero carbon as this research has already been
considered in (See Dequaire, 2012; Heffernan et al., 2012; Heffernan et al., 2013
for discourse on this subject). Neither does it revisit best practice in sustainable
building design. Instead the rationale for this study is to determine if it is possible
to create more commercially viable designs using existing policy, technology and
market mechanisms and to put the case forward for incorporating a new
perspective into the design phase.
The research was conducted over a period of 48 months from October 2010 to
October 2014 and is based on the main policies at the time of study. The specific
research aims are to:
Improve the design of zero carbon homes by incorporating
knowledge of how technological change occurs within society
Develop an understanding of commercial barriers inhibiting zero
carbon homes to create a design that has a greater potential for
commercialisation
Enhance understanding of commercial zero carbon design to
improve the viability of zero carbon homes in the future7

1.2.2 Research objectives
The objectives of the research are:
To conduct a social, technical and economic analysis of the new
build UK housing environment
To contextualise the issues regarding social and technical change to
zero carbon design to better inform architects, designers and house
builders in order to facilitate the decarbonisation of the new build
residential sector
To optimise a niche zero carbon housing design using this analysis
To conduct a technical-economic analysis of the optimised design to
establish commercial viability and benchmark the zero carbon design
against traditional housing standards
To introduce the design to key industry stakeholders to understand if
the optimised design is commercially viable in the current market
context
1.3 Chapter Guide
This thesis is divided into nine chapters and a references list.
Chapter one above introduces the background to the research, the structure of the
thesis and the research aims and objectives.
Chapter two details findings from the literature search. This chapter introduces the
multi-disciplinary in nature of the research problem and covers the technical,
social, political and economic aspects of commercial house design and building.
This chapter starts by reviewing the theory behind technological change in society
and identifies a framework from which to position the research.
Chapter three uses the analysis from chapter two and applies it specifically to the
housing sector. The aim of this chapter is to understand how applying the
knowledge of technological change in society to the zero carbon housing industry 8

can improve the design process. It identifies research gaps and reviews cutting
edge design principles in zero carbon housing. It concludes by identifying how the
research from chapter two can improve on the shortcomings in current zero
carbon design methods by adopting a key stakeholder perspective.
Chapter four develops an enhanced design philosophy for zero carbon homes.
The enhanced design philosophy developed in this chapter augments best
practice in the field with the aim of developing more commercially optimised zero
carbon homes. The chapter sets out the methodology used to optimise a zero
carbon home, details the methodology used to calculate building physics
parameters how the data was verified. It then details how the technical outputs
were linked to the implementation and lifecycle costs of the building. It also sets
out the financial metrics used in the economic analyses. The concept of using the
net benefits approach to life cycle costing is first introduced in this chapter as a
more effective way to measure the economic potential of zero carbon homes.
Chapter five details the social research methods used to answer the question
‘What are the key stakeholders’ views on the optimised design? Does it address
the obstacles to developing commercial scale zero carbon developments’. It does
this by detailing the two empirical research methods used. The first method was
based on a programme of in-depth interviews and observations with a sample of
commercial stakeholders. The second method was based on a review of case
study data. Both research methods followed an ethnographically informed
approach which is also detailed in this chapter.
Chapter six, chapter seven and chapter eight present the analysed results from
the empirical research phases. Chapter six details the results from the design
optimisation process. Chapter seven presents the analysed results from the in-
depth interview process and chapter eight presents the findings from the case
study research. The findings from chapter eight are contextualised within the
residential development process.
Chapter nine brings the research strands together and concludes the research. It
revisits the framework used to understand technological innovation in society and 9

how this informed design decisions. Chapter nine finishes by highlighting further
research developments arising from the analysed results and makes
recommendations for future research.
Chapter 2
10

Literature Review
2.1 Introduction
This research is multi-disciplinary in nature and covers the technical, social,
political and economic aspects of house design and building. Due to this the
literature review needed to cover a broad range of subjects and position these
within a theoretical framework. Positioning the main aspects of the research
problem within a theoretical framework is critical to focusing the empirical aspects
of the research.
The literature review for this research project follows a specific format. Firstly it
identifies the theoretical field of study, then it identifies a framework to organise
the multiple aspects of the research.
This research is contextualised to the UK house building regime and the critical
design aspects are explored in depth from a more informed theoretical
perspective. Finally this informed approach is developed into a set of criteria which
will be incorporated into a design methodology aimed at improving the
commercialisation of zero carbon homes.
2.2 Socio-technical innovation and transitions theory: Developing a framework for understanding the challenges of decarbonising the new build housing sector
2.2.1 Introduction
This section of the research develops a framework to better understand the
problems faced by housing developers and zero carbon architects when
attempting to solve the research problem. It draws on social theory regarding
innovations as the best way to do this (Bergman et al., 2008).
2.2.2 Socio-technical systems theory11

Understanding technological change in society requires an understanding of the
interplay between society and technology. This interplay is known as the socio-
technical system and how an innovation diffuses into established practices
requires understanding this system. This is often referred to as the sociology of
technology (Geels, 2001; 2004; Raven, 2006; Hughes, 1987; Foxon et al., 2008).
By better understanding the sociology of technology a greater depth of knowledge
can be drawn of how innovations, social practices, science and policy interlink
(Geels, 2001; 2004; Raven, 2006; Hughes, 1987; Foxon et al., 2008). This can
lead to a better understanding of how the challenges facing the integration of zero
carbon design into current commercial practice can be overcome. If this is
achieved more informed design decisions can be taken to help improve the uptake
of zero carbon innovation. The ultimate aim is to understand how to overcome
critical commercial barriers at the design stage to improve the potential of zero
carbon homes to be integrated into society. The next sections of this research
review some main aspects of socio-technical systems and the sociology of
technology.
2.2.3 The sociology of technology and socio-technical systems
Socio-technical systems are defined as complex and adaptive systems that
combine both social and technical elements in a specific system in order to reach
a goal (Nikolic, 2009). The technical elements include machines which perform a
desired function, in this case energy production and consumption from zero
carbon technologies, and the social components including: organisations, users,
producers, laws and policies (Hughes et al., 1987; Nikolic, 2009).
Hughes (1987) considers socio-technical systems, or as he terms them
technological systems, as physical, organisational, scientific and legislative
artefacts that are both socially constructed and shaping of society (Hughes, 1987).
Technological changes can therefore be seen as an amalgamation of
technologies, organisations, resources and pieces of legislation within the
sociology of technology (Geels, 2001; Hughes, 1987).
12
A socio-technical system consists of social and physical networks which interact
with each other (Nikolic, 2009; Hughes, 1987). In a socio-technical system
physical laws and technical realities interact with social networks of legislation and
behaviour. Social networks both act and are enacted upon by each other which
creates the emergent infrastructure and functions the system (Hughes, 1987;
Ottens et al., 2006; Van Dam, 2009; Hughes et al., 1987; Nikolic, 2009; Geels,
2001).
2.2.4 Major socio-technical changes
Major social technological changes involve fundamental changes to behavioural
and cultural practices (Geels, 2001; Foxon et al., 2008; Hughes, 2009; Shove and
Walker, 2007). User practice, policy interventions, technology and social groups
need to change simultaneously in order to prepare the way for new technologies
to emerge and take hold (Geels, 2001; Foxon et al., 2008; Hughes, 2009; Smith et
al., 2010).
When these factors interlink, dominant technologies and designs emerge and form
new configurations which can then compete with the status quo technologies,
eventually taking root and stabilising. This, however, does not occur easily as
significant inertia within the incumbent institutions exists and institutions resist
change (Williamson, 1998; Ostrom, 1994; Geels, 2011).
Understanding these issues is best captured within socio-technical change and
transitions theory. Bergman et al. (2008) consider these bodies of work to firstly
expose the heterogeneity of populations by differentiating firms and individuals ‘by
their innovativeness, resources and preference’ and secondly by looking at the
complex co-evolution of a range of actors and structures such as ‘firms,
consumers, legislation, technologies and infrastructure’. These two areas can then
be positioned within the process of social change to better understand the system
under study (Bergman et al., 2008).
In order to assist in understanding how an innovation that requires major socio-
technical change could be successfully fostered, the development of a framework
that can map a pathway and identify barriers is useful.
13

The challenge for such a framework is how to effectively link people, culture,
technology and the social context in a way that both captures and simplifies the
complexity of transitions theory. This firstly requires developing an understanding
of the leading approaches towards socio-technical transitions before selecting a
framework suitable to understand the complexities of the housing sector.
A review of five main theories from leading researchers in the field of innovation
was conducted. The five main theories analysed were:
1. Technological substitution models 2. Punctuated equilibrium perspective3. Long-wave theory 4. Technical Innovation Systems Approach5. The Multi Level Perspective
(Roger, 2003; Hekkert et al., 2007; Geels 2010; 2011; Ravens, 2006; Hughes, 1987; Freeman and Perez, 1988; Freeman and Louca, 2001)
Technological substitution models primarily advocate using market indicators,
such as market share, to map the declination of the market dominant technologies
and plot the rise of new stars (Christensen, 1997; Rogers, 2003). This is rooted in
marketing and commercial theory but differs from diffusion theory in its adoption of
a ‘David-versus-Goliath’ perspective (Geels, 2010; 2011).
Technological substitution is effective in observing market change, however, key
factors inhibiting change such as tecnological lock-in to the status quo technology
or inertia within the existing system are ignored by its market focus. This causes
the theory to fail in capturing key issues surrounding power, policy, culture,
infrastructure and social practice. Whilst it is simplistic and easy to understand,
thus reducing complexity within the research field, it does not encapsulate the
required breadth of issues facing radical technolocial innovation in the social
context (Geels, 2010; 2011). This means that key social, cultural and strucutral
issues facing zero carbon housing entreprenures are widely ignored. As such
theories which broaden the understanding of innovation within the social-context
and beyond market factors are essential to understanding radical socio-technical
14

change in the housing sector. The first theory reviewed that could potentially do
this was the Punctuated Equilibrium (PE) perspective (Geels, 2010; 2011;
Feeman and Perez, 1988, Freeman and Louca, 2011)
The PE perspective improves upon some of the shortcomings with technological
substitution models by introducing the concept of technological discontinuity
(Anderson and Tushman, 1990; Geels, 2010; 2011). This acknowledges that
existing dominant technologies can be in decline and acknowledges that a period
of new design, competition and substitution will occur when they are being
replaced with new technologies (Geels, 2010; 2011). Within the framework there
is considered to be a period where incremental change is ushered in, a period
where the old systems and ways of doing are replaced with the new. This creates
a passage of time when new technologies ‘ferment’ and a new dominant design
emerges (Anderson and Tushman, 1990; Geels, 2010; 2011). Whilst this improves
upon the Technological substitution model it still does not incorporate the source
of innovation or generate an understanding of where or how radical innovations
develop from (Geels, 2010; 2011). As this research project is looking into socio-
technical change from the innovation level the PE perspective presents a number
of issues in generating a deep enough understanding of the problem area from
multiple perspectives. It also relies too heavily on the technological push aspects
as the cause of the period of fermentation without improving the understanding of
how power, policy, social practice or culture influences it (Anderson and Tushman,
1990; Geels, 2010; 2011). As such the theory was considered to be too focused
on techno-economic factors to effectively elaborate and organise the key social
and technical issues facing a zero carbon housing transition.
Further research identified the theories which took a wider perspective on the
issues facing radical socio-technical change and brought the socialisation of
technology into the core of the theory, rather then in addition to market factors.
One such theory studied was the Long wave theory (LWT) (Feeman and Perez,
1988, Freeman and Louca 2011).
LWT improves upon the issues with the PE perspective and technological
substitution theories by bringing in co-evolutionary concepts relating to new 15

technologies to the social setting (Geels, 2011; Feeman and Perez, 1988,
Freeman and Louca 2011). It thus brings in the concept of transitions at the macro
level (Geels, 2011; Freeman and Louca, 2011). However, whilst the theory
acknowledges that there is interplay between technologies and society, Geels
(2010; 2011) states that it underplays the origins of technological innovations and
does not give enough consideration to how they come to be challenging the
existing status quo. This was considered to be a key issue for transitioning the
housing sector to a lower carbon model.
The LWT also assumes society to be reactive to technological change and
therefore social changes occur as a result of technological innovation (Hekkert et
al., 2011; Geels, 2010; 2011). Whilst acknowledging this link is an improvement
on Technological substitution and PE perspective, it does not address the society
and technology aspects in an integrated manner. The integrated manner, or what
Bikjer (1995) terms as the ‘Socio-Technical Ensemble’, is key to understanding
transitioning the housing sector’. By not adequately dealing with situations where
techno-economic forces are reactive to changes within the socio-institutional
framework it limits the effectiveness in generating deep understanding of radical
change (Geels, 2010; 2011). As such LWT fails to effectively elaborate on the
complexities of far reaching technological change by considering it as just
technology plus society (Bikjer, 1995). This does not improve our understanding of
how power, policy, infrastructure, institutions, social practice or culture can
influence change within the housing sector. It therefore does not effectively
improve the knowledge base of zero carbon housing entrepreneurs or elicit
enough new understanding to address the problems restricting the integration of
zero carbon homes into housing sector.
When researching the technological substitution theory, PE and LWT a common
issue was observed in each. All of these theories fell short in encompassing the
multiple dynamics and actors involved in socio-technical change (Geels, 2010;
2011). This is especially so in relation to environmentally led change or change
focused on achieving a social goal (Geels, 2010; 2011; Freeman and Louca
2011). This is perhaps most evident in the lack of focus on factors which resist
change (Geels, 2010; 2011). The theories discussed above also fail to consider 16

that pursuing a social goal may not necessarily lead to economic improvements
and thus incumbent companies may be reluctant to embrace technologies that
support them (Bikjer, 1995; Hekkert et al., 2011; Geels, 2011). This created a
need to look at theories with a greater emphasis on innovation within the social
context in order to better understand the multiple stakeholders, actor groups and
dynamics within the social context that zero carbon housing operates in. Two
theories better suited to doing this were analysed, the ‘Technical Innovation
Systems (TIS)’ approach and the MLP (Hekkert et al., 2011: Geels, 2010; 2011).
The next section focuses on the TIS and the MLP.
2.2.5 Technical Innovation Systems (TIS)
TIS theory explicitly brings factors relating to resisting change into the thinking.
The TIS approach switches the emphasis of innovation from predominantly market
factors onto the functions of the structures of a technological system (Hekkert et al
2007; 2011). This means that the TIS includes an integrated set of social and
technical elements to innovation within society rather then just considering
econometrics + society (Bikjer 1995; Hekkert et al 2011; Carlsson & Stankievicz,
1991; Geels 2011).
Hekkert et al (2011) define TIS approach as the study of how technologies and
innovations function within a technological system structure, however, they deem
the functions of a system central to understanding change as functions provide the
insight into the performance of a system. They point out that different
technological systems may have very similar structures but function completely
differently to support their viewpoint. They define the structure of the system as
technology, actors, networks and institutions. They define the functions of a
system as:
1. Entrepreneurial activities,
2. Knowledge development,
3. Knowledge exchange,
4. Guidance of the search,
5. Formation of markets,17

6. Mobilization of resources,
7. Counteracting resistance to change.
The structure of the system brings into play the wider components of a system
that affect innovation. It is important to understanding innovation as they consider
it to provide insight into who is involved with how a system functions and thus who
should evaluate the system functions i.e. the key stakeholders. The TIS approach
focuses on the fact that knowledge and competence are key elements to technical
systems alongside the flow of goods and services (Carlsson and Stankiewicz,
1991). As such the TlS approach is a more explicit acknowledgment that society,
institutions and structure have a significant effect on technological change than
the three theories discussed previously. This has important implications for a
housing transition as it includes a far deeper set of stakeholders issues, cultural,
political and social factors.
By acknowledging a structure to a system and the key functions within it, TIS
brings into play the concepts of actors, networks and technological function
(Hekkert et al., 2011). By analysing the structure and then focusing on the
functions within key structural components such as how politics, institutions,
education, research and support organisations affect technology, actors, networks
and institutions; socio-technical factors are considered alongside market factors
(Hekkert et al., 2011; Carlsson & Stankievicz, 1991). As such it is suggested that
market failure to reach an economic solution to a problem should not be the focus
of policy when looking to integrate innovation in the institutional system (Carlsson
& Stankievicz, 1991; Hekkert et al., 2011). This has led to the modern school of
thought in TIS that the focus of policy should be on the processes and not the
structure of the system (Hekkert et al., 2007; 2011). Hekkert et al (2007; 2011)
state that this changes the focus from the components of a system onto what is
actually happening which enables policy to be developed that assists a new
innovation’s integration into the system infrastructure or the generation of a new
TIS. They argue that this can only be done by addressing functional problems.
They also consider the functional approach of TIS to make it feasible to compare
how a system performs with different institutional set-ups. This makes generating
an understanding of the key factors affecting an innovation’s success easier which 18

should deliver a clearer set of policy goals and instruments to assist the innovation
(Hekkert et al., 2007; 2011). This suggests that the TIS is best used to analyse a
technological innovation system to identify where deficiencies or blockages arise
and thus suggest policy instruments that could help address them. As such the
TIS seems an appropriate basis to use for understanding the issues faced by zero
carbon housing design within the housing market system. Unfortunately, whilst
TIS theory is more multi-dimensional and starts to acknowledge some of the key
issues identified with characterising socio technical transitions, such as the role of
actors, infrastructure and policy; problems arise with how it treats radical
technological change.
TIS considers the structure of the system to be relatively stable over time i.e. fairly
static (Hekkert et al., 2011; Geels 2010, 2011). This creates problems when
considering how best to understand the creation of new system structures or how
existing structures evolve (Geels, 2010; 2011). Whilst TIS does acknowledge that
technological trajectories exist which enable existing systems to evolve over time,
it does not give enough attention to how they form, compete and substitute each
other (Geels, 2010; 2011). This creates a number of issues for understanding how
zero carbon housing developers could improve housing designs based on a
deeper understanding of socio-technical issues.
Secondly TIS tends to lean towards suggesting policy based remedies to
blockages preventing innovation. This approach is problematic as the policy
suggestions are not always taken on board by policy makers and when they are,
policies do not always lead to transitioned systems. This is apparent in many
aspect of renewable technology integration in the UK.
Thirdly the cultural and demand side changes are significantly underplayed and
somewhat underdeveloped in the system. This leads to a failure to effectively
account for key aspects in environmentally led socio-technical transitions (Geels,
2011).
Additionally the focus on the functions of a system underplays the role of structure
and thus ignores the struggles occurring between innovations and the status quo
(Geels, 2011). This creates issues when trying to understand the problems facing
a zero carbon housing transition by underplaying the issues occurring at the 19

design and development level. Thus, whilst far more in-depth then technological
substitution, PE and LWT theories, the TIS still has issues in effectively identifying
structural problems, barriers from incumbents and factors preventing the evolution
of the existing system and the development of new systems. More recent works in
TIS have started to pay more attention to the interplay between the status quo and
new innovations, however, the Multi Level Perspective (MLP) has also emerged
as a framework arguably better at doing this (Hekkert et al., 2011, Geels 2011). As
such many authors consider the MLP to be better adapted to understanding
radical socio-technical change than the TIS, such as Geels, 2001; 2004; 2010;
2011 and Genus and Coles (2008). As such, whilst further work on the TIS is
improving its applicability to radical technological change, many of the issues that
need to be addressed have already been tackled by MLP. As such using the MLP
theory in relation to understanding radical change within the housing sector is
considered a better theoretical framework than the more recent additions to TIS.
The next section of this thesis develops the understanding of the MLP before
applying it to the housing sector.
2.3 The MLP: Understanding radical socio-technical change and spheres of interaction in socio-technical systems
This section develops the understanding of the MLP as the best practice way to
understand socio-technical change. It introduces issues regarding radical change
and how the MLP is best placed to develop an understanding of the issues facing
far reaching innovation. This is important as significant deviations from the status
quo face more challenges when understanding change.
To understand the MLP it is important to understand the interactions that
characterise change in a socio-technical system.
Geels (2011), when discussing socio-technical changes in relation to sustainability
transitions, highlight three spheres of interaction with technologies;
1. Policy/ Power/ Politics
20

2. Economics/ Business/ Markets
3. Culture/ Discourse/ Public Opinion
(Geels, 2011 pp25)
To understand how the diffusion of innovation in society is shaped by the
interaction between policies, markets and culture it needs to be looked in a multi-
dimensional way incorporating the dynamics of systemic structural change. MLP
practitioners use such an approach to better understand how to dislodge the
incumbent regime and stimulate a socio-technical transition (Geels, 2001; Foxon
et al., 2008; Hughes, 2009; Smith et al., 2010).
2.3.1 Radical and systemic socio-technical change
Radical and systemic socio-technical change requires the reconfiguration of all the
factors identified by Geels (2011) as well as the interactions between them. Such
change is considered problematic due to stability in the existing system (Geels,
2011).
System stability is usually built up over a long period of time, is coordinated
through the industrial framework and usually widely accepted/ understood (Geels,
2011). This places innovations at both a significant social and economic
disadvantage (Geels, 2001; Foxon et al., 2008; Hughes, 2009; Smith et al., 2010).
Nelson and Winter (1982) suggest this is due to ‘Routinisation’. Becker further
defines routinisation as;
‘patterns, repetitive and persistent, collective, non-deliberate and self-
actuating, of processual nature, context-dependent, and specific, and path
dependent’ (Becker 2002 pp2).
According to Becker (2002) for organisations within complex socio-technical
systems routinisation coordinates, controls and economises resources. The
outcome of this reduces uncertainty in markets. Routinisation therefore provides
stability but also creates inertia (Becker, 2002).
21

Routines are often followed without volition and may well be intrinsic and
unnoticed (Nelson and Winter, 1982; Becker, 2002). For example, the routine of
energy consumption is that energy is available when we require it without having
to give too much forethought as to its origin or to alternative methods of producing
it. Thus, for an incumbent socio-technical system to persist, all that is required is
for the actors and organisations to do nothing different and continue in a business
as usual fashion. For new innovations to take hold, however, current actors must
partake in the more challenging and unsettling activity of changing their existing
routines (Nelson and Winter 1982; Becker 2002).
This routinisation causes the destabilisation of the existing infrastructure to be far
more difficult than maintaining it (Geels, 2001; Nelson and Winter, 1982; Becker,
2002). However, socio-technical changes, despite their difficulty, do occur and
there have been many cases throughout modern history, such as the move from
sailing ships to steam boats or horse and carriages to automobiles (Geels, 2001).
By looking at past transitions, patterns can be observed that may be helpful in
understanding how desired future transitions may be brought about (Geels, 2001;
Foxon et al., 2008; Hughes, 2009; Smith et al., 2010). By creating a structured
plan based on such research, it is possible to better understand the characteristics
of an environment conducive to desired future transitions. A core body of
contrasting and complementary ‘Transitions Theory’ exists surrounding how best
to do this (Geels, 2001; 2005; 2011; Geels and Verbong, 2007; Foxon et al., 2008;
Hughes, 2009; Smith et al., 2010; Bergman et al., 2008).
To understand the processes involved in radical systemic socio-technical change
it is important to look at best practices theory. Current best practice involves taking
a co-evolutionary approach to the dynamics of socio technical change (Geels,
2001; Geels, 2004; Hughes, 2009; Foxon et al., 2008). This allows a planning
framework for an imagined socio-technical system to be developed through the
identification of key actors, patterns and mechanisms involved (Geels, 2001;
2004; Hughes, 2009; Foxon et al., 2008). It involves the study of institutions,
processes, publics and their interactions (Kaghan and Bowker, 2001).
22

Understanding the processes involved in radical socio-technical change is best
embodied in transition pathway theory. Transition pathway theory is a systemic
thinking framework used to understand processes that facilitate major
technological changes in the social environment or within complex socio technical
systems (Geels, 2004; Trist and Murray, 1993).
2.3.2 The role of transitions planning
The focus of planning is to identify how societal change can be moved towards
more sustainable states (Bergman et al., 2008). It is based on imagined actor
responses and interactions between institutions and publics within the socio-
technical system (Geels, 2001; Trist and Murray, 1993; Hughes, 2009; Foxon et
al., 2008). The role of planning and facilitating is not to social engineer but to
imagine what a changed socio-technical system looks like in order to understand
what the decisions of the institutions and publics would be required for such a
change to occur. Consequently the role of planning in socio-technical change
theory is to provide:
Context to the engagement process between institutions and
public(s)
To limit the potential solutions in a difficult problem domain that is
poorly understood
Understand and create insights to barriers and drivers for change
Understand and create insights towards realising a sustainability
based socio-technical transition
(Bergman et al., 2008; Geels, 2001; 2004 2005; 2011; Hughes, 2009; Foxon et al.,
2008).
This study follows Geel’s research into socio-technical change which focuses on
disruptive new technologies and the impact they could have on the surrounding
institutions within the socio-technical system (Geels, 2001; 2004; 2005; 2011). It
focuses on the engagement between publics and institutions and identifies the
policies and engagement activities which are present or maybe required to
increase the likelihood of a change occurring.
23

2.4 An analytical tool: The MLP
Effective transition planning, as defined above, centres on the adoption of a
multilevel perspective (MLP) that incorporates the complexities of social actors,
institutions and infrastructures for integrating technologies into a socio-technical
landscape (Hughes, 2009; Foxon et al., 2008; Geels, 2004). Taking a multi-level
perspective involves applying multiple levels in a hierarchal structure in order to
best incorporate the complexity of multiple actors within society, industry and
government.
Geels (2004) proposes three levels to the MLP analytical framework:
Technical niches
Socio-technical regimes
The macro level landscape.
(Geels, 2004 pp684)
Critical to understanding the MLP is knowing how the individual levels interact and
integrate with each other. This is best described in the ‘Nesting’ of the levels.
Figure 2.1 below shows the ‘nesting’ of the three levels of the MLP and how they
form from niches, to patches of regimes and up to the overarching macro-level
landscape in a hierarchal structure.
Source: Geels 2004
Figure 2.1: Nesting of the Levels in the MLP
24
Within the MLP radical innovations begin in niches (Geels, 2004; Frantzeskaki et
al., 2009; Smith et al., 2010; Bergman, 2008). These are pockets of novelty that
incubate innovations and allow them to develop, often protecting them from
inhibitive market forces i.e. in universities or through grant funding (Geels, 2004;
Frantzeskaki et al., 2009; Smith et al., 2010; Bergman, 2008). For change to occur
innovations need to break out of their niches and shift the system away from its
dominant technologies (Geels, 2004; Frantzeskaki et al., 2009; Smith et al., 2010;
Bergman, 2008). This occurs at the regime level. The regime is the network of
technologies, social rules and infrastructures which creates the current system.
Technology, user practices, infrastructure, policy and scientific knowledge are key
aspects of the system and create the systems rules (Geels, 2004; Frantzeskaki et
al., 2009; Smith et al., 2010; Bergman, 2008). These are, however, shaped by
exogenous factors which form the final level to the MLP: the landscape level. This
level is characterised by the pressure it exerts upon the regime as well as being
beyond the control of the actors within the system (Geels, 2002; 2004).
Once the nesting of the regimes and how the levels form up is understood, it is
possible to develop a deeper understanding of how changes to the socio-technical
system occur through innovations at the Niche level. The following section details
the characteristics of each level of the MLP and how they impact upon zero
carbon housing innovations.
2.5 Technical niches
A niche is a subset of the wider market specifically focused on one technology or
product such as photovoltaics, heat pumps or solar thermal collectors
(Frantzeskaki et al., 2009). Niches develop as a response to a demand from a
market or society and the presence of the demand leads to the formulation of new
ideas, processes or technologies (Frantzeskaki et al., 2009). Technical niches are
a sub-category of niche and are most relevant to this study (Geels, 2004;
Frantzeskaki et al., 2009; Smith et al., 2010). Renewable energy technology
niches can be considered to have developed out of wider societal demands for
low carbon technologies.
25

Niches make up the micro level of the MLP and are crucial to the transition
process (Frantzeskaki et al., 2009). Technical niches can be considered a
prerequisite for any significant departure from the existing regime to occur. All
socio-technical changes can be considered to begin at this level (Geels, 2004;
Foxon et al., 2008; Smith et al., 2010; Frantzeskaki et al., 2009).
Technical niches are protected spaces that allow novel technologies and the
supporting infrastructure to develop. Smith et al. (2010) argue that further
research is required to firstly define what constitutes a technical niche and
secondly to define what actually makes a niche a protected space (Smith et al.,
2010). For example how much protection is required? Is a renewable technology
supported by a tariff enough to create a protected niche or does policy need to
promote the use of the technology more explicitly through targeted messages or
by penalising existing methods of doing things?
Technical niches are important to socio-technical transitions which require radical
technological development. The technical niche allows for the technologies to gain
momentum by protecting innovations from external market forces (Geels, 2004;
Frantzeskaki et al., 2009; Smith et al., 2010). Protected niches thus allow the
incubation of innovations to occur in way that relieves the pressures of wider
environmental selection (Geels and Schott, 2007; Smith et al., 2010). The
photovoltaic industry can be seen as having developed out of a protected
technical niche. When costs were high and prohibitive, government grants were
used to improve the economic viability and allow economies of scale to develop.
This protected the innovation from external market forces by relieving the pricing
pressures in order to stimulate consumer demand (Mendonca, 2010).
It is important to acknowledge that technical niches are more than just protected
markets. This is because they allow momentum to build in ways that go beyond
market forces such as through cultural, regulatory, economical, jurisdictional or
geographical means (Geels and Schott, 2007; Frantzeskaki et al., 2009). As such
niches can protect innovations from a variety of issues that characterise them as
different to the norm.
26

Smith et al. (2010) point out that whilst niches are formative of socio-technical
change, they are not in themselves blueprints for socio-technical change. They
consider niches to be facilitated or inhibited by the wider power structures of the
regime level and not just from the activities at the niche level (Smith et al., 2010).
2.5.1 Processes and success at the niche level
There are different processes that occur at the niche level which shape
technological development and success. These processes are broadly accepted
by Geels (2001; 2011) to be:
The articulation of accepted visions
Social network building to expand the number of actors within the
niche
Further learning and articulation of design to inform, revise and
refine the development of the niche
He also suggests that the success of technological development at the niche level
is dependent on these processes aligning. If these processes align and form a
stable configuration niches can expand into larger networks. They suggest that it
is the expansion of these networked niches which increases legitimacy of the
innovation and thus its ability to succeed. Geels therefore suggests that networked
niches are better suited to challenging the incumbent regime.
Geels (2001; 2005; 2011) and Smith et al. (2010) also identify ways in which
niches can legitimise and challenge the incumbent regime. These fall under the
banner of ‘Breakthroughs’. They suggest that niches can breakthrough via niche
accumulation, co-evolution or through actor related patterns.
Breakthrough from the niche level often occurs as a result of pressures or policy
developments at the macro level which apply downward pressures on the
incumbent regime (Smith et al., 2010). Geels (2001; 2005; 2011) suggests that
niches develop out of these opportunities, network and accumulate. Communities
then develop around these innovations, such as groups of engineers, producers
and users to further develop the niche. Dominant practices can then develop
27

within the niche and it is these practices that challenge the existing set of rules
within the various regimes at the regime level. The dominant practices cause
these innovations to ‘breakthrough’ and begin the process of diffusion within the
wider regime context (Geels, 2002; 2004).
Ravens (2006) cites the diffusion of natural gas into the Dutch energy system as
an example of niches breaking though. In this breakthrough the natural gas
innovations challenged the dominant coal and oil industries and forced the
incumbent regime to develop along a new trajectory, eventually forming a new
regime (Ravens, 2006).
2.5.2 Patterns of breakthrough
Patterns of breakthrough follow the diffusion of innovation curve but move beyond
the basic econometric models of diffusion by including dynamics and innovation
within the socio-technical system (Whitmarsh, 2012; Ravens, 2006; Rogers,
2003). Consequently it is important to review the diffusion and its contribution to
socio-technical change (Whitmarsh, 2012; Ravens, 2006). The diffusion of
innovation is the process that models an innovation or idea as it moves from
uptake via the early adopters through general uptake by the market majorities and
eventually to saturation (Rogers, 2003). It is a process involving multiple activities
and communications within the socio-technical system (Rogers, 2003).
Rogers (2003) suggests this process is based on communication, information
seeking, the processing of information and decision making. Rogers (2003) also
suggests that the core factor in developing the conceptual notion of an innovation
and moving it forward is confidence within individuals and the broader socio-
technical system. Confidence can be increased through the assurance in the
necessity of a technology or in the performance of an innovation (Roger, 2003;
Ravens, 2006). Support policies could be seen as putting an authoritative stamp
on an innovation as the correct pathway to pursue. Consequently policy can act as
an indicator to the regime and its publics that socio-technical change is required
(Ravens, 2006; Rogers, 2003).
28

It is important to look at how niches can break though in conjunction with how
innovations diffuse. Niches can breakthrough via niche accumulation, co-evolution
or through actor related patterns. Niche accumulation often starts with an early
adopter market with a different need to the mainstream market and a greater
willingness to pay for the satisfaction of that need. A good example of this in
practice is the accumulation of niche business cell phone users out of which the
mass cell phone market blossomed (Geels, 2004; Foxon et 2008; Smith et al.,
2010).
Raven’s (2006) analysis of transitions suggests that this is a form of Niche market
accumulation. He considers that this is a requisite for initiating radical socio-
technical change. Niche market accumulation starts by attracting innovators and
early adopters to create niche markets and is a gradual process. It can involve the
branching out of niches into new areas as technology usage and new applications
for innovations develop. Different niches can are then said to ‘accumulate’. Once
this occurs co-evolution can begin and the niches become larger and more stable.
The niche builds momentum through positive feedback loops which allow the
innovation to start making serious progress towards uptake in the wider market
(Ravens, 2006). Positive feedback loops create supply chain cost reductions,
foster the development of new applications, assist in overcoming initial design
problems and help in removing limitations (Geels, 2004; Ravens, 2006). A good
example of positive feedback loops are installer and developer relationships.
Installers can assist in bringing down the cost of installation by identifying different
methods and then feed these back to designers of technologies. Another example
would be maintenance costs reducing as installers familiarise themselves with
technologies and learn new ways to maintain systems (Geels, 2004; Ravens,
2006). When these activities occur costs, stability and uptake increase which can
lead to market adoption.
Ravens (2006) also describes the process of hybridisation. Hybridisation allows
for a transitional phase of the existing support infrastructure to occur by the
innovations first occupying an auxiliary role before eventually dominating.
Innovations which gain significant momentum and acceptance via niche
accumulation can enter into the competitive market and challenge the existing
29

regime (Geels, 2004; Ravens, 2006). Successful innovations replace the existing
regime over time and a new socio-technical regime established, eventually
forming a new socio-technical landscape (Geels, 2002; 2004). Ravens (2006)
considers that hybridisation offers the potential to circumvent many inertia
generating forces present that exist when directly competing with the existing
regime. He cites the introduction of gas turbines as an example of hybridised
niche accumulation. In this transition gas turbines were used as an auxiliary
technology to the dominant steam turbine technology to supplement energy
generation during peak load. The turbine technology then went on to replace the
existing technology. In this transition the gas turbine was not originally intended as
a replacement technology but eventually did replace the existing technology.
A major pitfall with following a niche accumulation approach to a socio-technical
transition, however, is that frequently niche markets remain as niche markets and
fail to challenge the institutional and social practice regime sufficiently (Geels,
2004; Ravens, 2006). Examples of this are many, from the Sinclair C5 which was
too niche to create a sustainable market for itself, or Heinz launching an eco-
cleaning product that the market just failed to understand as consumers too
heavily associated them with food. However, with sufficient planning and top down
commitment, niche level innovations could potentially build momentum and mount
an effective challenge to the existing institutions and infrastructures (Ravens,
2006). Once this occurs the commercialisation of an innovation becomes more of
a reality as niche designs and technologies become economically as well as
technically viable (Ravens, 2006). Following the Sinclair example electric personal
transport which followed, such as electric bikes, are finding an easy route to
commercialisation given the better timing and higher levels of support from
government policy regarding sustainable transportation, improved cycle ways,
congestion charging in central London etc. Given the increased uptake in electric
personal transport costs of batteries and e-bikes are now reducing and a greater
potential for mass market penetration exists.
30

2.5.3 Strategic actor related patterns
Strategic actor related patterns’ recognise that whilst processes at different levels
create opportunities for regime change it is the inter-linkages made by actor
groups that form a new regime (Ravens, 2006; Geels, 2002; 2004). Consequently
breakthrough is also a process that involves different groups of people to bring it
about. Therefore to assist innovations to breakthrough, ways of increasing the
involvement of actors is critical. Breakthrough via increasing strategic actor group
involvement can be better understood through the patterns and interactions of
these actor groups. Actor related patterns can be either industrial or
user/consumer lead (Ravens, 2006; Geels, 2002; 2004). Industry led
breakthrough occurs when one company takes the first mover risk with others
waiting until it is strategically beneficial to do so, such as the jetliner industry which
saw Boeing move first and Douglas move only when productive to do so (Geels,
2004). Market factors, such as market saturation, can also lead to companies
diversifying into new industries or adopting new technologies which lead to
breakthroughs of innovations into society (Ravens, 2006).
User/ consumer lead breakthroughs occur through shared visions or cultural
values that align and legitimise an innovation (Luthje, 2004; Rogers, 2003). The
market place then makes rapid strides towards adoption of the innovation, such as
that seen with the rise of the internet (Geels, 2004). Mass hype or hysteria can
also cause the rapid diffusion of an innovation, such as seen with the Sony
Playstation or the Apple iPod. Consumer lead breakthroughs are more common in
the consumer goods field (Luthje, 2004; Rogers, 2003). The increased
involvement of actors does, however, make this a non-linear process and this
creates additional challenges when attempting to facilitate niche market
breakthrough.
2.5.4 Zero carbon homes at the niche level
The niche level is where commercially viable zero carbon housing designs will
develop from individual technologies and prototypes into viable solutions.
Companies and new technologies within the zero carbon housing sector are
31
unlikely to be able to compete without protected niches and new entrants into the
market are unlikely without encouragement. Given the still somewhat embryonic
stage of truly zero carbon homes, for designs to develop as challengers to the
status quo protected technical niches could help them progress through learning
processes en route to uptake by the wider market. Further technological
development will be required to enable zero carbon homes to challenge the
existing regime and therefore a need still exists requiring participants and new
entrants to innovate further. One way this could occur is through punitive policies
being placed on the current carbon intensive regime. Another way would be the
development of financial support and incentives designed to encourage
investment into alternatives (Mendoca, 2010; Geels, 2001; 2011; Smith et al.,
2010).
Encouragingly economic support polices have been developed to help create
protected niches (Mendoca, 2010; Geels, 2001; 2011; Smith et al., 2010). Some
successful technologies have been created from these protected niches i.e.
modern PV technologies, however, for zero carbon housing innovations to
breakthrough to the regime level they will need continued support polices to aid
their development and deployment (Ravens, 2006). Support polices will be
needed in order to foster improvements in cost structures and economics of the
technologies, methods of deployment, usability and general market appeal
(Ravens, 2006; Rogers 2003; Geels, 2001; 2011; Smith et al., 2010).
Improvements in the cost structures are only likely to occur with scale and whilst
these scale improvements develop, support polices are required (Mendonca,
2010; Ravens, 2006; Rogers, 2003). This requires long term government
commitment through grant mechanisms such as the feed in tariffs and the
renewable heat incentive (Mendonca, 2010).
The development of building regulations which penalise carbon intensive homes
could assist in encouraging innovators in the field on the premise that R&D
investment now will create competitive advantage in the future (Goodier and Pan,
2010; Goodchild and Walshaw, 2011; Osmani and O’Reilly, 2009). If enough
innovators are encouraged to enter the field then existing niches can begin to
network and increased knowledge and resource sharing can occur (Geels 2001;
32

2011; Smith et al., 2010). Once these niches have networked and accumulated
into an integrated patchwork they can become more capable of challenging and
substituting the current regime (Ravens, 2006). The regime level is discussed in
the next section.
2.6 Socio-technical regimes (the meso level)
The Regime, or meso level, of the MLP represents the wider socio-technical
environment, incorporating the current set of routines and practices within, and
reinforcing of, the current technical system (Rip and Kemp, 1998). It is a particular
set of practices, rules and shared assumptions, which dominate the current
system (Geels, 2005; Rotmans et al., 2001). The regime is made up of the
institutions and regulative subsystems which creates the structure of the system
(Geels, 2005; Rotmans et al., 2001). The regime may be threatened by landscape
level changes, eg policy or institutional change, or from the niche level. Regimes
tend to oppose radical change in the system instead focussing on system
optimisation rather than innovation (Bergman et al., 2008)
Rip and Kemp (1998) suggest the regime level represents the current incumbent
actor groups and their power structures and rules. They also suggest that the
rules within the matrix of engineering practice, production of technologies, people,
skills, and the product characteristics constituting institutions and infrastructures
are also included.
2.6.1 Actor groups within the regime
Geels (2004) suggests that within a regime, there are distinct groups of actors with
a high degree of autonomy. These actors interact with each other and develop out
of their interactions with each other i.e. supply chains and producer relationships
often co-develop . He suggests that the actor groups which influence the regime
can include financing groups, user groups, NGO’s, R&D institutions and public
authorities. He also suggests that, at the regime level, the actors create distinct
sub-regimes such as:
33

The socio-cultural regime
The policy regime
The science regime
The technology regime
The user/market regime
Each sub-regime comprises of its actor groups and peers and has its own
dynamics. Additionally, each sub-regime can co-evolve and reinforce each other
(Geels, 2011; Hughes, 2009).
The sub-regimes have a distinctive duality to their interactions and evolutions of
their actors. Actors both draw on the established norms within common practices
but are also enacting upon them. As such they are both shaped by and can shape
the regime (Geels, 2011). This is critically important for the development of the
socio-technical regime along a sustainability path as transitions need to
understand how sustainability based innovations are shaped by established norms
and how established norms can be shaped by the actors involved (Bergman et al.,
2010).
2.6.2 Development trajectories
The socio-technical regime develops along trajectories. Trajectories are the
development pathway that a transition follows based on past development and
socio-technical characteristics. According to Foxon et al. (2008), trajectories
develop from the dynamic interaction of socio-technical factors within the current
political framework. They are the result of the co-evolution of processes within
social, technical, political, economic and industrial actors, each having a
significant impact on one another (Murman, 2003). Future trajectories thus
develop out of the historical, deep rooted and rigid structures within the existing
regime (Geels, 2005; Smith et al., 2005). This is due to the fact that habits,
investments, competencies and norms lock regimes into the current system
infrastructure (Foxon et al., 2008; Bergman, 2008; Geels, 2005; Smith et al.,
2005).
34

When new trajectories develop, they do so along similar pathways to what already
exists. This means that the emergent new trajectories rarely diversify to any
significant extent (Bergman, 2008; Geels, 2005; Smith et al., 2005 Foxon et al.,
2008). This phenomenon is termed dynamic stability (Geels, 2011; Smith et al.,
2010; Foxon et al., 2008). Regimes are thus considered to have high levels of
stability even when evolving i.e. being dynamically stable (Geels, 2011; Smith et
al., 2010). Consequently regimes tend to focus on system optimisation rather than
innovation (Bergman et al., 2008). As a result developing new trajectories or
altering existing ones is problematic (Foxon et al,. 2008; Hughes, 2009). They
suggest that user practices and the social context, a perspective lacking in both
technical-economic and co-evolutionary approaches, should be incorporated when
trying to understand how trajectories can be altered from their current path.
The motor industry offers good example of trajectories and change (Whitmarsh,
2012). Recent developments have focused on improving efficiency of current
technologies, however, more radical departures to the internal combustion engine
have struggled to make an impact. Electric cars require a different set of
infrastructures to be developed and the limitations of technologies has limited their
challenge to the existing regime. The trajectory the regime has developed along
has thus mirrored historical trends rather than integrating radical innovations
(Whitmarsh, 2012). This can be seen with hybrid petrol-electric engines being
more successful than full electric cars as they are akin to incremental change
rather than radical departure to the internal combustion engine (Whitmarsh, 2012).
2.6.3 Problems faced by niche housing innovations at the regime level
The current commercial house building regime presents a number of problems for
niche zero carbon innovations. Unfortunately the main players and actors in the
incumbent regime are entrenched and powerful exerting significant dominance.
Zero carbon housing innovations must compete with both the incumbent housing
market and the energy market regimes given the fact that they span both housing
design and energy supply sectors. Additionally, technology lock in is high and
35

there are high levels of entrenched sunk capital. The combination of these factors
makes transitioning along new trajectories hard.
Historically both the key regimes have had a long-term focus on cost reduction
(Calcutt, 2007; Osmani and O’Reilly, 2009; Goodier and Pan, 2010). Innovation in
the sector has primarily been along the current trajectory through incremental
improvements and not through radical innovations which stimulate significant
change. The commercial actors exhibit a trend of adherence to current regulations
as the design benchmark and not towards developing best practice (Osmani and
O’Reilly, 2009; Goodier and Pan, 2010). This has significant implications for
innovations in energy and environmental performance as step change
improvements in these areas have been lower on the political agenda. Thus policy
changes have historically fallen short of supporting best practice (Goodchild and
Walshaw, 2011; Goodier and Pan, 2010). When combined with the raft of other
housing policy objectives, step changes in energy and environmental performance
are unlikely to be focused on by national house builders.
The structure and commercial mix of the housing sector is also inhibitive to
change. The commercial residential housing sector is dominated by only about
100 private companies who build in excess of 1000 properties per year which
represents over 75% of the new build housing market by volume (Callcutt, 2007;
Ball, 2010; AMA, 2010). Consequently power is accumulated in the few
companies whose commercial objectives are not conducive to radical housing
innovation. Thus most new build properties will be built using well established
design and business models and not highly innovative designs.
The combined effect of these factors impacts consumer demand. This is because
homes are built to national house builder objectives and not to consumer
specifications or best practice (Callcutt, 2007; Ball, 2010; AMA, 2010; Goodier and
Pan, 2010; Osmani and O’Reilly, 2009). This restricts the field of consumer
demand designs to the smaller market segments such as self-builders. Whilst this
could enable a niche to develop it is important to acknowledge that self-builder
and national house builder objectives are not aligned.
36

Another major barrier are the ‘Rules’ of the housing regime. The rules are
established through a combination of building regulations, market values, market
demands, national house builders financial models, local authority rules, home
buyers liquidity, home buyer’s market habits, mortgage and lending models,
surveying rules, tenant demands, landlord demands, Registered Social Landlords
requirements and affordable housing targets (Callcutt, 2007; Ball, 2010; AMA,
2010; Goodier and Pan, 2010; Osmani and O’Reilly, 2009). Rules in the finance
and lending sub-regimes set the maximum value of a house, the availability of
finance, rates of finance and required returns (Goodier and Pan, 2010; RICS,
2012). These rules are stable and dominated by established financial mechanisms
that are based on established housing and market models (Goodier and Pan,
2010; RICS, 2012).
Innovative zero carbon design could require new rules to be developed to account
for higher build costs, better life cycle cost benefits, different disposable income
models and affordability rates. Thus zero carbon innovations will have to
challenge more than just the house builders’ rules and norms but also many of the
sub-regime’s rules and norms.
Another sub-regime that could affect the ability for zero carbon homes to
challenge the existing regime and the rules and norms is the property valuation
sector (Goodier and Pan, 2010; RICS, 2012; Zero Carbon Hub, 2009; 2010).
Homes are not only priced by developers but also by surveyors, agents and
lenders (Goodier and Pan, 2010; RICS, 2012). These actors have set rules for
determining the mortgage value and market value of properties (RICS, 2012).
These rules have been built up over a long time and are stable and entrenched.
For zero carbon homes to challenge the existing regime they may also require
changes to the valuation system (Goodier and Pan, 2010; RICS, 2012; Zero
Carbon Hub, 2009; 2010).
The public actor group sets the cultural and behavioural norms that a house is
expected to deliver (The Zero Carbon Hub, 2011; Theobold, 2008; Castel, 2010).
Any deviation from the expected norms requires changes to consumer tastes and
expectations (Castel, 2010). As these expectations are encompassed in cultural
37

habits they are stable, learnt and established and consequently hard to break
(Foxon et al., 2008; Geels, 2001; 2005; 2001). Many innovative zero carbon
designs in the past have required a shift in cultural and behavioural norms and
these have been met with resistance in the main market sector (Osmani and
O’Reilly, 2009; CABE, 2005). Innovators need to be aware of this at the niche
level in order to develop technologies that either minimise radical departure from
cultural norms or only incrementally change behaviour.
One of the biggest barriers at the regime level is the energy regime. The energy
regime, despite recent market reforms, is still dominated by as few as six major
companies (FOE, 2012; FOE, 2011; DECC, 2012). The electricity and gas market
regime, like the housing regime, is characterised by a historically stable and long
term supply infrastructure based on the purchase of energy (Foxon et al., 2008;
Geels, 2001; FOE, 2011; 2012). This occurs via the hierarchal supply of electricity
and gas by a major producer/ supplier to consumers via the established networks
and infrastructure (FOE, 2011; 2012). This infrastructure has required substantial
investment in the past and thus has high sunk costs and entrenchment locking it
into its current trajectory (FOE, 2011; FOE, 2012).
Energy companies and investors into the current infrastructure are unlikely to want
to deviate from it and will want to maximise return on investment on the sunk
financial costs into the current infrastructure. This means that this regime has high
levels of inertia and is very dynamically stable. If zero carbon designs deviate too
much from these established rules it will be difficult to breakthrough and challenge
at the regime level. Adaptation and co-evolution is likely to be the best method to
develop technologies to compete with the current regime (Ravens, 2006).
Rules and norms in the consumer sub-regime will also be well established (Geels,
2001; 2005; 2011; Foxon et al., 2008; 2009). The public actors expect energy to
be provided for consumption in a certain way. The current purchase of energy is
via the hierarchal supply and demand infrastructure and consumers expect energy
to be available when required at the point of use (Foxon et al., 2008; Geels ,2001;
FOE, 2012). They also expect to pay a supplier to provide this facility. These
cultural habits are stable and learnt over a long period and any changes to them,
38

such as supply and production of energy by the house, are likely to be met with
consumer resistance. Consumer’s energy habits will thus exhibit significant inertia
and this will present a number of challenges for zero carbon innovations (Geels,
2001; 2005; 2011; Foxon et al., 2008; 2009).
2.6.4 Challenges for decarbonisation at the regime level
There are a number of factors that, when combined with the market dominance of
very few key players and powerful incumbents, create a very challenging
environment for innovations to compete in (Geels, 2001; 2005; 2011; Foxon et al.,
2008; 2009). It is therefore unlikely that natural spaces in the current regime will
occur to allow niche innovations, which go beyond the modification level, to
challenge the existing regime (Geels, 2001; 2005; 2011). Resultantly there is
increased importance for niche level innovations to interlink at the micro level in
order to accumulate and eventually break through via niche accumulation, co-
evolution or actor related patterns (Ravens, 2006). This is likely to be a slow
process given the high levels of inertia likely to be exhibited by the energy and
housing market incumbents (Geels, 2001; 2005; 2011; Foxon et al., 2008; 2009).
In order to enable the required space for innovation to occur policy developments
will be required to discourage poor energy and environmental performance in
existing buildings.
Policies encouraging low carbon development will also be needed. Unfortunately
current policy mechanisms that are punitive to unsustainable practice are few in
number (Goodchild and Walshaw, 2011). Sustainable standards and
environmental best practice are voluntary only and whilst they have been
envisaged to become policy in the future, this has been incrementally watered
down (Goodchild and Walshaw, 2011; Zero Carbon Hub, 2009; 2011). This has
disadvantaged early adopters in the market in the past and sent mixed signals to
the political direction of housing standards.
Niche energy and house building innovators will need significant assistance to
enable space for successful niche innovations to develop. Such policy instruments
could help innovators facilitate change, force adaptation of the current market
39

technologies and enable opportunities for technological substitution to occur i.e. to
create the opportunities for the energy and housing market to break its dynamic
stability and follow a new trajectory.
2.7 The macro-level landscape
The overarching landscape of the MLP is represented by the macro level. This is
made up of the macro-economic, macro-political and macro-cultural elements that
comprise the socio-technical environment (Geels, 2004; Foxon et al., 2008). The
landscape level is representative of the amalgamation of both the micro and meso
levels combined with demographic trends, ideologies, social values and economic
patterns (Hughes, 2009; Foxon, et al., 2008; Geels, 2004; 2011). Thus the
landscape level forms the environment in which the micro and meso levels
function in. This landscape can both be influenced by the regimes and niches and
exert pressure on the sub-levels within the MLP hierarchy (Hughes, 2009; Foxon
et al., 2008; Geels, 2004; 2011; Smith et al., 2010). As such the landscape level is
considered somewhat outside of the socio-technical system but still influenced by,
and influential on, innovations (Hughes, 2009; Foxon, et al., 2008; Geels, 2004;
2011; Smith et al., 2010). The importance of the macro-level in shaping the
innovations and regimes is primarily in creating the backdrop for socio-technical
change. A good example of the macro level landscape is the low carbon
movement. Supranational organisations, national governments and think tanks
have influenced the global socio-political agenda and polices have been created
out of this agenda. Policies arising from the from the Kyoto Protocol, United
Nations Framework Convention on Climate Change, the Copenhagen Agreement,
the G8 and G20 create the back drop for multiple regimes at the meso level to
operate in.
The landscape can thus create a more or less conducive environment for low
carbon socio-technical change depending on how this back drop filters down to
the regime level. The UK adapted macro level socio-political agenda into regime
level policy in the ‘Climate Change Act 2008’ which created legally binding targets.
These targets were then filtered through to the housing regime though tightening
of the building regulations.
40

Within the landscape level political, social, cultural and institutional actors come
into play. These actors form the basis of the structural relationships that
characterise the landscape level (Geels, 2004; Foxon et al., 2008). These
structural relationships are considered slow to change (Geels, 2004; Foxon et al.,
2008).
2.7.1 Macro level as a stimulus for innovation
National and supra national environmental policy provides stimulus for niche level
technology actors to innovate along a particular trajectory. Macro-level polices can
thus been seen as the signal to the housing industry that the socio-technical
landscape is changing and that regimes need to develop along a new trajectory.
If macro level policy sets the scene and direction for multiple regimes a paradigm
shift can occur. This shift creates opportunities for niche level actors to develop
alternatives to the status quo technologies.
The low carbon housing industry is characterised by regimes which exhibit strong
social, political and commercial lock in which makes developing new low carbon
regimes difficult without some form of political assistance and direction from the
Macro level. One way for low carbon trajectories to develop in dynamically stable
markets is though paradigm shifts in the landscape filtered down into national and
regime level policy. Encouragingly there is evidence of a low carbon shift in policy
instruments. Policies created out of the Kyoto Protocol, United Nations Framework
Convention on Climate Change, the Copenhagen Agreement, and the G8 have
sent indications to the regime level that new trajectories are required. This could
send indications to the niche level that new innovations are required. This
backdrop could also help create spaces which could stimulate new sustainable
trajectories to develop out of existing regimes. However, for this to occur in the
housing sector, it will require the development of consistent and long term
perspectives within the policy framework at the regime level; this has not yet
occurred.
The UK government needs to integrate macro level paradigm changes into target
setting for house building in order for supra-national policy objectives to become
41

influential at the regime level. For the housing sector commitments to binding
targets under the ‘Climate Change Act’ and the ‘Renewable Energy Directive’
need to be translated into national policy and best practice needs to be anchored
into the regulations.
If best practice is absorbed into the building regulations with incremental steps of
increasingly tightening standards to stimulate achieving zero carbon milestones,
innovators can be encouraged to invest in prototype designs under the
understanding that this will create competitive advantage when voluntary
standards become regulation. As a result the main output from the macro level
needs to be a clear signal to the housing regime and niches that the low carbon
macro level direction will eventually cascade into goals and policy and the lower
levels of the MLP.
2.8 Criticisms of the MLP in relation to this research
The MLP has proved useful as a framework to understand socio-technical change,
however, it has also attracted many criticisms. This section of the research
analyses the critiques of the MLP and how they impact on this research project.
Many critiques of the MLP are from social practice theorists. Social practice theory
emphasises the ongoing and reproductive elements of social change which the
MLP does not. In many respects social practice theory and socio-technical change
theories (such as the MLP) opposed each other in breadth and emphasis. Social
practice theory therefore emphasises a greater degree of agency in how the
cultural aspects of socio-technical transitions affects and creates culture (Shove
and Walker, 2010). Theorists, such as Shove and Walker (2001; 2010), consider
the MLP to fall short in adequately accounting for the uncontrollable processes
representative of daily living. This is an important point to consider as the MLP
could insufficiently account for change driven through everyday practices (Cohen
and Ilieva, 2015). Cohen and Ilieva (2015) acknowledge the opposite perspective.
They consider that a critique of socio practice theory is that too much focus is
given to micro-level of everyday activities at the expense of acknowledging the
broader elements of socio-technical change. As such rationalisation of the level at
42

which to study socio-technical change depends on perception and context. Cohen
and Ilieva (2015) suggest looking at both perspectives are required to examine
social change on a large scale but decisions need to be made based on the
context. Within the context of this study understanding the broader aspects of
socio-technical change are more useful to understanding how to transition the new
build housing sector. This can be linked to a number of points, such as the level of
control exerted by national house builders or the way regulatory standards are
used as the benchmark for design. Changes in social practice will have a greater
effect in other contexts, such as the self build or retrofit markets where the
individual plays a greater role in shaping how they perform everyday practices
linked to carbon and energy. It is therefore considered the broader perspective
incorporated within the MLP is more useful here.
Social practice theorists consider the MLP to over emphasise the role of
competition and selection within the change process (Shove and Walker, 2010;
Genus and Cole, 2008). As a result it is argued that the MLP does not fully
account for social practice aspects of change, in many respects underplaying its
contribution. It is also argued that MLP cannot effectively conceptualise the
dynamics of demand. Consequently it is argued that the role of social acceptability
of an innovation is underplayed in favour of the role of competitive practices
(Shove and Walker, 2010; Genus and Cole, 2008). Shove and Walker (2010) use
examples of transitions that do not go through competitive processes in order to
support their argument. One such transition noted is the change in dominance of
showering versus bathing, a transition they consider to be purely social practice
based and not the result of competition.
The MLP does bring elements of social practice into the framework but it is the
level of consideration given that is contestable. Therefore it has to be
acknowledged that the full range of social practice elements involved may not be
captured within the MLP. Whilst this may be the case, an effective model for
understanding and directing transitions through social practice theory has yet to
be developed (Cohen and Ilieva, 2015). As such, whilst the structure of the MLP is
not optimal, it is considered one of the best ways to significantly capture the main
elements of change within the new build housing industry.
43

A more significant criticism of the MLP is based on the role that protected niches
play and whether they are always essential for change. Both Shove and Walker
(2010) and Genus and Cole (2008) argue the case this is not necessarily so and
that the role of ordinary practices should not be taken as given. Cohen and Ilieva
(2015), however, state that better ways to examine, support and scale innovations
into mainstream (regime) practices that are not based on the MLP have not been
suggested. If this is accepted as the case than the position of the MLP as the
leading framework for understanding transitions is further enhanced.
The hierarchal structure of the MLP has also been criticised. Some theorists, such
as Shove and Walker (2010) and Genus and Cole (2008), argue that the vertical
nested structure within the MLP does not fully account for the full range of
elements involved in change, such as skills and material availability in society. It is
also argued that too much emphasis is placed on the role of integration. They
argue that the MLP, by emphasising the factors that are required to facilitate a
transition, is too inclined to lean towards a techno-fix solution that forces social
habits to adapt to specific technologies. An example of this is restricting access to
older methods of doing or legislating too favourably towards a specific technology.
Consequently they argue that the MLP underplays the role of cultural and
behavioural development in favour of technology led solutions which may miss out
on central aspects of socio-technical transitions. It is therefore critical to bear
social practice aspects in mind when trying to foster a state where sustainability
led transitions may be more successful. Without such a consideration it would not
be possible to balance all aspects of socio-technical innovations. This critique
needs careful consideration in the research proposed in this thesis. The MLP will
be used to assist in developing housing innovations that are more likely to
challenge at the regime level and by its very nature is suggesting a techno-fix
solution to the carbon problem. It is important to note that cultural and behavioural
issues will be acknowledged in the way innovations developed will aim to minimise
the impacts on cultural and user practices.
Applying MLP theory has also been criticised for over simplification. Smith et al.
(2010) suggest that the MLP tends to over simplify the duality, or plurality, of
interactions between the specific levels and between the actors within these
44

levels. As such they argue that the MLP does not adequately capture the full
complexities of a transition. They point toward the fact that fluidity and complexity
within regimes are not captured in way the MLP treats regimes in a simplistic
fashion. Thus they criticise the way the MLP divides socio-technical systems for
ignoring the fact systems are fluid and constantly in transition anyway. Smith et al.
(2010) arguments that over simplification will present issues is acknowledged,
however, it is argued that there is a role for simplified models when trying to
understand complex issues in a complex environment (Geels, 2004). The
antithesis of an over simplified model, an overly complex model, can also be
criticised in that it is too complicated to foster understanding. Therefore a balance
must be sort and it is considered that the MLP, in conjunction with transitions
pathways theory, can be used to provide an adequate balance in this study.
Substantial criticism surrounds the role of transition managers within the MLP.
Most of this criticism is levelled at the MLP’s failure to fully account for agency
(Shove and Walker, 2007; Shove and Walker, 2010; Genus and Cole, 2008). The
remaining criticism is whether there can be such a role and if so who, if anyone,
has the right decide on what is best for society when in this role. Shove and
Walker (2007) consider the lack of agency as a somewhat irresolvable issue
which will always prevent the possibility of identifying who transition managers
should be. This impacts how to define the roles of transition managers and
deciding on whose authority they should act on (Shove and Walker, 2007; 2010;
Genus and Cole, 2008). If transition managers can exist, should they be internal
or external to the transitions process? If they are internal to the transition process
they could be considered to be acting on political and personal motivation and if
they are external to the process, how should they be selected to ensure
impartiality (Shove and Walker, 2007; 2010; Genus and Cole, 2008)? This raises
many concerns when it comes to managing transitions. The use of the MLP in the
study does not seek to allocate roles for transition managers. It seeks to use the
MLP as framework to understand the multiple elements and aspects involved with
a sustainable housing transition. It will use the MLP to identify and position key
stakeholders so that multiple perspectives can be incorporated into the design of
an innovation. By doing so it is anticipated that an innovation with a greater
potential to transition into the regime can be developed. This means that the roles
45

of transition managers are less important here based on two factors. Firstly this
research aims to use the MLP to better understanding sustainable housing
transitions and identify the main barriers preventing such a transition. Secondly it
aims to identify and incorporate the input of multiple stakeholders, identified and
positioned within the MLP framework, into the design process to optimised a
design. As such it does not specifically look at the role of transition managers.
One final criticism of the MLP is that it assumes the nationality of transitions by
incorporating policy only at the national level. It is argued, specifically by Smith et
al. (2010), that this ignores the geographical elements which can see divergence
regionally and at the city or village level. It is argued that geographical impacts can
bring different understandings and interests into play and thus framing a system
nationally misses out on specific needs that may be different locally. Smith et al.
(2010) also argue internationality plays a part due to the global and liberalised
nature of many societies. They consider that trans-national aspects, such as
internationally mobile capital, can play a significant role in shaping the
relationships and policies of other nation states and this is not effectively captured.
The issues that arise from nationality based assumptions in transitions theory is
not considered to be too much of an issue for this study as the focus here is on a
transition within the UK. It is acknowledged that regional factors will play a
significant role in a housing transition given the different demographics of housing
demand and pricing of housing in the UK and this will be considered in the
analysis of the results.
Whilst there are many critiques of the MLP as a practical framework it is still a very
useful tool to understand how niche technologies can become part of the wider
socio-technical system. In relation to this study, it offers many insights into how the
integration of zero carbon housing designs could be approached. Despite the
critiques, the MLP is still a very useful tool for application to the sector under
study. As the statistician Box (1987) once said ‘All models are wrong, but some
are useful’ (Box and Draper, 1987. p. 74) and such can be said of the MLP in this
scenario.
46

To use the MLP to understand the issues facing a sustainability led housing
transition requires an in depth analysis of the UK new build housing regime. The
next chapter of the research uses the socio-technical review to develop such an
analysis.
47

Chapter 3
Applying the Socio-Technical Review to the Housing Regime
3.1 Introduction
Using the analysis of the MLP to improve the design of a zero carbon home
involves understanding how the conceptual levels apply, how the multiple actors
and domains within the housing and energy sectors affect the conceptual levels of
the MLP and how the actors/ levels span and overlap. By understanding this it is
envisaged that a strategy can be developed to help improve the potential for niche
zero carbon innovations to compete at the housing building regime level. To do so
requires understanding the barriers and the roles of the key actors and using this
knowledge to inform design choices at the innovation level.
This section of the research focuses on applying knowledge of the MLP to
examine how zero carbon housing designs could be improved so that they could
potentially move beyond their current niche and into the mainstream. This focuses
on analysing the current house building regime and the issues at the niche level
before developing a design strategy.
3.2 Imagining the future system and contrasting the existing one
Transitions theory states that future systems need to be imagined and tracked
back to the current state (Foxon et al., 2008). Table 3.1 shows an overview of the
current and proposed socio-technical regime for domestic energy supply and
consumption. In effect this is a picture of the current and ultimate end state of the
transition process. This is based on a template developed by Geels (2004) and
Genus and Cole (2008). The aim is to firstly summarise the scope and magnitude
of change required, then to identify the main areas of the regime to focus research
on and finally to identify key actor groups who will affect the transition.
48

Table 3.1: Socio-Technical System for Domestic Energy Generation
Source: Author, adapted from Geels (2004): Genus and Cole (2008)
For an effective low carbon domestic sector to be developed via niche housing
designs many changes and adaptations are required across all artefacts in table
3.1. The individual artefacts are discussed in turn below.
The ‘Regulation and Policy’ artefact can be seen to be moving towards supporting
a low carbon energy system. A number of policies are in place that could help the
49
ArtefactCurrent System - Centralised Domestic Energy Purchase
Desired System -Low Carbon Decentralised Energy Production
Regulation and Policy
Production SystemCentralised, hierarchal, purchased from producer, non-specialist established equipment, ongoing costs dominated by price rises, carbon intensive
Decentralised, onsite generation, purchase of novel niche market technologies required, zero/ low carbon methods used
Markets
Large market, dominated by 6 core suppliers, hierarchal flow in single direction, entrenched and standardised market, established financial mechanisms, standard markets for energy supply and house buying/selling exist, dominated by price escalations
Changed buying behaviour to producer-consumer model, capital intensive implementation but low ongoing costs, new financial mechanisms in place, new methods of buying and selling energy, new methods of valuing homes and energy production, economies of scale developed for low carbon technology, economic returns achievable without support policy, widespread consumer demand outside of environmentally aware consumers
User PracticesConsumers buy from suppliers, long term learnt behaviour, stable system, standardised housing design, familiar technology and user interfaces
New technologies and user interfaces, consumers produce their own and buy-in energy, buy and sell to/from suppliers, novel building design, changes in everyday energy usage established, accepted new change in building design
Infrastructure
Established, hierarchal, large scale and national, privatised, high sunk costs, established but aging infrastructure, established supply and distribution chains with good economies of scale
Integrated new technologies, new methods of construction and refurbishment, new two way energy distribution infrastructure, new housing refurbishment techniques, established distribution outlets and suppliers
Culture and SymbolicLow symbolic value, un-engaging activity, necessity and commodity driven
New socially accepted infrastructure, higher symbolic value for energy consumption and conservation, Eco-credentials enshrined as important, future orientation for carbon reduction seen as important, social shared goal understood
Maintenance and distribution
Service contractors, scheduled maintenance, high levels of knowledge, trusted networks
New Installation teams and methods developed, new service contractors needed, new technologies to be maintained
Building regulations, Climate Change Act, Renewable Energy Directive, Code for Sustainable Homes, FITS, RHI, Green Deal
Socio-Technical System For Domestic Energy Generation

transition, such as the legally binding commitments under the climate change act
or through the current raft of renewables policies. The current backdrop to the
socio-technical system can therefore be seen as encouraging a more sustainable
system. Consequently the improvement of the design process for a niche zero
carbon home should focus on working within the current raft of regulations and
policies within this artefact.
There are more substantial changes required in the ‘Production System’ artefacts.
The current system is dominated by centralised production and distribution using
existing methods and technologies. There will be high levels of lock-in to the
existing methods and the incumbents will be entrenched and powerful. The
imagined system focuses on production and consumption under a decentralised
system using novel and innovative technologies and this will be considered a
radical departure from the current system. Such a departure will have to battle the
inertia and dynamic stability of the existing system and this will present a number
of challenges for optimising a niche design.
At the ‘Market’ artefact level fundamental changes to the existing system are
needed to bring about the imagined future end state system. The existing energy
production market will require a significant shake up on both the institutional and
public level. This is likely to encompass changes to both the existing market
models and financial mechanisms for supply and production of energy. One driver
at this level will be the continued fuel price escalation of the current methods of
supply and this could help facilitate a transition to new methods of energy supply/
consumption. The house types that are imagined to dominate will be significantly
different from both the buying and selling perspectives and this will likely require
new valuation systems and methods of pricing. The imagined system will require
new interpretations on existing finance mechanisms and new mechanisms may
also be required. This will have significant impacts on the buying behaviour of
property owners and the role of financial institutions. This indicates that there may
be a requirement for wider reaching systemic change which moves beyond the
scope of design improvement.
50

Careful consideration will need to be given to the impact that design decisions will
have on the market actors as the level of entrenchment, dynamic stability and
resistance to change. Success of an optimised design will likely be determined by
the actors within this artefact so consideration needs to be given to how best to
remove blockages at the market level and how to work with these key actors.
In the ‘User Practice’ artefact, changes to the aesthetics of homes and usage of
energy will be required. This will likely move beyond efficiency improvements and
include the use of new technologies and ways of doing established daily tasks.
Changes in this artefact will need to acknowledge the influence that cultural and
consumer preference will play. Changes such as how zero carbon homes need to
be used compared to current homes will also need to be considered alongside the
cultural habits and social practices that will need to be changed. A switch to a
microgenerating and decentralised energy market will also impact this artefact as
it will require changing the relationships home owners have with the energy
markets. One impact will be the movement from energy consumers to energy
‘Prosumers (producers and consumers)’ which will require new relationship
models with energy supply companies. Changes here will need to be carefully
considered in the design process as changes at this artefact level will have
significant impacts on the potential success of the niche design.
The ‘Infrastructure’ artefact also requires significant change between the current
and imagined system. The Infrastructure is characterised by large and powerful
incumbents who have high levels of vested interest in the current method of
delivery. The distribution systems and supply chains will be well developed and
these will require significant levels of innovation to enable the imagined system to
occur. As a result there will be impacts on both the design process but also wider
systemic impacts. Designs will need to exploit gaps in the existing system and
leverage drivers to enact change. Most of the major roadblocks to achieving the
imagined system will likely reside in a combination of the ‘Infrastructure’ and
‘Market’ Artefacts.
The ‘Cultural and Symbolic’, whilst mainly outside of the design process will have
significant impacts. The imagined system will place a much higher emphasis on
51

energy efficiency, renewable energy production and different methods of satisfying
existing consumer needs. This will require significant consumer buy-in to the
environmental change agenda. It will also require an increased importance to be
placed on the shared common goal. The main driver to instigate this will be
developed out of the market artefact as prices rise in energy provision under the
current system may raise the profile of energy efficiency and renewable energy
technologies.
The ‘Maintenance and distribution’ artefact will need to adapt and change
alongside changing delivery mechanisms. Engineers and maintenance firms will
need to adapt to manage and maintain a different set of technologies. They will
need to master a different set of problems than they currently have to solve and
this will present issues in the imagined system. Reliable and easy to maintain
technologies will improve the likelihood of a niche design being incorporated by
the actor group and thus improves the potential of a design to create the imagined
system.
In the imagined end state system there will be impacts at all artefact levels. As
such there are important design decisions to make in order to improve the
possibility of the imagined system becoming a reality. The design decisions taken
should be sympathetic to the issues identified at the various artefact levels to
reduce impact and improve the potential for the future system to become a reality.
The current policy landscape should be used as the back drop for designing zero
carbon homes. This is because there are signals in the ‘Regulations and Policies’
artefact indicating the imagined system could be supported under the current
policy terms. Reducing impacts on the wider systemic and infrastructure areas will
help improve the potential of innovations to foster the imagined system but how
much can be done through design optimisation is as yet unknown. Also, as the
policy that current exists could be considered somewhat conducive to change
design decisions should be made within the current policy remit.
The next stage of the regime analysis is to identify sub-regimes and specific
actors that can effect and will be affected by changes to the status quo. The aim is
52

to further identify where barriers and drivers to implementation exist and how to
leverage these in design decisions.
3.3 Analysing the house building regime
Critical to understanding the MLP is knowing how the individual levels interact and
integrate with each other. This is best described in the ‘Nesting’ of the levels.
Figure 2.1 below shows the ‘nesting’ of the three levels of the MLP and how they
form from niches, to patches of regimes and up to the overarching macro-level
landscape in a hierarchal structure.
Source: Geels 2004
Figure 2.1: Nesting of the Levels in the MLP
Within the MLP radical innovations begin in niches that incubate innovations and
allow them to develop, often protecting them from inhibitive market forces i.e. in
universities or through grant funding (Geels, 2004; Frantzeskaki et al., 2009;
Smith et al., 2010; Bergman, 2008). For change to occur innovations need to
break out of their niches and shift the system away from its dominant technologies
at the regime level (Geels, 2004; Frantzeskaki et al., 2009; Smith et al., 2010;
Bergman, 2008). The regime is the network of social rules and infrastructures
which create the technology, user practices, infrastructure, policy, scientific
knowledge and the system and systems rules (Geels, 2004; Frantzeskaki et al.,
2009; Smith et al., 2010; Bergman, 2008). These are shaped by exogenous
factors at the landscape level which exerts pressure upon the regime whilst being
beyond the control of the actors within the system (Geels, 2002; 2004).
53

To better understand how the housing sector could be decarbonised using
innovations designed to work within the socio-technical changes described above;
a full analysis of how the industry is set-up to deliver new build homes is required.
Critically the role of key strategic actors within this process needs to be analysed
and understood.
Whilst large scale commercial house builders are one of the most influential actor
groups within the house building regime they interact and are dependent on other
actor groups that make up the regime. Actor groups such as local authorities,
registered social landlords, financers, surveyors, banks and lenders, funders and
architects are all key to the process. The following section details the actor groups
and positions them within the levels of the MLP.
3.3.1 Identifying the sub-regimes and actors
There are many actors across the levels of the MLP who can effect the
implementation of zero carbon homes. The main actors who will be considered in
this analysis are:
National government policy makers (Macro level and Regime Level
Policy) - Responsible for setting the policy framework
National house builders (Regime level: Market Sub-Regime) -
Commercially build the largest number of homes by volume and
account for 75% of the market share
Energy supply companies (Regime level: Market Sub-Regime) - key
constituent of the energy market and characterised by the Big 6
companies
Land owners (Regime level: Market Sub-Regime) - critical to the
development process
Consultants (Regime level: Market Sub-Regime) - critical to the
development process
Estate Agents (Regime level: Market Sub-Regime) - will sell and be
involved in the marketing of zero carbon homes
54

Home Buyers (Regime level: Market Sub-Regime) - will create
demand in the market
Registered social landlords (Regime level: Market Sub-Regime) - will
create demand in the market
Valuers and Surveyors (Regime Level: Finance Sub-Regime) - will
be responsible for valuing the homes and determining market rate
Financial institutions Regime Level: Finance Sub-Regime) - will be
responsible for lending to both the developers for project finance and
the consumers via mortgages
Investors/ funders (Regime Level: Finance Sub-Regime) - will be
responsible for enabling projects through financial service
provisions.
Banks and mortgage providers (Regime Level: Finance Sub-
Regime) - will be responsible for developing and adjusting lending
criteria based on life cycle costing
Architects designers and engineers (Niche Level Innovators) -
responsible for developing zero carbon designs
Technology developers (Niche Level Innovators) - responsible for
developing renewable components for incorporating into zero carbon
homes
System installers (Niche Level Innovators) - responsible for installing
the technologies developed and bridging knowledge gaps
3.3.2 Defining the housing market sub-regime
The research into defining the housing market regime was conducted during a
difficult time for the housing industry and the economy as a whole. Increasing the
volume of zero carbon homes being built was becoming increasingly difficult
during this timeframe and house builders were under pressure to build more for
less.
Between 2008-2011 the industry has been characterised by a slow rate of housing
growth following the recession, however, post 2011 the UK was predicted to
55

embark on the largest house building programme for more than 40 years. At the
time of writing growth was expected to dramatically ramp up until 2016 (AMA,
2010; Calcut 2007; CABE, 2005; House of Commons, 2014). Whilst this may be
the case it is an area fraught with conflicting social, commercial and environmental
goals, many of which stem from the process being largely in the hands of private
house builders. As result the UK is facing a distinct problem where the need exists
to build increasing volumes of new homes to meet the demand for housing,
especially affordable housing, whilst at the same time decarbonising the sector to
meet targets set out under the 2020 policy reduction commitments (AMA, 2010;
Calcut, 2007; Climate Change, Act 2008; EU Directive, 2009). Decarbonising
unfortunately increases the build costs and can be seen as conflicting with the first
house building objective. As the two issues are so closely related, yet conflicting,
the need to develop a zero carbon housing solution that has the potential to be
rolled out to the large scale housing market is critical.
Market analysis conducted on the current state of the zero carbon house building
environment has shown that the majority of zero carbon housing implementation
has been in the self-build market segment. This is a concern as the self-build
market segment represents less than 10% of the total market (AMA, 2010; Calcutt,
2007; Welling, 2006). A further concern is that the self-build market comprises
very few of the main actors that form the commercial housing regimes and thus
very little is known about the framework of issues and ability to build commercial
zero carbon homes in the largest market segments. As the self-build market tends
to build properties using bespoke designs favoured by individual clients, they
prioritise commercial and economic aspects less. They also have less interaction
with many of the housing market actor groups as they are not part of the
established supply chains (National Self Build Association, 2011). Self-builders
mainly prioritise strong environmental motivations, attitudes and legacy building
over economic aspects, however, these issues are not representative of the wider
market context (Goodier and Pan, 2010; Ball, 2010; Wellings, 2006; AMA, 2010;
National Self Build Association, 2011). Additionally, zero carbon self-builders are
not focused on replicable designs or mass market resale values of
commercialised properties. This is evident in the fact that only 6 commercially
56

available properties had achieved post build zero carbon status by the end of
2010.
In contrast to the self-build sector, the commercial house building market
represents the largest market segment, at around 75% of the annual new build
market, and is dominated by 100 main companies of which only 25 build in excess
of 1000 properties per annum (Calcutt, 2007; Welling, 2006). Large scale
commercial house builders are thus the most influential actor group within the
house building regime.
When this research project was initiated it was envisaged that UK building
regulations would legislate for all new build homes to be zero carbon by 2016. As
such the timeframe to legislative change was very short to enable incremental
change to have a significant impact. Given the vast majority of housing
constructed by the main actor group within the sub-regime, developing a strategy
to enable these actors to cost effectively deploy zero carbon homes in a timely
manor was of critical importance. As such the research parameters did not look to
upscale self building actors or stimulate incremental change with a longer term
view of meeting new build volumes, but instead looked to assist in developing a
solution that could work within the development objectives of commercial house
builders.
3.4 Understanding the processes in the sub regime: The new build development process
To understand how new build zero carbon homes can be integrated in national
house builder portfolios it is critical to understand how the development process
works. This section of the research uses conventional econometric models of
property development to explain the development process in the UK. A single
framework for the development process is used. It is acknowledged that Knight
(2011), Guy and Henneberry (2000) and Healey and Barrett (1990) consider there
to be a lack of research from a non-econometric stance, however, the focus of this
study is to develop a comparative baseline to analyse the commercialisation of
zero carbon homes in a practical sense. This section of the research focuses on a
57
development model from the event-sequence approach to conceptualisation
(Healey 1991; Gore & Nicholson 1991). This section draws mainly on the work by
Reed (2007) and Wilkinson and Reed (2008) which is based on classic research
by Healy (1991) and Goodchild and Munton (1985). The definition of developer in
this section, for reasons defined in early sections, refers to national house builders
whose underlying development incentive is profit (Isaac, 1994; Isaac, 1996;
Millington, 2000). The dominance of such builders in the UK housing development
process is documented back as far as Craven (1969).
3.4.1 Commercial residential property development process and its actors
At a basic level the commercial development process can be considered as the
acquisition of land, the production of developments and disposal of the built assets
for acceptable levels of return (Byrne, 2005). It is an event-sequence model which
progresses from conception to disposal of a built asset (Healey, 1991).
Commercial building and property development in reality is a more complex
process which requires government permissions, space planning policy, public
scrutiny, changes of land use and quite often long periods of manufacture
(construction) (Byrne, 2005; Wilkinson and Reed, 2008). Guy and Hennebury
(2000) consider the built asset to be the tip of the proverbial iceberg when
analytical attempts are made to explain the development process. They consider
property development to be complex process, entailing the management of
finance, materials, labour and skills across many actors within the social,
economic and political context.
UK housing development process tracks back to the 1947 Town and Country
Planning act which was designed to protect amenity and maintain the balance
between private and public land interests (Ratcliffe et al., 2004). This effectively
placed the decision on land use issues with the government. From the act the
modern real estate development process emerged (Ratcliffe et al., 2004).
The multiple stakeholder in the development process are linked by the property
developer. The interaction between these main actors is what constitutes the
58

development process and has a marked effect on what can be built and what does
get built.
The development process involves recognising that the different events which
occur over a significant period of time is rarely under the control of one
actor/owner/ company from initiation to completion (Healy, 1991). Core activities in
the development process centre on the initiation of the project, the design and
costing of the development, evaluation of the development appraisal by investors,
acquisition of land, obtaining planning permissions, implementation, construction
and asset disposal (Byrne, 2005; Wilkinson and Reed, 2008). It is important to
note that the construction process is not necessarily sequential and often phases
are repeated through-out the process or happen in a different order (Wilkinson
and Reed, 2008).
During the development process large amounts of capital are tied up and as the
return on this investment is affected by future market prices, the return on capital
is subject to significant market risk (Byrne, 2005; Wilkinson and Reed, 2008).
Therefore short periods of construction and carefully managed costs are essential
to successful development.
Property development is similar in many respects to any commercial
manufacturing process with a number of inputs used to create the final product.
The final product is the changing of land use or altering of a building through
combining land, labour, materials and finance (Wilkinson and Reed, 2008).
Wilkinson and Reed (2008) identify many intricacies specific to the property
development process which affect residential developments differently to other
manufacturing processes i.e. complexity, length of manufacture, levels of public
scrutiny, location and site characteristics. Wilkinson and Reed (2008) build on
Cadman and Austin-Crowe (1978) and Goodchild and Munton (1985) research on
event–sequence models for property development into the following 8 stages:
3.4.2 Stage 1: Initiation
Development is initiated when land is considered suitable for a change in usage or
a change in intensity of usage. The process can be initiated by any actors or
59

stakeholders in the development process, from land owners, commercial entities
and local authorities. In some cases the initiator will be involved from conception
to disposal of the build asset or may terminate their involvement in subsequent
development stages based on their specific objectives (Byrne, 2005; Wilkinson
and Reed, 2008).
Initiators shape developments based on their specific objectives and different
initiators will have different development goals. For example, private developers
may wish to profit maximise and dispose of the built asset as quickly as possible.
This may lead to higher density developments targeted at specific markets. Local
Authority initiators may prioritise social and affordable housing of other local
development goals.
Early stages in the initiation process include market research to establish demand
for a certain build type or volume, establishing the likelihood of planning
permission being granted for a certain development or permission for a change in
land use (Byrne, 2005; Wilkinson and Reed, 2008).
3.4.3 Stage 2: Evaluation
Widely considered to be the most important stage of the development process,
project evaluation is key to influencing the type of development to be built. This is
normally based on financial appraisal and assessment of alternatives using
economic tools combined with risk assessment.
Developers essentially take cues from the market as to what to build and when.
This is based on traditional economic cues like rising prices signalling to
developers that demand for certain building options is high relative to supply.
Falling prices indicate the opposite and fewer developments are actioned (Guy
and Hennebury, 2000; Helay, 1991). The ultimate aim is to minimise prolonged
vacancies or holding of empty built assets whilst maximising profit. Developers
and development choices are thus considered well defined and rational following
this deterministic approach to supply and demand (Guy and Hennebury, 2000).
60

The value of the land is established during the evaluation stage based on
economic cues and the build budget is determined based on the overarching profit
goals and targets. Whilst the professional team involved in taking this decision is
varied across professions the ultimate risk by deciding to proceed rests with the
developer. Consequently the financial and market appraisal is always undertaken
prior to any commitment to proceed and flexibility within the scope will allow for
changes to be made to the scheme. It is important to note that flexibility decreases
as the project stages progress. Market research has been given greater attention
within project development to allow more flexibility to meet market demands
(Byrne, 2005; Wilkinson and Reed, 2008). As such not tying developments into a
particular typology or build type is gaining greater traction within the market place
as a way to maximise profit (Wilkinson and Reed, 2008).
3.4.5 Stage 3: Acquisition
Once a development has been initiated and evaluated it is important to proceed
through the various legal and investigatory processes. Ownership must be
established, existing planning permissions identified and investigated, and public
rights of way etc established. The necessary permissions and allowances must
also be obtained (Byrne, 2005; Wilkinson and Reed, 2008).
Ground investigations work, surveying, load bearing capacities and access to
drainage, infrastructure, services, as well as any geological characteristics
identified that could affect the development (Reed, 2007; Byrne, 2005; Wilkinson
and Reed, 2008).
3.4.6 Stage 4: Design and Costing
Developers may work on a number of initial ideas with the professional team to
develop options to maximise return and meet development criteria in order to
develop a design brief. This sets the design parameters for the architect and
provides information to the surveyors and estimators. A well developed brief can
help keep initial design costs down prior to a developer fully committing to a
project. Design briefs usually include design work to create elevations of buildings,
locations of buildings on the site master plan, initial floor layouts and internal 61
arrangements, building specifications and initial materials lists for items such as
finishes (Reed, 2007; Byrne 2005; Wilkinson and Reed, 2008).
Whilst design and costing decisions are undertaken early on, as it also influences
the evaluation stage of the project, the design parameters can be considered a
somewhat continuous process spanning other stages to various degrees. As the
project progresses design and costing gets more detailed and provides greater
certainty to the development appraisal. Decisions are taken regarding the design
and development appraisal prior to seeking detailed planning permission as
design flexibility decreases as decisions are taken that shape planning
permissions (Byrne, 2005; Wilkinson and Reed, 2008).
During the design process the developers need for improving cost certainty
increases and the need to improve and finalise the cost estimates developed
during earlier stages becomes critical to establishing the financial appraisal.
Quantity surveyors usually become involved at this stage in order to make more
detailed cost estimates sufficient to enable negotiations with building contractors
(Reed, 2007; Byrne, 2005).
Designs usually progress significantly throughout the development process with
the final product often significantly varying from the initial design concept. It is
important to note that design changes later on in the development process are
usually far more costly than at the initial stages (Reed, 2007; Wilkinson and Reed,
2008).
Design and costing is also affected by funding and sources of funds (Radcliffe et
al., 2004). This is because parameters within the funds can significantly influence
what gets built in order to meet the funder’s requirements (Radcliffe et al., 2004).
3.4.7 Stage 5: Permissions
All property development in the UK involves planning permissions when
concerning the change of usage of land or building operation. The aim of the
planning process is to ensure that the right development happens for the benefit of
the local community and the economy (DCLG, 2015).
62
The permissions process has a critical role to play in identifying what development
is in relation to a specific location. It is also essential in determining what areas
need to be protected or enhanced (DCLG, 2015). The outcome of the planning
process is an assessment of whether a proposed development is suitable and
thus allowed to occur.
The planning system has recently undergone reform in order to encourage
sustainable development and simplify the planning system. This has resulted in
planning decisions now being taken at the lowest possible level with the
engagement of local people (DCLG, 2015).
According to the DCLG (2015) the majority of planning decisions are now made
within the three tier system of local government (County councils, District, borough
or city councils Parish or town councils). About 90% of planning applications are
decided through delegated powers by the local planning authority officers. Larger
developments are decided by planning committee, informed by officer’s
recommendations.
Planning permission is sought from the relevant local planning authority. Outline
planning is often sought prior to full approval in order to establish the likelihood for
the land use change before a full planning submission is compiled. Outline
planning only requires sufficient information to describe the type, size and form of
a scheme but does not allow a development to proceed with a particular scheme
without detailed planning consent (Reed, 2007; Byrne, 2005; Wilkinson and Reed,
2008). The advantage of outline planning is that it allows a developer to gain an
understanding of a site’s potential without the cost of full planning. This makes it
cost effective to submit outline planning before the site is purchased.
According to Reed (2007), Byrne (2005) and Wilkinson and Reed (2008) detailed
planning consent involves submitting detailed drawings, access, detailed design,
external elevations and landscaping. They consider obtaining planning permission
to be quite complex and state that it involves both legislative and local knowledge
of a particular planning authority. A main point they note is that the developer may
have to enter into contract with the local planning authority. This is because part of
the planning agreement may need to be negotiated during the planning approval 63

process. These planning agreements may add additional items to the
development plan which are not covered as planning conditions but must still be
met, such as improvements to local facilities or the provision of services and
infrastructure. Reed (2007), Byrne (2005) and Wilkinson and Reed (2008) all
consider these conditions to impose additional development costs which can
affect the viability of a scheme to a greater or lesser degree (Reed, 2007; Byrne
2005; Wilkinson and Reed, 2008).
3.4.8 Stage 6: Commitment
Once all the preliminary work outlined in processes one to five has been
completed and statutory permissions negotiated, the developer becomes liable for
commitment to the project. Whilst the costs in the earlier processes are kept to a
minimum before any substantial commitment is made, the developer now
becomes liable for the more substantial outlays of capital. Usually this has taken
some time and many developments are re-evaluated at this point to make sure
that there have not been any significant changes in housing values or the cost of
finance that may jeopardise the viability of the project (Reed, 2007; Wilkinson and
Reed, 2008).
Most of the financial commitment up until this stage has been in the form of
consultancy and professional fees, however, the development will now require
investment to excise options on land and commit to land purchase. Conditional
contracts are usually drawn up in lieu of finance being obtained and subject to
planning in order to mitigate some of the risk relating incomplete items. Contracts
requiring the land acquisition finance and appointing contractors and the
professional team will be signed at this point and this signals commitment to
pursuing the development. At this point risk significantly increases (Byrne, 2005;
Wilkinson and Reed, 2008).
3.4.9 Stage 7: Implementation
Implementation occurs when there is a commitment to a development and building
type at a defined cost. The build program is accepted which spreads the costs of
the development over the timeline for the development. An important point to note 64

at the implementation stage is that flexibility in the development plan is greatly
reduced. Many developers, in order to de-risk projects, try to keep the maximum
flexibility until the implementation stage as the latest possible point for change.
Project management is critical at this stage in order to coordinate the design and
processes to bring the project in on time, budget and specification. Delays which
occur now have significant implications for the developments budget (Byrne, 2005;
Wilkinson and Reed, 2008).
3.4.10 Stage 8: Disposal
Disposal is the point at which the built asset moves into its in use phase and is
sold on by the developer. In this respect disposal refers to the sale or rent of the
buildings built during the development process. The end use of the built asset is
often considered early on in the development appraisal stage although disposal
usually occurs in the latter stages. Many developers seek to ensure owner
occupation occurs early on by pre-selling off plan. This can significantly help de
risk a project and assist in obtaining funding. The main determinant of most
developments is the ability to meet the desired disposal price forecast in the
evaluation stage (Byrne, 2005; Wilkinson and Reed, 2008). The disposal may
involve private for sale, letting or sale to a housing association or body. Whilst this
is the final stage in the development process the developer’s responsibilities do
not end here. There is still a need for the developer to maintain contact with the
occupier to maintain and manage warranty and defects periods even though no
direct relationship may exist (Byrne, 2005; Wilkinson and Reed, 2008). Therefore
post occupation management needs to be considered as part of the development
process to earn the developer a good reputation. The financial success of the
development can now be fully assessed against initial development appraisals
and cost plans (Reed, 2007; Byrne, 2005; Wilkinson and Reed, 2008).
3.5 Specific issues relating to zero carbon development
In additional to the typical issues faced by national house builders within the
development process, national house builders cite additional barriers specific to
implementing low carbon housing. Research by Goodier and Pan (2010) and by
65

Ball (2010) identified major barriers to commercial viability within this sector,
further highlighting the un-readiness of the market for absorbing zero carbon
designs and constructing zero carbon homes. The following points are considered
to create major hurdles for the zero carbon housing sector;
• Pricing. Impact on construction prices, and therefore sales prices, in a
price sensitive market creates a major concern which is currently holding
the industry back. Developers have indicated that consumers are not willing
to pay more and builders are not willing to take a reduction on profit without
an offset in cost. As such it is implied that there is, as yet, no market for a
commercial scale zero carbon housing sector. These issues affect the
initiation, evaluation, design and costing and disposal phases.
• Uncertainty and durability. Uncertainty exists about the durability and
ongoing costs of maintaining zero carbon buildings and proof is needed
that these are unlikely to have significant impacts. Until such proof is
offered, commercial builders are reluctant to incorporate these niche
technologies. These issues mainly impact upon the evaluation, design and
costing and disposal phases.
• Resistance. The level of consumer resistance to new technologies may
be too great, with parallels being drawn to that of problems faced with the
introduction of energy saving light bulbs (Goodier and Pan, 2010). Current
industry concerns are such that if zero carbon facilities are misused or
turned off, which they deem likely, the basis for installing them is eroded
alongside the motivation to do so, (i.e. why should the industry go to the
effort and cost to build them when they will not be used in the designed
manner anyway). Whilst this could be considered a somewhat facetious
argument, Goodier and Pan (2010) highlight this as a concern, which has
attracted broad consensus within the commercial house building industry.
These issues affect the initiation, evaluation, design and costing and
disposal phases.
•Low carbon technologies. Novel technologies are a concern as these
could extend build costs. Extended build costs in turn impact the supply, 66

cost and risk factors within a building project, thus increasing the difficulty in
obtaining construction finance. As there is greater perceived risk by
investors, securing funding for innovative projects with higher technical risk
is more difficult. To mitigate this, if investors can be found, the rates of
return required are significantly higher than for conventional builds due to
the uncertainties. This can make it financially unviable to build a
commercial large scale zero carbon development. Problematically these
issues affect the initiation, evaluation, design and costing, commitment,
implementation and disposal phases.
Whilst these are serious concerns, it is not yet understood how these issues
actually translate within the context of real zero carbon projects due to the lack of
commercial drive or legislative pressure to build them. Thus how these issues
affect the commercialisation of zero carbon homes throughout the development
process requires further consideration. To do this they have been grouped as
relating to either cost, market potential or risk (Goodier and Pan, 2010; Ball,
2010). The effect each of these issues have on the development process in
relation to zero carbon homes is detailed in the following section.
3.5.1 Cost based issues
Cost based issues were identified from the literature as the most business critical
issue and are always at the forefront of national house builder mind-sets (Ball,
2010; Goodier and Pan, 2010; Zero Carbon Hub, 2009). High cost structures
impact on borrowing rates, ability to obtain finance and use of capital and can thus
create increased difficulties in project financing as well as generating lower rates
of return. As such many zero carbon developments fail to progress beyond
inception.
Cost based issues mainly stem from zero carbon design involving increased
technologies with low market penetration and high costs, as well as more costly
construction and installation techniques (Ball, 2010; Goodier and Pan, 2010; Zero
Carbon Hub, 2009).
67

The literature also identified additional implications relating to cost, such as a
current lack of established sales values for zero carbon homes and an un-
established market demand (Osmani and O’Reilly, 2009). In the UK this situation
could be further exacerbated due to the property valuation system, based on the
RIC’s red book approach (the UK’s mandatory rules and best practice guidelines
for built asset valuation) as it currently does not account for the financial benefits
from lower life cycle costs of zero carbon design (Osmani and O’Reilly, 2009;
Goodier and Pan, 2010).
There is also the potential for the housing design to be penalised for using
innovations that rightly or wrongly are perceived to be untested (Osmani and
O’Reilly, 2009; Zero Carbon Hub, 2009). However, these barriers are less clear
when considered at the commercial stakeholder level and further research which
includes other commercial actors such as investors, project managers and
medium as well as large scale house builders is needed to develop a richer
understanding of the field.
3.5.2 Market potential and demand
Market potential beyond niche markets was also identified as a potential issue in
the literature, mainly due to the perceptions that only green motivated consumers
want to live in environmentally efficient homes (Osmani and O’Reilly, 2009; Zero
Carbon Hub, 2009). The literature also identifies that energy efficiency and low
carbon living are just two factors that encompass a range of purchase decisions
(CABE, 2005; RICS, 2010). Issues such as proximity to urban centres versus a
rural location, proximity to local or specific schools and transport links etc. all have
marked effects on house purchasing decisions and therefore greatly affect the
value a zero carbon home can command (CABE, 2005; RICS, 2010). Research in
the UK by Castell (2010) and CABE (2005) does indicate the market potential for
adopting sustainable lifestyles is increasing, however, industry analysts consider
there to be a lack of consumer willingness to pay for technologies that require
behaviour change (Castell, 2010; Bryant and Goodman, 2013; Osmani and
O’Reilly, 2009). In the UK the resistance to technologies that require significant
user practice change is considered to be high (Castell, 2010). Recent
68

developments in design have helped to reduce costs and user practice change
regarding zero carbon living, making it easier for traditional home owners to
transition to zero carbon living without significant user practice change i.e. the
improvement of automation in renewable heating systems and reduced
requirement for biomass systems etc. As a result it is pertinent to now revisit these
issues to provide further empirical evidence for market potential and explore if any
of these issues have changed from a commercial actor perspective.
3.5.3 Development risk
The final category of issue identified in the literature was the potential for zero
carbon designs to effect development risk. Risk effects projects in two ways, both
at the individual development process steps and through the combined effect on
overall project risk. This appears to stem from the combined affect of potential
construction delays, reduced marketability, increased costs, increased
technological uncertainty as well as a reluctance to enter into the unknown
(Osmani and O’Reilly, 2009; Zero Carbon Hub, 2009; 2011; Goodier and Pan,
2010; Ball, 2010). The industry led perception is that higher construction cost zero
carbon homes are such an unknown quantity that, when combined with potentially
lower profitability and demand, large scale zero carbon projects are undesirable at
best and potentially commercially unviable at worst. Whilst recent design
improvements and step changes in zero carbon architecture can also be viewed in
the same risk category, there is a strong case for conducting further empirical
research to see how design changes affect risk through reducing costs, simplifying
design or providing additional sales attributes.
The next section looks at the impact housing and energy policy can have on
implementing zero carbon homes.
3.6 Policy sub- regime: Housing policy and renewable energy
New build housing policy in the UK is a combination of voluntary standards,
regulation and legislation. The first set of national building standards go back to
1965 but the modern standards stem from ‘The Building Act 1984’. The building
act introduced functional standards, performance standards and test of adequacy, 69

reasonableness and appropriateness and competition. These were supported by a
raft of statutory guidance detailed in the Approved Documents which have been
replaced over time with the current set of building regulation. However, there are
now essentially 100 different and often conflicting policy instruments detailed in
over 1500 pages of documentation published by the DCLG (DCLG, 2014). These
regulations also cover affordability targets, accessibility, grant funding and
planning applications. The most relevant of these documents for this study relate
to energy and environmental protection.
3.6.1 Energy in buildings policy
Energy regulation is set out in Part L1A which details the minimum standards for
regulatory compliance. Part L1A does not promote best practice but states the
minimum requirements only. Best Practice for energy efficiency, reduced carbon
production and environmental protection are incorporated in the Code for
Sustainable Homes (CfSH). Unfortunately the CfSH is only voluntary and most
national builders default to the guidance covered in Part L1A and not the CfSH.
New house construction, more specifically for energy in new builds, is covered by
‘PART L1A: Conservation of Fuel Power’ section of the building regulations (CLG,
2010(c)). Recent changes to the regulations have expanded to include carbon
emissions for new dwellings with the heating standard expanded to include carbon
neutral and zero carbon technology (CLG, 2006 (b); CLG, 2010(c)). Ventilation
and air conditioning also have inclusions in the standard which bring it in line with
the EU ‘Energy Performance of Buildings Directive’ (DIRECTIVE 2002/91/EC).
The ‘Energy Performance of Buildings Directive’ also brought in energy
performance certificate criteria to monitor, control and communicate compliance
with target emissions rates of buildings with specific purpose of contributing to
tackling climate change via buildings (DIRECTIVE 2002/91/EC).
Until recently the relationship between Part L and the CfSH has been converging
so that the building regulations would eventually incorporate the increasingly tight
energy efficiency and carbon emission standards contained within the CfSH (CLG,
2010; DCLG, 2007; Association for the Conservations of Energy (ACE), 2013).
70

The desired end point for this process should have resulted in zero carbon
standards becoming mandatory by 2016. Unfortunately the revision of Part L in
2013 did not go as far as what was first thought in setting out the minimum
standard (ACE, 2013). This signalled the start of a divergence from the CfSH and
the first signal that the roadmap towards a decarbonised sector in 2016 would not
be followed (ACE, 2013). The 2013 revision should have lifted the minimum
standard up to code level four of the CfSH but did not. It was also delayed by a
year and did not take affect until 2014 (ACE, 2013). When the planned date for
decarbonisation of the new build sector is penned for 2016 this lack of progress is
particularly concerning. Where the industry now stands is that the energy
efficiency and renewable energy requirements contained within Part L1A fell well
short of what was intended and is unlikely to drive the required learning and cost
innovation through the industry to meet 2016 targets. Due to this fact energy in
building regulation is unlikely to be the driver towards achieving best practice and
thus it is important to understand what drivers do exist.
There are two main drivers. The first driver was the ‘Planning and Energy Act
2008’ which enabled local authorities to press for more stringent energy efficiency
and carbon reduction targets then required by Part L1 under what was known as
the ‘The Merton Rule’ (CLG, 2010; DCLG, 2007; ACE, 2013). This rule allowed
authorities to stipulate that up to 10% of energy required by a building must be
from renewable sources. The act is part of the localism agenda and individual
council can choose to incorporate it or not. At the time of writing the act is
currently undergoing repeal based on the premise that Part L1 is now sufficiently
robust to remove it (CLG, 2010; DCLG, 2007; ACE, 2013). As demonstrated
above, the amendments to Part L1 have in fact fallen short of what was originally
intended. The second main driver is the CfSH and this is covered in depth in the
next section.
3.6.2 The ‘Code for Sustainable Homes’
The CfSH has been developed in order to address the shortfall that most homes
are not built to current best practice but instead to the minimum level required by
regulations. Whilst significant improvements have been made in the last 20 years
71

to increase energy efficiency of buildings, contributing to around a 70%
improvement of new build homes over the 1990 levels, 25% of total UK carbon
emissions resulted from domestic energy usage in 2010 (CLG, 2010b; DUKES,
2010). With further improvements drastically required the CfSH was developed to
augment energy and building policy. The CfSH is split into nine categories which
cover the areas of energy use and carbon emissions, water, materials use,
Surface Run-off, Waste, Pollution, Health and Wellbeing, Management and
Ecology and build on the BRE’s Ecohomes standard (BREEAM, 2011). The CfSH
was built out of the Eco-homes standards but differs by introducing more stringent
minimum performance levels. As a result a previous ‘very good’ standard under
Ecohomes roughly equates to the lower levels of the CfSH (BREEAM, 2011).
Each of the nine categories encompasses a number of environmental impacts and
subsequently encourages the construction of well-designed and adaptable homes
(CLG, 2010; CLG, 2006). In order to meet the various levels of the CfSH the
building must meet the requirements set-out under each design category and
score a specific number of percentage points against the criteria.
Whilst the CfSH covers all these areas of housing construction, it is heavily
weighted towards energy usage and reducing carbon emissions. The CfSH allows
flexibility in meeting the requirement and also allows for certain tradeable points in
some categories however the minimum standards within the energy and carbon
categories are mandatory. In addition to this 21.4% of all available points required
to achieve the minimum ratings for a level are allocated to energy and carbon
reduction measures (McManus et al., 2010). The largest numbers of total credits,
31, are allocated to energy and emissions and the highest weighting factor of
36.4% is applied to Energy and Carbon (CLG, 2010; CLG, 2006). For comparison,
the next highest weighting is 14% and these are available for the health and
wellbeing category (CLG ,2010; CLG, 2006).
The previous BRE standard under Ecohomes related 22% of the overall points
(CLG, 2010; CLG, 2006; BREEAM, 2011). This emphasises the importance of
addressing problematic energy consumption and high levels of carbon production
from the domestic sector. Energy and carbon reduction methods are assessed
72

against the following criteria; Dwelling Emission Rate, Fabric Energy Efficiency,
Energy Display Devices, Drying Space, Energy Labelled White Goods, External
Lighting, Low and Zero Carbon Technologies, Cycle Storage and Office/ Work
space (CLG, 2010b).
The CLG report for 2006 on the CfSH states that the main intention of this
category of the code is to limit atmospheric carbon emissions. The code does not
state particular methods for achieving these standards and gives scope to the
variety of technologies and techniques that could be used to achieve them (CLG
2010; CLG, 2006). The Domestic Emission rate is calculated by estimating the
total carbon emissions per m2 per annum in (KgCO2/M2/year), taking into account
energy used for heating, cooling, hot water and lighting (CLG 2010; CLG 2006).
The Cyril Sweet report (2007) states that: ‘achieving high CfSH code levels above
level 3 will require the use of renewable technologies in some form or other’.
The reality is that the CfSH is not a set of regulations but merely a set of
standards that go above and beyond what is set for minimum compliance under
the building regulations, such as in Part L for energy efficiency. The fact that it is a
voluntary code of conduct limits its remit.
3.6.3 The reality of the CfSH
Importantly there is a legal obligation to assess a new home against the code
which seeks to provide adequate communication about a property to a home
buyer. The only exceptions where the standard is mandated is for social housing
when ‘Homes and Communities Agency (HCA)’ funding is sought (Homes and
Communities Authority, 2009). The HCA points out that many authorities are
already demanding a higher level of construction than is mandated and that they
will favour housing built to higher code standards (Housing and Communities,
2009).
In terms of impact, this has resulted in publicly funded new housing, operating off
tight margins, taking the initiative and becoming the emergent force in driving and
delivering more sustainable homes. In contrast the private sector, which operates
off high margins, is still dominated by sub best practice (RIBA, 2008; 2009).
73

Without mandatory assessment imposed on the commercial sector the majority of
new build properties will be built to minimum building regulation standards instead
of best practice prior to mandatory zero carbon introduction in 2016 (RIBA, 2008).
It is important to note that even in the public sector new build to code level 6 is still
rarely pursued.
The CfSH has come under criticism from both industry and government sources
from both pro and anti angles. The ‘Select Committee on Environmental Audit
(Twelfth Report)’ highlights the fact that around 2 million additional homes will
have been built prior to zero carbon legislation entering into force and this will
significantly impact 2020 carbon reduction targets. Industry analysts have been
seen to take the opposing view that if zero carbon standards are introduced prior
to 2016, affordability and scale of construction will be too adversely impacted and
thus house building targets will not be met (Select Committee on Environmental
Audit, 2008; rudi.net, 2010).
The regulatory responses to such polarised viewpoints seem to be favouring
industry based concerns surrounding maintaining housing volume and affordable
housing levels, however, to create a new build housing stock that can effectively
decarbonise the sector a harder line is required. This has led to some debate
about what zero carbon should mean. The HM Government Carbon Plan (2011)
(DECC, 2011a) states the intention to deliver zero carbon new homes from 2016
and zero carbon non-domestic buildings by 2019 without defining what a zero
carbon home is. This ambiguity means that a wide range of possibilities exist, with
Chadderton (2013) suggesting it could mean ‘zero net energy consumption, zero
net source energy use, zero emissions building, zero net energy cost, zero off-site
energy use, zero grid supply’.
The ‘Zero Carbon Hub’ announced in the 2011 budget review that only ‘as built’
building services covered by building regulations will be covered by the ‘zero
carbon home’ definition. This means that emissions from appliances such as
cookers, televisions and computers will be excluded. The Zero Carbon Hub is also
recommending that the definition is relaxed to allow for an increase in the CO2
emissions/m2 from 2016 onwards. The effect that this has had on commercial
74

residential development has been to make achieving zero carbon status easier
and more cost effective. On the flip side this has significantly reduced the impact
that the domestic sector will have on 2050 CO2 reduction targets. As a result a
zero carbon home under regulatory definition parameters will in fact emit around a
tonne of CO2 per annum despite being termed zero carbon (The Zero Carbon
Hub, 2011; HM Treasury & BIS, 2011). When this is combined with the required
housing volume from 2016 onwards the impact on the sector’s carbon abatement
is greatly amplified.
This decision by the Zero Carbon Hub has also created a split between the
voluntary code for sustainable homes standards and the proposed 2016 building
regulations definition. Osmani and O’Reilly 2009 consider that this has created
ambiguity in the market place and because developers generally take cues from
regulation this has somewhat contributed to current stagnation.
Figure 3.1 below shows the recent and proposed regression of the zero carbon
standard and how much extra carbon will be emitted from a building regulations
zero carbon home compared to a CfSH zero carbon home.
Figure 3.1: Regression of the Zero Carbon Standard
Source: Adapted from Heffernan et al., 2013.
Figure 3.1 also introduces another proposed policy regarding off-site generation of
renewable energy. This is essentially a proposed tax on developers to off-set
carbon elsewhere in the economy and not on the property itself. If this is passed
on to consumers then essentially it is a tax on the consumer to pay for a low
carbon home without receiving the energy or cost benefits of those solutions
75

(Block, 2015). It also diverts additional carbon abatement from elsewhere in the
economy by allocating carbon credits to houses which could offset them within the
plot boundary.
The culmination of the consistent watering down and industry led lobbying has
resulted in far weaker regulatory requirements on national house builders. As
mentioned above, national house builders take their direction from the regulations
which makes this situation both undesirable and problematic.
In 2014 it was officially announced that the code for sustainable homes would be
scrapped in favour of reducing the number of policies and voluntary standards.
3.6.4 Other policy drivers
Based on the impacts and limitations of housing and energy policy it is important
to look at other policy drivers that could affect commercialising zero carbon
homes. One such driver is based on energy policy. Energy policy developments
promoting the inclusion of renewable energy into new build housing have heavily
focused on improving their investment potential. This is in response to cost
barriers faced by potential adopters by rewarding them with tariff payments (Jager,
2006; Massini and Menicheti, 2010; DECC, 2010; CLG, 2010). In relation to
energy, as more technically viable microgenerating solutions have emerged, the
need has arisen to assess not only the technological potential for energy
generation but also the economic viability for both complementary and competing
technologies. What is apparent is that uptake is being shaped not only by the
social and technical context but by the political and economic contexts as well.
There is a large body of research which points to cost barriers to renewable
energy implementation, such as by Massini and Menicheti (2010) and Jager
(2005). This supports the rationale underpinning the Feed in Tariff (FITS) and
Renewable Heat incentive (RHI). This body of work is not revisited here but the
impact on zero carbon homes is (for more details on the rationale and
development on FITS schemes please see Massini and Menicheti (2010), Jager
(2005) and Mendonca (2010)). The impact of renewable technology policies on
zero carbon homes is not their ability to reduce capital costs but their potential to
76

encourage uptake through reduced life cycle costs. As many technologies are
economically unviable from a purely avoided energy cost basis economic support
policy has become essential (Massini and Menicheti, 2010; DECC, 2010; CLG,
2010). What has been seen in the industry since 2010 is that the retrofit market
has developed significantly in incorporating onsite photovoltaics. Consequently
there is scope to investigate how these policies could improve the uptake of onsite
renewables in new build homes.
3.7 Challenges for a decarbonised residential development sector
Commercial house builders are defined as overly risk adverse, reluctant to
innovate, inefficient and cautious towards investment (Goodier and Pan, 2010;
Barker, 2003). Unfortunately zero carbon homes are innovative untested designs
and as such they increase cost, risk, and require supply chain innovation (Goodier
and Pan 2010; Ball, 2010). This creates barriers within the development process
which has significant implications for commercialising zero carbon developments
(Goodier and Pan, 2010; Ball, 2010). Costs and price constraints are the first
impact area where barrier and resistance to innovation exist.
3.7.1 Costs
Table 3.2 details the results of a cost comparison of completed zero carbon
homes in the UK. The documented costs for zero carbon designs range from 40%
to almost double current designs.
Table 3.2 UK Build Costs for Zero Carbon Homes
Project Costs Per m2Building regulations 1,070£ Bere Architects Code 6 1,700£ Miller Zero Aircrete house 1,608£ Miller House Merton Rise 1,423£ Kingspan Lighthouse 1,938£
Source: Cyrill Sweet 2007, Code for Sustainable Homes 2010;Bere Architects 2010,Miller Zero Homes 2010, Kingspan 2009)
Increased costs can, however, be mitigated by increased sales values.
Unfortunately there is currently a lack of established sales values for zero carbon 77

homes (Zero Carbon Hub, 2009; Goodier and Pan, 2010). The result is that zero
carbon homes may not command sufficient price premiums to commercially justify
them. This stems from historic housing valuations which have resulted in lower
mortgage offers (Zero Carbon Hub, 2009; Goodier and Pan, 2010). This is created
by the valuation system unjustly penalising innovative designs for perceived
maintenance issues, aesthetic changes and technological unknowns impacting
market value (Zero Carbon Hub, 2009). House buying criteria also exacerbates
this. Sustainability and energy efficiency are just two factors within a plethora of
purchase decisions spanning location, school catchment areas, transport links, etc
and whilst energy efficiency is becoming more important, due to the subjective
nature of home buying criteria there is an inherent limit to the additional value zero
carbon homes have (CABE, 2005; RICS, 2010). The combination of the increased
costs, lower historic values and a price constrained market implies that zero
carbon homes will be the least profitable type of home to construct commercially.
3.7.2 Demand
Another critical barrier is accurately establishing demand (Byrne, 2005; Birrell &
Bin, 1997; Wilkinson & Reed, 2008; Callcutt, 2007). Due to the way the
development process works, this must occur at the development phase and
predicted accurately to protect investors. Demand is usually predicted using
market and historical data, however, documented sales history for commercial
scale zero carbon homes does not exist. Calcutt (2007) considers that predicting
demand for standard houses in the current market is difficult thus accurately
predicting demand for zero carbon homes is highly improbable. He also considers
accurately predicting demand and managing uncertainty as essential components
of successful development and therefore zero carbon development is inherently
more difficult.
3.7.3 Construction techniques
In combination to these issues, zero carbon homes often use novel methods of
construction. A lack of historic construction data for these methods create
additional risks of overspend on budgets and construction delays. Whilst
78

overspend clearly correlates to profitability, delays to the construction phases also
affects it by delaying the disposal of assets. As capital is committed early on in the
development process and cannot be realised until the disposal of the asset, this
can have pronounced effects of investment returns (Byrne, 2005; Birrell & Bin,
1997; Wilkinson & Reed, 2008). The Callcutt report considers novel construction
techniques to increase the risk of component failure and thus costs for post
construction rectification. Ball (2010) confirms this, suggesting tried and tested
methodologies have led to the current housing market enjoying lower risk to other
developments; this may not be so for zero carbon development.
Zero carbon housing, however, could be considered to reduce risk at some stages
of the development process. Planning risks could be reduced by incorporating
core sustainable development principles from national and local planning policy for
energy and resource reduction (PPS 1, 2005; PPS Supplement, 2007). As local
authority goals diversify further into this area, zero carbon developments could
have the upper hand over traditional builds when obtaining planning. As local
authority owned land is more likely to be made available if developments
significantly contribute to carbon reduction targets, site acquisition risks could be
reduced for zero carbon homes (PPS 1, 2005; PPS Supplement, 2007).
3.7.4 Existing research and knowledge gaps
Whilst the concerns described in the previous sections are serious, it is not yet
understood how these issues actually translate within the context of real zero
carbon projects. This is related to a lack of commercial drive or legislative
pressure to build such projects. Additionally these factors have not been tested in
conjunction with zero carbon homes designed to address commercial barriers, the
basis of this study. Combined with this there have been no attempts to quantify
the potential benefits of zero carbon living in financial terms in order to indicate to
the market that zero carbon housing could potentially attract a premium or the fact
that once zero carbon targets are implemented, selling a building regulations
home may become more difficult in the mid to long term. Thus there is significant
scope to re-examine these issues to identify if they are relevant to commercially
optimised zero carbon homes.
79

Whilst there is a good and growing body of work related to this field going back to
the sustainable buildings task group in 2004, there exists significant scope to
qualitatively examine potential issues within key strategic stakeholder groups. The
current body of research includes technical and sociological research covering
both quantitative and qualitative methods but more research is required in order to
help improve the commercialisation of zero carbon homes. This is evidenced in
their lack of penetration into national house builder portfolios. Williams and Dair
(2007) asked a question in 2007 that still remains unanswered. Their research
asked that, considering the level of policy and pressure group drive to build
sustainable homes, why are they not becoming a reality? Williams and Dair’s
(2007) research conducted quantitative research (63 interviews) with a mix of
development types and identified 12 barriers to be overcome. Their research was
project specific and not representative of the wider field but did bring to the fore
some of the key issues faced by commercial stakeholders.
Osmani and O’Reilly (2005), WWF (2005) and Carter (2006) have all conducted
quantitative research (125 interviews) in the field. The broad aims of this body of
work were to identify drivers towards implementing environmentally based
solutions. Whilst some of this work was conducted with commercial stakeholders
the main focus was on positive impacts from a corporate social responsibility
(CSR) perspective. Due to this, this research did not focus on elaborating the
wider impacts of commercialising zero carbon homes but instead focused on
generating insights into a narrower subset of findings. Whilst this research is
important to the field it is unlikely, given the step change required in national
house builders thinking, to think that CSR alone will bring about the requisite
change.. Work by WWF (2007) and Carter (2006; 2010) stated that going beyond
the minimum regulatory standards should be sufficient to create improved
branding and image and this should lead to greater adoption of such designs,
however, the progress of zero carbon design within the national residential
development sector has not echoed these findings. Osmani and O’Reilly (2009)
point to research from the Sponge network (2007), a UK not for profit sustainable
development organisation, to support claims that customer demand will drive
national house builders towards zero carbon designs. However, since 2007 the
market has not significantly shifted in this direction (Osmani and O’Reilly 2009).
80

Osmani and O’Reilly (2009) also considered the Code for Sustainable Homes
(2007) to be the best driver towards zero carbon design, however, this has not
been the case to date. Consistent watering down of the policy and its lack of
adoption in practice has not created the market they thought would occur when
they were conducting their research in 2009. Their quantitative paper does
broaden the field to summarise a limited range of commercial barriers from a
stakeholder perspective, however, its scope does not allow for a rich elaboration
of concerns across a full breath of commercial respondents, instead focusing on
explaining the quantitative research. It also focuses on national house builders but
does not include other stakeholders which also impact the development process.
Research by Heffernan et al. (2012) in 2012 broadened the field to include wider
stakeholders but their study was limited to 12 semi structured interviews with a
Housing Association, a Development Manager, a Contractor, an Architect, an
Energy Consultant, a Local Authority, a Planning Policy/ Building Control Officer
and a Government Agency. Their main findings related to the skills gap and whilst
they do identify issues with legislation and economics they do not provide
sufficient depth on how to address these issues (Heffernan et al., 2012). Their
findings do, however, support the literature findings from Callcutt (2007), NHBC
(2010), Osmani and O’Reilly (2009). Whilst this is important it does not sufficiently
answer the question set out by Williams and Dair (2007). Heffernan et al. (2012)
also only focus on the building regulations definition of zero carbon homes and do
not include truly innovative homes that seek to maximise decarbonisation by
including unregulated building load as well.
This research study intends to build upon the research conducted to date by
Calcutt (2007), Osmani and O’Reilly’s (2009), Goodier and Pan (2010), Heffernan
et al. (2012) but broaden out to include more stakeholders and to focus
specifically on an optimised design developed to address literature based barriers.
The premise of this research is thus to answer why there is still a lack of progress
in the field of mainstreaming zero carbon homes.
The issues identified above demonstrate the need for further investigation into
what the potential drivers of building economically and technically viable zero
81

carbon homes are as well as how to overcome the persistent barriers.
Developments in the field which incorporate policies, technology, economics and
new ways of thinking might provide an answer to the mainstreaming issue but
these are yet to be explored. Finally existing barriers need to be contextualised to
an optimised zero carbon design and further understandings generated as to
whether or not these barriers can be over come at the design stage. If new
developments in policy, technology and commercial drivers are incorporated into
the existing body of work new strategies that capitalise on them could be created.
Based on the existing quantitative data and the need to explore attitudes,
understandings and perceptions across stakeholder groups this research needs to
be qualitative in nature. This will enable both the exploration of new ideas and the
deeper understanding of whether existing barriers can be addressed in new ways.
Therefore, given the current body of work and the research questions still
remaining unanswered, there is a need to conduct further studies in the field, in
particular to:
Include more stakeholders from the wider and systemic field
To contextualise literature based findings with an optimised design
which aims to address these barriers
Elaborate on existing barriers from a key stakeholder perspective
Contribute to future research in the field by identifying areas of
research to be quantifiably verified
3.8 Current methods of designing sustainable buildings
When designing sustainable buildings it is the responsibility of the architect and
the engineer to design a building that optimises the electrical, heating and cooling
loads and selects the type of equipment that is used to satisfy the buildings energy
demands (Lechner, 2008; Dunster et al., 2008). Lechner (2008) suggest three
tiers to sustainable design;
1. The basic design form and fabric. It is the architect’s role to specify
materials to use and use them to reduce loads.
82

2. The design of passive gains: It is the architects role to reduce energy loads
by maximising passive design and utilise free energy gains
3. The specification of mechanical and electrical equipment: to meet these
loads is the role of the architect and engineer to design the mechanical and
electrical system to satisfy energy loads.
Dunster et al. (2008) set out similar principles in the ZED standards approach to
sustainable design. The ZED standards approach advocates optimising the main
elements of the building fabric first. Reducing thermal demand through improving
the building fabric is given priority and the building fabric needs to be highly
insulated to do this. The wall, floor and roof construction should aim to reduce U-
values to a minimum of 0.14 W/m2k and control heat loss through glazing
elements by using windows, either double or triple glazed with a U-values around
1.0W/m2K. In the UK large windows should be placed on the southern aspect and
glazing elements minimised on the northern aspect. This is to reduce heat loss
and maximise passive solar gains.
The main aim of improving insulation levels is to reduce the peak loads, base
heating load and thus enable smaller and more efficient heating plant to be
installed. The plant will also be needed for shorter periods during the heating
season. A highly insulated building also keeps more of the internal gains inside
the building.
A key component of the ZED standards regarding insulation is that this should
firstly be continuous and secondly at a consistent depth across the whole building
envelope. This is because any gaps that exist will create cold thermal bridges
which will allow heat to flow from inside to outside the building. The higher the
levels of insulation the more important this becomes as heat loss via thermal
bridging will account for proportionally more heat loss.
In addition to reducing the U-value of the building elements the mass of the
building, using thermally massive materials, should be improved. Materials that
are thermally massive have the ability to store heat and release it when the
internal temperatures drop. The more thermally massive the building the greater
83

use of solar gains that can be made. It is important to size the depth of the thermal
mass to mirror diurnal and nocturnal temperature swings. In the day time the
building is prevented from over heating because the thermally massive material
stores heat. When temperatures drop at night heat is released back into the
building reducing the load on the heating plant. Materials with a high specific heat
capacity, a high density and a moderate thermal conductivity should be prioritised
so that the maximum amount of heat can be stored in the minimum amount of
material and released at a rate that is in line with the buildings daily heating and
cooling cycle.
With the building properly insulated it should also be made as airtight as possible.
This involves taping and sealing joints and penetrations so that heat loss via
infiltration is minimised. Wet internal trades such as plaster can contribute to
higher levels of airtightness if detailed correctly so that plaster is continuous down
to the screed/ floor level with the joint taped and hidden by surface finishes. Once
a building is highly insulated, thermally massive and as airtight as feasible
ventilation becomes and important factor to control. Air needs to be exchanged to
ensure the health of the internal environment and occupants by controlling oxygen
and carbon levels, moisture and odour. In traditional builds infiltration and natural
ventilation is sufficient to control this without mechanically ventilating a building,
however, airtight buildings do not sufficiently allow this. As a result ventilation
becomes one of the biggest sources of heat loss in a ZED standards building due
to heat being lost every time air is exchanged with the outside environment. This
creates the need to control ventilation and to exchange air but recover the heat
content. This can be achieved by routing all colder incoming fresh air and
exhausting all warmer stale air through a heat exchanger. The exchanger allows
heat to be recovered without mixing the air flows. The result of this is that the
internal air volume can be ventilated with very little heat loss based on efficiencies
of over 90%. The ZED standard advocates improving airtightness to 1.5 air
changes per hour at 50 Pascal to provide a healthy internal environment with
sufficient air changes when used in conjunction with a heat recovery ventilation
system.
84

In conjunction to this the building should be properly oriented to maximise solar
gains and natural lighting in the UK. The minimum standards in the ZED standards
tool kit form the basis of a well designed zero carbon home. The remaining energy
load can then be met though a mix of energy efficient technologies and grid
connected renewable energy systems such as solar thermal panels, photovoltaics,
air source or ground source heat pumps, micro wind or biomass.
Both Lechner (2008) and Dunster et al. (2008) focus on developing buildings
which function better by using less energy, less resources and producing less
carbon. They develop their philosophies into thorough guidelines detailing the
different approaches an architect and engineer could take towards achieving
sustainable design goals, however, neither publication adequately takes into
account the role of meeting commercial stakeholder objectives in designing
buildings. Consequently their publications draw on the fact that there are many
different techniques for creating sustainable buildings but do not address the fact
there are very few buildings, in the UK at least, that incorporate all their design
elements in a holistic design. This is what needs further elaboration in order to
understand why.
In addition to the elements outlined above the ZED standards philosophy does set
out to dismantle some of the objections to zero carbon standards from a technical
and implementation perspective but does not fully develop solutions to many key
stakeholder objections identified. For example, Dunster et al. (2008) acknowledge
that residential developers have usually invested in land banks so are highly
motivated not to increase the capital costs by including zero carbon standards,
however, they do not offer an effective solution to the capital expenditure issue.
The research in this study proposes that addressing the main commercial barriers
and stakeholder issues by better informing the design choices architects and
engineers make may help create a solution to improve implementation. It is
argued that by including these issues early on it will be possible to bridge the gap
between the commercial residential development sector, architects and engineers
so that more commercially viable sustainable buildings can be created for the
wider market.
85

3.8.1 Problems in current methods of designing sustainable buildings
Lechner (2008) emphasises the point that the most important work on reducing a
buildings impact is done at the design stage. Thus decisions, both technical and
economical, are best made early on in the design process. If this principle is
furthered by incorporating stakeholder drivers and barriers at the design phase
then it is argued that a more commercially viable building can be created.
Dunster et al. (2008) state that architects should take the lead on developing
houses that are super-insulated, airtight, have properly oriented windows, use
correct U-value assumption, utilise passive gains and solar gains, have highly
efficient appliances and low energy lighting and maximise the use of renewable
technologies (Lechner 2008;Dunster et al., 2008).
Neither Lechner (2008) nor Dunster et al. (2008) offer easy fix solutions. They are
holistic approaches that require an understanding of all elements of the design
process and the buildings functionality. Both approaches focus on developing
buildings which function better by using less energy, less resources and producing
less carbon. Lechner (2008) and Dunster et al. (2009) develop their philosophies
into thorough guidelines detailing the different approaches an architect and
engineer could take towards achieving sustainable design goals, however, neither
adequately take into account the role of meeting commercial stakeholder
objectives in designing buildings. Whilst this is desirable from a design purists
perspective and somewhat from the energy systems specification perspective it
does not address the issues that whilst there are very few buildings in the UK that
incorporate all these elements.
This study proposes that incorporating the main commercial barriers and
stakeholder issues into the design choices architects and engineers make may
help create a solution and improve implementation. It is argued that by including
these issues early on it will be possible to bridge the gap between the commercial
residential development sector, architects and engineers so that more
commercially viable sustainable buildings can be created for the wider market.
86

It acknowledged here that any methodology created that includes stakeholder
objectives will narrow down some design choices and perhaps eliminate some
options that are not suitable for the UK commercial residential market, but it is
argued here that what will be left will be a guiding methodology that will be more
appropriate for creating both sustainable and commercially viable buildings then
what is currently proposed by both Lechner (2008) and Dunster et al. (2008).
3.9 Optimising the design of sustainable buildings from a key stakeholder perspective
This study aims to develop a design philosophy based on the analysis of the
socio-technical systems theory, the MLP and the housing regime. This analysis
will be used to determine design objectives for developing an optimised zero
carbon home. The design philosophy will then be used to develop a methodology
that effectively merges the principles of good residential property development
and leading sustainable building design into an integrated approach. At the same
time, key commercial stakeholder barriers would attempt to be addressed at the
design phase.
The design philosophy will take the same holistic approach to building design as
both Lechner (2008) and Dunster et al. (2008) and follow in their techniques to
achieving zero carbon buildings. The research developed aimed at being added to
the design lexicon developed by these authors in order to further their work into
the field of commercial viability. As such the design methodology does not intend
to develop a blue print for all sustainable homes, it tries to leave some flexibility
within the design process, but does test the design principles by developing a
specific design to be modelled and tested with stakeholders.
The design methodology will not seek to influence what Lechner (2008) defines as
the ‘journalism of architecture’ nor will it seek to address what he defines as the
‘Blandness of modern architecture’ or the ‘Inappropriateness of copying previous
styles’. It will not seek to address issues arising from culture, shape or form which
create the identity of a building; influencing how a building is read (Lechner 2008).
It will ignore, to a certain extent, the vernacular of a building, however, the building
87

developed from the methodology is designed for the UK climate so to a certain
extent follows the UK vernacular. The methodology will not seek to develop a
particular style (form) or lend itself particular to one style of architecture over
another. It will, however, seek to ensure that the buildings designed will be correct
for their function, climate and location. It is important to note that the only limits
imposed on the form are those which directly affect energy performance. The
methodology developed here will ignore building finishes, either internal or
external, that are not integral to energy performance. The elements that will affect
aesthetics are primarily: the building orientation, the south facing roof pitch and
size, the window size orientation and specification, the wall thickness and the
optimal placing of energy generating technologies such as photovoltaics (Dunster
et al., 2008; Lechner et al., 2008).
The aim of the process is to develop objectives which need to be met at the
design stage of a zero carbon project alongside sustainable building principles
adapted from Dunster et al. (2008) and Lechner (2008). The design objectives are
contextualised within the UK socio-political and socio-technical environment.
The objectives will be designed to be added to Lecher’s (2008) three tier approach
and to Dunster et al. (2008) Zed standard approach to sustainable building design
to augment them, not replace them. They are designed to be universally
applicable to any zero carbon housing project in the UK. The design details of
Lechner (2008) and Dunster et al. (2008) approaches are not described in detail
here but are referred to throughout the design methodology section i.e. the
principles of passive design, increased air tightness, super insulation, thermal
mass, high performance windows, use of low energy technologies etc. This is
because the design methodology developed here is designed to build upon the
already established principles of sustainable design, but from a socio-technical
and commercial stakeholder informed approach.
3.10 Conclusion to literature review
Mackay (2009) defined climate change as essentially a carbon problem and
carbon as predominantly a product of energy generation and consumption. Under
88

this logic the answer to mitigating climate change should lie in reducing emissions
associated with energy (Mackay, 2009; Jackson, 2009). There exists a specific
need to reduce domestic carbon emissions as over 25% of all carbon emissions
can be attributed to this sector. A major component of the domestic emission
sector is the new build market. The diffusion of zero carbon homes into this
market has been too slow to make a meaningful impact on reducing new build
domestic sector emissions (Callcutt, 2007, Mlecnik, 2010; Osmani and O’Reilly,
2009). Creating viable markets for commercial house builders has been regularly
cited as the core problem but creating solutions to this have proven more difficult
than first envisaged by the policy makers who introduced the ‘Code for
Sustainable Homes’ in 2007 (Mlecnik, 2010; Osmani and O’Reilly, 2009; Miles
and Whitehouse, 2013). Many of the problems can be traced back to the lack of
defined plans for delivering the zero carbon targets in new build homes (Goodchild
and Walshaw, 2011). Consequently many zero carbon homes are still locked into
the green niches they carved out for themselves with little prospect of breaking
through to the mainstream market. Issues identified in this research affecting the
mainstreaming of these green niche designs point towards political, financial,
technical, market and cultural barriers.
Problems in the theoretical construct point to issues rooted in changing the socio-
technical system. These issues stem from the requirement to enact major socio-
technical change into a socio-technical system dominated by institutions with high
levels of dynamic stability, resistance to change, and powerful incumbents.
To better understand the problems with initiating change the MLP was used as an
analytical tool to analyse the house building regime in the UK and identify where
blockages may lie.
Whilst there are critiques of the MLP, such as its underplaying the role of social
practice, its hierarchal structure, the potential to over simplify, issues with
developing functional boundaries and the role of managing transitions it is a useful
research tool to try to understand how to improve the implementation of zero
carbon homes. Issues were identified at all levels of the MLP and with multiple
actor groups. Significant problems were identified at the regime level and the
89

impact these could have on innovations at the niche levels was found to be
substantial. As such, even though the wider macro level can be considered to be
developing a sustainability based back drop to the regimes, enacting change in
the regimes will be difficult.
The understanding of the issues at the regime level was enhanced by developing
an imagined end state system and back tracking to the current system. This
identified that the regime zero carbon homes will have to compete in is dominated
by the specific key actor groups such as policy makers, national house builder’s
lender, agents, architects and funders.
The actors groups and issues were then positioned within the development
process to identify what issues existed with current designs. What was identified
was that far reaching systemic change to areas such as building practices, the
relationships with energy supply and consumption, changes to the relationships
between consumers and energy supply companies, and an appreciation of how
finance and economics affects the buying behaviour of property owners are all
inhibiting factors. There are also critical consumer considerations to take into
account such as changes to the aesthetics of houses, user practice changes for
zero carbon living, cultural habits and social practice changes (Lee 2011; Roy et
al., 2007). These create distinct design challenges for architects and designers.
When developing zero carbon building designs it is the responsibility of the
architect and the engineer to design a building that optimises the electrical,
heating and cooling loads. They select the type of equipment that is used to
satisfy the buildings energy demands (Lechner, 2008; Dunster et al., 2008). As
such there is an implicit design challenge to address commercial barriers as much
as possible at the design phase. If architects and engineers are educated in this
design challenge from both a socio-technical and commercial stakeholder
perspective it may be possible to develop niche zero carbon designs with a
greater chance of breaking through to the commercial market. The current body
of research includes technical and sociological research covering both quantitative
and qualitative methods but more qualitative research is required in order to help
improve the commercialisation of zero carbon homes. This is evidenced in the
90

lack of penetration of innovative zero carbon homes into national house builder
portfolios. Thus, whilst there is a good and growing body of work related to this
field going back to the sustainable buildings task group of 2004, there exists
significant scope to qualitatively examine potential issues within key strategic
stakeholder groups and integrate solutions into designs.
In the technical field research by Lechner (2008) and Dunster et al. (2008) have
focused on developing philosophies into thorough guidelines detailing the different
approaches an architect and engineer could take towards achieving zero carbon
design goals, however, neither of the literatures adequately take into account the
role of meeting commercial stakeholder objectives in designing buildings. As such
neither fully develop solutions to the stakeholder objections identified by Callcutt
(2007), Mlecnik (2010), Ball (2010), Osmani and O’Reilly (2009), or Goodier and
Pan (2012). Also neither takes a socio-technically informed perspective to
commercialisation.
In summary there are distinct research gaps in both the technological and
sociology fields that warrant further investigation in order to establish the potential
of developing a socio-technical design philosophy. This study proposes that
incorporating commercial barriers and stakeholder issues into the design choices
of architects and engineers may help improve implementation rates.
The aim of empirical research developed from the socio-technical review is to
bridge the design-knowledge gap between the commercial residential
development sector, architects, and engineers so that more commercially viable
zero carbon homes can be created. By doing so it is posited that greater strides
can be made in increasing the deployment of renewable energy in new build
homes and reducing the overall environmental impacts of new build housing. The
findings and research developments from this section are used to shape the
research methodology and empirical research design in chapter three.
91

Chapter 4 Methodology: Optimising a Zero Carbon Home
4.0 Introduction
To achieve the aims of the research an enhanced design philosophy has been
developed out of Lechner (2008) and Dunster et al. (2008) models of sustainable
building design by integrating findings from the analysis of the socio-technical
review, the MLP, and the housing regime analysis. This design philosophy aims to
incorporate the principles of good residential property development, socio-
technical barriers and leading sustainable building design into an integrated
approach which addresses key commercial stakeholder barriers during the design
phase.
The result of this process is the development of design objectives which need to
be incorporated into the design stage of a zero carbon project alongside
sustainable building principles (adapted from Dunster et al., 2008 and Lechner,
2008).
This chapter of the research develops these design objectives into an applied
methodology. This methodology includes defining the building physics model
parameters, defining the economic and cost based comparison model, identifying
how to compare an optimised building to a building built to current building
regulations, and develops an optimised zero carbon home through repeated
refinement and design iterations. The optimised design is then introduced to the
key stakeholders identified in this study to develop a qualitative analysis of its
commercial viability. The methodology section covers these three components of
the research design.
Sections 4.1 to 4.5.2 of the methodology covers the process used to optimise a
niche zero carbon design based on the design objectives derived from the
literature and applied analysis.
92

Section 4.6 details the steps taken to identify and establish the techno-economic
performance parameters of the designs developed and how this design was
optimised from both a technical and economic perspective.
The final sections, 4.7 to 4.9, detail the empirical social research methodology
used to verify the commercial potential of the optimised housing designed
developed in sections one and two.
4.1 Developing an enhanced methodology
The enhanced methodology developed for this study has been used to create
design objectives for optimising a zero carbon design. These objectives have
been informed by the MLP research on barriers from specific stakeholder
perspectives. The design objectives are detailed below;
1.) Maximise decarbonisation above regulatory standards. Zero carbon homes
should offset the entire annual energy load of the building via grid connected
microgeneration technologies to make maximum impact in decarbonising the
sector by avoiding unaccounted for emissions. It is important to offset all carbon
emissions and exceed minimum regulatory standards because unregulated
energy loads account for approximately one third of domestic carbon emissions.
As such a zero carbon home under regulatory standards would still emit around
one ton or carbon per annum. Clearly this is not carbon neutral.
In addition there is support from the ‘Zero Carbon Hub’ that not all emissions need
to be offset on site and could potentially be accounted for via ‘Allowable Solutions’
(Zero Carbon Hub, 2011). Allowable solutions, similar to carbon credits obtained
from investing in low carbon projects off-site, can be viewed as reducing the
carbon abatement potential of the system as a whole. This is because they take
up offsets that could be achieved in addition to decarbonising the housing stock.
This perspective is viewed only as a last resort in this project without firstly
exploring the potential to fully decarbonise the house type in its entirety.
2.) Reduction and simplification of technologies. The number of additional
technologies required to create the zero carbon home should be minimised to
93

reduce both costs and the requirement for user practice change. Technologies
that are easy to use when compared to traditional heating and electrical systems,
and have a documented history of reliability should be prioritised. The issues of
cost reduction focus only on the over and above costs of zero carbon construction.
This is because there are certain base costs that are inherent to all buildings no
matter how they are built. All houses in the UK require a heating system, glazing,
walls with insulation etc. set out to a minimum requirement in the building
regulations. Zero carbon homes improve on these to such an extent that all the
energy required by the building is offset. As such it is important to only include the
additional costs arising for items such as renewables or extra insulation. For
example, using this method means that improvements to the heating technologies
have the base cost for a standard gas central heating system deducted to arrive at
the over and above costs. Only the extra insulation cost beyond minimum building
regulations are included and when any new materials are introduced that reduce
the need for an existing trade the existing trade cost is deducted. This
methodology is adapted from the Sir Cyril Sweet Report (2007) as this is an
accepted standard in comparing buildings built to different standards against each
other.
Additionally the literature review highlighted that zero carbon homes often require
technologies that users are not comfortable using or that require significant user
practice change. Biomass technologies have often been cited as an example of
this. As such, in addition to meeting commercial objects, simplification of
technology will place user practice at the forefront of design. The end house type
must be as simple to use or more automated then traditional control systems. As
these decisions will be made by the designer at the design stage, the usability
criteria will be taken somewhat subjectively.
3.) Cost reduction. The methodology for assessing cost reduction used in this
research is based on offsetting the additional ‘over and above costs’ of creating a
zero carbon home when compared against a benchmark cost of a building
regulations home. This is based on the methodology used in the Sir Cyril Sweet
Report (2007). Whilst eliminating over and above costs is an ultimate aim, due to
zero carbon homes inherently requiring additional new technology and more
94

materials quantities of items such as insulation, it is acknowledged that a zero
carbon home is likely to still be more expensive even after cost reduction.
4.) Justifying Additional Costs. Any additional costs that cannot be offset via
simplification or material substitution must be economically justified against
running costs reductions or incomes generated. Designs should seek to balance
additional costs with income generating microgeneration technologies supported
by government initiatives either in the form of FITs or grants. A microgeneration
led approach is proposed for this purpose in order to develop zero carbon homes
that could function on a single unit basis that also generate maximum investment
returns for owner-occupiers. Following the same strategy that cost reduction is
critical, new ways of justifying residual additional costs is essential. This study
proposes two methods to achieve this. The first is based on the offset of
operational costs such as reducing heating bills through additional insulation and
reduced electrical bills through renewable energy generation.
This second method is based on the literature review findings highlighting
renewable energy policy as a critical route to justifying expenditure. This will be
done through exploring policies and technologies designed to provide a return on
investment and excluding technologies that cannot justify their additional capital
expenditure.
A limitation of this method is that it excludes community led energy systems.
Whilst it is acknowledged that decarbonisation can be achieved using community
led energy systems, a microgeneration led approach was adopted in the design
philosophy for this study. This decision was taken so that the house types
developed did not rely on community based infrastructure projects to move
forward and were more in line with traditional build programs. It was considered
that this would remove a large barrier to community scale developments, providing
the designers and developers with a freer reign from a planning and development
perspective. This perspective was evidenced in the planning proposals for a
Zedfactory development in Shoreham port which was initially refused planning for
a communal biomass CHP unit but passed when the unit was removed.
95

In addition the house types and communities developed would not require the
additional complex legal, financial and managerial arrangements required for
community led energy service provisions by companies which would simplify the
house types further for the developers.
A microgeneration led approach was also preferred in order to develop zero
carbon homes that could function on a single unit basis and that generated
investment returns for individual property owners.
It is acknowledged here that any methodology created that is informed by
stakeholder objectives will narrow down some design choices and perhaps
eliminate some options that are not suitable for the UK commercial residential
market, but it is argued here that what will be left will be a guiding methodology
that will be more appropriate for creating both sustainable and commercially viable
buildings then what is currently proposed by authors such as Lechner (2008) and
Dunster et al. (2008). The rationale for using these design objectives are detailed
in the following section.
4.2 House type design
A detached 4 bedroom home with a gross internal area of 141 m2 was chosen as
the basis for comparison. 120m2 were inside the insulated area with the remaining
21m2 constituting attic space. Detached properties constitute 22% of the UK
housing market (Housing and Planning Statistics, 2009). Larger detached houses
are more difficult to design to zero carbon standards due to the lack of party walls
and increased envelope area. They are also likely to be the most costly building
typology due to the structural requirements. As such successfully developing a
detached model would provide data and better information to inform the design of
other typologies then vice-versa.
An existing niche zero carbon housing design created by Zedfactory architects
using the ZED standards approach was chosen as the baseline for optimisation in
this project. The house type was considered economically unviable by major
developers and whilst popular for use in bespoke projects and non-commercial
projects has not been adopted by a commercial builder.
96

Whilst most of the houses aesthetic qualities were left as originally designed the
sustainable design aspects and energy equipment were modified using the four
objectives and following Lechner’s (2008) three tier approach and Dunster et al.
(2008) ZED standards methodology.
Real dimensions and living areas could be used for modelling and optimisation.
This will give results more consistent with real world projects being undertaken,
and that are currently failing to break into the mainstream market.
The house type under study was 3 storeys with a room in the roof and attic space
on the third storey.
The gross internal floor area on the ground and first floor were 47m2 each.
Storey height was 2.5m for the ground and first floor and 2.68m for the
bedroom in the roof. A sloping roof pitch reduced the ceiling height at the
north elevation
The ground floor contained a 16m2 living area, and a 21m2 kitchen diner
and a 2.8m2 ground floor toilet
The first floor contained a 17.5m2 bedroom, a 7.5m2 bedroom, a 8.5m2
bedroom with 3.3 m2 en-suite, and a 4.5 m2 bathroom. A 1.5m2 Plant
cupboard was also on this floor
The second floor contained an 11.4m2 bedroom with a 3.6m2 en suite, 21
m2 loft area
Total external envelope area consisted of 18m2 of glazing, 185m2 of
external wall, 47m2 insulated ground floor slab and 47m2 insulated roof
It is important to note here that the aesthetics of the property are not under study
at this stage. The main focus of this research is the energy performance,
economics and usability of the building designed. That said the building designed
will still be able to benefit from a range of external finishes including brick slip,
timber cladding, rendering, zinc cladding etc.
4.3 Building physics97

This section details the calculation methods for the building physics modelling
4.3.1 Thermal and electrical load modelling
The house type was modelled to establish energy losses, energy usage, energy
use reduction and energy production. The initial modelling was conducted using
equations for space heating demands at 18°C set point (without a set back
thermostat), hot water demand based on 5 person occupancy based on ‘Energy
Saving Trust’ data stating an average inlet temperature of 16.2°C and the tank
temperature of 52.9°C, ventilation heat loss with heat recovery and predicted
appliance load electrical consumption. Solar gains and internal gains were then
calculated. Internal gains arise from lights, appliances, cooking and metabolic
gains from the occupants. Useful heat gains and metabolic gains were only used
during the heating season based on their utilisation factors. SAP (2012) standards
were used for metabolic gains.
4.3.2 Internal gains
Heat gains arise through windows and glazed doors. Solar gains for openings
result from heat gains through the glazed elements. Glazed elements with a
glazed area greater than 60% were included for solar gains. Solar gains were
calculated separately for glazing on different elevation orientations. The equation
for calculating solar gains was taken from SAP (2009). The following formula was
used:
Solar Gain = 0.9 ´ A ´ S ´ G ´ FF ´ Z
0.9 is the typical average ratio of transmittance at normal incidence (SAP,
2009)
A is the area the opening (m²)
S is the solar flux (sum of direct and diffuse solar radiation) on a surface in
W/m²
G is the total solar transmittance factor for the glazed element at normal
incidence (from manufacturer)
FF is the frame factor for windows and doors (fraction of opening that is
glazed)98

Z is the solar access factor due to over shading. This is assumed to be less
than 20% due to new build passive solar design and thus an access factor
of 1 is used here
S was calculated for the heating season using the table 3.1 below (from
SAP 2012) and the formula below for converting horizontal irradiance to
vertical:
Table 4.1: Solar Irradiance
Fx(m) = Rhtov(θ)Sh
Where:
Rhtov(θ) = A + B cos(θ) + C cos(2θ)
A = 0.702 − 0.0119 (ϕ − δ) + 0.000204 (f − δ)2
B = − 0.107 + 0.0081 (ϕ − δ) − 0.000218 (f − δ)2
C = 0.117 − 0.0098 (ϕ − δ) + 0.000143 (f − δ)2
Where:
Fx (m) is the vertical solar flux for an element in month m with orientation q
(W/m2)
(m) is month
Rhtov(θ) is the factor for converting from horizontal to vertical solar flux
θ is the orientation of the opening measured eastwards from North (e.g.,
East = 90) (°)
ϕ is the latitude of the site (°) = 53.4° N for heating calculations
99

δ is the solar declination for month m (°)
Sh is the horizontal solar flux (W/m2)
4.3.3 Heat Loss, insulation and thermal bridges
Alongside mechanical and electrical plant, wall build up and insulation materials
were also considered. Heating demand was calculated by determining the thermal
loss of the building envelope based on various insulation levels and the resulting
wall build up U-values. The key function of the building envelope is to reduce the
heat loss of a building. Heat is lost through the fabric and also through thermal
bridging. As air tightness in buildings has improved and the level of insulation
increased, thermal bridging is now a major source of heat loss through the
envelope. Repeated thermal bridges were accounted for in the U-value
calculations for the walls and non-repeating thermal bridges were calculated
individually based on materials and wall details using material datasheets or
THERM calculations conducted by the BRE.
Heat loss was calculated by the equation:
H = Ht + Hv + Hi
Where;
H = overall heat loss (W) Ht = heat loss due to transmission through building envelope (W) Hv = heat loss caused by ventilation (W) Hi = heat loss caused by infiltration (W)
The heat loss through the building envelope, which is reduced by increasing the level of insulation, is calculated by the equation;
Ht = A U (ti - to)
Where;
Ht = transmission heat loss (W) A = area of exposed surface (m2) U = overall heat transmission coefficient (W/m2K) ti = inside air temperature (oC)
100

to= outside air temperature (oC)
(Frazer, 2011)
Heat loss was calculated for the various elements of the envelope such as walls,
roof, floor, windows and through thermal bridges.
Heat loss due to infiltration was constant across build iterations due to high levels
of air tightness being important to low energy buildings. Air Changes per Hour
(ACH) from infiltration was fixed at 1.5 air changes per hour @ 50 Pascals
pressure (0.075 ACH at normal pressure).
In order to reduce overall heat loss (H), reducing Ht has substantial effects. Ht is
affected by the type and choice of insulation, wall thickness, thermal bridging and
glazing strategy for windows.
As heat loss through the building envelope is a key variable in overall heat loss
(H) and combined with the fact that the heat loss of the building envelope is a
response to the overall heat transmission coefficient (U), reducing the impact of
this is essential to reducing overall heat loss (H).
Thermostatic set points of 18°c were chosen for the internal temperature of the
building based on data from BedZED set points. Five year average monthly
temperature figures were used to establish ti and t0 on average per month. This
could then be used with various wall build up U-values and non- repeating thermal
bridges to calculate the energy requirement per m2 to maintain the temperature
internally.
Thermal bridging is the sum of the Psi values multiplied by the length of the non-
repeating thermal bridge. Thermal bridging becomes more important to heat loss
calculation in highly insulated and air tight buildings as the percentage of heat lost
through thermal bridging is proportionally greater the lower the heat loss through
the envelope.
4.3.4 Ventilation heat loss
101

As well as space heating loads to maintain internal temperature from heat loss
through the building fabric, heat loss also occurs through ventilation. Buildings
require ventilation to allow stale air to be removed and replaced with fresh air.
Moisture also needs to be removed in order to control humidity and inhibit mould
and dust mite growth as these have related health effects (Pearce and Ahn, 2013;
WHO, 2004). Moisture can also damage materials in the building infrastructure
(Pearce and Ahn, 2013). Whilst this can be achieved in properties by opening
windows, this creates high levels of heat loss and the code for sustainable homes
sets strict limits on the amount of heat that can be passed through the building
envelope. Due to this, effective and controlled ventilation is a core construction
objective alongside the high levels of air tightness required to achieve Code 6
status.
The main issue with ventilation of properties is that in order to exchange air, heat
is lost via the exchange of heated internal air being replaced with unheated
external fresh air. The solution to this problem is to utilise a ‘Mechanical
Ventilation Heat Recovery (MVHR)’ system in order to allow for the exchange of
air whilst retaining its heat content (Dunster et al., 2007). Most systems require
electrical assistance to drive fans and this adds to the electrical loading of a
building. This is accounted for in the electrical consumption figures.
Air flowing through the MVHR system passes through a flat-plate heat exchanger
to recover heat from the exhaust air and transfer a proportion of it to the incoming
supply of fresh air. The more efficient the system the more heat is transferred to
the incoming air supply and thus the more heat retained by the building. Typical
system efficiencies range from 70% to 90% and can effectively reduce the heat
load demand of a building by recovering heat normally lost through ventilation.
MVHR system works across a series of supply and extract ducts. Stale air is
extracted from warm wet areas of the house such as the bathrooms and kitchens.
Large diameter pipes are used for the ductwork to allow for low pressure drops to
be achieved. Low pressure drops facilitate good air flow in the system (Gilbert,
2007).
Heat loss due to ventilation has been calculated using the following formula;102

Hv = cp ρ qv (ti - to)
Where;
Hv = ventilation heat loss (W) cp = specific heat capacity of air (J/kg K) ρ = density of air (kg/m3) qv = air volume flow (m3/s) ti = inside air temperature (oC) to = outside air temperature (oC)
(Frazer, 2011)
MVHR reduces this and the reduced heat loss due to ventilation with heat
recovery has been calculated using the following:
Hv = (1 - β/100) cp ρ qv (ti - to)
Where:
β = heat recovery efficiency (%)
(Frazer, 2011)
4.3.5 Thermal mass
The Thermal Mass Parameter (TMP) for a dwelling is required for heating and
cooling calculations. The thermal mass parameter was calculated using a method
derived from Concrete Centre (2012). Firstly the heat capacity was calculated for
the materials. The heat capacity, or kappa value per unit area (k in kJ/m²K), for the
thermal mass elements was calculated as follows:
k = 10-6 × Σ (dj rj cj)
where:
dj is the thickness of layer (mm) 103

rj is density of layer (kg/m³)
cj is specific heat capacity of layer (J/kg·K)
The calculation is used for all layers in the element, starting at the inside surface
and stopped at whichever of the following conditions was encountered first :
The total thickness of the layers exceeds 100mm
The midpoint of the construction is reached
An insulation layer is reached (defined as thermal conductivity <= 0.08 W/mK);
The Thermal Mass Parameter (TMP) for a dwelling is required for the heating and
cooling calculations. It is determined using the above calculations and the
following formula:
(Area x Heat Capacity)/ Total Floor Area (TFA).
The total TMP includes, walls, ground floor and inter floor materials.
The benefit of thermal mass is taken into account in the utilisation factors
calculated using the SAP 2012 method:
τ = TMP / (3.6 x HLP)
a = 1 + τ / 15
L = H (Ti Te)
γ = G/ L104

(If L = 0 set γ = 106; to avoid instability when γ is close to 1 round γ to 8 decimal places)
If γ > 0 and γ ≠ 1 η=1−γ a
1−γ a+1
If γ = 1 η=aa+1
If ν ≤ 0: n= 1
(SAP, 2012)
4.3.6 Hot water consumption and energy demand
Hot water consumption, 50L per person per day, was calculated based on high
average usage data from Kalogirou (2014).
How water energy consumption was then calculated in kWh per person per
annum using the following formula:
kWh Hot water usage (Q) = density(rho)* Specific Heat Capacity (cp)*Usage (L/day)*Frequency (days)* Temperature rise (dTw)*0,001/3600.
Hot water systems also suffer losses due to distribution. Distribution losses of 15%
were also added to this figure.
4.3.7 Appliance and electrical loads
Appliance load and unregulated energy demand was calculated based on a
number of sources for different house types. Appliance load was considered
constant versus a building regulations new build house so that only changes to the
building fabric, hot water, space heating and ventilation equipment would be
observed but unregulated loads still accounted for in the model. Unregulated loads
assumed A+ appliances would be installed. The loads came from studies on
energy efficiency available in the literature and manufacturer’s data where study
data was not available.
105

4.4 Optimising the zero carbon design using the key design parameters
With a baseline building physics model developed it is possible to establish annual
energy losses, peak energy loads and annual energy usage. With these
parameters set it is then possible to start establishing which low carbon
technologies could meet these loads whilst still being annually net zero carbon.
The optimisation of the building using the design objectives identified from the
literature review and applied analysis could then begin from an economic,
technical and key stakeholder perspective.
Various combinations of best practice zero carbon design technologies were
identified using the Dunster et al. (2008) and Lechner (2008) design philosophies,
which had been adapted to include the design objectives identified in this study.
To optimise the U-values achievable by thermal envelope, the wall build up, roof
build up and floor build-up were inputted into Build Desk V3.4 software.
Calculations made using Build Desk have been independently reviewed and
comply with BR443 conventions for U-value calculations. Build Desk V3.4 was
also used to check the wall, roof and floor types passed the surface moisture and
interstitial condensation requirements. Market ready technologies were identified
to meet the remaining energy loads. Some technologies were excluded from the
modelling during this study: micro-CHP was discounted due to the use of natural
gas compromising its carbon abatement potential and micro-wind was discounted
due to evidenced reliability, maintenance and cost issues. Fourteen technically
viable systems were identified. From these fourteen systems it was possible to
work out the cost and economic parameters, such as implementation costs, build
costs, running costs and cash flows and compare them. Technical and economic
modelling was then conducted using various combinations of best available
technologies in order to develop a valid technical base for comparison. From the
fourteen technically viable solutions four optimised energy systems were
developed. These are presented in table 4.2.
106

4.4.1 Renewable energy technology outputs
Outputs from solar based renewables were calculated using an integrated climatic
and geographic database tool. The Joint Research Centre of the European
Commission’s Photovoltaic Geographic Information System (PVGIS) was chosen
as the tool for this study. The PVGIS database is considered one of the most
thorough datasets for PV output estimations based on HelioClim-1 data. As this
data can only be used by a limited number of experts, the PVGIS model was
developed. PVGIS is used by decision-makers, professionals, and aid agencies
globally. Indeed many software tools, such as PVSYS use PVGIS data. PVGIS
data was been inputted over the 1985-2005 time period and factors beam, diffuse
and reflected irradiation allowing for shadowing by local terrain features (Suri et
al., 2007). Errors have been cleaned using the European Solar Radiation Atlas
(ESRA) and this has allowed for the removal of suspicious data points from the
database. The PVGIS tool was chosen for both its usability and accuracy. A study
by Suri et al. (2007) showed that the mean bias error (MBE) was only 0.3% and
the root mean square error (RMSE) was only 3.7% for the entire dataset within the
model. As such they estimate that there is only a 3.2% over-estimation by the
model demonstrating the accuracy of the results obtained.
4.4.2 Model data, parametric analysis and verification
The initial equation based modelling used parametric analysis. Parametric
analysis was chosen as, whilst not strictly an optimisation method, it can be used
to optimise if systematically and methodically approached (Singh and Kensek,
2014). Given the combined technical and economic optimisation that this study
required, parametric analysis was the best option to use because it allowed
spread sheet software to be used to link both the technical and economic
elements together. This meant that the effects of changing one parameter could
be observed across both the technical and economic outputs. This would not have
been possible using a dynamic computer model in either a timely or effective
manner.
A systematic and methodical approach was taken to the optimisation process.
Firstly the building fabric was optimised to identify the most cost effective methods 107

for the wall, roof and floor construction. Secondly, renewable energy systems
were developed to satisfy the remaining building energy loads. The aim was to
use as few technologies as possible to reduce costs and simplify the systems
developed. The effect of changing an element on thermal and energy performance
was observed alongside the implementation cost and the life cycle cost. Different
permeations were used to establish technically viable options and a design freeze
imposed when the building met the zero carbon criteria. This enabled the
development of the fourteen technically viable solutions to be determined. These
solutions were then listed and ranked in terms of implementation costs and life
cycle costing. Different ways of achieving the same performance using different
materials or combinations of technologies and materials were used to further
optimise the building elements by interchanging key attributes from each solution.
The effect on energy performance was then noted alongside the effect on life
cycle costs. This enabled the interplays between performance, implementation
cost and life cycle cost to be observed and the trade-offs between reducing
energy consumption below a certain level against increasing renewable energy
production observed. Changes in technologies and incomes from tariffs and
expenditures could also be observed. This created four optimised solutions. From
these four technically and economically optimised designs a final optimised design
was selected.
Within the parametric analysis some of the parameters were fixed and some
variable. The fixed parameters enabled a valid comparative baseline to be
developed so the results were not skewed by i.e. changes to desired internal
temperature. The fixed parameters were for space heating demands using an
18°C set point, hot water demand based on 5 person occupancy and 50L of hot
water/ person/ day, and predicted appliance electrical consumption including
lighting energy use. Other parametric factors were variable and based on the
characteristics of specific elements involved with optimising the building’s energy
performance including: wall and window U-value, space heating primary energy
source, ventilation rate energy loss with heat recovery, heat recovery efficiency,
heating and hot water system efficiency, passive solar gains and internal gains,
energy generation by different renewable energy systems, renewable energy
system sizing, implementation costs, build costs and running costs.
108

Once a range of technically and economically viable systems were created the
equation based modelling could be validated using a dynamic modelling tool for
data for accuracy. Dynamic modelling is considered the best way to capture the
complex interactions that contribute to thermal performance, demand and their
uncertainties. This was achieved using TRNSYS. TRNSYS is a transient systems
simulation program developed by the University of Wisconsin and has been
available for over 30 years (University of Wisconsin, 2015). It is widely used for
energy in building simulation. This enabled different usage and occupancy
patterns to be modelled as well as more dynamic passive and solar gain modelling
including solar gains, radiative heat, internal radiative gains and wall gains).
TRNSYS models thermal behaviour of a building divided into different zones and
models thermal demands hourly for each thermal zone (University of Wisconsin,
2015). Thus whilst TRNSYS models are less flexible to rapidly change and
observe technical and economic optimisation they offer more detailed and
accurate outputs. As such the final optimised design was modelled in TRNSYS to
increase certainty in the thermal loads. The design parameters and building
attributes of the optimised design were given to a Masters student to input. The
orientation of the building, temperature set points, ventilation strategy, occupancy,
thermal emitters and heating system were kept the same, however, the TRNSYS
model was divided into 15 individual thermal zones with different occupancy
patterns and usages. Within TRNSYS the user specifies each thermal zone and
occupancy pattern in turn. The outputs of the TRNSYS verification for thermal
loads are presented in section 6.9.8
4.5 Techno-economic performance
The following section details the calculation methods used to assess economic
performance.
4.5.1 Introduction to the techno-economic model
109
With technical performance of the energy systems and the building physics
modelled for the house type the resulting energy loads can be financially analysed
and capitalised. Establishing capital expenditure costs, incomes and costs saving
could then be determined using a techno-economic model.
The underlying principle of this model is that the total cost of the zero carbon
building over the FITS period is compared against the cost of a building
regulations building over the same period. As the owner/ occupier will receive the
benefits from living in the Code 6 building then it is logical to assume that the cost
of the extra technology will be passed on from developer to consumer.
The costing method used to establish costs is the ‘over and above’ cost
methodology set out in the ‘Cyril Sweett Report (2007)’ and the ‘Code for
Sustainable Homes Cost review (2010)’.
4.5.2 Technological inputs/ assumptions to generate cash flow forecasts
To prepare the data for financial analysis cash flow forecasts have to be created
based on the capitalisation of the technical outputs. This is based on the outputs
for each energy system and the outputs from a 2010 building regulations home
built to the same dimensions and gross internal floor areas. The section below
details the assumption made when calculating these results.
The orientation of the property takes into account a large south facing roof aspect.
This is to maximise passive solar gains and maximise electrical output from PV
systems. Average UK insolation was used based on PVGIS estimates averaged
out for the insolation levels received across the nine UK residential regions.
Thermal loads were determined by the building envelope U-values created and
compared against a Code 3 compliant (2010 building regulations) house. Thermal
loads included heat lost through ventilation, building envelop and hot water
demand. Hot water demand per person was considered constant versus a building
regulations home. The building regulations property was assumed to have a
condensing gas boiler to supply heating and hot water loads. The standard energy
110

price used to calculate costs for gas are based on the ’Energy Saving Trust’
utilities calculation data (accessed 2013). A monetary value could then be
assigned to the cost saving achieved through increasing the thermal efficiency of
the building and through the improved efficiency of the heating systems. The
capitalised values of the building regulations home energy consumption was then
compared against the energy systems designed for the zero carbon home.
Electrical loads were based on whether or not electric heating was used, the
efficiency of the heating system and the base electrical loads including appliance
loads. The model is constructed to account for electricity demand with costs at
their current levels with an annual fuel price escalator included going forwards.
The standard energy price used to calculate costs for electricity are based on the
energy saving trusts calculation data (accessed 2013).
When solar PV arrays were installed the electricity costs were then compared to
Solar PV electrical production and a reduction in cost was made based on the
amount of solar energy used in the home.
Solar PV also generates a revenue via the feed in tariff. The energy generated
was matched to the appropriate feed in tariff rate base on the building being
completed in 2015. The array sizes in this study all fall within the deemed export
sizes so the export tariff was taken to be 50% of the generated energy. The FITS
rates are detailed in table 4.2 below.
Table 4.2: FITs Rates
Source: Ofgem 2014
The cash flow calculations therefore include the reduction in energy demand
through increased efficiency, the cost benefits from renewable energy generated
111
Pv System Size
Starting Tariffs (p/kWh) 01
-DEC
-12
TO
31-J
AN-1
3
01-F
EB-1
3 TO
31
-MAR
-13
01-A
PR-1
3 TO
30
-APR
-13
01-M
AY-1
3 TO
31
-JU
L-13
01-A
UG-
13 T
O
31-O
CT-1
3
01-N
OV-
13 T
O
31-J
AN-1
4
01-F
EB-1
3 TO
31
-MAR
-14
01-A
PR-1
3 TO
30
-APR
-14
01-M
AY-1
4 TO
31
-JU
L-14
01-A
UG-
14 T
O
31-O
CT-1
4
01-N
OV-
14 T
O
31-J
AN-1
5
01-F
EB-1
5 TO
31
-MAR
-15
01-A
PR-1
5 TO
30
-APR
-15
01-M
AY-1
5 TO
31
-JU
L-15
01-N
OV-
15 T
O
31-J
AN-1
6
01-A
UG-
15 T
O
31-O
CT-1
6
up to 4kW high 15.44 15.44 15.44 15.44 14.9 14.38 13.88 13.88 13.39 12.92 12.47 12.03 12.03 11.61 11.2 10.81medium 13.9 13.9 13.9 13.9 13.41 12.94 12.49 12.49 12.05 11.63 11.22 10.83 10.83 10.45 10.08 9.73
>4kW - 10kW high 13.99 13.99 13.99 13.99 13.5 13.03 12.57 12.57 12.13 11.71 11.3 10.9 10.9 10.52 10.15 9.79medium 12.59 12.59 12.59 12.59 12.15 11.72 11.31 11.31 10.91 10.53 10.16 9.8 9.8 9.46 9.13 8.81

and used, incomes from the renewable energy generated (where applicable) and
the incomes from energy exported back to the grid (where applicable).
4.5.3 Inflation, CAGR and Cash flow projections
The model incorporates inflation and fuel price escalation. Fuel price escalation
has been calculated based on DECC (2009b) ‘Average Weekly Household Fuel
Expenditure’ trends of domestic bill increases. Domestic bills rose by an average
of 0.2% per annum for the 1990-2009 trend but rose by 3.49% in the period 2000-
2009. When the 2004-2009 trend was examined, prices had actually risen by 11%
reflecting the rise in fossil fuel prices (DECC, 2009). With fossil fuel prices likely to
continue rising, it was appropriate to incorporate annual predicted fuel price
escalation for the entire twenty five year period. This was incorporated into three
different scenarios at different rates.
Scenario one was based on the past five year energy price trend based on the
2010 revision of ‘The annual averaged weekly energy bills expenditure on gas and
electricity’ report from DECC.
Scenario two and three were derived from Ofgem’s ‘Project Discovery (2010)’
updated scenarios.
A compound annual growth rate was used. The compound annual growth rate
(CAGR) was used to apply a smoothed annual growth rate applied over the 20
year FITs period. These values were used to calculate a range of low and high
price increases. Table 4.3 details the CAGR used in each scenario
Table 4.3: Compound Annual Growth Rates (CAGR)
Past 5 year Trend OFGEM High OFGEM Low8% 5% 3%
Compound Annual Growth Rates
In addition to fuel price escalation inflation of the index linked FITS tariffs were
included at 3% per annum. This is based on the mean annual inflation trend for
2000-2008 (Towers and Watson, 2009).
112

4.5.4 The net benefits or deficits model
The results from the techno-economic model result in a net benefit or deficit in
terms of cash flow. The net benefit, if achieved, means that it is financially
beneficial to be living in the modelled house in comparison to the building
regulations part L house at that point in time.
The Net benefit was calculated using the following formula:
NB = Ti + Ta –To
Where:
Ti =Total Cash Inflows
Ta=Total Avoided Costs
To =Total Cash Outflows.
4.5.5 Self-funding calculation
The calculations were also run excluding the avoided cost element in order to
develop an income only based model. This model was used to derive if a positive
net cash flow could be obtained without accounting for avoided costs, in other
words if a true cash income could be obtained. If this was possible to achieve the
house was defined as having net zero energy bills.
4.5.6 Additional calculations: funding methods
One of the main barriers identified in the literature review was the lack of
additional sales values of zero carbon homes. It is anticipated that the results of
this research will provide a financial justification for this. Whilst it is not clear yet if
additional sales values will be attributed to zero carbon design it is important to
see if such a premium can be added to account for them. As such, methods of
funding need to be incorporated into the model. This provides an alternative
perspective on the financial data by determining if the increased capital costs of
an optimised zero home can be offset. The most likely funding method used by
an owner occupier to purchase a building is a mortgage or loan so all costs for the
113

renewable energy technologies have been adjusted to account for this. Mortgage
payments have thus been deducted from the incomes generated in the net
benefits model. For comparison a capital funded scenario has also been
developed to analyse results from up front funding.
The calculations of all the potential costs and revenues that occur from the
building have been calculated over a 25 year mortgage period at 5% based on the
average overall costs of the 5 lowest rate mortgage lenders on money
supermarket.com accessed in January 2011 (Mansfield Building Society,
Loughborough Building Society, Nationwide Building Society, Leek United Building
Society and Skipton Building Society). The calculation includes the reduction in
energy demand through increased efficiency, the cost benefits and incomes from
the energy generated by the microgeneration technologies and the avoided costs
of not having to buy energy. The model was run for both upfront capital funding
and mortgage funding. Mortgage funding was priced through a repayment
mortgage at 5% spread over 25 years.
4.5.7 Self-funding net zero energy bills
The self-funding calculations were also run again incorporating the additional
mortgage cost that would arise from the increased capital expenditure. If a positive
cash flow could be achieved taking into account the mortgage payment then the
house type was deemed to be self-funding and net zero energy bills.
4.5.8 Standard investment appraisal analysis
Standard techniques for analysing investment potential of the house type were
also conducted in addition to net benefits modelling using the techno-economic
data. This was conducted in order to establish the investment potential of the
house type using standard investment tools as well as the techno-economic model
developed for this project.
Positive financial analysis was deemed essential to the research. A critical factor
in the design methodology is the justification of additional costs and standard
investment appraisal tools offer unilaterally accepted methods to assessing this.
114

The standard investment tools used in this analysis were: Simple Payback, Net
Present Value and Internal Rate of return (Götze et al., 2008). These investment
tools and methodologies are detailed below.
4.5.9 Simple payback
The simple payback period is the most basic of the investment appraisal tools
used and calculates when an investment reaches the point at which it generates
profit in years. The payback period was calculated based on algorithmic cash
inflows at yearly time intervals until the cumulative inputs became positive, using
the formula below;
Payback period = Investment required / Net annual cash inflows
(Götze et al., 2008)
4.5.10 Net Present Value (NPV)
Whilst payback is a useful first stage appraisal tool it is somewhat simplistic. As
such the Net Present Value (NPV) was calculated in addition to the simple
payback. The NPV assists in building a stronger investment case then payback
alone can build by including the time value of money and the potential of
alternative investments (Götze et al., 2008). It does this through the use of a
discount rate and discounted cash flow analysis. Simply the NPV is the sum of
future incomes in present day terms.
The discount rate was deemed to be the interest rate achievable by leaving the
over and above capital outlay in a bank account. It was identified that 5% was the
highest possible interest rate available at Santander based on a Money.co.uk
search (2011) and this was used to discount cash flows in the NPV calculation.
Investment in the house type was considered a more attractive option to the
alternative if the NPV was positive (Götze et al., 2008). The higher the NPV the
stronger the investment case.
The formula used to calculate the different discount rates were;115

(Götze et al., 2008)
This formula discounts each of the net cash flows at the defined discount rate ‘i’
for the set period of time ‘t’; ‘t’ was deemed to be twenty years. The sum of these
discounted cash flows is subtracted from the initial cash outlay at t=0. NPV is the
net present value and the term CF0 is the initial cash outlay (Götze et al., 2008).
CFt is the net cash flow at the period t.
Whilst this is useful in assessing the strength of a capital funded investment this
use of the NPV is somewhat limited when assessing a mortgage funded
investment. To do this effectively for mortgage funded options requires the
discount rate to be adjusted to reflect the cost of capital. This can be done by
using the weighted average cost of capital (WACC) and the capital asset pricing
model (CAPM) (Cornelius, 2002). The WACC methodology thus enables the
investment decision to be linked to the finance decision so that if an investment is
to be accepted the net present value needs to be positive when discounted at the
cost of capital (Cornelius, 2002).
The CAPM model works based on the principle that the investor will require the
risk-free rate of return from a project as a minimum. The investor will also desire a
premium to adjust for the particular risk of an investment.
It is acknowledged that WACC is normally only used by companies and not
householders when making an investment decision to ensure the only investments
undertaken by the company are ones that exceed the companies hurdle rate.
However, this does allow the incorporation of economic risk into the decision. To
do this requires a beta value which is company/ industry specific. In this case this
was determined by the utilities sector beta value.
The WACC equation is given as follows:
116

Where:
Re = cost of equity
Rd = cost of debt
E = market value of the firm's equity
D = market value of the firm's debt
V = E + D
E/V = percentage of financing that is equity
D/V = percentage of financing that is debt
Tc = corporate tax rate
(Götze et al., 2008)
The CAPM equation is given as follows:
re = rf + ß(rm – rf)
where:
rf = risk-free rate of return
rm = market portfolio return
ß = Beta value
(Cornelius, 2002)
To adjust for the non-availability of capital the discounted cash flow rate was set at
3%, the rate of inflation to reflect the domestic nature of the investment and to
discount to real terms. This yielded a WACC discount rate of 7.3%.
4.5.11 Internal Rate of Return (IRR)
The Internal rate of return (IRR) of a project is the third method used in this
appraisal. The IRR is the interest rate which creates a net present value of cash
flows which equal zero. Internal rate of return is used to evaluate the
117
attractiveness of a project or investment. The IRR is an indicator of yield of a
project and the higher the IRR the more attractive an investment is (Götze et al.,
2008). For investment to be considered attractive in this study the IRR must
exceed the discount rate used.
The Internal Rate of Return (IRR) was was calculated using the following formula;
(Götze et al., 2008)
In order for a the zero carbon opportunity to be considered viable to be invested
in, firstly the investment must payback, secondly the NPV must be positive and
thirdly the IRR must be greater than the discount rate used.
Chapter 5
Social Research Methodology
5.1 Introduction
Having designed the optimised zero carbon home with a novel financing method it
was necessary to see whether it was likely to appeal to key actors in the building
industry and whether it could be implemented. The overarching research question 118
for this part of the study was ‘What are the key stakeholders’ views on the
optimised design? Does it address the obstacles to developing commercial scale
zero carbon developments?’ There are different approaches that the research
could have taken to explore this question. I decided to take a two pronged
approach, both showing the design to a range of stakeholders and discussing it
with them, and following the progress of a real time case study using the design.
To obtain maximum insights into the stakeholders’ views and experiences of the
design a mixed method qualitative approach was adopted. The findings from this
section of the research provided new insights and enhanced understandings of
the barriers and drivers towards the decarbonised residential build sector.
5.1.1 Research aim and objectives
The proposed research aims to better understand stakeholder’s views on adopting
the housing design into commercial practice. To date, there has been limited
research into how best to understand strategic actors and their motivation in
relation to zero carbon design, and none specifically relating to this design.
The objective of this study is to develop an in-depth understanding of drivers and
barriers towards the optimised design from key stakeholder perspectives. This will
enable an analysis of how well the optimised design fits within commercial builder
portfolios. The following section details the empirical research plan I designed to
contribute to the field of knowledge in this area.
5.1.2 Research design
This research focused on developing a rich understanding of potential inhibitors,
drivers and attitudes towards the creation of a commercialised zero carbon
housing market from the perspectives of key actors. The research design needed
to elicit meaningful responses from informed respondents and needed to be
exploratory and elaborative to satisfy the research objective (Thomas, 1987). As
such the research was inherently qualitative in nature.
119

The research needed to include the perspectives of a wide range of stakeholders
with diverse perspectives who could meaningfully contribute to the research. The
selection of key stakeholder groups was informed by my application of the MLP to
the decarbonisation of the housing regime (See Table 3.4). Selection of specific
respondents was informed by my experiences within the industry and key contacts
developed through my time with the sponsor organisation.
Nagy Hesse-Biber and Leavy (2011) state that to best understand research that
involves diverse perspectives from multiple actors on a subject matter, the focus
should be on generating knowledge on the common subject matter. Qualitative
research puts the generation of knowledge at the centre of the research
methodology. I thus chose a qualitative research methodology for this study as it
allowed me to draw from a variety of tools and techniques specifically designed to
do this. This research did not look to create statistical representation, as this
would not add to the knowledge generation goals, but looked to obtain as much
depth on the drivers and barriers towards the optimised design as possible.
To achieve this the research design did not use surveys or questionnaires but
developed a research framework that was flexible and adaptive, with an aim to
generate new insights and explore them in-depth (Nagy Hesse-Biber and Leavy,
2011). Flexibility was important for the research design so that it could be
adaptable to new ideas and insights generated as the research progressed. It also
enabled the research to take place over a longer period of time and draw into the
research framework new respondents who could contribute to the research as
they became apparent.
To develop a research framework to enable this to happen involved understanding
how the social world within the field of study was constructed. Nagy Hesse-Biber
and Leavy’s (2011) assume the social world is continually being constructed
through group interactions and this is what creates the social reality. It stands that
the social reality can best be understood through the perspectives of the social
actors constructing it, or as Nagy Hesse-Biber and Leavy (2011) put it, by
understanding the perspective of the social actors ‘enmeshed in meaning-making
activities’ (Nagy Hesse-Biber and Leavy, 2011 pp5). The central theme of the
120

research thus focused on developing an understanding of ‘meaning making’
activities for commercialising the optimised design such as setting policy,
designing, financing, building and selling new build homes. Fielding and Thomas
(2003) suggest naturalistic approaches to social research are required to
understand these activities. Ethnography is such a technique and was utilised in
the study.
Ethnography involves exploring naturally occurring social interactions (Nagy
Hesse-Biber and Leavy, 2011). Ethnography involves a mix of different social
research techniques such as observation, semi-structured interviews, informal
interviews and documentary research. The natural environment that was observed
was based on the sponsor organisation role in developing zero carbon homes.
This involved attending meetings, design discussions, visiting and talking at
exhibitions, and observing the development process for zero carbon homes. Given
my unique position within the research and the sponsor organisation, ethnography
was the most appropriate qualitative research method to use so that it could
engage with key stakeholder from this environment.
5.1.3 Qualitative research design
The research design was further split into 2 strands to:
1) Make the best use of my position within the research field
2) Make best use of the sponsor organisation’s position within the industry.
The first strand was based on interviews and observations within a sample of key
stakeholders. The second strand was based on a case study review. The case
study review was included because as the research progressed an opportunity
arose to follow a real development that had been adapted to use the optimised
design. This created a unique opportunity to illustrate the findings from the first
research strand with a real life example. The case study developed in parallel to
the first research strand so some of the stakeholders were included in both
strands. Where this occurred, the data that informed the case study was mainly
from repeat meetings, interviews and correspondence.
121

Both research strands were conducted through interview and observation,
presentations, workshops and board meetings. Stakeholders were introduced to
the study through existing relationships, sponsor organisation contacts and
snowball sampling. Snowball sampling is a non-probability based sample method
which uses information gained from early respondents to identify further
respondents (Gilbert, 2003; Cohen, 2003). Snow ball sampling is an effective way
to gain access to stakeholders who could meaningfully contribute to the research
study (Gilbert, 2003; Cohen, 2003). Some stakeholders were introduced via
participants already interviewed and some were selected based on the case study
progression.
A non-standardised semi-structured interview approach was developed. Fielding
and Thomas (2003) suggested that the best technique to employ should focus on
developing a list of subject matters to be used when speaking to respondents as
opposed to using a rigid interview structure. A list of subjects was drawn up and
was used to steer the conversation onto relevant subjects only when required,
preference was given to not using it unless necessary (Fielding and Thomas,
2003). The empirical research focused on exploring key stakeholder opinions on
the optimised design and consequently the subject matter list was drawn from key
areas identified in the literature review. This enabled the research to focus on
whether the key issues identified in the literature had been addressed by the
optimised design and assess the extent that this occurred. It also enabled new
insights to be drawn from the study that were not identified in the literature review
and how these issues related to the optimised design.
The subject matter shortlist was drawn up to enable the research to link the
literature review findings together with the initial applied analysis of the housing
regime. This enabled the empirical research findings to focus on either elaborating
on the literature findings, establishing the extent the optimised design addressed
the issues identified and identifying unknown issues within the research scope.
The research subject matter list is detailed below;
1. Cost: What are the respondent thoughts on perceived cost based issues
122

2. Economic Viability: What are the respondent thoughts on the economics
and investment returns of the optimised design
a. What are the respondent thoughts on whether lower returns could be
acceptable in some instances
b. What are the respondents thoughts on funding this development
3. Market Potential and Demand: What are the respondent thoughts on the
market potential of the optimised design
a. What are the respondents thoughts on the types of innovation used
and impact on demand
b. What are the respondents thoughts on the impact of improved
usability
4. Risk: What are the respondents thoughts on the development/ developer
Risk impacts
a. What are the respondents thoughts on being innovators
5. Policy: Could/is the current policy framework driving change or inhibiting
zero carbon development.
6. Knowledge and Skills: What issues surround skill sets, roles of developers
and key responsibilities
Conversations then develop naturally allowing the respondent to focus on the
issues most important to them (Fielding and Thomas, 2003). This research
technique was used to identify what the most important barriers/ drivers from the
optimised design were to a particular respondent from their own perspective.
When responses on the subject matter were exhausted the conversation could be
prompted to move it on if required but the free flowing nature of the conversations
rarely required this. This approach proved very effective at bringing new ideas,
attitudes and understandings to the forefront of the research findings. This method
created significant benefits to the research as contributions were always
expansive and significant amounts of new knowledge were generated. This
knowledge could be firmly attributed to the free flowing conversational style of the
research. One criticism of this style was, however, that respondents had a
tendency to wander off topic and significantly large volumes of contributions were
created. This considerably added to the time it took to code and analyse the data
123

and at some points it was not always clear what contributions related to specific
subject matters. To remedy this the field note analysis was critical.
Some respondents contributed to the study more than once and some
relationships with stakeholders were ongoing. My role in the sponsor organisation
meant that some of the participants were met on multiple occasions. As such the
data from the semi-structured interviews is sometimes supported by follow-up data
from emails and/ or transcribed phone calls. On some occasions only emails and
transcribed phone calls are used. Again this generated valuable information which
was only possible through the ethnographic techniques the research draws upon.
The non-standardised nature of the research plan meant that not all discussions
were viewed formally as interviews. This meant that meetings attended relating to
either the subject matter or case study have been included in the analysed data.
These meetings provided a rich source of contributions. Whilst these meetings
were only attended as an observer without the formal presentation of an interview
guide they enabled the uniqueness of the research situation and my ability to
engage with multiple stakeholders to be fully utilised.
The non-standardised approach and mixed source of information meant that
multiple methods for contributions are included in the study. Some contributions
are from transcribed verbatim transcription, some from transcribed field notes and
some from interpreted field note analysis. Correspondence and follow-up
meetings are also included. Whilst this introduced added complexity to the data
treatment the research could be constantly updated and over a far longer research
period than would have been possible through a standardised interview process.
5.1.4 Data Treatment
When adopting a complex and lengthy qualitative study it is essential to manage
the data so that the richness of the findings can be extracted from the mixed
research methods. Strauss (1987) states that the quality of qualitative research
lies in the ability to code the findings effectively and easily. Bryman & Burgess
124
(1994) suggest that the aim of good qualitative analysis is the reduction of data
from its voluminous form into more wieldy parts. To organise and analyse the
data, thematic analysis was conducted using a coding system. Codes were
developed both deductively from the literature review and inductively from issues
which emerged from the data (Strauss, 1987). The coding of the responses
allowed for the data to be re-sequenced and cut into themes (Saldana, 2013). This
allowed development of a mechanism to capture and analyse new insights and
relate them back to the literature (Halcomb and Davies, 2006). As such the
existing body of research both informed and was informed by the results (Dey,
1993).
The data collected was transcribed and analysed using the following methodology;
Interviews were conducted with concurrent note taking and
data recording where possible
Post interview reflective note taking enabled a guide to the
interview/ meeting to be developed which helped interpret the
large volumes or transcribed data
Intelligent verbatim and edited transcription enabled the
transcribed data to be broken down into manageable
components to enable analysis and review
Thematic review enable the data to be coded and analysed
(Adapted from Halcomb and Davies, 2006)
Three broad overarching categories were pre-defined based on the literature
review findings but sub-themes and new insights were allowed to develop out of
the research itself (Gilbert, 2003). These predefined categories were:
Cost Based Issues
Market Potential and Demand
Development Risk
125

5.1.5 Sample selection
The sample selection was purposively selected from stakeholders and actor
groups identified as having an impact of the commercialisation of the optimised
design at the regime level. The identification of these stakeholders and actor
groups was based on applying socio-technical change theory to the commercial
residential property development sector and the application of a multilevel
perspective (MLP) to housing and energy markets. This acted as a screen to
identify stakeholder groups. Respondents from these stakeholder groups were
selected though pre-existing relationships and snowball sampling. The main
requirement of the research framework was to find participants who could
meaningfully contribute to the study to generate rich and meaningful data. Based
on this logic snow ball sampling and purposive sampling was used to find
appropriate participants from existing contacts, sponsor organisation relationships
and contacts recommended by them. Actor groups who could affect the decision
to adopt a commercialised approach to zero carbon homes were then selected
from dominant actor groups identified from the MLP screen.
The nature of ethnography means that some respondents involved in the case
study were not initially interviewed but contributed through their later introduction
to the research as the file expanded. The sampling method allowed for the
respondents to contribute to the research after the initial interview was conducted.
This would not have been possible using a rigid survey process and many of the
most valuable contributions would not have been obtained. This meant that the
quality of the contributions to the research was improved through the ongoing
relationships with the stakeholders. Relationships with stakeholders were naturally
maintained through discussions involving the case study which was ongoing
throughout the research period.
The sample of actors was selected from senior management or director level
participants across a range of respondent job functions. Thirty four respondents
were interviewed. Some of these interviews were supported by follow-up meetings
and or emails and phone call transcripts. Stakeholders who were part of the case
126

study process contributed the most frequently. A list of respondents is detailed in
table 5.1:
127
Number Code Type Level Case Study Group Interview Meeting AttendedFollow-up
Correspondence1 HB1 1 Top 100 Commercial House Builders Investment Director Commercial Developers/ Builders Y Y2 HB3 2 Top 100 Commercial House Builders Product director Commercial Developers/ Builders Y Y3 HB4 3 Top 100 Commercial House Builders Director Commercial Developers/ Builders Y Y4 HB2 4 Top 100 Commercial House Builders Product director Commercial Developers/ Builders Y Y5 MB SME Developer Director Other Developer/ Builders Y Y6 MB 2 SME Developer Director / foreman Other Developer/ Builders Y Y7 SB Social SME Developer CEO Other Developer/ Builders Y N8 SB2 Social SME Developer Director Other Developer/ Builders Y Y9 SB3 Specialist Green developer Director Other Developer/ Builders Y N10 HB5 House builder on Housing Association framework director Developer/ HA Y N11 HA1 Housing Association senior manager Developer/ HA Y N12 HA2 Local Authority Representative senior manager Local Authority Y N13 EP Big 6 Energy Provider Head of renewables development Energy Suppliers Y N14 EP2 Energy Foundation (Charity) Director Energy Suppliers Y N15 PM Project Manager Director Project Managers Y Y Y16 PM2 Project Manager Project Manager Project Managers Y Y Y17 T1 Investors Director Financers Y Y N18 T2 Investors Director Financers Y Y19 T3 Investors Director Financers Y N20 T4 Investors Director Financers Y Y N21 Q Quantity Surveyor senior manager Quantity Surveyor Y N22 BD1 Green Architects Architect Technical Respondents Y Y Y23 TL1 Deep Green Architect Architect Technical Respondents Y Y Y24 I Installer Director Technical Respondents Y N25 L1 Mortgages and values senoir mananger Valuer and Lending Y N26 L2 Mortgages and values director Valuer and Lending Y N27 WP Warranty provider technical sales manager Valuer and Lending Y N28 WW Alternative route to Market Director Alternative route to Market Y N29 NB Alternative route to Market Director Alternative route to Market Y N30 M1 Building NGO Director Uncategorised Y N31 M2 Self Build NGO Director Uncategorised Y N32 M3 Journalist and area specialist Journalist Uncategorised Y N33 A1 Estate Agents Estate Agents Estate Agents Y Y Y34 A2 Estate Angents Estate Angents Estate Agents Y Y N
128
Table 5.1: Respondent List.

Respondents with high level job functions directly involved with the delivery of
housing, funding for housing developments, delivering local authority housing
schemes, lending, surveying or designing homes were initially selected for the
sample. For example Managing Directors, Operational Directors, CEO’s of SME
developers, technical directors, project directors or department heads for the relevant
stakeholder group, These respondents were identified from the main participant
groups such as large developers, medium developers, funders, local authorities,
agents. From the participants within the preliminary sample other key actors were
recommended or identified and then approached. This occurred for actors in the
participant groups identified in the literature review and through new participant group
categories. These new categories were identified from the key actors as additional
stakeholder groups who could potentially provide meaningful contributions to the
research subject or potentially progress the case study. This sampling method
enabled the research sample to be broadened to include key include actors from
alternative development models, such as community self building, and NGOs
responsible for research into energy and housing, trade bodies, and journalists from
specialist trade press. This enabled an even broader range of stakeholder opinions to
be evaluated within the study to satisfy the aims of:
o Including more stakeholders from the wider and systemic field
o Contextualising the literature based findings in relation to an
optimised design
o Understanding how literature based barriers effect an optimised
home designed to address them
o Elaborating on existing barriers from a key stakeholder
perspective
The respondents from the sample were coded based on the initials of their actor
group i.e. House builders use the initials HB, medium sized builder MB, Project
manager PM etc. This coding is used in table 5.1. Where more than one respondent
from that actor group is included a number starting at 1 is included after the initials.
Respondents highlighted in yellow also contributed to the case study. Table 5.1 is the
main reference to the code, respondent, level and actor group.
129

5.1.6 Data recording
Where possible, field notes and audio recordings were conducted simultaneously
during the interviews. This enabled easier observer participation and interaction
within the interviews. Recorded minutes and email memos were also collected and
collated.
Data was monitored and interpreted periodically to keep track on whether the data
that was been collected was on track to answer the research questions and if not, to
focus data collection towards areas where it was lacking.
5.1.7 Ethics and safety
Ethics and safety are important considerations for field based social research. This
research project was conducted in accordance with the ESRC Research Ethics
Framework (REF) 2009.
The research programme sought consent. The nature and aim of the research was
made explicit to respondents, the purpose of this research disclosed to them along
with whom it was being conducted for. For public meetings this was not deemed
necessary. In instances such as prearranged meetings the meeting organisers were
made aware in advance of the research so that the research was not covert. In all
instances participant’s names were removed to prevent identification of the
respondents. Oral consent was gained from the respondents. It was endeavoured
that the involvement of both the University of Surrey and the sponsor company were
as transparent as possible.
Confidentiality was assured by only using coded person/ company references when
transcribing the results. Permission was obtained for the use of the recording
equipment from all participants. The data that was collected has been kept in
accordance to the data protection act and person/company names have or will be
deleted from the record as soon as feasible (ESRC, 2009). Ethical approval was not
deemed necessary as the proposal did not involve reward or work with vulnerable or
at risk participants and no incentive was offered to the participants (ESRC, 2009). In
combination to this the research subject was not considered to be ethically sensitive.
130

The project did not pose any significant risk of potential physical or psychological
harm, cause any discomfort or cause any excess or undue stress to the participants
(ESRC, 2009). I maintained ownership over results and the subsequent publication of
data. The industrial sponsor did not have access to raw data or unpublished work
and consequently accountability remains with me. I was the only moderator used for
the sessions and was trained in the university ethics protocol and ESRC REF (2009;
2012). In accordance, it was deemed that this research met the criteria for
independently conducted research, with confidentially and anonymity protected
(ESRC, 2009). To ensure confidentially and anonymity, organisational names and
individual names were made anonymous along with any identifying background data
in accordance with ESRC guidelines on research ethics (REF, 2009). This protects
both the participants and their companies.
5.2 Case study research
In addition to the semi-structured interviews the research was further supplemented
by a case study. The case study is used as an illustrative example of how the issues
identified in both the literature and interview and observation study are reflected in an
real housing project. A good case study methodology and narrative emphasises the
complexity and contradictions of theory in practice, enhancing the understanding of
both hypotheses and generalisations (Flyvbjerg, 2006). deMarrais and Lapan (2004)
suggest that case study data can provide an additional sense of meaning and
significance to qualitative research. As they explain in their research, a case study
can complement the ethnography shaped mixed research approach by providing
contemporary data to illuminate the understandings already generated. During the
research period the opportunity arose to include a case study to provide this
additional aspect of understanding.
The case study involved a project that had been previously marketed using a non-
optimised zero carbon design. This particular project had failed to attract investment
or progress beyond the conceptualisation stage. As the optimised design offered
many benefits over the previous version the project was redesigned to incorporate it.
New development appraisals were drawn up and the development was eventually
entered into planning. The project was due to break ground prior to the end of the
131

research period which would provide an opportunity to explore the potential success
of the optimised design in real life. This provided interesting insights and, conversely
to the analysis of the interview and observation responses, integrated the data
together rather than separating it out for generalisation (deMarrais and Lapan, 2004).
What is meant by this statement is that a case study focuses on the narrative and the
story behind the data where as coded and analysed data is used to support specific
points (deMarrais and Lapan, 2004). As such case studies provide context
dependent and practical knowledge to support the theoretical knowledge generated
in the primary research stream (Yin, 1994). Thus the case study enables readers of
the research to enrich their understanding of the stakeholder responses through a
context rich illustration (Flyvbjerg, 2006).
Whilst case studies are sometimes maligned for not being able to generate theory the
case study method is used here to bring further clarity to the primary research stream
(Flyvbjerg, 2006). It is important to note that the case study is not used to provide
verification to the primary research findings instead to illustrate them (Yin, 1994;
Flyvbjerg, 2006).
Yin (1994) suggests that successful case studies need to be bounded in scope and
time. The case study was bounded by the following research questions:
Does the optimised design improve the potential for the development to
progress to completion, given that the project has failed to progress once
already?
Do the responses and conclusion drawn from the primary research stream
manifest themselves in the case study?
What additional insights are gained from studying the optimised design in an
actual development scenario?
5.3 Case study design
The case study involved a master plan for an 89 home development built using the
optimised design. The development proposed was a mixed tenure scheme of
predominantly private for sale housing but also included rented social housing. A full
132

costing, cash flow and development appraisal was developed for this site using the
optimised design. The research material developed for this study was:
A brochure highlighting the benefits of the optimised design
The site masterplan incorporating the optimised design
The development appraisal based on using the optimised design
The case study material was sent via the sponsor organisation to stakeholders within
the development process, some of whom were also in the interview and observation
study. The case study was used as an illustrative example of a fully appraised and
designed master plan for a zero carbon housing development. Once the case study
data was disseminated to commercial actors who could help develop the project, the
progress of the case study was monitored over the research period. The case study
was initially greeted with a degree of success and funding was achieved to put the
project into planning. The case study then started to progress through the
development process but encountered a number of hurdles along the way. The case
study was them beset by many of the issues identified from the interview and
observation process and the project did not ‘break ground’ when it was supposed to.
Indeed a number of extensions to the land option were granted. As such the project
was not constructed during the research period although limited successes were
made before the research period ended. Responses from the case study are
included in both coded data from the primary research strand and also analysed
separately to provide an illustration of how the development process is affected by
zero carbon design.
133

Chapter 6
The Optimised Zero Carbon Home and Stakeholder Opinions on its Viability
6.1 Introduction
This section presents and analyses the empirical research findings. The results are
split into two sections. The first section focuses on the modelled outcomes from the
technically and economically optimised home. The second section is focused on
communicating the outcomes from the interview and observation process that used
the optimised design to assess the likelihood of commercialisation.
6.2 Section 1: Energy balances, cost savings and life cycle costing of the optimised design
The results presented in this section focus on the modelled energy balances, cost
savings and life cycle costing of the optimised zero carbon home. The optimal design
was derived from a series of different design iterations. Each design iteration used
the methodology to enhance an existing Zedfactory design. It applied the
methodology developed in chapter 3 to a combination of the ZED standards (2008)
and Lechner’s (2008) 3 tier approach to designing zero carbon buildings. Different
design aspects and the effects they had on the technical and economic viability were
observed over a number of different design iterations. The iterative design process
was based on refining, revisiting and further refining the design outcomes in order to
develop the most user friendly, cost effective and technically viable design.
6.2.1 Format and data presentation
This section is split into two component parts. The first part presents the construction
details and the building typology of the optimised design. The subsequent part
presents the results from the building costs optimisation, the life cycle costing and
financial analysis.
134

The first part, which presents the building construction details, was broken down into
the key components. This follows a logical construction process which is detailed
below:
1. House type and dimensions
2. Wall and roof construction method
a. Insulation strategy for wall construction
b. Thermal bridging reduction based on construction system
c. Thermal mass parameter
3. Energy consumption and generation (Mechanical and Electrical)
a. Outputs from renewable technologies
b. Energy usage: Regulated
c. Energy usage: Unregulated
d. Peak load calculations
e. Monthly temperature and energy profiles
f. Summary table
The second section presents the economic and the costing data derived from the
various iterations of the design process. This section is split into two component
parts. The first part presents the life cycle costing and net benefits. The section part
presents the results from traditional financial tools.
6.3 House type and dimensions
The Zedfactory house type to be optimised was a compact 3 storey home. The third
storey comprised of a sunspace and a room in the attic space. The building was
oriented to maximise the south facing roof space for renewable energy technologies.
The home was designed to fit into site masterplan of 50 homes per hectare. It is
anticipated that at this density all homes can be oriented for maximum solar gain and
renewable energy generation. According the planning portal densities of 50 to 100
homes in city centres and 50 to 65 dwellings per hectare along transport corridors
should be aimed for when designing eco towns (Planning Portal, 2008) .This design
was to be used on a case study development which would form part of the case
study research. The building description is outlined below.135

The gross internal floor area on the ground and first floor were 47m2 each.
Storey height was 2.5m for the ground and first floor and 2.68m for the
bedroom in the roof. A sloping roof pitch reduced the ceiling height at the north
elevation.
The ground floor contained a 16m2 living area, and a 21m2 kitchen diner and a
2.8m2 ground floor toilet.
The first floor contained a 17.5 m2 bedroom, an 8.5m2 bedroom with 3.3 m2 en-
suite, and a 4.5m2 bathroom, a 7.5m2 bedroom, a 1.5m2 Plant cupboard was
also on this floor
The second floor contained an 11.4m2 bedroom with a 3.6m2 en suite, 21m2
loft area.
Total external envelope area consisted of 18m2 of glazing, 185m2 of external
wall, 47m2 insulated ground floor slab and 47m2 insulated roof.
6.4 Construction system
This research focused on analysing a selection of the main construction systems
used for low carbon housing which were systematically discounted. The systems
analysed included Structurally Insulated Panels (SIPs), In-situ Concrete Formed
(ICF) systems, traditional brick and block wall systems (using fully filled mortar beds
instead of furrow joints to enhance airtightness) and Timber framed systems (Dunster
et al., 2008; Simon et al. 2013; Taki and Pendred, 2012; Hamilton-MacLaren et al.,
2013). All systems investigated used the same foundation system (See section 6.5)
6.4.1 Discounting SIPS systems from the study
Hamilton- MacLaren et al (2013) and Simon et al. (2013) define SIPS panels as
consisting of a structurally insulated foam core which acts as bracing between a
stressed skin of rigid board such as OSB, fibre cement or metal sheet. They state
that rigid insulation is either bonded to the board and pressure laminated or injected
and high temperature cured within the frame. There are many SIPS panels on the
market with most of the variations occurring with the jointing system i.e. surface
spline systems, block spline systems or cam lock systems with either PIR, PUR, EPS
or XPS foam core insulation (Simon et al., 2013; Taki and Pendred, 2012; Hamilton-
136

MacLaren et al., 2013). The process requires the SIPS panels to use high VOC
petroleum based insulation that has high embodied carbon and energy and
eliminates the ability to use natural insulation materials such as mineral wool or wood
fibre (Simon et al., 2013; Taki and Pendred, 2012; Hamilton-MacLaren et al., 2013).
Whilst most SIPS systems are standardised, each panel had to be designed for a
specific project and assembled in the factory (Simon et al., 2013; Taki and Pendred,
2012; Hamilton-MacLaren et al., 2013). The panels need to be erected on site using
heavy plant lifting equipment. This adds cost and complexity to the build. Wall
thicknesses are determined by the factory build process giving designers set
parameters to work within. The majority of systems have factory processes which
only allowed u-values to 0.16 W/m2K to be created without additional applications of
on-site insulated layers (Simon et al., 2013; Taki and Pendred, 2012; Hamilton-
MacLaren et al., 2013). As such to make a wall design with a u-value of 0.14 W/m2K
or below requires both factory production and site alteration.
SIPS panels create significant issues for foundation design and construction quality
on site. SIPs panels must be level and with minimum tolerances for differential
settlement (Simon et al., 2013). If construction occurs outside of these fine margins it
can compromise sealant within the panel joints, allowing moisture infiltration and thus
susceptibility to rot. The deflection tolerances thus require highly skilled installation
with excellent working knowledge throughout the design - CAD - production -
installation sequence (Simon et al., 2013; Hamilton-MacLaren et al., 2013). Any
failure in understanding or communication along the design chain can lead to many
problems on site in the quality of the build.
Smith et al. (2013) state that joint sealing between element junctions of a SIPS
system can lead to a significant weak point in the building fabric for air tightness and
bridge reduction. To avoid this requires skilled detailing and quality control to ensure
a successful installation and achievement of the design fabric performance. Many
SIPS manufacturers will not guarantee airtightness performance at design stage
unless the accredited installation teams will be erecting the building on site,
increasing the need for skilled labour sourced from limited availability (Simon et al.,
2013; Hamilton-MacLaren et al., 2013). This increases costs and highlights skills
gaps within traditional commercial build teams.
137

SIPS panel buildings also require careful consideration of services routing at the
design stage prior to panel fabrication (Simon et al., 2013). Many SIPS companies
place service run constraints on their systems stating they can only run through
internal partition walls with wiring through a cavity created between the SIPS panel
and an internal plasterboard lining (Simon et al., 2013; Hamilton-MacLaren et al.,
2013; Gillott et al., 2010). To avoid a light weight feel to the building many companies
prefer a chased run within a double layer of plasterboard to reduce noise and provide
a solid feel but this increases costs and on site workmanship (Simon et al., 2013;
Hamilton-MacLaren et al., 2013).
SIPS panel systems also suffer from a lack of breathability from the insulation types
used, resulting in water vapour build-up and internal air quality issues (Simon et al.,
2013; Hamilton-MacLaren et al., 2013). In addition to increasing the buildings initial
drying times this factor can lead to more serious issues with ventilation when they are
incorrectly detailed or occupants incorrectly use the ventilation system. At worst this
can create significant problems for the long term durability of the primary structure
(Simon et al., 2013; Hamilton-MacLaren et al., 2013). Timber frame buildings can
overcome this by being breathable through insulation choice and vapour control
methods.
The SIPS panel bonding processes which adheres the insulation to the outer skin is
also liable to delaminating over time. The Urethane foam insulation commonly used
is also subject to an undesirable degradation process where it can powder creating
long term issues with declared u-values (Simon et al., 2013; Taki and Pendred, 2012;
Hamilton-MacLaren et al., 2013; Gillott, 2010).
SIPS systems also cause problems for post build alterations to the building. Difficultly
in changes to the building in future occupancy modes i.e. building extensions require
careful consideration in relation to integrating new sections into the existing building
fabric.
SIPS panels also require expensive engineered timber, either I-beams or glulam
beams, for all the floor and roof panels to form the structural diaphragm of the
building (Simon et al., 2013; Taki and Pendred, 2012; Hamilton-MacLaren et al.,
2013). Good design and installation is required to eliminate the thermal bridging and
ensure airtightness is achieved. 138

Positions of windows and openings are also limited in most SIPS systems restricting
the ability to place openings with creative freedom. Perhaps more importantly for zero
carbon homes SIPS are not ideally suited to traditional solar panel installation as
there are no structural timbers within the roof plane to attached PV or roof top solar
thermal panels to (Home power, 2013). To structurally improve the systems to take
rood top solar technologies requires installing either double splines of engineered
timbers at regular intervals, dramatically increasing the thermal bridging or to not use
the SIPs panel system for the roof design and switch to a trussed roof integrated in
the SIPs system, increasing complexity (Simon et al., 2013; Taki and Pendred, 2012;
Hamilton-MacLaren et al., 2013).
In summary SIPS systems have suffered from issues relating to rot prevention, fire
resistance/ regulatory compliance, concerns with the longevity of the primary
structure, panel weight and erection equipment requirement, load bearing issues and
insulation material toxicity i.e. use of HBCD (hexabromocyclododecane), HFC, CFC,
off-gassing, application vapours (Simon et al., 2013; Taki and Pendred, 2012;
Hamilton-MacLaren et al., 2013). Many SIPS projects have thus resulted in a wall
system that is timely and costly build and could create potential long term issues.
Such issues were noted in a case study where the SIPS significantly contributed to a
40% cost uplift over an as designed code 6 development case study in 2010
(Sustainable Housing Blog, 2010). Thus, even though SIPS panel systems can be
considered popular for low energy buildings it was considered that there were
significant enough issues for the them to be discounted from the study in favour of
other build systems such as timber frame (Simon et al., 2013; Hamilton-MacLaren et
al., 2013), traditional brick and block or insitu concrete formed systems (covered in
more detail below).
6.4.2 Discounting ICF wall systems from the study
A second alternative build system investigated was ICF systems. ICF systems are
another popular choice of low energy building construction, primarily developed in
Europe but predominantly used in the USA (Taki and Pendred, 2012; Hamilton-
MacLaren et al., 2013). ICF is an insulated wall block with tied inner and outer
leaves, reinforced and filled with concrete (Taki and Pendred, 2012; Hamilton-
MacLaren et al., 2013).
139

ICF is generally a more expensive building system than either timber frame of SIPS,
adding approximately 5% to the cost premium of traditional builds (5%-10% on
construction costs) (Lewis, 2000)
One design issue with ICF is that concrete is a very high embodied carbon building
material and its usage should be minimised to reduce environmental impact (Taki
and Pendred, 2012; Hamilton-MacLaren et al., 2013).
An additional problem is that after investing in large quantities of thermally massive
and high embodied carbon material, the massive element is isolated within the
insulation block (Gillott et al., 2010). Thermal mass is most effective when placed
inside the room which the insulation layer is protecting (Dunster et al., 2008). The fact
that ICF puts the massive material inside the insulation material significantly reduces
its performance benefit as a massive material (Gillott et al., 2010).
ICF is also vapour impermeable and whilst the wall concrete is unaffected by
moisture the internal environment is and this can create rot issues with internal timber
components and create internal air quality issues (Dunster et al., 2008; Taki and
Pendred, 2012; Hamilton-MacLaren et al., 2013).
Typical U-values with ICF systems are only down to 0.19 W/m2K for a 250mm wall
build up and thus require further insulation to get to Code level 6 fabric performance
requirements and this adds cost and complexity. ICF is, however, relatively quick,
structurally superior over SIPS and timber frame and very good at eliminating thermal
bridging if the window and opening junctions are well detailed (Hawks and Percer,
2005; Taki and Pendred, 2012; Hamilton-MacLaren et al., 2013).
ICF systems generally suffer from similar off-gassing issues from the form work
insulation material which is usually a petroleum derived EPS of XPS whose usage
should also be minimised. The level of styrofoam used in ICF systems is significant
as they form all the form work around the building (Simon et al., 2013; Hawks and
Percer, 2005). Also, whilst the concrete provides a good resistance to fire, the
Styrofoam melts releasing toxic gases during combustion (Hawks and Percer, 2005;
Gillott, 2010).
ICF also has construction issues. Filling the block with concrete can present quality
issues as too rapid a pour can burst the blocks and the wrong consistency of the 140

concrete pour can also damage the insulation form work (Gadja and Dowell, 2003).
Incorrect pours can also create air pockets with the wall (Gadja and Dowell, 2003).
As the formwork is left in place inspecting walls after pouring is difficult (Gadja and
Dowell, 2003).
ICF systems are also relatively more expensive in other ways and they require
multiple trades on site to complete the fabric construction. Whilst trades are similar to
traditional construction, specialist pumping equipment is required to complete the
concrete pours at high level and care must be taken to eliminate bursting the form
work and negating voids (Gadja and Dowell, 2003).
Given the high embodied carbon of the build process, construction process, lack of
vapour permeability, high levels of styrofoam insulation, the requirement for both dry
trade and wet trades on site, isolation of the thermal mass; Styrofoam based ICF
systems were not pursued for further in this study (Hawks and Percer, 2005; Taki and
Pendred, 2012; Hamilton-MacLaren et al., 2013).
6.4.3 Using the timber framing method to overcome issues with ICF and SIPS.
Given the issues with SIPS and ICF systems highlighted in the previous sections, a
timber frame system was chosen for the optimisation process. Timber frames offer
the best trade off in terms of the ease of creating super insulated, sustainable and
optimised buildings.
Timber frame buildings have low lowest environmental impact in terms of embodied
carbon, embodied energy, low eco-toxicity, VOCs, and high recyclability.
Timber frames are easy to change and adapt to take different thicknesses of
insulation between the studs. If the stud work is oversized they can offer a cost
effective way to take thermal mass through increased load bearing, which unlike ICF,
can be connected to the internal environment.
Timber frames are also easy to reduce air leakages through carefully detailing and
positioning the airtightness membranes. Difficulties with floor/ ceiling junctions can be
easily designed around. Additionally timber frames can use structural grade timbers 141
such as C24 to eliminate the need to use expensive engineered timber such as I-
beams for joists.
Timber frames do not suffer from the accuracy and detailing issues with installing
SIPS systems on site reducing the need for specialist erection teams and the
likelihood of onsite errors.
Timber frame systems are also unrestricted in insulation choice as the insulation is
not structural as in SIPS and does not create the formwork as in ICF systems. This
means that natural materials can be used to reduce the embodied carbon, energy
and toxicity of the building.
In addition to the environmental performance benefits over ICF and SIPS, timber
framing is considered a standard construction method and not MMC. This can make
it easier to achieve warranties and mortgages, thus improving there commercial
appeal.
Timber framed solutions are predominantly comprised of dry construction methods
that do not require multiple carbon intensive concrete deliveries and trades on site,
simplifying the construction and reducing costs and trade interfaces. Given the fact
that open frame panels can be installed without heavy lifting gear, partial offsite
construction and prefabricated can occur to reduce build times.
Due to these benefits over ICF and SIPS, timber frame systems were considered to
be the most environmental, cost effective and commercially appealing and thus used
in this research. However, in order to give a fair comparison regarding costing, a
traditional brick and block build and an ICF build was used to generate a cost
baseline. The ICF system used in the final cost analysis was a non-styrofoam based
ICF eco-block system. This was to reflect the popularity of ICF in low energy
buildings but still keep environmental impact to a minimum in comparison to timber
framing (Hawks and Percer 2005; Taki and Pendred, 2012; Hamilton-MacLaren et
al., 2013). The system used was a market available system based on a recycled
wood based form work which improved air permeability issues and avoided the
excessive use of styrofoam. The system only allowed for u-values to 0.19 W/m 2K, 142

however, an additional layer of mineral wool could be used to enable an ICF building
to be insulated as low as 0.13 W/m2K.
A traditional brick and block system based on a brick outer leaf, 300mm full filled
cavity and block inner leaf with extended wall ties and cavity closers was also
included in the final cost based study to reflect the costs of adapting tradition
masonry construction to achieve improved U-values. This was based on the wall
build up at BedZED, a proven low carbon construction build using traditional brick
block techniques adapted to low carbon design (Dunster et al., 2008). This created 3
types of building system for cost based analysis:
• An over sized timber semi-balloon frame
• Eco-Block ICF (breathable non Styrofoam system)
• Traditional masonry with extended cavity.
The next section details the choice of timber framing materials and design and how
the system was optimised.
6.4.4 Timber System
An oversized timber semi-balloon frame construction method was used for the
finalised design. A balloon frame uses light weight and thinner framing members than
traditional wooden construction and the studs in the wall carry an equal distribution of
the vertical and compressive loads of the building (BRE, 2005). Rigidity is provided
by the outer OSB sheeting. Upper floors are carried by horizontal joists on top of the
studs (BRE, 2005). The timber frame was oversized because the sizing of the studs
allowed for a relatively more heavy weight frame to standard balloon frame buildings
to be created that could take increased insulation thickness and loads. Load bearing
was important for incorporating thermal mass. The semi-balloon frame also allows for
the breather membrane and airtightness layer to be dressed in a continuous layer up
the wall face making airtightness detailing to a higher level easier (BRE, 2005). The
specification and material break down of the timber frame is detailed in Table 6.1 and
figure 6.1 to 6.4.
143

Table 6.1: Wall and Roof Build-up
Copyright Zedfactory Europe Ltd
Figure 6.1: Typical Wall build up
144
Layer123456
Layer12345 18mm OSB deck
Breather Membrane 200x 75mm C16 Verticle studs at 600mm Centres Full Filled with 200mm Mineral Wool Insulation
Thermal Elements of Roof Build-up
200x 75mm C16 Verticle studs at 600mm Centres Full Filled with 200mm Mineral Wool Insulation
Breather Membrane and 25 x 38 battens at 400mm Centres15mm Cement Board
Thermal Elements of Wall Build-up15mm Cement Board200x 75mm C16 Verticle studs at 600mm Centres Full Filled with 200mm Mineral Wool Insulation15mm OSB50 x 100mm C16 Horizontal Battens at 450mm Centres Full Filled with 100mm Mineral Wool Insulation
18mm OSB deck

Copyright Zedfactory Europe Ltd
Figure 6.2: Wall and Roof Build-up under Integrated PV panels
Copyright Zedfactory Europe Ltd
Figure 6.3: Wall and Floor Build-up under North Roof
145

Copyright Zedfactory Europe Ltd
Figure 6.4: Spaces underneath the integrated PV roof
This construction system was chosen due to:
The ease of changing/ adapting the frame to different widths to take different thicknesses of insulation between the studs. The over sizing increased the capacity to take thermal mass
The ease of reducing air leakages through easy to position and wrap air tightness lines
Low costs
Timber framing is considered a standard construction method and not MMC
Timber framed solutions are predominantly comprised of dry construction methods that do not require multiple carbon intensive concrete deliveries
Timber frame solutions reduce labour trades and interfaces
Partial offsite construction and prefabricated wall panels reduce build times and allow for coordinated ‘Just in time deliveries’ to reduce the construction program length
The combined aspects reduce risk of construction delays
146
Room in Roof below Integrated PV RoofAttic Space outside the
Thermal Envelope

6.5 Insulation strategy
Mineral wool with a Lambda value of 0.037 W/m2K was chosen due to its cost
effectiveness and inert nature. Mineral wool is odourless and non-hygroscopic. It is
also rot proof and does not encourage the growth of fungi, mould or bacteria. Mineral
wool is also CFC free, HCFC free has a low ozone depletion and low environment
impact potential. Mineral wool offered the best trade off in terms of price and
performance of all the natural insulation materials used to arrive at the same U-value.
Fossil fuel derived materials were discounted from the study due to high embodied
carbon, ODP’s, CFC’s or VOC’s.
A combined 300mm of mineral wool insulation was used in the framing system with
200mm in between the studs and 100mm in between the horizontal studs. The
combined 300mm of insulation enabled low wall U-values to be created which
reduced heat loss and conserved energy. Splitting the insulation and adding the
100mm internally also helped in breaking the thermal bridges.
The ground floor slab was insulated using a high density Polystyrene (EPS) Passive
Slab foundation system. This foundation design was based on using a concrete ring
beam sited on a 300mm permanent form insulation raft of Polystyrene (EPS). This
method was chosen as it eliminated cold bridging at the wall-floor junction detail.
Eliminating this cold bridge is critical to reducing heat loss as the higher levels of
insulation in the walls causes the effect of the wall-floor cold thermal bridge to
increase in importance as it becomes a major source of heat loss. By using this
method to eliminate the cold thermal bridge at the wall-floor junction a U-value of 0.1
W/m2K was achieved. Details can be seen in figure 6.5.
147

Copyright Zedfactory Europe Ltd
Figure 6.5: Insulated Floor Slab and Foundation Build up
Copyright Zedfactory Europe Ltd
Figure 6.6: Section through Foundation Detail
A wall U-value of 0.14 W/m2K was achieved for the walls and 0.1 W/m2K for the floor
and ceiling. Build desk calculations also confirmed that the surface to avoid critical
humidity and thus mould growth was not a risk and neither was interstitial
condensation. The design detailing of the envelope ensured that the insulation
148

formed a continuous unbroken layer around the roof, walls and floor of the building
fabric to reduce thermal bridging losses.
Air tightness is also a critical factor in reducing heat loss. Airtightness is provided by
the materials and continuity of the airtightness line. At 15mm the OSB3 is considered
to be air tight if correctly taped and sealed. All critical junctions were detailed to
ensure the continuity of the air tightness line along with the correct taping and sealing
of penetrations. The design airtightness goal for this building was to achieve 1.5 air
changes per hour at 50 Pascals based on the taped and sealed OSB3. Higher levels
of airtightness are envisaged as possible given the render on the external cement
board and internal plastering but in lieu of an airtightness test and based on previous
experience within the sponsor organisation a design airtightness of 1.5 ACH was
used in this study.
6.6 Thermal bridging
Thermal bridging values were calculated using THERM and verified by the BRE.
Each thermal bridge was calculated individually with its Ψ-value and then multiplied
by the total length of the bridge. The sum of the values is the resultant thermal
bridging heat loss. The total fabric heat loss through the thermal bridging was
calculated at 14.26 W/K.
6.7 Thermal mass
In combination to reducing thermal demand via insulation, terracotta thermally
massive blocks were included in the building design to provide inertia against
temperature variations, thus reducing heating and cooling loads. The thermal mass
was integrated into the exposed ceiling soffits in the ground floor ceiling. An overall
thermal mass parameter of 239 kJ/m2K for the building was achieved. Good practice
thermally massive designs should exceed 200 kJ/m2K. The benefit of thermal mass is
taken into account in the utilisation factors calculated using the SAP 2012 method.
Timber framed buildings are more lightweight than other buildings and it is more
difficult to maximise the thermal mass parameter. This is even harder whilst trying to
reduce costs. A number of different options for the thermal mass were considered but
149

integrating into the ground floor ceiling enables TMP and cost to be reconciled. This
was made possible by the oversized frame system enabling the thermal mass to be
supported. The beam and block thermal mass flooring system was specifically
designed for lightweight frame systems and thus functioned well with the timber
frame methodology. An additional rationale for integrating the thermal mass into the
ceiling was to reduce other costs and thus the over and above costs. This was
achieved by substituting traditional flooring/ ceiling build-ups and finishes, such as
plasterboard, plaster and paint, by using a product that was already finished. The
other systems considered were not finished products. As such the beam and block
thermal mass flooring system reduced the need for some onsite trades and thus
helped reduce the implementation costs further. Other systems were also considered
but they did not offer the extra cost benefits or maximised TMP of the beam and
block system. Thermal mass was mainly limited to the ground floor ceiling but the
internal cement board with a paint finish applied also provided additional thermal
mass.
6.8 Windows
Good passive solar design means that the size of the windows in the north wall
should be reduced to no more than 15% of the total floor area. In the optimised
building north facing glazing was kept to below 4%.
Windows also have higher U-values than walls so to minimise heat loss high
performance windows are required. High performance double glazing was used to
keep window U-values around the target 1 W/m2k. Double glazed windows were
chosen as they did not add a significant cost premium unlike triple glazing. Double
glazing is also standard in traditional builds so care was taken to source high
performing double glazing. Window frames are also a weak point thermally as
significant thermal bridges can be created here. As such the windows sourced were
timber framed to reduce thermal bridging. Different suppliers of windows were
contacted to source high performance windows and costs compared. The lowest cost
option that gave an acceptable U-value was chosen. Given the other energy saving
measures the optimised design used windows with a U-value of 1.2 W/m2k, G-value
of 0.51, a frame factor of 0.65 and light transmission of 0.72.
150

6.9 Renewable energy platforms
Once load reduction techniques were defined and thermal performance established
the remaining thermal load needed to be met by renewable energy systems.
Fourteen building energy systems were designed and these were rationalised down
to four technically and economically viable systems.
The table below details the fourteen systems and the variation of system 14 with
building integrated PV.
Table 6.2: Fourteen Energy Systems
1 PV, biomass boiler, solar thermal, thermal store, Passive stack Heat recovery Ventilation system2 PV, biomass Stove with backboiler, solar thermal, thermal store, Passive stack Heat recovery Ventilation system3 PV, biomass wood pellet boiler with autofeed hopper, solar thermal, thermal store, Passive stack Heat recovery Ventilation system4 PV, ground source heat pump, solar thermal, thermal store, Passive stack Heat recovery Ventilation system5 PV, ground source heat pump, thermal store, Passive stack Heat recovery Ventilation system6 PV, exhaust air source heat pump (1), solar thermal, thermal store, Passive stack Heat recovery Ventilation system7 PV, exhaust air source heat pump (2) thermal store, Passive stack Heat recovery Ventilation system8 PV, exhaust air source heat pump (2), solar thermal, thermal store, Passive stack Heat recovery Ventilation system9 PV, air source heat pump, solar thermal, thermal store, Passive stack Heat recovery Ventilation system
10 PV, air source heat pump, solar thermal, thermal store, Passive stack Heat recovery Ventilation system11 PV, ground source heat pump, Mechanical Heat Recovery Ventilation system12 PV, air source heat pump, Mechanical Heat Recovery Ventilation system Solar thermal13 PV, integrated air source heat pump MVHR system+ Solar thermal14 PV, air source heat pump, Mechanical Heat recovery Ventilation system15 Roof integrated BIPV, air source heat pump, Mechanical Heat Recovery Ventilation system
From the fourteen technically viable solutions, four optimised energy systems were
developed using the optimisation criteria of:
1. Maximise decarbonisation above regulatory standards.
2. Reduction and simplification of technologies
3. Cost reduction.
4. Justifying Additional Costs
The energy systems using wood burning stoves were discounted in the first
screening based on the literature review findings on public aversion to biomass
systems (Delta-ee, 2012).
Biomass systems using wood pellet boilers were also eliminated in the primary
screening as:
151

The implementation cost of the auto feed hopper and storage systems were
significant.
The outputs in the techno-economic model showed lower returns than heat
pump systems.
The systems that used biomass technologies also had more core components
than other systems, 5 in total.
The combined effect of this system analysis led to the discounting of systems 1, 2
and 3.
Next the energy systems using passive stack ventilation were eliminated. These
systems were too costly to purchase and install which made them economically less
viable than MVHR systems. When combined with the large PV array and the FITS
income it was not necessary to avoid the costs and energy consumption that the
passive stack systems saved over a traditional MVHR system. Passive stack systems
were also unable to justify their additional costs though an income and the cost flow
did not turn positive over the 20 year period. This meant the running cost benefit and
energy saving benefit versus implementation costs forced any system with the
passive stack ventilators to be eliminated. This led to the discounting of systems 4 to
10.
This reduced the number of viable systems after the initial screening to four systems.
These four renewable energy platforms are detailed in table 6.3. These four systems
were used for a second screening process and comparison in this study. Table 6.3
only presents the main system components for energy generation. To avoid
repetition, the trades offs identified in the second screening are discussed in section
6.12.
152

Table 6.3: Energy Systems
Energy SystemSystem 1System 2System 3System 4
Building Envelope U Values (W/m2/k)AirtightnessHeating Whole House Ventilation RateSolar ThermalPhotovoltaicsAir Source Heat PumpGround Source heat PumpMVHR and Integrated MVHR
Notes
Technology PlatformSolar PV+MVHR+Ground Source Heat PumpSolar PV+MVHR + Air Source Heat Pump+Solar ThermalSolar PV+ Integrated MVHR+ ASHP+ Solar ThermalSolar PV+ MVHR + Air Sourced Heat Pump
250w Mono-crystalline 15.3% Efficiency4 kW3.5 kW90% Efficiency
Walls: 0.14, Ground Floor: 0.1, Roof: 0.1, Windows: 0.9 (whole window), Door: 0.91.5 ACHSet Point 18'C + Heating Emitters: Under Floor Heating Coils0.5 Air Changes Per Hour2x 16 evacuated Tube (2.1m), 3.472m2 Gross area, 1.522m2 absorption area
For reasons discussed in detail in the section 6.12 option four was determined to be
the most technically and economically balanced solution. Section 6.9 details the
outputs from system 4.
6.9.1 Outputs from system 4: PV system
Table 6.4 below shows the outputs from the PV system for option 4 over the course
of the year. The arrays were designed for new builds with minimal over shading as
the sites would be optimised for solar design. A location representative of the
average UK irradiation levels was chosen.
Table 6.4: PVGIS Outputs
153
Month Ed Em Hd HmJan 7.78 241 1.12 34.7Feb 13 363 1.86 52Mar 22.3 690 3.22 99.9Apr 31.8 954 4.73 142May 33.8 1050 5.13 159Jun 36.3 1090 5.57 167Jul 33 1020 5.11 159Aug 29.1 902 4.49 139Sep 24.5 734 3.7 111Oct 15.2 471 2.25 69.6Nov 10.3 308 1.49 44.6Dec 6.77 210 0.98 30.4
Yearly average 22 669 3.31 101Total for yearTotal per Kw installed 973
8030 1210
Fixed system: inclination=18°, orientation=0°
PVGIS estimates of solar electricity generation
Solar radiation database used: PVGIS-CMSAF
Nominal power of the PV system: 8.2 kW (crystalline silicon)Estimated losses due to temperature and low irradiance: 7.0% (using local ambient temperature)Estimated loss due to angular reflectance effects: 3.4%Other losses (cables, inverter etc.): 10.0%Combined PV system losses: 19.2%
Ed: Average daily electricity production from the given system (kWh)Em: Average monthly electricity production from the given system (kWh)Hd: Average daily sum of global irradiation per square meter received by the modules of the given system (kWh/m2)Hm: Average sum of global irradiation per square meter received by the modules of the given system (kWh/m 2)

6.9.2 Heating and hot water demand
The electrified heating source selected increased the simplicity of the system,
lowered capital costs, reduced user practice change and allowed for greater
automation of the control system. As such space heating and hot water requirements
were satisfied using a thermal store with an air source heat pump, under floor heating
coils and a ‘Mechanical Ventilation Heat Recovery (MVHR)’ unit.
The ventilation system was designed to provide a whole house background
ventilation rate of 0.6 air changes per hour to comfortably achieve building regulation
flow rates. The ventilation system was 90% efficient at heat recovery. The modelled
heat pump efficiency was adjusted monthly based on seasonal external weather
conditions to reflect efficiency drops due to lower external air temperatures based on
the average 24hr temperature for the month. Efficiency details at different external
temperatures and flow rates were supplied by the manufacturer. The average
monthly efficiency can be seen in table 6.9.
This system was modelled to provide the household’s total designed energy load and
effectively substituted all traditional heating systems from the property. As such the
entire annual energy demand of the building was met via the heat pump system and
PV platform using grid back up during times of intermittent or low production.
6.9.3 Hot Water Energy Usage
Table 6.5 below shows the hot water requirements for the building. This is based on
50L of hot water per person per day. A 300L insulated hot water tank was selected
for the thermal store.
154

Table 6.5: Hot Water Usage
rho 1000 kg/m3cp 4.19 kJ/kg.K
L/day 50 Ldays 365.25 -
tank temp (tq) 52.9 Ksupply temp (tf) 16.2 Ktemp rise (dTw) 36.7 K
Annual Heat Energy /Person/Annum (Q) 779 kWh
Domestic Hot Water Energy Requirement
Q = density(rho)*cp*L/day*days*dTw*0,001/3600
The hot water required was then adjusted for distribution losses. Heat loss from the
tank was based on manufacturers’ data. This additional energy was divided by the
number of people in the house to arrive at a total energy requirement for hot water
per person per year. This data is presented in table 6.6 below.
Table 6.6 Hot Water Usage per Person
Hot water useage litres/day LAnnual Heat Energy /Person/Annum (Q) kWh15% distribution loss kWhTotal kWhheat loss kWh/day kWhannual heat loss to from cylinder kWhannual heat loss to from cylinder attributed per person kWhTotal DHW energy requirement/person/year kWh951
553290.989611777950
Hot water Usage Allocated per person including Losses
6.9.4 Unregulated energy load data
In addition to regulated energy loads for lighting, heating and hot water the design
philosophy also required the building to take into account other energy loads. This
required an estimation of the energy requirement for appliances. Data from The
University of Surrey ‘Efficient household Appliance Survey’ (See Leach et al., 2012),
carbon footprint.com and manufacturers’ data for appliances were used to calculate
loads and run times. These are detailed in table 6.7:
155
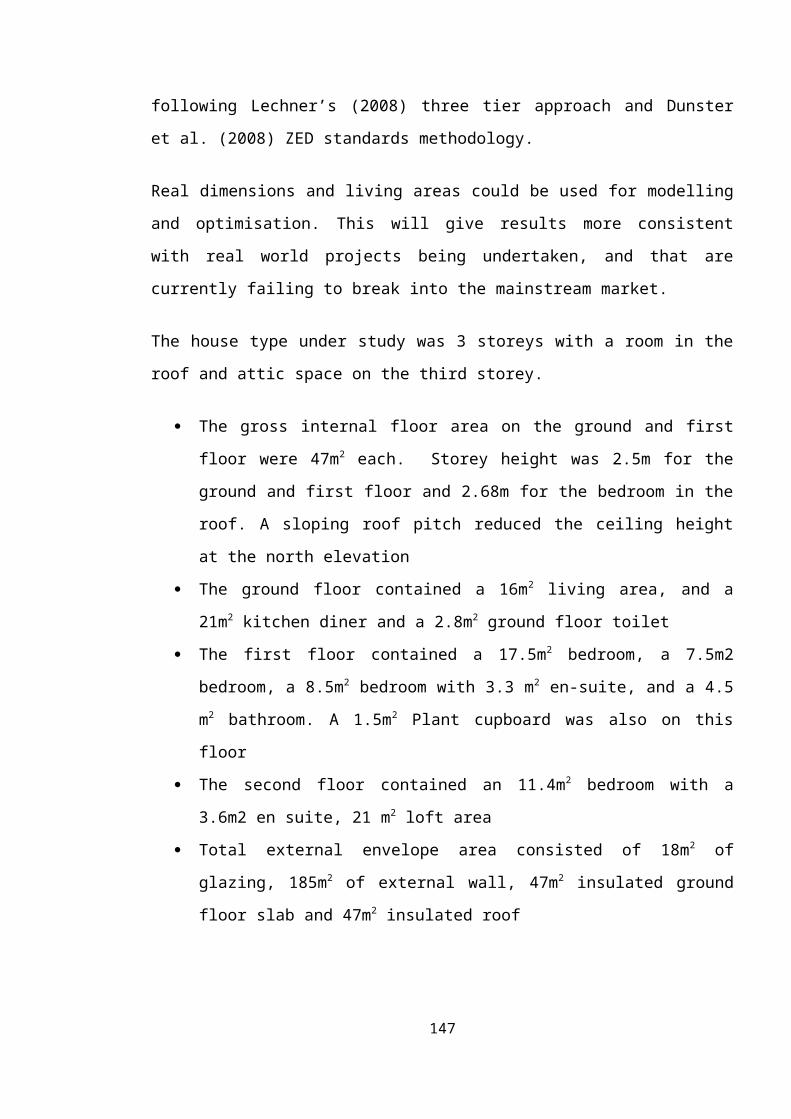
Table 6.7: Electrical Appliance Loads
Annual kwh Use Frequency SourceLighting Load 3.45 5hrs daily ManufacturerFridge Freezer 474.5 daily Univeristy of Surrey
Dish washer 383.25 8 per week Univeristy of Surreywashing machine 328.5 8 per week Univeristy of Surrey
dryer 219 7 per week Univeristy of SurreyUSB powered items (x3) 5.48 5 hours daily Manufacturer
LCD Screen TV (x2) 365 5 hours daily ManufacturerSatellite receiver (x2) 109.5 5 hours daily ManufacturerLapTop Computer (x2) 36.5 6 hours daily ManufacturerCentral Heating Pump 397.5 5300 hrs annually Manufacturer
MVHR (22w combined fan power) 192.72 24hrs daily ManufacturerInduction cooking+ A rated oven 600 1.3kw daily EU and DEFRA
microwave,kettle and misc Kitchen 290 Annual carbonfoortprint.comTotal 3405 Annual
5 Person Household
6.9.5 Peak load calculations
An important part of the building energy system and plant requirements are the peak
loads. This is because peak loads determine plant size and what technologies would
work for the house type’s energy demands. Whilst a small plant maybe more efficient
if it cannot meet the peak demand of the building, regardless of the duration of the
peak load, the system cannot be used. The peak load calculations were based on an
internal temperature of 18°c and an external temperature of -4°c The tables below
show the peak heating loads per season offset against usable peak heating gains.
Table 6.8: Peak Thermal Load
u-valueArea of Element
Specific Heat Loss Rate
dt (18 INT & -4 EXT) Q (W)
Wall 0.14 185 26 22 570Floor 0.1 47 4.70 22 103Roof 0.1 47 4.70 22 103Window 1.2 18 21.60 22 475Therm bridging Losses 14.26 22 314Ventilation and Infiltration Losses 15.50 22 341Specific Heat Loss Rate 86.67Space Heating Q (W) 1907Hot Water Peak 2200Plant Size 4107
Peak Load
156

6.9.6 Seasonal loads
To calculate the monthly and annual heating loads in relation to seasonal efficiencies
of heating technologies, monthly loads and weather profiles were created. The
monthly load profiles also took into account the usable internal gains and solar gains
and monthly gain profiles were created. Profiles were modelled using a 24 hour
average of temperature (°C). The peak loads, heating loads and heating technology
efficiencies were combined with the hot water requirements and unregulated loads.
This created the full annual energy profile for the optimised design. Table 6.9 details
the annual load profiles for the optimised design. Figure 6.7 details the energy
production versus energy demand of the building on a monthly basis.
157

Table 6.9: Annual Load Profiles for the optimised design
Month 24 Avg. Temp (dt)°
Difference between internal and extexternal Temp (18'c Set point)°
COP (Seasonal Avg 3.5)
Monthly Percentage of Annual Heating Load %
Heating Base kWh (Thermal)
Heating Base kWh (Electrical)
Hot Water Base Load
kWh (Thermal)
Hot Water kWh
(Electric)
Monthly Unregulated
Load kWh (Electrcial)
Total Electricity Use kWh
Total PV Monthly
Production kWh
Energy Balance
kWh (Electrcial)
Jan 4.8 13.2 2.8 17% 344 121 404 142 247 510 241 -269Feb 4.9 13.1 2.8 15% 229 81 368 130 223 433 363 -70Mar 6.4 11.6 3.0 15% 197 66 404 135 247 447 690 243Apr 9.3 8.7 3.3 11% 23 7 391 118 239 363 954 591May 12.4 5.6 3.6 7% 0 0 404 111 247 358 1050 692Jun 15.5 2.5 4.0 0% 0 0 391 99 239 337 1090 753Jul 17.2 0.8 4.0 0% 0 0 404 102 247 349 1020 671Aug 17.1 0.9 4.0 0% 0 0 404 102 247 349 902 553Sep 14.8 3.2 4.0 0% 0 0 391 99 239 337 734 397Oct 11.8 6.2 4.0 8% 22 6 404 102 247 354 471 117Nov 7.8 10.2 3.3 12% 164 50 391 118 239 407 308 -99Dec 5.1 12.9 3.0 16% 339 113 404 135 247 494 210 -284Average/total 3.5 100% 1317 442 4758 1391 2905 4739 8033 3294
The results in Table 6.9 demonstrate that the optimised design is energy positive for 8 months on the year and energy negative for
only 4. Annually the dwelling is significantly energy positive.
158

0
200
400
600
800
1000
1200
Jan Feb Mar Apr May Jun Jul Aug Sep Oct Nov Dec
kWh
Energy Production V's Energy Demand
Total Electricity Use kWh
Total PV Monthly Production kWh
Figure 6.7: Energy Production versus Energy Demand
6.9.7 Summary table
Table 6.10 below details the summary of the building parameters, all energy data,
and current tariffs for gas, electricity and FITs.
Table 6.10: Energy Summary
6.9.8 Verification
The thermal energy requirements of the optimised design calculated using the
equation based model were verified using a dynamic modelling tool called TRNSYS.
Table 6.11 details the outputs of the TRNSYS dynamic energy model. 159
Gross Internal Floor Area (GIFA) (thermal envelope) 120 m2Square metres of Insulated envelope 185 m2Square meters of glazing 18 m2Total Annual electrical consumption 5136 kWhVentilation Heat loss (MVHR @ 90%) 345 kWhTotal Space Heating Requirement from plant 1304 kWhPer person hot water demand 951 kWhTotal Hot Water Heating ( including losses) 4755 kWhAnnual hot water+ space heating consumption 6058 kWhAnnual space heating requirement/m2 11 kWh/m2Total energy Demand 11195 kWhTotal energy Demand/m2 93 kWhAnnual Heat Surplus 0 kWhAnnual Electrical Surplus 2894 kWhElectricity price /kWh 0.134£ £FITS Export rate 0.049£ £FITS Generation rate 0.126£ £RHI Solar Thermal Rate 0.085£ £

6.11: TRNSYS Model
The thermal energy requirement determined by the TRNSYS model was 1314kWh
per annum. The annual thermal load calculated by the equation based model was
almost identical at 1317 kWh per annum. As such the outputs from the equation
based model were determined as appropriately verified. As the equation based
model yielded a slightly higher energy consumption this was used in the economic
modelling so as not to understate the energy demand. These results are presented in
the following result section.
6.10 Economic Modelling: Wall construction
Three methods of construction were investigated for this task. It was identified that an
offsite timber frame construction method offered marginally better out turn
construction costs (£127/m2) for a fully erected external wall build-up than traditional
masonry construction (£129/m2) or an alternative eco-block construction (£135/m2)
when built to the same thermal efficiency.
This method also created a number of technical benefits in terms of speed of
erection, costs and secondary benefits. One such secondary benefit of using the
timber balloon framing method was that it did not constitute a ‘Modern Method of
Construction’ (MMC). MMC’s are disliked by many warranty provides as they do not
have a documented history to show that they will last 60 years. As such mortgaging 160

them under standard terms is more difficult. As the frame type did not use MMC this
meant that the frame would not require special considerations for lending purposes.
This has important implications for its appeal to national house builders as not only is
there a cost reduction but the construction method would qualify for lending and
NHBC warranty under standard terms.
6.11 Economic Modelling: Cost benefit analysis of the building fabric optimisation
The initial cost benefit analysis demonstrated that timber frame construction offered
better outturn construction costs, however, these were not as pronounced as
anticipated. As such selecting timber framing as the lowest cost framing technique
was justified but looking for other fabric cost optimisation areas was also required. A
cost benefit trade off was conducted on the fabric materials to further reduce costs.
This was achieved through observing the interplay between implementation costs
and running costs. A good example of this is the level of insulation selected based on
the cost versus achieved U-value. The walls of the building were insulated to a U-
value of 0.14W/m2K. The ground floor slab and roof were insulated to a U-value of
0.1W/m2K. This was due to the disproportionate cost of reducing the U-value further
than 0.14W/m2K for the walls. In terms of cost benefit the additional cost of improving
the building fabric displayed significant drop-off after this point. Each additional
100mm of insulation only provided decreasing additional energy savings than the
100mm layer before whilst the material cost remained the same. 400mm of insulation
only reduced the energy requirement by half that of the 200mm layer before. When
modelled, once the 300mm level of insulation was reached, the next 100mm of
insulation only reduced annual energy cost by £7.65 per annum whilst increasing the
cost per m2 of wall by £8/m2. Table 6.11 below shows that the first additional layer of
100mm insulation saves 1166kWh per annum. The next 100mm (300mm total) only
saved an additional 318 kWh whilst increasing to 400mm only saved 200kWh over
the 300mm insulation total. Plant size at 300mm drops by almost 1kW peak to 4.1kW
whereas plant size after 300mm only reduces by a further 0.08 kW. Table 6.12
demonstrates the insulation levels, energy saved and cost to save this energy.
Table 6.12: Insulation Cost benefit
161

mm of Insulation
Energy saved kWh over
whole Total wall area
Cost per M2
200 1166 16.00£ 300 318 24.00£ 400 200 32.00£
Other examples of fabric cost optimisation can be seen in the materials substitutions
for thermal mass, detailed in section 6.7 and the integrated PV system detailed in
section 6.12.1.
A secondary impact was the thickness of the walls. On a constrained site this would
mean lower density housing and less gross internal space and this would impact the
end property value or, as was the case with the case study, the gross development
value by reducing the number of properties on the site. A U-value of 0.14W/m2K still
allowed cost effective energy system design as the impact on the thermal load did
not significantly increase the plant size. For example, a reduction to 0.12W/m2K
required an additional 100mm of insulation but only reduced the thermal energy input
by 200kWhr per annum. This additional thermal load did not require a larger heating
plant to satisfy it as the peak load only changed from 4.025kW to 4.107kW with the
reduction in insulation. The increase in the wall thickness was 200mm on the North-
South and 200mm on the East-West walls when combined. As such this had both a
cost implication in terms of additional insulation and building footprint/ site density
implication on the case study.
The ground floor slab was easier to insulate to a lower U-value. A U-value of
0.1W/m2K was achieved due to the concrete ring beam being sited on the 300mm
permanent form insulation raft, a foundation method required to reduce thermal
bridging through the floor. The added benefit of this foundation method eliminated the
need for external footings. It also reduced the amount of concrete required and
substituted the requirement for pouring screed. This meant that the concrete only
needs to be poured once, thus reducing concrete costs and installation over
traditional strip foundations.
162
The depth and position of the ceiling rafters also meant that it was easier to
incorporate additional insulation into the ceiling plain to achieve 0.1 W/m2K more cost
effectively than it was in the walls.
A full cost breakdown is detailed in table 6.12
6.12 Economic Modelling: Energy systems
The trade-offs in energy system design were decided based on implementation cost,
life cycle costs, usability and simplicity. Four systems were designed to meet the
energy load of the modelled building, however, three were subsequently found not to
effectively balance the cost-usability trade-off.
Table 6.13: Technology Platforms
Energy SystemSystem 1System 2System 3System 4
Building Envelope U Values (W/m2/k)AirtightnessHeating Whole House Ventilation RateSolar ThermalPhotovoltaicsAir Source Heat PumpGround Source heat PumpMVHR and Integrated MVHR
Notes
Technology PlatformSolar PV+MVHR+Ground Source Heat PumpSolar PV+MVHR + Air Source Heat Pump+Solar ThermalSolar PV+ Integrated MVHR+ ASHP+ Solar ThermalSolar PV+ MVHR + Air Sourced Heat Pump
250w Mono-crystalline 15.3% Efficiency4 kW3.5 kW90% Efficiency
Walls: 0.14, Ground Floor: 0.1, Roof: 0.1, Windows: 0.9 (whole window), Door: 0.91.5 ACHSet Point 18'C + Heating Emitters: Under Floor Heating Coils0.5 Air Changes Per Hour2x 16 evacuated Tube (2.1m), 3.472m2 Gross area, 1.522m2 absorption area
System 1 was simplistic and easy to use, however, it also had the highest capital and
installation costs and was thus too capital intensive to be cost effective. The higher
COP of the heat pump helped reduce both life cycle costs and the PV costs,
however, the cost of the installed ground source system was too prohibitive. The total
over and above system cost, installed including coils and cylinder, was estimated at
£25,775.
System 2 substituted the ground source heat pumps for air sourced heat pumps to
reduce cost. It also added solar thermal panels. This reduced electrical demand for
hot water heating and compensated for the lower COP.
Whilst these substitutions significantly reduced capital costs over option 1 it
increased system complexity by adding an additional technology. This meant 163

additional storage tanks and control systems as well as ongoing maintenance
procedures would be required. As such the system did not minimise user
requirements due to complexity. The total over and above costs for system 2 were
£14,513.
System 3 aimed to reduce costs further by using an integrated mechanical ventilation
heat recovery (MVHR) and air-source heat pump unit. Whist this was initially
considered cheaper the total construction costs were in fact higher due to the novelty
of the system. It also included solar thermal panels to meet hot water demands within
the electrical production limit. As such system 3 did not reduce costs over system 2
and did not, in the end, minimise user requirements by combining the air source heat
pump and MVHR. This was due to the addition of solar thermal controls.
The combined MVHR and heat pump unit also had a negative impact on heating
loads as the combined system over ventilated the building to meet winter heating and
hot water loads. This increased the ventilation rate from 0.6ACH to 1.3 ACH. This
was due to two issues. Firstly the air supply to the heat pump took priority which
meant that when a thermal demand existed the MVHR was bypassed. This in effect
cooled the building by bringing cold air in without recovering the heat from the extract
air (which went to the heat pump). As such the unit had to provide more heat for
longer by using electricity. Secondly there was an inability to regulate the air flow
whilst the heat pump was in operation this meant the ventilation rate was too high
under certain conditions. As such more energy was required to maintain the steady
state heating requirement of the building than if a non-integrated unit was used.
Unfortunately this meant an additional level of control but the improvements in energy
consumption warranted it. Also, this negatively impacted life cycle costs. The total
over and above costs for system 3 were £14,825.
System 4 offered the best balance of costs and usability. The removal of solar
thermal, increased electrical demand for heating and hot water but simplified the
storage and control systems. It also reduced a layer of installation and capital costs.
The separation of the MVHR from the air source heat pump remedied the over
ventilation and MVHR bypass issues experienced when modelling option 3.
164

The removal of the solar thermal collectors also simplified the system. However, this
required more electrical energy to provide hot water which increased energy
demands from electrical sources. A secondary benefit from removing the solar
thermal was that the size of the PV array could be increased by utilising the roof
space vacated by the solar thermal collectors. This allowed the additional electrical
energy consumption of the heat pump to be offset by the increased PV output. This
also brought into question the cost benefit of energy saving versus technology choice
and income. The PV offered better cost benefits than the solar thermal and thus
although it increased electrical energy demand it reduced life cycle costs. The total
over and above costs of this system was £13,484.
Once the lowest cost energy system was established the additional methods of
reducing the over and above costs could be investigated. The process this took was
to investigate additional material integration and substitution of traditional building
materials. The results of this process are detailed in the following section.
6.12.1 Integrated PV systems
As a consequence of this research it was identified that roof mounted PV and
standard Building Integrated PV (BIPV) were not the most economical way to
incorporate PV panels into a new build home. This was due to the need to install a
roofing build-up and then include PV panelling as an additional cost on top. A
consequence of this was that a main component of the energy system significantly
added to the over and above costs.
Roof integrated BIPV technologies were then investigated to see if the potential
existed for further cost reductions. Current market available BIPV did not offer lower
pricing than roof mounted BIPV for the same power density, in fact costs increased.
This lead to further investigations into how best to reduce PV costs through material
substitution.
The main issue with existing market ready solutions was that the BIPV was used
primarily to create a flush fitting roofing plain to improve aesthetics and this attracted
a price premium. Many components of tradition roofing solutions were still required
such as the rafter, vapour permeable layer, decking, sarking, counter batten and tiling
165

batten. The higher cost PV mounted tile is than added to the roofing costs. This did
not reduce over and above costs.
According to calculations based on Langdon (2012) costs for a roof occupying the
approximate area to meet energy loads would equate to £4,500-£5,500 depending on
roof type. Design iterations showed that if the roofing substrate from the rafter level
upwards was replaced by PV it offered significant opportunity for improved cost
effectiveness as long as the cost of the PV panel did not significantly increase. As
such methods for reducing costs further were developed.
The main changes required to integrate the PV panel into the roof involved
engineering modifications to enable the conversion of a PV panel into a complete
roofing substrate. The edge extrusions of the panels were reengineered to utilise an
overlapping flashing cap to create a weather proof seal to the PV tiling system.
EPDM seals and gaskets were used in the panel joints to increase the resistance to
weather conditions, especially wind driven rain. A condensate drainage channel was
also developed to allow the panels to be securely fastened to the rafters to protect
against wind uplift. Finally eaves, ridge and verge flashings were developed to
complete the roof. These are detailed in figure 6.8.
166

Copyright Zedfactory Europe Ltd
Figure 6.8: Integrated Roofing Panel and System Installation Details
167

The finished design was tested and certified by the Building Research Establishment
to meet with the appropriate BS and EN standards for roofing products and released
to the market.
According to calculations based on Langdon (2012), a roof occupying the same area
equates to around £83 per m2. The cost of the integrated PV roofing system equated
to £170 per m2. The net over and above cost to be offset was therefore £87 per m2.
For comparison, a roof mounted system would be approximately £283 per m2. The
cost benefit of the integrated PV roof system was thus only £83 m2 versus £283 m2.
The net benefit from using the roof integrated system was £204 m2.As such the total
over and above cost for system 4 was reduced to £10,244.
6.13 Optimised cost summary
The following section details the over and above costs for the final optimised system.
6.13.1 Total building costs
To price the full building specification all elements were priced using current rates
from manufacturers, Langdon (2012), and quantity surveyor prices. This included the
cost of interior finishing. Table 6.13 below details the costs of the complete building fit
out. Total construction costs was only £1184 per m2
Table 6.14: Costs of the Complete Building
168
Work Packages Line Item costsRaft Foundation System + Dwarf Wall details 13,000£ Frameworks 30,443.00£ Incoming Services 5,000.00£ Wall system 12,724£ Glulam Beam and Terracotta Block Floor 5,000£ Cost for the Supply & 1st Fix of Staircases (Excluding spindles, aprons and other 2nd/3rd Fix Items) 2,534£
300mm MW+100mm MW+ VCL to solar Loft Floor 872£
EPDM Tanking under PV roof ( required for NHBC) 2,200£ Ventilation hatches to Solar Loft (18mm ply, hinges, chain and catch / clasp): 300£ North Facing ROOF Complete 3,097£ PV Roof - Materials only 8,250.00£ PV Roof - Fixing only 600£ Velux Roof Lights 1,200.00£ Flashing to Solar loft wall / roof junction: 200.00£ Window and doors, installed excluding internal reveals and external cills 8,250.76£ External Cills supply only cost ( install cost inc in windows) 272.60£ MVHR + ASHP inc Under floor system installed 7754inverter, sundries, consumer units, electrical labour,G59,, MCS handover packs 2,481£ Julliettes 2,000£ Soffits and Barge Boards 2,213.53£ Rainwater Goods 564£ Soil Stack (110mm PVC) 150.00£ SUB-TOTAL 109,106£
Sub-total - Shell and Core services m2 inc Developer Costs 117,835£
Cost to complete finishes (QS Pricing) 50,283£
Total On Plot Turn Key costs (Excluding site civils, Planning, Section 106) 168,117.51£

6.14 Lifetime cost benefits
Tables 6.15 and 6.16 below show the results of the techno-economic model. They
detail the economic outputs based on the energy and climate models. Table 6.15
shows the net benefit calculation including mortgage costs and avoided costs. Table
6.16 shows the self-funding model which included mortgage rates but excluded
avoided costs. Table 6.17 shows the modelling run without the FIT’s. All three tables
used 3% RPI inflation rate and 5% fuel price escalation. Figures 6.9 and 6.10 detail
the economic outputs based on the energy consumption and production.
169
Work Packages Line Item costsRaft Foundation System + Dwarf Wall details 13,000£ Frameworks 30,443.00£ Incoming Services 5,000.00£ Wall system 12,724£ Glulam Beam and Terracotta Block Floor 5,000£ Cost for the Supply & 1st Fix of Staircases (Excluding spindles, aprons and other 2nd/3rd Fix Items) 2,534£
300mm MW+100mm MW+ VCL to solar Loft Floor 872£
EPDM Tanking under PV roof ( required for NHBC) 2,200£ Ventilation hatches to Solar Loft (18mm ply, hinges, chain and catch / clasp): 300£ North Facing ROOF Complete 3,097£ PV Roof - Materials only 8,250.00£ PV Roof - Fixing only 600£ Velux Roof Lights 1,200.00£ Flashing to Solar loft wall / roof junction: 200.00£ Window and doors, installed excluding internal reveals and external cills 8,250.76£ External Cills supply only cost ( install cost inc in windows) 272.60£ MVHR + ASHP inc Under floor system installed 7754inverter, sundries, consumer units, electrical labour,G59,, MCS handover packs 2,481£ Julliettes 2,000£ Soffits and Barge Boards 2,213.53£ Rainwater Goods 564£ Soil Stack (110mm PVC) 150.00£ SUB-TOTAL 109,106£
Sub-total - Shell and Core services m2 inc Developer Costs 117,835£
Cost to complete finishes (QS Pricing) 50,283£
Total On Plot Turn Key costs (Excluding site civils, Planning, Section 106) 168,117.51£

Table 6.15: Net Benefit Calculation including Mortgage Costs and Avoided Costs
170
1 2 3 4 5 6 7 8 9 10 11 12 13 14 15 16 17 18 19 20 21 22 23 24 25
Year 2015 2016 2017 2018 2019 2020 2021 2022 2023 2024 2025 2026 2027 2028 2029 2030 2031 2032 2033 2034 2035 2036 2037 2038 2039FITS linked RPI increase 0% 3% 3% 3% 3% 3% 3% 3% 3% 3% 3% 3% 3% 3% 3% 3% 3% 3% 3% 3% 3% 3% 3% 3% 3%Price increase over inflation 0% 5% 5% 5% 5% 5% 5% 5% 5% 5% 5% 5% 5% 5% 5% 5% 5% 5% 5% 5% 5% 5% 5% 5% 5%
Utility Costs
ElectricityTarrif InformationRate 0.13£ 0.14£ 0.15£ 0.16£ 0.16£ 0.17£ 0.18£ 0.19£ 0.20£ 0.21£ 0.22£ 0.23£ 0.24£ 0.25£ 0.27£ 0.28£ 0.29£ 0.31£ 0.32£ 0.34£ 0.36£ 0.37£ 0.39£ 0.41£ 0.43£ Export price per kWh 0.049£ 0.051£ 0.053£ 0.056£ 0.059£ 0.062£ 0.065£ 0.068£ 0.072£ 0.075£ 0.079£ 0.083£ 0.087£ 0.091£ 0.096£ 0.101£ 0.106£ 0.111£ 0.117£ 0.123£ 0.129£ 0.135£ 0.142£ 0.149£ 0.156£ FITS rate 0.126£ 0.129£ 0.133£ 0.137£ 0.141£ 0.146£ 0.150£ 0.155£ 0.159£ 0.164£ 0.169£ 0.174£ 0.179£ 0.185£ 0.190£ 0.196£ 0.202£ 0.208£ 0.214£ 0.220£ 0.227£ 0.234£ 0.241£ 0.248£ 0.256£
HeatTarrif InformationRate 0.05£ 0.05£ 0.06£ 0.06£ 0.06£ 0.06£ 0.07£ 0.07£ 0.07£ 0.08£ 0.08£ 0.09£ 0.09£ 0.09£ 0.10£ 0.10£ 0.11£ 0.11£ 0.12£ 0.13£ 0.13£ 0.14£ 0.15£ 0.15£ 0.16£ Delivered heat price at boiler efficiency 0.06 0.06 0.06 0.07 0.07 0.08 0.08 0.08 0.09 0.09 0.10 0.10 0.11 0.11 0.12 0.12 0.13 0.13 0.14 0.15 0.16 0.16 0.17 0.18 0.19
Photovoltaic systemGenerated power used in house (kWh) 3774.375 3774.375 3774.375 3774.375 3774.375 3736.63125 3699.2649 3662.27229 3625.65 3589.393 3553.499 3517.964 3482.785 3447.957 3413.477 3379.342 3345.549 3312.093 3278.972 3246.183 3213.721 3181.584 3149.768 3118.2702 3087.087498Generated power exported (kWh) 3774.375 3774.375 3774.375 3774.375 3774.375 3736.63125 3699.2649 3662.27229 3625.65 3589.393 3553.499 3517.964 3482.785 3447.957 3413.477 3379.342 3345.549 3312.093 3278.972 3246.183 3213.721 3181.584 3149.768 3118.2702 3087.087498Cost and IncomeAvoided cost from power used in house £346.21 £363.52 £381.70 £400.79 £420.83 £441.87 £463.96 £487.16 £511.52 £537.09 £563.95 £592.14 £621.75 £652.84 £685.48 £719.75 £755.74 £793.53 £833.21 £874.87 £918.61 £964.54 £1,012.77 £1,063.40 £1,116.57Income from export £183.06 £192.21 £201.82 £211.91 £222.51 £231.30 £240.43 £249.93 £259.80 £270.06 £280.73 £291.82 £303.35 £315.33 £327.78 £340.73 £354.19 £368.18 £382.73 £397.84 £413.56 £429.89 £446.87 £464.53 £482.87Bought in Energy -£287.82 -£302.21 -£317.32 -£333.18 -£349.84 -£367.33 -£385.70 -£404.98 -£425.23 -£446.50 -£468.82 -£492.26 -£516.87 -£542.72 -£569.85 -£598.35 -£628.26 -£659.68 -£692.66 -£727.29 -£763.66 -£801.84 -£841.93 -£884.03 -£928.23FITs income £1,131.94 £1,169.55 £1,208.49 £1,248.78 £1,290.48 £1,320.31 £1,350.90 £1,382.27 £1,414.45 £1,447.46 £1,481.32 £1,516.06 £1,551.70 £1,588.28 £1,625.81 £1,664.33 £1,703.86 £1,744.44 £1,786.10 £1,828.86 £1,872.77 £1,917.85 £1,964.14 £2,011.69 £2,060.51NET Annual Benefit £1,190.33 £1,230.87 £1,272.87 £1,316.38 £1,361.46 £1,394.84 £1,429.16 £1,464.44 £1,500.73 £1,538.05 £1,576.44 £1,615.94 £1,656.58 £1,698.40 £1,741.44 £1,785.74 £1,831.34 £1,878.29 £1,926.64 £1,976.43 £2,027.72 £2,080.55 £2,134.98 £2,191.06 £2,248.86Replacement Inverter -£1,000Monthly Net Benefit £99.19 £102.57 £106.07 £109.70 £113.46 £116.24 £119.10 £122.04 £125.06 £128.17 £131.37 £51.33 £138.05 £141.53 £145.12 £148.81 £152.61 £156.52 £160.55 £164.70 £168.98 £173.38 £177.91 £182.59 £187.40Summary or loan repayment and avoided costAnnual Loan Repayment £0.00 £0.00 £0.00 £0.00 £0.00 £0.00 £0.00 £0.00 £0.00 £0.00 £0.00 £0.00 £0.00 £0.00 £0.00 £0.00 £0.00 £0.00 £0.00 £0.00 £0.00 £0.00 £0.00 £0.00 £0.00Total Annual cost/income £1,190.33 £1,230.87 £1,272.87 £1,316.38 £1,361.46 £1,394.84 £1,429.16 £1,464.44 £1,500.73 £1,538.05 £1,576.44 £1,615.94 £1,656.58 £1,698.40 £1,741.44 £1,785.74 £1,831.34 £1,878.29 £1,926.64 £1,976.43 £2,027.72 £2,080.55 £2,134.98 £2,191.06 £2,248.86Monthly Profit/loss £99.19 £102.57 £106.07 £109.70 £113.46 £116.24 £119.10 £122.04 £125.06 £128.17 £131.37 £134.66 £138.05 £141.53 £145.12 £148.81 £152.61 £156.52 £160.55 £164.70 £168.98 £173.38 £177.91 £182.59 £187.40
Mineral wool InsulationAnnual usable heat saving (kWh) 965 965 965 965 965 965 965 965 965 965 965 965 965 965 965 965 965 965 965 965 965 965 965 965 965Cost and IncomeAvoided cost from heat saved £56.74 £59.58 £62.56 £65.68 £68.97 £72.42 £76.04 £79.84 £83.83 £88.02 £92.42 £97.04 £101.90 £106.99 £112.34 £117.96 £123.86 £130.05 £136.55 £143.38 £150.55 £158.08 £165.98 £174.28 £182.99Monthly Net Benefit £4.73 £4.96 £5.21 £5.47 £5.75 £6.03 £6.34 £6.65 £6.99 £7.34 £7.70 £8.09 £8.49 £8.92 £9.36 £9.83 £10.32 £10.84 £11.38 £11.95 £12.55 £13.17 £13.83 £14.52 £15.25Summary or loan repayment and avoided costAnnual Maintenance cost £0.00 £0.00 £0.00 £0.00 £0.00 £0.00 £0.00 £0.00 £0.00 £0.00 £0.00 £0.00 £0.00 £0.00 £0.00 £0.00 £0.00 £0.00 £0.00 £0.00 £0.00 £0.00 £0.00 £0.00 £0.00Annual Loan Repayment £0.00 £0.00 £0.00 £0.00 £0.00 £0.00 £0.00 £0.00 £0.00 £0.00 £0.00 £0.00 £0.00 £0.00 £0.00 £0.00 £0.00 £0.00 £0.00 £0.00 £0.00 £0.00 £0.00 £0.00 £0.00Total Annual cost/income £56.74 £59.58 £62.56 £65.68 £68.97 £72.42 £76.04 £79.84 £83.83 £88.02 £92.42 £97.04 £101.90 £106.99 £112.34 £117.96 £123.86 £130.05 £136.55 £143.38 £150.55 £158.08 £165.98 £174.28 £182.99Monthly Profit/loss £4.73 £4.96 £5.21 £5.47 £5.75 £6.03 £6.34 £6.65 £6.99 £7.34 £7.70 £8.09 £8.49 £8.92 £9.36 £9.83 £10.32 £10.84 £11.38 £11.95 £12.55 £13.17 £13.83 £14.52 £15.25
Mechnical Ventilation Heat Recovery SavingAnnual usable heat saving (kWh) 3024 3024 3024 3024 3024 3024 3024 3024 3024 3024 3024 3024 3024 3024 3024 3024 3024 3024 3024 3024 3024 3024 3024 3024 3024Cost and IncomeAvoided cost from heat saved £177.86 £186.76 £196.10 £205.90 £216.20 £227.01 £238.36 £250.27 £262.79 £275.93 £289.72 £304.21 £319.42 £335.39 £352.16 £369.77 £388.26 £407.67 £428.05 £449.45 £471.93 £495.52 £520.30 £546.32 £573.63Monthly Net Benefit £14.82 £15.56 £16.34 £17.16 £18.02 £18.92 £19.86 £20.86 £21.90 £22.99 £24.14 £25.35 £26.62 £27.95 £29.35 £30.81 £32.35 £33.97 £35.67 £37.45 £39.33 £41.29 £43.36 £45.53 £47.80Summary or loan repayment and avoided costAnnual Loan Repayment £0.00 £0.00 £0.00 £0.00 £0.00 £0.00 £0.00 £0.00 £0.00 £0.00 £0.00 £0.00 £0.00 £0.00 £0.00 £0.00 £0.00 £0.00 £0.00 £0.00 £0.00 £0.00 £0.00 £0.00 £0.00Total Annual cost/income £177.86 £186.76 £196.10 £205.90 £216.20 £227.01 £238.36 £250.27 £262.79 £275.93 £289.72 £304.21 £319.42 £335.39 £352.16 £369.77 £388.26 £407.67 £428.05 £449.45 £471.93 £495.52 £520.30 £546.32 £573.63Monthly Profit/loss £14.82 £15.56 £16.34 £17.16 £18.02 £18.92 £19.86 £20.86 £21.90 £22.99 £24.14 £25.35 £26.62 £27.95 £29.35 £30.81 £32.35 £33.97 £35.67 £37.45 £39.33 £41.29 £43.36 £45.53 £47.80ASHPAnnual usable heat harvest HW(kWhrs) 6167 6167 6167 6167 6167 6167 6167 6167 6167 6167 6167 6167 6167 6167 6167 6167 6167 6167 6167 6167 6167 6167 6167 6167 6167space heating 1412 1412 1412 1412 1412 1412 1412 1412 1412 1412 1412 1412 1412 1412 1412 1412 1412 1412 1412 1412 1412 1412 1412 1412 1412Cost and IncomeAvoided cost from heat saved (-running cost) £151.32 £169.46 £188.51 £208.50 £229.50 £251.55 £274.70 £299.00 £324.52 £351.32 £379.46 £409.01 £440.03 £472.60 £506.80 £542.72 £580.42 £620.02 £661.59 £705.24 £751.07 £799.20 £849.73 £902.79 £958.50RHI for ASHP £0.00 £0.00 £0.00 £0.00 £0.00 £0.00 £0.00 £0.00 £0.00 £0.00 £0.00 £0.00 £0.00 £0.00 £0.00 £0.00 £0.00 £0.00 £0.00 £0.00 £0.00 £0.00 £0.00 £0.00 £0.00RHI for Biomass £0.00 £0.00 £0.00 £0.00 £0.00 £0.00 £0.00 £0.00 £0.00 £0.00 £0.00 £0.00 £0.00 £0.00 £0.00 £0.00 £0.00 £0.00 £0.00 £0.00 £0.00 £0.00 £0.00 £0.00 £0.00Monthly Net Benefit £12.61 £14.12 £15.71 £17.38 £19.12 £20.96 £22.89 £24.92 £27.04 £29.28 £31.62 £34.08 £36.67 £39.38 £42.23 £45.23 £48.37 £51.67 £55.13 £58.77 £62.59 £66.60 £70.81 £75.23 £79.88Summary or loan repayment and avoided costAnnual Loan Repayment £0.00 £0.00 £0.00 £0.00 £0.00 £0.00 £0.00 £0.00 £0.00 £0.00 £0.00 £0.00 £0.00 £0.00 £0.00 £0.00 £0.00 £0.00 £0.00 £0.00 £0.00 £0.00 £0.00 £0.00 £0.00Total Annual cost/income £151.32 £169.46 £188.51 £208.50 £229.50 £251.55 £274.70 £299.00 £324.52 £351.32 £379.46 £409.01 £440.03 £472.60 £506.80 £542.72 £580.42 £620.02 £661.59 £705.24 £751.07 £799.20 £849.73 £902.79 £958.50Monthly Profit/loss £12.61 £14.12 £15.71 £17.38 £19.12 £20.96 £22.89 £24.92 £27.04 £29.28 £31.62 £34.08 £36.67 £39.38 £42.23 £45.23 £48.37 £51.67 £55.13 £58.77 £62.59 £66.60 £70.81 £75.23 £79.88
Summary TotalsAdditional Monthly Mortgage Repayment -£59.89 -£59.89 -£59.89 -£59.89 -£59.89 -£59.89 -£59.89 -£59.89 -£59.89 -£59.89 -£59.89 -£59.89 -£59.89 -£59.89 -£59.89 -£59.89 -£59.89 -£59.89 -£59.89 -£59.89 -£59.89 -£59.89 -£59.89 -£59.89 -£59.89Avoided costs £61.01 £64.94 £69.07 £73.41 £77.96 £82.74 £87.75 £93.02 £98.55 £104.36 £110.46 £116.87 £123.59 £130.65 £138.07 £145.85 £154.02 £162.61 £171.62 £181.08 £191.01 £201.44 £212.40 £223.90 £235.97Income ( cash inflows - cash outflows) £70.34 £72.28 £74.26 £76.30 £78.39 £79.41 £80.43 £81.44 £82.43 £83.41 £84.37 £85.32 £86.24 £87.13 £88.00 £88.83 £89.63 £90.40 £91.12 £91.80 £92.43 £93.00 £93.52 £93.97 £94.36Total Inflows/Avoided costs £131.36 £137.22 £143.34 £149.71 £156.34 £162.15 £168.19 £174.46 £180.99 £187.78 £194.84 £202.18 £209.83 £217.78 £226.06 £234.68 £243.66 £253.00 £262.74 £272.88 £283.44 £294.45 £305.92 £317.87 £330.33Net Monthly Benefit £71.47 £77.33 £83.45 £89.82 £96.45 £102.26 £108.30 £114.57 £121.10 £127.89 £134.95 £142.29 £149.94 £157.89 £166.17 £174.79 £183.77 £193.11 £202.85 £212.99 £223.55 £234.56 £246.03 £257.98 £270.44
Table 6.16: Net Benefit Calculation Excluding Avoided Costs
171
Year 2015 2016 2017 2018 2019 2020 2021 2022 2023 2024 2025 2026 2027 2028 2029 2030 2031 2032 2033 2034 2035 2036 2037 2038 2039FITS linked RPI increase 0% 3% 3% 3% 3% 3% 3% 3% 3% 3% 3% 3% 3% 3% 3% 3% 3% 3% 3% 3% 3% 3% 3% 3% 3%Price increase over inflation 0% 5% 5% 5% 5% 5% 5% 5% 5% 5% 5% 5% 5% 5% 5% 5% 5% 5% 5% 5% 5% 5% 5% 5% 5%
Utility Costs
ElectricityTarrif InformationRate 0.13£ 0.14£ 0.15£ 0.16£ 0.16£ 0.17£ 0.18£ 0.19£ 0.20£ 0.21£ 0.22£ 0.23£ 0.24£ 0.25£ 0.27£ 0.28£ 0.29£ 0.31£ 0.32£ 0.34£ 0.36£ 0.37£ 0.39£ 0.41£ 0.43£ Export price per kWh 0.049£ 0.051£ 0.053£ 0.056£ 0.059£ 0.062£ 0.065£ 0.068£ 0.072£ 0.075£ 0.079£ 0.083£ 0.087£ 0.091£ 0.096£ 0.101£ 0.106£ 0.111£ 0.117£ 0.123£ 0.129£ 0.135£ 0.142£ 0.149£ 0.156£ FITS rate 0.126£ 0.129£ 0.133£ 0.137£ 0.141£ 0.146£ 0.150£ 0.155£ 0.159£ 0.164£ 0.169£ 0.174£ 0.179£ 0.185£ 0.190£ 0.196£ 0.202£ 0.208£ 0.214£ 0.220£ 0.227£ 0.234£ 0.241£ 0.248£ 0.256£
HeatTarrif InformationRate 0.05£ 0.05£ 0.06£ 0.06£ 0.06£ 0.06£ 0.07£ 0.07£ 0.07£ 0.08£ 0.08£ 0.09£ 0.09£ 0.09£ 0.10£ 0.10£ 0.11£ 0.11£ 0.12£ 0.13£ 0.13£ 0.14£ 0.15£ 0.15£ 0.16£ Delivered heat price at boiler efficiency 0.06 0.06 0.06 0.07 0.07 0.08 0.08 0.08 0.09 0.09 0.10 0.10 0.11 0.11 0.12 0.12 0.13 0.13 0.14 0.15 0.16 0.16 0.17 0.18 0.19
Photovoltaic systemGenerated power used in house (kWh) 3774.375 3774.375 3774.375 3774.375 3774.375 3736.63125 3699.2649 3662.27229 3625.65 3589.393 3553.499 3517.964 3482.785 3447.957 3413.477 3379.342 3345.549 3312.093 3278.972 3246.183 3213.721 3181.584 3149.768 3118.2702 3087.087498Generated power exported (kWh) 3774.375 3774.375 3774.375 3774.375 3774.375 3736.63125 3699.2649 3662.27229 3625.65 3589.393 3553.499 3517.964 3482.785 3447.957 3413.477 3379.342 3345.549 3312.093 3278.972 3246.183 3213.721 3181.584 3149.768 3118.2702 3087.087498Cost and IncomeAvoided cost from power used in house £346.21 £363.52 £381.70 £400.79 £420.83 £441.87 £463.96 £487.16 £511.52 £537.09 £563.95 £592.14 £621.75 £652.84 £685.48 £719.75 £755.74 £793.53 £833.21 £874.87 £918.61 £964.54 £1,012.77 £1,063.40 £1,116.57Income from export £183.06 £192.21 £201.82 £211.91 £222.51 £231.30 £240.43 £249.93 £259.80 £270.06 £280.73 £291.82 £303.35 £315.33 £327.78 £340.73 £354.19 £368.18 £382.73 £397.84 £413.56 £429.89 £446.87 £464.53 £482.87Bought in Energy -£287.82 -£302.21 -£317.32 -£333.18 -£349.84 -£367.33 -£385.70 -£404.98 -£425.23 -£446.50 -£468.82 -£492.26 -£516.87 -£542.72 -£569.85 -£598.35 -£628.26 -£659.68 -£692.66 -£727.29 -£763.66 -£801.84 -£841.93 -£884.03 -£928.23FITs income £1,131.94 £1,169.55 £1,208.49 £1,248.78 £1,290.48 £1,320.31 £1,350.90 £1,382.27 £1,414.45 £1,447.46 £1,481.32 £1,516.06 £1,551.70 £1,588.28 £1,625.81 £1,664.33 £1,703.86 £1,744.44 £1,786.10 £1,828.86 £1,872.77 £1,917.85 £1,964.14 £2,011.69 £2,060.51NET Annual Benefit £1,190.33 £1,230.87 £1,272.87 £1,316.38 £1,361.46 £1,394.84 £1,429.16 £1,464.44 £1,500.73 £1,538.05 £1,576.44 £1,615.94 £1,656.58 £1,698.40 £1,741.44 £1,785.74 £1,831.34 £1,878.29 £1,926.64 £1,976.43 £2,027.72 £2,080.55 £2,134.98 £2,191.06 £2,248.86Replacement Inverter -£1,000Monthly Net Benefit £99.19 £102.57 £106.07 £109.70 £113.46 £116.24 £119.10 £122.04 £125.06 £128.17 £131.37 £51.33 £138.05 £141.53 £145.12 £148.81 £152.61 £156.52 £160.55 £164.70 £168.98 £173.38 £177.91 £182.59 £187.40Summary or loan repayment and avoided costAnnual Loan Repayment £0.00 £0.00 £0.00 £0.00 £0.00 £0.00 £0.00 £0.00 £0.00 £0.00 £0.00 £0.00 £0.00 £0.00 £0.00 £0.00 £0.00 £0.00 £0.00 £0.00 £0.00 £0.00 £0.00 £0.00 £0.00Total Annual cost/income £1,190.33 £1,230.87 £1,272.87 £1,316.38 £1,361.46 £1,394.84 £1,429.16 £1,464.44 £1,500.73 £1,538.05 £1,576.44 £1,615.94 £1,656.58 £1,698.40 £1,741.44 £1,785.74 £1,831.34 £1,878.29 £1,926.64 £1,976.43 £2,027.72 £2,080.55 £2,134.98 £2,191.06 £2,248.86Monthly Profit/loss £99.19 £102.57 £106.07 £109.70 £113.46 £116.24 £119.10 £122.04 £125.06 £128.17 £131.37 £134.66 £138.05 £141.53 £145.12 £148.81 £152.61 £156.52 £160.55 £164.70 £168.98 £173.38 £177.91 £182.59 £187.40
Mineral wool InsulationAnnual usable heat saving (kWh) 965 965 965 965 965 965 965 965 965 965 965 965 965 965 965 965 965 965 965 965 965 965 965 965 965Cost and IncomeAvoided cost from heat saved £56.74 £59.58 £62.56 £65.68 £68.97 £72.42 £76.04 £79.84 £83.83 £88.02 £92.42 £97.04 £101.90 £106.99 £112.34 £117.96 £123.86 £130.05 £136.55 £143.38 £150.55 £158.08 £165.98 £174.28 £182.99Monthly Net Benefit £4.73 £4.96 £5.21 £5.47 £5.75 £6.03 £6.34 £6.65 £6.99 £7.34 £7.70 £8.09 £8.49 £8.92 £9.36 £9.83 £10.32 £10.84 £11.38 £11.95 £12.55 £13.17 £13.83 £14.52 £15.25Summary or loan repayment and avoided costAnnual Maintenance cost £0.00 £0.00 £0.00 £0.00 £0.00 £0.00 £0.00 £0.00 £0.00 £0.00 £0.00 £0.00 £0.00 £0.00 £0.00 £0.00 £0.00 £0.00 £0.00 £0.00 £0.00 £0.00 £0.00 £0.00 £0.00Annual Loan Repayment £0.00 £0.00 £0.00 £0.00 £0.00 £0.00 £0.00 £0.00 £0.00 £0.00 £0.00 £0.00 £0.00 £0.00 £0.00 £0.00 £0.00 £0.00 £0.00 £0.00 £0.00 £0.00 £0.00 £0.00 £0.00Total Annual cost/income £56.74 £59.58 £62.56 £65.68 £68.97 £72.42 £76.04 £79.84 £83.83 £88.02 £92.42 £97.04 £101.90 £106.99 £112.34 £117.96 £123.86 £130.05 £136.55 £143.38 £150.55 £158.08 £165.98 £174.28 £182.99Monthly Profit/loss £4.73 £4.96 £5.21 £5.47 £5.75 £6.03 £6.34 £6.65 £6.99 £7.34 £7.70 £8.09 £8.49 £8.92 £9.36 £9.83 £10.32 £10.84 £11.38 £11.95 £12.55 £13.17 £13.83 £14.52 £15.25
Mechnical Ventilation Heat Recovery SavingAnnual usable heat saving (kWh) 3024 3024 3024 3024 3024 3024 3024 3024 3024 3024 3024 3024 3024 3024 3024 3024 3024 3024 3024 3024 3024 3024 3024 3024 3024Cost and IncomeAvoided cost from heat saved £177.86 £186.76 £196.10 £205.90 £216.20 £227.01 £238.36 £250.27 £262.79 £275.93 £289.72 £304.21 £319.42 £335.39 £352.16 £369.77 £388.26 £407.67 £428.05 £449.45 £471.93 £495.52 £520.30 £546.32 £573.63Monthly Net Benefit £14.82 £15.56 £16.34 £17.16 £18.02 £18.92 £19.86 £20.86 £21.90 £22.99 £24.14 £25.35 £26.62 £27.95 £29.35 £30.81 £32.35 £33.97 £35.67 £37.45 £39.33 £41.29 £43.36 £45.53 £47.80Summary or loan repayment and avoided costAnnual Loan Repayment £0.00 £0.00 £0.00 £0.00 £0.00 £0.00 £0.00 £0.00 £0.00 £0.00 £0.00 £0.00 £0.00 £0.00 £0.00 £0.00 £0.00 £0.00 £0.00 £0.00 £0.00 £0.00 £0.00 £0.00 £0.00Total Annual cost/income £177.86 £186.76 £196.10 £205.90 £216.20 £227.01 £238.36 £250.27 £262.79 £275.93 £289.72 £304.21 £319.42 £335.39 £352.16 £369.77 £388.26 £407.67 £428.05 £449.45 £471.93 £495.52 £520.30 £546.32 £573.63Monthly Profit/loss £14.82 £15.56 £16.34 £17.16 £18.02 £18.92 £19.86 £20.86 £21.90 £22.99 £24.14 £25.35 £26.62 £27.95 £29.35 £30.81 £32.35 £33.97 £35.67 £37.45 £39.33 £41.29 £43.36 £45.53 £47.80ASHPAnnual usable heat harvest HW(kWhrs) 6167 6167 6167 6167 6167 6167 6167 6167 6167 6167 6167 6167 6167 6167 6167 6167 6167 6167 6167 6167 6167 6167 6167 6167 6167space heating 1412 1412 1412 1412 1412 1412 1412 1412 1412 1412 1412 1412 1412 1412 1412 1412 1412 1412 1412 1412 1412 1412 1412 1412 1412Cost and IncomeAvoided cost from heat saved (-running cost) £151.32 £169.46 £188.51 £208.50 £229.50 £251.55 £274.70 £299.00 £324.52 £351.32 £379.46 £409.01 £440.03 £472.60 £506.80 £542.72 £580.42 £620.02 £661.59 £705.24 £751.07 £799.20 £849.73 £902.79 £958.50RHI for ASHP £0.00 £0.00 £0.00 £0.00 £0.00 £0.00 £0.00 £0.00 £0.00 £0.00 £0.00 £0.00 £0.00 £0.00 £0.00 £0.00 £0.00 £0.00 £0.00 £0.00 £0.00 £0.00 £0.00 £0.00 £0.00RHI for Biomass £0.00 £0.00 £0.00 £0.00 £0.00 £0.00 £0.00 £0.00 £0.00 £0.00 £0.00 £0.00 £0.00 £0.00 £0.00 £0.00 £0.00 £0.00 £0.00 £0.00 £0.00 £0.00 £0.00 £0.00 £0.00Monthly Net Benefit £12.61 £14.12 £15.71 £17.38 £19.12 £20.96 £22.89 £24.92 £27.04 £29.28 £31.62 £34.08 £36.67 £39.38 £42.23 £45.23 £48.37 £51.67 £55.13 £58.77 £62.59 £66.60 £70.81 £75.23 £79.88Summary or loan repayment and avoided costAnnual Loan Repayment £0.00 £0.00 £0.00 £0.00 £0.00 £0.00 £0.00 £0.00 £0.00 £0.00 £0.00 £0.00 £0.00 £0.00 £0.00 £0.00 £0.00 £0.00 £0.00 £0.00 £0.00 £0.00 £0.00 £0.00 £0.00Total Annual cost/income £151.32 £169.46 £188.51 £208.50 £229.50 £251.55 £274.70 £299.00 £324.52 £351.32 £379.46 £409.01 £440.03 £472.60 £506.80 £542.72 £580.42 £620.02 £661.59 £705.24 £751.07 £799.20 £849.73 £902.79 £958.50Monthly Profit/loss £12.61 £14.12 £15.71 £17.38 £19.12 £20.96 £22.89 £24.92 £27.04 £29.28 £31.62 £34.08 £36.67 £39.38 £42.23 £45.23 £48.37 £51.67 £55.13 £58.77 £62.59 £66.60 £70.81 £75.23 £79.88
Summary TotalsAdditional Monthly Mortgage Repayment -£59.89 -£59.89 -£59.89 -£59.89 -£59.89 -£59.89 -£59.89 -£59.89 -£59.89 -£59.89 -£59.89 -£59.89 -£59.89 -£59.89 -£59.89 -£59.89 -£59.89 -£59.89 -£59.89 -£59.89 -£59.89 -£59.89 -£59.89 -£59.89 -£59.89Avoided costsIncome ( cash inflows - cash outflows) £70.34 £72.28 £74.26 £76.30 £78.39 £79.41 £80.43 £81.44 £82.43 £83.41 £84.37 £85.32 £86.24 £87.13 £88.00 £88.83 £89.63 £90.40 £91.12 £91.80 £92.43 £93.00 £93.52 £93.97 £94.36Total Inflows/Avoided costs £70.34 £72.28 £74.26 £76.30 £78.39 £79.41 £80.43 £81.44 £82.43 £83.41 £84.37 £85.32 £86.24 £87.13 £88.00 £88.83 £89.63 £90.40 £91.12 £91.80 £92.43 £93.00 £93.52 £93.97 £94.36Net Monthly Benefit £10.45 £12.39 £14.37 £16.41 £18.50 £19.52 £20.54 £21.55 £22.54 £23.52 £24.48 £25.43 £26.35 £27.24 £28.11 £28.94 £29.74 £30.51 £31.23 £31.91 £32.54 £33.11 £33.63 £34.08 £34.47

Table 6.17: Net Benefit Calculation Excluding FITS
172
1 2 3 4 5 6 7 8 9 10 11 12 13 14 15 16 17 18 19 20 21 22 23 24 25
Year 2015 2016 2017 2018 2019 2020 2021 2022 2023 2024 2025 2026 2027 2028 2029 2030 2031 2032 2033 2034 2035 2036 2037 2038 2039FITS linked RPI increase 0% 3% 3% 3% 3% 3% 3% 3% 3% 3% 3% 3% 3% 3% 3% 3% 3% 3% 3% 3% 3% 3% 3% 3% 3%Price increase over inflation 0% 5% 5% 5% 5% 5% 5% 5% 5% 5% 5% 5% 5% 5% 5% 5% 5% 5% 5% 5% 5% 5% 5% 5% 5%
Utility Costs
ElectricityTarrif InformationRate 0.13£ 0.14£ 0.15£ 0.16£ 0.16£ 0.17£ 0.18£ 0.19£ 0.20£ 0.21£ 0.22£ 0.23£ 0.24£ 0.25£ 0.27£ 0.28£ 0.29£ 0.31£ 0.32£ 0.34£ 0.36£ 0.37£ 0.39£ 0.41£ 0.43£ Export price per kWh 0.049£ 0.051£ 0.053£ 0.056£ 0.059£ 0.062£ 0.065£ 0.068£ 0.072£ 0.075£ 0.079£ 0.083£ 0.087£ 0.091£ 0.096£ 0.101£ 0.106£ 0.111£ 0.117£ 0.123£ 0.129£ 0.135£ 0.142£ 0.149£ 0.156£ FITS rate -£ -£ -£ -£ -£ -£ -£ -£ -£ -£ -£ -£ -£ -£ -£ -£ -£ -£ -£ -£ -£ -£ -£ -£ -£
HeatTarrif InformationRate 0.05£ 0.05£ 0.06£ 0.06£ 0.06£ 0.06£ 0.07£ 0.07£ 0.07£ 0.08£ 0.08£ 0.09£ 0.09£ 0.09£ 0.10£ 0.10£ 0.11£ 0.11£ 0.12£ 0.13£ 0.13£ 0.14£ 0.15£ 0.15£ 0.16£ Delivered heat price at boiler efficiency 0.06 0.06 0.06 0.07 0.07 0.08 0.08 0.08 0.09 0.09 0.10 0.10 0.11 0.11 0.12 0.12 0.13 0.13 0.14 0.15 0.16 0.16 0.17 0.18 0.19
Photovoltaic systemGenerated power used in house (kWh) 3774.375 3774.375 3774.375 3774.375 3774.375 3736.63125 3699.2649 3662.27229 3625.65 3589.393 3553.499 3517.964 3482.785 3447.957 3413.477 3379.342 3345.549 3312.093 3278.972 3246.183 3213.721 3181.584 3149.768 3118.2702 3087.087498Generated power exported (kWh) 3774.375 3774.375 3774.375 3774.375 3774.375 3736.63125 3699.2649 3662.27229 3625.65 3589.393 3553.499 3517.964 3482.785 3447.957 3413.477 3379.342 3345.549 3312.093 3278.972 3246.183 3213.721 3181.584 3149.768 3118.2702 3087.087498Cost and IncomeAvoided cost from power used in house £344.14 £361.34 £379.41 £398.38 £418.30 £439.21 £461.17 £484.23 £508.45 £533.87 £560.56 £588.59 £618.02 £648.92 £681.36 £715.43 £751.20 £788.77 £828.20 £869.61 £913.09 £958.75 £1,006.69 £1,057.02 £1,109.87Income from export £183.06 £192.21 £201.82 £211.91 £222.51 £231.30 £240.43 £249.93 £259.80 £270.06 £280.73 £291.82 £303.35 £315.33 £327.78 £340.73 £354.19 £368.18 £382.73 £397.84 £413.56 £429.89 £446.87 £464.53 £482.87Bought in Energy -£283.66 -£297.84 -£312.73 -£328.37 -£344.79 -£362.03 -£380.13 -£399.14 -£419.09 -£440.05 -£462.05 -£485.15 -£509.41 -£534.88 -£561.62 -£589.71 -£619.19 -£650.15 -£682.66 -£716.79 -£752.63 -£790.26 -£829.77 -£871.26 -£914.83FITs income £183.06 £192.21 £201.82 £211.91 £222.51 £231.30 £240.43 £249.93 £259.80 £270.06 £280.73 £291.82 £303.35 £315.33 £327.78 £340.73 £354.19 £368.18 £382.73 £397.84 £413.56 £429.89 £446.87 £464.53 £482.87NET Annual Benefit £243.53 £255.71 £268.50 £281.92 £296.02 £308.48 £321.48 £335.03 £349.15 £363.88 £379.24 £395.26 £411.96 £429.37 £447.53 £466.46 £486.21 £506.80 £528.27 £550.67 £574.02 £598.38 £623.79 £650.28 £677.92Replacement Inverter -£1,000Monthly Net Benefit £20.29 £21.31 £22.37 £23.49 £24.67 £25.71 £26.79 £27.92 £29.10 £30.32 £31.60 -£50.40 £34.33 £35.78 £37.29 £38.87 £40.52 £42.23 £44.02 £45.89 £47.84 £49.87 £51.98 £54.19 £56.49Summary or loan repayment and avoided costAnnual Loan Repayment £0.00 £0.00 £0.00 £0.00 £0.00 £0.00 £0.00 £0.00 £0.00 £0.00 £0.00 £0.00 £0.00 £0.00 £0.00 £0.00 £0.00 £0.00 £0.00 £0.00 £0.00 £0.00 £0.00 £0.00 £0.00Total Annual cost/income £243.53 £255.71 £268.50 £281.92 £296.02 £308.48 £321.48 £335.03 £349.15 £363.88 £379.24 £395.26 £411.96 £429.37 £447.53 £466.46 £486.21 £506.80 £528.27 £550.67 £574.02 £598.38 £623.79 £650.28 £677.92Monthly Profit/loss £20.29 £21.31 £22.37 £23.49 £24.67 £25.71 £26.79 £27.92 £29.10 £30.32 £31.60 £32.94 £34.33 £35.78 £37.29 £38.87 £40.52 £42.23 £44.02 £45.89 £47.84 £49.87 £51.98 £54.19 £56.49
Mineral wool InsulationAnnual usable heat saving (kWh) 965 965 965 965 965 965 965 965 965 965 965 965 965 965 965 965 965 965 965 965 965 965 965 965 965Cost and IncomeAvoided cost from heat saved £56.74 £59.58 £62.56 £65.68 £68.97 £72.42 £76.04 £79.84 £83.83 £88.02 £92.42 £97.04 £101.90 £106.99 £112.34 £117.96 £123.86 £130.05 £136.55 £143.38 £150.55 £158.08 £165.98 £174.28 £182.99Monthly Net Benefit £4.73 £4.96 £5.21 £5.47 £5.75 £6.03 £6.34 £6.65 £6.99 £7.34 £7.70 £8.09 £8.49 £8.92 £9.36 £9.83 £10.32 £10.84 £11.38 £11.95 £12.55 £13.17 £13.83 £14.52 £15.25Summary or loan repayment and avoided costAnnual Maintenance cost £0.00 £0.00 £0.00 £0.00 £0.00 £0.00 £0.00 £0.00 £0.00 £0.00 £0.00 £0.00 £0.00 £0.00 £0.00 £0.00 £0.00 £0.00 £0.00 £0.00 £0.00 £0.00 £0.00 £0.00 £0.00Annual Loan Repayment £0.00 £0.00 £0.00 £0.00 £0.00 £0.00 £0.00 £0.00 £0.00 £0.00 £0.00 £0.00 £0.00 £0.00 £0.00 £0.00 £0.00 £0.00 £0.00 £0.00 £0.00 £0.00 £0.00 £0.00 £0.00Total Annual cost/income £56.74 £59.58 £62.56 £65.68 £68.97 £72.42 £76.04 £79.84 £83.83 £88.02 £92.42 £97.04 £101.90 £106.99 £112.34 £117.96 £123.86 £130.05 £136.55 £143.38 £150.55 £158.08 £165.98 £174.28 £182.99Monthly Profit/loss £4.73 £4.96 £5.21 £5.47 £5.75 £6.03 £6.34 £6.65 £6.99 £7.34 £7.70 £8.09 £8.49 £8.92 £9.36 £9.83 £10.32 £10.84 £11.38 £11.95 £12.55 £13.17 £13.83 £14.52 £15.25
Mechnical Ventilation Heat Recovery SavingAnnual usable heat saving (kWh) 3024 3024 3024 3024 3024 3024 3024 3024 3024 3024 3024 3024 3024 3024 3024 3024 3024 3024 3024 3024 3024 3024 3024 3024 3024Cost and IncomeAvoided cost from heat saved £177.86 £186.76 £196.10 £205.90 £216.20 £227.01 £238.36 £250.27 £262.79 £275.93 £289.72 £304.21 £319.42 £335.39 £352.16 £369.77 £388.26 £407.67 £428.05 £449.45 £471.93 £495.52 £520.30 £546.32 £573.63Monthly Net Benefit £14.82 £15.56 £16.34 £17.16 £18.02 £18.92 £19.86 £20.86 £21.90 £22.99 £24.14 £25.35 £26.62 £27.95 £29.35 £30.81 £32.35 £33.97 £35.67 £37.45 £39.33 £41.29 £43.36 £45.53 £47.80Summary or loan repayment and avoided costAnnual Loan Repayment £0.00 £0.00 £0.00 £0.00 £0.00 £0.00 £0.00 £0.00 £0.00 £0.00 £0.00 £0.00 £0.00 £0.00 £0.00 £0.00 £0.00 £0.00 £0.00 £0.00 £0.00 £0.00 £0.00 £0.00 £0.00Total Annual cost/income £177.86 £186.76 £196.10 £205.90 £216.20 £227.01 £238.36 £250.27 £262.79 £275.93 £289.72 £304.21 £319.42 £335.39 £352.16 £369.77 £388.26 £407.67 £428.05 £449.45 £471.93 £495.52 £520.30 £546.32 £573.63Monthly Profit/loss £14.82 £15.56 £16.34 £17.16 £18.02 £18.92 £19.86 £20.86 £21.90 £22.99 £24.14 £25.35 £26.62 £27.95 £29.35 £30.81 £32.35 £33.97 £35.67 £37.45 £39.33 £41.29 £43.36 £45.53 £47.80
ASHPAnnual usable heat harvest HW(kWhrs) 6058 6058 6058 6058 6058 6058 6058 6058 6058 6058 6058 6058 6058 6058 6058 6058 6058 6058 6058 6058 6058 6058 6058 6058 6058space heating 1304 1304 1304 1304 1304 1304 1304 1304 1304 1304 1304 1304 1304 1304 1304 1304 1304 1304 1304 1304 1304 1304 1304 1304 1304Cost and IncomeAvoided cost from heat saved (-running cost) £148.66 £166.48 £185.19 £204.83 £225.46 £247.12 £269.86 £293.74 £318.81 £345.14 £372.78 £401.80 £432.28 £464.28 £497.88 £533.16 £570.20 £609.10 £649.94 £692.82 £737.85 £785.13 £834.77 £886.90 £941.63RHI for ASHP £0.00 £0.00 £0.00 £0.00 £0.00 £0.00 £0.00 £0.00 £0.00 £0.00 £0.00 £0.00 £0.00 £0.00 £0.00 £0.00 £0.00 £0.00 £0.00 £0.00 £0.00 £0.00 £0.00 £0.00 £0.00RHI for Biomass £0.00 £0.00 £0.00 £0.00 £0.00 £0.00 £0.00 £0.00 £0.00 £0.00 £0.00 £0.00 £0.00 £0.00 £0.00 £0.00 £0.00 £0.00 £0.00 £0.00 £0.00 £0.00 £0.00 £0.00 £0.00Monthly Net Benefit £12.39 £13.87 £15.43 £17.07 £18.79 £20.59 £22.49 £24.48 £26.57 £28.76 £31.07 £33.48 £36.02 £38.69 £41.49 £44.43 £47.52 £50.76 £54.16 £57.74 £61.49 £65.43 £69.56 £73.91 £78.47Summary or loan repayment and avoided costAnnual Loan Repayment £0.00 £0.00 £0.00 £0.00 £0.00 £0.00 £0.00 £0.00 £0.00 £0.00 £0.00 £0.00 £0.00 £0.00 £0.00 £0.00 £0.00 £0.00 £0.00 £0.00 £0.00 £0.00 £0.00 £0.00 £0.00Total Annual cost/income £148.66 £166.48 £185.19 £204.83 £225.46 £247.12 £269.86 £293.74 £318.81 £345.14 £372.78 £401.80 £432.28 £464.28 £497.88 £533.16 £570.20 £609.10 £649.94 £692.82 £737.85 £785.13 £834.77 £886.90 £941.63Monthly Profit/loss £12.39 £13.87 £15.43 £17.07 £18.79 £20.59 £22.49 £24.48 £26.57 £28.76 £31.07 £33.48 £36.02 £38.69 £41.49 £44.43 £47.52 £50.76 £54.16 £57.74 £61.49 £65.43 £69.56 £73.91 £78.47
Summary TotalsAdditional Monthly Mortgage Repayment -£59.89 -£59.89 -£59.89 -£59.89 -£59.89 -£59.89 -£59.89 -£59.89 -£59.89 -£59.89 -£59.89 -£59.89 -£59.89 -£59.89 -£59.89 -£59.89 -£59.89 -£59.89 -£59.89 -£59.89 -£59.89 -£59.89 -£59.89 -£59.89 -£59.89Avoided costs £60.62 £64.51 £68.60 £72.90 £77.41 £82.15 £87.12 £92.34 £97.82 £103.58 £109.62 £115.97 £122.63 £129.63 £136.98 £144.69 £152.79 £161.30 £170.23 £179.61 £189.45 £199.79 £210.64 £222.04 £234.01Income ( cash inflows - cash outflows) -£8.38 -£8.80 -£9.24 -£9.70 -£10.19 -£10.89 -£11.64 -£12.43 -£13.27 -£14.17 -£15.11 -£16.11 -£17.17 -£18.30 -£19.49 -£20.75 -£22.08 -£23.50 -£24.99 -£26.58 -£28.26 -£30.03 -£31.91 -£33.89 -£36.00Total Inflows/Avoided costs £52.23 £55.71 £59.36 £63.19 £67.22 £71.25 £75.48 £79.91 £84.55 £89.41 £94.51 £99.86 £105.46 £111.34 £117.49 £123.95 £130.71 £137.80 £145.23 £153.03 £161.20 £169.76 £178.74 £188.15 £198.01Net Monthly Benefit -£7.66 -£4.18 -£0.53 £3.30 £7.33 £11.36 £15.59 £20.02 £24.66 £29.52 £34.62 £39.97 £45.57 £51.45 £57.60 £64.06 £70.82 £77.91 £85.34 £93.14 £101.31 £109.87 £118.85 £128.26 £138.12
Net Benefit Matrix

£0.00
£50.00
£100.00
£150.00
£200.00
£250.00
1 2 3 4 5 6 7 8 9 10 11 12 13 14 15 16 17 18 19 20
£
Year
Additional Monthly Mortgage Repayment
Avoided costs
Income ( cash inflows - cash outflows)
Figure 6.9. Monthly cash flows and avoided costs.
£0.00
£20.00
£40.00
£60.00
£80.00
£100.00
£120.00
£140.00
£160.00
£180.00
1 2 3 4 5 6 7 8 9 10 11 12 13 14 15 16 17 18 19 20
Contribution to Net Benefit in Income/ Cost Savings
Net benfefit From PV System ( Income)
Net benefit from Additional Insulation ( Saving)
Net benefit from MVHR (Saving)
Net Benefit From Heating system (Saving)
Figure 6.10 Contribution to net monthly benefit from income/cost savings.
Figure 6.9 shows the monthly cash flows and avoided costs. The chart
demonstrates that the additional monthly mortgage payment is always lower than
the income generated from the FITS without having to take into account the
avoided costs. This underpins the short term viability of the model. The chart also
demonstrates that inflation and fuel price escalation significantly increase the
effect of the avoided costs over time. This underlines the importance of abating
energy costs in the long term and underpins the long term viability of the model.
As such the technologies that reduce energy consumption are as important as the
income generated through the FITS backed PV system.
173

A secondary outcome demonstrated by Figure 6.9 is that the running costs are
effectively substituted by the increased mortgage cost. This provides an additional
benefit to the owner-occupier as these costs pay down the debt on the building
instead of in a Part L compliant building where outgoings are used to pay an
energy provider. This creates a residual investment benefit for the mortgage
holder. It is important to note that this benefit is only possible when using the
FITS, however, recent policy changes have indicated that longevity of FITS at the
currently proposed levels are not guaranteed to remain.
When the net benefit contributions are further analysed the role each technology
has in creating the net benefit can be better understood. Figure 6.10 shows the
contribution each technology has in the net benefit calculation in terms of income
or avoided cost. In year twelve it is assumed the inverter for the PV system is
replaced and this accounts for the dip in monthly income in that year.
Figures 6.9 and 6.10 show the FITS backed PV income to be the most significant
contribution to the net benefit equation. This could lead to criticisms of the model
as it appears to heavily rely on subsidy support, bringing the long term viability into
question. As subsidies are not considered a long term solution it is important for
the model demonstrate that it can create a net benefit without the FITS.
-£50.00
£0.00
£50.00
£100.00
£150.00
£200.00
£250.00
£300.00
1 2 3 4 5 6 7 8 9 10 11 12 13 14 15 16 17 18 19 20
1.) Total Net Benefit ( Including FITS and Avoide Costs)
2.) Total Monthly Income (Excluding Avoided Costs)
3.) Total Monthly Net Benefit ( Excluding FITS)
Figure 6.11: Short, mid and long term viability under different income
scenarios.
174

Figure 6.11 shows a comparison of the net benefit model under three scenarios.
Scenarios represented by lines one and two demonstrate the short-term viability
by including the FITS payments. Line one includes the avoided costs and line two
excludes them. Critically a net benefit exists without the avoided costs, eliminating
any financial impact on the consumer. Line three demonstrates the long term
viability by removing the FITS generation tariff income from the calculation.
These findings demonstrate positive net benefits can be achieved in both the short
and long term. Firstly, the positive net benefits achieved with the FITS mechanism
gives short term viability. This is demonstrated by the positive year one to year
twenty cash flows. Line two demonstrates that this is possible using cash inflows
alone by excluding the avoided cost component. This means that the optimised
zero carbon home is more economical to live in than a Part L building regulations
home from year one, even with an increased mortgage payment. This effectively
eliminates energy bills over the course of the year by using the FITS to offset the
residual energy bills with enough surplus to offset the annual additional mortgage
costs. Line three shows that when the FITS generation tariff is omitted the model
still returns a positive net benefit from year three onwards. Whilst there is a slight
deficit in year one to three of the investment the seventeen years in positive cash
flow far out weigh this. This emphasises the combined effects of fine tuning the
energy system for life cycle cost reduction and reduced implementation costs. The
outcome is a design that improves on the life cycle costs of a Part L design
without requiring support tariffs. This adds resiliency to the methodology by
moving zero carbon design towards commercial viability without the need for
economic support. It is important to note that whilst the FITS is not required to
create a home that is more economical to live in compared to a Part L complaint
home it is does not offset the additional mortgage cost with an income. This is
because the FITS income offsets the mortgage payment in scenarios one and two
(lines one and two) but avoided costs provide the majority of net benefit in
scenario three (line three). As such the FITS based model is more attractive to the
consumer through its income provision. The more attractive cost benefits derived
from the FITS model should be used to stimulate uptake in the early adoption
175

stages and phased out with volume. The FITS is thus proposed as a way to
stimulate the diffusion of innovation into national builder portfolios by enabling the
developer to pass the additional costs of zero carbon construction on to the
consumer without negatively impacting either party. This has important
implications for policy makers in the UK who need to consider the impact that
reducing the FITS again, by as much as 87%, could have on the uptake of zero
carbon homes.
6.15 Financial Analysis
To calculate income and cost balances, the energy balances were linked to tariff
incomes derived from either FITS and/ or predicted RHI returns where appropriate
(accounting for inflation and predicted fuel price escalation). The reduced tariff
rate for a domestic install in mid-2014 was used for the FITs rate. A compound
annual growth rate (CAGR) of 3% was used for inflation. Fuel price escalation
calculations are detailed in table 6.17. The model was projected forwards over 20
years to bound investment potential to the tariff period for the Solar FITS. This
was due to the FITS period being the longest tariff period.
The economic model developed assumed that the extra capital costs for zero
carbon design would be passed to the consumer via a higher purchase price in
order to protect the developer’s profit. As the initial capital outlay is significant for
the combined microgeneration platform, extended mortgage payments were
assumed to be the finance method. As such the over and above mortgage costs
were incorporated into the net benefits calculations. A mortgage rate of 5% was
used over a typical 25 year mortgage period.
The technical model was used to calculate and compare the energy losses of the
zero carbon design with those of a building regulations home. Potential energy
savings for the zero carbon design were calculated and then translated into a
monetary benefit which could be attributed to elements such as the extra
insulation, heat recovery technology and improved air tightness levels. Energy
savings were calculated on 2012 energy costs for gas and electricity in the UK
and termed avoided costs.
176

The reduced energy demand for both regulated and unregulated energy loads
were capitalised and an allowance made for the bought in energy requirement
during times of insufficient PV production as well as a cost saving for the PV
produced electricity. The energy generated was then capitalised using the
appropriate FITS rate. The totals were then summed and the over and above
mortgage costs for the additional insulation and energy system components was
then deducted.
The annual net benefit was thus arrived at by capitalising energy flows, comparing
energy costs, expenditures and tariff incomes of a building regulations home to
the Zero Carbon design. A further calculation was also made in order to see if
removing avoided costs from the equation could create a model that was
effectively net of energy costs and self-funding.
6.15.1 Traditional investment appraisal tools
In addition to the net benefits and zero energy bills approach to financial returns,
traditional investment appraisal tools were also used. These tools enabled
comparisons to be made using standard investment decision tools. This helps
explain the results in standard investment terms and not just the study specific net
benefit equations. The basic investment decision tools used by corporate
professionals of cumulative returns, payback, NPV and IRR were used with the
addition of the annual net benefit metric.
Traditional financial analysis tools were used in two different headline scenarios.
The first scenario assumed that debt finance of the over and above costs would
be through a mortgage and not paid in full upfront. The second scenario assumed
an equity only model based on increased capital funding to cover the over and
above costs i.e. the additional costs were paid in full upfront.
Inflation and predicted fuel price escalation are included in both scenarios.
Differing rates of inflation and fuel price escalation were predicted to have
pronounced effects on investment appraisal outcomes. However, fuel price
escalation is predictive and subject to significant uncertainty so in order to
incorporate this into the model, different high-low fuel price escalation growth
177

scenarios were created from the literature review findings. These were based on
different sources, detailed below:
Table 6.18: CAGR
Compound Annual Growth RatesPast 5 year Trend OFGEM High OFGEM Low
8% 5% 3%
The graphs in figure 6.12 – 6.14 show the cumulative cash flows, payback year,
and net benefit line for each of the scenarios when the over and above costs are
equity funded.
178

179
-£20,000
-£10,000
£0
£10,000
£20,000
£30,000
£40,000
£50,000
1 2 3 4 5 6 7 8 9 10 11 12 13 14 15 16 17 18 19 20 21 22 23 24 25
Cumulative Return *
Annual Net Benefit
-£15,000
-£10,000
-£5,000
£0
£5,000
£10,000
£15,000
£20,000
£25,000
£30,000
£35,000
£40,000
1 2 3 4 5 6 7 8 9 10 11 12 13 14 15 16 17 18 19 20 21 22 23 24 25
Cumulative Return *
Annual Net Benefit
-£15,000
-£10,000
-£5,000
£0
£5,000
£10,000
£15,000
£20,000
£25,000
£30,000
£35,000
1 2 3 4 5 6 7 8 9 10 11 12 13 14 15 16 17 18 19 20 21 22 23 24 25
Cumulative Return *
Annual Net Benefit
Figure 6.12: Capital Funded 8% Price Escalator Figure 6.13: Capital Funded 5% Price Escalator
Figure 6.14 Capital Funded 3% Price Escalator

The graphs in figures 6.15 – 6.17 show the cumulative cash flows, payback year,
and net benefit line for each of the scenarios when the over and above costs are
mortgage funded based on a 70:30 loan to value ratio.
180

181
-£5,000
£0
£5,000
£10,000
£15,000
£20,000
£25,000
£30,000
1 2 3 4 5 6 7 8 9 10 11 12 13 14 15 16 17 18 19 20 21 22 23 24 25
Cumulative Return *
Annual Net Benefit
-£5,000
£0
£5,000
£10,000
£15,000
£20,000
£25,000
£30,000
£35,000
£40,000
1 2 3 4 5 6 7 8 9 10 11 12 13 14 15 16 17 18 19 20 21 22 23 24 25
Cumulative Return *
Annual Net Benefit
Figure 6.15 Mortgage Funded 8% Price Escalator Figure 6.16 Mortgage Funded 5% Price Escalator
-£5,000
£0
£5,000
£10,000
£15,000
£20,000
£25,000
£30,000
1 2 3 4 5 6 7 8 9 10 11 12 13 14 15 16 17 18 19 20 21 22 23 24 25
Cumulative Return *
Annual Net Benefit
Figure 6.17 Mortgage Funded 3% Price Escalator

6.15.2 Key Findings
What has been identified from this research is that there is a positive net benefit
from the energy system and thermal envelope design when supported by the tariff
mechanisms. Most encouragingly the net benefit in all instances is positive from
year 1 and all the investments payback. As such, if an owner occupier chooses an
optimised zero carbon home to live in based on the methodology developed in this
thesis, they will be financially better off than living in a building regulations
property from year 1.
The short paybacks were achievable for all capital funding scenarios within 6-7
years, depending on inflation and growth rates used for fuel price escalation,
which gives an encouragingly low timeframe that the property owner will have to
consider remaining in a property before selling at market value becomes
profitable. As average holding time in the UK is 7 years the impact of this could
potentially be minimal (Rigby and Pickard, 2011; Dixon, 2009). If a premium is
attached to the optimised zero carbon design this impact will be further reduced.
Another key finding is that the optimised design demonstrate financial viability
without the FITs policy. The fine tuning of the energy system and material
substitution strategy means that when the avoided costs are included in the net
benefits calculation the life cycle costs of the building still improve on a building
regulations design. This demonstrates the resiliency of the design philosophy.
However, in the short to midterm, the FITS scheme is of critical importance to the
financial underpinning of the results. This is because the ability for the developer
to pass the additional costs on to the consumer without negatively impacting them
is wholly dependent on the FITs. Without this policy the economic viability
becomes more difficult to justify. Figures 6.18 and 6.19 below show the financial
returns from the energy platform without FITs tariff for the 8% fuel price scenario
(the best scenario for economic justification). Whilst the FITs generation payments
have been excluded the export tariff is still kept as the energy surplus can still be
exported to the grid under a power purchase agreement.
182

183
-£15,000
-£10,000
-£5,000
£0
£5,000
£10,000
£15,000
£20,000
£25,000
1 2 3 4 5 6 7 8 9 10 11 12 13 14 15 16 17 18 19 20 21 22 23 24 25
Cumulative Return *
Annual Net Benefit
-£6,000
-£4,000
-£2,000
£0
£2,000
£4,000
£6,000
£8,000
£10,000
£12,000
£14,000
1 2 3 4 5 6 7 8 9 10 11 12 13 14 15 16 17 18 19 20 21 22 23 24 25
Cumulative Return *
Annual Net Benefit
Figure 6.18 Capital Funded without Policy Support Figure 6.19 Mortgage Funded without Policy Support

Without the support policy the payback for the capital funded model was pushed
back until the 12th year, 5 years over the average home occupancy rate. Under the
mortgage funded scenario the net benefit was negative for the first 3 years. This
demonstrates the importance that economic policy has on zero carbon housing
viability. It is important to note that the model demonstrates viability over the long
term even without the FITs. This is because the avoided cost + payment for
exported energy still enabled the optimised design to payback its capital
expenditure all be it over a longer timeframe. This demonstrated that even without
the FIT’s the home owner would be better off living in the optimised design based
on avoided costs and exported energy income alone.
From an investment perspective in a rational economic context, greater demand
should exist for the optimised zero carbon home than building regulation
properties given the positive net benefits. However, this is frequently not the case
and further research into the social and contextual factors affecting the decision
making process is needed to examine the likely effect this could have on the
success of the design.
6.15.3 Investment Appraisal - NPV, IRR
For Capital funded investments the discount cash flow was set at a WACC of 9%
using the CAPM model with utilities Beta values. Encouragingly, under all
scenarios for the capital funded energy platform, the net benefit model provided a
positive NPV and IRR in excess of the WACC. This emphasises that economically
viable zero carbon housing is a viable prospect and generates attractive
investment returns when capital funded. Table 6.19 shows the NPV and IRR for
the different fuel price escalation scenarios.
Table 6.19 NPV and IRR for Capital Funded Model
Fuel Price Escalator NPV IRR%8% 29,018£ 125% 21,267£ 113% 17,268£ 10
184

6.15.4 Mortgage funded Investment Appraisal - NPV, IRR
The mortgage funded model is proposed to negate the need to have readily
available capital. As capital is not available the discounted cash flow has been set
at the WACC derived from the CAPM model. The ‘Loan to value ratio’ for the
calculations was considered to be 70:30. Under these parameters, even with the
low estimates of fuel price growth of 3% the model returns positive NPV’s,
demonstrated in table 6.18.
Most encouragingly the levered IRR generates significant returns based on the
cash flows and avoided costs. This is due to the low initial down payment and high
avoided costs. As such the levered return against the additional borrowed capital
is very high. As fuel price escalation scenarios rise this return increases with it.
This is highlighted in table 6.19
Table 6.20 NPV and IRR Mortgage Funded Model
Fuel Price Escalator NPV IRR%8% 13,289£ 40%5% 11,229£ 38%3% 10,022£ 36%
It is important to note that these high IRR’s are the result of the avoided cost
element of the net benefit calculation and as such are specific to owner-
occupation of the property. These returns would not be realised by an external
investor as the IRR for such an entity would be based solely on the income and
not the avoided cost element which benefits the occupier only.
6.16 Discussion
This project has addressed research gaps in both the technical and economic
aspects of zero carbon design in an attempt to develop an in-depth understanding
of why the implementation of zero carbon homes is currently inhibited and whether
barriers could be overcome in the design process. To do this socio-technical
research was used to develop a design methodology to augment best practice in
185

zero carbon building design. The design methodology can be summarised in the
following four objectives;
1.) Maximise decarbonisation above regulatory standards
2.) Reduction and Simplification of Technologies
3.) Cost reduction
4.) Economic justification of additional costs
The four objectives identified in the design methodology were used to augment
Lechner (2008) and Dunster et al. (2008) approaches to zero carbon homes. The
success of meeting these objectives are analysed in the following sections.
6.16.1 Decarbonisation must be maximised to include all carbon emissions
During the course of this research program industry lobbying and changes to the
regulatory definition of what a zero carbon home should be was observed. To
prevent a missed opportunity in maximising the decarbonisation of the sector, it
was important to ascertain that meeting both the regulated and the unregulated
building energy loads was technically possible. Demonstrating that these loads
could be met economical was therefore a core objective for an optimised zero
carbon home. This formed the rationale for this design objective.
The technical design objective was achieved by the optimised home. Four
different techniques to achieve this objective were created out of fourteen potential
solutions. As such it is possible to determine that there are a number of ways to
create technically viable homes that offset all their in use and regulated carbon
emissions. If this design objective was incorporated into the building regulations
then an additional one tonne of carbon per zero carbon home could be saved over
the current building regulations zero carbon definition.
186

If buildings are correctly oriented on a site plan and solar design is a design
priority, offsetting carbon emission within the site boundary should be possible
across many sites. The case study demonstrated that it was possible to use
different variations of the house type developed in this study across a site
designed to 50 homes per hectare. This would change with higher site density but
this research proves that a correctly designed and oriented building is capable of
meeting all its annual energy load via onsite and grid connected micro generation
technologies.
This finding has important implication for policy makers. If policy sub-regime actors
buy-in to this feasibility the scope exists to shift the building regulations back to the
original definition of zero carbon design. If commercial actor buy-in can be
obtained then commercialised and zero carbon housing developments on many
sites across the UK could be realistic under the strictest definition. The literature
review suggested that housing market actors react best to clear and decisive
policy goals so tightening the building regulations could be significant in leading
the industry towards a more sustainable trajectory.
6.16.2 Reduction and simplification of technologies
This objective in the methodology was aimed at solving the energy problem using
current technology without the need for consumer behaviour change or significant
lifestyle changes. This objective needed to work closely with the preceding one.
The aim of this design objective was to keep the decarbonisation of the housing
stock in line with the “ecological modernisation” school of thought (Hajer, 1995;
Pickvance, 2009). As such it emphasised the need to create ‘compatibility through
design’ so that decarbonisation occurred without major changes in lifestyles, thus
removing many of the identified barriers to existing designs (Hajer, 1995;
Pickvance, 2009).
This objective was supported by the literature, firstly in Castell’s (2010) research
into low carbon technologies and consumer acceptance and secondly through
industry perceptions that zero carbon homes are less desirable because they
187

require behaviour change (Zero Carbon Hub, 2009; Delta-ee, 2012; Osmani and
O’Reilly, 2009; Castell, 2010)
In Castell’s (2010) research, resistance into low carbon technologies and policies
that require significant user practice change was considered high. This was based
on empirical research results on the public’s complacency about their actions and
climate change, their demotivated stance based on the perception that UK actions
have minimal impact compared to other larger nations, their perception of a low
effect on the UK of climate change and their current understanding of the issues
requiring low carbon practices which relate to marketability and consumer
demand.
In the commercial based literature previous zero carbon designs were considered
to rely on technologies that require home owners to change their behaviour (Delta-
ee, 2012; Osmani and O’Reilly, 2009). For example the use of biomass heating
systems were commonly proposed which required owner-occupiers to change
how they purchase and use energy for space heating and hot water. The market
for homes that impose consumer change is therefore considered limited based on
consumer willingness to accept lifestyle change (Delta-ee, 2012)..
This research took a somewhat subjective approach to reducing impact on
consumer lifestyle choices and focused on incorporating technologies that could
either be directly compared to control systems for standard heating technologies
or had such a high level of automation that they were essentially ‘fit and forget’
technology.
The technologies chosen focused on using tried and tested renewable generators
and distinctly novel technologies were excluded on the grounds of unproven
reliability. The final optimised design used PV, MVHR and an Air Source Heat
Pump only. Solar thermal collectors were removed to simplify the system as this
removed an additional set of controls. This also removed a layer of maintenance.
The removal of the solar thermal collectors required more electrical energy to
provide hot water but also allowed for the PV array to be increased in size. This
was critical as the load on the heat pump was increased. Some commentators do
not consider heat pumps to be a renewable technology per se as they rely on the
188

efficient use of electrical energy to provide heat and hot water rather than
generating energy from low carbon sources. As such it is important that the
energy requirement of the heat pump be entirely offset by renewable electricity in
order to create a zero carbon technology. The increased PV array allowed the
additional electrical energy consumption of the heat pump to be offset. The heat
pump was the preferred technology given the control system and usage
similarities to conventional boiler systems. Due to these adaptations this objective
was considered to be satisfied by the optimised heating system design.
PV was chosen as the primary source of renewable electrical energy. This was
due to the ‘fit and forget’ nature of the technology, tried and tested reliability, and
relatively easy installation and maintenance of PV systems. PV systems do not
require user input to run and only require periodic cleaning.
The only additional control system requiring monitoring by the occupant was the
MVHR system which, once set by the installer, should not require changing. As
such it was considered that the MVHR did not impinge on usability. However,
there is an annual cleaning requirement for the filters, similar to cleaning vacuum
cleaner filters. Whilst MVHR is not strictly a fit and forget technology it is required
for air quality and energy demand reduction and thus could not be avoided and
this additional maintenance issue was considered a minor impact. No other
technologies were required to offset the annual energy load and this is a one of
the main characteristics of the simplification techniques employed.
The energy platform selected could be considered to significantly reduce and
simplify the energy platforms for zero carbon homes compared to previous
iterations which frequently included biomass systems, solar thermal, PV and/ or
micro wind turbines and MVHR to create a zero carbon home. The main benefit
was through the electrification of all systems and the maximisation of the PV array.
The benefits that this brought regarding automation and control systems similar to
those found in existing properties was paramount to simplifying the technologies
and system. Standard room thermostats and TRV’s could be used to control the
system and there was no requirement to buy or store solid fuel or syngas on site.
Energy produced by the system would be available on demand without any need
189

for the occupier to give any more forethought to energy provision then they would
via a standard gas central heating system. Considering these factors, the energy
system objective of simplification can be considered to be met.
6.16.3 Cost Reduction
Cost was consistently cited as a primary barrier to implementation by key authors
such as Goodier and Pan (2010), Ball (2010), Callcut (2007) and Osmani and
O’Reilly (2009). As such the aim of this objective was to create the lowest cost
zero carbon home possible. There were two benchmarks for this. The first was the
comparative cost against other zero carbon designs. The second was the
comparative costs against a building regulations benchmark.
The optimised design was significantly cheaper than comparative niche zero
carbon homes. This is detailed in Table 6.21. This is encouraging as it reduces
one of the most significant national builder based barriers by bringing the cost of
construction closer to traditional builds.
Table 6.21: Comparative Costs
Project Build Costs/ m²Optimised Design 1,184.00£ Building Regulations 1,070.00£ Miller Light House 1,423.00£ Miller Zero Aircrete House 1,608.00£ Bere Architects Code 6 1,700.00£ Kingspan Light House 1,938.00£ Source: Cyril Sweett 2007, Code for Sustainable Homes 2010, Bere Architects 2010, Miller Zero Homes, 2010, Kingspan 2009
Unfortunately the optimised design was not cost neutral when compared to
traditional builds. The price premium was 6% over a traditional build. Whilst this is
a significant cost improvement over other designs, when this uplift is carried
across a number of dwellings on a site or across a national builder portfolios the
impact on returns is significant.
From the results it is possible to conclude that cost neutrality is still some way from
a reality, however, adopting the design philosophy can create a more
economically efficient zero carbon home than previously demonstrated.
Integration and substitution of technologies needs to be examined further to see if
190

other cost reducing areas exist. As such it is recommended that future research
adapts the design philosophy to create more design iterations that have the
potential to simply technologies further.
It is also important to review the cost reduction objective in conjunction with cost
justification. This is because whilst cost neutrality is still not achievable, cost
justification was and this can have a significant impact in mitigating the residual
costs. This is analysed in the following section.
6.16.4 Economic justification of additional costs
In combination to minimising the over and above costs, the modelling
demonstrated that tariff incomes could offset the additional costs involved with the
design. This was achievable under both the capital funded and mortgage financed
scenarios. This is an important outcome from the optimised design.
The technical model was used to calculate and compare the energy losses of the
optimised design with those of a building regulations home. Potential energy
savings were calculated and then translated into a monetary benefit which could
be attributed to elements such as the extra insulation and heat recovery
technology. These are costs that the material substitution and simplification
method could not reduce to comparable levels of a building regulations home.
When the avoided costs were included an annual net benefit of £857.64 was
achieved using the optimised design. This is a significant benefit when considered
against a £960.00 per annum energy bill if the renewables were removed. This
helps to provide economic justification through life cycle costing of the over and
above costs.
When the model was run with the avoided costs excluded an annual cash income
was achieved. Whilst this was only £125.40 per annum it still enabled an offsetting
of all the additional costs. This is perhaps more important than the net benefit
figure as when the property, including a premium for zero carbon technologies, is
mortgage funded the over and above costs are self-funding. As such the
optimised design has a zero payback period. This was a major benefit as it
191

confirmed the possibility for the developer to build these homes without negatively
impacting their bottom line profit. At the same time the higher purchase price still
financially benefited the owner-occupier based on incomes offsetting costs. As the
UK housing market is dominated by houses constructed by national house
builders this is a significant improvement on zero carbon design.
Another major attribute of the design methodology was that the running costs of a
traditional build are substituted by the increased mortgage cost. This provides an
additional benefit to the owner-occupier as the costs are used to pay down the
debt on the building rather than to the energy provider creating a residual
investment benefit to the mortgage holder. This should also provide an additional
financial benefit to the mortgage provider as money that would be paid to an
energy provider could be paid to the lender instead in the form of the increased
monthly mortgage payment.
As well as the net benefits and self-funding benefits created, traditional investment
appraisal tools were also positive. Traditional financial analysis tools were used in
two different headline scenarios. The first scenarios assumed that debt finance
through a mortgage would be the likely funding method. The second scenario
assumed an equity only model based on increased capital funding. Inflation and
predicted fuel price escalation are included in both scenarios under different
sensitivity tests.
If an owner occupier chose an optimised zero carbon home to live in, based on
the methodology developed in this thesis, they will be financially better off than
living in a building regulations property. Importantly this net benefit is achievable
from the first year. The net benefit in all instances was positive from year 1 and all
the investments payback. This shows that the results were robust within the
sensitivity range.
Short paybacks for all capital funding scenarios fell within the nine to ten years
depending on growth rates used for fuel price escalation. This gives an
encouragingly low investment timeframe. This low timeframe relates closely to the
average property holding time in the UK: Seven years (Rigby and Pickard, 2011;
Dixon, 2009). As such the impact that capital funding the zero carbon upgrade
192
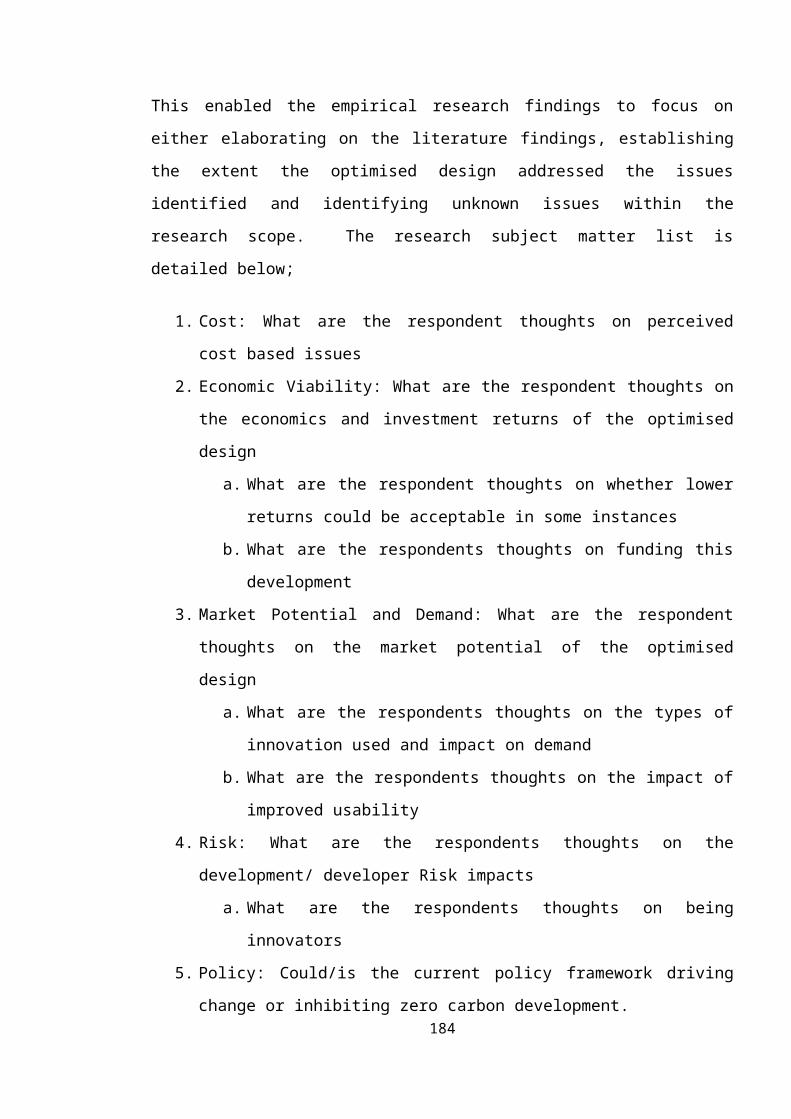
package should have on owner occupiers is minimal. If a premium is attached to
the optimised zero carbon design this impact will be further reduced as the selling
price will reflect the remaining years on the tariffs.
6.16.5 Conclusion
Whilst it is possible to create technically viable zero carbon homes using a variety
of different techniques, creating commercially and economically viable zero
carbon homes is more problematic. Addressing commercial barriers during the
design process is required in order to optimise the design and improve the
potential for developer buy-in.
The outcomes of the economic modelling are positive when compared to the
design objectives. They confirm that adopting a design philosophy that substitutes
traditional building materials with energy generating ones and utilising FITs eligible
technologies, marked improvements in both implementation and life cycle costing
can be achieved. It is possible to conclude that more economically efficient zero
carbon homes are possible. Unfortunately it can also be concluded that it is not
possible to create a zero carbon home for the same cost as a building regulations
home. This is demonstrated in the reduced but still higher implementation costs.
One of the most positive conclusions that can be drawn is tariff incomes can be
used to offset the additional costs. An annual cash flow benefit of £125.40, with
the avoided cost benefit excluded, would be achieved by this design after all cash
flows have been taken into consideration, including an increased mortgage
payment. This effectively makes the energy production and efficiency upgrades
over a building regulations home cost neutral to the owner occupier. When this is
compared to a predicted annual cost of £960.00 per annum for a new home built
to current building regulations standards, the net financial benefit of this design to
the owner-occupier is £1085.40 per annum (the aggregate of income plus not
spending the £960.00). An additional benefit from this is that there is effectively a
zero payback period on the additional costs. As the running costs would be used
to pay down the mortgage not the cost of energy provision, a residual investment
benefit to the mortgage holder exists.
193

An additional commercial driver identified from the modelling is based on the
developer passing all additional costs of building to the higher standard on to the
purchaser. This could, in principle, enable the developer to build these homes
without negatively impacting their bottom line profit. This means that the higher
purchase price for this design financially benefits both developers and the owner-
occupiers. It is important to note here that the model does not yet take into
account lending criteria or surveyor valuations which may affect the ability of the
developer to sell properties at a higher rate. This research is conducted in the next
section.
This research has demonstrated that technically viable microgeneration solutions
can be developed to meet a household’s energy demands whilst offsetting their
carbon emissions. This has been shown to be achievable economically if existing
policy tools are used to improve investment returns. What has been calculated is
that the optimised zero carbon home will, from the end of year one through to year
twenty, generate a net benefit for both mortgage and capital funded options
through life cycle costing. In the case of mortgage funding the over and above
costs, an excess net benefit still exists after deduction of the mortgage payment.
Thus, not only does the optimised zero carbon home work out cheaper to run
almost instantly, it generates a surplus net benefit and protects the occupier from
fuel price rises to greater or lesser degrees dependent on the sensitivity analysis.
The more fuel prices rise the better off the owner- occupier becomes. In addition
to this effectively zero energy bill house, the longevity of the technologies and
tariffs could carry a premium when it comes to selling the property at the seven
year ownership average.
The recent economic down turn in 2008 and its ongoing impacts has meant that
securing finance for buildings and an increased mortgage may seem unlikely or
unaffordable. When this financial breakdown is presented to banks or building
societies, it offers the possibility to provide additional financial services as the cost
is more than met by the returns generated from the technologies. In theory this
mitigates the financial risk of the extra loan amount. Whether or not this is likely to
be the case in practice is explored in the next section of the research.
194

Additionally the economics of the optimised design creates an opportunity for
banks to effectively receive monies that would otherwise be spent with utilities
companies in the form of the over and above mortgage payment. This could help
create a new financial product offering a diversification option for the lender within
the mortgage market. It is important to note the banks will have additional financial
criteria based on credit ratings etc. that will affect individual borrower’s ability to
secure the finance differently but this is beyond the scope of the current stage of
research. The feasibility of this idea is tested in the next section of the research.
This model also has important implications for developers. Zero carbon
commitments have already been made under the 2016 zero carbon target for new
build homes. If innovators embrace this model now they could be at a competitive
advantage in the 2016 market. This means that innovation now could create
further cost benefits associated with volume and experience by developing
optimised zero carbon homes now.
To explore these assumptions and establish stakeholder opinion on the way that
the model addresses critical barriers, qualitative research with key stakeholders
was conducted. The following section of research details the results and analysis
of this.
195

Chapter 7
Ethnographic Research Relating to the Feasibility of the Design
The research conducted in the previous sections focused on optimising the design
and exploring different ways to demonstrate financial viability. This is only the first
part of the story as given the housing regime characteristics it is important to
understand whether or not the design is attractive to commercial stakeholders.
This was tested using a mixed qualitative approach informed by ethnography. The
approach taken is outlined fully in the methodology section.
Interviews, emails, and telephone conversations with key stakeholders were
gathered over the course of the research period. The optimised design was
presented to stakeholders to gather their opinions on its potential to be
commercialised. The following section details the depth and breadth of the issues
facing the creation of a commercialised zero carbon housing sector using the
optimised design. The research findings are analysed and discussed which has
lead to new insights being developed alongside recommendations for future
research.
The research in this chapter is divided into seven sections. Section 7.1 focuses on
cost based issues. Sections 7.2 and 7.3 detail the impacts on market potential and
demand. Section 7.4 details of the impact of the optimised design on development
risk. Section 7.5 highlights policy based barriers. Section 7.6 details issues with
skill set, roles and responsibilities and section 7.7 details structural based barriers
present in the wider socio-technical field.
7.1 Cost based issues: Economics and investment returns
Respondent HB1 (Interview): You need to do the same stuff for the same
price [and] then you’re onto a winner
196

The rationale for this research project was to explore the commonly held belief by
large UK house builders that highly innovative zero carbon homes are
commercially unviable. This was reflected by the limited penetration of such
designs into commercial builder portfolios at the time the research plan was
formulated (AMA, 2010; Calcutt, 2007; Welling, 2006). This is evident in the fact
that only 6 commercially available properties had achieved post build zero carbon
status by the end of 2010.
Commercial house builders are defined as overly risk adverse, reluctant to
innovate, inefficient and cautious towards investment (Goodier and Pan, 2010;
Barker, 2003). Unfortunately innovative zero carbon homes are considered
untested designs and as such they increase costs and risk, and require supply
chain innovation. This creates barriers within the development process which has
significant implications for commercialisation (Goodier and Pan 2010; Ball 2010).
Costs and price constraints are the first impact area where barriers and resistance
to innovation exist.
Callcut (2007) and Osmani and O’Reilly (2009) both identified cost as a major
issue in their research. This was also observed in this study, with increased costs
of zero carbon design remaining the most persistent objection. This was the case
despite the lower costs involved with the optimised design. Responses from
commercial builder stakeholders most strongly reflected this, with one respondent
stating that until the cost of building a zero carbon home was the same as building
a building regulations home he would not be interested in developing designs on a
commercial basis. Analysis of the field notes collected from meetings with other
key stakeholders also confirmed this. In relation to the case study, both the initial
interviews and the follow-up meetings with HB2 and HB3, cost based issues
dominated. In fact the combined cost and risk issues eventually led both these
commercial builders rejecting the opportunity to develop the case study project.
Even when a developer was found to progress the case study development
(Respondent SB2) through to the commitment stage, cost based issues were
continually at the forefront. SB2 constantly reviewed costs and asked for new
design iterations to be considered that may reduce costs in the future. The
197

following responses are typical of the cost based objections observed across
stakeholder groups:
Respondent MB (Interview): A big player… he said until the day comes
we can build a code 6 house, or zero carbon if you like, for the same price
as we build today I won’t change. Come back to me when you can.
Respondent T (Interview): Your model justifies additional capital cost and
is highly innovative, however, the true solution, the real answer, is to deliver
the housing design at the same cost and not at a justified cost
Respondent SB2 (Interview): [you need] to drive down the development
cost to improve headroom on sales requirements. We need to reference to
the borrowing power of the local work force, placing a ceiling on house
prices in certain areas. This is not a prime site so having this in mind is also
very important.
Reflective note taking across all stakeholder groups echoed the same cost based
mantra. The commercial builders, quantity surveyors, investors and media
representatives all considered that the mainstream market would not want to
move if bottom line profits would be affected. Respondents considered that the
method of passing costs onto consumers would still impact bottom line profit and
would thus be difficult to get national house builders to buy into. The quantity
surveyor also considered developments using the model unlikely to be
progressed. He did not consider the costs and returns to reconcile and indicated
that he would not recommend the case study development to developers. He took
a different view point to the cost justification route and advocated removing
renewables as the best way to improve the viability. He did not fully appreciate the
balance between implementation costs and life cycle costs and therefore resulted
to a default position of cost savings through reducing the specification to the
minimum regulatory requirement. This was demonstrated when QS1 said:
Respondent QS1 (Interview): In our view this project is just not interesting
from a developer point of view. Nobody would be interested in this from a
developer view purely because of sales costs...Zero energy development
198

on this scale in this area is not deliverable or profitable. You need to reduce
the cost. Is it possible to reduce the size of PV roof? You need to remove
portions of the roof. The roofs will be proportionately more expensive as a
result of the overhangs.
Respondents considered that doing the minimum possible to meet the design brief
would be the only way to make zero carbon developments work. Respondents
advocated reducing the higher cost items, such as the levels of PV, was the best
way to do this. Most respondents did not take a holistic view of how the whole
building worked together and did not consider the life cycle cost benefits, just the
cost implications. The advice from the quantity surveyor respondents was to do
the minimum possible to meet the planning requirements and not attempt to offset
the life cycle costs. One quantity surveyor considered it to be his responsibility to
advise on the cheapest possible way to meet the design brief and cut out what
they considered to be unnecessary. It was not their role to consider life cycle costs
and said that he would advise a developer to make the build cheaper. QS1
demonstrated this when he said:
Respondent QS1 (correspondence): I don't know what the energy
consumption of your Code 6 designs are but I don't suppose they are that
high. Do just what is needed and reduce cost…meet the brief.
As such it was noted that developing the new mindset that upfront costs were not
the main determinant of financial viability would be a significant challenge from the
very outset of a project.
Local Housing authorities also felt that cost was the most inhibitive factor. One HA
stated that because of high development costs he did not look to build homes
beyond improved insulation levels involved with Code 4 designs. He also pointed
out that completed examples of Code 6 designs have only been built due to
heavily subsided costs. He made it clear that he considered zero carbon design
uneconomical because of higher cost factors and that this would also be the case
with the optimised design. This was well illustrated in the follow-up
correspondence when he stated that:
199

Respondent HA1 (Correspondence): The key barrier in delivering any
site is cost and typically we do not generally deliver new homes above
Code Level 4 for this reason. Very few Housing Associations have
delivered projects at Code Level 6, and where they have these generally
tend to be pilot type projects which have to be heavily subsidised by the
HA. We would really like to see the delivery of an affordable housing
scheme but it would be very unlikely that we would be able to progress to
the levels of this design.
Even socially motivated commercial builders SB2, who went on to fund the case
study to the commitment stage, considered the reduced costs and improved
returns of the optimised design to still be uneconomical when applied to large
scale developments. This was due to the lack of a surplus in the financial
development model dedicated to this purpose. SB2 commented:
Respondent SB2 (Correspondence): Contrary to what we had heard
about the economics of solar, it is now becoming clear that solar is
uneconomic at this scale and for this type of development. The [case study]
work is now demonstrating this very clearly. This is mirrored by the
concerns of the construction industry who seem less than persuaded that
solar is the right way to achieve Code 6 unless there is a surplus in the
investment model that can be used in that way. We don't have the luxury of
that surplus. The key objective of this strategy is to find a partner who will
take the risk on delivery of a market solution where economical solutions for
energy generation are not viable.
The surplus in the investment model referred to either outside funding by a third
party or a price premium designed to cover the cost uplift. Neither was inputted
into the financial appraisal when reviewed by the developer. As the development
process progressed this became more of an issue and it became clear that whilst
the developer had bought into the concept they were actively looking at ways to
make the development costs lower still. As such the full design philosophy was not
fully accepted as they were seeking ways to reduce the renewable component
costs through different funding models. The alternative funding models would
200

unpick the economic model used by the optimised design to justify higher costs
and prevent the life cycle costs being realised by the owner occupier.
Respondents also pointed towards other cost issues relating to house pricing
limits. It was noted that house price ceilings in local areas currently dictate the
maximum price a house can command. If construction costs were too high this
would restrict the ability to roll-out higher construction cost homes in these
regions, despite the offsetting of life cycle costs. Income levels of the people
wishing to live an the area would in fact dictate what a house could be sold for.
Life cycle costing was still not being accepted by some stakeholders as way to
offset higher costs and thus the argument for zero carbon development reverted
back to building and selling the optimised design for the same price as traditional
builds. SB2 highlighted this fact when they responded to the price justification in
the model as follows:
Respondent SB2 (Interview): We need to reference the borrowing power
of the local work force, placing a ceiling on house prices in certain areas…
having this in mind is very important…. very few will have surpluses... I
acknowledge all of this but suggest that the focus is first on the lender. Any
purchaser will require a mortgage and this will need to be against a certified
value. As you know, valuation is a comparable business so reference will
be made to the prevailing local market and augmented by any evidence
that the [life cycle cost] increment is supported by a commensurate
increase in value.
As such he considered the cost model as ‘aspiration’ only and not a commercial
driver. The inability to pass the additional cost on to the consumer even though
consumers would be financially better off is therefore a significant barrier to
commercialisation of the optimised design.
Another cost based insight which amplified this problem was identified from
investor responses. Investor T2 identified that limits within traditional investment
approaches exist which prevent the cost model being utilised for funding
purposes. As such problems with perceived affordability highlighted above were
exacerbated by problems with lending criteria that did not account for life cycle
201

costing in affordability assessments. Their responses were aimed at both the fact
that the thinking behind this would require new financial products to be able to
mitigate risk and enable lending against and the level of innovation being untested
in financial markets and. Investor T1 stated:
Respondent T1 (Interview): … traditional funders would dismiss these
returns as traditional finance models are flawed when applied to zero
carbon designs, as the cost and requisite returns don’t reconcile. Funding
of green developments is [possible but] still dependent on meeting risk and
funding criteria. The instruments required for this do not exist yet. Even
though your model justifies costs it does not fit in with traditional ways of
thinking.
The theme of acceptability of a housing development using the model was
persistent. The responses identified a distinct lack of consensus about whether
the economic benefits of these approaches could be financially capitalised upon
and this created concern as to whether or not the cost model could be relied on as
a commercial tool. Responses across actor groups exhibited this. The analysis
showed that the model was considered interesting and innovative but could not
provide enough security for developers and lender. This was based on the scale
of new thinking required across key elements of the banking, investment,
developer and purchasing criteria to justify change. This point was further
emphasised by the national house builders. HB4 also added:
Respondent HB4 (Interview): … we do not believe that the additional
sales value required would be achievable in an already [price] sensitive
private resale market.
As such the commercial stakeholder reluctance to embrace the model was not
only that it was too innovative and lacked evidence, it was also based on a
perception that the market could not handle higher costs, even if justified. This
was further linked to profit and return criteria. The main emergent theme was
whether the model would lead to similar profits or lower profits to traditional
investments. If they did lead to similar profits, was the level of risk acceptable?
The respondents answered this question negatively with the general consensus
202

being that developments using the optimised design would still be the least
preferred option. This could be traced back to the fact that, whilst the case study
development was profitable, it would either provide lower returns than standard
developments or increase risk without guaranteeing enough profit to justify it.
Project manager, PM2, illustrated this:
Respondent PM (Interview): …the problem is, as it stands, is that when
you approach a developer with this scheme they will require a 20%
development profit and a 12% contract profit and this development doesn’t
generate that. That’s a lot of profit. They want an end user involved to put it
in the bag and [only] then they will require less. It’s risk to them. There are
lots of people looking for their money. They are a big company with
probably 20 schemes competing for funds which can provide this.
The field note analysis from follow-up meetings also confirmed this as an issue.
The lack of certainty as to whether additional costs could be justified through
innovative financial models led to some developers deciding not to progress the
case study development any further. HB4 gave the following reason not to pursue
the case study development:
Respondent HB4 (Correspondence): Having reviewed the information …
we both feel that whilst we both are impressed by the design ideas and the
potential of the homes, we strongly feel that this would not be well received
or understood by the market. Also we do not believe that the additional sale
value required would be achievable as this would put these properties
potentially 20-25% above an already sensitive private resale market.
Respondents LA1 and SB2 requested documented evidence of the model working
elsewhere which was not possible due to the level of innovation in the design and
life cycle cost model. The local authority representative said:
Respondent LA1 (Correspondence): I am interested in quantifying the
direct and indirect economic and financial benefits of the proposal. Could
you help point me in the direction of any research which you are aware of
which quantifies the benefits of the type of development in your proposal.
203

This was corroborated by the sustainable builder, SB2
Respondent SB2 (Interview): This design is underplaying the ongoing
cost savings and we need to capitalise on these more. Can you prove the
lifetime costs of the home and show the savings over a standard building
regulations home? But I would stress that it will hard UK and/or local
evidence that will change perceptions.
Innovation in cost and economic models was perceived to add additional risk
which prevented in from being relied on in investment decisions. As such the
impact of innovation in the financial and economic fields was equally problematic
as innovation in design.
7.1.1 Exceptions to cost based issues
The large scale developers, respondents HB2, HB3 and HB4, however, did point
to an exception to this. This was based on pre-sales in order to de-risk the project.
HB2 in particular advocated such an approach. He suggested that guaranteed
sales of the built asset prior to construction could be investigated as a means to
facilitate more expensive build projects. It was considered that de-risking the
project in such a way could allow zero carbon homes to be built at a commercial
scale by getting housing association to take more risk. By taking some of the risk
the respondent thought the organisation to be open to the lower margins on a zero
carbon development. The excerpt from the interview with HB2 below illustrates
this point.
Respondent HB2 (Interview): you need a guaranteed revenue backed
investment to make these things happen….. We would need one of two
outs, one that it’s refinanced at the end or to know that we have an RSL/ LA
already at the end with a guaranteed purchase. Then we might be
interested. The risk profile changes and we can consider lower returns. You
will struggle for the construction funding, that’s where we are being
approached more than anything. It’s not an issue to fund an asset once it’s
been built but the issue is who funds it whilst it is being built. That’s where
we get most of the approaches to us. We essentially provide the
204

construction funding. Here it is a mix of investment funding and investment
risk. You need a guaranteed revenue backed investment to make these
things happen. However you call it, to make these things happen, at one
end open market down to RSL backed at the other. It’s still a guaranteed
revenue stream which makes it happen. you have to bear in mind that
you’re up against other, more standard, investments competing for finance
that have better IRR’s. The only way to offset this is with a guaranteed
revenue backed investment.
7.1.2 Issues with tariff backed models
Another insight developed from this research was the commercial builders’
reluctance to base business models using tariffs/ subsidies. Whilst their attitudes
towards subsidies were generally positive subsidies were not considered
significantly stable or beneficial enough to facilitate the roll-out of zero carbon
design. Respondent SB3 illustrated this point when discussing using the FITs as a
way to justify business models. He considered that in the past, models which used
the FITs to generate revenue had proven to be unreliable. He said.
Respondent SB3 (Interview): …That’s going to be your biggest problem...
You over spec on the PV to exceed your demand and bring in income to
cover the other tech but with a drop [in the FITs] I don’t think it will work. It’s
causing us problems with developments which used the FITs to push up
the return but now it doesn’t work. The revenue stream is not enough
This was based on the outcomes from the controversial first FIT’s regression.
Whilst the FIT’s policy and regression schedule is more stable now the
repercussions of this are still impacting developments.
The field notes from the meetings with investment respondents T2, T3 and
developer SB3 also raised concerns regarding the use of subsidies and whether
or not it was prudent to base a housing model on using them. This was considered
a risky move that created problems when looking beyond single developments
and taking a long term view on the optimised housing model. Other respondents
were clearly of the opinion that until subsidy free ways of proving the economics of
205

zero carbon homes could be achieved, there was no way of incorporating designs
into current commercial models. The following excerpts from the interviews with
HB1 and T1 illustrate this finding.
Respondent HB1 (Interview): Off-setting the capital cost is the killer.
There is no subsidy free way of doing this. Not sure about no bills – I don’t
see any additional value from a zero bill house. I cannot see that any valuer
or bank would put a premium to this using subsidies, I’m not sure the
people who [actually] lend really put value on these types of things. I’ve
seen valuations devalued for using renewables.
Respondent T1 (Interview): ….the real answer is to deliver the housing
design at the same cost and not at a justified cost.
As such commercial viability was firmly rooted in cost equality and not justification.
This has important impacts on the optimised design. Without subsidies the model
would not prove financially viable as the ability to offset the cost uplift would not be
possible. As such, based on the responses from stakeholder’s suggesting that
tariffs do not contribute to commercial viability, commercialisation of the optimised
design will be problematic.
7.1.3 Issues with traditional funding and other methods of investment
Additional insights developed out of investor responses related to securing
finance. Responses from respondent T2 particularly suggested looking at
alternative routes for funds. He intimated that the best option for securing finance
for innovative developments maybe through ‘Sustainable Investment Portfolios’.
Respondent T2 thought that these might be a more viable source of funding as
they were designed to take a longer term view of the market. As such they would
be more open to alternative forms of funding and investment. Positively he agreed
that zero carbon housing projects could match these fund criteria. T2 said:
Respondent T2 (Interview): ‘Funding of green developments is still
dependent on meeting risk and funding criteria, however, they [sustainable
206

investment funds] will take slightly lower and more long term perspectives,
unlike traditional funders who would dismiss these returns as traditional
finance models are flawed when applied to zero carbon designs, as the
cost and requisite returns don’t reconcile. Funding of green developments
is [possible but] still dependent on meeting risk and funding criteria.
Field note analysis from respondents T1 and T2 showed a consensus that
traditional funding routes would not be able to incorporate life cycle costing
benefits. As such the commercialisation of the optimised design was likely to
require alternative funding methods, like leveraging green investment funding.
Whilst this effectively limits the routes to commercialisation it did demonstrate that
under certain conditions and with certain types of investors, zero carbon
developments could be viable. As such alternative funding stakeholders were
included in the study.
The responses from alternative investment respondents showed that sustainability
focused funds would be willing to take slightly higher risk and accept a more long
term perspective on realising their returns, there were similar concerns regarding
the economic models as the traditional investment route. The primary concern
stemmed from the fact that the economic models, which used non-traditional
approaches, would be poorly understood by some elements in the development
process. They were rooted in the mortgage lenders and financial institutions
unfamiliarity with the economics of zero carbon living. Whilst the investors
acknowledged that innovative buildings required an innovative approach to
finance they also emphasised the need to still fit into standard models. This was
illustrated by the following responses from traditional investors and the socially
oriented developer.
Respondent T1 (Interview): Your model has disadvantages, it’s a non-
traditional model [and] not a standard financial technique understood by
mortgage lenders or banks…… We will have trouble selling the concept to
traditional large scale builders as they have standard models and concepts
and this will be viewed as outside of what is acceptable to them…..
207

Commercial contractors and banks have models that this form of thinking
just won’t fit into.
Respondent T2 (Interview): The problem that you will have on a project
like this is that no matter how you justify the extra expenditure, which you
have done, it falls outside of the remit of traditional lines of thinking and
therefore it will be incredibly hard to push it through’
Out of all the potential traditional and alternative investment participants
interviewed, social minded developers were perhaps the most receptive. This was
due to their experience with working with local authorities and their knowledge of
local authority asset management. This experience enabled them to view the
model as a solution to difficult developments sites, known as market failure sites.
Market failure sites are sites which have been turned down by developers as
commercially non-viable for development. The sustainable developer considered
the optimised design to hit a number of financial social objectives for local
authorities which traditional developments would not meet. As such he considered
the model as a low cost way to leverage unused council land assets not fit for
other forms of sale or development. It was noted that if the model could be fed into
council and LA carbon abatement targets he could see the potential to generate
incomes for LA’s whilst reducing emissions, currently a cost to councils. By
capitalising this value it was considered that it may be possible to subsidise the
increased build cost of the home.
Respondent SB2 (Interview). We are always looking to extract value…
and add value which often leads us to look in all manner of places. Which
ranges from patches of land you can bang up a few houses, which is easy,
or to where you would have to stretch hard to find any opportunity to add
value.
Respondent SB2 (Interview): once you have the long term benefit of low
bills and bit of money coming back at a domestic level there’s a way of [us]
using that future promise to raise capital to subsidise the value of the
house.
208

7.2 Market potential and demand
HB1:…does the sector want a code 6 house?
HB2: …Mainstream code 6. I just don’t think it’s going to happen
Another critical barrier is accurately establishing demand (Byrne, 2005; Birrell &
Bin, 1997; Wilkinson & Reed, 2008; Callcutt, 2007). Due to the way the
development process works, this must occur at the development phase and be
predicted accurately to protect investors. Demand is usually predicted using
market and historical data, however, documented sales history for commercial
scale zero carbon homes does not exist. Callcutt (2007) considers accurately
predicting demand and managing uncertainty as essential components of
successful development. Establishing if demand for a zero carbon home exists is
considered essential to instigating a commercial roll-out of the optimised design.
Without demonstrating that demand exists it is hard to convince national house
builders that a zero carbon product is required or that the segment is large enough
to invest into. Establishing demand for a zero carbon home is therefore critical in
order to stimulate niche accumulation of innovations that can break through in to
the regime level (Rogers, 2003, Ravens, 2006). If demand can be established and
built up at the expense of traditional market designs a route to commercialisation
can be developed. Callcutt (2007), Mlecnik (2010), Ball (2010), Osmani and
O’Reilly (2009), and Goodier and Pan (2010) all identified critical issues relating to
creating viable markets for zero carbon homes as a significant reason why zero
carbon homes have not achieved commercial acceptability.
7.2.1 Innovation and demand
The research confirmed that many of the issues highlighted above still applied to
the optimised zero carbon design, with many stakeholders questioning the validity
of demand for a commercialised product. Respondents highlighted a perceived
lack of research to prove that zero carbon homes warrant commercial scale roll-
outs. The respondents across the majority of strategic actor groups also intimated
that they were not prepared to embrace innovative zero carbon designs until
209

consumer barriers and drivers were better understood. Respondent HB2
succinctly put this when he stated
Respondent HB2 (Interview): I’m keen to be innovative…..but does the
target sector want a code 6 house?
The project manager interviewed also encapsulated this issue when he said:
Respondent PM (Interview): The problem is…there is not really a
recognised market for a code 6 house.
A new insight gained from this study was that first mover advantage was not
necessarily considered a good thing. None of the respondents wanted to be the
one to innovate and then have the repercussions felt across the sector. It was far
easier to not innovate and continue doing what had been done historically. This
created a situation where there was clearly very little desire to pioneer zero carbon
developments. With a lack of pioneers it is unlikely that the initial first development
to prove the concept works would occur. A key component of gaining market
acceptance is building the designs for the commercial market and establishing
returns from sold homes. By doing so business models can be established and
proven. Proven business models can then be scaled up to reduce risk. Therefore
creating a viable business model based on completed built assets was considered
essential by national house builder respondents. HB1 illustrated this in the
following except, supported by exerts from HB3 and M3
Respondent HB1 (Interview): Nobody wants to be a market leader in this
industry. We are focused on building fabric only, code level 4 in a nucleus
of houses across the UK, no renewables, for the price of code 3. Stuff we
can build at a max level. After the roll out this year we have a 5 year
exploitation plan where we commercialise and bring to market that solution.
Its bread and butter stuff, straight forward 2 and 3 storey builds not this kind
of stuff. I look at this stuff and go nope. It’s absolutely straight forward stuff.
Whether or not its architecturally appealing is up for grabs but it’s
something that is affordable, has got low running costs and someone can
live in. Stuff we’ve been doing for 30,40,50 years.
210

Respondent HB3 (Interview): The UK market is too conservative and that
is why there is no movement. To impact the market, to shake it up, get it
moving. You cannot be unique. You need to get the rest to move. The idea
has to be to create competition in this market and get more people doing
this. The UK market is too conservative so there is no movement.
Respondent M3 (Interview): This development will be one of the first to be
built like this. You will be the developer enabler on this. The only way to
change the market is to get the first one built. You need someone to put
their heads up and take the risk… but the push for next year will be volume
so who will be the enabling developer on this?
When discussing demand the respondents mainly focused on one critical
question: Is the market developed enough to demand a readily available zero
carbon house? This is essential to the optimised designs commercial viability as it
raises the further question of whether a need to develop a commercialised zero
carbon product exists. In the opinions of the commercial builders and energy
provider the answer was categorically no, as demonstrated in the following
statements:
Respondent HB1 (Interview): We are not actively looking at PV and stuff.
You guys are too niche. This is all niche and not for commercial scale.
Ideally we build the house and sell the house. We are keen to work with an
energy provider.
Respondent HB1 (Interview): does the sector want a code 6 house?
Respondent HB2 (Interview): Mainstream code 6. I just don’t think its
going to happen’
Respondent EP (Interview): Public drivers are low. We don’t feel that the
people who buy houses want these technologies.
Post reflective note taking from respondents M1, M2 and M3 also supported the
notion that the model was somewhat complex and required changes in the
211

mindsets of not only builders but by consumers as well. These respondents were
not convinced that the model would be understood by the market, especially
respondent M2. Respondent M2 thought that only highly motivated consumers
would want to embrace the notion of spending upfront to save expenditure over
the lifetime of the building. He considered this to be restricted to self-builders who
would already aspire to achieve this. As such he did not think the model would
increase mainstream demand for zero carbon homes. What he thought was that
self-build community approaches would better suit this model as that would be
where demand already existed. M2 also considered the main stream market to be
flawed in general and that alternatives needed to be investigated to improve both
the volume and sustainability of homes. This perception was also observed across
other actors in the non-traditional routes to market. Respondents WW and NB
considered that up scaling the self-build market would be more likely to improve
the roll-out of innovative zero carbon design. However, it is important to note that
these actors are actively involved in trying to upscale the self-build environment,
‘rubbing against the grain’.
HB1 did recognise that this was changing, however, whilst energy efficiency is
becoming more important the subjective nature of home buying criteria meant
there is an inherent limit to the additional value this can create (CABE, 2005;
RICS, 2010).
The investor group did consider the optimised design to create drivers based on
energy efficiency. One driver was protection against the threat of energy price
rises and by removing this threat it protected disposable income. The investor, T2,
considered that the potential loss of disposable income for owner occupiers could
be marketed as this would be a concern for future home owners. He considered
that there was a strong need to communicate this value to investors and potential
home owners and in their opinion this should be the primary message and not
eco-credentials. He was, however, unclear on the potential premium this could
justify.
Respondent T2 (Interview): The main benefit to leverage is that the cost
of living is set to drastically increase over the coming years with disposable
212

income drastically reducing as energy and fuel costs rise. How you
capitalise on it is unclear
Respondent T2 (Interview): You need to establish how to get the market
to recognise this [life cycle costing] as an investment return.
Respondent SB2 did not view this as an additional benefit to the customer instead
he viewed it as a way to subsidise the build costs for the developer. Their main
aim was to deliver the case study for as lower cost as possible and would have
preferred to use the life cycle cost benefits to bolster the development appraisal
and not to benefit the home owner. This was unfortunate as it contradicted
investor T2’s preferred option of using it to increase demand in line with the design
philosophy objective.
Respondent SB2 (Interview): once you have the long term benefit of low
bills and bit of money coming back at a domestic level there’s a way of [us]
using that future promise to raise capital to subsidise the value of the
house.
Conversely house builders HB2 and HB4 did not see this as a way of increasing
demand. HB4 did not think the market would want or understand the life cycle cost
model, even though he agreed it was good in principle. He questioned whether
people would pay more for a home even though savings would be recovered later
on and that the market ceiling prices would prevent the sales uplift ever being
realised.
HB2 went further and considered that the entire concept of mainstreaming
innovative zero carbon designs as flawed. He did not consider it to be a question
of methodology but down to the fact that he did not think it would ever happen.
Respondent HB2 (Interview): I do not think it is a matter of how you go
about these things. Mainstream code 6. I just don’t think it’s going to
happen.
213
This reluctance to innovate was evident in the field notes from other stakeholders.
Most stakeholders agreed that the model was innovative but that it would not
create additional demand via the mainstream market. HB1, HB3, EP1, T1, A2,
ES2, PM, SB2 and QS1 all corroborated this finding. Due to this pattern it was
possible to conclude that the level of innovation, lack of understanding in the
market, the lack of desire from commercial builders, the lack of understanding by
banks and valuers, the cost issues and lack of proven track record all contribute to
a regime wide perspective that demand is too low and the evidence base to
sparse for commercialisation of the optimised design.
7.2.2 Improvements in usability
When analysing the improvements in usability responses were mixed. This part of
the model was somewhat under commented on by the majority of commercial
respondents. Their responses instead focused on other issues such as cost and
risk, illuminating in itself. When reviewing the transcripts and field notes the most
prevalent responses on usability centred on the ranking of purchase decision
factors. The perception that energy efficiency is only one small part of the
consumer purchasing decision persisted and thus very little attention was given to
this in the study. Most commercial respondents focused on this aspect instead of
the ease of use, highlighted in the following excerpts.
Respondent HB2 (Interview): It’s good but what do you want from your
house – location, life style etc but energy efficiency is moving up the list in
the top ten. It’s coming, it could be a driver but people aren’t pitching up to
our sites demanding it.
Respondent HB1 (Interview): People just care that it works and they are
warm. That’s all. other issues are more important… other things people
want from their homes.
Respondent HB4 (Interview): It’s not an issue with [traditional] homes.
People don’t think about this.
214

The Housing Authority, however, considered usability to be more of an issue.
Respondent HA considered that changing to standard ways of doing things would
cause issues with marketability. The HA respondents highlighted that this issue
would impact consumer demand and he did not consider a zero carbon product to
be appropriate for the same markets as traditional build. This creates issues for
niche innovations moving to the regime level as it defines zero carbon homes as a
separate segment to traditional builds. This is somewhat related to cautionary
approaches to innovation as the housing association respondent considered that
incorporating the elements separately could be acceptable but incorporating them
holistically in a single project would be problematic. These points are both
demonstrated in the following statement from HA1:
Respondent HA1 (Interview): Living in a Code 6 property requires the
resident to fully embrace the principles that make running the property
efficient. Ideally you want residents to opt for living in this type of
property…. I think we could incorporate elements into any new homes to
ensure they were highly energy efficient but we would be wary of signing up
to an entirely new construction method and product.
7.3 Instances where lower returns are acceptable
Concerns regarding cost and market demand have been highlighted in the
existing literature, however, one new insight generated from this research was that
lower returns could be acceptable for zero carbon developments in some
circumstances. This was in contrast to previously held assumptions and was
based on the fact that some commercial builders do not consider the risk of lower
rate of return from the investment as the core stumbling block. This was based on
being able to guarantee presales, thus reducing risk. The lower risk profile
achieved by pre-selling would offset some profit requirements allow them to take
a lower rate of return. HB2 said:
Respondent HB2 (Interview): At the moment we are looking at the zero
grant model where we actually sell at around 20% below the market value,
we sell them all at that because they [RSL] take all the sales risk, risks with
215

zero occupancy, and we’re happy to do that. It’s de-risked. We would need
to think along the same line’s with this. We would be happy to look at it
once it’s de-risked.
Both the medium sized developers viewed the case study model as having more
enablers than inhibitors and considered many of its features as reducing risk, not
increasing it. They both considered the economic model as way to generate
added value to medium scale developments. They also felt that this model could
be what was needed to challenge the industry to build zero carbon homes on a
large scale, however, this would not happen without one being built and proven as
profitable first. MB 1 and 2 said:
Respondent MB1 (Interview): The first one will be key…now if we can set
things up so that the medium sized developer is the one going against the
grain and we produce something that’s better and good and more for the
future and sustainable, then we’ve got something. And we can use that
there.
Respondent MB2 (Interview): we innovate as well go along here. You
have to understand that its innovation. Things won’t always work straight off
and you have to be flexible. Prototype so to speak. So it’s more risky. You
have to have the appetite for it and be convinced people will buy it. If not it
won’t happen. Someone has to build the first one and that’s key.
Both the medium sized builders considered differentiation as important to them
and this could offer competitive advantage if the funding was available. They were
motivated to look for new ways to make innovation work.
7.4 Development Risk
Respondent HB2 (Interview): I think, I know, that where we will come from
is… what’s our security?
Perhaps the second most consistent observation in the responses was in the risk
theme. This was particularly so regarding mitigating and managing risk. Risk is
216

considered by a number of authors (Ball, 2007; Calcult, 2010; Goodier and Pan,
2010; Osmani and O’Reilly, 2009; Heffernan et al., 2012) to be a major hurdle to
a commercialised sector as due to the combined effects of increased cost,
uncertainty, lower marketability and unknown factors regarding design. Risk of
unknown issues and unforeseen problems relating to new ways of doing things
significantly hampers innovation in the housing market.
Respondents from the commercial house builder actors affirmed this perspective.
Respondents highlighted economic issues regarding risk and returns and
suggested that risk is split into 2 categories: development risk and construction
risk. Respondent HB2 considered that given current economic returns from the
development, it could only satisfy one element of risk for them, construction risk.
As such he would not be interested in carrying the development risk aspect of the
project. He suggested that in order to address both risk categories for his
company, a further 15-18% increase in profitability would be required. HB2 said:
Respondent HB2 (Interview): The construction is not the problem.
Normally our investment return model is for 12%. On an annual basis IRR.
That’s what we get as a group investing elsewhere. But with development
risk, it would be different we would be looking at over 15%. Not 11%.If we
were to be the developer taking risk on sales it would be between 15 – 20%
[on top] at least. This is more risky so probably more on top. We would
have effectively refinanced the development before we’ve built it.
The research with other stakeholders also identified that commercial builders
internal corporate practices were highly risk adverse when pursuing innovation led
strategies. As such changes to standardised housing designs within their
portfolios were always viewed sceptically. Respondents HB1 noted that his
company was very risk adverse and do not want to make great strides in
innovation, especially in an economic downturn. This was exacerbated by basing
business models on a product offering that had an untested market and involved
increasing the sales price. He highlighted that in the sector no-one wanted to
move first in case the ramifications are felt too deep across the industry.
217

The optimised design presented in this research was also viewed in the same
way. This was traced back to the design being a substantial deviation to tried and
tested methods of doing. As such this increased their risk exposure to perceived
unacceptable levels. This meant zero carbon homes would continue to be
fundamentally at odds with top level corporate strategy. The following excerpts
from multiple stakeholders summarise commercial actors’ attitudes towards risk:
Respondent HB1 (Interview): It’s pretty hard building now – 5 years ago
was much more rosier but now it’s backs to the wall and we need to look at
cost base and profitability, meeting regulation and designing any
opportunity to extract that profitability. We can’t be adding risk or basing
decisions on untested designs. It’s [innovation] not our goal at the moment.
Respondent HB2 (Interview): I think, I know, that where we will come
from, is what’s our security? If we are taking a risk on sales so we would
need one of two outs, one that it’s refinanced at the end or to know that we
have an RSL/ LA …. We can’t look at it unless we have this security.
Respondent HB3 (Interview): We can’t change our risk process or risk
profile for this. If it was to happen it would have to be separate on a project
by project basis only.
Respondent HB2 (Interview): But we don’t like to take the investment risk
Respondent PM (Interview): But it’s risk. There are lots of people looking
for their money.
Respondent EP (Interview): It’s unclear whether we have the risk or
market appetite
The responses also showed that generally the zero carbon market is considered
too risky. This is due to the untested state of designs, unsubstantiated increases
in sales price being the basis of the economic rationale and the requirement for
new technologies. This level of innovation created unease in many of the actors
due to their lack of knowledge of implementing these designs. An additional
218

insight generated was an apparent lack of confidence in other actors’ knowledge
in delivering such a development. The lack of comparable projects meant that
stakeholders interviewed felt zero carbon developments were relying too heavily
on intuition and ‘gut feeling’ as opposed to reliable data and knowledge. When
talking about the case study respondent A2 said:
Respondent A2 (Interview): This development will be a zero energy
village and a sustainable community. It is being used as a pilot scheme that
if managed and delivered correctly could be used as a bench mark as best
practice on similar schemes moving forward. [But] the fact is that as
developers and agents alike we have little experience in selling a scheme
like this. As this is so unique my advice can really only be based on instinct
and assessment as opposed to accurate, market comparable valuing.
The lack of confidence in other actors’ knowledge was highlighted clearly in the
case study when an unexpected risk barrier was drawn out of the discussions with
Lender L1. Lender L1 did not have concerns regarding single home lending but
did have concerns when providing mortgages for consumers over the whole of the
site. He was more comfortable lending on only a few properties and not lending
across all properties on an innovative development. He considered this to expose
them to too much risk. This is a risk that cascaded down to the developers as
developers would not want to build a development that a lender had concerns
over lending against. L1 summarised this succinctly when he said:
Respondent L1 (Interview): …The other key issue we’ve discussed is our
level of appetite for the capital we commit overall to properties on the site.
As you know, we have to take concentration risk into account and we will
want to be assured that other mortgage lenders are providing support too
throughout the project. Understandably, our Executive does not want to
over-commit and risk having a disproportionate level of mortgages on this
site. There may prove to be some further flexibility in the exposure numbers
once we’ve had some live experience of applications [but not currently].
When combined with estate agents’ lack of knowledge, this trait can be seen
across the regime, confirming the commercial builders’ anxiety regarding the
219

optimised design. The whole market, including lenders, builders, valuers and
agents can thus be considered institutionally risk adverse. As demonstrated in the
previous sections, the adversity to risk is not just design related but also tied to
new propositions, costing and economic models. This is further emphasised by
the reliance of the stakeholders on proven track records and comparative data
before innovation is embraced.
This trait was demonstrated across the actor groups whenever any significant
variations to major development attributes were discussed, evidenced in the way
responses centre on the problems of innovation and not the merits of the design.
As such national house builders would not recommend highly innovative
developments to the board until confirmation that the market could take the
designs at scale could be achieved.
The ability to commercialise zero carbon homes could, however, lie in developing
appropriate risk mitigation strategies. One such strategy suggested was to
research the ability for the development’s risk to be passed on to a more willing
party. Another way would be through selling the project prior to construction. If risk
could be passed on or reduced through pre-selling the future asset this could be
capitalised on and the risk and return ratio made more unacceptable. HB1 said:
Respondent HB1 (Interview): We don’t like to take the investment risk.
We effectively refinance the development before we’ve built it. We’re happy
to look at a development like this once it’s refinanced.
Some participants highlighted that the current methods of pricing innovative
projects to account for risk inhibited the financial viability in other ways. One
developer, when carrying out risk assessment and compiling financial models
stated that his company increased all fees and costs when dealing with more
innovative designs. This is summarised succinctly when HB4 said:
Respondent HB4 (Interview): We reflect things in the normal costs as
well. Normal costs such as agent’s fees are risk priced to reflect code 6.
Your 1.25% [fee] becomes 5% in the valuation, same with the other fees…
we lift each 3 or 4 times to risk price.
220

Housing association respondents also indicated that risk is a problem, specifically
in relation to deliverability and high levels of unknown elements in the construction
system. HA representatives were also apprehensive to go down a route which
they considered imposed eco-standards and lifestyle choices on consumers. HA1
commented:
Respondent HA1 (Interview): Few of the contractors we currently work
with will have experience in delivering this type of product and I think it is
likely that a specialist contractor would have to be used for this work. This
does raise issues for us in that we would have to work with a new
contractor that we do not have previous experience of and who may not
have delivered affordable housing before.
This was echoed in responses from the Energy provider who stated that:
Respondent EP1 (Interview): Councils are worried about social housing.
‘People do not want to live in houses with heat pumps. It can be soul
destroying to work on a project only to have it rejected on resident issues.
This is problem you will have…convincing both councils and residents.
This is problematic as commercial builders stated that they would rely on the
Housing Authority to de-risk innovative investments but this is not supported by
the responses from the HA actor. If the Housing Associations are unwilling to take
the additional risk it is unlikely that another actor will be found to do so. This only
leaves pre-selling as a way to de-risk an innovative development, reducing
potential risk management strategies.
From the responses from all key stakeholder groups such as national builders,
funders, lenders and Housing Authorities, risk is a critical issue that is still not
addressed by the optimised design. The model was not considered to adequately
de-risk the level of innovation and in many respects it was considered to increase
risk by innovating in both the marketing messages and economic models. The
literature findings from Goodier and Pan (2010) and Ball (2007) that the market is
risk adverse and restrictive to innovation can be clearly observed, to the point that
mitigating one risk is considered to create another. The impact of this does not
221

create a favourable outlook for the commercialisation of the optimised design, or
for instigating radical technological change.
7.5 Additional policy based issues
Respondent HB1: The low carbon agenda has been heavily diluted
A major issue identified in the existing research (Callcutt, 2007; Mlecnik, 2010;
Ball, 2010; Osmani and O’Reilly, 2009; Goodier and Pan, 2010) was that strong
policy instruments are critical to the successful implementation of zero carbon
homes. In order to drive the industry towards a more sustainable approach to
housing these authors considered clear and consistent policy to be key.
The opinions on policy varied across the stakeholders. Commercial biases and
environmental stand points heavily influenced whether or not the stakeholders felt
that current policy instruments were a good or bad thing. Stakeholder group also
influenced whether respondents thought environmental standard should be an
option or if the markets should be allowed to force the outcomes independently.
Some stakeholders felt that policy went too far and needed to be redacted whilst
others felt very strongly that policy did not go far enough and was actually moving
backwards by supporting less effective solutions.
The big six energy company respondent clearly felt the low carbon agenda was
not a strong driver, from a regulatory perspective, and did not warrant pursuing
environmentally lead goals. She noted that recent changes to keynote policies
supported her company’s decision not to whole heartedly embrace the changes
required to drive the zero carbon housing design forward. She was in support of
reducing policy and felt that restrictive policy and subsidised models were not the
correct route forward. As such she expected that her company would be ‘sticking
to their knitting’ and not actively pursuing research and development in the fields
surrounding the microgeneration technologies incorporated into building design.
She also felt that the industry supported watered down legislation and would in
fact like to see it watered it down more.
Commercial builders also believe that code 4 should be the benchmark
achievement for commercial construction and that this is a widely accepted view
222

through the industry, with a core coalition of large scale builders actively pursuing
this agenda. The responses from the commercial builder were broadly compliant
with the views of the industry leading energy provider. They believe that the code
for sustainable homes has been, and is in the process of being, watered down.
They also viewed policy redaction as a good response to industry lead concerns.
The energy provided felt very strongly about this. She clearly demonstrated this on
many occasions but most clearly when she said:
Respondent EP (Interview):...code 6 will become code 5 and then
watered down…..we think this will happen. It [the industry] needs it
The commercial builders’ views on how the legislation currently impacts them
gave further credence to the ineffectuality of the code in its current form for
making any substantial impact on the industry in the short term. Respondent HB1
in particular stated that given the industries procurement structure, the current
legislation for code four will not actually impact the developers building design until
at least 2016, the date when fully zero carbon regulations for new builds are due
to take effect. The predicted date by the developer for zero carbon regulations to
take effect was as late as 2020. This was highlighted by HB1 when he said:
Respondent HB1 (Interview): The [zero carbon] hub links us all together
for that. They take the advice from industry. They should develop the
framework and go up to government about how to do it. Code 6 will
become code 5. Our view is that when that happens, we just build a really
good fabric house and put into a pot of money. We are a really good house
builder and that’s what we want to do. We don’t want to do energy.
This has led to a lack of urgency in researching and developing standardised zero
carbon offerings and gives the developer more scope to lobby for a scaling back in
regulatory guidance. Two of the developers quite openly admitted that they are
unsure about how to pursue commercialised zero carbon homes. HB2 said that he
is currently only able to deliver 60% zero carbon reductions within the current
business models and technical frameworks. HB1 highlighted this succinctly when
he said:
223

Respondent HB1 (Interview): We know about 2010 we’ve gone past that
we’re good to 2014. Beyond we don’t know. The [zero carbon] hub links us
all together for that. They take the advice from industry. We know how to
get to 60% beyond that we don’t know.
Ambiguity surrounding zero carbon approaches was also viewed positively.
Developers thought that lack of clarity would inevitably delay voluntary standards
entering into policy. It was clearly observed that commercial objectives were
rooted in achieving minimum standards mandated by building regulations and not
best practice so whilst standards were voluntary they lacked effectiveness. It was
also observed that delaying when changes to standards took effect was also
beneficial. As such the lag between when policy is implemented and when it is
due to take effect was viewed positively by commercial actors. This resulted in an
apparent lack of urgency in prioritising a zero carbon roll-out. This perspective was
well supported across actor groups. This was especially clear when EP said:
Respondent EP (Interview): Our aim is to meet the diluted [CfSH]
standards only. We only want to do what is required. Our impression of the
commercial market is that they [commercial builders] want to only do the
minimum to get them in line with the code and no more.
As a consequence of these perspectives and because the housing model went
beyond the minimum standards, justifications to price rises and complexity were
considered avoidable at present. As such an design, which required changes
beyond the remit of current policy and regulation, would be unlikely to gain traction
before changes are mandated, delaying any roll-out of zero carbon design.
Respondents views of policy mainly focused on economic policy. SB3 and SB1
viewed reliance on subsidies to support a business case negatively and based this
on historical inconsistencies in policies and unscheduled changes to tariffs. They
also considered ambiguity in policy to increase risk. This was also a view shared
by the medium developer trying to maximise the economic gain to keep their
development viable.
224

7.6 Issues with skill sets, roles and responsibilities
In combination with cost, demand and risk issues, there were persistent fears over
novel technologies and construction methods demonstrated. A lack of historic
construction data for the optimised design added to the risk profile, especially in
areas such as overspend on budgets and construction delays. Whilst overspend
clearly correlates to profitability, delays to the construction phases also affects
returns by delaying the disposal of assets. As capital is committed early on in the
development process and cannot be realised until the disposal of the asset, this
can have pronounced effects of investment returns (Byrne, 2005; Birrell & Bin,
1997; Wilkinson & Reed, 2008). The Callcutt report considers the ability to
mitigate this to diminish as construction complexity and novelty increase. Callcutt
(2007) also added that novel construction techniques increase the risk of
component failure and thus costs for post construction rectification. Ball (2010)
confirmed this, suggesting tried and tested methodologies have led to the current
housing market enjoying lower risk to other developments; this may not be so for
zero carbon development. As such these were the main issues the design
methodology set out to overcome, however, many of these risks were still
perceived to exist.
Key issues in the literature surround the readiness of the market to create or
absorb innovation into current competencies. The research by Osmani and
O’Reilly (2009), Goodier and Pan (2010), Heffernan et al., 2012 highlighted
concerns within the construction industry surrounding skills and capabilities, with
knowledge gaps for installing new technologies or using modern methods of
construction a particular concern. The respondents in this study highlighted there
were the significant issues regarding skills but these mainly focused on the
overlapping of roles and moving beyond their core competencies.
The commercial builders focused on what they considered their perceived roles
and responsibilities to be and contrasted them with what they considered zero
carbon designs to require of them. They felt their role as house builders should
focus only on the building fabric and improving energy efficiency as this was their
core business. The optimised zero carbon design forced them to take
225

responsibility for energy generation which they considered beyond their skill set,
they did not feel comfortable with high levels of renewables.
This led to a consensus across stakeholders that integrated energy solutions
within zero carbon houses equated to a shift in business practice, one which
detracted from each core supplier capabilities and amounted to a blurring of their
roles i.e. house builders did not want to become energy providers, energy
providers did not want to become involved with managing building fabric
demands. HB1 summarised this point when he said:
Respondent HB1 (Interview): We want fabric only solutions….. We [want
to] just build a really good fabric house. XXX [energy provider] are doing a
desktop study for us to see how far above we can get if we put PV on top.
Then if we get to 100% this can be given to an allowable solution provider
or maybe we go down that route depending on cost. But if it benefits XXX
then they can take it onboard. They want to line up with a builder, we want
to give it over to an energy provider so we work together that way. We don’t
mind using some renewables. We will build for solar gain, and can put on
solar thermal that’s ok. We don’t get into energy provision there.
Respondent HB1 (Interview): we want to be XXX home not XXX energy
provider. We want to work with allowable solutions providers. We go to
level 4 and just pay somebody else who provides allowable solutions. If the
house building community puts money into a pot – 5 grand a plot 100,000
homes a year, what’s that 50 million, give that to someone else to leverage
that up to 250 and apply solutions to existing builds or elsewhere. The
developer does not want to do it.
The issues with roles and responsibilities also highlighted a lack of desire to span
boundaries into areas that were considered better served by others in the supply
chain. The respondents highlighted that their business model favoured
consolidating existing corporate strategy rather than diversification. One
respondent did reveal a preferred alternative strategy to improving the energy
generation capacity of buildings which unfortunately did not support the economic
rationale of the optimised design. His intention was to focus on bringing down the
226

cost of a Code 4 building and adopting a fabric only approach. He did not want to
incorporate renewables at all. Instead their preferred alternative was to pay a tax
to offset the carbon related to energy consumption. This tax would, in their
opinion, remove any onus on them to install renewables. The renewables
commitment would be outsourced to specialists who would develop this field
allowing everyone to focus on their perceived core competencies. These
specialists would be funded out of the taxation. He preferred this approach even
though it would affect profit negatively as it would remove the need to develop
new skills or diversify. When interviewed HB1 commented
Respondent HB1 (Interview): put 2 grand a plot into a pot maybe use that
to improve existing housing stock. Taxing us that way instead…It’s no
sense driving us to make stuff that can’t be bought because of price.
The large energy provider’s views did not support the house builder’s perspective.
She viewed renewable energy technologies in homes on the large scale as
detracting from to their core business goals. An overriding factor from EP1
seemed to be that she did not view promoting renewables on homes as a core
business objective for their domestic division and viewed focusing on ‘putting
wires in for buildings’ as their main focus for future R and D. She also felt that
there was insufficient consumer demand and that consumers do not actually want
to change to decentralised renewable technologies. As such she did not view
pursuing strategies to roll out renewables as giving consumers what they want.
She considered that if you put energy price rises to one side, consumers were
happy with the way the current system of centralised energy supply functions and
that generally consumers do not want to change this system. EP1 said:
Respondent EP1 (Interview): People do not want to live in houses with
heat pumps and such. It can be soul destroying to work on a project only to
have it rejected on resident issues. This is not something we actively
pursue. On new builds we want to put the wires in. Doing this better is our
focus.
227

7.7 Structural barriers
The literature review highlighted the need to include multiple stakeholders across
all levels of the MLP. Only by doing this can a detailed understanding of what
inhibits the commercialisation of innovative zero carbon designs be developed.
This pushed the field of study beyond concentrating on just national house
builders and extended to include the views of a wider field of study developed by
using the MLP. These issues are discussed in the next section.
7.7.1 Banking and valuation
One issue highlighted was based in a lack of understanding of the benefits of zero
carbon design in both the banking and valuation sectors. Many respondents from
other actor groups pointed to a critical need to address these factors before
attempting to commercialise zero carbon homes. The first of these issues
stemmed from a lack of established sales values and whether or not a sufficient
price premium could be commanded. These issues are central to the economic
rationale developed in conjunction with optimised design. Respondent T2 felt that
the problem was related to a need for new thinking in the banking sector. House
builders were equally concerned. They even considered that zero carbon homes
were potentially worth less on the open market. HB1 said:
Respondent HB1 (Interview): I’m not sure the people who lend really put
value on these types of things. I’ve seen valuations devalued for using
renewables.
This was corroborated by respondent A1 and A2 who said:
Respondent A1: We’re unaware of what value, if any, will be gained from
demand for eco-homes, it’s hard to ascertain what this hidden figure may
be.
Respondent A2: As this is so unique to the area my advice on final prices
can really only be based on instinct and assessment as oppose to accurate
market comparable valuing. We are unaware of what value if any will be
228

gained due to the demand for eco-homes…We [would need] to stage the
property release in small numbers and review the prices after each stage
release allowing us to understand the added value that purchasers may
pay.
The responses from A2 are somewhat encouraging as whilst he did not know how
to approach the sale of the case study development he did not dismiss the
possibility of higher prices being able to be charged. They stated that this would
have to be assessed during the feedback and sales programme for the case study
if it went ahead. The social oriented developers also brought the issues of valuing
zero carbon designs to the fore. They considered it impossible to get additional
sales uplift whilst the current valuation system was in place. They attributed many
of the issues to the RICS ‘Redbook’ standard which would not allow lenders to
take the economic benefits into account. They frequently referred back to the
valuation standard being a major stumbling block for the optimised designs cost
justification approach.
These points were also evident in comments and field notes from L1, SB2, PM
and GA1. In relation to the case study, follow-up meetings with SB2 continually
referred back to the lack of ability to leverage the economic benefits. Whilst SB2
were more willing to look at different models to make the project viable, he
considered the extra cost across the whole development to be a brake on
progress. He also considered it harder to obtain the required funding with the
lower profitability. Even so, SB2’s company persisted with the development
process, however, the field notes continually refer back to keeping potential
options open including exploring different ways to reduce the cost in line with the
specification, such as through external funding of the PV. SB2, thought that this
would mitigate issues preventing the economic model being accepted and would
reduce build costs enabling more sources of finance to be available. However, as
pointed out by GA1, this would also prevent the life cycle cost benefits being
realised by the customer and unpick the zero carbon – zero bills model.
In analysing the responses it became clear that a knowledge gap in the valuation
sector existed. Some respondents in this study considered bringing valuers’
229

knowledge of zero carbon economics up to level of this research project essential
to developing a price premium for a zero carbon home. With a price premium
considered essential for cost justification by national house builders creating the
knowledge base to allow for higher valuations is critical to the viability of the
optimised design. National house builders will not commit to commercial roll-outs if
they cannot protect their profitability when committing to higher capital cost
designs and buyers requiring mortgages cannot purchase higher cost homes
without valuers first applying a premium to the design. This wider structural
‘roadblock’ is a critical issue to solve before commercialisation of the optimised
design can occur. This was observed in both the correspondence from developers
and the interviews with house builders, lenders, and green architects. The extracts
below illustrate this point.
Respondent SB2 (Correspondence): Banks and valuers cannot
incorporate or capitalise on the ongoing costs of a home when deciding on
mortgage valuations. This is because the RICS red book does not sign off
on them. You need to take the cost model to RICS and get a chartered
surveyor with professional indemnity to sign off on the capital value of the
savings over a typical mortgage life and then mortgage values can
understand and reflect the benefits of this design.
Respondent HB1 (Interview): We need to educate valuers to recognise
these sorts of thing, take into account sustainability features that sort of
thing. Otherwise you cannot charge more. You’re competing with cheaper
to build designs and relying on people to demand more.
This problem resides in the wider systemic arena of the house buying industry and
stretches beyond the bounds of design improvement and demonstrating life cycle
costs. This is due to the fact that a house cannot be financed for higher than the
mortgage value, regardless of the overall cost savings, unless a surveyor gives
that value. Based on the responses in this study the only premium for energy
efficiency key house builders would be comfortable with, or a lender would even
consider, would be around 2-3%. In the case of the optimised design this is
considered to be below the premium required to make a zero carbon home
230

commercially attractive when increased build costs and perceptions of risk are
factored in. A premium of 10% at least would be required to be comparable to
traditional builds.
The respondents also highlighted a lack of understanding of the economics of
zero carbon housing within the banking industry when is came to obtaining project
finance. These issues were highlighted as especially inhibiting for medium sized
developers. The respondents suggested that the banking sector lacked an
understanding of the economic advantages of a zero carbon dwelling over that of
a traditional building and did not appropriately account for this in lending criteria.
The medium builder, MB1, felt very strongly about this. He indicated that banks
did not understand why a developer would go for a project that returned less than
another scheme on the same site, claiming that all national house builders
understood was maximising profit and minimising risk and that funding zero
carbon developments would be too difficult.
Respondent MB (Interview): I need to achieve 25% profit, which is
chunky, but when you are put before these banks that is what they are
looking for especially when they are not sold on all this code 6 which they
think is still pie in the sky stuff. So I understand it…. My financial advisors…
they would suggest to go back to something more standard…put in for
planning again as you could end up with far more at the end. They don’t get
it.
MB’s response also suggested that when obtaining finance the returns required by
banks for this type of development could be as high as 25%, more than double the
project return of the case study. It was the view of one respondent that because
banks are not sympathetic to the financial benefits of the model it would not be
possible for them to obtain funding for this project. Funding from traditional
sources was therefore considered to be the major barrier preventing medium
sized developers from being able to pursue zero carbon developments.
Respondent MB (Interview): funding is key for me. I have to do what I
can get funding for. What the banks will give me. I want to do this type of
development, I really do, but it got to be what I can get funding for.
231

This respondent also highlighted other structural issues. National builders’
business models were considered too rigid to be able to adapt to new market
approaches or to be able to realise the benefits of innovative design. In
combination to this rigidity, respondents also viewed the national house builder
dominance as strangling the industry and restricting innovation.
Medium sized developers also viewed large scale builders and industry cost
structures as too restrictive to allow smaller developers to effect change, which
meant creating zero carbon developments incredibly hard, relying on highly
environmentally aware entrepreneurs to develop the market.
Size and scale of developer also had an affect on the viability of the optimised
design. Whilst smaller scale developers were generally more receptive to the zero
carbon designs and development models as a method for differentiation, this was
a marked contrast to large scale developers who focused on cost efficiency as a
method of competitive advantage. One of the medium sized developers, MB2,
considered that the project required an attitude to risk that only smaller developers
would consider. He thought that large national builders would not want to ‘innovate
as they went’ and could not fathom how it could be acceptable that things might
need to be adjusted on site. He also considered that the level of flexibility required
to innovate was beyond most large builders. This was succinctly put when he
stated that:
Respondent MB2 (Interview): …we innovate as we go along here. You
have to understand that it’s innovation. Things won’t always work straight
off and you have to be flexible. Prototype so to speak. So it’s more risky.
You have to have the appetite for it and be convinced people will buy it.
Both the medium sized developers also acknowledged, unfortunately, that to
progress beyond niche projects would usually require a large scale developer in
some capacity. As such the role that they could play in large scale build projects,
even though they were motivated to do so, would be limited. They considered that
the only way to do so would be to relax the design parameters which could
increase the likelihood of attracting a large house builder. However, it was also
noted that once a large scale developer was involved in a project, the designs
232

would bend and become what was most profitable and not what was best from a
carbon abatement perspective.
7.8 Illustrating the research findings
The responses analysed have shown the difficulty in challenging the existing
housing regime status quo, even when the design is modified to address key
stakeholder barriers. The persistent issues and ingrained attitudes presented
override many of the benefits achieved through the optimisation process. In order
to further illustrate these findings a case study was developed following a housing
development project from initialisation through the development process. Chapter
6 details the case study and uses it to illustrate the findings from chapter 5. It
brings the findings together from both chapter 5 and 6 to conclude this section of
the research.
233

Chapter 8
Case Study Research: Contextualising the Results within the Development Process
8.1 Introduction
The objective of this section is to illustrate the empirical research presented in
chapter 5 so far and link the understanding developed back to the literature. The
results from the case study research are presented by using the 8 development
stages adapted from Wilkinson and Reed (2008).
8.1.1 Initiation phase
The initiative phase for this project began in October 2011 when the existing
development appraisal for the case study site was updated to use the optimised
design. The development appraisal was then distributed to a selection of
commercial house builders.
One of the main benefits intended by the optimised design in the initiation phase
was to increase demand to build the project by commercial builders. The impact
the modified development appraisal had was observed through improved
commercial viability which manifested itself when further investigation by
commercial stakeholders occurred. One of the key differentiators which triggered
further evaluation was the ability to market homes based on the offsetting energy
bills as opposed to marketing them purely on environmental grounds. This
improved investor confidence and was recognised as an innovative way to justify
higher capital costs. This added benefit meant that the development was not
dismissed as too innovative or rejected straight away by some investors and clear
indications were given that the development would be further analysed to
ascertain its viability. Initially, the first impressions of the development using the
optimised design were positive and expectations of the model leading to a
completed development were raised. Unfortunately many of the benefits used to
raise expectations were eroded by wider market issues and by a lack of
234

comparable profit margin to traditional builds, confirming some of the issues
highlighted in the interview and observation process. These issues arose as the
project progressed through the development process and are discussed in more
detail in the subsequent phases.
8.1.2 Project evaluation phase
The second stage in the development process is the project evaluation stage. This
is considered to be the most important stage in the development process. This is
because during the evaluation stage key influencing decisions are made which
define the process and the type of development to be built. It is where the critical
cost and economic characteristics of the design methodology become increasingly
important (Wilkinson and Reed, 2008). Cost based issues were identified in both
the literature and the interview and observation study as some of the most
business critical issues (Ball, 2010; Goodier and Pan, 2010; Zero Carbon Hub,
2009).
The first year of the study program between September 2010 and October 2011
was spent optimising the design and reducing the build costs through the design
philosophy developed. The optimised design attempted to create a home that was
comparable to a traditional build in cost, however, the design developed did not
manage to fully offset all the additional build costs. The increased technology and
material costs were, however, significantly reduced in comparison to previous zero
carbon designs and the cost premium was significantly lower when compared to a
traditional build. As detailed in the results chapter, the cost premium, after material
substitution and integration was accounted for, was only £10,244 (£72 /m 2). The
design methodology, from an evaluation stage assessment perspective, had clear
cost benefits against other zero carbon house types. Unfortunately, the empirical
research conducted with the stakeholders demonstrated that any increase in build
cost over traditional builds was considered undesirable by national house builders.
This became clear in the case study when the profit margins in the development
appraisal were frequently benchmarked against standard build projects. The
reduced opportunity cost from investing funds into the case study development
versus a standard build became a major hurdle. What started to become apparent
235
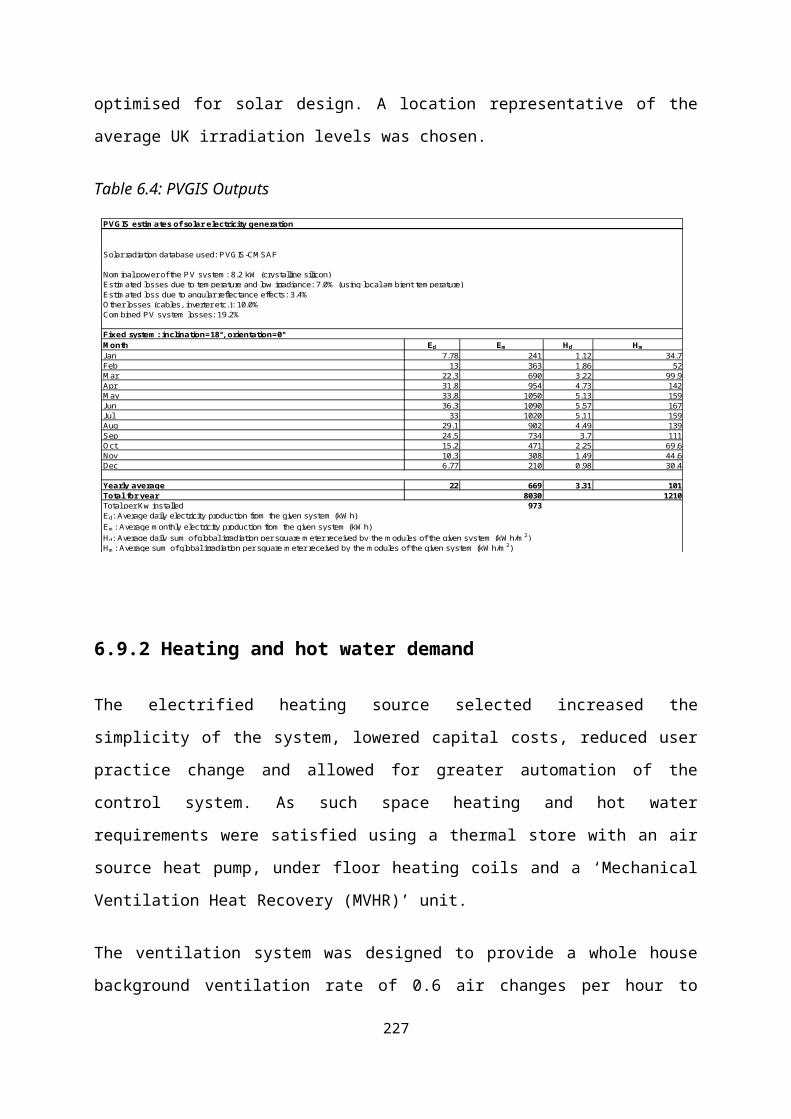
was that while the design methodology created the opportunity for it to be
considered further, it would only take preference when the investment options
were between zero carbon options and not when traditional development options
existed.
Another partial success of the optimised design observed during the case study
was that, prior to October 2011 when the case study was updated with the
optimised design, the project had not achieved funding during the preceding four
year period. When the initial financial evaluation was conducted using the
optimised design it showed this development to be viable under the new design
parameters. This evaluation passed the initial due diligence tests of a more
socially oriented developer who was prepared to fund the full planning submission
based on the initial financial analysis. This means that the design could be seen
as a partial success at this stage. However, in late 2011, the scenario changed
again. This was when the council clearly stated its intention to only allow a zero
carbon development to be built. The council was keen to develop a landmark
housing scheme to spearhead their low carbon strategy and pushed for maximum
decarbonisation. During this period, between November 2011 and December
2011, the large commercial builders decided not to progress with the case study.
After the new year in 2012, only the socially oriented and medium sized builders
were still considering building the project and the main commercial builders had all
rejected the project as either commercially unviable of not within their
development remit. This was attributed to a number of reasons, outlined in
Chapter 7, but for the remaining commercial developer the inability to mitigate
development risk by having a fall back option of delivering a lower specification
build if required was cited. This also became an issue for the socially oriented
developer, however, even with only one developer looking to progress the project,
further progress was still made. This was until the tight design brief was cited as
an issue again. What occurred as the development process progressed through
the evaluation and detailed costing stages in 2012 was that additional cost
constraints were identified. Although the cost issues originated from factors
outside of the design methodology (such as additional ground work costs,
changing profit goals, house price stagnation and issues with funding sources) it
236

did demonstrate that national house builders do have a basis for being wary of
high capital cost developments. This is because a traditional build development
would have had more scope in the budget to absorb these unforeseen cost
increases than was achievable using the zero carbon development plan. Whilst
the design methodology reduced costs and got the development to progress
further down the development process it also confirmed that it is still more risky to
pursue a zero carbon development than traditional builds. This clearly manifested
itself as the decision process for the case study unfolded. This lack of progress
was attributed by the developer to the narrowing down of the project scope very
early on in the development process. They felt this restricted the use of lower cost
development options further down the line, increasing risk. As such the case study
supported the empirical findings from the interview and observation study that
tying the developer into one housing methodology early on does indeed open the
developer up to more problems with viability. This point substantiates points raised
by Reed (2007) and Wilkinson and Reed (2008) when they identified that the
market should be giving greater attention to building flexibility into projects to meet
changing market demands and not pursuing a single development typology
(Reed, 2007; Byrne, 2005; Wilkinson and Reed, 2008).
8.1.3 Acquisition
The next phase in the process is acquisition, however, this has very little impact
from differing methodologies so is not analysed here.
8.1.4 Detailed design and costing
Following on from acquisition, is detailed design and costing. The main impact of
the optimised design was not specific to the design methodology, but related more
to zero carbon developments in general. The literature indicated that developers
favoured working up a number of initial ideas with a professional team to develop
different options to maximise return within the design brief (Reed, 2007; Byrne,
2005; Wilkinson and Reed, 2008). Whilst the design objectives developed in this
study maintain some flexibility by not prescribing specific technologies, they still
impose the need to meet all energy requirements via zero carbon energy sources.
237

As such the methodology developed in this research excludes lower levels of the
code for sustainable homes or traditional housing designs from consideration. In
the case study this was observed when investor and commercial builder actors
reacted to the constraints of design aspects of the development. The fact that the
development was designed in detail before they were involved in the process
restricted their ability to put their own stamp on it. Additionally developers did not
have the option to reduce the design standard and this restricted the number of
potential funders the development appealed to. When the effects of the planning
restrictions, reduced flexibility and increased costs were combined it became
apparent that the case study would only appeal to certain developers and not the
mainstream commercial builders.
The methodology did, however, bring some benefits to this development stage.
Reed (2007), Byrne (2005) and Wilkinson and Reed (2008) state that during the
design process developers’ need for increasing cost certainty increases as a
project progresses. The further along the process the development gets, the
greater the need to finalise initial cost estimates becomes. This enables a well-
developed financial appraisal to be created that is suitable for investment
purposes and to enable negotiations with building contractors. As most traditional
build projects progress, design and costing gets more detailed and provides
greater certainty to the development appraisal, however, the methodology
proposed here provides a large degree of certainty early on as it broadly defines
many cost items at the outset. The design methodology, for example, can then let
Quantity Surveyors focus on sourcing cheaper prices for the core elements rather
than researching alternatives. Another benefit is the design standard means that
the design should vary little throughout the development process. The result was
that the final product broadly reflected the initial concept due to the design
constraints. These benefits were well illustrated by the case study.
Firstly, the main building fabric and mechanical and electrical costs (referred to as
shell and core costing) were defined early on as part of the design optimisation
process. This enabled fairly accurate costs to be entered for these items into the
initial development appraisal developed in October 2011. This enabled the
developers to take an early decision on viability at both the initiation and
238

evaluation phases. Secondly, the costs defined early on remained relatively
constant during the development process which improved cost certainty for the
developer. The socially oriented developer who progressed the development
furthest noted the stability of the shell and core costing throughout the
development process. This was contrasted by the variability of other costs in the
project as the case study progressed through 2012. Costs outside of the design
methodology varied significantly during the detailed costing phase during the 2012
to 2013 period. Costs such as substation works, ground works, incoming services
costs, earth moving and civil engineering varied significantly from the initial
estimates used in the project evaluation phase and these jeopardised the project
viability. Unfortunately these escalating costs outside of the optimised design
methodology forced a re-evaluation of the shell and core costs in an attempt to
offset the other price rises. This caused the project to stall during most of 2013
whilst different funding options and ways to reduce the predicted over spend were
investigated in an attempt to meet the profit goals of the project. New developers
were also sought in an attempt to sell the project on during this period as the
social developer’s ability to develop the project was impacted. The impact of the
optimised design on project viability is thus open to interpretation. From one
perspective the shell and core costs were relatively stable and had the other costs
outside of the design philosophy not varied the project would have maintained
viability. This is a significant finding as the risk from choosing the optimised design
methodology did not affect the final project costs during the detailed costing
phase, a benefit that can be directly attributed to the design philosophy. An
argument can therefore be made that the risk profile was not affected by choosing
the zero carbon design. The fact that the price rises identified in the case study
would have related to any dwelling type on the site support this argument.
However, from the opposite perspective, the higher costs involved with the
optimised design, about £10,000 per home on across 90 homes, meant there was
reduced headroom in the appraisal to absorb these costs. Thus the counter
argument was also made. The case study particulars i.e. the lower house prices in
region, the lack of price premium for the zero carbon homes, the developer profit
goals and the escalating costs outside of the optimised design process meant that
the project was becoming less attractive at the end of the detailed design and
costing phase than at the earlier stages. However, the developer still decided to
239

proceed with the planning application. This was partially due to the money already
invested in the detailed design and project development up until this point. It was
also based on the fact that the land value would increase with full planning
permission granted. This could open up other sources of capital or enable the
project to be sold on.
8.1.5 Permissions
The next stage in the development process is obtaining the relevant permissions.
Obtaining planning permission can be quite complex and involves legislation and
local knowledge of a particular planning authority. Developers may enter into
contract with the local planning authority as part of the planning agreement
negotiated within the planning approval. These conditions often impose additional
development costs which can affect the viability of a scheme. Zero carbon
developments can improve the potential for planning to be granted as the
developments can help the local council meet several additional objectives, such
as reducing fuel poverty by offsetting energy bills, significantly contributing to
carbon reduction, and helping meet renewable energy targets. In turn this can
reduce additional planning conditions. The case study development demonstrated
this clearly.
Planning for the site was easier to obtain for the case study. The local authority
had a low carbon strategy, employment targets and fuel poverty targets. They also
considered that a development built to this standard would become a showcase
development. Due to these factors they considered the development to able to
bring benefits to all these areas and as such the development gained significant
top level backing. It also meant that the project became tied into meeting the
highest levels of the code for sustainable homes and this became a condition of
planning. In return the development benefited from reduced Section 106
commitments and from reduced land costs. The section 106 commitments were
focused on improving public transport and promoting sustainable transport such
as car clubs.
240

The ethos of the scheme also helped to overcome some objections to the project.
One of the main objections was the impact that the additional homes would have
on traffic. The argument was made that the development would attract more
environmentally aware buyers and would actively promote sustainable and public
transport. Combined with the section 106 commitments to reduce travel impact
and promote sustainable transport, the argument was also made that the zero
carbon development would have a lower impact on traffic than a standard housing
development.
As such it is possible to conclude from the case study that zero carbon
development can benefit developers by increasing the likelihood of gaining
planning permission and also by reducing the burdens of certain planning
conditions such as section 106 contributions. These issues also have important
implications on project viability and in the case of the case study, provided
financial benefit to the development appraisal.
8.1.6 Commitment
The next stage in the development process is commitment. Once all the
preliminary work outlined in the previous stages has been completed the
development becomes liable for commitment. Many developments are re-
evaluated at this point to make sure that there have not been any significant
developments that may jeopardise the financial viability of the project, such as
changes to housing values, economic changes, or changes to the cost of finance.
The case study was re-evaluated at the end of 2013.
Responses from the national house builders during the interview and observation
study showed that they felt zero carbon homes increased their exposure to
changes in the market demand, house price changes or economic changes
making zero carbon developments more risky. Indeed some questioned whether
the market even existed for the optimised design at a commercial scale. These
perspectives and opinions started to manifest themselves in the case study. What
was observed in the case study was that the combination of changing profit goals,
cost increases outside of the shell and core costs and difficulties in achieving
241

funding based on revised development appraisals meant the case study was at an
impasse. It was now over 2 years into the project and the social developer had
already committed a significant capital investment to get the project to this stage.
However, they could not progress the project any further. The problems with
meeting the profit targets required by their investors and an inability to secure
other sources of finance meant that the project had still not been fully committed
to. In fact very little progress had been made despite a number of board, investor,
and contractor meetings. Different building systems were examined by outside
quantity surveyors and a more viable way to meet the code 6 commitments had
still not been found.
To get to a stage where all the required elements were in place to enable
commitment and then implementation to occur forced the developer to re-examine
the potential for value engineering. The developer considered the best way to
steer the project back to commercial viability was to reduce the building
specification, however, the planning permission did not allow this. The result was
the development continued to stall for a prolonged period whilst the options were
assessed.
It is hard to untangle the many elements and attribute drivers or barriers of the
optimised design with their contribution to the impasse during this stage. This is
due to the potential to view the situation from multiple perspectives. For example,
the fact that another lower cost way to achieve a development that met code 6
standards was not found supports the rationale the optimised design is one on the
most cost affective design methodologies for creating a zero carbon development.
This, however, was also construed negatively as even though the costs were
lower the development was still not commercially viable. The planning benefits
that aided in achieving planning and reducing section 106 costs realised by the
optimised design were now inhibiting the development by preventing cost
reductions from scaling back the design specification occurring. Whilst this is
encouraging from an environmental perspective in so far as the design ethos is
preserved by the planning granted, the overall viability of the project is in jeopardy.
The developer could not find additional sources of finance to employ a main
contractor to build the project, even though the project still generated a profit, as
242

the profit margin was now too low. In early 2014, after almost 18 months of
stagnation, the developer attempted to sell the project to recover their investment
and progress the project to its implementation phase. During this period the
project should have been breaking ground.
The developer will likely look at their experience of the project negatively. In
respect to future developments it is highly unlikely they will seek planning for such
highly innovative housing designs.
8.1.7 Implementation
Implementation occurs when there is a commitment to a development and building
type at a defined cost and the build program is accepted which spreads the costs
of the development. Project management is critical at this stage in order to
coordinate the design and processes to bring the project in on time, budget and
specification. By the last quarter of 2014, the case study had still not progressed
to the implementation stage, almost 10 months after the site work was scheduled
to begin, and 6 months after the first house was scheduled to be completed on
site. Due to this the discussion of the implementation phase for the case study is
based on the reasons why implementation did not occur.
Risk played a key role as the developer considered there to be some increased
risk from construction delays from the additional technologies. They considered
the renewable energy systems to require specialist accredited installers to
commission items such as the PV and requested that the heat pumps be
commissioned by specialists. As such there would have likely been an impact on
the construction programme but this cannot be confirmed. In contrast to this some
on site trades were removed through the integration of the thermal mass into the
ceiling plane and the substitution of traditional materials and this may have offset
these other potential delays. The offsite manufacture of the framing components
could be called in on a just in time basis which could also have reduced time and
storage needs on site. An additional benefit of this would have been reduced
financial commitment during the implementation phases and this was indicated on
the revised development appraisal. This was because the components could be
243

purchased just prior to their requirement on site which meant that the level of
borrowing was lower. Additionally the houses were design to be all electric
meaning that there was not any requirement to bring gas to the site which was
also considered to bring a cost and time saving. The development appraisal also
indicated that a short build period was proposed, reducing financial commitment
during construction, incurring less interest, and reaching the disposal phase
quicker.
Unfortunately it was not possible to test these assumptions. The project may still
progress further as buyers for the project are being sort out but the future status of
the development is currently unclear. Whilst this was unfortunate, as it would have
demonstrated what additional drivers could be leveraged by the design, it is also
somewhat revealing of the mindset of developers when it comes to highly
innovative projects. The delays to the project were thus not caused by the design
or the construction method but by a lack of commitment and the abject need to
continually look towards further cost savings. Unfortunately it is not possible to
draw any further illustrations from the case study for this phase.
8.1.8 Disposal stage
The final process is the disposal of the built assets. Many developers seek to
ensure owner occupation occurs early on by pre-selling off plan. This can
significantly help de-risk a project and assist in obtaining funding. This was noted
in the interview and observation study. As such market potential was identified as
an issue in both the empirical research and literature, mainly due to the
perceptions that only green motivated consumers want to live in environmentally
efficient homes (Osmani and O’Reilly, 2009; Zero Carbon Hub, 2009). Key
authors attributed this to energy efficiency and low carbon living being just two
factors that encompass a range of purchase decisions (CABE, 2005; RICS, 2010).
The empirical research responses from national builders highlighted that they
were not convinced the commercial market existed yet. These perceptions clearly
affected the case study. By the end of the research period none of the optimised
designs were built for commercial sale and as such it is very hard to comment on
the impact the design and economics could have had on built asset disposal.
244

One metric that was able to be tested using the case study was the developers
pre-selling strategy which began after planning was achieved. This strategy
demonstrated that public engagement with the concept of zero carbon - zero
energy bills homes could be a decision making factor. This is demonstrated in the
way that, because the properties were significantly different to alternative
properties on the market, the local residents appreciated both the environmental
and economic benefits. They also placed significant value on reduced and
eliminated energy costs. This was evidenced in the significant numbers of early
expressions of interest and the need to set up a procedure to convert these into
allocated plots on plan. In relation to the RSL properties two RSLs agreed to
purchase the social housing on the site under standard terms, demonstrating that
RSL demand existed for the properties as well as private for sale demand.
Unfortunately, in both cases, the properties were not premium priced due to estate
agents not incorporating the life cycle cost benefits into the pricing model, a fact
supported by responses from the actors in the interview and observation study.
Because of this, the effect of consumer willingness to pay for the life cycle cost
benefits can not be assessed, a core issue to commercial viability.
From the case study it was possible to demonstrate that expressions of interest
and allocated plot sales can de-risk a project. This is based on demand being
demonstrated for optimised designed properties. At the end of 2014 this fact
enabled the project, which stalled significantly during the commitment phase, to be
re-evaluated to look into other ways to make the project viable. Another effect the
pre-sales had on the developer was that it forced them to commit to using the
optimised design as pre-sales were only likely to be achieved based on the
optimised design’s benefits.
A key outcome to draw out of the disposal stage is that, even though none of the
homes were built or sold, a major determinant of development success is the
ability to meet the desired disposal price. As the early expressions of interest for
plot reservations demonstrated, market value for the properties could be achieved
and many developers consider that achieving asking price is a determinant of
success (Wilkinson and reed, 2008). Thus, even if the properties were not
premium priced, they were not devalued for being innovative. This slightly
245

assuages barriers noted in the interview and observation process that alluded to
lower prices being likely. Unfortunately the benefit of achieving asking price is
somewhat undermined by the fact that a price premium needs to be commanded
to stimulate commercial builder interest.
Due to the delays in the project it was not possible to assess the overall success
of the project any further. This is because the financial success of the sold
development needs to be assessed against the initial appraisals and cost plans.
As the project is not yet built or fully disposed it was only possible to assess the
success of the methodology by comparing initial envisaged sales prices against
presales demand for properties. At the time of concluding this study a buyer for
the project is still being sought and the project has not yet reached implementation
stage.
246

Chapter 9
Discussions and Conclusions
9.0 Concluding the empirical research phase
Initiating a commercial roll out of zero carbon homes is problematic, especially in
the short term. Integrating the optimised zero carbon home into commercial
developer portfolios in the mid term seems equally unlikely given responses
relating to risk and a distinct aversion to becoming first movers in the market,
illustrated in the case study example. Given the lack of innovators in the national
house building actor group, commercialisation by these stakeholders is unlikely to
occur. This is further exacerbated by respondents who consider that the market
needs to move as a whole for innovation to be successful, especially given the
dilution of the toughest standards in zero carbon housing policy.
In relation to investment and returns, the returns achievable by zero carbon
developments are not considered to be particularly attractive to commercial
developers. When compared to traditional build developments the lower returns
combined with additional risk made the case study development unviable from
many commercial stakeholder perspectives.
It is possible to conclude that zero carbon development needs to take a long term
view to integration as opposed to radical changes that try to fix the problems via
design solutions as obtaining regime level buy-in is problematic. Whilst the longer
term potential has been identified as possible within current market practices a
somewhat inhibitive catch 22 is holding the sector back. This is based on the
optimised design demonstrating commercial potential in theory but it requires the
viability to be proven first. This will only be achieved once a completed large scale
development goes ahead which results from the case study have shown to be
improbable. As such the industry is at an impasse. Medium sized developers may
provide the best option to remove this impasse, however, this is not without its
difficulties. The potential exists because medium sized developers’ risk profile is
different to larger national builders, however, medium sized developers are
247

restricted by the availability of project funding. This wider issue identified from the
funding stakeholders interviewed means that even though the desire may exist to
build more innovative homes the options for funding via traditional routes are
limited. This creates a new barrier to implementation.
Based on the responses analysed in this study cost will continue to be the major
hurdle for commercialisation. Respondents almost unilaterally agreed that the
answer to initiating a zero carbon roll-out is to build high environmental
specification homes for the same cost as building regulation homes. This cost
parity would offset some of the risk concerns of national builders and may
encourage market differentiation. Unfortunately cost parity was not achieved by
the optimised design. To achieve cost parity economies of scale will be needed
but without buy-in from large national builders, it will be near impossible to drive
sufficient volume through the sector to obtain them. Due to this, and the industry
cost structures, it means it is unlikely the optimised design standard will become
commercially viable before 2016.
This issue was further impacted by policy based concerns. A perceived lack of
consistency and clarity in the regulations and standards led many commercial
actors to believe that regulatory changes would enable them to be able to meet
future standards in an easier way. This would negate the need for radical
departures from established ways of delivering homes. Regulation was used by
many actor groups as a way of justifying a more cautious approach to innovation,
citing the fact that in real terms code 4 regulations will not affect them until 2016
and zero carbon regulations will not affect them until around 2020. Thus, even
though low carbon regulation could be considered imminent, the effect of
legislation is not. When the recent scaling back of the zero carbon definition is
also incorporated it seems to provide justification to the industry led perspective.
Given that during the research period very little headway had been made to prove
that commercial scale zero carbon developments under the older zero carbon
definition was possible this provides evidence to support this. Since the conclusion
of the research this has been borne out in reality with the removal of the code for
sustainable homes in 2015 and a reworking of the zero carbon definition to make
it easier to meet.
248

It is possible to conclude that, given current national builder attitudes towards zero
carbon design and innovation, the market is likely to continue to stagnate. More
worryingly, given the changes in definition best practice may never be achieved at
a commercial scale as national builders will revert to the regulatory definition only.
As such the role for the optimised design beyond the remit of small scale
development is particularly limited as neither commercial stakeholder attitudes or
policy will support such a design.
The research also identified wider systemic concerns, particularly in the valuation
system, which impact both developers and purchasers. A key concern identified
was based on the premiums required by developers for zero carbon homes to be
viable. These premiums were considered unobtainable and this has the potential
to make zero carbon development loss making under standard commercial
models, unless subsidised or de-risked. This is due to a variety of factors but
mainly due to:
The fact that the optimised design was considered a non-standard product
so it was not considered possible for them to be offered to the market at the
same price point
The fact that energy efficiency is limited to the impact it can have on pricing
and purchasing decisions
A lack of understanding in the market about life cycle cost benefits
An inability to capitalise on life cycle costs based on the current valuation
system
Local limits to house prices placing a ceiling on achievable values
The fact new homes are bench marked against existing house prices in a
region
A lack of desire to build innovative homes
This research also revealed that the issues surrounding zero carbon homes
created an unacceptable level of risk for national house builders. In order to fully
account for the additional perceived risk national builders require a higher rate of
return then generally possible using the optimised design.
249

Establishing demand was also considered prohibitive to the optimised zero carbon
design. Many actors questioned whether or not the market required such a
product and as such question the validity of pursuing such high levels of
innovation. They used the lack of established research to support the economic
claims or life cycle costing approach as a reason not to pursue the case study
development.
Whilst cost based issues were the most prevalent barrier cited across actor
groups, when the combined responses are analysed it possible to conclude that
the real issues relate to conservatism and risk. National builders want to build
what they have been building for a significant period of time and do not want to
innovate. Lending and funding criteria are based on existing models and what is
known in the market and this serves to protect the establish models, crowding out
innovation. As such new ways of justifying costs and developing new approaches
to business models are not being embraced. This significantly inhibits the desire to
commercialise the optimised design.
What the research conducted in this study set out to achieve was to establish if
commercial barriers could be overcome by innovation in design. What has been
shown by the findings is that even though designs can be optimised to reduce cost
barriers, residential cost uplifts can be justified and impacts on consumers
minimised; the market is not prepared to innovate to this level. This leads to the
conclusion that new ways of building larger scale developments need to be
investigated in order to break the control that the current regime level actors have
on integrating innovation at the commercial scale.
Removing commercial barriers from an optimised design approach alone is thus
not feasible given the resistance in the stakeholder groups and the inertia created
by tried and tested ways of doing. With this said change is not impossible, but the
speed of change and level of innovation will be far more incremental than
anticipated when developing the optimised the design.
The wider systemic issues in the lending, funding and valuation sectors both
restrict innovation and allow developers to persist with cautious approaches to
innovation. Thus, even when certain commercial barriers are overcome the new
250

issues identified allow the national house builders to slow down the rate of
adoption. These issues are beyond the scope of an improved design philosophy.
As such the barriers that span the political, economic and socio-technical context
create significant inertia that will prevent the optimised design being
commercialised in the short to midterm as barriers exist in all facets of
deliverability. Issues which will affect a commercial roll-out of the optimised design
can be summarised as:
Lower predicted levels of return to standard housing developments
Current industry cost structures preventing the cost methodology being accepted
Risk management practices inhibiting innovation in design and economic models
A lack of desire to become a market leader in innovation
A lack of research to support commercial levels of demand for the design
An aversion to influencing consumer choice in cost and pricing methods
Inability to price homes beyond current market rates even though the cost can be justified
A lack of understanding of the economic benefits of life cycle costing within the market actors
A lack of ability to commercialise innovation in life cycle costing within the finance and banking sectors
As a consequence of these findings the commercialised pursuit of a large scale
zero carbon housing market via the traditional market routes seems improbable at
best. The most likely outcome for the market is that policy will adapt to support
less radical approaches to solving the carbon issues in new build homes. This is
unfortunate given that the market requires clear and consistent regulation in order
to drive innovation through it. Until policy mandates change or the mindsets of
national builders change to allow different risk profiles to be pursued, the market
will not make a commitment towards complete decarbonisation. Instead, industry
will focus their efforts on opposing change and trying to reduce the impact of
legislative change which they have done successfully in the past. If instead the
251

planning process could be adapted to be used as a tool to increase the level of
sustainable development then it could improve the level of zero carbon
development. If this is done alongside tightening of traditional development
permissions it can be used as a tool to direct developers down a more sustainable
route. This could be used in conjunction with the building regulations to force more
sustainable development through the planning system. If this is not done then the
result will be incremental change only.
9.1 Revisiting the MLP: How did the MLP help and what are the future implications of using the MLP in this way?
‘This section is a post-research ‘hindsight’ reflection on the findings from the
literature review’. This research used the MLP as a framework to better
understand the problems faced by housing developers and zero carbon architects.
This use of the MLP shaped the research proposal, the development of the design
methodology and identified key stakeholders and areas for study. It was used to
contextualise transitions theory in relation to commercialising zero carbon designs.
This section examines how the analysed results relate back to the MLP by:
Analysing whether the MLP was useful in identifying areas for research
Analysing how the research can inform using the MLP in the context of zero
carbon housing.
Analysing how the findings can help future research
9.2 What was learnt from using the MLP to inform design decisions: Use of the MLP
The MLP was used to develop a picture of barriers and drivers to the
commercialisation of zero carbon homes and the roles the main actors could play
in overcoming them. This understanding was then translated into design choices
that could be taken at the innovation level to improve the success of an innovation
at breaking through to challenge incumbents at the regime level. As such the MLP
was used as a method of informing design of a novel zero carbon home.
252

The development of this informed design method enabled the incorporation of a
wider range of factors, stakeholders, social, political, environmental, technological
and commercial issues to be brought to the forefront when designing a zero
carbon home. This was especially pertinent when trying to address the question
posed by Williams and Dair (2007) of ‘Given such a strong policy drive, what is
stopping sustainable developments from being realized in practice?’ (pp136) ’This
section of the research reviews the technique of using the MLP as method to
improve design.
The MLP was used as a tool to identify how the main factors in the current socio-
technical environment could be used to create a house that could make a zero
carbon housing sector a reality. The MLP was not used as a tool for social
engineering but instead used as a tool to identify how existing instruments in the
socio-technical environment could be better leveraged.
The application of the MLP was focused on leveraging existing policy instruments
that are already in place whilst at the same time reducing socio-technical barriers
within the design process. The aim of using the MLP in this way was to see if it
could assist in designing a home that could shift the dynamic stability in the
regime towards a more sustainable trajectory by appealing to commercial
developer goals and reducing potential barriers. The MLP was also used to
broaden designer’s horizons to include wider stakeholders and actor group issues
into the design process. As such the MLP was used to identify stakeholders and
better understand the roles they could play in commercialising an optimised zero
carbon design.
The process of developing the MLP framework to inform the design of zero carbon
homes involved developing an initial overview of the current and proposed socio-
technical regime. This determined what the main characteristics of the system
were and what the desired end state system based on commercialised zero
carbon homes would look like. The aim of this process was to back-cast the end
state to the current one to understand the problems faced by designers and
developers.
253

The process highlighted that for an effective low carbon domestic sector to be
developed via niche housing designs, many changes and adaptations would be
required in the current system. It also identified that the political landscape
seemed to be moving towards supporting the future system through a number of
policies already in place and that working within this policy framework would be
crucial to commercialising zero carbon homes.
It also identified that fundamental changes to the aesthetics and usability of
homes would likely be required and the effect this could have on cultural and
consumer preference would need to be acknowledged in design. A preference
would be to techno-fix the solution without requiring significant user practice
change otherwise the socio-technical transition would be more difficult.
It identified that the importance of energy, renewable energy in particular, would
need to be viewed as culturally important by the mainstream public in order to
create a shared social goal. If energy was not a concern then demand would likely
be low. This would make combating inertia in the consumer stakeholder group
harder and thus restrict demand. It was used to identify that the way innovative
zero carbon homes would function economically would be significantly different to
the existing socio-technical system. Thus the likely impact on how homes are
valued, bought and sold to incorporate energy benefits into pricing models would
have to be considered. This would have commercial and social impacts on a wider
field of stakeholder and institutions than just national house builders, developers
and owner-occupiers. Finally the transitioned system would likely require new
interpretations on existing finance mechanisms and potentially new mechanisms
might need to be created. The impact this could have on the buying behaviour of
property owners and the role of financial institutions would thus need to be
considered.
All these factors have important implications for whether or not a technically and
economically viable solution could be created that was both commercially and
socially acceptable. They also have important implications for the ease at which
the design can be integrated into the current status quo.
254

Once these system characteristics were identified the future end state could be
back-cast to the current system to identify the changes required, who the key
actors are and what their main characteristics were. The MLP was then used as a
framework to further elaborate on these issues by categorising them and
positioning them at the Macro, Meso and Micro level. Potential drivers and barriers
at each level could then be identified and their impact on the design
characteristics assessed. Once these characteristics were assessed an optimised
design could be developed to potentially reduce barriers to implementation. This
analysis is detailed in the following section.
9.3 Using the MLP to inform design decisions: Macro-level drivers and barriers
The macro level shapes the niche level design process by applying pressure on
the regimes to adopt more sustainable practices. Whilst this affects all regimes in
the socio-technical system and not just the housing regime, greater environmental
awareness is a positive indicator to the direction the regime should take.
The role of the macro-level in shaping the design of zero carbon homes is
somewhat limited to creating the backdrop for socio-technical change as it is part
of and created by the constitution of the regimes. The key actors for creating a low
carbon backdrop for innovation within the housing sector were considered to be
supranational organisations, national governments and think tanks who could
influence the global socio-political agenda.
Policies created from the Kyoto Protocol, United Nations Framework Convention
on Climate Change, the Copenhagen Agreement, and the G8 and G20 can all
shape and be shaped by the regime level in turn, creating a more/ less conducive
environment for zero carbon socio-technical change. Stakeholders from the macro
level were considered outside of the interview and observation study but the affect
of policy on the regime was clear. The current political landscape was an
established backdrop within which the housing and energy regimes function now
and in the near future. Due to this the intent, if not the method, for low carbon
change can be considered to exist. As such the macro level can be considered to
255

be informing design only to the extent that national and supra national
environmental policy is providing stimulus for a change in market direction. Niche
level technology actors can thus consider there to be a macro level landscape
paradigm to innovate within. How this is to be achieved can only be considered at
the levels within the system; the meso-level and micro level. As such Macro-level
actors were not considered further in optimising a design for commercialisation.
9.4 Using the MLP to inform design decisions: Meso-level (regime level) drivers and barriers
Whilst innovation occurs at the micro–level, it is the meso level that is critically
important to developing a low carbon housing sector, evidenced in the empirical
research conducted in this study. In order for niche zero carbon homes to
challenge the status quo they must be able to challenge the incumbent market
actors who constitute the regime. Prior to the empirical research the MLP was
used to identify who the main actors for change would be within the socio-
technical system for the commercial residential housing sector. What was
identified was that the sector is dominated by around 100 private companies who
build in excess of 1000 properties per year and this represents over 75% of the
new build housing market by volume. As such it was critically important to engage
with national builders as they have a significant affect on the housing regimes
trajectory. The meso-level of the MLP was also used to identify other actors
groups who should be incorporated in the study such as lenders, estate agents,
funders and architects. The inclusion of these additional actors was essential for
elaborating on a wider range of issues and generating a richer field of study.
Further literature research on the meso level identified that the market builds what
it is comfortable with and most new build properties are not built to customer
specifications or best practice but are built to established design parameters. This
meant that developers were more important to include in the study than end users
because their level of control on what gets built is high. Central to developing the
design criteria used in this study was to identify how stable current practices
employed by national builders were. Unfortunately for zero carbon design the
major actors are considered entrenched and powerful. This includes actors in both
256

the incumbent housing market and the energy market regimes. Both the case
study and the interview and observation study highlighted where the main barriers
exist to designs that have been optimised to address barriers in these actors thus
why it is so problematic to create a decarbonised housing sector based on
innovative design models.
The research also illustrated why competing with, or integrating into regimes that
are characterised by a few central players exerting significant dominance,
technology lock in and entrenched sunk capital is so difficult.
What is clear is that the current commercial house building regime identified had
such a long-term focus on cost reduction that limited incremental innovation is
likely to persist. Whilst this focused the optimised design on improving developer
returns and using the minimum innovations/ technologies possible to satisfy the
design objective, it was still problematic to address this issue.
Key commercial actors were identified in the literature review as adhering to
current building regulations and considered zero carbon design to conflict with
other priorities such as cost saving practices. To address this the optimised design
was focused on reducing costs and leveraging existing policy/ regulations,
however, this was still not enough to trigger significant levels of commercial actor
buy-in.
Profitability was also identified as a national house builder objective. As such the
optimised design had to focus on ways to generate additional price justification in
order to make zero carbon design more attractive to developers than standard
buildings. Whilst this objective was incorporated into the study it was not possible
to offset all costs and a plethora of additional reasons why the optimised design
benefits could not be capitalised were noted in the interview and observation
study. Therefore addressing this issue still proved problematic.
Actors in the market and financial sub-regimes were characterised as having strict
risk profiles which were adversely affected by un-established markets and lower
profitability of zero carbon design. As such the optimised design had to reduce
257

developer risk. This also proved feasible in the design phase but problematic in
practice when the design was evaluated by commercial stakeholders.
One of the main benefits of using the MLP in this way was that it pointed towards
wider systemic issues that needed to be incorporated into the design process.
This was due to house pricing being somewhat outside of the developer’s control.
The research project thus needed to include more stakeholders. The desk based
research identified many actors/ groups across the levels of the MLP who could
affect the commercialisation of niche zero carbon homes. The key actors
considered in this analysis included amongst others national house builders,
energy supply companies, land owners, estate agents, consultants, housing
authorities, quantity surveyors, lenders and investors. These actors were identified
and positioned within the levels of the MLP and used to identify drivers and
barriers which could be incorporated into the design process to improve niche
level zero carbon design. This element of the research highlighted significant
findings such as the inability to pass costs on to the consumer and the need to
look into the accepted norms within surveying practices.
The meso-level analysis of the MLP also indicated that the public actor group
would be an important sub-regime. This actor group sets the cultural and
behavioural norms that a house is expected deliver. Any deviation from the
expected norms requires changes in consumer demand and as cultural habits are
stable, learnt and established over a long time they are hard to break. This shaped
the design methodology to focus on the need to create ‘compatibility through
design’ so that environmental improvement occurs without major changes in
consumer lifestyles (Hajer, 1995, Pickvance, 2009). Due to this, the technologies
incorporated in the optimised design needed to focus on increasing the levels of
‘fit and forget’ technology and reducing the requirements for user practice change.
The MLP analysis highlighted that it would be unlikely for natural spaces or cracks
in the regime to occur. Without such cracks niche innovations that go beyond
modification are unlikely to have any significant effect on the status quo. A
significant challenge for the design philosophy was to create radical innovation in
the carbon output of the designs without creating radical innovation in the design
258
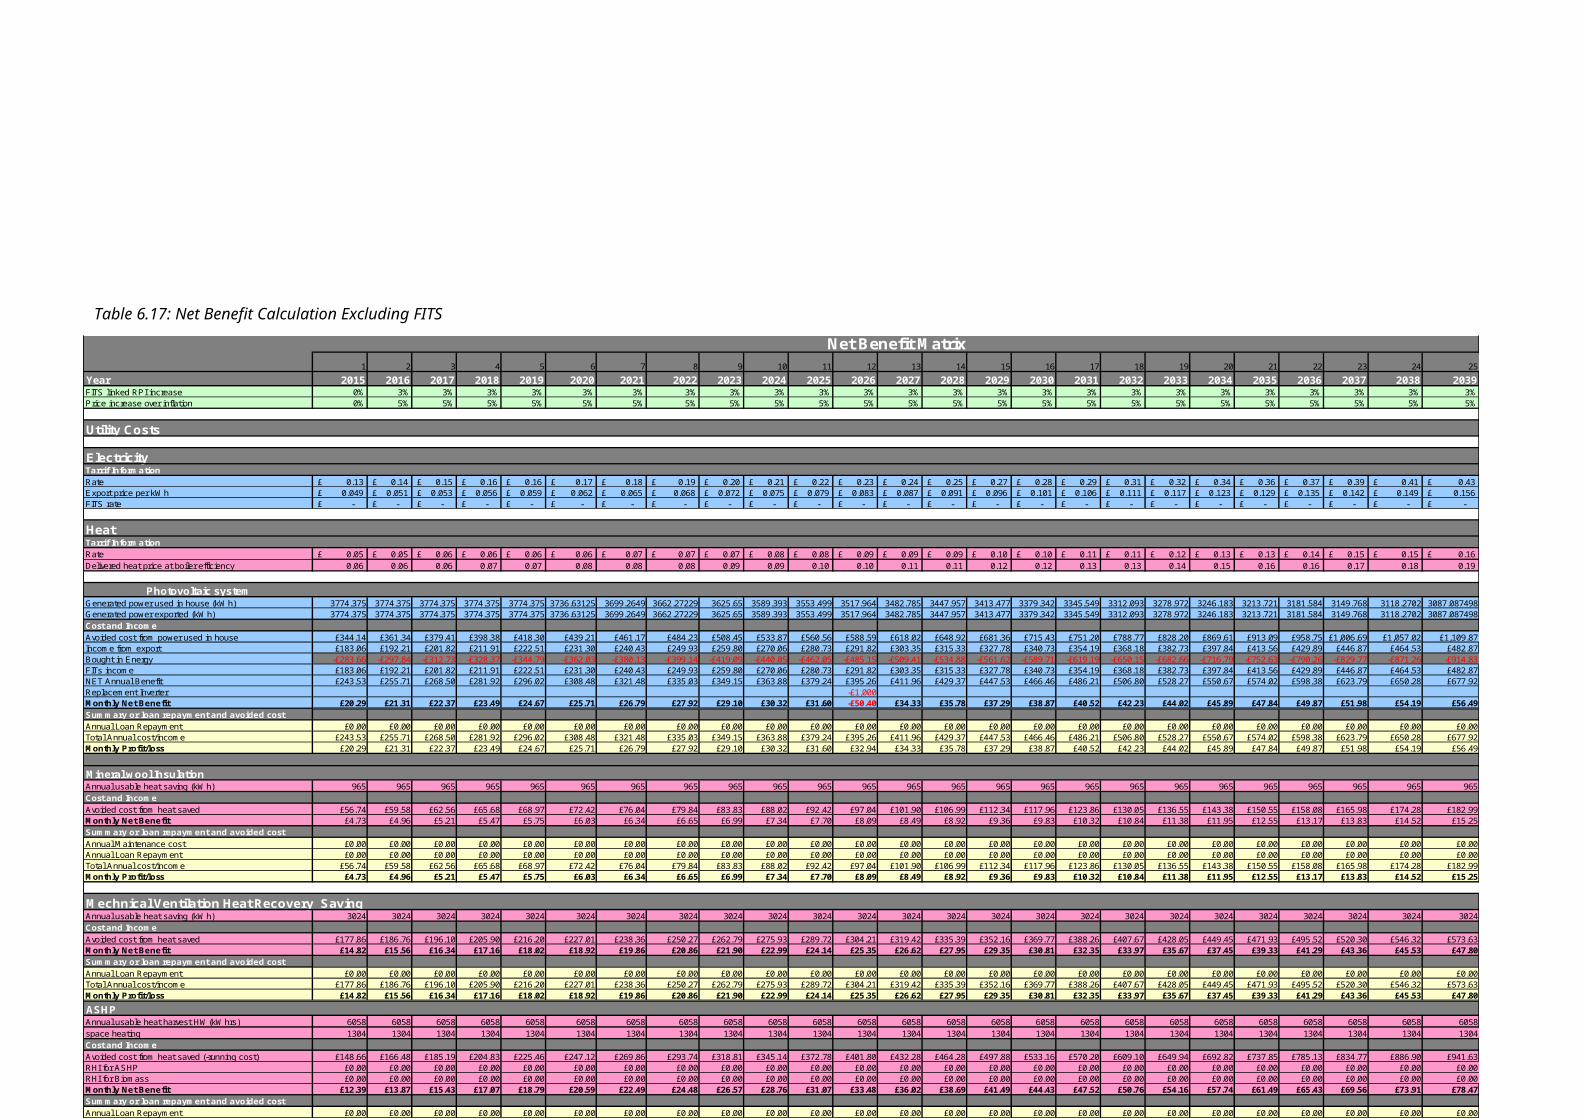
itself. This focused the design methodology on reducing radical departures from
the norm from both the developer and consumer perspective. The MLP analysis
also identified that the most likely method for niches to challenge the regime would
be accumulation and breakthrough. As such the design methodology focused on
utilising existing niche technologies in new ways so that established niche
technologies could be interlinked and thus create new markets by consolidating
existing technical niches. As niche accumulation and breakthrough is a slow
process so there was an increased need to capitalise on gains already made by
more established technologies. The aim was to try to combat inertia exhibited by
the energy and housing market incumbents in an easier way. The objective was to
try to give the optimised design as greater potential as possible to challenge at the
regime level by incorporating existing benefits and drivers. This also included
policy drivers at the niche level. However, it was again demonstrated in the
empirical study that even minimising the amount of technologies and only focusing
on existing technologies with a proven history created different integration
challenges such as innovation in financial models to justify costs.
In regards to the policy regime, at the time of research, there were too few policy
instruments that were punitive to unsustainable practice. Some taxable benefits
were available for zero carbon homes but they were not substantial enough to
instigate radical change. Policy drivers such as the CfSH standards and
environmental best practice were voluntary only and whilst they were envisaged to
become the policy in the future at the beginning of the research they were
incrementally watered down. By the end of the research the Code for Sustainable
Homes had been withdrawn. This had an effect of disadvantaging early adopters
in the zero carbon market and sent mixed signals regarding the political direction
of housing standards. The effect was reduced levels of radical innovation at the
niche level, making it hard for truly innovative designs to compete with the existing
regime. It was thus critical to look at policy drivers and focus the optimised design
on utilising as many drivers as possible.
Leveraging economic support polices were considered essential in developing
protected niches for successful innovations such as PV technologies. As such to
combat regime inertia and to create economic drivers for developers and
259

consumers technologies supported by economic based policies were prioritised in
the design methodology. Even though this was the case ancillary issues such as
the ability to premium price based on lifecycle costing, created additional barriers.
9.4.1 Using the MLP to inform design decisions: Niche level
The MLP states that the niche (micro) level is where innovation develops. The
niche level is where zero carbon designs and technologies are competing to
develop viable solutions to challenge incumbents at the regime level. For zero
carbon homes to develop significantly they require protected niches. Zero carbon
homes are still in their infancy and require further refinement to the current market
ready designs, hence the need for this research. In order for refinement to occur
the niche technologies will require protection from market forces supported by
government policy and incentives. Improvements were needed in the cost
structures and economics of the technologies, methods of deployment and the
usability of designs. Whilst improvements in the cost structures are only likely to
occur with scale, improving the economics can occur through support polices. The
development of future building regulations out of the higher voluntary standards
could go some way to create such a niche but this research identified that the
current policy regime does not go this far. What was identified from the MLP
analysis was that niches do not exist per se for zero carbon homes, however, they
do exist for some of the constituent technologies. These technologies were made
the focus of the design methodology. What was envisioned at the beginning of the
research was that if more established niche technologies with the correct policy
instruments are leveraged then it should be possible to develop competitive price
structures for niche zero carbon design. The idea was that if enough benefits
could be generated to overcome strategic actor barriers the optimised design
could become economically viable and thus capable of creating substantial
changes to incumbents at the regime level. It could also assist in the development
of a new trajectory of innovation. As such the design methodology was created to
be applicable to the majority of zero carbon projects so that if successful, other
entrants could be encouraged to enter the market. This would further develop the
optimised design or its technological components so that niches could network
and increased knowledge and resource sharing. Thus the niche level of the MLP
260

was used to identify how a niche zero carbon home could be developed that
maximised its chances for niche accumulation or breakthrough. This firstly led to
the development of the design objectives and subsequently to the development of
the optimised design. The processes at the niche level thus shaped the
development of the optimised design to leverage drivers, focus on reducing
developer based barriers and build upon the more established niche technologies
to encourage breakthrough and accumulation.
9.4.2 Evaluating the MLP for informing design
Using the MLP in this way enabled the design methodology to be better informed.
The MLP was used to broaden the design criteria to include more elements from a
wider pool of stakeholders. This enabled the identification of more barriers and
drivers which improved the design process and the potential for
commercialisation.
The optimised design thus focused on cost improvement, simplification, reduced
cultural barriers, improving the economics and justifying additional costs. The
resultant design worked within the current policy framework developed from the
macro level environment and translated through the policy regime.
The optimised design leveraged the maximum potential policy benefits in its
design. The result was a reduced cost zero carbon design that offset all predicted
carbon emissions annually and justified its costs through life cycle costing. The
optimised design was considered more viable than other market iterations and this
was corroborated by the interview and observation process (please see the results
section for full details). As such the MLP was instrumental in developing the
optimised design.
Most of the main benefits from using the MLP prior to designing the optimised
home were from identifying wider stakeholder issues. Without using the MLP in
this way the design could have taken a slightly myopic view of the market barriers
and failed to leverage some of the drivers available. It also assisted in identifying
additional barriers to commercial roll-outs of the design present in the wider
systemic environment.
261

Critically most of the benefits derived from using the MLP in this way come with
the benefit of hindsight. This is because the MLP shaped the interview and
observation process which identified the wider systemic issues within the regime
after the optimised design was developed.
This use of the MLP also helped, in part, to highlight the issues preventing the
realisation of many of the optimised design’s benefits being realised by
commercial actors or owner occupiers. This was due to the incorporation of a
broader group of stakeholders into the interview and observation process.
As such many of the benefits of using the MLP framework in this study will be
realised by future iterations of the design. It will also enable future researchers to
focus on the policy gaps and to help in the development of specific protected
niches for zero carbon homes. It was originally envisaged that leveraging existing
policy drivers would be able to achieve this, however, the interview and
observation process highlighted wider issues which prevented this from being the
case i.e. the issues in commercially realising the life cycle cost benefits or the
inability of the developer to pass costs on to the consumer. These issues were
created by the valuation system not the design. These issues were identified by
stakeholders found by using the MLP.
Whilst the optimised design did not achieve the desired goal of creating a design
likely to be adopted by the wider national house building market it did create a
design that was considered more viable than existing designs.
The incorporation of a wider group of stakeholders firstly in the design process
and secondly in the interview and observation process raised new issues that
were not under consideration before, such as how to capitalise life cycle costing to
include them in lending criteria or how can the valuation system be reviewed to
allow developers to pass justifiable costs on to consumers.
The use of the MLP therefore enabled the conclusion that initialising a commercial
role out of an optimised zero carbon home will be more problematic than just
incorporating stakeholder barriers into design. As such integrating zero carbon
homes into commercial developer mixes within short timeframes is especially
262

unlikely given the responses from the stakeholders relating to risk appetite and
their aversion to become first movers in the market.
When the optimised design was scaled up to volume level, the returns achievable
were still considered less attractive than building regulation projects. As such the
benefits of the optimised design were limited to being more viable than previous
zero carbon designs.
The MLP based design process has shown that the current socio-technical
environment is not conducive to a commercialised roll-out of the optimised design.
There are many critical issues that still need addressing in the wider actors groups
before the design can be commercially accepted. Education within many of the
wider actor groups is required to create such an environment so that the life cycle
cost benefits can be realised by both the developers and consumers. Without
development in these areas of the socio-technical environment zero carbon
housing markets will continue to stagnate.
Whilst the possibility to optimise designs to address many of the socio-technical
barriers is encouraging, the requirement of new ways of thinking to enable them to
be realised is still inhibitive to their roll out. As such this research points to the
need for policy and/or regulation to be developed to help create protected niches
for zero carbon designs and not just their constituent technologies.
It is thus possible to conclude using the MLP in this study enabled the design to
be improved from a different perspective but also helped to identify where deep
rooted systemic change is required. This research should thus help future design
iterations, policy makers and socio-technical transition practitioners to focus their
efforts on the systemic barriers that could make a decarbonised sector a reality.
These barriers are mainly based in the established norms of the key actor groups
and they will not be overcome until new ways of thinking are embraced. It is
recommended that financial analysts and surveyors are consulted in order to
develop the required mechanisms to help facilitate a decarbonised sector.
The empirical research conducted using the MLP as a framework has thus
identified where barriers to commercialising optimised zero carbon homes exist. It
263

has determined that the effects of some of the barriers already known in the
literature will still impact upon the optimised design, all be it in a different way. It
has also identified unknown barriers to innovation and pointed to some wider
systemic issues that are beyond the scope of an improved design philosophy. It is
thus possible to conclude that whilst the design is unlikely to result in a
commercial scale roll-out by developers in the short term it has still been useful in
determining what needs to be done for facilitation in the longer term. As such,
whilst using the MLP in this way can be considered to have improved the end
design it did not achieve all the design objectives or lead to a significantly
improved chance for commercialisation due to the factors identified in the
interview and observation and case study research. This said using the MLP was
still useful in creating the optimised design and future research could be well
informed by adopting this approach again in light of the research findings.
9.5 Conclusion: How the MLP was used in this Research
Whilst it is possible to create technically viable zero carbon homes using a variety
of different techniques, creating commercially and economically viable zero
carbon homes is more problematic. What is required is to address commercial
barriers into the design process in order to optimise the design and improve the
potential for developer buy in. Whilst it is inherent to zero carbon design that costs
are higher, through adopting a material substitution, simplification and tariff
backed methodology it is possible to significantly reduce over and above costs.
These reduced costs can then be justified by additional incomes generated by the
technologies. As demonstrated in this study the additional mortgage costs can be
offset entirely by the FITs income meaning that there is effectively a zero payback
period on the additional costs.
The methodology proposed offered a number of benefits but also highlighted
where issues still exist that cannot be addressed in the design process. When
compared against other zero carbon developments the methodology can be seen
to address a number of issues and thus improve viability. Improved usability and
reduced life cycle costs significantly improved end user demand but not project
profitability. The project margins were considered marginal on this project so it can
264

be attested that the reduced cost model enabled the project to remain viable until
the commitment phase whereas more costly zero carbon designs would not have.
The project, whilst still not at disposal stage, can be seen to be somewhat
successful as pre-sales expressions of interest at the initial sales price were
achieved.
Unfortunately when compared against traditional build projects there are still a
number of issues that need to be addressed, however, most of these issues
cannot be addressed at the design phase. Most of the issues revolve around risk
and reduced flexibility that arises from committing to a zero carbon home early on
and not allowing the project to revert back to building regulations later on. As such
funders and developers still prefer to build traditional developments as they are
lower risk. Even when they do consider zero carbon developments to be viable to
progress to latter stages of the development process, they considered the ability
to revert back to building regulations as critical.
Other issues were rooted in the wider systemic environment surrounding the
development process, specifically relating to sales prices and costs. These issues
need to be addressed with institutions such as RICS or estate agent valuers to
enable improved development appraisals and thus return to be generated.
Positively these issues can be considered warranted as the case study did
demonstrate that increased demand exists for the properties designed using the
methodology when compared to existing homes in the area. This increased
demand can be attributed to the methodology’s offsetting of energy bills in relation
to traditional builds.
Strategic actor group analysis is useful in identifying where barriers to
commercialising zero carbon homes exist. It enables the clarification of existing
barriers, their contextualisation from individual actor group perspectives and the
elaboration of new insights. The major issues identified from the research span
the political, economic and socio-technical context, indicating large scale barriers
to commercialising zero carbon design exist in all facets of deliverability. Issues
such as inconsistent and ineffective policy, low predicted levels of return, current
industry cost structures, risk aversion, the predicted levels of demand, an aversion
265

to influencing consumer choice and a lack of understanding of the economic
benefits within the finance and banking sectors. Whilst there were some drivers
noted, they seem of minor consequence to the majority of investors and
developers when considered against the backdrop of the over-arching wider
economic objectives.
As a result of the analysis conducted here, the commercialised pursuit of a large
scale zero carbon housing market via the traditional market routes seems
improbable at best. Even considering government targets for decarbonisation by
2016, the findings here indicate that this is unlikely to have any real impact by
2016. There is need for strong, clear and consistent regulation in order to drive the
industry forward, and this is currently lacking. The findings suggest that for zero
carbon homes to become viable, alternative market approaches such as different
build models, investment sources or new market mechanisms will be required.
Whether the potential for this to occur through entrepreneurial development or if
further regulatory reform will be required to make this happen is as yet unclear.
The results highlight where the design methodology provided solutions to existing
problems and where issues still existed that could not be addressed in the design
process. Many of the issues surrounding commercialising zero carbon homes
were discovered anchored in the wider systemic environment and these cannot be
addressed through optimising design.
The solutions created by the optimised design were most apparent when
compared against other zero carbon developments. As such the benefits are
rooted in step change improvements to existing zero carbon design
methodologies and not in the substitution of traditional builds. When combined
with the systemic issues identified, this prevented the design methodology from
effectively competing with standard house building models.
The main issues that improved viability were the improved usability and reduced
life cycle costs. The significantly improved cost structures added extra dimensions
to saleability by allowing the developer to focus on life cycle cost savings and not
just environmental benefits. Whilst this could improve end user demand issues, in
practice the valuation sector prevented the case study project from capitalising on
266

this. As such this benefit did not improve the profitability of zero carbon
developments.
The development had marginal profitability caused from a lack of premium pricing
and this caused many issues with the development process. Funding issues and
changing profit goals meant that significant delays were experienced on this
project. Indeed the inflexibility of the planning conditions was a major factor in the
development not reverting to traditional building types. However, the reduced
costs over other zero carbon buildings enabled the project to remain viable until
the commitment phase whereas other more costly zero carbon designs would not.
Also the ability for the project to gain pre-sales based on the life cycle cost
benefits means that the project, whilst still not at disposal stage, can be
considered somewhat successful based on the benefits directly achieved by using
the methodology.
Unfortunately when compared against traditional build projects there are still a
number of issues that need to be addressed. Most of these issues revolve around
risk and reduced profitability. Risk issues arise from committing to a higher cost
zero carbon typology early on with ill-defined markets. When combined with the
reduced development flexibility restricting a developer’s ability to revert to a lower
cost building, design risk issues are exacerbated. As such funders and developers
still prefer to build traditional developments as they are lower risk.
Even when investors and developers do consider zero carbon developments to be
viable to progress to latter stages of the development process they consider the
ability to revert back to building regulations as a key risk mitigation tool. This and
other issues identified are rooted in the wider systemic environment surrounding
the development process and cannot specifically be addressed in the design
process. Issues specifically relating to sales prices, valuations, funding and costs
cannot be addressed by design, only by systemic change and education in the
wider industrial sectors. These need to be addressed with institutions such as
RICS or estate agents and not via design. If these issues can be addressed it
would enable valuers to allow developers to capitalise on the improved
characteristics of the optimised design. If these issues can be reflected in the
267

development appraisals they would improve developer returns. This research did
identify a developing evidence base to support this from the demand side. This
was linked to the case study where increased demand for the properties was
demonstrated over traditional builds in the area, evident in the presales. Whilst it is
not possible to examine if the demand would have existed at higher prices due to
the agents issuing standard valuations, the properties designed using the
methodology can be considered in demand.
This research project set out to address major barriers to implanting zero carbon
homes at the commercial scale. It reviewed the literature, developed a novel
approach to design and empirically tested the design to see what commercial
stakeholders thought. Whilst the design made significant improvements compared
to older zero carbon designs it was not possible to influence the successful
outcome of a case study development to be built using the design. The issues
addressed by the design’s innovation seemed to create new issues related to
novelty in both the technological and economic characteristics. The level of
resistance in incumbents and the lack of desire to innovate in the industry meant
that the commercialisation of the design is unlikely to occur using standard
business models. These point to wider systemic changes that will be required
within the regime to allow the optimised design to challenge at the regime level.
Without these changes it is unlikely that the optimised design can compete under
the current rules of the system. Currently the optimised design and the benefits it
could bring are considered too much of a radical departure to the current accepted
norms. The important implications for these results are that the optimum market
for the design remains within the lower volume self-builders and not the national
house builders. This significantly reduces the impact the design could have in both
build volume and decarbonisation. As such future research needs to look into
alternative routes to market or stimulating significant market reform. The former
may provide an easier route.
268

9.5.1 Conclusion: How this Research informs the literature
The MLP has proved useful as a framework to understand socio-technical change,
however, based on the way it was used in this study there are some
recommendations that can be made to inform the literature.
This study took the Geels (2011; 2005; 2011) and the Cohen and Ilieva (2015)
perspective that understanding the broader aspects of socio-technical change
would be most useful to understand how to transition the new build housing
sector. This position was valid based on a number of points, such as the level of
control exerted by national house builders and the way regulatory standards are
used as the benchmark for design. As such the broader aspects of socio-technical
change seemed more important to consider when improving the design of a zero
carbon home. Cohen and Ilieva (2015) considered that using socio practice theory
would give too much focus to micro elements of behaviour and practice and miss
out on the boarder aspects of socio-technical change. Whilst this is
acknowledged, it is argued that the research and design process could have been
improved if more of the practice factors were considered. Cohen and Ilieva (2015)
do state that rationalising the level at which to study socio-technical change needs
to be made is dependent on context, but it is suggested that to use transitions
theory to improve design it needs to incorporate practice elements as well.
Shove and Walker (2001; 2010) state that socio-technical change models, such as
the MLP, tend to fall short in accounting for the processes of practice and culture
and this was observed in this study. It is important to note that Cohen and Ilieva
(2015) state an effective model for doing this is yet to be developed. What this
research shows is that the need to develop such an approach is necessary.
The case study identified that the role of some aspects of social practice were
significantly underplayed by the application of the MLP and these had a marked
impact on the potential to implement the optimised design. This underplay caused
some key barriers to implementation not to be identified during the optimisation
process. A good example was how the net benefits approach to cost justification
was met with so much resistance and the resistance not adequately considered.
269

Whilst transitions theory did bring elements of social practice into the framework,
the optimisation process would have benefited from greater consideration. This
would have improved the balance of broader socio-technical changes aspects and
narrower practice issues being incorporated into the design process. It is therefore
suggested that to improve the use of the socio-technical change theory for
informing design, greater balance should be sought in future research.
Following Geels (2004) template to use transitions theory to imagine a future
state, examine the differences between the current and the future state, and track
back to what is required was effective in assisting in the design process. It helped
identify where blockages could occur and what policy tools to exploit to help
design an innovation that was more likely to transition to the regime level. Whilst
this was useful it did not full identify all stakeholder issues that inhibit change. This
created a scenario where certain barriers were addressed but other barriers,
which developed out of the design solutions, took greater importance. Thus
imagined actor responses and interactions between institutions and publics within
the socio-technical system were not effectively captured (Geels, 2001; Trist and
Murray, 1993; Hughes, 2009; Foxon et al., 2008). Ways in which these responses
and interactions can be better captured need to be incorporated into socio-
technical change theory so that it can be used more effectively for developing
innovations that can challenge at the regime level.
This research also identified that, whilst the structure of the MLP is not optimal, it
did identify issues that could be improved through additional iterations of the
design process. Although these issues were not initially identified through the
application of transitions theory, they were identified through the empirical
research. As this research was shaped by transitions theory, the MLP in particular,
they were identified due to its use. Whilst this supports the argument from authors
such as Shove and Walker (2001; 2010) and Smith et al. (2005) that transitions
theory does not effectively capture all the critical elements of socio-technical
change, it is contested that transitions theory and frameworks such as the MLP
are valid to use when designing zero carbon homes. This is especially so when
attempting to capture the main elements inhibiting change. It is suggested here
that the broader aspects of socio-technical change identified using transitions
270

theory should be used to inform a secondary approach which focuses more on
stakeholder and cross stakeholder barriers to capture a greater range of transition
based issues.
It is debated in the literature that the MLP over emphasises of the role of protected
niches (Shove and Walker, 2010; Genus and Cole, 2008). However, this research
strongly supports Geels (2004) recommendations that protected niches are
necessary. A key finding from this research was that the niches carved out by
renewable technologies supported by energy policy was not strong enough to
create space for zero carbon homes to compete at the regime level. As such a
more specific niche, targeted at zero carbon homes was required. This indicates
that greater efforts need to be placed in assisting niche accumulation so that they
develop stronger accumulated niches to enable breakthrough. It is therefore
suggested that protection and support in transitioning innovations into mainstream
(regime) practices are of critical importance to stimulate socio-technical change.
As such ways to improve the formation of niches that incorporate elements from
other niches need to be at the forefront of transitions thinking. A good example of
this is to give greater support to innovations that incorporate multiple niche
technologies so that niches can be encouraged to accumulate.
This research sought to bring different actors together to encourage strategic actor
patterns that supported breakthrough, as proposed by Ravens (2006) and Geels
(2002; 2004). Unfortunately new patterns to support innovations were
disproportionately affected by powerful incumbents who locked development into
the old regime. This was evident in the way that one strategic actor group could
prevented new linkages being formed between others i.e. the net benefit approach
could not form linkages between developers, lenders and consumers because the
power the surveyors had in determining house price criteria. As such focusing on
changing the protocols in the surveyor group would be more effective then
developing new links between developers, lender and consumers. As such ways
in which to encourage strategic actor patterns needs to pay particular attention to
removing blockers to creating new patterns.
271

It is important to note that using the MLP, whilst effective in identifying incumbents
that would resist change, was not effective in developing a deep enough
understanding of where certain types of resistance would occur. If this could be
identified using the MLP then more of the unknown barriers which emerged from
the empirical research stage could have been identified at the design stage. This
said, how these could be addressed are unlikely to be identified. A good example
of this is the way the MLP identified key stakeholders would resist price increases
but did not identify that the incumbents would resist price justification techniques.
In summary transitions theory was useful to the optimisation process but, as Smith
et al. (2010) suggest, the key models were too simplistic to identify the plurality of
interactions between the specific levels and between the specific actors. This was
clearly demonstrated in the way that additional costs were identified as a key
issues but the way the actor groups interacted to inhibit the benefits being realised
was not picked-up i.e. the fact that estate agents did not value zero carbon homes
effectively, which prevented developers being able to pass justifiable costs on to
consumers, which affected lending criteria, but was caused by the RICS valuation
approach was not captured. As such it is a valid argument that the MLP and
transitions theory do not adequately capture the full complexities of a transition.
Whilst it was initially contested that a simplistic model would function well in
enabling a innovation to be optimised for breakthrough into the regime, the reality
was the complexity was just as important in inhibiting breakthrough. The challenge
for the theory is thus how to capture the greater complexity in way that can be
both easily understood and actionable.
9.6 Further research developments
Following on from the results from the empirical research section of the study the
optimised design was revisited. The same design philosophy was applied to the
optimised design to understand where further design changes could be made in
line with the interview and observation results. This section details these changes.
272

9.6.1 Alternative routes to market
As a direct result of this research new ways of reaching the commercial scale
market are being investigated by the Sponsor organisation. These include up
scaling self-build models to commercial volumes using a ‘shell and core’ build
philosophy. Another way is to examine different ways to construct developments,
around 100 properties per development, without using a main contractor so as to
overcome both developer based objections and cost based issues by removing a
layer from the development program.
9.6.2 Evolution of the optimised design
The result from the interview and observation study clearly demonstrated the need
to reduce capital costs further. To do this the insulation, wall construction and
M&E plant were re-evaluated. The material substitution and integration objectives
were applied to further reduce costs here.
To reduce costs on the M&E components a method of integrating the MVHR and
heating systems together were evaluated. A proprietary MHVR heat pump was
modelled into the design which enabled the 75mm flexible air duct work used for
ventilation to be used to supply warm air throughout the property. This removed
the need for additional space heating emitters such as under floor heating or
convector radiators.
The COP of the energy system was also slightly improved by the process in which
outside air, extracted air and air passing over the heat exchanger worked. An
average COP of 3.8 could be achieved based on manufacturers’ declared values
based on achieving a U-value of 0.14 W/m2K and the predicted air tightness level.
273

Copyright Zedfactory Europe Ltd
Figure 9.0: MVHR and Space Heating Distribution
A new framing method was also developed. The framing method reduced the
need for offsite construction by enabling the process to be conducted quicker
onsite. It also reduced the level of specialist skills in some core components of the
assembly process. The method allowed almost all structural cutting to occur prior
to the materials arriving onsite. The dimensions of the building were designed to
use a modular design template so that the main structural elements, such as the
OSB layer, could be used as supplied from the manufacturer. This has benefits for
both the commercial and self-build market as the level of skill required is reduced
so that trained self-builders can assist in the construction phase and that the
construction phase and lead in times for commercial builders are significantly
reduced.
Central to this process was the use of a hybridised timber and steel frame method.
Pre-manufactured laser cut and folded steel perimeter ring beam / lintel sections
were designed for use at each floor and roof level. This was combined with a
standardised design and pre-cut component list. The steel ring beam and lintel
sections had up stands ready to locate the timber studs to. The steel section
formed the ring beam and shot fired straight into a timber sole plate fixed to the
EPS raft foundation system.
274

Copyright Zedfactory Europe Ltd
Figure 9.1: Detailed Wall Build-up
Copyright Zedfactory Europe Ltd
Figure 9.2: Detailed Wall Plan
275

Copyright Zedfactory Europe Ltd
Figure 9.3: Typical Floor Build-Up
External insulation was changed to a 150mm cork insulation board (120kg/m3,
thermal conductivity 0.038 W/m2K) which could take render straight onto the
surface substrate. This eliminated the need for a render carrier board and thus
removed a layer of construction material and process. The cork board was also
used as a 50mm internal insulation layer which could be lime-plastered to,
removing the need for plaster board or cement board. The lime plaster acts as
additional thermal mass in lieu of the cement board.
The building has been certified by an independent structural engineer and the
construction process is currently undergoing LABC building control and warranty
approval to ensure that it complies with current UK building regulations and is
insurable, mortgageable and able to achieve a standard LABC 10 Year building
warranty.
These changes are designed to reduce costs, increase material substitution and
simplify the building further. Unfortunately the innovation in building typology,
construction method and technology are yet to be fully verified and could not be
276

done so during the duration of this research project. This will be done using a test
house at the BRE due to commence construction in Mid-2015. This will enable the
quantification of costs and time savings via the new construction method. The
construction model and process is still undergoing innovation and R&D and as
such the design was not included in the full thesis write up, however, as the
design is an evolution of the ideas and methodology designed in this thesis it
represents further research developed using this study as a baseline. This clearly
demonstrates the contribution to industry the research is making and how the
findings from both the technical and social research components are shaping
future innovative zero carbon housing design which goes beyond the regulatory
minimum.
This research has challenged the industry as to what is possible in zero carbon
housing design and delivery. The results are better informing mechanical and
electrical system designers, architects, NGO’s and residential property developers
on the process of designing and implementing zero carbon homes whilst
balancing commercial market factors. It is responsible for challenging how we
price energy and opening up industry to consider life cycle costing within housing
prices; raising questions about whether the housing valuation system and lending
criteria are fit for purpose for tomorrow’s new homes. It has established the
blockages in the current system and opened up the potential to examine
alternative ways to build high specification zero carbon homes at a larger scale
using without involving tradition volume house builders.
277

10. References
ACE. (2013). EAC inquiry: Code for Sustainable Homes and the Housing Standards Review. Written evidence to Environmental Audit Committee. October 2013, Association for the Conservations of Energy.
AMA. (2010). Market Research – Self Build Build Housing Market – UK 2009-2013. AMA Research
Anderson, P., Tushman, M., 1990. Technological discontinuities and dominant designs: a cyclical model of technological change. Administrative Science Quarterly 35, 604–633.
Babbie, E.R. (2001). The practice of social research. Belmont, CA: Wadsworth Thomson Learning.
Ball, M. (2010). The housebuilding industry: Promoting recovery in housing supply, CLG, London.
Barker, K (2003). Review of Housing Supply: Securing our Future Housing Needs, Interim Report, London: HMSO.
Becker, M. C. (2001). The concept of routines twenty years after Nelson and Winter. A review of the literature. Danish Research Unit for Industrial Dynamics, Working Paper, No 03-06.
Beiske, B. (2003). Post-WTO economic effects on state-owned enterprises in China. diplom.de.
BERE Architects. (2010). ‘First Welsh Passivhaus prototype – Fenestration Calculations & Cost Data’. Online August 17 2010 Available from <http://www.bere.co.uk/blog/first-welsh-passivhaus-prototype-%E2%80%93-fenestration-calculations-cost-data>
Bergman, N., Haxeltine, A., Whitmarsh, L., Köhler, J., Schilperoord, M. and Rotmans. ,J. (2008) Modelling Socio-Technical Transition Patterns and Pathways. Journal of Artificial Societies and Social Simulation vol. 11, no. 37
Birrell, G. & Bin, G. S. (1997) 'The UK property development process: its phases and their degree of importance to profitability', Cutting Edge.
Block, E. (2015). Zero Carbon Homes: Lower PV costs but weaker standards. Sun and Wind Energy 1/2015.
BRE. (2005). Digest 496. Timber Framed Buildings: A guide to the Construction Process. BRE Publications. Building Research Establishment
BREEAM. (2011). New Construction Technical Manual: Version: SD5073 Issue: 3.0 – Issue Date:18/10/2012. BRE Global Ltd 2011. Building Research Establishment Environmental Assessment Method
Build Desk. (2012). Build Desk U 3.4 Manual. Available at http://builddesk.co.uk/wp-content/uploads/2013/01/manual.pdf
278

Bryman, A., & Burgess, R. G. (1994). Reflections on qualitative data analysis. Analyzing qualitative data, 216-226.
Byrne, P. (2002). Risk, uncertainty and decision-making in property. Routledge.
CABE. (2005). What home buyers want: Attitudes and decision making among consumers. Published on 1 March 2005. Chartered Association of Building Engineers
Cadman, D. and Austin-Crowe, L. (1978) Property Development, Spon, London.
Callcutt Review.2007. The Callcutt Review of Housebuilding Delivery, Department of Communities and Local Government (CLG), London.
Carter, E. (2006) Making Money from Sustainable Homes: A Developers Guide, CIOB Publications, Ascot.
B. Carlsson, R. Stankiewicz, On the Nature, Function, and Composition of Technological systems, Journal of Evolutionary Economics 1 (1991) 93-118.
Castell, S. (2010). ‘What the Public Say: About Designing low carbon interventions’. Department for Business Innovation and Skills. November 2010.
Chadderton, D. V. (2013). Building services engineering. Routledge.
Cohen, N., & Ilieva, R. T. (2015). Transitioning the food system: A strategic practice management approach for cities. Environmental Innovation and Societal Transitions. In Press
Cohen,S. (1972). Folk Devils and Moral Panics. Oxford. Oxford University Press
Communities and Local Government. (2006). ‘The Code for Sustainable Homes; A Step-Change In Sustainable Home Building Practice’. December 2006. Queen’s Printer and Controller of Her Majesty’s Stationery office
Communities and Local Government. 2010(b). ‘Code for Sustainable Homes: A Cost Review’. Queen’s Printer and Controller of Her Majesty’s Stationery office
Communities and Local Government. 2010 (c). Approved Document L1A: Conservation of Fuel and Power In New Dwellings (2010 Edition). Queen’s Printer and Controller of Her Majesty’s Stationery office
Cornelius, I. (2002). If the CAPM Fits. CIMA Insider. April 2002.
Craven, E. (1969). Private Residential Expansion in Kent 1956-64: A Study of Pattern and Process in Urban Growth. Urban Studies, 6(1), 1-16.
Christensen, C., 1997. The Innovator’s Dilemma: When New Technologies Cause Great Firms to Fail. Harvard Business School Press, Boston, MA.
Cyril Sweett. (2007). A cost review of the Code for Sustainable Homes. Report for English Partnerships and the Housing Corporation.
DCLG. (2015). Plain English guide to the Planning System. London: The Stationery Office. Department for Communities and Local Government
279

DECC. (2010) (b). The Green Deal: a summary of the government’s Proposals. 2010. Department of energy and Climate Change
DECC. (2010). Feed-in Tariffs - Government’s Response to the Summer 2009 Consultation. February 2010. Department of energy and Climate Change
DECC. (2010). Annual Energy Statement. DECC Departmental Memorandum. July 2010. Department of energy and Climate Change
DECC. (2012). Electricity Market Reform: Policy Overview. November 2012. Department of energy and Climate Change
Delta-ee. (2012). Microgeneration: What do customers want? Insights from our GB Microgeneration Research Service. A Delta-ee White Paper August 2012
deMarais,K., and Lapan, S. (2004). Foundations for Research Methods of Inquiry in Education and the Social Sciences. Lawrence Erlbaum Associates. Mahwah, New Jersey
Dequaire, X. (2012). Passivhaus as a low-energy building standard: contribution to a typology. Energy efficiency, 5 (3), 377-391.
Dey, I. (1993). Qualitative Data Analysis: a user friendly guide. London. Routledge.
Dixon, T. (2009). Urban land and property ownership patterns in the UK: trends and forces for change. Land Use Policy, 26, S43-S53.
DUKES. (2010). Digest of United Kingdom Energy Statistics 2010. A National Statistics publication. London: TSO
DUKES. (2012). Digest of United Kingdom Energy Statistics 2012. A National Statistics publication. London: TSO. Digest of United Kingdom Energy Statistics
Dunster, B., Simmons.C, Gilbert,B. (2008). The ZEDbook: solutions for a shrinking world. Taylor & Francis. Oxford
ENERGY SAVING TRUST (EST) (2010) Sustainable Refurbishment – Towards an 80% Reduction in CO2 Emissions, Water Efficiency, Waste Reduction, and Climate Change Adaptation, CE309, Energy Saving Trust, London
Energy Saving Trust. (2013). Utilities calculation data. (accessed 2013) available at http://www.energysavingtrust.org.uk/domestic/content/our-calculations
ESRC Research Ethics Framework (REF). (2009). available at www.esrcsocietytoday.ac.uk/.../ESRC_Re_ Ethics _Frame_tcm6-11291.pdf
Fielding, N and Thomas, H. (2001), in N. Gilbert (Ed.) Researching Social Life. Second Edition. SAGE Publications Ltd.
Flyvbjerg,B. (2006). Five Misunderstandings About Case-Study Research, Qualitative Inquiry, vol. 12, no. 2, April 2006, pp. 219-245
FOE. 2012. Briefing: Energy Market Reform. April 2012. Friends of the Earth
280

FOE.2011. Report: The Dirty Half Dozen. October 2011. Friends of the Earth
Foxon, T.J., Pearson, P.J., Hammond, G.P. (2008). Transition Pathways to A Low Carbon Economy. Working Paper 1: Conceptual & Analytical Framework. E.ON UK / EPSRC Transition Pathways to a Low Carbon Economy Scenarios Workstream, Working Paper 1
Frantzeskaki, N., & Loorbach, D. (2009). Transitions governance: Towards a new governance paradigm. 13th Annual Conference of the International Research Society for Public Management (IRSPM XIII) April 6th – 8th, 2009, Copenhagen Business School, Copenhagen, Denmark
Frazer,F. 2011. Student Notes for Building Services Engineering. Available at www.bsenotes.com
Freeman, C., Louca, F., 2001. As Time Goes By: From the Industrial Revolutions to the Information Revolution. Oxford University. Press, Oxford.
Freeman, C., Perez, C., 1988. Structural crisis of adjustment, business cycles and investment behaviour. In: Dosi, G., Freeman, C., Nelson, R., Silverberg, G., Soete, L. (Eds.), Technical Change and Economic Theory. Pinter, London, pp. 38–66.
Gajda, J. and Dowell, A.M., 2003. Concrete consolidation and the potential for voids in ICF walls. Portland Cement Association.
Geels, F. and Raven, R. (2007). Non-linearity and expectations in niche-development trajectories: Ups and downs in Dutch biogas development (1973–2003), Technology Analysis & Strategic Management 18(3/4): 375–392. 229
Geels, F. W., & Schot, J. (2007). Typology of sociotechnical transition pathways. Research policy, 36(3), 399-417.
Geels, F.W. (2001). Technological transitions as evolutionary reconfiguration processes: A multi-level perspective and a case-study. Nelson and Winter Conference, June 12-15, 2001, Aalborg, Denmark
Geels, F.W. (2004). Processes and patterns in transitions and system innovations: Refining the co-evolutionary multi-level perspective. Technological Forecasting & Social Change 72 (2005) 681–696
Geels, F.W. and J. Schot. (2007). Typology of sociotechnical transition pathways. Research Policy 36, 399-417
Geels, F.W. (2002). Technological transitions as evolutionary reconfiguration processes: A multi-level perspective and a case-study. Research Policy 31
Geels, F.W. (2010). Socio-technical transitions:Multi-level perspective, pattterns and
mechanisms DTU, 10 May 2010, Copenhagen
Geels, F W. (2011). The multi-level perspective on sustainability transitions: Responses to seven criticisms. Environmental innovation and societal transitions 1.1 (2011): 24-40.
281

Genus, A. and Coles, A.M. (2008). Rethinking the multi-level perspective of technological transitions. Research Policy 37 (2008) 1436–1445Genus, A., Nor, M.A.M. (2007). Bridging the digital divide in Malaysia: an empirical analysis of technological transformation and implications for e-development. Asia Pacific Business Review 13, 95–112.
Ghorbani, Amineh, et al. 2010. Using institutional frameworks to conceptualize agent-based models of socio-technical systems. Proceeding of the 2010 workshop on complex system modelling and simulation. Vol. 3. 2010.
Gilbert, N. (2003). Researching Social Life. 2nd edition. Sage Publication Ltd.
Gilbert. B. (2007). The development of an equation to quantify the performance of a wind driven heat recovery ventilation system. Working paper
Gillott, M., Taranto, L. and Spataru, C., 2010. Low-carbon housing design informed by research. Civil Engineers Engineering Sustainability 163 June 2010 Issue ES2.
Goodchild, B., & Walshaw, A. (2011). Towards zero carbon homes in England? From inception to partial implementation. Housing Studies, 26 (6), 933-949
Goodchild, R. and Munton, R. (1985). Development and the Landowner, Allen and Unwin, London.
Goodier, C and Pan, W. (2010). The Future of UK Housebuilding. RICS Research Report. December 2010.
Gore , T. And Nicholson, D. (1991). Models Of the land development process: A critical review, Environment and Planning A,23,pp. 705–730
Götze, U., Northcott, D., Schuster, P. (2008). Investment Appraisal. Methods and Models. Springer Berlin
Hajer, M.A., (1995). The politics of environmental discourse. Oxford: Clarendon Press.Healey, P. (1991). Models of the development process: A review. Journal of property research, 8(3), 219-238.
Hamilton-MacLaren, F., Loveday, D.L. and Mourshed, M. 2013. Public opinions on alternative lower carbon wall construction techniques for UK housing. Habitat International, 37, pp.163-169.
Hawks, L.K. and Percer, K., 2005. INSULATING CONCRETE FORMS (ICFS). Utah State Digital Commons
Healey, P., & Barrett, S. M. (1990). Structure and agency in land and property development processes: some ideas for research. Urban studies, 27(1), 89-103.
Hekkert, M.P., Suurs, R.A., Negro, S.O., Kuhlmann, S. and Smits, R.E., 2007. Functions of innovation systems: A new approach for analysing technological change. Technological forecasting and social change, 74(4), pp.413-432.
Hekkert, M., Negro, S., Heimeriks, G. and Harmsen, R., 2011. Technological innovation system analysis. Faculty of Geosciences Utrecht University.
282

Heffernan, E., Pan, W., & Liang, X. (2012). Delivering zero carbon homes in the UK. In Procs 28th Annual ARCOM Conference (pp. 3-5).
Heffernan, E., Pan, W., Liang, X., & de Wilde, P. (2013). Redefining zero? A critical review of definitions of zero energy buildings and zero carbon homes. The 2013 Technical Symposium of the Chartered Institution of Building Services Engineers (CIBSE), Liverpool, UK., 11-12 April 2013, p. 1-14
HM Treasury/BIS. (2011). Plan for Growth. March 2011. ISBN 978-1-84532-842-9
Home Power. 2013. Solar on SIPS. Issue #156, August / September 2013
House of Commons Daily Hansard Debates. (2011). Solar Power (Feed-in Tariff). 23 of November 2011. Available at http://www.publications.parliament.uk/pa/cm201011/cmhansrd/cm111123/debtext/111123-0003.htm
House of Commons. (2008). Greener Homes for the Future? An Environmental Analysis of the Government’s House-building Plans, Environmental Audit Committee Twelfth Report of Session 2007–08, HC 566.
House of Commons. (2014). Stimulating housing supply – Government initiatives. Standard Note: SN/SP/6416
Housing and Planning Statistics. (2009). Department for Communities and Local Government http://www.housingcorp.gov.uk/upload/pdf/Code_for_ Sustainable_Homes_050407.pdf
Hughes, N. (2009). Transition Pathways to a Low Carbon Economy. Using scenarios to bring about low carbon energy transitions: Lessons from transitions theory and the scenario building tradition. E.ON UK / EPSRC Transition Pathways to a Low Carbon Economy Scenarios Workstream, Working Paper 3
Halcomb, E.J., and Davidson, P.M. (2006). Is verbatim transcription of interview data always necessary? Applied Nursing Research 19
Hughes, T.P., (1987). The evolution of large technological systems. In: Bijker, W.E.,Hughes, T.P., Pinch, T. (Eds.), The Social Construction of Technological Systems: New Directions in the Sociology and History of Technology. The MIT Press, Cambridge, Massachusetts, 51–82.
Isaac, D. (1994) Property Finance. London, Mcmillan
Isaac, D. (1996). Property Development: Appraisal and Finance. Basingstoke. Palgrave
Jackson, T. (2009). Prosperity without Growth: Economics for a Finite Planet. Earthscan
Jager, W. (2006). Stimulating the diffusion of photovoltaic systems: A behavioural perspective. Energy Policy, 34(14), 1935-1943.
Kaghan, William N., and Geoffrey C. Bowker. (2001). Out of machine age?: complexity, sociotechnical systems and actor network theory. Journal of Engineering and Technology Management 18.3 (2001): 253-269.
283

Kalogirou., S. A. (2014). Solar Energy Engineering: Processes and Systems. Academic Press; 1st edition
Kingspan. (2009). ‘Kingspan Lighthouse’. Unpublished.
Klijn, E. H., & Koppenjan, J. F. (2006). Institutional design: changing institutional features of networks. Public management review, 8(1), 141-160.
Langdon,D. (2012). Spons Architects and builders Price Book.137th edition. Spons Press
Leach, M., Peters,M., Fudge, S.(2012). Efficient Household Appliances: A field study of the contribution of appliance replacement and consumer behaviour to reducing energy use Research Study Report. Centre for Environmental Strategy, University of Surrey
Lecher, N. (2008). Heating, Cooling, and Lighting: Sustainable Design Methods for Architects, Wiley Press, Hoboken, NJ
Lee, S. (2011). Aesthetics of Sustainable Architecture. 010 Publishers. Rotterdam
Lewis, D.C., 2000. Use of insulating concrete forms in residential housing construction (Doctoral dissertation, Monterey, California. Naval Postgraduate School).
Lofland, J. and Lofland, L. (1994). Analysing Social Settings, Belmont, CA, Wandsworth
Lüthje, C. (2004). Characteristics of innovating users in a consumer goods field: An empirical study of sport-related product consumers. Technovation, 24(9), 683-695
MacKay. D.J.C. (2009). Sustainable Energy— without the hot air. Version 3.5.2.
Masini, A., and Menichetti.E. (2010). Investment decisions in the renewable energy sector: An analysis of non-financial drivers. Technological Forecasting and Social Change 80.3 (2013): 510-524.
McManus, A., Gaterell, M. R., & Coates, L. E. (2010). The potential of the Code for Sustainable Homes to deliver genuine ‘sustainable energy’in the UK social housing sector. Energy Policy, 38(4), 2013-2019.
Mendonca, M. (2007). Feed-in Tariffs: Accelerating the Deployment of Renewable Energy. ISBN 9781844074662, EarthScan, London.
Mendonca, M. (2009). Feed-in Tariffs: Accelerating the Deployment of Renewable Energy. Routledge . 2009.
Miles, J., and N. Whitehouse. (2013). Offsite Housing Review. Department of Business, Innovation & Skills and the Construction Industry Council, London (2013).
Miller Zero. (2010). ‘H+H Case Study Miller Zero: The Pinnacle, Basingstoke’. (available online http://www.hhcelcon.co.uk/documents/52344/f82dc019-613a-4fe5-90bc-09e5962a1d4d)
Millington, A. F. (2000). Property Development. London. E.G. Books
Mlecnik, E., Visscher, H., & Van Hal, A. (2010). Barriers and opportunities for labels for highly energy-efficient houses. Energy Policy, 38(8), 4592-4603.
284

Money.co.uk Search. (2011). Available at: <http://www.money.co.uk/current-accounts/high-interest-current-accounts.htm> [Accessed 10 May 2011]
Munton,R. (1985). Investment in British agriculture by the financial institutions. Sociologia Ruralis, 25 (1985), pp. 155–173
Murman J.P. (2003), Knowledge and Competitive Advantage, the Coevolution of Firms, Technology, and National Institutions. Cambridge University Press
Nagy Hesse-Biber, S., and Leavy,P. (2011). The Practice of Qualitative Research Second Edition. SAGE
National Self Build Association. (2011). An Action Plan to promote the growth of self build housing. The report of the Self Build Government-Industry Working Group. July 2011
Nelson, P.R. and Winter S. (1982). An Evolutionary Theory of Economic Change. Harvard University Press.
Nikolic, I. (2009). Co-Evolutionary Process For Modelling Large Scale Socio-Technical Systems Evolution. PhD thesis, Delft University of Technology, 2009.
Williamson. O.E. (1998). Transaction cost economics: how it works; where it is headed. The Economist, 146(1): 23(58, 1998)
Ofgem.(2010). Project Discovery Energy Market Update Scenarios. Reference Number 16a/10. Office of Gas and Electricity Markets
Ottens, M., Franssen, M., Kroes, P. and Van De Poel, I. (2006). Modelling infrastructures as socio-technical systems. International Journal of Critical Infrastructures 2 (2–3): 133–145. 2, 13, 79
Pearce, A., & Ahn, Y. H. (2013). Sustainable buildings and infrastructure: paths to the future. Routledge.
Pickvance, C. (2009). Local Environment: The International Journal of Justice and Sustainability Volume 14, Issue 4, 2009
Planning Policy Statement 1. (2005). Office of the Deputy Prime Minister
Planning Policy Statement Supplement. (2007). Office of the Deputy Prime Minister
Polkinghorne, D. E. (1995). Narrative configuration in qualitative analysis. In J. A. Hatch & Ratcliffe, J., Stubbs, M., & Shepherd, M. (2004). Urban planning and real estate development (Vol. 8). Taylor & Francis.
Raven, R. (2006). Niche accumulation and hybridisation strategies in transition processes towards a sustainable energy system: An assessment of differences and pitfalls. Energy Policy 35.4 (2007): 2390-2400.
RIBA. (2008). Consultation paper on the future of the Code for Sustainable Homes – making a rating mandatory. Response by the Royal Institute of British Architects
285

RIBA. (2009). Improving Housing Quality: Unlocking the Market available at < https://www.architecture.com/Files/RIBAHoldings/PolicyAndInternationalRelations/Policy/Housing/ImprovingHousingQuality.pdf > Royal Institute of British Architects
RICS. (2012).Valuation - Professional Standards (the 'Red Book'). Royal Institute of Chartered Surveyors
Rip, A. and Kemp, R. (1998). Technological change, in S. Rayner and E. L. Malone (eds), Human Choice and Climate Change, Battelle Press.
Rogers, E.M. (2003). Diffusion of innovations (5th ed.). New York: Free Press.
Rotmans, J., Kemp, R. and Van Asselt, M. (2001). More evolution than revolution: Transition management in public policy, foresight 3.1 (2001): 15-31.
Roy, R., Caird, S., Potter, S. (2007). People Centred Eco-design: Consumer adoption and use of low and zero carbon products and systems. In Murphy, J. 2007. Governing Technology for Sustainability. Earthscan, pp 41-62
Rudi,net. (2010). For place’s sake – refurbish, don’t rebuild< Accessed March 2011>
Saldaña, J. (2013): The coding manual of qualitative researchers (2. ed.). Los Angeles, London, New Delhi.
SAP. (2012). BRE: Standard Assessment Procedure (SAP 2012) available at https://www.bre.co.uk/filelibrary/SAP/2012/SAP-2012_9-92.pdf. Standard Assessment Proceedure
Seyfang, G. (2009). Community action for sustainable housing: Building a low-carbon future. Energy Policy, 38(12), 7624-7633.
Shove, E. and G. Walker.(2010). Governing transitions in the sustainability of everyday life. Research Policy 39 (2010) 471–476
Shove, E. and Walker,G.2007. CAUTION! Transitions ahead: politics, practice, and sustainable transition management. Environment and Planning A 39.4 (2007): 763-770.
Sijm, J.P.M. (2002). The Performance of Feed-in Tariffs to Promote Renewable Electricity in European Countries. The Energy Centre of the Netherlands, ECN-C-02-083, 2002.
Simon, K., Wiss, J., Weinfeld,J., Moore,T., Robinson,K., Weincek, C. 2013. Structural Insulated Panels (SIPs). Edited by the Chairs of the Building Enclosure Councils with assistance from Richard Keleher, AIA, CSI, LEED AP. Available at< https://www.wbdg.org/resources/sips.php>
Singh, S., & Kensek, K. (2014). Early Design Analysis Using Optimization Techniques In Design/Practice.
Smith, A., Stirling, A., & Berkhout, F. (2005). The governance of sustainable socio-technical transitions. Research policy, 34(10), 1491-1510.
286

Solnosky, R. L. and Memari, A. M. (2015) Sustainability Metrics for Efficient and Innovative Residential Building Wall Systems, in Engineering Solutions for Sustainability: Materials and Resources II (eds J. W. Fergus, B. Mishra, D. Anderson, E. A. Sarver and N. R. Neelameggham), John Wiley & Sons, Inc., Hoboken, NJ, USA. doi: 10.1002/9781119179856.ch17
Sponge Sustainability Network. (2007). Eco Chic or Eco Geek? The Desirability of Sustainable Homes, Sponge Sustainability Network.
Stern, N. (2007). The Economics of Climate Change – The Stern Review: Cambridge University Press.
Strauss, A. (1987). Qualitative Analysis for Social Scientists. New York. Cambridge University Press
Suri. M., Huld. T.A, Dunlop. E.D, Ossenbrink. H.A, (2007). Potential of Solar Electricity Generation in the European Union Member States and Candidate countries. Solar Energy 81 (2007) 1295–1305
Sustainable Housing Blog. 2010. Code for Sustainable Homes level 6 development Available at< http://www.sustainablehomes.co.uk/blog/bid/46848/Code-for-Sustainable-Homes-level-6-development>
Taki, A.H. and Pendred, R., 2012. Energy Efficient Construction Methods in UK Dwellings.
The Building Act .(1984). Printed in the UK by The Stationery Office Limited.
The Climate Change Act. (2008). Printed in the UK by The Stationery Office Limited.
The HM Government Carbon Plan. (2011). Available at < https://www.gov.uk/government/publications/the-carbon-plan-reducing-greenhouse-gas-emissions--2
The Renewable Energy Dicrect. (2009). ‘Directive 2009/28/EC of the European Parliament and of the Council of 23 April 2009 on the promotion of the use of energy from renewable sources and amending and subsequently repealing Directives 2001/77/EC and 2003/30/EC (Renewable Energy Directive)
The UK Renewable Energy Strategy. (2009). Department of Energy & Climate Change; First published: 15 July 2009
The Zero Carbon Hub. (2010). ‘Zero Carbon Definition for Homes – Carbon Compliance Levels Recommended available at <http://www.zerocarbonhub.org/news_details.aspx?article=18>
The Zero Carbon Hub. (2011). Budget announcement on Zero Carbon New Homes. Available at <http://www.zerocarbonhub.org/news_details.aspx?article=22>
The Zero Carbon Hub. (2011). Allowable Solutions for Tomorrows New Homes: towards a Workable Framework. Available at < www.zerocarbonhub.org>
The Zero Carbon Hub. (2009). Developing the Marketing Plan Interim Report of the Consumer Engagement Workstream. Available at <
287

http://www.zerocarbonhub.org/sites/default/files/resources/reports/Developing_the_Marketing_Plan-Interim_Report_2009.pdf >
Theobald, K., & Walker, S. (2008). Meeting the challenge of zero carbon homes: a multi-disciplinary review of the literature and assessment of key barriers and enablers. Northampton University
Thomas, P. (1987). The use of social research: myths and models, In M.Bulmer (ed.), Social Research and Government: Comparative essays on Britain and the United States. Cambridge University Presspp.51-60
Towers and Watson. (2009). UK Long-term Statistics.2009
Town and Country Planning Act (1947). State. Wiley online Library. http://onlinelibrary.wiley.com/doi/10.1111/j.1468-2230.1948.tb00073.x/pdf
Trist, E. and Murray, H. (1993). Historical overview: the foundation and development of the The foundation and development of the Tavistock Institute to 1989. In E. Trist and H. Murray (Eds.): The Social Engagement of Social Science, Vol 2: The Socio-Technical Perspective, University of Pennsylvania Press, Philadelphia.
UNFCCC (1998). Kyoto Protocol to the United Nations Framework Convention on Climate Change. URL: http://unfccc.int/resource/docs/convkp/kpeng.pdf. United Nations Framework Convention on Climate ChangeUnited Nations framework convention on climate change. (1997). Kyoto Protocol. Kyoto.
United Nations Framework Convention on Climate Change. (2009) Copenhagen Accord. Available at http://unfccc.int/resource/docs/2009/cop15/eng/l07.pdf. Accessed April 14, 2010.
Uswitch Price Search Online. (2010). Available at: <http://www.uswitch.com [Accessed January 2011]
University of Wisconsin. (2015). About TRNSYS. Available at: http://sel.me.wisc.edu/trnsys/faq/faq.htm#General
Van Dam, K. H. (2009). Capturing socio-technical systems with agent-based modelling, PhD thesis, Delft University of Technology, Delft, the Netherlands.
Verbong, G,. and Geels, F. (2007). The ongoing energy transition: lessons from a socio-technical, multi-level analysis of the Dutch electricity system (1960–2004). Energy policy 35.2 (2007): 1025-1037.
Wellings, F. (2006). Private Housebuilding Annual 2006.Troubadour Publishing, London.
Whitmarsh, L. (2012). How useful is the Multi-Level Perspective for transport and sustainability research?. Journal of Transport Geography, 24, 483-487.
WHO. 2004. Ventilation rates and moisture-related allergens in UK dwellings. 2nd WHO International Housing and Health Symposium, Vilnius, Lithuania, 2004. World Health Organisation
Wilkinson, S., Reed, R. (2008). Property Development. Fifth edition. Routledge.
288

Williams, K. and Dair, C. (2007). What is Stopping Sustainable Building in England? Barriers Experienced by Stakeholders in Delivering. Sustainable Development. Volume 15, Issue 3, pages 135–147, May/June 2007
Wisniewski, R. (Eds.), Life history and narrative (pp. 3–25). London: Falmer.
WWF. (2005). Investing in Sustainability. Progress and Performance Among the UK’s Listed House-builders. WWF-UK, Surrey. World Wildlife Fund for Nature
Yin, R. K. (1994). Case study research: Design and methods (2nd ed.). Thousand Oaks, CA: Sage
289