equasis statistics---the-world-fleet-2005
TRANSCRIPT


The world merchant fleetin 2005
Statistics from Equasis

Equasis statistics The world merchant fleet in 2005
1
Table of content
1. Themes and Tables....................................................................... 3
1.1. Overview ......................................................................................................... 3
1.2. Size................................................................................................................. 3
1.3. Type................................................................................................................ 3
2. The World Fleet Population ............................................................ 5
2.1. Whole fleet....................................................................................................... 6
2.2. Ships by age .................................................................................................... 7
2.3. Ships by flag .................................................................................................. 11
3. Classification Societies .................................................................17
3.1. Class status.................................................................................................... 19
3.2. Class status and age ....................................................................................... 24
3.3. Class status and flag ....................................................................................... 44
3.4. Safety performance......................................................................................... 54
4. P&I Clubs ...................................................................................57
4.1. P&I status ...................................................................................................... 58
4.2. P&I and age ................................................................................................... 63
4.3. Non P&I and age............................................................................................. 68
4.4. P&I status and flag.......................................................................................... 73
4.5. Safety performance......................................................................................... 78
5. Port State Control........................................................................81
5.1. Over inspection............................................................................................... 82
5.2. Un-inspected ships .......................................................................................... 85
5.3. Un-inspected ships by age................................................................................ 86
5.4. Un-inspected ships by Class ............................................................................. 91
5.5. Ship inspections by flag ................................................................................... 96
5.6. Ship inspections by P&I.................................................................................. 101
6. Vetting program and trade associations........................................107
6.1. Scheme status.............................................................................................. 108
6.2. Safety performance....................................................................................... 108
6.3. Company performance................................................................................... 110

Equasis statistics The world merchant fleet in 2005
2

Equasis statistics The world merchant fleet in 2005
3
1. Themes and Tables
INTRODUCTION
This report provides a picture of the world’s
merchant fleet derived from data contained
in the EQUASIS database. It looks at the
make up of the fleet and its performance.
The statistics are grouped into themes which
could be of interest to the industry and
regulators.
The themes are as follows:
1. The Fleet Population
2. Classification Societies
3. P&I Clubs
4. Port State Control
5. Vetting Programmes and Trade
Associations
1.1. OVERVIEW
EQUASIS is populated with most of the
world’s merchant ships. Basic particulars are
derived from Lloyds Register Fairplay’s
commercial database (LRF). From a
commercial and regulatory point of view size
and type are two key criteria and therefore
throughout this report the statistical analysis
is based on these two elements.
1.2. SIZE
By size ships are grouped into three
categories:
1. Small ships
less than 500GT
2. Medium ships
between 500GT and 25.000 GT
3. Large ships
between 25.000GT and 60.000 GT
4. Very Large ships
over 60.000GT
The small ships category reflects the
tonnage threshold for cargo ships to comply
with the SOLAS convention. This category
includes many ships which do not trade
internationally.
Regulatory and commercial tonnage
thresholds are not common to all ship types.
Instead categories 2, 3 and 4 have been
chosen so as to divide the fleet into three
approximately equal parts in terms of
tonnage and reflects the larger worldwide
trading ships.
1.3. TYPE
EQUASIS uses over 100 descriptions of ship
type. For this report these types have been
aggregated into 13 main types as follows:
• General Cargo Ships
• Specialized Cargo Ships
• Container Ships
• Ro-Ro Cargo Ships
• Bulk Carriers
• Oil And Chemical Tankers
• Gas Tankers
• Other Tankers
• Passenger Ships
• Offshore Vessels
• Service Ships
• Tugs
• Leisure Vessels
A table showing this aggregation is at Annex
I.
Chapter 1

Equasis statistics The world merchant fleet in 2005
4

Equasis statistics The world merchant fleet in 2005
5
2. The World Fleet Population
INTRODUCTION
The tables in this chapter give a picture of
the fleet of ships in EQUASIS in terms of
type, size, age and the flag under which the
ship is registered. Flags are grouped in two
categories, black and non-black. The so-
called black flags are those whose safety
performance as measured by the detention
rate of their ships leads to them being
targeted for inspection by port state control
authorities. The Paris MoU, Tokyo MoU and
USCG each publish annually a list of
targeted flags. The black flag group used in
the tables in chapter 2.3 includes those flags
which appear on at least one of the annual
lists for 2004. A list of these flags is at
Annex II.
RESULTS
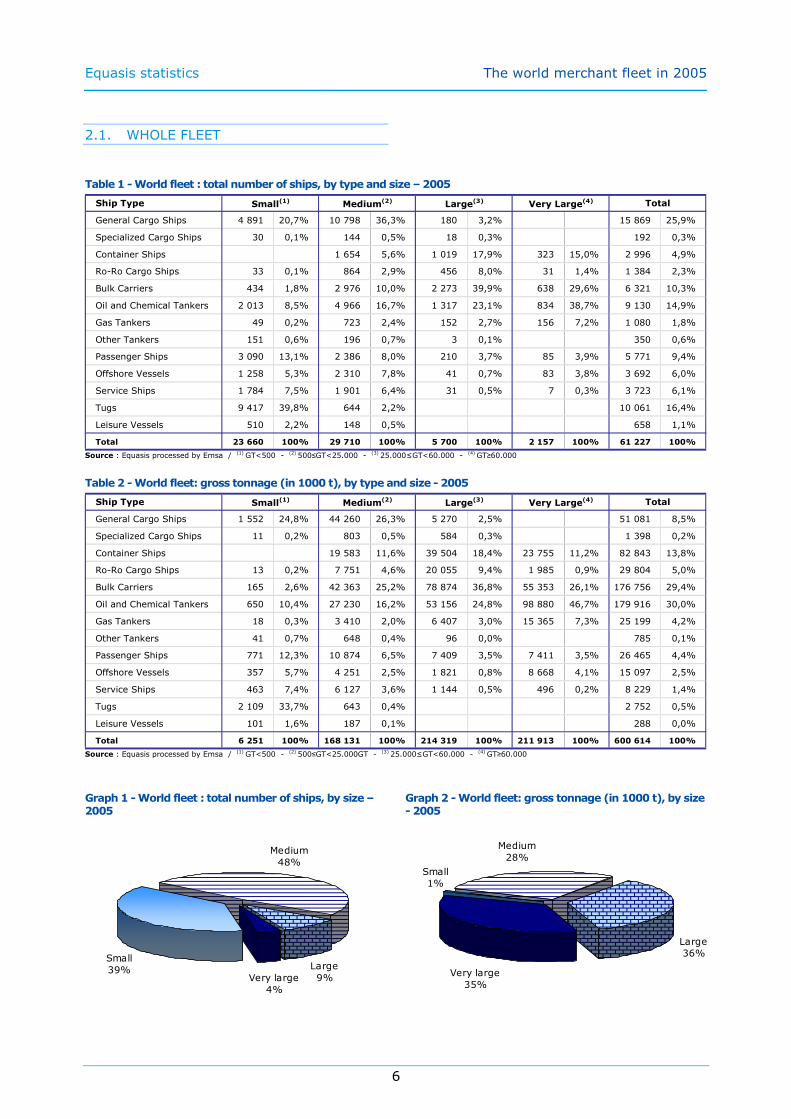
Table 1 shows that by number the EQUASIS
fleet is dominated (87%) by small and
medium sized ships up to 25.000 gt. Many
of the small ships are not subject to
international conventions on safety and
pollution prevention because of their size or
because they do not trade internationally.
Tugs and general cargo ships dominate the
small ship category (60.5%) with general
cargo ships and oil/chemical tankers
accounting for over half of medium sized
ships. In terms of tonnage the large and
very large categories represent 71% of the
whole fleet, with oil and chemical tankers
and bulk carriers dominating both categories
at 61.8% and 69,5% respectively.
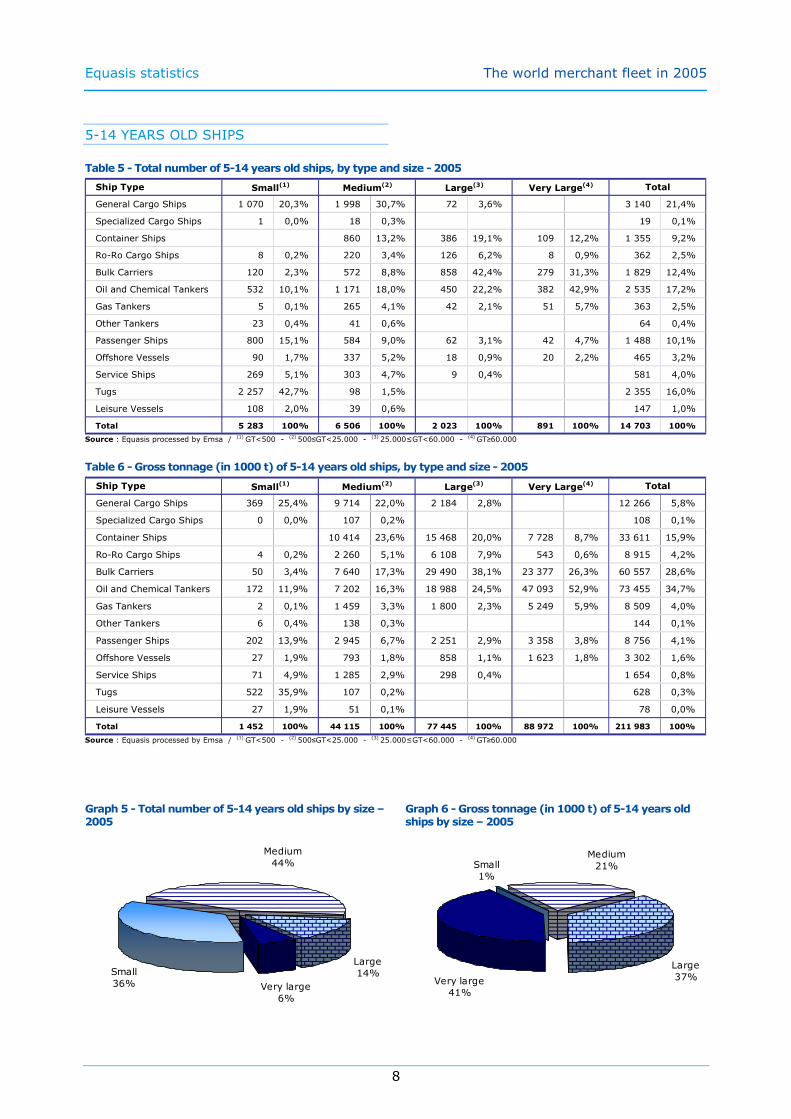
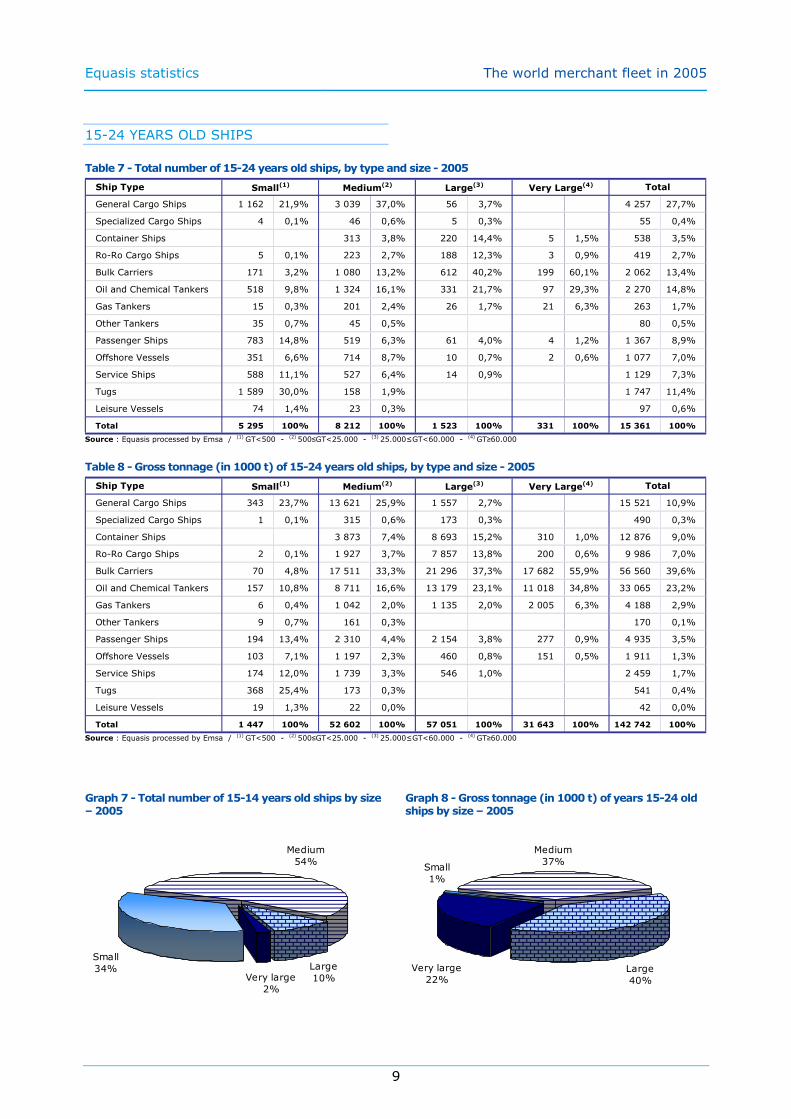
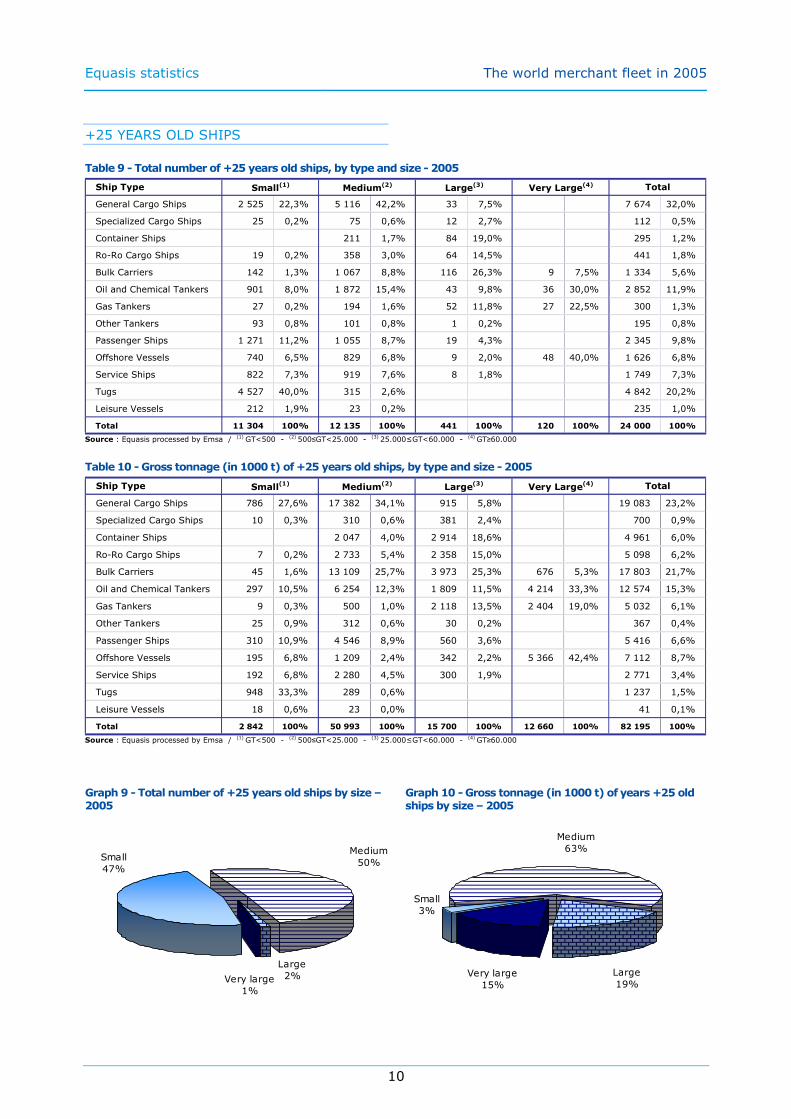
Tables 3 and 4 reveal that by number and
by tonnage the fleet up to 4 years old has a
higher proportion of large and very large
ships than the overall average (35% by
number compared with an overall average
of 13% and 87% by tonnage compared with
an overall average of 71%). At the other
end of the age scale large and very large
ships account for just 3% by number and
34% by tonnage of the EQUASIS fleet over
25 years old.
Graph 11 shows that nearly three-quarters
of the fleet is not registered with a black
listed flag. As tables 13-20 show this
proportion is more or less the same for each
size category. For general cargo ships their
share of the fleet under black flags is
noticeably greater (36.9%) than their share
of the non-black flag fleet. Conversely
passenger ships are 5.3% of the black flag
fleet but 11% of the non-black flag fleet.
Chapter 2
Equasis statistics The world merchant fleet in 2005
6
2.1. WHOLE FLEET
Table 1 - World fleet : total number of ships, by type and size – 2005
Ship Type
General Cargo Ships 4 891 20,7% 10 798 36,3% 180 3,2% 15 869 25,9%
Specialized Cargo Ships 30 0,1% 144 0,5% 18 0,3% 192 0,3%
Container Ships 1 654 5,6% 1 019 17,9% 323 15,0% 2 996 4,9%
Ro-Ro Cargo Ships 33 0,1% 864 2,9% 456 8,0% 31 1,4% 1 384 2,3%
Bulk Carriers 434 1,8% 2 976 10,0% 2 273 39,9% 638 29,6% 6 321 10,3%
Oil and Chemical Tankers 2 013 8,5% 4 966 16,7% 1 317 23,1% 834 38,7% 9 130 14,9%
Gas Tankers 49 0,2% 723 2,4% 152 2,7% 156 7,2% 1 080 1,8%
Other Tankers 151 0,6% 196 0,7% 3 0,1% 350 0,6%
Passenger Ships 3 090 13,1% 2 386 8,0% 210 3,7% 85 3,9% 5 771 9,4%
Offshore Vessels 1 258 5,3% 2 310 7,8% 41 0,7% 83 3,8% 3 692 6,0%
Service Ships 1 784 7,5% 1 901 6,4% 31 0,5% 7 0,3% 3 723 6,1%
Tugs 9 417 39,8% 644 2,2% 10 061 16,4%
Leisure Vessels 510 2,2% 148 0,5% 658 1,1%
Total 23 660 100% 29 710 100% 5 700 100% 2 157 100% 61 227 100%
Large(3)Small(1) Medium(2) TotalVery Large(4)
Source : Equasis processed by Emsa / (1) GT<500 - (2) 500≤GT<25.000 - (3) 25.000≤GT<60.000 - (4) GT≥60.000
Table 2 - World fleet: gross tonnage (in 1000 t), by type and size - 2005
Ship Type
General Cargo Ships 1 552 24,8% 44 260 26,3% 5 270 2,5% 51 081 8,5%
Specialized Cargo Ships 11 0,2% 803 0,5% 584 0,3% 1 398 0,2%
Container Ships 19 583 11,6% 39 504 18,4% 23 755 11,2% 82 843 13,8%
Ro-Ro Cargo Ships 13 0,2% 7 751 4,6% 20 055 9,4% 1 985 0,9% 29 804 5,0%
Bulk Carriers 165 2,6% 42 363 25,2% 78 874 36,8% 55 353 26,1% 176 756 29,4%
Oil and Chemical Tankers 650 10,4% 27 230 16,2% 53 156 24,8% 98 880 46,7% 179 916 30,0%
Gas Tankers 18 0,3% 3 410 2,0% 6 407 3,0% 15 365 7,3% 25 199 4,2%
Other Tankers 41 0,7% 648 0,4% 96 0,0% 785 0,1%
Passenger Ships 771 12,3% 10 874 6,5% 7 409 3,5% 7 411 3,5% 26 465 4,4%
Offshore Vessels 357 5,7% 4 251 2,5% 1 821 0,8% 8 668 4,1% 15 097 2,5%
Service Ships 463 7,4% 6 127 3,6% 1 144 0,5% 496 0,2% 8 229 1,4%
Tugs 2 109 33,7% 643 0,4% 2 752 0,5%
Leisure Vessels 101 1,6% 187 0,1% 288 0,0%
Total 6 251 100% 168 131 100% 214 319 100% 211 913 100% 600 614 100%
TotalSmall(1) Medium(2) Large(3) Very Large(4)
Source : Equasis processed by Emsa / (1) GT<500 - (2) 500≤GT<25.000GT - (3) 25.000≤GT<60.000 - (4) GT≥60.000
Graph 1 - World fleet : total number of ships, by size – 2005
Very large
4%
Small
39% Large
9%
Medium
48%
Graph 2 - World fleet: gross tonnage (in 1000 t), by size - 2005
Medium
28%
Large
36%
Small
1%
Very large
35%

Equasis statistics The world merchant fleet in 2005
7
2.2. SHIPS BY AGE
0-4 YEARS OLD SHIPS
Table 3 - Total number of 0-4 years old ships, by type and size - 2005
Ship Type
General Cargo Ships 134 7,5% 645 22,6% 19 1,1% 798 11,1%
Specialized Cargo Ships 5 0,2% 1 0,1% 6 0,1%
Container Ships 270 9,5% 329 19,2% 209 25,6% 808 11,3%
Ro-Ro Cargo Ships 1 0,1% 63 2,2% 78 4,6% 20 2,5% 162 2,3%
Bulk Carriers 1 0,1% 257 9,0% 687 40,1% 151 18,5% 1 096 15,3%
Oil and Chemical Tankers 62 3,5% 599 21,0% 493 28,8% 319 39,1% 1 473 20,6%
Gas Tankers 2 0,1% 63 2,2% 32 1,9% 57 7,0% 154 2,1%
Other Tankers 9 0,3% 2 0,1% 11 0,2%
Passenger Ships 236 13,3% 228 8,0% 68 4,0% 39 4,8% 571 8,0%
Offshore Vessels 77 4,3% 430 15,1% 4 0,2% 13 1,6% 524 7,3%
Service Ships 105 5,9% 152 5,3% 7 0,9% 264 3,7%
Tugs 1 044 58,7% 73 2,6% 1 117 15,6%
Leisure Vessels 116 6,5% 63 2,2% 179 2,5%
Total 1 778 100% 2 857 100% 1 713 100% 815 100% 7 163 100%
Large(3)Small(1) Medium(2) TotalVery Large(4)
Source : Equasis processed by Emsa / (1) GT<500 - (2) 500≤GT<25.000 - (3) 25.000≤GT<60.000 - (4) GT≥60.000
Table 4 - Gross tonnage (in 1000 t) of 0-4 years old ships, by type and size - 2005
Ship Type
General Cargo Ships 54 10,7% 3 543 17,3% 613 1,0% 4 211 2,6%
Specialized Cargo Ships 71 0,3% 30 0,0% 101 0,1%
Container Ships 3 248 15,9% 12 429 19,4% 15 718 20,0% 31 394 19,2%
Ro-Ro Cargo Ships 0 0,1% 832 4,1% 3 731 5,8% 1 242 1,6% 5 805 3,5%
Bulk Carriers 0 0,1% 4 103 20,1% 24 115 37,6% 13 618 17,3% 41 837 25,6%
Oil and Chemical Tankers 24 4,7% 5 063 24,8% 19 179 29,9% 36 556 46,5% 60 822 37,2%
Gas Tankers 1 0,2% 408 2,0% 1 353 2,1% 5 707 7,3% 7 470 4,6%
Other Tankers 38 0,2% 66 0,1% 104 0,1%
Passenger Ships 66 12,9% 1 074 5,3% 2 445 3,8% 3 775 4,8% 7 359 4,5%
Offshore Vessels 31 6,2% 1 052 5,1% 162 0,3% 1 528 1,9% 2 772 1,7%
Service Ships 25 5,0% 824 4,0% 496 0,6% 1 345 0,8%
Tugs 271 53,2% 75 0,4% 346 0,2%
Leisure Vessels 37 7,2% 91 0,4% 127 0,1%
Total 510 100% 20 421 100% 64 124 100% 78 639 100% 163 694 100%
TotalSmall(1)
Medium(2)
Large(3)
Very Large(4)
Source : Equasis processed by Emsa / (1) GT<500 - (2) 500≤GT<25.000 - (3) 25.000≤GT<60.000 - (4) GT≥60.000
Graph 3 - World fleet : total number of 0-4 years old ships, by size – 2005
Very large
11%
Small
25%
Large
24%
Medium
40%
Graph 4 - World fleet : gross tonnage (in 1000 t) of 0-4 years old ships by size – 2005
Medium
12%
Large
39%
Small
0%
Very large
49%
Equasis statistics The world merchant fleet in 2005
8
5-14 YEARS OLD SHIPS
Table 5 - Total number of 5-14 years old ships, by type and size - 2005
Ship Type
General Cargo Ships 1 070 20,3% 1 998 30,7% 72 3,6% 3 140 21,4%
Specialized Cargo Ships 1 0,0% 18 0,3% 19 0,1%
Container Ships 860 13,2% 386 19,1% 109 12,2% 1 355 9,2%
Ro-Ro Cargo Ships 8 0,2% 220 3,4% 126 6,2% 8 0,9% 362 2,5%
Bulk Carriers 120 2,3% 572 8,8% 858 42,4% 279 31,3% 1 829 12,4%
Oil and Chemical Tankers 532 10,1% 1 171 18,0% 450 22,2% 382 42,9% 2 535 17,2%
Gas Tankers 5 0,1% 265 4,1% 42 2,1% 51 5,7% 363 2,5%
Other Tankers 23 0,4% 41 0,6% 64 0,4%
Passenger Ships 800 15,1% 584 9,0% 62 3,1% 42 4,7% 1 488 10,1%
Offshore Vessels 90 1,7% 337 5,2% 18 0,9% 20 2,2% 465 3,2%
Service Ships 269 5,1% 303 4,7% 9 0,4% 581 4,0%
Tugs 2 257 42,7% 98 1,5% 2 355 16,0%
Leisure Vessels 108 2,0% 39 0,6% 147 1,0%
Total 5 283 100% 6 506 100% 2 023 100% 891 100% 14 703 100%
Large(3)Small(1) Medium(2) TotalVery Large(4)
Source : Equasis processed by Emsa / (1) GT<500 - (2) 500≤GT<25.000 - (3) 25.000≤GT<60.000 - (4) GT≥60.000
Table 6 - Gross tonnage (in 1000 t) of 5-14 years old ships, by type and size - 2005
Ship Type
General Cargo Ships 369 25,4% 9 714 22,0% 2 184 2,8% 12 266 5,8%
Specialized Cargo Ships 0 0,0% 107 0,2% 108 0,1%
Container Ships 10 414 23,6% 15 468 20,0% 7 728 8,7% 33 611 15,9%
Ro-Ro Cargo Ships 4 0,2% 2 260 5,1% 6 108 7,9% 543 0,6% 8 915 4,2%
Bulk Carriers 50 3,4% 7 640 17,3% 29 490 38,1% 23 377 26,3% 60 557 28,6%
Oil and Chemical Tankers 172 11,9% 7 202 16,3% 18 988 24,5% 47 093 52,9% 73 455 34,7%
Gas Tankers 2 0,1% 1 459 3,3% 1 800 2,3% 5 249 5,9% 8 509 4,0%
Other Tankers 6 0,4% 138 0,3% 144 0,1%
Passenger Ships 202 13,9% 2 945 6,7% 2 251 2,9% 3 358 3,8% 8 756 4,1%
Offshore Vessels 27 1,9% 793 1,8% 858 1,1% 1 623 1,8% 3 302 1,6%
Service Ships 71 4,9% 1 285 2,9% 298 0,4% 1 654 0,8%
Tugs 522 35,9% 107 0,2% 628 0,3%
Leisure Vessels 27 1,9% 51 0,1% 78 0,0%
Total 1 452 100% 44 115 100% 77 445 100% 88 972 100% 211 983 100%
TotalSmall(1)
Medium(2)
Large(3)
Very Large(4)
Source : Equasis processed by Emsa / (1) GT<500 - (2) 500≤GT<25.000 - (3) 25.000≤GT<60.000 - (4) GT≥60.000
Graph 5 - Total number of 5-14 years old ships by size – 2005
Medium
44%
Large
14%Small
36% Very large
6%
Graph 6 - Gross tonnage (in 1000 t) of 5-14 years old ships by size – 2005
Very large
41%
Small
1%
Large
37%
Medium
21%
Equasis statistics The world merchant fleet in 2005
9
15-24 YEARS OLD SHIPS
Table 7 - Total number of 15-24 years old ships, by type and size - 2005
Ship Type
General Cargo Ships 1 162 21,9% 3 039 37,0% 56 3,7% 4 257 27,7%
Specialized Cargo Ships 4 0,1% 46 0,6% 5 0,3% 55 0,4%
Container Ships 313 3,8% 220 14,4% 5 1,5% 538 3,5%
Ro-Ro Cargo Ships 5 0,1% 223 2,7% 188 12,3% 3 0,9% 419 2,7%
Bulk Carriers 171 3,2% 1 080 13,2% 612 40,2% 199 60,1% 2 062 13,4%
Oil and Chemical Tankers 518 9,8% 1 324 16,1% 331 21,7% 97 29,3% 2 270 14,8%
Gas Tankers 15 0,3% 201 2,4% 26 1,7% 21 6,3% 263 1,7%
Other Tankers 35 0,7% 45 0,5% 80 0,5%
Passenger Ships 783 14,8% 519 6,3% 61 4,0% 4 1,2% 1 367 8,9%
Offshore Vessels 351 6,6% 714 8,7% 10 0,7% 2 0,6% 1 077 7,0%
Service Ships 588 11,1% 527 6,4% 14 0,9% 1 129 7,3%
Tugs 1 589 30,0% 158 1,9% 1 747 11,4%
Leisure Vessels 74 1,4% 23 0,3% 97 0,6%
Total 5 295 100% 8 212 100% 1 523 100% 331 100% 15 361 100%
Large(3)Small(1) Medium(2) TotalVery Large(4)
Source : Equasis processed by Emsa / (1) GT<500 - (2) 500≤GT<25.000 - (3) 25.000≤GT<60.000 - (4) GT≥60.000
Table 8 - Gross tonnage (in 1000 t) of 15-24 years old ships, by type and size - 2005
Ship Type
General Cargo Ships 343 23,7% 13 621 25,9% 1 557 2,7% 15 521 10,9%
Specialized Cargo Ships 1 0,1% 315 0,6% 173 0,3% 490 0,3%
Container Ships 3 873 7,4% 8 693 15,2% 310 1,0% 12 876 9,0%
Ro-Ro Cargo Ships 2 0,1% 1 927 3,7% 7 857 13,8% 200 0,6% 9 986 7,0%
Bulk Carriers 70 4,8% 17 511 33,3% 21 296 37,3% 17 682 55,9% 56 560 39,6%
Oil and Chemical Tankers 157 10,8% 8 711 16,6% 13 179 23,1% 11 018 34,8% 33 065 23,2%
Gas Tankers 6 0,4% 1 042 2,0% 1 135 2,0% 2 005 6,3% 4 188 2,9%
Other Tankers 9 0,7% 161 0,3% 170 0,1%
Passenger Ships 194 13,4% 2 310 4,4% 2 154 3,8% 277 0,9% 4 935 3,5%
Offshore Vessels 103 7,1% 1 197 2,3% 460 0,8% 151 0,5% 1 911 1,3%
Service Ships 174 12,0% 1 739 3,3% 546 1,0% 2 459 1,7%
Tugs 368 25,4% 173 0,3% 541 0,4%
Leisure Vessels 19 1,3% 22 0,0% 42 0,0%
Total 1 447 100% 52 602 100% 57 051 100% 31 643 100% 142 742 100%
TotalSmall(1) Medium(2) Large(3) Very Large(4)
Source : Equasis processed by Emsa / (1) GT<500 - (2) 500≤GT<25.000 - (3) 25.000≤GT<60.000 - (4) GT≥60.000
Graph 7 - Total number of 15-14 years old ships by size – 2005
Very large
2%
Small
34% Large
10%
Medium
54%
Graph 8 - Gross tonnage (in 1000 t) of years 15-24 old ships by size – 2005
Medium
37%
Large
40%
Small
1%
Very large
22%
Equasis statistics The world merchant fleet in 2005
10
+25 YEARS OLD SHIPS
Table 9 - Total number of +25 years old ships, by type and size - 2005
Ship Type
General Cargo Ships 2 525 22,3% 5 116 42,2% 33 7,5% 7 674 32,0%
Specialized Cargo Ships 25 0,2% 75 0,6% 12 2,7% 112 0,5%
Container Ships 211 1,7% 84 19,0% 295 1,2%
Ro-Ro Cargo Ships 19 0,2% 358 3,0% 64 14,5% 441 1,8%
Bulk Carriers 142 1,3% 1 067 8,8% 116 26,3% 9 7,5% 1 334 5,6%
Oil and Chemical Tankers 901 8,0% 1 872 15,4% 43 9,8% 36 30,0% 2 852 11,9%
Gas Tankers 27 0,2% 194 1,6% 52 11,8% 27 22,5% 300 1,3%
Other Tankers 93 0,8% 101 0,8% 1 0,2% 195 0,8%
Passenger Ships 1 271 11,2% 1 055 8,7% 19 4,3% 2 345 9,8%
Offshore Vessels 740 6,5% 829 6,8% 9 2,0% 48 40,0% 1 626 6,8%
Service Ships 822 7,3% 919 7,6% 8 1,8% 1 749 7,3%
Tugs 4 527 40,0% 315 2,6% 4 842 20,2%
Leisure Vessels 212 1,9% 23 0,2% 235 1,0%
Total 11 304 100% 12 135 100% 441 100% 120 100% 24 000 100%
Large(3)Small(1) Medium(2) TotalVery Large(4)
Source : Equasis processed by Emsa / (1) GT<500 - (2) 500≤GT<25.000 - (3) 25.000≤GT<60.000 - (4) GT≥60.000
Table 10 - Gross tonnage (in 1000 t) of +25 years old ships, by type and size - 2005
Ship Type
General Cargo Ships 786 27,6% 17 382 34,1% 915 5,8% 19 083 23,2%
Specialized Cargo Ships 10 0,3% 310 0,6% 381 2,4% 700 0,9%
Container Ships 2 047 4,0% 2 914 18,6% 4 961 6,0%
Ro-Ro Cargo Ships 7 0,2% 2 733 5,4% 2 358 15,0% 5 098 6,2%
Bulk Carriers 45 1,6% 13 109 25,7% 3 973 25,3% 676 5,3% 17 803 21,7%
Oil and Chemical Tankers 297 10,5% 6 254 12,3% 1 809 11,5% 4 214 33,3% 12 574 15,3%
Gas Tankers 9 0,3% 500 1,0% 2 118 13,5% 2 404 19,0% 5 032 6,1%
Other Tankers 25 0,9% 312 0,6% 30 0,2% 367 0,4%
Passenger Ships 310 10,9% 4 546 8,9% 560 3,6% 5 416 6,6%
Offshore Vessels 195 6,8% 1 209 2,4% 342 2,2% 5 366 42,4% 7 112 8,7%
Service Ships 192 6,8% 2 280 4,5% 300 1,9% 2 771 3,4%
Tugs 948 33,3% 289 0,6% 1 237 1,5%
Leisure Vessels 18 0,6% 23 0,0% 41 0,1%
Total 2 842 100% 50 993 100% 15 700 100% 12 660 100% 82 195 100%
TotalSmall(1)
Medium(2)
Large(3)
Very Large(4)
Source : Equasis processed by Emsa / (1) GT<500 - (2) 500≤GT<25.000 - (3) 25.000≤GT<60.000 - (4) GT≥60.000
Graph 9 - Total number of +25 years old ships by size – 2005
Very large
1%
Small
47%
Large
2%
Medium
50%
Graph 10 - Gross tonnage (in 1000 t) of years +25 old ships by size – 2005
Medium
63%
Large
19%
Small
3%
Very large
15%

Equasis statistics The world merchant fleet in 2005
11
2.3. SHIPS BY FLAG
WHOLE FLEET
Table 11 - World fleet : total number of ships, by type and flag – 2005
Ship Type
General Cargo Ships 6 284 36,9% 9 585 21,7% 15 869 25,9%
Specialized Cargo Ships 78 0,5% 114 0,3% 192 0,3%
Container Ships 768 4,5% 2 228 5,0% 2 996 4,9%
Ro-Ro Cargo Ships 498 2,9% 886 2,0% 1 384 2,3%
Bulk Carriers 2 138 12,5% 4 183 9,5% 6 321 10,3%
Oil and Chemical Tankers 2 264 13,3% 6 866 15,5% 9 130 14,9%
Gas Tankers 283 1,7% 797 1,8% 1 080 1,8%
Other Tankers 100 0,6% 250 0,6% 350 0,6%
Passenger Ships 908 5,3% 4 863 11,0% 5 771 9,4%
Offshore Vessels 838 4,9% 2 854 6,5% 3 692 6,0%
Service Ships 623 3,7% 3 100 7,0% 3 723 6,1%
Tugs 2 214 13,0% 7 847 17,8% 10 061 16,4%
Leisure Vessels 45 0,3% 613 1,4% 658 1,1%
Total 17 041 100% 44 186 100% 61 227 100%
Black Flag TotalNon Black Flag
Source : Equasis processed by Emsa
Table 12 - World fleet : gross tonnage (in 1000 t) of ships, by type and flag – 2005
Ship Type
General Cargo Ships 17 982 10,7% 33 100 7,6% 51 081 8,5%
Specialized Cargo Ships 438 0,3% 960 0,2% 1 398 0,2%
Container Ships 21 602 12,9% 61 241 14,1% 82 843 13,8%
Ro-Ro Cargo Ships 11 728 7,0% 18 076 4,2% 29 804 5,0%
Bulk Carriers 66 134 39,5% 110 621 25,5% 176 756 29,4%
Oil and Chemical Tankers 35 169 21,0% 144 747 33,4% 179 916 30,0%
Gas Tankers 5 286 3,2% 19 913 4,6% 25 199 4,2%
Other Tankers 169 0,1% 616 0,1% 785 0,1%
Passenger Ships 3 702 2,2% 22 763 5,3% 26 465 4,4%
Offshore Vessels 3 495 2,1% 11 601 2,7% 15 097 2,5%
Service Ships 990 0,6% 7 240 1,7% 8 229 1,4%
Tugs 598 0,4% 2 155 0,5% 2 752 0,5%
Leisure Vessels 22 0,0% 266 0,1% 288 0,0%
Total 167 315 100% 433 299 100% 600 614 100%
TotalBlack Flag Non Black Flag
Source : Equasis processed by Emsa
Graph 11 - World fleet : total number of ships, by flag – 2005
Non Black
Flag
72%
Black Flag
28%
Graph 12 - World fleet : gross tonnage (in 1000 t) of ships, by flag – 2005
Black Flag
28%
Non Black
Flag
72%

Equasis statistics The world merchant fleet in 2005
12
SMALL SHIPS
Table 13 - Total number of small(1) ships, by type and flag – 2005
Ship Type
General Cargo Ships 1 577 30,1% 3 314 18,0% 4 891 20,7%
Specialized Cargo Ships 16 0,3% 14 0,1% 30 0,1%
Container Ships
Ro-Ro Cargo Ships 10 0,2% 23 0,1% 33 0,1%
Bulk Carriers 52 1,0% 382 2,1% 434 1,8%
Oil and Chemical Tankers 375 7,2% 1 638 8,9% 2 013 8,5%
Gas Tankers 5 0,1% 44 0,2% 49 0,2%
Other Tankers 41 0,8% 110 0,6% 151 0,6%
Passenger Ships 468 8,9% 2 622 14,2% 3 090 13,1%
Offshore Vessels 298 5,7% 960 5,2% 1 258 5,3%
Service Ships 278 5,3% 1 506 8,2% 1 784 7,5%
Tugs 2 080 39,8% 7 337 39,8% 9 417 39,8%
Leisure Vessels 32 0,6% 478 2,6% 510 2,2%
Total 5 232 100% 18 428 100% 23 660 100%
Black Flag TotalNon Black Flag
Source : Equasis processed by Emsa - (1) GT<500
Table 14 - Gross tonnage (in 1000 t) of small(1) ships, by type and flag – 2005
Ship Type
General Cargo Ships 503 34,9% 1 049 21,8% 1 552 24,8%
Specialized Cargo Ships 7 0,5% 5 0,1% 11 0,2%
Container Ships
Ro-Ro Cargo Ships 4 0,3% 9 0,2% 13 0,2%
Bulk Carriers 20 1,4% 145 3,0% 165 2,6%
Oil and Chemical Tankers 131 9,1% 520 10,8% 650 10,4%
Gas Tankers 2 0,2% 16 0,3% 18 0,3%
Other Tankers 11 0,8% 29 0,6% 41 0,7%
Passenger Ships 123 8,5% 649 13,5% 771 12,3%
Offshore Vessels 88 6,1% 268 5,6% 357 5,7%
Service Ships 73 5,1% 390 8,1% 463 7,4%
Tugs 468 32,5% 1 641 34,1% 2 109 33,7%
Leisure Vessels 9 0,7% 92 1,9% 101 1,6%
Total 1 440 100% 4 811 100% 6 251 100%
TotalBlack Flag Non Black Flag
Source : Equasis processed by Emsa - (1) GT<500
Graph 13 - Total number of small ships, by flag – 2005
Non Black
Flag
78%
Black Flag
22%
Graph 14 - Gross tonnage (in 1000 t) of small ships, by
flag – 2005
Black Flag
23%
Non Black
Flag
77%

Equasis statistics The world merchant fleet in 2005
13
MEDIUM SHIPS
Table 15 - Total number of medium(1) ships, by type and flag – 2005
Ship Type
General Cargo Ships 4 696 48,3% 6 102 30,5% 10 798 36,3%
Specialized Cargo Ships 54 0,6% 90 0,5% 144 0,5%
Container Ships 444 4,6% 1 210 6,1% 1 654 5,6%
Ro-Ro Cargo Ships 274 2,8% 590 3,0% 864 2,9%
Bulk Carriers 1 027 10,6% 1 949 9,7% 2 976 10,0%
Oil and Chemical Tankers 1 540 15,8% 3 426 17,1% 4 966 16,7%
Gas Tankers 209 2,2% 514 2,6% 723 2,4%
Other Tankers 59 0,6% 137 0,7% 196 0,7%
Passenger Ships 413 4,2% 1 973 9,9% 2 386 8,0%
Offshore Vessels 512 5,3% 1 798 9,0% 2 310 7,8%
Service Ships 343 3,5% 1 558 7,8% 1 901 6,4%
Tugs 134 1,4% 510 2,6% 644 2,2%
Leisure Vessels 13 0,1% 135 0,7% 148 0,5%
Total 9 718 100% 19 992 100% 29 710 100%
Black Flag TotalNon Black Flag
Source : Equasis processed by Emsa - (1) 500≤GT<25.000
Table 16 - Gross tonnage (in 1000 t) of medium(1) ships, by type and flag – 2005
Ship Type
General Cargo Ships 17 190 33,8% 27 070 23,1% 44 260 26,3%
Specialized Cargo Ships 188 0,4% 615 0,5% 803 0,5%
Container Ships 5 238 10,3% 14 345 12,2% 19 583 11,6%
Ro-Ro Cargo Ships 2 155 4,2% 5 597 4,8% 7 751 4,6%
Bulk Carriers 14 545 28,6% 27 818 23,7% 42 363 25,2%
Oil and Chemical Tankers 6 825 13,4% 20 405 17,4% 27 230 16,2%
Gas Tankers 893 1,8% 2 517 2,1% 3 410 2,0%
Other Tankers 158 0,3% 490 0,4% 648 0,4%
Passenger Ships 1 810 3,6% 9 064 7,7% 10 874 6,5%
Offshore Vessels 809 1,6% 3 441 2,9% 4 251 2,5%
Service Ships 854 1,7% 5 273 4,5% 6 127 3,6%
Tugs 129 0,3% 514 0,4% 643 0,4%
Leisure Vessels 12 0,0% 174 0,1% 187 0,1%
Total 50 806 100% 117 325 100% 168 131 100%
TotalBlack Flag Non Black Flag
Source : Equasis processed by Emsa - (1) 500≤GT<25.000
Graph 15 - Total number of medium ships, by flag – 2005
Non Black
Flag
67%
Black Flag
33%
Graph 16 - Gross tonnage (in 1000 t) of medium ships, by flag – 2005
Black Flag
30%
Non Black
Flag
70%

Equasis statistics The world merchant fleet in 2005
14
LARGE SHIPS
Table 17 - Total number of large(1) ships, by type and flag – 2005
Ship Type
General Cargo Ships 11 0,7% 169 4,0% 180 3,2%
Specialized Cargo Ships 8 0,5% 10 0,2% 18 0,3%
Container Ships 225 14,9% 794 18,9% 1 019 17,9%
Ro-Ro Cargo Ships 201 13,3% 255 6,1% 456 8,0%
Bulk Carriers 788 52,3% 1 485 35,4% 2 273 39,9%
Oil and Chemical Tankers 208 13,8% 1 109 26,4% 1 317 23,1%
Gas Tankers 44 2,9% 108 2,6% 152 2,7%
Other Tankers 3 0,1% 3 0,1%
Passenger Ships 13 0,9% 197 4,7% 210 3,7%
Offshore Vessels 6 0,4% 35 0,8% 41 0,7%
Service Ships 2 0,1% 29 0,7% 31 0,5%
Tugs
Leisure Vessels
Total 1 506 100% 4 194 100% 5 700 100%
Black Flag TotalNon Black Flag
Source : Equasis processed by Emsa - (1) 25.000≤GT<60.000
Table 18 - Gross tonnage (in 1000 t) of large(1) ships, by type and flag – 2005
Ship Type
General Cargo Ships 289 0,5% 4 981 3,2% 5 270 2,5%
Specialized Cargo Ships 244 0,4% 340 0,2% 584 0,3%
Container Ships 9 267 16,2% 30 238 19,2% 39 504 18,4%
Ro-Ro Cargo Ships 8 770 15,4% 11 285 7,2% 20 055 9,4%
Bulk Carriers 27 622 48,4% 51 252 32,6% 78 874 36,8%
Oil and Chemical Tankers 8 021 14,1% 45 135 28,7% 53 156 24,8%
Gas Tankers 1 964 3,4% 4 443 2,8% 6 407 3,0%
Other Tankers 96 0,1% 96
Passenger Ships 526 0,9% 6 883 4,4% 7 409 3,5%
Offshore Vessels 267 0,5% 1 555 1,0% 1 821 0,8%
Service Ships 63 0,1% 1 081 0,7% 1 144 0,5%
Tugs
Leisure Vessels
Total 57 031 100% 157 288 100% 214 319 100%
TotalBlack Flag Non Black Flag
Source : Equasis processed by Emsa - (1) 25.000≤GT<60.000
Graph 17 - Total number of large ships, by flag – 2005
Non Black
Flag
74%
Black Flag
26%
Graph 18 - Gross tonnage (in 1000 t) of large ships, by flag – 2005
Black Flag
27%
Non Black
Flag
73%

Equasis statistics The world merchant fleet in 2005
15
VERY LARGE SHIPS
Table 19 - Total number of very large(1) ships, by type and flag – 2005
Ship Type
General Cargo Ships
Specialized Cargo Ships
Container Ships 99 16,9% 224 14,2% 323 15,0%
Ro-Ro Cargo Ships 13 2,2% 18 1,1% 31 1,4%
Bulk Carriers 271 46,3% 367 23,3% 638 29,6%
Oil and Chemical Tankers 141 24,1% 693 44,1% 834 38,7%
Gas Tankers 25 4,3% 131 8,3% 156 7,2%
Other Tankers
Passenger Ships 14 2,4% 71 4,5% 85 3,9%
Offshore Vessels 22 3,8% 61 3,9% 83 3,8%
Service Ships 7 0,4% 7 0,3%
Tugs
Leisure Vessels
Total 585 100% 1 572 100% 2 157 100%
Black Flag TotalNon Black Flag
Source : Equasis processed by Emsa - (1) GT≥60.000
Table 20 - Gross tonnage (in 1000 t) of very large(1) ships, by type and flag – 2005
Ship Type
General Cargo Ships
Specialized Cargo Ships
Container Ships 7 097 12,2% 16 658 10,8% 23 755 11,2%
Ro-Ro Cargo Ships 800 1,4% 1 185 0,8% 1 985 0,9%
Bulk Carriers 23 947 41,3% 31 407 20,4% 55 353 26,1%
Oil and Chemical Tankers 20 192 34,8% 78 688 51,1% 98 880 46,7%
Gas Tankers 2 428 4,2% 12 937 8,4% 15 365 7,3%
Other Tankers
Passenger Ships 1 243 2,1% 6 167 4,0% 7 411 3,5%
Offshore Vessels 2 331 4,0% 6 337 4,1% 8 668 4,1%
Service Ships 496 0,3% 496 0,2%
Tugs
Leisure Vessels
Total 58 038 100% 153 875 100% 211 913 100%
TotalBlack Flag Non Black Flag
Source : Equasis processed by Emsa - (1) GT≥60.000
Graph 19 - Total number of very large ships, by flag – 2005
Non Black
Flag
73%
Black Flag
27%
Graph 20 - Gross tonnage (in 1000 t) of very large ships, by flag – 2005
Black Flag
27%
Non Black
Flag
73%
Equasis statistics The world merchant fleet in 2005
16

Equasis statistics The world merchant fleet in 2005
17
3. Classification Societies
INTRODUCTION
Classification societies provide technical and
surveying services for the shipping industry
and undertake statutory surveys on behalf
of flag states (as so-called “recognized
organizations”). These services are mostly
provided by societies belonging to the
International Association of Classifications
Societies (IACS). There is no requirement
under international conventions for a ship to
be “in class”. However the vast majority of
ships (and their flag state) rely on meeting
the standards of class in order to comply
with the construction standard required
under the SOLAS convention.
The members of IACS are:
• American Bureau of Shipping
• Bureau Veritas
• China Classification Society
• Det Norske Veritas
• Germanischer Lloyd
• Indian Register of Shipping
• Korean Register of Shipping
• Lloyd's Register of Shipping
• Nippon Kaiji Kyokai
• Registro Italiano Navale
• Russian Maritime Register of
Shipping
The tables in this chapter show the
proportion of the EQUASIS fleet, in each size
and type category, which is classed with
members of IACS and those classed with
recognized organizations which are not
members of IACS. Data on class is provided
by the IACS secretariat and for non IACS
recognized organizations the information is
supplied by LRF when available.
There is also a proportion of ships which are
either not classed, or for which data is
unavailable. These are shown as “Class not
recorded”. In some of these cases data
shows that the ship has previously been
with an IACS class but IACS class has been
withdrawn and no current data is available.
Such cases are recorded in this report as
“IACS withdrawn”. Ships in this group have
had their class withdrawn at the owners
request, due to transfer to a non IACS class
or because of overdue surveys, non-
compliance with conditions of class and
other safety reasons or other non safety
related reasons. Ships which have been
withdrawn from one IACS class and
transferred to another IACS member are
counted in the IACS total.
In chapter 3.3 the fleet is analysed
according to class and flag status. Flags are
grouped in two categories, black and non-
black. The so-called black flags are those
whose safety performance as measured by
the detention rate of their ships leads to
them being targeted for inspection by port
state control authorities. The Paris MoU,
Tokyo MoU and USCG each publish annually
a list of targeted flags. The black flag group
used in the tables in chapter 3.3 includes
those flags which appear on at least one of
the annual lists for 2004. A list of these flags
is at Annex II.
In chapter 3.4 the detention rate of ships is
the ratio between the number of detentions
and the number of inspections in the Paris
MoU, Tokyo MoU and USCG regions in 2005.
All detentions are counted, whether or not
the recognized organization has any
responsibility towards the grounds for the
detention.
Chapter 3

Equasis statistics The world merchant fleet in 2005
18
RESULTS
Graph 21 suggests that by number half
(53%) of the fleet is classed with an IACS
member. However as Tables 23 and 24
show many of those outside IACS are in the
small ships category which are not subject
to international conventions on safety and
pollution prevention because of their size or
because they do not trade internationally.
By tonnage, ships under IACS class societies
dominate – 90% overall and for large and
very large ships around 95%. As graphs 31,
41, 51 and 61 show IACS’ share of the fleet
diminishes by age – 76% of the 0-4 year old
fleet down to 30% of the fleet over 25 years
old.
However this picture is distorted by the
higher proportion of small ships (and often
non-classed) in this older fleet. For medium
sized ships and above there is a much
smaller reduction in the IACS share of the
fleet with age except in the case of medium
sized ships where the proportion of IACS
classed ships drops to 40% of the over 25
year old fleet from a proportion of 73-83%
in the other age ranges (see Graphs 35, 45,
55 and 65).
Tables 75 – 90 show that within the large
and very large fleet the proportion of ships
under IACS class is the same in the black
flag fleet and non-black fleet. However for
medium ships only 48% of the black flag
fleet is under IACS while 69% of the non-
black flag fleet is under IACS.
The safety performance of the whole fleet as
measured by detention rates shows a good
record with 4,3% of inspections resulting in
detention in 2005. Those ships with an IACS
class were less likely to be detained in 2005
(3,2%) than those with non-IACS societies
(17,3%) or whose IACS status has been
withdrawn.

Equasis statistics The world merchant fleet in 2005
19
3.1. CLASS STATUS
Table 21 - World fleet : total number of ships, by type and class – 2005
Ship Type
General Cargo Ships 6 390 20,1% 1 256 47,6% 993 30,4% 7 230 30,8% 15 869 25,9%
Specialized Cargo Ships 107 0,3% 9 0,3% 14 0,4% 62 0,3% 192 0,3%
Container Ships 2 798 8,8% 26 1,0% 48 1,5% 124 0,5% 2 996 4,9%
Ro-Ro Cargo Ships 1 129 3,5% 24 0,9% 74 2,3% 157 0,7% 1 384 2,3%
Bulk Carriers 5 003 15,7% 123 4,7% 274 8,4% 921 3,9% 6 321 10,3%
Oil and Chemical Tankers 5 394 17,0% 269 10,2% 473 14,5% 2 994 12,7% 9 130 14,9%
Gas Tankers 887 2,8% 4 0,2% 58 1,8% 131 0,6% 1 080 1,8%
Other Tankers 138 0,4% 17 0,6% 29 0,9% 166 0,7% 350 0,6%
Passenger Ships 1 942 6,1% 310 11,7% 335 10,3% 3 184 13,5% 5 771 9,4%
Offshore Vessels 2 516 7,9% 54 2,0% 146 4,5% 976 4,2% 3 692 6,0%
Service Ships 1 418 4,5% 81 3,1% 228 7,0% 1 996 8,5% 3 723 6,1%
Tugs 3 742 11,8% 449 17,0% 573 17,5% 5 297 22,5% 10 061 16,4%
Leisure Vessels 345 1,1% 19 0,7% 22 0,7% 272 1,2% 658 1,1%
Total 31 809 100% 2 641 100% 3 267 100% 23 510 100% 61 227 100%
Class not recordedIACS Non IACS TotalIACS Withdrawn
Source : Equasis processed by Emsa - IACS membership on 31/12/2005
Table 22 - World fleet : gross tonnage (in 1000 t) of ships, by type and class – 2005
Ship Type
General Cargo Ships 36 491 6,8% 2 264 34,7% 3 081 15,8% 9 245 25,4% 51 081 8,5%
Specialized Cargo Ships 1 235 0,2% 20 0,3% 67 0,3% 77 0,2% 1 399 0,2%
Container Ships 79 041 14,7% 292 4,5% 746 3,8% 2 764 7,6% 82 843 13,8%
Ro-Ro Cargo Ships 28 344 5,3% 137 2,1% 605 3,1% 718 2,0% 29 804 5,0%
Bulk Carriers 161 597 30,0% 1 526 23,4% 6 495 33,4% 7 137 19,6% 176 755 29,4%
Oil and Chemical Tankers 166 625 31,0% 1 038 15,9% 5 827 30,0% 6 426 17,7% 179 916 30,0%
Gas Tankers 24 239 4,5% 7 0,1% 321 1,7% 633 1,7% 25 200 4,2%
Other Tankers 564 0,1% 33 0,5% 115 0,6% 73 0,2% 785 0,1%
Passenger Ships 21 317 4,0% 785 12,0% 1 063 5,5% 3 301 9,1% 26 466 4,4%
Offshore Vessels 11 900 2,2% 199 3,1% 688 3,5% 2 309 6,4% 15 096 2,5%
Service Ships 5 455 1,0% 117 1,8% 298 1,5% 2 359 6,5% 8 229 1,4%
Tugs 1 337 0,2% 94 1,4% 139 0,7% 1 182 3,3% 2 752 0,5%
Leisure Vessels 146 0,0% 4 0,1% 5 0,0% 133 0,4% 288 0,0%
Total 538 291 100% 6 516 100% 19 450 100% 36 357 100% 600 614 100%
Class not recordedIACS Non IACS TotalIACS Withdrawn
Source : Equasis processed by Emsa - IACS membership on 31/12/2005
Graph 21 - World fleet : total number of ships, by class – 2005
Non IACS
4%IACS
Withdrawn
5%
IACS
53%Class not
recorded
38%
Graph 22 - World fleet : gross tonnage (in 1000 t) of ships, by class – 2005
Non IACS
1%IACS
Withdrawn
3%
IACS
90%
Class not
recorded
6%

Equasis statistics The world merchant fleet in 2005
20
SMALL SHIPS
Table 23 - Total number of small(1) ships, by type and class – 2005
Ship Type
General Cargo Ships 277 4,7% 463 39,7% 113 10,2% 4 038 26,0% 4 891 20,7%
Specialized Cargo Ships 1 0,0% 1 0,1% 2 0,2% 26 0,2% 30 0,1%
Container Ships
Ro-Ro Cargo Ships 8 0,1% 1 0,1% 24 0,2% 33 0,1%
Bulk Carriers 5 0,1% 5 0,4% 5 0,5% 419 2,7% 434 1,8%
Oil and Chemical Tankers 237 4,1% 46 3,9% 72 6,5% 1 658 10,7% 2 013 8,5%
Gas Tankers 9 0,2% 1 0,1% 7 0,6% 32 0,2% 49 0,2%
Other Tankers 17 0,3% 6 0,5% 4 0,4% 124 0,8% 151 0,6%
Passenger Ships 653 11,2% 140 12,0% 182 16,4% 2 115 13,6% 3 090 13,1%
Offshore Vessels 546 9,4% 19 1,6% 55 5,0% 638 4,1% 1 258 5,3%
Service Ships 500 8,6% 25 2,1% 105 9,5% 1 154 7,4% 1 784 7,5%
Tugs 3 331 57,1% 442 37,9% 542 49,0% 5 102 32,8% 9 417 39,8%
Leisure Vessels 251 4,3% 18 1,5% 20 1,8% 221 1,4% 510 2,2%
Total 5 835 100% 1 167 100% 1 107 100% 15 551 100% 23 660 100%
TotalIACS Non IACS IACS Withdrawn Class not recorded
Source : Equasis processed by Emsa - (1) GT<500 - IACS membership on 31/12/2005
Table 24 - Gross tonnage (in 1000 t) of small(1) ships, by type and class – 2005
Ship Type
General Cargo Ships 88 5,6% 145 46,9% 35 12,9% 1 284 31,3% 1 552 24,8%
Specialized Cargo Ships 0 0,0% 0 0,2% 1 0,3% 10 0,2% 11 0,2%
Container Ships
Ro-Ro Cargo Ships 3 0,2% 0 0,1% 9 0,2% 13 0,2%
Bulk Carriers 2 0,1% 2 0,7% 2 0,8% 159 3,9% 165 2,6%
Oil and Chemical Tankers 89 5,7% 16 5,2% 27 10,0% 519 12,6% 650 10,4%
Gas Tankers 4 0,2% 0 0,2% 3 1,1% 11 0,3% 18 0,3%
Other Tankers 5 0,3% 2 0,6% 1 0,3% 33 0,8% 41 0,7%
Passenger Ships 182 11,7% 39 12,7% 45 16,8% 504 12,3% 771 12,3%
Offshore Vessels 165 10,5% 5 1,5% 15 5,5% 172 4,2% 357 5,7%
Service Ships 119 7,6% 5 1,7% 24 8,8% 315 7,7% 463 7,4%
Tugs 872 55,7% 90 29,1% 114 42,2% 1 033 25,2% 2 109 33,7%
Leisure Vessels 37 2,4% 4 1,2% 4 1,4% 57 1,4% 101 1,6%
Total 1 565 100% 309 100% 270 100% 4 107 100% 6 251 100%
TotalIACS Non IACS IACS Withdrawn Class not recorded
Source : Equasis processed by Emsa - (1) GT<500 - IACS membership on 31/12/2005
Graph 23 - Total number of small ships, by class – 2005
Class not
recorded
65%
IACS
25%
IACS
Withdrawn
5%Non IACS
5%
Graph 24 - Gross tonnage (in 1000 t) of small ships, by class – 2005
Class not
recorded
66%IACS
25%
IACS
Withdrawn
4%Non IACS
5%

Equasis statistics The world merchant fleet in 2005
21
MEDIUM SHIPS
Table 25 - Total number of medium(1) ships, by type and class – 2005
Ship Type
General Cargo Ships 5 934 32,0% 793 54,8% 880 44,4% 3 191 41,1% 10 798 36,3%
Specialized Cargo Ships 88 0,5% 8 0,6% 12 0,6% 36 0,5% 144 0,5%
Container Ships 1 511 8,2% 21 1,5% 37 1,9% 85 1,1% 1 654 5,6%
Ro-Ro Cargo Ships 644 3,5% 23 1,6% 68 3,4% 129 1,7% 864 2,9%
Bulk Carriers 2 244 12,1% 109 7,5% 185 9,3% 438 5,6% 2 976 10,0%
Oil and Chemical Tankers 3 123 16,9% 214 14,8% 340 17,2% 1 289 16,6% 4 966 16,7%
Gas Tankers 579 3,1% 3 0,2% 48 2,4% 93 1,2% 723 2,4%
Other Tankers 118 0,6% 11 0,8% 25 1,3% 42 0,5% 196 0,7%
Passenger Ships 1 010 5,5% 167 11,5% 145 7,3% 1 064 13,7% 2 386 8,0%
Offshore Vessels 1 875 10,1% 33 2,3% 86 4,3% 316 4,1% 2 310 7,8%
Service Ships 886 4,8% 56 3,9% 123 6,2% 836 10,8% 1 901 6,4%
Tugs 411 2,2% 7 0,5% 31 1,6% 195 2,5% 644 2,2%
Leisure Vessels 94 0,5% 1 0,1% 2 0,1% 51 0,7% 148 0,5%
Total 18 517 100% 1 446 100% 1 982 100% 7 765 100% 29 710 100%
IACS Non IACS IACS Withdrawn Class not recorded Total
Source : Equasis processed by Emsa - (1) 500≤GT<25.000 - IACS membership on 31/12/2005
Table 26 - Gross tonnage (in 1000 t) of medium(1) ships, by type and class – 2005
Ship Type
General Cargo Ships 31 163 23,4% 2 119 42,7% 3 047 35,6% 7 931 37,2% 44 260 26,3%
Specialized Cargo Ships 651 0,5% 19 0,4% 66 0,8% 67 0,3% 803 0,5%
Container Ships 18 704 14,0% 91 1,8% 290 3,4% 497 2,3% 19 583 11,6%
Ro-Ro Cargo Ships 6 745 5,1% 137 2,8% 363 4,2% 507 2,4% 7 751 4,6%
Bulk Carriers 34 352 25,8% 1 181 23,8% 2 599 30,4% 4 231 19,8% 42 363 25,2%
Oil and Chemical Tankers 22 877 17,2% 573 11,5% 1 076 12,6% 2 704 12,7% 27 230 16,2%
Gas Tankers 3 193 2,4% 6 0,1% 92 1,1% 119 0,6% 3 410 2,0%
Other Tankers 463 0,3% 32 0,6% 114 1,3% 40 0,2% 648 0,4%
Passenger Ships 7 145 5,4% 659 13,3% 433 5,1% 2 636 12,4% 10 874 6,5%
Offshore Vessels 3 524 2,6% 31 0,6% 167 1,9% 529 2,5% 4 251 2,5%
Service Ships 3 890 2,9% 112 2,3% 274 3,2% 1 851 8,7% 6 127 3,6%
Tugs 465 0,3% 5 0,1% 25 0,3% 149 0,7% 643 0,4%
Leisure Vessels 109 0,1% 1 0,0% 2 0,0% 76 0,4% 187 0,1%
Total 133 281 100% 4 965 100% 8 548 100% 21 337 100% 168 131 100%
IACS Non IACS IACS Withdrawn Class not recorded Total
Source : Equasis processed by Emsa - (1) 500≤GT<25.000 - IACS membership on 31/12/2005
Graph 25 - Total number of medium ships, by class – 2005
Non IACS
5%
IACS
Withdrawn
7%
IACS
62%
Class not
recorded
26%
Graph 26 - Gross tonnage (in 1000 t) of medium ships, by class – 2005
Non IACS
3%
IACS
Withdrawn
5%
IACS
79%
Class not
recorded
13%

Equasis statistics The world merchant fleet in 2005
22
LARGE SHIPS
Table 27 - Total number of large(1) ships, by type and class – 2005
Ship Type
General Cargo Ships 179 3,3% 1 0,8% 180 3,2%
Specialized Cargo Ships 18 0,3% 18 0,3%
Container Ships 983 18,1% 5 21,7% 10 8,3% 21 16,8% 1 019 17,9%
Ro-Ro Cargo Ships 447 8,2% 6 5,0% 3 2,4% 456 8,0%
Bulk Carriers 2 146 39,5% 8 34,8% 65 54,2% 54 43,2% 2 273 39,9%
Oil and Chemical Tankers 1 249 23,0% 7 30,4% 35 29,2% 26 20,8% 1 317 23,1%
Gas Tankers 150 2,8% 1 0,8% 1 0,8% 152 2,7%
Other Tankers 3 0,1% 3 0,1%
Passenger Ships 200 3,7% 3 13,0% 2 1,7% 5 4,0% 210 3,7%
Offshore Vessels 32 0,6% 1 0,8% 8 6,4% 41 0,7%
Service Ships 25 0,5% 6 4,8% 31 0,5%
Tugs
Leisure Vessels
Total 5 432 100% 23 100% 120 100% 125 100% 5 700 100%
TotalIACS Non IACS IACS Withdrawn Class not recorded
Source : Equasis processed by Emsa - (1) 25.000≤GT<60.000 - IACS membership on 31/12/2005
Table 28 - Gross tonnage (in 1000 t) of large(1) ships, by type and class – 2005
Ship Type
General Cargo Ships 5 240 2,6% 30 0,7% 5 270 2,5%
Specialized Cargo Ships 584 0,3% 584 0,3%
Container Ships 38 143 18,7% 201 23,8% 391 8,8% 770 17,0% 39 504 18,4%
Ro-Ro Cargo Ships 19 673 9,6% 243 5,5% 139 3,1% 20 055 9,4%
Bulk Carriers 74 599 36,5% 269 31,9% 2 134 47,9% 1 871 41,3% 78 874 36,8%
Oil and Chemical Tankers 50 357 24,6% 287 34,0% 1 527 34,3% 985 21,7% 53 156 24,8%
Gas Tankers 6 322 3,1% 44 1,0% 41 0,9% 6 407 3,0%
Other Tankers 96 0,0% 96 0,0%
Passenger Ships 7 094 3,5% 87 10,3% 68 1,5% 161 3,5% 7 409 3,5%
Offshore Vessels 1 433 0,7% 47 1,1% 341 7,5% 1 821 0,8%
Service Ships 951 0,5% 193 4,3% 1 144 0,5%
Tugs
Leisure Vessels
Total 204 492 100% 844 100% 4 454 100% 4 530 100% 214 319 100%
TotalIACS Non IACS IACS Withdrawn Class not recorded
Source : Equasis processed by Emsa - (1) 25.000≤GT<60.000 - IACS membership on 31/12/2005
Graph 27 - Total number of large ships, by class – 2005
Non IACS
0%
IACS
Withdrawn
2%
IACS
96%
Class not
recorded
2%
Graph 28 - Gross tonnage (in 1000 t) of large ships, by class – 2005
Non IACS
0%
IACS
Withdrawn
2%
IACS
96%
Class not
recorded
2%
Equasis statistics The world merchant fleet in 2005
23
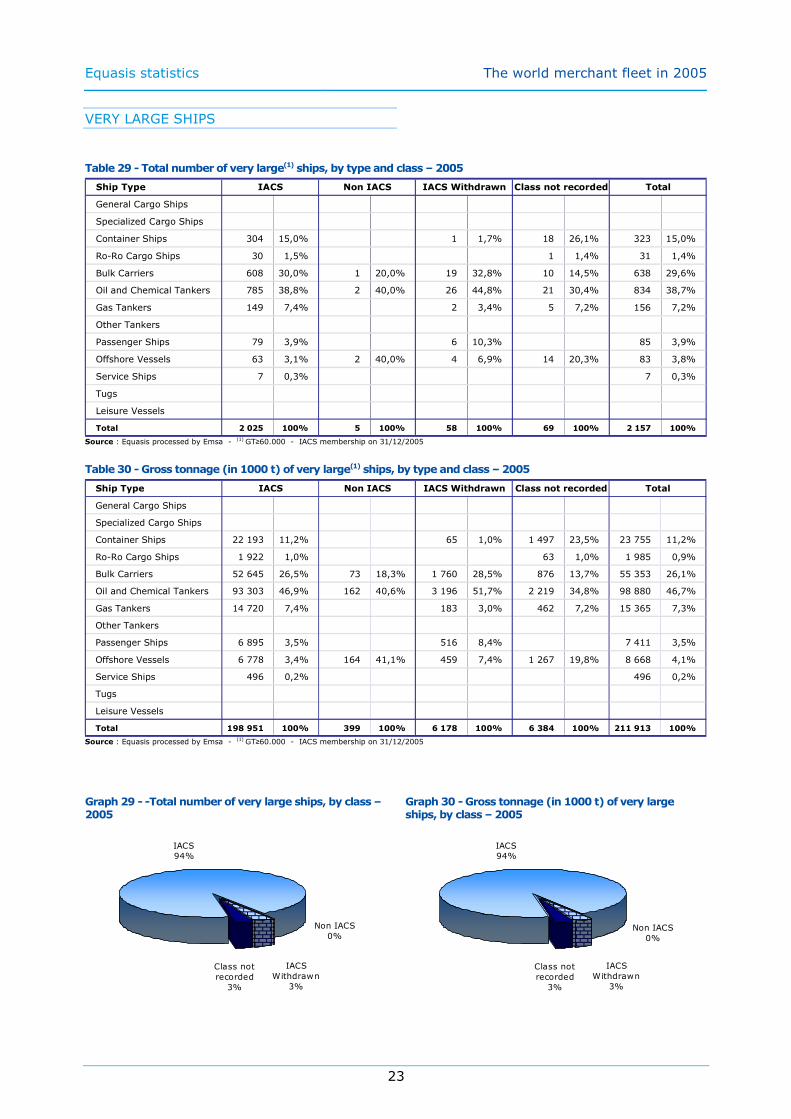
VERY LARGE SHIPS
Table 29 - Total number of very large(1) ships, by type and class – 2005
Ship Type
General Cargo Ships
Specialized Cargo Ships
Container Ships 304 15,0% 1 1,7% 18 26,1% 323 15,0%
Ro-Ro Cargo Ships 30 1,5% 1 1,4% 31 1,4%
Bulk Carriers 608 30,0% 1 20,0% 19 32,8% 10 14,5% 638 29,6%
Oil and Chemical Tankers 785 38,8% 2 40,0% 26 44,8% 21 30,4% 834 38,7%
Gas Tankers 149 7,4% 2 3,4% 5 7,2% 156 7,2%
Other Tankers
Passenger Ships 79 3,9% 6 10,3% 85 3,9%
Offshore Vessels 63 3,1% 2 40,0% 4 6,9% 14 20,3% 83 3,8%
Service Ships 7 0,3% 7 0,3%
Tugs
Leisure Vessels
Total 2 025 100% 5 100% 58 100% 69 100% 2 157 100%
IACS Non IACS IACS Withdrawn Class not recorded Total
Source : Equasis processed by Emsa - (1) GT≥60.000 - IACS membership on 31/12/2005
Table 30 - Gross tonnage (in 1000 t) of very large(1) ships, by type and class – 2005
Ship Type
General Cargo Ships
Specialized Cargo Ships
Container Ships 22 193 11,2% 65 1,0% 1 497 23,5% 23 755 11,2%
Ro-Ro Cargo Ships 1 922 1,0% 63 1,0% 1 985 0,9%
Bulk Carriers 52 645 26,5% 73 18,3% 1 760 28,5% 876 13,7% 55 353 26,1%
Oil and Chemical Tankers 93 303 46,9% 162 40,6% 3 196 51,7% 2 219 34,8% 98 880 46,7%
Gas Tankers 14 720 7,4% 183 3,0% 462 7,2% 15 365 7,3%
Other Tankers
Passenger Ships 6 895 3,5% 516 8,4% 7 411 3,5%
Offshore Vessels 6 778 3,4% 164 41,1% 459 7,4% 1 267 19,8% 8 668 4,1%
Service Ships 496 0,2% 496 0,2%
Tugs
Leisure Vessels
Total 198 951 100% 399 100% 6 178 100% 6 384 100% 211 913 100%
IACS Non IACS IACS Withdrawn Class not recorded Total
Source : Equasis processed by Emsa - (1) GT≥60.000 - IACS membership on 31/12/2005
Graph 29 - -Total number of very large ships, by class – 2005
Class not
recorded
3%
IACS
94%
IACS
Withdrawn
3%
Non IACS
0%
Graph 30 - Gross tonnage (in 1000 t) of very large ships, by class – 2005
Class not
recorded
3%
IACS
94%
IACS
Withdrawn
3%
Non IACS
0%
Equasis statistics The world merchant fleet in 2005
24
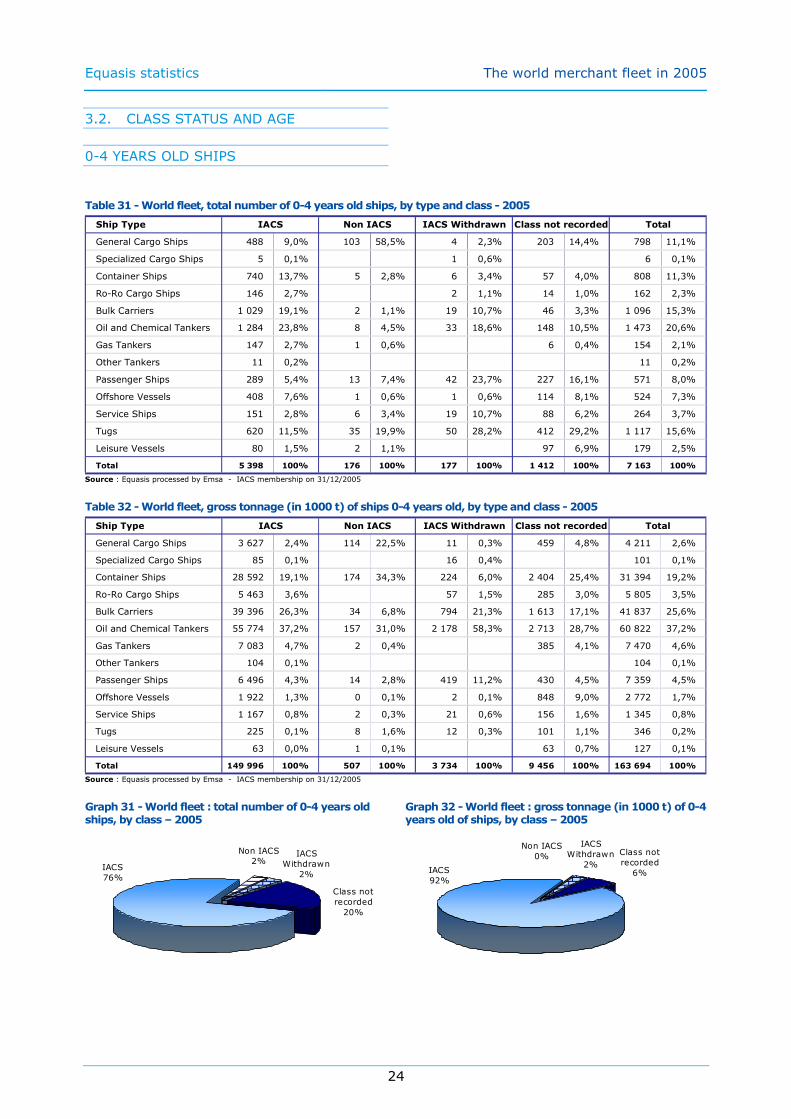
3.2. CLASS STATUS AND AGE
0-4 YEARS OLD SHIPS
Table 31 - World fleet, total number of 0-4 years old ships, by type and class - 2005
Ship Type
General Cargo Ships 488 9,0% 103 58,5% 4 2,3% 203 14,4% 798 11,1%
Specialized Cargo Ships 5 0,1% 1 0,6% 6 0,1%
Container Ships 740 13,7% 5 2,8% 6 3,4% 57 4,0% 808 11,3%
Ro-Ro Cargo Ships 146 2,7% 2 1,1% 14 1,0% 162 2,3%
Bulk Carriers 1 029 19,1% 2 1,1% 19 10,7% 46 3,3% 1 096 15,3%
Oil and Chemical Tankers 1 284 23,8% 8 4,5% 33 18,6% 148 10,5% 1 473 20,6%
Gas Tankers 147 2,7% 1 0,6% 6 0,4% 154 2,1%
Other Tankers 11 0,2% 11 0,2%
Passenger Ships 289 5,4% 13 7,4% 42 23,7% 227 16,1% 571 8,0%
Offshore Vessels 408 7,6% 1 0,6% 1 0,6% 114 8,1% 524 7,3%
Service Ships 151 2,8% 6 3,4% 19 10,7% 88 6,2% 264 3,7%
Tugs 620 11,5% 35 19,9% 50 28,2% 412 29,2% 1 117 15,6%
Leisure Vessels 80 1,5% 2 1,1% 97 6,9% 179 2,5%
Total 5 398 100% 176 100% 177 100% 1 412 100% 7 163 100%
Class not recordedIACS Non IACS TotalIACS Withdrawn
Source : Equasis processed by Emsa - IACS membership on 31/12/2005
Table 32 - World fleet, gross tonnage (in 1000 t) of ships 0-4 years old, by type and class - 2005
Ship Type
General Cargo Ships 3 627 2,4% 114 22,5% 11 0,3% 459 4,8% 4 211 2,6%
Specialized Cargo Ships 85 0,1% 16 0,4% 101 0,1%
Container Ships 28 592 19,1% 174 34,3% 224 6,0% 2 404 25,4% 31 394 19,2%
Ro-Ro Cargo Ships 5 463 3,6% 57 1,5% 285 3,0% 5 805 3,5%
Bulk Carriers 39 396 26,3% 34 6,8% 794 21,3% 1 613 17,1% 41 837 25,6%
Oil and Chemical Tankers 55 774 37,2% 157 31,0% 2 178 58,3% 2 713 28,7% 60 822 37,2%
Gas Tankers 7 083 4,7% 2 0,4% 385 4,1% 7 470 4,6%
Other Tankers 104 0,1% 104 0,1%
Passenger Ships 6 496 4,3% 14 2,8% 419 11,2% 430 4,5% 7 359 4,5%
Offshore Vessels 1 922 1,3% 0 0,1% 2 0,1% 848 9,0% 2 772 1,7%
Service Ships 1 167 0,8% 2 0,3% 21 0,6% 156 1,6% 1 345 0,8%
Tugs 225 0,1% 8 1,6% 12 0,3% 101 1,1% 346 0,2%
Leisure Vessels 63 0,0% 1 0,1% 63 0,7% 127 0,1%
Total 149 996 100% 507 100% 3 734 100% 9 456 100% 163 694 100%
Class not recordedIACS Non IACS TotalIACS Withdrawn
Source : Equasis processed by Emsa - IACS membership on 31/12/2005
Graph 31 - World fleet : total number of 0-4 years old ships, by class – 2005
Non IACS
2%IACS
Withdrawn
2%IACS
76%
Class not
recorded
20%
Graph 32 - World fleet : gross tonnage (in 1000 t) of 0-4 years old of ships, by class – 2005
Non IACS
0%
IACS
Withdrawn
2%IACS
92%
Class not
recorded
6%

Equasis statistics The world merchant fleet in 2005
25
0-4 YEARS OLD SMALL SHIPS
Table 33 - Total number of 0-4 years old small(1) ships, by type and class - 2005
Ship Type
General Cargo Ships 8 1,0% 49 50,5% 77 9,3% 134 7,5%
Specialized Cargo Ships
Container Ships
Ro-Ro Cargo Ships 1 0,1% 1 0,1%
Bulk Carriers 1 0,1% 1 0,1%
Oil and Chemical Tankers 12 1,5% 1 1,4% 49 5,9% 62 3,5%
Gas Tankers 1 0,1% 1 0,1% 2 0,1%
Other Tankers
Passenger Ships 74 9,5% 7 7,2% 14 19,2% 141 17,0% 236 13,3%
Offshore Vessels 31 4,0% 1 1,0% 45 5,4% 77 4,3%
Service Ships 48 6,2% 5 5,2% 9 12,3% 43 5,2% 105 5,9%
Tugs 567 72,8% 33 34,0% 49 67,1% 395 47,6% 1 044 58,7%
Leisure Vessels 38 4,9% 2 2,1% 76 9,2% 116 6,5%
Total 779 100% 97 100% 73 100% 829 100% 1 778 100%
TotalIACS Non IACS IACS Withdrawn Class not recorded
Source : Equasis processed by Emsa - (1) GT<500 - IACS membership on 31/12/2005
Table 34 - Gross tonnage (in 1000 t) of 0-4 years old small(1) ships, by type and class - 2005
Ship Type
General Cargo Ships 2 1,0% 24 67,4% 28 12,7% 54 10,7%
Specialized Cargo Ships
Container Ships
Ro-Ro Cargo Ships 0 0,1% 0 0,1%
Bulk Carriers 0 0,2% 0 0,1%
Oil and Chemical Tankers 5 2,2% 0 2,9% 18 8,2% 24 4,7%
Gas Tankers 0 0,2% 0 0,1% 1 0,2%
Other Tankers
Passenger Ships 22 9,5% 2 6,7% 4 21,2% 37 16,7% 66 12,9%
Offshore Vessels 12 5,3% 0 1,0% 19 8,3% 31 6,2%
Service Ships 12 5,2% 1 3,3% 2 14,2% 9 4,2% 25 5,0%
Tugs 166 71,0% 7 19,6% 11 61,7% 87 39,1% 271 53,2%
Leisure Vessels 13 5,6% 1 2,0% 23 10,3% 37 7,2%
Total 234 100% 35 100% 17 100% 224 100% 510 100%
TotalIACS Non IACS IACS Withdrawn Class not recorded
Source : Equasis processed by Emsa - (1) GT<500 - IACS membership on 31/12/2005
Graph 33 - Total number of 0-4 years old small ships, by class – 2005
Class not
recorded
47%
IACS
44%
IACS
Withdrawn
4%Non IACS
5%
Graph 34 - Gross tonnage (in 1000 t) of 0-4 years old small ships, by class – 2005
Class not
recorded
44%IACS
46%
IACS
Withdrawn
3%
Non IACS
7%

Equasis statistics The world merchant fleet in 2005
26
0-4 YEARS OLD MEDIUM SHIPS
Table 35 - Total number of 0-4 years old medium(1) ships, by type and class - 2005
Ship Type
General Cargo Ships 462 20,4% 54 75,0% 4 6,7% 125 27,5% 645 22,6%
Specialized Cargo Ships 4 0,2% 1 1,7% 5 0,2%
Container Ships 249 11,0% 1 1,4% 1 1,7% 19 4,2% 270 9,5%
Ro-Ro Cargo Ships 53 2,3% 1 1,7% 9 2,0% 63 2,2%
Bulk Carriers 239 10,5% 2 2,8% 3 5,0% 13 2,9% 257 9,0%
Oil and Chemical Tankers 521 23,0% 5 6,9% 13 21,7% 60 13,2% 599 21,0%
Gas Tankers 61 2,7% 1 1,4% 1 0,2% 63 2,2%
Other Tankers 9 0,4% 9 0,3%
Passenger Ships 113 5,0% 6 8,3% 25 41,7% 84 18,5% 228 8,0%
Offshore Vessels 368 16,2% 1 1,7% 61 13,4% 430 15,1%
Service Ships 96 4,2% 1 1,4% 10 16,7% 45 9,9% 152 5,3%
Tugs 53 2,3% 2 2,8% 1 1,7% 17 3,7% 73 2,6%
Leisure Vessels 42 1,9% 21 4,6% 63 2,2%
Total 2 270 100% 72 100% 60 100% 455 100% 2 857 100%
IACS Non IACS IACS Withdrawn Class not recorded Total
Source : Equasis processed by Emsa - (1) 500≤GT<25.000 - IACS membership on 31/12/2005
Table 36 - Gross tonnage (in 1000 t) of 0-4 years old medium(1) ships, by type and class - 2005
Ship Type
General Cargo Ships 3 041 16,7% 91 58,4% 11 4,0% 400 23,0% 3 542 17,3%
Specialized Cargo Ships 55 0,3% 16 5,8% 71 0,3%
Container Ships 3 058 16,8% 3 2,1% 10 3,6% 178 10,2% 3 249 15,9%
Ro-Ro Cargo Ships 725 4,0% 23 8,3% 83 4,8% 831 4,1%
Bulk Carriers 3 881 21,3% 34 22,1% 45 16,2% 143 8,2% 4 104 20,1%
Oil and Chemical Tankers 4 741 26,0% 11 7,3% 67 24,2% 244 14,0% 5 063 24,8%
Gas Tankers 402 2,2% 2 1,5% 4 0,2% 409 2,0%
Other Tankers 38 0,2% 38 0,2%
Passenger Ships 650 3,6% 12 7,5% 83 30,0% 329 18,9% 1 073 5,3%
Offshore Vessels 890 4,9% 2 0,7% 159 9,1% 1 051 5,1%
Service Ships 659 3,6% 1 0,3% 18 6,5% 146 8,4% 824 4,0%
Tugs 59 0,3% 1 0,7% 2 0,7% 14 0,8% 76 0,4%
Leisure Vessels 50 0,3% 40 2,3% 90 0,4%
Total 18 249 100% 155 100% 277 100% 1 740 100% 20 421 100%
IACS Non IACS IACS Withdrawn Class not recorded Total
Source : Equasis processed by Emsa - (1) 500≤GT<25.000 - IACS membership on 31/12/2005
Graph 35 - Total number of 0-4 years old medium ships, by class – 2005
Class not
recorded
16%
IACS
79%
IACS
Withdrawn
2%
Non IACS
3%
Graph 36 - Gross tonnage (in 1000 t) of 0-4 years old medium ships, by class – 2005
Non IACS
1%
IACS
Withdrawn
1%IACS
89%Class not
recorded
9%

Equasis statistics The world merchant fleet in 2005
27
0-4 YEARS OLD LARGE SHIPS
Table 37 - Total number of 0-4 years old large(1) ships, by type and class - 2005
Ship Type
General Cargo Ships 18 1,1% 1 1,3% 19 1,1%
Specialized Cargo Ships 1 0,1% 1 0,1%
Container Ships 301 18,7% 4 66,7% 4 21,1% 20 25,6% 329 19,2%
Ro-Ro Cargo Ships 74 4,6% 1 5,3% 3 3,8% 78 4,6%
Bulk Carriers 648 40,2% 12 63,2% 27 34,6% 687 40,1%
Oil and Chemical Tankers 465 28,9% 2 33,3% 2 10,5% 24 30,8% 493 28,8%
Gas Tankers 32 2,0% 32 1,9%
Other Tankers 2 0,1% 2 0,1%
Passenger Ships 66 4,1% 2 2,6% 68 4,0%
Offshore Vessels 3 0,2% 1 1,3% 4 0,2%
Service Ships
Tugs
Leisure Vessels
Total 1 610 100% 6 100% 19 100% 78 100% 1 713 100%
TotalIACS Non IACS IACS Withdrawn Class not recorded
Source : Equasis processed by Emsa - (1) 25.000≤GT<60.000 - IACS membership on 31/12/2005
Table 38 - Gross tonnage (in 1000 t) of 0-4 years old large(1) ships, by type and class - 2005
Ship Type
General Cargo Ships 584 1,0% 30 1,0% 613 1,0%
Specialized Cargo Ships 30 0,0% 30 0,0%
Container Ships 11 379 18,9% 171 73,5% 150 22,0% 729 25,0% 12 429 19,4%
Ro-Ro Cargo Ships 3 558 5,9% 34 5,0% 139 4,8% 3 731 5,8%
Bulk Carriers 22 709 37,7% 411 60,4% 994 34,1% 24 115 37,6%
Oil and Chemical Tankers 18 112 30,0% 62 26,5% 86 12,6% 919 31,6% 19 179 29,9%
Gas Tankers 1 353 2,2% 1 353 2,1%
Other Tankers 66 0,1% 66 0,1%
Passenger Ships 2 382 3,9% 64 2,2% 2 445 3,8%
Offshore Vessels 125 0,2% 36 1,2% 162 0,3%
Service Ships
Tugs
Leisure Vessels
Total 60 298 100% 232 100% 681 100% 2 912 100% 64 124 100%
TotalIACS Non IACS IACS Withdrawn Class not recorded
Source : Equasis processed by Emsa - (1) 25.000≤GT<60.000 - IACS membership on 31/12/2005
Graph 37 - Total number of 0-4 years old large ships, by class – 2005
Non IACS
0%
IACS
Withdrawn
1%IACS
94%
Class not
recorded
5%
Graph 38 - Gross tonnage (in 1000 t) of 0-4 years old large ships, by class – 2005
Non IACS
0%
IACS
Withdrawn
1%IACS
94%
Class not
recorded
5%

Equasis statistics The world merchant fleet in 2005
28
0-4 YEARS OLD VERY LARGE SHIPS
Table 39 - Total number of 0-4 years old very large(1) ships, by type and class - 2005
Ship Type
General Cargo Ships
Specialized Cargo Ships
Container Ships 190 25,7% 1 4,0% 18 36,0% 209 25,6%
Ro-Ro Cargo Ships 19 2,6% 1 2,0% 20 2,5%
Bulk Carriers 142 19,2% 4 16,0% 5 10,0% 151 18,5%
Oil and Chemical Tankers 286 38,7% 1 100% 17 68,0% 15 30,0% 319 39,1%
Gas Tankers 53 7,2% 4 8,0% 57 7,0%
Other Tankers
Passenger Ships 36 4,9% 3 12,0% 39 4,8%
Offshore Vessels 6 0,8% 7 14,0% 13 1,6%
Service Ships 7 0,9% 7 0,9%
Tugs
Leisure Vessels
Total 739 100% 1 100% 25 100% 50 100% 815 100%
IACS Non IACS IACS Withdrawn Class not recorded Total
Source : Equasis processed by Emsa - (1) GT≥60.000 - IACS membership on 31/12/2005
Table 40 - Gross tonnage (in 1000 t) of 0-4 years old very large(1) ships, by type and class - 2005
Ship Type
General Cargo Ships
Specialized Cargo Ships
Container Ships 14 156 19,9% 65 2,3% 1 497 32,7% 15 718 20,0%
Ro-Ro Cargo Ships 1 179 1,7% 63 1,4% 1 242 1,6%
Bulk Carriers 12 805 18,0% 338 12,2% 475 10,4% 13 618 17,3%
Oil and Chemical Tankers 32 916 46,2% 84 100% 2 025 73,4% 1 531 33,4% 36 556 46,5%
Gas Tankers 5 326 7,5% 381 8,3% 5 707 7,3%
Other Tankers
Passenger Ships 3 443 4,8% 332 12,0% 3 775 4,8%
Offshore Vessels 894 1,3% 634 13,8% 1 528 1,9%
Service Ships 496 0,7% 496 0,6%
Tugs
Leisure Vessels
Total 71 215 100% 84 100% 2 759 100% 4 580 100% 78 639 100%
IACS Non IACS IACS Withdrawn Class not recorded Total
Source : Equasis processed by Emsa - (1) GT≥60.000 - IACS membership on 31/12/2005
Graph 39 - Total number of 0-4 years old very large ships, by class – 2005
Class not
recorded
6%
IACS
91%
IACS
Withdrawn
3%Non IACS
0%
Graph 40 - Gross tonnage (in 1000 t) of 0-4 years old very large ships, by class – 2005
Non IACS
0%
IACS
Withdrawn
4%IACS
90%
Class not
recorded
6%

Equasis statistics The world merchant fleet in 2005
29
5-14 YEARS OLD SHIPS
Table 41 - World fleet, total number of 5-14 years old ships, by type and class - 2005
Ship Type
General Cargo Ships 1 792 18,2% 179 35,9% 68 13,6% 1 101 28,6% 3 140 21,4%
Specialized Cargo Ships 14 0,1% 5 0,1% 19 0,1%
Container Ships 1 318 13,4% 4 0,8% 13 2,6% 20 0,5% 1 355 9,2%
Ro-Ro Cargo Ships 334 3,4% 1 0,2% 11 2,2% 16 0,4% 362 2,5%
Bulk Carriers 1 617 16,4% 5 1,0% 36 7,2% 171 4,4% 1 829 12,4%
Oil and Chemical Tankers 1 904 19,3% 33 6,6% 64 12,8% 534 13,9% 2 535 17,2%
Gas Tankers 349 3,5% 6 1,2% 8 0,2% 363 2,5%
Other Tankers 36 0,4% 1 0,2% 5 1,0% 22 0,6% 64 0,4%
Passenger Ships 633 6,4% 78 15,6% 102 20,4% 675 17,6% 1 488 10,1%
Offshore Vessels 386 3,9% 6 1,2% 2 0,4% 71 1,8% 465 3,2%
Service Ships 282 2,9% 14 2,8% 28 5,6% 257 6,7% 581 4,0%
Tugs 1 141 11,6% 169 33,9% 157 31,5% 888 23,1% 2 355 16,0%
Leisure Vessels 55 0,6% 9 1,8% 7 1,4% 76 2,0% 147 1,0%
Total 9 861 100% 499 100% 499 100% 3 844 100% 14 703 100%
Class not recordedIACS Non IACS TotalIACS Withdrawn
Source : Equasis processed by Emsa - IACS membership on 31/12/2005
Table 42 - World fleet, gross tonnage (in 1000 t) of ships 5-14 years old, by type and class - 2005
Classification societies : World fleet - Gross tonnage of 5-14 years ships (in 1000 tons), by type - 2005
Ship Type
General Cargo Ships 11 161 5,5% 173 22,9% 239 5,4% 694 15,9% 12 266 5,8%
Specialized Cargo Ships 97 0,0% 11 0,3% 108 0,1%
Container Ships 33 083 16,3% 55 7,3% 311 7,0% 162 3,7% 33 611 15,9%
Ro-Ro Cargo Ships 8 621 4,3% 1 0,1% 242 5,5% 52 1,2% 8 915 4,2%
Bulk Carriers 58 377 28,8% 135 17,9% 1 608 36,3% 436 10,0% 60 557 28,6%
Oil and Chemical Tankers 71 178 35,2% 153 20,2% 1 478 33,4% 646 14,8% 73 455 34,7%
Gas Tankers 8 372 4,1% 83 1,9% 54 1,2% 8 509 4,0%
Other Tankers 105 0,1% 30 0,7% 9 0,2% 144 0,1%
Passenger Ships 7 307 3,6% 177 23,5% 301 6,8% 971 22,3% 8 756 4,1%
Offshore Vessels 2 594 1,3% 2 0,2% 61 1,4% 645 14,8% 3 302 1,6%
Service Ships 1 135 0,6% 25 3,3% 40 0,9% 455 10,4% 1 654 0,8%
Tugs 382 0,2% 33 4,4% 32 0,7% 182 4,2% 628 0,3%
Leisure Vessels 35 0,0% 1 0,2% 2 0,0% 39 0,9% 78 0,0%
Total 202 446 100% 754 100% 4 426 100% 4 357 100% 211 983 100%
Class not recordedIACS Non IACS TotalIACS Withdrawn
Source : Equasis processed by Emsa - IACS membership on 31/12/2005
Graph 41 - World fleet : total number of 5-14 years old ships, by class – 2005
Non IACS
3%IACS
Withdrawn
3%
IACS
68%
Class not
recorded
26%
Graph 42 - World fleet : gross tonnage (in 1000 t) of 5-14 years old of ships, by class – 2005
Class not
recorded
2%
IACS
96%
IACS
Withdrawn
2%
Non IACS
0%
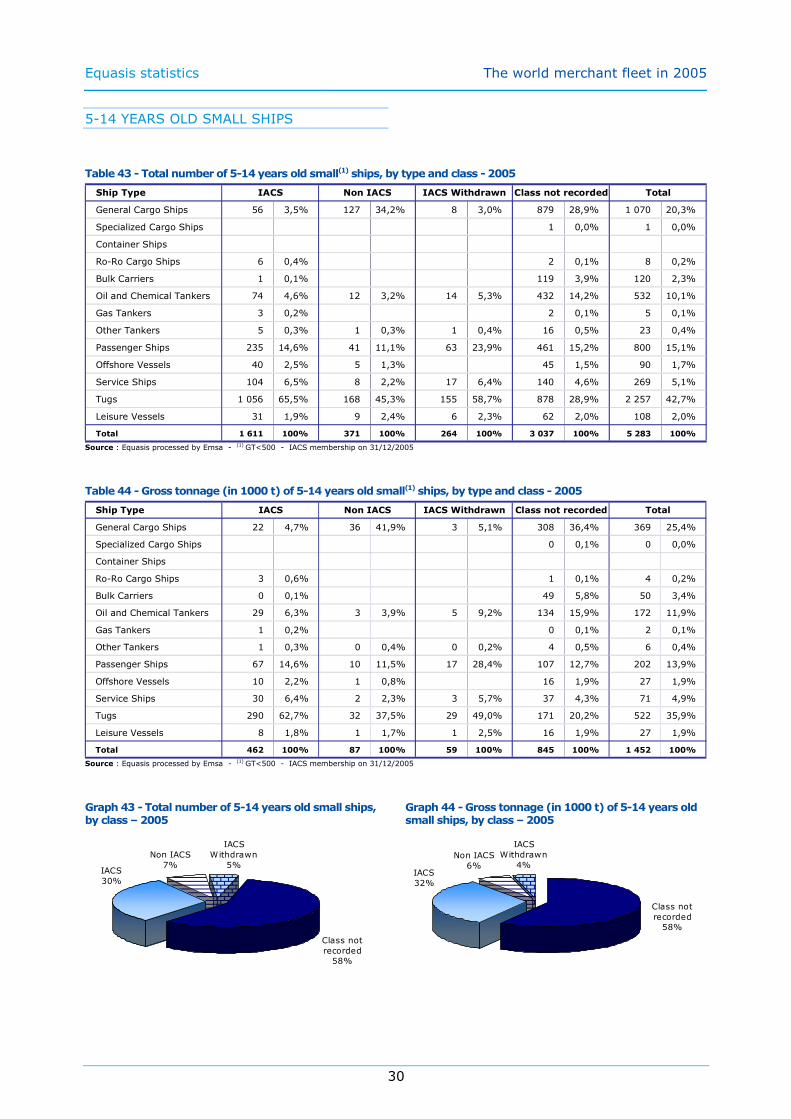
Equasis statistics The world merchant fleet in 2005
30
5-14 YEARS OLD SMALL SHIPS
Table 43 - Total number of 5-14 years old small(1) ships, by type and class - 2005
Ship Type
General Cargo Ships 56 3,5% 127 34,2% 8 3,0% 879 28,9% 1 070 20,3%
Specialized Cargo Ships 1 0,0% 1 0,0%
Container Ships
Ro-Ro Cargo Ships 6 0,4% 2 0,1% 8 0,2%
Bulk Carriers 1 0,1% 119 3,9% 120 2,3%
Oil and Chemical Tankers 74 4,6% 12 3,2% 14 5,3% 432 14,2% 532 10,1%
Gas Tankers 3 0,2% 2 0,1% 5 0,1%
Other Tankers 5 0,3% 1 0,3% 1 0,4% 16 0,5% 23 0,4%
Passenger Ships 235 14,6% 41 11,1% 63 23,9% 461 15,2% 800 15,1%
Offshore Vessels 40 2,5% 5 1,3% 45 1,5% 90 1,7%
Service Ships 104 6,5% 8 2,2% 17 6,4% 140 4,6% 269 5,1%
Tugs 1 056 65,5% 168 45,3% 155 58,7% 878 28,9% 2 257 42,7%
Leisure Vessels 31 1,9% 9 2,4% 6 2,3% 62 2,0% 108 2,0%
Total 1 611 100% 371 100% 264 100% 3 037 100% 5 283 100%
TotalIACS Non IACS IACS Withdrawn Class not recorded
Source : Equasis processed by Emsa - (1) GT<500 - IACS membership on 31/12/2005
Table 44 - Gross tonnage (in 1000 t) of 5-14 years old small(1) ships, by type and class - 2005
Ship Type
General Cargo Ships 22 4,7% 36 41,9% 3 5,1% 308 36,4% 369 25,4%
Specialized Cargo Ships 0 0,1% 0 0,0%
Container Ships
Ro-Ro Cargo Ships 3 0,6% 1 0,1% 4 0,2%
Bulk Carriers 0 0,1% 49 5,8% 50 3,4%
Oil and Chemical Tankers 29 6,3% 3 3,9% 5 9,2% 134 15,9% 172 11,9%
Gas Tankers 1 0,2% 0 0,1% 2 0,1%
Other Tankers 1 0,3% 0 0,4% 0 0,2% 4 0,5% 6 0,4%
Passenger Ships 67 14,6% 10 11,5% 17 28,4% 107 12,7% 202 13,9%
Offshore Vessels 10 2,2% 1 0,8% 16 1,9% 27 1,9%
Service Ships 30 6,4% 2 2,3% 3 5,7% 37 4,3% 71 4,9%
Tugs 290 62,7% 32 37,5% 29 49,0% 171 20,2% 522 35,9%
Leisure Vessels 8 1,8% 1 1,7% 1 2,5% 16 1,9% 27 1,9%
Total 462 100% 87 100% 59 100% 845 100% 1 452 100%
TotalIACS Non IACS IACS Withdrawn Class not recorded
Source : Equasis processed by Emsa - (1) GT<500 - IACS membership on 31/12/2005
Graph 43 - Total number of 5-14 years old small ships, by class – 2005
Class not
recorded
58%
IACS
30%
IACS
Withdrawn
5%
Non IACS
7%
Graph 44 - Gross tonnage (in 1000 t) of 5-14 years old small ships, by class – 2005
Class not
recorded
58%
IACS
32%
IACS
Withdrawn
4%Non IACS
6%

Equasis statistics The world merchant fleet in 2005
31
5-14 YEARS OLD MEDIUM SHIPS
Table 45 - Total number of 5-14 years old medium(1) ships, by type and class - 2005
Ship Type
General Cargo Ships 1 664 30,7% 52 42,3% 60 33,7% 222 28,4% 1 998 30,7%
Specialized Cargo Ships 14 0,3% 4 0,5% 18 0,3%
Container Ships 829 15,3% 3 2,4% 9 5,1% 19 2,4% 860 13,2%
Ro-Ro Cargo Ships 198 3,7% 1 0,8% 7 3,9% 14 1,8% 220 3,4%
Bulk Carriers 514 9,5% 3 2,4% 10 5,6% 45 5,8% 572 8,8%
Oil and Chemical Tankers 1 020 18,8% 20 16,3% 33 18,5% 98 12,5% 1 171 18,0%
Gas Tankers 255 4,7% 5 2,8% 5 0,6% 265 4,1%
Other Tankers 31 0,6% 4 2,2% 6 0,8% 41 0,6%
Passenger Ships 300 5,5% 36 29,3% 35 19,7% 213 27,3% 584 9,0%
Offshore Vessels 317 5,8% 1 0,8% 1 0,6% 18 2,3% 337 5,2%
Service Ships 173 3,2% 6 4,9% 11 6,2% 113 14,5% 303 4,7%
Tugs 85 1,6% 1 0,8% 2 1,1% 10 1,3% 98 1,5%
Leisure Vessels 24 0,4% 1 0,6% 14 1,8% 39 0,6%
Total 5 424 100% 123 100% 178 100% 781 100% 6 506 100%
IACS Non IACS IACS Withdrawn Class not recorded Total
Source : Equasis processed by Emsa - (1) 500≤GT<25.000 - IACS membership on 31/12/2005
Table 46 - Gross tonnage (in 1000 t) of 5-14 years old medium(1) ships, by type and class - 2005
Ship Type
General Cargo Ships 8 955 22,0% 136 30,8% 236 27,6% 386 19,0% 9 714 22,0%
Specialized Cargo Ships 97 0,2% 11 0,5% 107 0,2%
Container Ships 10 134 24,8% 25 5,7% 134 15,7% 122 6,0% 10 414 23,6%
Ro-Ro Cargo Ships 2 148 5,3% 1 0,1% 61 7,1% 51 2,5% 2 260 5,1%
Bulk Carriers 7 337 18,0% 23 5,3% 139 16,2% 141 6,9% 7 640 17,3%
Oil and Chemical Tankers 6 900 16,9% 96 21,6% 92 10,8% 114 5,6% 7 202 16,3%
Gas Tankers 1 407 3,4% 39 4,6% 13 0,6% 1 459 3,3%
Other Tankers 103 0,3% 30 3,5% 5 0,2% 138 0,3%
Passenger Ships 1 916 4,7% 138 31,1% 71 8,4% 819 40,3% 2 945 6,7%
Offshore Vessels 740 1,8% 1 0,2% 14 1,6% 39 1,9% 793 1,8%
Service Ships 928 2,3% 23 5,1% 36 4,2% 298 14,7% 1 285 2,9%
Tugs 92 0,2% 1 0,2% 2 0,3% 11 0,5% 107 0,2%
Leisure Vessels 27 0,1% 1 0,1% 23 1,1% 51 0,1%
Total 40 784 100% 443 100% 855 100% 2 033 100% 44 115 100%
IACS Non IACS IACS Withdrawn Class not recorded Total
Source : Equasis processed by Emsa - (1) 500≤GT<25.000 - IACS membership on 31/12/2005
Graph 45 - Total number of 5-14 years old medium ships, by class – 2005
Non IACS
2%
IACS
Withdrawn
3%
IACS
83%
Class not
recorded
12%
Graph 46 - Gross tonnage (in 1000 t) of 5-14 years old medium ships, by class – 2005
Class not
recorded
5%
IACS
92%
IACS
Withdrawn
2%
Non IACS
1%

Equasis statistics The world merchant fleet in 2005
32
5-14 YEARS OLD LARGE SHIPS
Table 47 - Total number of 5-14 years old large(1) ships, by type and class - 2005
Ship Type
General Cargo Ships 72 3,7% 72 3,6%
Specialized Cargo Ships 0 0,0%
Container Ships 380 19,3% 1 25,0% 4 11,1% 1 5,9% 386 19,1%
Ro-Ro Cargo Ships 122 6,2% 4 11,1% 126 6,2%
Bulk Carriers 836 42,5% 1 25,0% 15 41,7% 6 35,3% 858 42,4%
Oil and Chemical Tankers 439 22,3% 1 25,0% 10 27,8% 450 22,2%
Gas Tankers 40 2,0% 1 2,8% 1 5,9% 42 2,1%
Other Tankers 0 0,0%
Passenger Ships 59 3,0% 1 25,0% 1 2,8% 1 5,9% 62 3,1%
Offshore Vessels 13 0,7% 1 2,8% 4 23,5% 18 0,9%
Service Ships 5 0,3% 4 23,5% 9 0,4%
Tugs
Leisure Vessels
Total 1 966 100% 4 100% 36 100% 17 100% 2 023 100%
TotalIACS Non IACS IACS Withdrawn Class not recorded
Source : Equasis processed by Emsa - (1) 25.000≤GT<60.000 - IACS membership on 31/12/2005
Table 48 - Gross tonnage (in 1000 t) of 5-14 years old large(1) ships, by type and class - 2005
Ship Type
General Cargo Ships 2 184 2,9% 2 184 2,8%
Specialized Cargo Ships
Container Ships 15 221 20,2% 30 19,7% 177 12,3% 40 6,7% 15 468 20,0%
Ro-Ro Cargo Ships 5 927 7,9% 181 12,6% 6 108 7,9%
Bulk Carriers 28 808 38,3% 39 25,6% 474 32,9% 169 27,9% 29 490 38,1%
Oil and Chemical Tankers 18 445 24,5% 54 35,3% 490 34,0% 18 988 24,5%
Gas Tankers 1 715 2,3% 44 3,0% 41 6,7% 1 800 2,3%
Other Tankers
Passenger Ships 2 149 2,9% 29 19,4% 28 2,0% 44 7,3% 2 251 2,9%
Offshore Vessels 620 0,8% 47 3,3% 191 31,5% 858 1,1%
Service Ships 178 0,2% 120 19,8% 298 0,4%
Tugs
Leisure Vessels
Total 75 246 100% 152 100% 1 442 100% 605 100% 77 445 100%
TotalIACS Non IACS IACS Withdrawn Class not recorded
Source : Equasis processed by Emsa - (1) 25.000≤GT<60.000 - IACS membership on 31/12/2005
Graph 47 - Total number of 5-14 years old large ships, by class – 2005
Non IACS
0%
IACS
Withdrawn
2%
IACS
97%
Class not
recorded
1%
Graph 48 - Gross tonnage (in 1000 t) of 5-14 years old large ships, by class – 2005
Non IACS
0%
IACS
Withdrawn
2%
IACS
97%
Class not
recorded
1%

Equasis statistics The world merchant fleet in 2005
33
5-14 YEARS OLD VERY LARGE SHIPS
Table 49 - Total number of 5-14 years old very large(1) ships, by type and class - 2005
Ship Type
General Cargo Ships
Specialized Cargo Ships
Container Ships 109 12,7% 109 12,2%
Ro-Ro Cargo Ships 8 0,9% 8 0,9%
Bulk Carriers 266 30,9% 1 100% 11 52,4% 1 11,1% 279 31,3%
Oil and Chemical Tankers 371 43,1% 7 33,3% 4 44,4% 382 42,9%
Gas Tankers 51 5,9% 51 5,7%
Other Tankers
Passenger Ships 39 4,5% 3 14,3% 42 4,7%
Offshore Vessels 16 1,9% 4 44,4% 20 2,2%
Service Ships
Tugs
Leisure Vessels
Total 860 100% 1 100% 21 100% 9 100% 891 100%
IACS Non IACS IACS Withdrawn Class not recorded Total
Source : Equasis processed by Emsa - (1) GT≥60.000 - IACS membership on 31/12/2005
Table 50 - Gross tonnage (in 1000 t) of 5-14 years old very large(1) ships, by type and class - 2005
Ship Type
General Cargo Ships
Specialized Cargo Ships
Container Ships 7 728 9,0% 7 728 8,7%
Ro-Ro Cargo Ships 543 0,6% 543 0,6%
Bulk Carriers 22 231 25,9% 73 100% 995 48,1% 77 8,8% 23 377 26,3%
Oil and Chemical Tankers 45 804 53,3% 890 43,0% 398 45,5% 47 093 52,9%
Gas Tankers 5 249 6,1% 5 249 5,9%
Other Tankers
Passenger Ships 3 175 3,7% 184 8,9% 3 358 3,8%
Offshore Vessels 1 224 1,4% 399 45,6% 1 623 1,8%
Service Ships
Tugs
Leisure Vessels
Total 85 955 100% 73 100% 2 070 100% 874 100% 88 972 100%
IACS Non IACS IACS Withdrawn Class not recorded Total
Source : Equasis processed by Emsa - (1) GT≥60.000 - IACS membership on 31/12/2005
Graph 49 - Total number of 5-14 years old very large ships, by class – 2005
Class not
recorded
1%
IACS
98%
IACS
Withdrawn
1%
Non IACS
0%
Graph 50 - Gross tonnage (in 1000 t) of 5-14 years old very large ships, by class – 2005
Class not
recorded
1%
IACS
98%
IACS
Withdrawn
1%
Non IACS
0%

Equasis statistics The world merchant fleet in 2005
34
15-24 YEARS OLD SHIPS
Table 51 - World fleet, total number of 15-24 years old ships, by type and class - 2005
Ship Type
General Cargo Ships 2 239 24,2% 391 53,1% 234 29,6% 1 393 30,5% 4 257 27,7%
Specialized Cargo Ships 44 0,5% 1 0,1% 1 0,1% 9 0,2% 55 0,4%
Container Ships 514 5,6% 6 0,8% 9 1,1% 9 0,2% 538 3,5%
Ro-Ro Cargo Ships 374 4,0% 5 0,7% 11 1,4% 29 0,6% 419 2,7%
Bulk Carriers 1 685 18,2% 27 3,7% 96 12,1% 254 5,6% 2 062 13,4%
Oil and Chemical Tankers 1 496 16,2% 53 7,2% 126 15,9% 595 13,0% 2 270 14,8%
Gas Tankers 234 2,5% 1 0,1% 12 1,5% 16 0,3% 263 1,7%
Other Tankers 34 0,4% 1 0,1% 5 0,6% 40 0,9% 80 0,5%
Passenger Ships 451 4,9% 100 13,6% 80 10,1% 736 16,1% 1 367 8,9%
Offshore Vessels 878 9,5% 12 1,6% 36 4,6% 151 3,3% 1 077 7,0%
Service Ships 479 5,2% 35 4,7% 69 8,7% 546 11,9% 1 129 7,3%
Tugs 777 8,4% 102 13,8% 108 13,7% 760 16,6% 1 747 11,4%
Leisure Vessels 54 0,6% 3 0,4% 4 0,5% 36 0,8% 97 0,6%
Total 9 259 100% 737 100% 791 100% 4 574 100% 15 361 100%
Class not recordedIACS Non IACS TotalIACS Withdrawn
Source : Equasis processed by Emsa - IACS membership on 31/12/2005
Table 52 - World fleet, gross tonnage (in 1000 t) of ships 15-24 years old, by type and class - 2005
Ship Type
General Cargo Ships 12 492 9,5% 653 36,4% 904 19,0% 1 472 29,3% 15 521 10,9%
Specialized Cargo Ships 477 0,4% 1 0,1% 2 0,0% 9 0,2% 490 0,3%
Container Ships 12 668 9,7% 26 1,4% 118 2,5% 64 1,3% 12 876 9,0%
Ro-Ro Cargo Ships 9 762 7,4% 52 2,9% 74 1,6% 98 2,0% 9 986 7,0%
Bulk Carriers 52 673 40,2% 455 25,4% 2 244 47,1% 1 188 23,7% 56 560 39,6%
Oil and Chemical Tankers 31 086 23,7% 322 18,0% 1 137 23,9% 520 10,4% 33 065 23,2%
Gas Tankers 4 158 3,2% 0 0,0% 11 0,2% 18 0,4% 4 188 2,9%
Other Tankers 138 0,1% 1 0,1% 12 0,2% 19 0,4% 170 0,1%
Passenger Ships 4 061 3,1% 191 10,6% 77 1,6% 605 12,0% 4 935 3,5%
Offshore Vessels 1 529 1,2% 14 0,8% 36 0,8% 332 6,6% 1 911 1,3%
Service Ships 1 780 1,4% 53 3,0% 119 2,5% 507 10,1% 2 459 1,7%
Tugs 311 0,2% 23 1,3% 29 0,6% 177 3,5% 541 0,4%
Leisure Vessels 28 0,0% 1 0,1% 1 0,0% 12 0,2% 42 0,0%
Total 131 165 100% 1 791 100% 4 764 100% 5 022 100% 142 742 100%
Class not recordedIACS Non IACS TotalIACS Withdrawn
Source : Equasis processed by Emsa - IACS membership on 31/12/2005
Graph 51 - World fleet : total number of 15-24 years old ships, by class – 2005
Non IACS
5%IACS
Withdrawn
5%
IACS
60%
Class not
recorded
30%
Graph 52 - World fleet : gross tonnage (in 1000 t) of 15-24 years old of ships, by class – 2005
Non IACS
1%
IACS
Withdrawn
3%
IACS
92%
Class not
recorded
4%

Equasis statistics The world merchant fleet in 2005
35
15-24 YEARS OLD SMALL SHIPS
Table 53 - Total number of 15-24 years old small(1) ships, by type and class - 2005
Ship Type
General Cargo Ships 76 5,2% 167 47,4% 22 8,5% 897 27,8% 1 162 21,9%
Specialized Cargo Ships 1 0,1% 3 0,1% 4 0,1%
Container Ships
Ro-Ro Cargo Ships 5 0,2% 5 0,1%
Bulk Carriers 2 0,1% 2 0,6% 3 1,2% 164 5,1% 171 3,2%
Oil and Chemical Tankers 84 5,7% 15 4,3% 26 10,1% 393 12,2% 518 9,8%
Gas Tankers 4 0,3% 1 0,3% 2 0,8% 8 0,2% 15 0,3%
Other Tankers 4 0,3% 31 1,0% 35 0,7%
Passenger Ships 175 12,0% 55 15,6% 58 22,5% 495 15,4% 783 14,8%
Offshore Vessels 245 16,7% 2 0,6% 16 6,2% 88 2,7% 351 6,6%
Service Ships 169 11,5% 7 2,0% 28 10,9% 384 11,9% 588 11,1%
Tugs 666 45,5% 101 28,7% 99 38,4% 723 22,4% 1 589 30,0%
Leisure Vessels 38 2,6% 2 0,6% 4 1,6% 30 0,9% 74 1,4%
Total 1 464 100% 352 100% 258 100% 3 221 100% 5 295 100%
TotalIACS Non IACS IACS Withdrawn Class not recorded
Source : Equasis processed by Emsa - (1) GT<500 - IACS membership on 31/12/2005
Table 54 - Gross tonnage (in 1000 t) of 15-24 years old small(1) ships, by type and class - 2005
Ship Type
General Cargo Ships 22 5,4% 47 50,2% 5 8,2% 269 30,6% 343 23,7%
Specialized Cargo Ships 0 0,1% 1 0,1% 1 0,1%
Container Ships
Ro-Ro Cargo Ships 2 0,2% 2 0,1%
Bulk Carriers 1 0,2% 1 1,0% 1 1,9% 67 7,6% 70 4,8%
Oil and Chemical Tankers 32 7,8% 5 5,8% 10 15,1% 110 12,5% 157 10,8%
Gas Tankers 2 0,4% 0 0,5% 1 1,5% 3 0,3% 6 0,4%
Other Tankers 1 0,3% 8 1,0% 9 0,7%
Passenger Ships 49 11,9% 15 15,9% 14 21,2% 117 13,3% 194 13,4%
Offshore Vessels 74 18,1% 0 0,5% 5 7,4% 24 2,7% 103 7,1%
Service Ships 43 10,6% 1 1,4% 7 10,8% 122 13,9% 174 12,0%
Tugs 175 42,6% 22 24,2% 21 32,3% 150 17,0% 368 25,4%
Leisure Vessels 11 2,7% 0 0,5% 1 1,5% 7 0,8% 19 1,3%
Total 410 100% 93 100% 65 100% 879 100% 1 447 100%
TotalIACS Non IACS IACS Withdrawn Class not recorded
Source : Equasis processed by Emsa - (1) GT<500 - IACS membership on 31/12/2005
Graph 53 - Total number of 15-24 years old small ships, by class – 2005
Class not
recorded
60%
IACS
28%
IACS
Withdrawn
5%
Non IACS
7%
Graph 54 - Gross tonnage (in 1000 t) of 15-24 years old small ships, by class – 2005
Class not
recorded
62%IACS
28%
IACS
Withdrawn
4%Non IACS
6%

Equasis statistics The world merchant fleet in 2005
36
15-24 YEARS OLD MEDIUM SHIPS
Table 55 - Total number of 15-24 years old medium(1) ships, by type and class - 2005
Ship Type
General Cargo Ships 2 107 35,0% 224 59,9% 212 43,7% 496 37,0% 3 039 37,0%
Specialized Cargo Ships 38 0,6% 1 0,3% 1 0,2% 6 0,4% 46 0,6%
Container Ships 291 4,8% 6 1,6% 7 1,4% 9 0,7% 313 3,8%
Ro-Ro Cargo Ships 183 3,0% 5 1,3% 11 2,3% 24 1,8% 223 2,7%
Bulk Carriers 913 15,2% 20 5,3% 65 13,4% 82 6,1% 1 080 13,2%
Oil and Chemical Tankers 1 008 16,8% 33 8,8% 82 16,9% 201 15,0% 1 324 16,1%
Gas Tankers 183 3,0% 10 2,1% 8 0,6% 201 2,4%
Other Tankers 30 0,5% 1 0,3% 5 1,0% 9 0,7% 45 0,5%
Passenger Ships 212 3,5% 44 11,8% 22 4,5% 241 18,0% 519 6,3%
Offshore Vessels 625 10,4% 10 2,7% 20 4,1% 59 4,4% 714 8,7%
Service Ships 297 4,9% 28 7,5% 41 8,5% 161 12,0% 527 6,4%
Tugs 111 1,8% 1 0,3% 9 1,9% 37 2,8% 158 1,9%
Leisure Vessels 16 0,3% 1 0,3% 6 0,4% 23 0,3%
Total 6 014 100% 374 100% 485 100% 1 339 100% 8 212 100%
IACS Non IACS IACS Withdrawn Class not recorded Total
Source : Equasis processed by Emsa - (1) 500≤GT<25.000 - IACS membership on 31/12/2005
Table 56 - Gross tonnage (in 1000 t) of 15-24 years old medium(1) ships, by type and class - 2005
Ship Type
General Cargo Ships 10 913 24,1% 606 48,2% 899 34,5% 1 203 35,7% 13 621 25,9%
Specialized Cargo Ships 304 0,7% 1 0,1% 2 0,1% 8 0,2% 315 0,6%
Container Ships 3 729 8,2% 26 2,0% 54 2,1% 64 1,9% 3 873 7,4%
Ro-Ro Cargo Ships 1 705 3,8% 52 4,1% 74 2,8% 97 2,9% 1 927 3,7%
Bulk Carriers 15 501 34,2% 293 23,3% 1 054 40,5% 664 19,7% 17 511 33,3%
Oil and Chemical Tankers 8 029 17,7% 68 5,4% 284 10,9% 330 9,8% 8 711 16,6%
Gas Tankers 1 017 2,2% 10 0,4% 16 0,5% 1 042 2,0%
Other Tankers 137 0,3% 1 0,1% 12 0,4% 11 0,3% 161 0,3%
Passenger Ships 1 612 3,6% 146 11,6% 64 2,4% 488 14,5% 2 310 4,4%
Offshore Vessels 1 047 2,3% 13 1,1% 31 1,2% 105 3,1% 1 197 2,3%
Service Ships 1 227 2,7% 52 4,1% 111 4,3% 348 10,3% 1 739 3,3%
Tugs 136 0,3% 1 0,1% 8 0,3% 28 0,8% 173 0,3%
Leisure Vessels 17 0,0% 1 0,1% 4 0,1% 22 0,0%
Total 45 372 100% 1 258 100% 2 604 100% 3 367 100% 52 602 100%
IACS Non IACS IACS Withdrawn Class not recorded Total
Source : Equasis processed by Emsa - (1) 500≤GT<25.000 - IACS membership on 31/12/2005
Graph 55 - Total number of 15-24 years old medium ships, by class – 2005
Non IACS
5%
IACS
Withdrawn
6%
IACS
73%
Class not
recorded
16%
Graph 56 - Gross tonnage (in 1000 t) of 15-24 years old medium ships, by class – 2005
Non IACS
2%
IACS
Withdrawn
5%
IACS
87%
Class not
recorded
6%
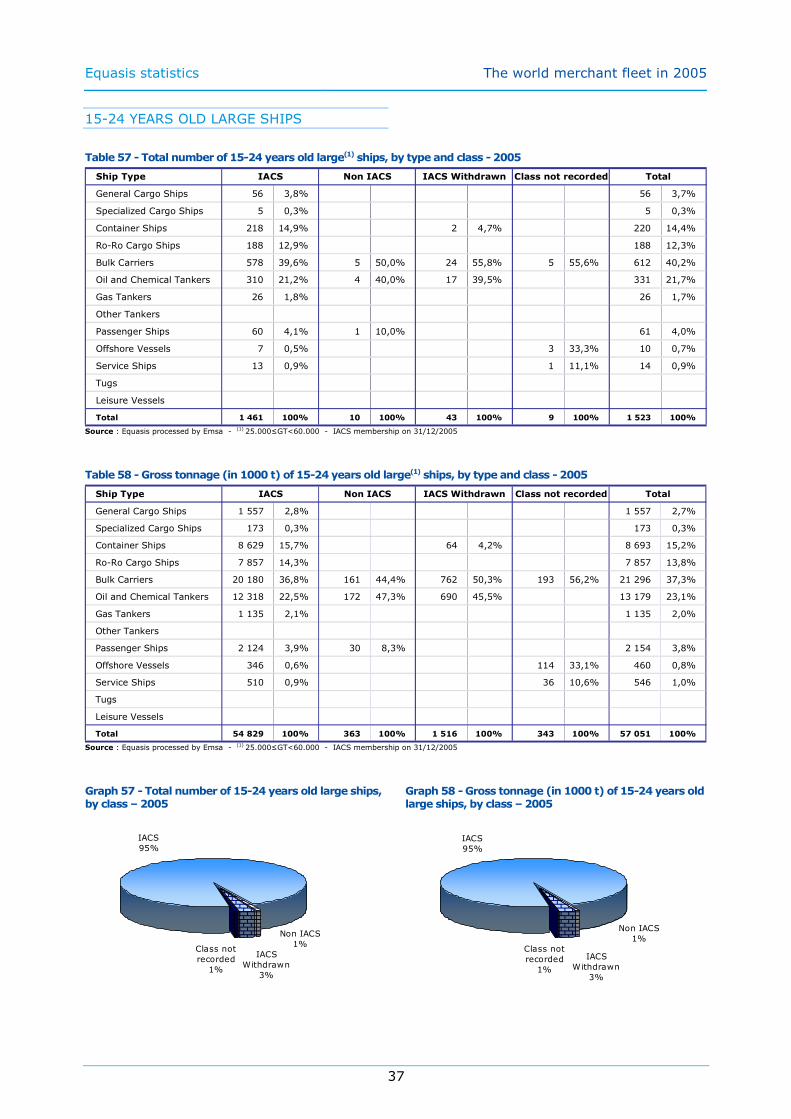
Equasis statistics The world merchant fleet in 2005
37
15-24 YEARS OLD LARGE SHIPS
Table 57 - Total number of 15-24 years old large(1) ships, by type and class - 2005
Ship Type
General Cargo Ships 56 3,8% 56 3,7%
Specialized Cargo Ships 5 0,3% 5 0,3%
Container Ships 218 14,9% 2 4,7% 220 14,4%
Ro-Ro Cargo Ships 188 12,9% 188 12,3%
Bulk Carriers 578 39,6% 5 50,0% 24 55,8% 5 55,6% 612 40,2%
Oil and Chemical Tankers 310 21,2% 4 40,0% 17 39,5% 331 21,7%
Gas Tankers 26 1,8% 26 1,7%
Other Tankers
Passenger Ships 60 4,1% 1 10,0% 61 4,0%
Offshore Vessels 7 0,5% 3 33,3% 10 0,7%
Service Ships 13 0,9% 1 11,1% 14 0,9%
Tugs
Leisure Vessels
Total 1 461 100% 10 100% 43 100% 9 100% 1 523 100%
TotalIACS Non IACS IACS Withdrawn Class not recorded
Source : Equasis processed by Emsa - (1) 25.000≤GT<60.000 - IACS membership on 31/12/2005
Table 58 - Gross tonnage (in 1000 t) of 15-24 years old large(1) ships, by type and class - 2005
Ship Type
General Cargo Ships 1 557 2,8% 1 557 2,7%
Specialized Cargo Ships 173 0,3% 173 0,3%
Container Ships 8 629 15,7% 64 4,2% 8 693 15,2%
Ro-Ro Cargo Ships 7 857 14,3% 7 857 13,8%
Bulk Carriers 20 180 36,8% 161 44,4% 762 50,3% 193 56,2% 21 296 37,3%
Oil and Chemical Tankers 12 318 22,5% 172 47,3% 690 45,5% 13 179 23,1%
Gas Tankers 1 135 2,1% 1 135 2,0%
Other Tankers
Passenger Ships 2 124 3,9% 30 8,3% 2 154 3,8%
Offshore Vessels 346 0,6% 114 33,1% 460 0,8%
Service Ships 510 0,9% 36 10,6% 546 1,0%
Tugs
Leisure Vessels
Total 54 829 100% 363 100% 1 516 100% 343 100% 57 051 100%
TotalIACS Non IACS IACS Withdrawn Class not recorded
Source : Equasis processed by Emsa - (1) 25.000≤GT<60.000 - IACS membership on 31/12/2005
Graph 57 - Total number of 15-24 years old large ships, by class – 2005
Non IACS
1%
IACS
Withdrawn
3%
IACS
95%
Class not
recorded
1%
Graph 58 - Gross tonnage (in 1000 t) of 15-24 years old large ships, by class – 2005
Non IACS
1%
IACS
Withdrawn
3%
IACS
95%
Class not
recorded
1%

Equasis statistics The world merchant fleet in 2005
38
15-24 YEARS OLD VERY LARGE SHIPS
Table 59 - Total number of 15-24 years old very large(1) ships, by type and class - 2005
Ship Type
General Cargo Ships
Specialized Cargo Ships
Container Ships 5 1,6% 5 1,5%
Ro-Ro Cargo Ships 3 0,9% 3 0,9%
Bulk Carriers 192 60,0% 4 80,0% 3 60,0% 199 60,1%
Oil and Chemical Tankers 94 29,4% 1 100% 1 20,0% 1 20,0% 97 29,3%
Gas Tankers 21 6,6% 21 6,3%
Other Tankers
Passenger Ships 4 1,3% 4 1,2%
Offshore Vessels 1 0,3% 1 20,0% 2 0,6%
Service Ships
Tugs
Leisure Vessels
Total 320 100% 1 100% 5 100% 5 100% 331 100%
IACS Non IACS IACS Withdrawn Class not recorded Total
Source : Equasis processed by Emsa - (1) GT≥60.000 - IACS membership on 31/12/2005
Table 60 - Gross tonnage (in 1000 t) of 15-24 years old very large(1) ships, by type and class - 2005
Ship Type
General Cargo Ships
Specialized Cargo Ships
Container Ships 310 1,0% 310 1,0%
Ro-Ro Cargo Ships 200 0,7% 200 0,6%
Bulk Carriers 16 992 55,6% 426 73,7% 264 60,9% 17 682 55,9%
Oil and Chemical Tankers 10 708 35,0% 78 100% 152 26,3% 80 18,4% 11 018 34,8%
Gas Tankers 2 005 6,6% 2 005 6,3%
Other Tankers
Passenger Ships 277 0,9% 277 0,9%
Offshore Vessels 62 0,2% 89 20,7% 151 0,5%
Service Ships
Tugs
Leisure Vessels
Total 30 553 100% 78 100% 579 100% 433 100% 31 643 100%
IACS Non IACS IACS Withdrawn Class not recorded Total
Source : Equasis processed by Emsa - (1) GT≥60.000 - IACS membership on 31/12/2005
Graph 59 - Total number of 15-24 years old very large ships, by class – 2005
Class not
recorded
2%
IACS
96%
IACS
Withdrawn
2%
Non IACS
0%
Graph 60 - Gross tonnage (in 1000 t) of 15-24 years old very large ships, by class – 2005
Class not
recorded
1%
IACS
97%
IACS
Withdrawn
2%
Non IACS
0%

Equasis statistics The world merchant fleet in 2005
39
25+ YEARS OLD SHIPS
Table 61 - World fleet, total number of 25+ years old ships, by type and class - 2005
Ship Type
General Cargo Ships 1 871 25,7% 583 47,4% 687 38,2% 4 533 33,1% 7 674 32,0%
Specialized Cargo Ships 44 0,6% 8 0,7% 12 0,7% 48 0,4% 112 0,5%
Container Ships 226 3,1% 11 0,9% 20 1,1% 38 0,3% 295 1,2%
Ro-Ro Cargo Ships 275 3,8% 18 1,5% 50 2,8% 98 0,7% 441 1,8%
Bulk Carriers 672 9,2% 89 7,2% 123 6,8% 450 3,3% 1 334 5,6%
Oil and Chemical Tankers 710 9,7% 175 14,2% 250 13,9% 1 717 12,6% 2 852 11,9%
Gas Tankers 157 2,2% 2 0,2% 40 2,2% 101 0,7% 300 1,3%
Other Tankers 57 0,8% 15 1,2% 19 1,1% 104 0,8% 195 0,8%
Passenger Ships 569 7,8% 119 9,7% 111 6,2% 1 546 11,3% 2 345 9,8%
Offshore Vessels 844 11,6% 35 2,8% 107 5,9% 640 4,7% 1 626 6,8%
Service Ships 506 6,9% 26 2,1% 112 6,2% 1 105 8,1% 1 749 7,3%
Tugs 1 204 16,5% 143 11,6% 258 14,3% 3 237 23,7% 4 842 20,2%
Leisure Vessels 156 2,1% 5 0,4% 11 0,6% 63 0,5% 235 1,0%
Total 7 291 100% 1 229 100% 1 800 100% 13 680 100% 24 000 100%
Class not recordedIACS Non IACS TotalIACS Withdrawn
Source : Equasis processed by Emsa - IACS membership on 31/12/2005
Table 62 - World fleet, gross tonnage (in 1000 t) of ships 25+ years old, by type and class - 2005
Ship Type
General Cargo Ships 9 211 16,8% 1 324 38,2% 1 927 29,5% 6 621 37,8% 19 083 23,2%
Specialized Cargo Ships 576 1,1% 19 0,5% 48 0,7% 56 0,3% 700 0,9%
Container Ships 4 698 8,6% 37 1,1% 92 1,4% 134 0,8% 4 961 6,0%
Ro-Ro Cargo Ships 4 498 8,2% 85 2,4% 233 3,6% 282 1,6% 5 098 6,2%
Bulk Carriers 11 151 20,4% 901 26,0% 1 849 28,3% 3 901 22,3% 17 803 21,7%
Oil and Chemical Tankers 8 587 15,7% 405 11,7% 1 034 15,8% 2 548 14,5% 12 574 15,3%
Gas Tankers 4 626 8,5% 4 0,1% 227 3,5% 175 1,0% 5 032 6,1%
Other Tankers 216 0,4% 32 0,9% 73 1,1% 46 0,3% 367 0,4%
Passenger Ships 3 452 6,3% 403 11,6% 265 4,1% 1 295 7,4% 5 416 6,6%
Offshore Vessels 5 854 10,7% 184 5,3% 589 9,0% 484 2,8% 7 112 8,7%
Service Ships 1 373 2,5% 38 1,1% 119 1,8% 1 242 7,1% 2 771 3,4%
Tugs 419 0,8% 30 0,9% 66 1,0% 722 4,1% 1 237 1,5%
Leisure Vessels 20 0,0% 1 0,0% 2 0,0% 18 0,1% 41 0,1%
Total 54 682 100% 3 464 100% 6 526 100% 17 523 100% 82 195 100%
Class not recordedIACS Non IACS TotalIACS Withdrawn
Source : Equasis processed by Emsa - IACS membership on 31/12/2005
Graph 61 - World fleet : total number of 25+ years old ships, by class – 2005
Non IACS
5%
IACS
Withdrawn
8%
IACS
30%
Class not
recorded
57%
Graph 62 - World fleet : gross tonnage (in 1000 t) of 25+ years old of ships, by class – 2005
Non IACS
4%
IACS
Withdrawn
8%
IACS
67%
Class not
recorded
21%
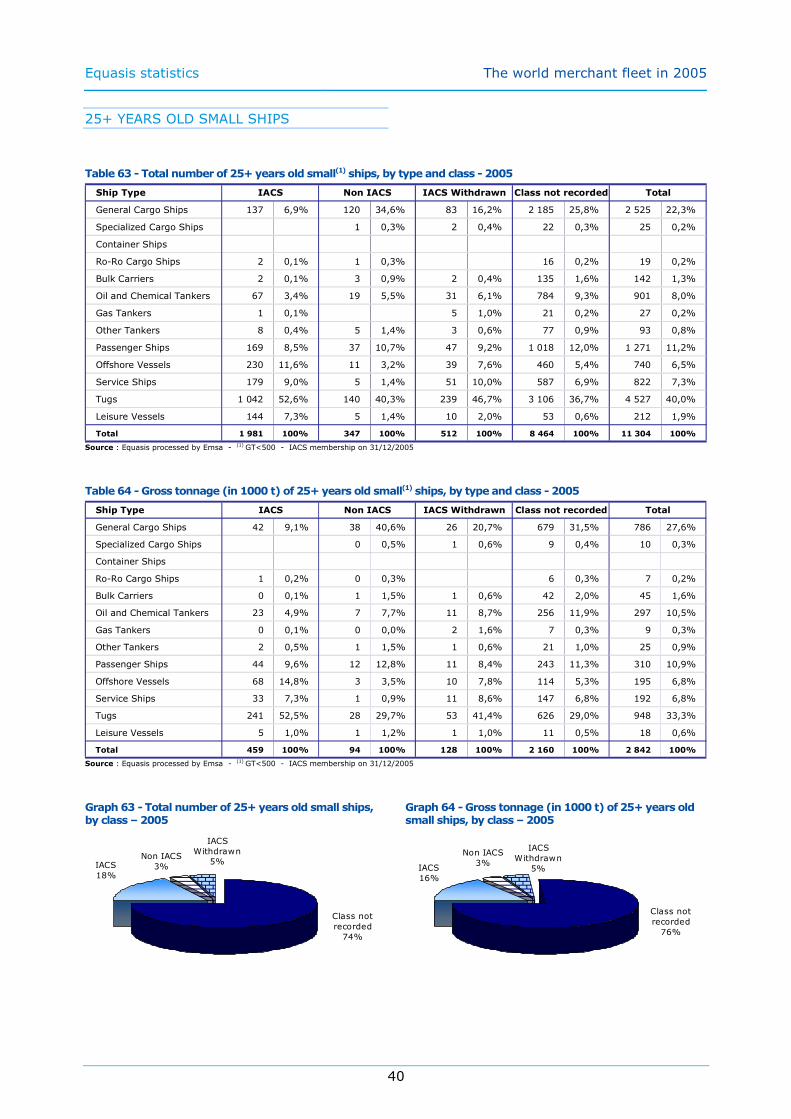
Equasis statistics The world merchant fleet in 2005
40
25+ YEARS OLD SMALL SHIPS
Table 63 - Total number of 25+ years old small(1) ships, by type and class - 2005
Ship Type
General Cargo Ships 137 6,9% 120 34,6% 83 16,2% 2 185 25,8% 2 525 22,3%
Specialized Cargo Ships 1 0,3% 2 0,4% 22 0,3% 25 0,2%
Container Ships
Ro-Ro Cargo Ships 2 0,1% 1 0,3% 16 0,2% 19 0,2%
Bulk Carriers 2 0,1% 3 0,9% 2 0,4% 135 1,6% 142 1,3%
Oil and Chemical Tankers 67 3,4% 19 5,5% 31 6,1% 784 9,3% 901 8,0%
Gas Tankers 1 0,1% 5 1,0% 21 0,2% 27 0,2%
Other Tankers 8 0,4% 5 1,4% 3 0,6% 77 0,9% 93 0,8%
Passenger Ships 169 8,5% 37 10,7% 47 9,2% 1 018 12,0% 1 271 11,2%
Offshore Vessels 230 11,6% 11 3,2% 39 7,6% 460 5,4% 740 6,5%
Service Ships 179 9,0% 5 1,4% 51 10,0% 587 6,9% 822 7,3%
Tugs 1 042 52,6% 140 40,3% 239 46,7% 3 106 36,7% 4 527 40,0%
Leisure Vessels 144 7,3% 5 1,4% 10 2,0% 53 0,6% 212 1,9%
Total 1 981 100% 347 100% 512 100% 8 464 100% 11 304 100%
TotalIACS Non IACS IACS Withdrawn Class not recorded
Source : Equasis processed by Emsa - (1) GT<500 - IACS membership on 31/12/2005
Table 64 - Gross tonnage (in 1000 t) of 25+ years old small(1) ships, by type and class - 2005
Ship Type
General Cargo Ships 42 9,1% 38 40,6% 26 20,7% 679 31,5% 786 27,6%
Specialized Cargo Ships 0 0,5% 1 0,6% 9 0,4% 10 0,3%
Container Ships
Ro-Ro Cargo Ships 1 0,2% 0 0,3% 6 0,3% 7 0,2%
Bulk Carriers 0 0,1% 1 1,5% 1 0,6% 42 2,0% 45 1,6%
Oil and Chemical Tankers 23 4,9% 7 7,7% 11 8,7% 256 11,9% 297 10,5%
Gas Tankers 0 0,1% 0 0,0% 2 1,6% 7 0,3% 9 0,3%
Other Tankers 2 0,5% 1 1,5% 1 0,6% 21 1,0% 25 0,9%
Passenger Ships 44 9,6% 12 12,8% 11 8,4% 243 11,3% 310 10,9%
Offshore Vessels 68 14,8% 3 3,5% 10 7,8% 114 5,3% 195 6,8%
Service Ships 33 7,3% 1 0,9% 11 8,6% 147 6,8% 192 6,8%
Tugs 241 52,5% 28 29,7% 53 41,4% 626 29,0% 948 33,3%
Leisure Vessels 5 1,0% 1 1,2% 1 1,0% 11 0,5% 18 0,6%
Total 459 100% 94 100% 128 100% 2 160 100% 2 842 100%
TotalIACS Non IACS IACS Withdrawn Class not recorded
Source : Equasis processed by Emsa - (1) GT<500 - IACS membership on 31/12/2005
Graph 63 - Total number of 25+ years old small ships, by class – 2005
Class not
recorded
74%
IACS
18%
IACS
Withdrawn
5%Non IACS
3%
Graph 64 - Gross tonnage (in 1000 t) of 25+ years old small ships, by class – 2005
Class not
recorded
76%
IACS
16%
IACS
Withdrawn
5%
Non IACS
3%

Equasis statistics The world merchant fleet in 2005
41
25+ YEARS OLD MEDIUM SHIPS
Table 65 - Total number of 25+ years old medium(1) ships, by type and class - 2005
Ship Type
General Cargo Ships 1 701 35,4% 463 52,8% 604 48,0% 2 348 45,2% 5 116 42,2%
Specialized Cargo Ships 32 0,7% 7 0,8% 10 0,8% 26 0,5% 75 0,6%
Container Ships 142 3,0% 11 1,3% 20 1,6% 38 0,7% 211 1,7%
Ro-Ro Cargo Ships 210 4,4% 17 1,9% 49 3,9% 82 1,6% 358 3,0%
Bulk Carriers 578 12,0% 84 9,6% 107 8,5% 298 5,7% 1 067 8,8%
Oil and Chemical Tankers 574 11,9% 156 17,8% 212 16,8% 930 17,9% 1 872 15,4%
Gas Tankers 80 1,7% 2 0,2% 33 2,6% 79 1,5% 194 1,6%
Other Tankers 48 1,0% 10 1,1% 16 1,3% 27 0,5% 101 0,8%
Passenger Ships 385 8,0% 81 9,2% 63 5,0% 526 10,1% 1 055 8,7%
Offshore Vessels 565 11,7% 22 2,5% 64 5,1% 178 3,4% 829 6,8%
Service Ships 320 6,7% 21 2,4% 61 4,8% 517 10,0% 919 7,6%
Tugs 162 3,4% 3 0,3% 19 1,5% 131 2,5% 315 2,6%
Leisure Vessels 12 0,2% 1 0,1% 10 0,2% 23 0,2%
Total 4 809 100% 877 100% 1 259 100% 5 190 100% 12 135 100%
IACS Non IACS IACS Withdrawn Class not recorded Total
Source : Equasis processed by Emsa - (1) 500≤GT<25.000 - IACS membership on 31/12/2005
Table 66 - Gross tonnage (in 1000 t) of 25+ years old medium(1) ships, by type and class - 2005
Ship Type
General Cargo Ships 8 255 28,6% 1 286 41,4% 1 901 39,5% 5 941 41,9% 17 382 34,1%
Specialized Cargo Ships 196 0,7% 19 0,6% 48 1,0% 48 0,3% 310 0,6%
Container Ships 1 784 6,2% 37 1,2% 92 1,9% 134 0,9% 2 047 4,0%
Ro-Ro Cargo Ships 2 167 7,5% 84 2,7% 205 4,3% 276 1,9% 2 733 5,4%
Bulk Carriers 7 633 26,4% 831 26,7% 1 362 28,3% 3 283 23,1% 13 109 25,7%
Oil and Chemical Tankers 3 208 11,1% 398 12,8% 633 13,2% 2 015 14,2% 6 254 12,3%
Gas Tankers 367 1,3% 4 0,1% 42 0,9% 87 0,6% 500 1,0%
Other Tankers 184 0,6% 31 1,0% 72 1,5% 25 0,2% 312 0,6%
Passenger Ships 2 968 10,3% 364 11,7% 215 4,5% 999 7,0% 4 546 8,9%
Offshore Vessels 847 2,9% 17 0,5% 120 2,5% 226 1,6% 1 209 2,4%
Service Ships 1 076 3,7% 37 1,2% 108 2,2% 1 058 7,5% 2 280 4,5%
Tugs 178 0,6% 2 0,1% 13 0,3% 96 0,7% 289 0,6%
Leisure Vessels 15 0,1% 1 0,0% 8 0,1% 23 0,0%
Total 28 876 100% 3 109 100% 4 812 100% 14 196 100% 50 993 100%
IACS Non IACS IACS Withdrawn Class not recorded Total
Source : Equasis processed by Emsa - (1) 500≤GT<25.000 - IACS membership on 31/12/2005
Graph 65 - Total number of 25+ years old medium ships, by class – 2005
Non IACS
7%
IACS
Withdrawn
10%IACS
40%
Class not
recorded
43%
Graph 66 - Gross tonnage (in 1000 t) of 25+ years old medium ships, by class – 2005
Class not
recorded
28%
IACS
57%
IACS
Withdrawn
9%
Non IACS
6%

Equasis statistics The world merchant fleet in 2005
42
25+ YEARS OLD LARGE SHIPS
Table 67 - Total number of 25+ years old large(1) ships, by type and class - 2005
Ship Type
General Cargo Ships 33 8,4% 33 7,5%
Specialized Cargo Ships 12 3,0% 12 2,7%
Container Ships 84 21,3% 84 19,0%
Ro-Ro Cargo Ships 63 15,9% 1 4,5% 64 14,5%
Bulk Carriers 84 21,3% 2 66,7% 14 63,6% 16 76,2% 116 26,3%
Oil and Chemical Tankers 35 8,9% 6 27,3% 2 9,5% 43 9,8%
Gas Tankers 52 13,2% 52 11,8%
Other Tankers 1 0,3% 1 0,2%
Passenger Ships 15 3,8% 1 33,3% 1 4,5% 2 9,5% 19 4,3%
Offshore Vessels 9 2,3% 9 2,0%
Service Ships 7 1,8% 1 4,8% 8 1,8%
Tugs
Leisure Vessels
Total 395 100% 3 100% 22 100% 21 100% 441 100%
TotalIACS Non IACS IACS Withdrawn Class not recorded
Source : Equasis processed by Emsa - (1) 25.000≤GT<60.000 - IACS membership on 31/12/2005
Table 68 - Gross tonnage (in 1000 t) of 25+ years old large(1) ships, by type and class - 2005
Ship Type
General Cargo Ships 915 6,5% 915 5,8%
Specialized Cargo Ships 381 2,7% 381 2,4%
Container Ships 2 914 20,6% 2 914 18,6%
Ro-Ro Cargo Ships 2 330 16,5% 28 3,4% 2 358 15,0%
Bulk Carriers 2 902 20,6% 69 71,8% 486 59,7% 515 76,9% 3 973 25,3%
Oil and Chemical Tankers 1 482 10,5% 261 32,0% 65 9,7% 1 809 11,5%
Gas Tankers 2 118 15,0% 2 118 13,5%
Other Tankers 30 0,2% 30 0,2%
Passenger Ships 440 3,1% 27 28,2% 40 4,9% 53 7,9% 560 3,6%
Offshore Vessels 342 2,4% 342 2,2%
Service Ships 263 1,9% 36 5,4% 300 1,9%
Tugs
Leisure Vessels
Total 14 118 100% 97 100% 815 100% 670 100% 15 700 100%
TotalIACS Non IACS IACS Withdrawn Class not recorded
Source : Equasis processed by Emsa - (1) 25.000≤GT<60.000 - IACS membership on 31/12/2005
Graph 67 - Total number of 25+ years old large ships, by class – 2005
Class not
recorded
5%
IACS
89%
IACS
Withdrawn
5%
Non IACS
1%
Graph 68 - Gross tonnage (in 1000 t) of 25+ years old large ships, by class – 2005
Non IACS
1%
IACS
Withdrawn
5%
IACS
90%
Class not
recorded
4%

Equasis statistics The world merchant fleet in 2005
43
25+ YEARS OLD VERY LARGE SHIPS
Table 69 - Total number of 25+ years old very large(1) ships, by type and class - 2005
Ship Type
General Cargo Ships
Specialized Cargo Ships
Container Ships
Ro-Ro Cargo Ships
Bulk Carriers 8 7,5% 1 20,0% 9 7,5%
Oil and Chemical Tankers 34 32,1% 1 14,3% 1 20,0% 36 30,0%
Gas Tankers 24 22,6% 2 28,6% 1 20,0% 27 22,5%
Other Tankers
Passenger Ships
Offshore Vessels 40 37,7% 2 100% 4 57,1% 2 40,0% 48 40,0%
Service Ships
Tugs
Leisure Vessels
Total 106 100% 2 100% 7 100% 5 100% 120 100%
IACS Non IACS IACS Withdrawn Class not recorded Total
Source : Equasis processed by Emsa - (1) GT≥60.000 - IACS membership on 31/12/2005
Table 70 - Gross tonnage (in 1000 t) of 25+ years old very large(1) ships, by type and class - 2005
Ship Type
General Cargo Ships
Specialized Cargo Ships
Container Ships
Ro-Ro Cargo Ships
Bulk Carriers 616 5,5% 60 12,1% 676 5,3%
Oil and Chemical Tankers 3 874 34,5% 129 16,7% 211 42,4% 4 214 33,3%
Gas Tankers 2 140 19,1% 183 23,7% 81 16,4% 2 404 19,0%
Other Tankers
Passenger Ships
Offshore Vessels 4 598 40,9% 164 100% 459 59,6% 145 29,1% 5 366 42,4%
Service Ships
Tugs
Leisure Vessels
Total 11 228 100% 164 100% 771 100% 497 100% 12 660 100%
IACS Non IACS IACS Withdrawn Class not recorded Total
Source : Equasis processed by Emsa - (1) GT≥60.000 - IACS membership on 31/12/2005
Graph 69 - Total number of 25+ years old very large ships, by class – 2005
Class not
recorded
4%
IACS
88%
IACS
Withdrawn
6%
Non IACS
2%
Graph 70 - Gross tonnage (in 1000 t) of 25+ years old very large ships, by class – 2005
Class not
recorded
4%
IACS
89%
IACS
Withdrawn
6%
Non IACS
1%

Equasis statistics The world merchant fleet in 2005
44
3.3. CLASS STATUS AND FLAG
BLACK FLAGS – WHOLE FLEET
Table 71 - World fleet: total number of black flag ships, by type and class – 2005
Ship Type
General Cargo Ships 1 874 25,2% 1 132 51,0% 605 44,5% 2 673 44,4% 6 284 36,9%
Specialized Cargo Ships 25 0,3% 9 0,4% 9 0,7% 35 0,6% 78 0,5%
Container Ships 693 9,3% 19 0,9% 17 1,3% 39 0,6% 768 4,5%
Ro-Ro Cargo Ships 379 5,1% 15 0,7% 48 3,5% 56 0,9% 498 2,9%
Bulk Carriers 1 726 23,2% 92 4,1% 125 9,2% 195 3,2% 2 138 12,5%
Oil and Chemical Tankers 1 089 14,6% 217 9,8% 173 12,7% 785 13,0% 2 264 13,3%
Gas Tankers 209 2,8% 2 0,1% 17 1,3% 55 0,9% 283 1,7%
Other Tankers 27 0,4% 10 0,5% 15 1,1% 48 0,8% 100 0,6%
Passenger Ships 156 2,1% 226 10,2% 92 6,8% 434 7,2% 908 5,3%
Offshore Vessels 508 6,8% 43 1,9% 47 3,5% 240 4,0% 838 4,9%
Service Ships 160 2,2% 65 2,9% 73 5,4% 325 5,4% 623 3,7%
Tugs 574 7,7% 388 17,5% 139 10,2% 1 113 18,5% 2 214 13,0%
Leisure Vessels 16 0,2% 29 0,5% 45 0,3%
Total 7 436 100% 2 218 100% 1 360 100% 6 027 100% 17 041 100%
Class not recordedIACS Non IACS TotalIACS Withdrawn
Source : Equasis processed by Emsa - IACS membership on 31/12/2005
Table 72 - Gross tonnage (in 1000 t) of black flagships, by type and class - 2005
Ship Type
General Cargo Ships 10 309 7,1% 1 867 42,1% 1 925 27,0% 3 882 39,9% 17 982 10,7%
Specialized Cargo Ships 340 0,2% 20 0,5% 43 0,6% 36 0,4% 438 0,3%
Container Ships 20 751 14,2% 72 1,6% 183 2,6% 595 6,1% 21 602 12,9%
Ro-Ro Cargo Ships 11 139 7,6% 66 1,5% 326 4,6% 197 2,0% 11 728 7,0%
Bulk Carriers 60 185 41,2% 1 043 23,5% 2 840 39,8% 2 067 21,2% 66 134 39,5%
Oil and Chemical Tankers 32 190 22,0% 518 11,7% 1 244 17,4% 1 217 12,5% 35 169 21,0%
Gas Tankers 5 085 3,5% 6 0,1% 54 0,8% 142 1,5% 5 286 3,2%
Other Tankers 71 0,0% 12 0,3% 63 0,9% 23 0,2% 169 0,1%
Passenger Ships 2 523 1,7% 459 10,4% 259 3,6% 461 4,7% 3 702 2,2%
Offshore Vessels 2 754 1,9% 190 4,3% 57 0,8% 494 5,1% 3 495 2,1%
Service Ships 448 0,3% 96 2,2% 107 1,5% 339 3,5% 990 0,6%
Tugs 213 0,1% 80 1,8% 40 0,6% 265 2,7% 598 0,4%
Leisure Vessels 11 0,0% 11 0,1% 22 0,0%
Total 146 016 100% 4 429 100% 7 141 100% 9 729 100% 167 315 100%
Class not recordedIACS Non IACS TotalIACS Withdrawn
Source : Equasis processed by Emsa - IACS membership on 31/12/2005
Graph 71 - Total number of black flag ships, by class – 2005
Non IACS
13%
IACS
Withdrawn
8%
IACS
44%
Class not
recorded
35%
Graph 72 - Gross tonnage (in 1000 t) of black flag ships, by class – 2005
Non IACS
3%
IACS
Withdrawn
4%
IACS
87%
Class not
recorded
6%

Equasis statistics The world merchant fleet in 2005
45
BLACK FLAGS – SMALL SHIPS
Table 73 - Total number of black flag small(1) ships, by type and class - 2005
Ship Type
General Cargo Ships 27 3,4% 452 44,3% 35 13,1% 1 063 33,6% 1 577 30,1%
Specialized Cargo Ships 1 0,1% 1 0,4% 14 0,4% 16 0,3%
Container Ships
Ro-Ro Cargo Ships 1 0,1% 9 0,3% 10 0,2%
Bulk Carriers 4 0,4% 48 1,5% 52 1,0%
Oil and Chemical Tankers 32 4,1% 41 4,0% 14 5,2% 288 9,1% 375 7,2%
Gas Tankers 5 0,2% 5 0,1%
Other Tankers 4 0,4% 2 0,7% 35 1,1% 41 0,8%
Passenger Ships 34 4,3% 100 9,8% 54 20,2% 280 8,9% 468 8,9%
Offshore Vessels 128 16,3% 14 1,4% 9 3,4% 147 4,7% 298 5,7%
Service Ships 56 7,1% 20 2,0% 28 10,5% 174 5,5% 278 5,3%
Tugs 500 63,8% 384 37,6% 124 46,4% 1 072 33,9% 2 080 39,8%
Leisure Vessels 7 0,9% 25 0,8% 32 0,6%
Total 784 100% 1 021 100% 267 100% 3 160 100% 5 232 100%
TotalIACS Non IACS IACS Withdrawn Class not recorded
Source : Equasis processed by Emsa - (1) GT<500 - IACS membership on 31/12/2005
Table 74 - Gross tonnage (in 1000 t) of black flag small(1) ships, by type and class - 2005
Ship Type
General Cargo Ships 9 4,0% 141 51,8% 11 16,1% 342 39,1% 503 34,9%
Specialized Cargo Ships 0 0,2% 0 0,7% 6 0,7% 7 0,5%
Container Ships
Ro-Ro Cargo Ships 0 0,1% 4 0,4% 4 0,3%
Bulk Carriers 2 0,7% 19 2,1% 20 1,4%
Oil and Chemical Tankers 13 5,6% 14 5,3% 6 8,7% 98 11,2% 131 9,1%
Gas Tankers 2 0,2% 2 0,2%
Other Tankers 1 0,5% 0 0,5% 10 1,1% 11 0,8%
Passenger Ships 11 4,8% 29 10,6% 14 20,5% 69 7,9% 123 8,5%
Offshore Vessels 40 17,6% 3 1,2% 3 3,9% 43 4,9% 88 6,1%
Service Ships 15 6,4% 4 1,5% 7 10,3% 48 5,5% 73 5,1%
Tugs 137 60,3% 77 28,3% 26 39,3% 228 26,1% 468 32,5%
Leisure Vessels 3 1,2% 7 0,8% 9 0,7%
Total 227 100% 273 100% 67 100% 873 100% 1 440 100%
TotalIACS Non IACS IACS Withdrawn Class not recorded
Source : Equasis processed by Emsa - (1) GT<500 - IACS membership on 31/12/2005
Graph 73 - Total number of black flag small ships, by class – 2005
Class not
recorded
60%IACS
15%
IACS
Withdrawn
5%Non IACS
20%
Graph 74 - Gross tonnage (in 1000 t) of black flag small ships, by class – 2005
Non IACS
19%
IACS
Withdrawn
5%
IACS
16%
Class not
recorded
60%

Equasis statistics The world merchant fleet in 2005
46
BLACK FLAGS – MEDIUM SHIPS
Table 75 - Total number of black flag medium(1) ships, by type and class - 2005
Ship Type
General Cargo Ships 1 836 39,4% 680 57,0% 570 54,5% 1 610 57,0% 4 696 48,3%
Specialized Cargo Ships 17 0,4% 8 0,7% 8 0,8% 21 0,7% 54 0,6%
Container Ships 377 8,1% 19 1,6% 15 1,4% 33 1,2% 444 4,6%
Ro-Ro Cargo Ships 171 3,7% 14 1,2% 44 4,2% 45 1,6% 274 2,8%
Bulk Carriers 720 15,5% 85 7,1% 98 9,4% 124 4,4% 1 027 10,6%
Oil and Chemical Tankers 726 15,6% 176 14,8% 146 14,0% 492 17,4% 1 540 15,8%
Gas Tankers 141 3,0% 2 0,2% 17 1,6% 49 1,7% 209 2,2%
Other Tankers 27 0,6% 6 0,5% 13 1,2% 13 0,5% 59 0,6%
Passenger Ships 96 2,1% 126 10,6% 37 3,5% 154 5,4% 413 4,2%
Offshore Vessels 358 7,7% 27 2,3% 38 3,6% 89 3,1% 512 5,3%
Service Ships 102 2,2% 45 3,8% 45 4,3% 151 5,3% 343 3,5%
Tugs 74 1,6% 4 0,3% 15 1,4% 41 1,5% 134 1,4%
Leisure Vessels 9 0,2% 4 0,1% 13 0,1%
Total 4 654 100% 1 192 100% 1 046 100% 2 826 100% 9 718 100%
IACS Non IACS IACS Withdrawn Class not recorded Total
Source : Equasis processed by Emsa - (1) 500≤GT<25.000 - IACS membership on 31/12/2005
Table 76 - Gross tonnage (in 1000 t) of black flag medium(1) ships, by type and class - 2005
Ship Type
General Cargo Ships 10 011 27,9% 1 725 44,4% 1 914 43,0% 3 540 54,3% 17 190 33,8%
Specialized Cargo Ships 96 0,3% 19 0,5% 42 0,9% 30 0,5% 188 0,4%
Container Ships 4 930 13,7% 72 1,9% 65 1,5% 171 2,6% 5 238 10,3%
Ro-Ro Cargo Ships 1 790 5,0% 66 1,7% 197 4,4% 102 1,6% 2 155 4,2%
Bulk Carriers 11 348 31,6% 937 24,1% 1 319 29,6% 941 14,4% 14 545 28,6%
Oil and Chemical Tankers 5 011 13,9% 504 13,0% 495 11,1% 815 12,5% 6 825 13,4%
Gas Tankers 775 2,2% 6 0,1% 54 1,2% 58 0,9% 893 1,8%
Other Tankers 71 0,2% 11 0,3% 63 1,4% 13 0,2% 158 0,3%
Passenger Ships 853 2,4% 431 11,1% 135 3,0% 392 6,0% 1 810 3,6%
Offshore Vessels 606 1,7% 23 0,6% 55 1,2% 125 1,9% 809 1,6%
Service Ships 370 1,0% 92 2,4% 100 2,2% 291 4,5% 854 1,7%
Tugs 76 0,2% 3 0,1% 14 0,3% 37 0,6% 129 0,3%
Leisure Vessels 8 0,0% 5 0,1% 12 0,0%
Total 35 943 100% 3 889 100% 4 452 100% 6 522 100% 50 806 100%
IACS Non IACS IACS Withdrawn Class not recorded Total
Source : Equasis processed by Emsa - (1) 500≤GT<25.000 - IACS membership on 31/12/2005
Graph 75 - Total number of black flag medium ships, by class – 2005
Non IACS
12%IACS
Withdrawn
11%
IACS
48%
Class not
recorded
29%
Graph 76 - Gross tonnage (in 1000 t) of black flag medium ships, by class – 2005
Non IACS
8%
IACS
Withdrawn
9%
IACS
70%
Class not
recorded
13%

Equasis statistics The world merchant fleet in 2005
47
BLACK FLAGS – LARGE SHIPS
Table 77 - Total number of black flag large(1) ships, by type and class - 2005
Ship Type
General Cargo Ships 11 0,8% 11 0,7%
Specialized Cargo Ships 8 0,6% 8 0,5%
Container Ships 224 15,5% 1 2,9% 225 14,9%
Ro-Ro Cargo Ships 196 13,6% 4 11,4% 1 4,2% 201 13,3%
Bulk Carriers 749 51,9% 3 100% 18 51,4% 18 75,0% 788 52,3%
Oil and Chemical Tankers 192 13,3% 12 34,3% 4 16,7% 208 13,8%
Gas Tankers 44 3,0% 44 2,9%
Other Tankers
Passenger Ships 13 0,9% 13 0,9%
Offshore Vessels 5 0,3% 1 4,2% 6 0,4%
Service Ships 2 0,1% 2 0,1%
Tugs
Leisure Vessels
Total 1 444 100% 3 100% 35 100% 24 100% 1 506 100%
TotalIACS Non IACS IACS Withdrawn Class not recorded
Source : Equasis processed by Emsa - (1) 25.000≤GT<60.000 - IACS membership on 31/12/2005
Table 78 - Gross tonnage (in 1000 t) of black flag large(1) ships, by type and class - 2005
Ship Type
General Cargo Ships 289 0,5% 289 0,5%
Specialized Cargo Ships 244 0,4% 244 0,4%
Container Ships 9 213 16,8% 53 3,9% 9 267 16,2%
Ro-Ro Cargo Ships 8 612 15,7% 129 9,5% 29 3,4% 8 770 15,4%
Bulk Carriers 26 271 48,0% 104 100% 601 44,0% 646 75,6% 27 622 48,4%
Oil and Chemical Tankers 7 295 13,3% 582 42,6% 143 16,8% 8 021 14,1%
Gas Tankers 1 964 3,6% 1 964 3,4%
Other Tankers
Passenger Ships 526 1,0% 526 0,9%
Offshore Vessels 230 0,4% 36 4,2% 267 0,5%
Service Ships 63 0,1% 63 0,1%
Tugs
Leisure Vessels
Total 54 707 100% 104 100% 1 365 100% 855 100% 57 031 100%
TotalIACS Non IACS IACS Withdrawn Class not recorded
Source : Equasis processed by Emsa - (1) 25.000≤GT<60.000 - IACS membership on 31/12/2005
Graph 77 - Total number of black flag large ships, by class – 2005
Non IACS
0%
IACS
Withdrawn
2%
IACS
96%
Class not
recorded
2%
Graph 78 - Gross tonnage (in 1000 t) of black flag large ships, by class – 2005
Non IACS
0%
IACS
Withdrawn
2%
IACS
97%
Class not
recorded
1%

Equasis statistics The world merchant fleet in 2005
48
BLACK FLAGS – VERY LARGE SHIPS
Table 79 - Total number of black flag very large(1) ships, by type and class - 2005
Ship Type
General Cargo Ships
Specialized Cargo Ships
Container Ships 92 16,6% 1 8,3% 6 35,3% 99 16,9%
Ro-Ro Cargo Ships 12 2,2% 1 5,9% 13 2,2%
Bulk Carriers 257 46,4% 9 75,0% 5 29,4% 271 46,3%
Oil and Chemical Tankers 139 25,1% 1 8,3% 1 5,9% 141 24,1%
Gas Tankers 24 4,3% 1 5,9% 25 4,3%
Other Tankers
Passenger Ships 13 2,3% 1 8,3% 14 2,4%
Offshore Vessels 17 3,1% 2 100% 3 17,6% 22 3,8%
Service Ships
Tugs
Leisure Vessels
Total 554 100% 2 100% 12 100% 17 100% 585 100%
IACS Non IACS IACS Withdrawn Class not recorded Total
Source : Equasis processed by Emsa - (1) GT≥60.000 - IACS membership on 31/12/2005
Table 80 - Gross tonnage (in 1000 t) of black flag very large(1) ships, by type and class - 2005
Ship Type
General Cargo Ships
Specialized Cargo Ships
Container Ships 6 608 12,0% 65 5,2% 425 28,7% 7 097 12,2%
Ro-Ro Cargo Ships 737 1,3% 63 4,2% 800 1,4%
Bulk Carriers 22 566 40,9% 920 73,2% 461 31,1% 23 947 41,3%
Oil and Chemical Tankers 19 871 36,0% 161 12,8% 160 10,8% 20 192 34,8%
Gas Tankers 2 346 4,3% 81 5,5% 2 428 4,2%
Other Tankers
Passenger Ships 1 133 2,1% 110 8,8% 1 243 2,1%
Offshore Vessels 1 878 3,4% 164 100% 290 19,6% 2 331 4,0%
Service Ships
Tugs
Leisure Vessels
Total 55 139 100% 164 100% 1 256 100% 1 479 100% 58 038 100%
IACS Non IACS IACS Withdrawn Class not recorded Total
Source : Equasis processed by Emsa - (1) GT≥60.000 - IACS membership on 31/12/2005
Graph 79 - Total number of black flag very large ships, by class – 2005
Class not
recorded
3%
IACS
95%
IACS
Withdrawn
2%
Non IACS
0%
Graph 80 - Gross tonnage (in 1000 t) of black flag very large ships, by class – 2005
Class not
recorded
3%
IACS
95%
IACS
Withdrawn
2%
Non IACS
0%

Equasis statistics The world merchant fleet in 2005
49
NON BLACK FLAGS – WHOLE FLEET
Table 81 - World fleet, total number of non black flag ships, by type and class – 2005
Ship Type
General Cargo Ships 4 516 18,5% 124 29,3% 388 20,3% 4 557 26,1% 9 585 21,7%
Specialized Cargo Ships 82 0,3% 5 0,3% 27 0,2% 114 0,3%
Container Ships 2 105 8,6% 7 1,7% 31 1,6% 85 0,5% 2 228 5,0%
Ro-Ro Cargo Ships 750 3,1% 9 2,1% 26 1,4% 101 0,6% 886 2,0%
Bulk Carriers 3 277 13,4% 31 7,3% 149 7,8% 726 4,2% 4 183 9,5%
Oil and Chemical Tankers 4 305 17,7% 52 12,3% 300 15,7% 2 209 12,6% 6 866 15,5%
Gas Tankers 678 2,8% 2 0,5% 41 2,1% 76 0,4% 797 1,8%
Other Tankers 111 0,5% 7 1,7% 14 0,7% 118 0,7% 250 0,6%
Passenger Ships 1 786 7,3% 84 19,9% 243 12,7% 2 750 15,7% 4 863 11,0%
Offshore Vessels 2 008 8,2% 11 2,6% 99 5,2% 736 4,2% 2 854 6,5%
Service Ships 1 258 5,2% 16 3,8% 155 8,1% 1 671 9,6% 3 100 7,0%
Tugs 3 168 13,0% 61 14,4% 434 22,8% 4 184 23,9% 7 847 17,8%
Leisure Vessels 329 1,3% 19 4,5% 22 1,2% 243 1,4% 613 1,4%
Total 24 373 100% 423 100% 1 907 100% 17 483 100% 44 186 100%
Class not recordedIACS Non IACS TotalIACS Withdrawn
Source : Equasis processed by Emsa - IACS membership on 31/12/2005
Table 82 - Gross tonnage (in 1000 t) of non black flag ships, by type class and class - 2005
Ship Type
General Cargo Ships 26 182 6,7% 397 19,0% 1 157 9,4% 5 363 20,1% 33 100 7,6%
Specialized Cargo Ships 895 0,2% 24 0,2% 41 0,2% 960 0,2%
Container Ships 58 290 14,9% 219 10,5% 562 4,6% 2 169 8,1% 61 241 14,1%
Ro-Ro Cargo Ships 17 205 4,4% 71 3,4% 279 2,3% 520 2,0% 18 076 4,2%
Bulk Carriers 101 413 25,9% 483 23,1% 3 655 29,7% 5 070 19,0% 110 621 25,5%
Oil and Chemical Tankers 134 435 34,3% 520 24,9% 4 582 37,2% 5 210 19,6% 144 747 33,4%
Gas Tankers 19 154 4,9% 1 0,1% 267 2,2% 491 1,8% 19 913 4,6%
Other Tankers 493 0,1% 21 1,0% 51 0,4% 51 0,2% 616 0,1%
Passenger Ships 18 794 4,8% 326 15,6% 804 6,5% 2 839 10,7% 22 763 5,3%
Offshore Vessels 9 146 2,3% 9 0,4% 631 5,1% 1 815 6,8% 11 601 2,7%
Service Ships 5 007 1,3% 21 1,0% 191 1,6% 2 020 7,6% 7 240 1,7%
Tugs 1 124 0,3% 15 0,7% 99 0,8% 917 3,4% 2 155 0,5%
Leisure Vessels 135 0,0% 4 0,2% 5 0,0% 122 0,5% 266 0,1%
Total 392 273 100% 2 088 100% 12 309 100% 26 629 100% 433 299 100%
Class not recordedIACS Non IACS TotalIACS Withdrawn
Source : Equasis processed by Emsa - IACS membership on 31/12/2005
Graph 81 - Total number of non black flag ships, by class – 2005
Non IACS
1%
IACS
Withdrawn
4%IACS
55%
Class not
recorded
40%
Graph 82 - Gross tonnage (in 1000 t) of non black flag ships, by class – 2005
Non IACS
0%
IACS
Withdrawn
3%
IACS
91%
Class not
recorded
6%

Equasis statistics The world merchant fleet in 2005
50
NON BLACK FLAGS – SMALL SHIPS
Table 83 - Total number of non black flag small(1) ships, by type and class - 2005
Ship Type
General Cargo Ships 250 4,9% 11 7,5% 78 9,3% 2 975 24,0% 3 314 18,0%
Specialized Cargo Ships 1 0,0% 1 0,1% 12 0,1% 14 0,1%
Container Ships
Ro-Ro Cargo Ships 8 0,2% 15 0,1% 23 0,1%
Bulk Carriers 5 0,1% 1 0,7% 5 0,6% 371 3,0% 382 2,1%
Oil and Chemical Tankers 205 4,1% 5 3,4% 58 6,9% 1 370 11,1% 1 638 8,9%
Gas Tankers 9 0,2% 1 0,7% 7 0,8% 27 0,2% 44 0,2%
Other Tankers 17 0,3% 2 1,4% 2 0,2% 89 0,7% 110 0,6%
Passenger Ships 619 12,3% 40 27,4% 128 15,2% 1 835 14,8% 2 622 14,2%
Offshore Vessels 418 8,3% 5 3,4% 46 5,5% 491 4,0% 960 5,2%
Service Ships 444 8,8% 5 3,4% 77 9,2% 980 7,9% 1 506 8,2%
Tugs 2 831 56,0% 58 39,7% 418 49,8% 4 030 32,5% 7 337 39,8%
Leisure Vessels 244 4,8% 18 12,3% 20 2,4% 196 1,6% 478 2,6%
Total 5 051 100% 146 100% 840 100% 12 391 100% 18 428 100%
TotalIACS Non IACS IACS Withdrawn Class not recorded
Source : Equasis processed by Emsa - (1) GT<500 - IACS membership on 31/12/2005
Table 84 - Gross tonnage (in 1000 t) of non black flag small(1) ships, by type class - 2005
Ship Type
General Cargo Ships 79 5,9% 4 10,3% 24 11,8% 942 29,1% 1 049 21,8%
Specialized Cargo Ships 0 0,0% 0 0,1% 4 0,1% 5 0,1%
Container Ships
Ro-Ro Cargo Ships 3 0,3% 5 0,2% 9 0,2%
Bulk Carriers 2 0,1% 0 1,0% 2 1,0% 140 4,3% 145 3,0%
Oil and Chemical Tankers 76 5,7% 2 4,5% 21 10,4% 421 13,0% 520 10,8%
Gas Tankers 4 0,3% 0 1,4% 3 1,5% 8 0,3% 16 0,3%
Other Tankers 5 0,4% 1 1,5% 1 0,3% 24 0,7% 29 0,6%
Passenger Ships 172 12,8% 10 28,3% 31 15,5% 435 13,5% 649 13,5%
Offshore Vessels 125 9,3% 2 4,4% 12 6,0% 130 4,0% 268 5,6%
Service Ships 104 7,8% 1 3,4% 17 8,4% 267 8,3% 390 8,1%
Tugs 735 54,9% 13 34,9% 87 43,2% 806 24,9% 1 641 34,1%
Leisure Vessels 34 2,5% 4 10,3% 4 1,8% 50 1,6% 92 1,9%
Total 1 338 100% 36 100% 202 100% 3 234 100% 4 811 100%
TotalIACS Non IACS IACS Withdrawn Class not recorded
Source : Equasis processed by Emsa - (1) GT<500 - IACS membership on 31/12/2005
Graph 83 - Total number of non black flag small ships, by class – 2005
Class not
recorded
67%
IACS
27%
IACS
Withdrawn
5%Non IACS
1%
Graph 84 - Gross tonnage (in 1000 t) of non black flag small ships, by class – 2005
Class not
recorded
67%
IACS
28%
IACS
Withdrawn
4%Non IACS
1%

Equasis statistics The world merchant fleet in 2005
51
NON BLACK FLAGS – MEDIUM SHIPS
Table 85 - Total number of non black flag medium(1) ships, by type and class - 2005
Ship Type
General Cargo Ships 4 098 29,6% 113 44,5% 310 33,1% 1 581 32,0% 6 102 30,5%
Specialized Cargo Ships 71 0,5% 4 0,4% 15 0,3% 90 0,5%
Container Ships 1 134 8,2% 2 0,8% 22 2,4% 52 1,1% 1 210 6,1%
Ro-Ro Cargo Ships 473 3,4% 9 3,5% 24 2,6% 84 1,7% 590 3,0%
Bulk Carriers 1 524 11,0% 24 9,4% 87 9,3% 314 6,4% 1 949 9,7%
Oil and Chemical Tankers 2 397 17,3% 38 15,0% 194 20,7% 797 16,1% 3 426 17,1%
Gas Tankers 438 3,2% 1 0,4% 31 3,3% 44 0,9% 514 2,6%
Other Tankers 91 0,7% 5 2,0% 12 1,3% 29 0,6% 137 0,7%
Passenger Ships 914 6,6% 41 16,1% 108 11,5% 910 18,4% 1 973 9,9%
Offshore Vessels 1 517 10,9% 6 2,4% 48 5,1% 227 4,6% 1 798 9,0%
Service Ships 784 5,7% 11 4,3% 78 8,3% 685 13,9% 1 558 7,8%
Tugs 337 2,4% 3 1,2% 16 1,7% 154 3,1% 510 2,6%
Leisure Vessels 85 0,6% 1 0,4% 2 0,2% 47 1,0% 135 0,7%
Total 13 863 100% 254 100% 936 100% 4 939 100% 19 992 100%
IACS Non IACS IACS Withdrawn Class not recorded Total
Source : Equasis processed by Emsa - (1) 500≤GT<25.000 - IACS membership on 31/12/2005
Table 86 - Gross tonnage (in 1000 t) of non black flag medium(1) ships, by type and class - 2005
Ship Type
General Cargo Ships 21 152 21,7% 393 36,5% 1 133 27,7% 4 391 29,6% 27 070 23,1%
Specialized Cargo Ships 555 0,6% 24 0,6% 36 0,2% 615 0,5%
Container Ships 13 775 14,2% 19 1,7% 225 5,5% 326 2,2% 14 345 12,2%
Ro-Ro Cargo Ships 4 955 5,1% 71 6,6% 166 4,0% 404 2,7% 5 597 4,8%
Bulk Carriers 23 004 23,6% 244 22,7% 1 280 31,3% 3 290 22,2% 27 818 23,7%
Oil and Chemical Tankers 17 866 18,4% 69 6,4% 581 14,2% 1 888 12,7% 20 405 17,4%
Gas Tankers 2 418 2,5% 1 0,1% 37 0,9% 61 0,4% 2 517 2,1%
Other Tankers 392 0,4% 21 1,9% 51 1,2% 27 0,2% 490 0,4%
Passenger Ships 6 293 6,5% 229 21,3% 299 7,3% 2 244 15,1% 9 064 7,7%
Offshore Vessels 2 918 3,0% 8 0,7% 112 2,7% 404 2,7% 3 441 2,9%
Service Ships 3 519 3,6% 20 1,8% 174 4,3% 1 560 10,5% 5 273 4,5%
Tugs 389 0,4% 2 0,2% 12 0,3% 111 0,8% 514 0,4%
Leisure Vessels 101 0,1% 1 0,1% 2 0,0% 71 0,5% 174 0,1%
Total 97 338 100% 1 077 100% 4 096 100% 14 815 100% 117 325 100%
IACS Non IACS IACS Withdrawn Class not recorded Total
Source : Equasis processed by Emsa - (1) 500≤GT<25.000 - IACS membership on 31/12/2005
Graph 85 - Total number of non black flag medium ships, by class – 2005
Non IACS
1%
IACS
Withdrawn
5%
IACS
69%
Class not
recorded
25%
Graph 86 - Gross tonnage (in 1000 t) of non black flag medium ships, by class – 2005
Class not
recorded
13%
IACS
83%
IACS
Withdrawn
3%
Non IACS
1%

Equasis statistics The world merchant fleet in 2005
52
NON BLACK FLAGS – LARGE SHIPS
Table 87 - Total number of non black flag large(1) ships, by type and class - 2005
Ship Type
General Cargo Ships 168 4,2% 1 1,0% 169 4,0%
Specialized Cargo Ships 10 0,3% 10 0,2%
Container Ships 759 19,0% 5 25,0% 9 10,6% 21 20,8% 794 18,9%
Ro-Ro Cargo Ships 251 6,3% 2 2,4% 2 2,0% 255 6,1%
Bulk Carriers 1 397 35,0% 5 25,0% 47 55,3% 36 35,6% 1 485 35,4%
Oil and Chemical Tankers 1 057 26,5% 7 35,0% 23 27,1% 22 21,8% 1 109 26,4%
Gas Tankers 106 2,7% 1 1,2% 1 1,0% 108 2,6%
Other Tankers 3 0,1% 3 0,1%
Passenger Ships 187 4,7% 3 15,0% 2 2,4% 5 5,0% 197 4,7%
Offshore Vessels 27 0,7% 1 1,2% 7 6,9% 35 0,8%
Service Ships 23 0,6% 6 5,9% 29 0,7%
Tugs
Leisure Vessels
Total 3 988 100% 20 100% 85 100% 101 100% 4 194 100%
TotalIACS Non IACS IACS Withdrawn Class not recorded
Source : Equasis processed by Emsa - (1) 25.000≤GT<60.000 - IACS membership on 31/12/2005
Table 88 - Gross tonnage (in 1000 t) of non black flag large(1) ships, by type and class - 2005
Ship Type
General Cargo Ships 4 951 3,3% 30 0,8% 4 981 3,2%
Specialized Cargo Ships 340 0,2% 340 0,2%
Container Ships 28 930 19,3% 201 27,2% 337 10,9% 770 20,9% 30 238 19,2%
Ro-Ro Cargo Ships 11 061 7,4% 113 3,7% 110 3,0% 11 285 7,2%
Bulk Carriers 48 328 32,3% 165 22,4% 1 533 49,6% 1 225 33,3% 51 252 32,6%
Oil and Chemical Tankers 43 061 28,7% 287 38,8% 945 30,6% 841 22,9% 45 135 28,7%
Gas Tankers 4 359 2,9% 44 1,4% 41 1,1% 4 443 2,8%
Other Tankers 96 0,1% 96 0,1%
Passenger Ships 6 567 4,4% 87 11,7% 68 2,2% 161 4,4% 6 883 4,4%
Offshore Vessels 1 203 0,8% 47 1,5% 305 8,3% 1 555 1,0%
Service Ships 888 0,6% 193 5,2% 1 081 0,7%
Tugs
Leisure Vessels
Total 149 785 100% 740 100% 3 088 100% 3 675 100% 157 288 100%
TotalIACS Non IACS IACS Withdrawn Class not recorded
Source : Equasis processed by Emsa - (1) 25.000≤GT<60.000 - IACS membership on 31/12/2005
Graph 87 - Total number of non black flag large ships, by class – 2005
Non IACS
0%
IACS
Withdrawn
2%
IACS
96%
Class not
recorded
2%
Graph 88 - Gross tonnage (in 1000 t) of non black flag large ships, by class – 2005
Non IACS
0%IACS
Withdrawn
2%
IACS
96%
Class not
recorded
2%

Equasis statistics The world merchant fleet in 2005
53
NON BLACK FLAGS – VERY LARGE SHIPS
Table 89 - Total number of non black flag very large(1) ships, by type and class - 2005
Ship Type
General Cargo Ships 0 0,0%
Specialized Cargo Ships 0 0,0%
Container Ships 212 14,4% 12 23,1% 224 14,2%
Ro-Ro Cargo Ships 18 1,2% 18 1,1%
Bulk Carriers 351 23,9% 1 33% 10 21,7% 5 9,6% 367 23,3%
Oil and Chemical Tankers 646 43,9% 2 67% 25 54,3% 20 38,5% 693 44,1%
Gas Tankers 125 8,5% 2 4,3% 4 7,7% 131 8,3%
Other Tankers
Passenger Ships 66 4,5% 5 10,9% 71 4,5%
Offshore Vessels 46 3,1% 4 8,7% 11 21,2% 61 3,9%
Service Ships 7 0,5% 7 0,4%
Tugs
Leisure Vessels
Total 1 471 100% 3 100% 46 100% 52 100% 1 572 100%
IACS Non IACS IACS Withdrawn Class not recorded Total
Source : Equasis processed by Emsa - (1) GT≥60.000 - IACS membership on 31/12/2005
Table 90 - Gross tonnage (in 1000 t) of non black flag very large(1) ships, by type and class - 2005
Ship Type
General Cargo Ships
Specialized Cargo Ships
Container Ships 15 586 10,8% 1 073 21,9% 16 658 10,8%
Ro-Ro Cargo Ships 1 185 0,8% 1 185 0,8%
Bulk Carriers 30 079 20,9% 73 31% 839 17,1% 415 8,5% 31 407 20,4%
Oil and Chemical Tankers 73 432 51,1% 162 69% 3 035 61,7% 2 059 42,0% 78 688 51,1%
Gas Tankers 12 374 8,6% 183 3,7% 381 7,8% 12 937 8,4%
Other Tankers
Passenger Ships 5 762 4,0% 406 8,2% 6 167 4,0%
Offshore Vessels 4 900 3,4% 459 9,3% 977 19,9% 6 337 4,1%
Service Ships 496 0,3% 496 0,3%
Tugs
Leisure Vessels
Total 143 813 100% 235 100% 4 922 100% 4 905 100% 153 875 100%
IACS Non IACS IACS Withdrawn Class not recorded Total
Source : Equasis processed by Emsa - (1) GT≥60.000 - IACS membership on 31/12/2005
Graph 89 - Total number of non black flag very large ships, by class – 2005
Class not
recorded
3%
IACS
94%
IACS
Withdrawn
3%
Non IACS
0%
Graph 90 - Gross tonnage (in 1000 t) of non black flag very large ships under non black flag, by class – 2005
Class not
recorded
3%
IACS
94%
IACS
Withdrawn
3%
Non IACS
0%

Equasis statistics The world merchant fleet in 2005
54
3.4. SAFETY PERFORMANCE
WHOLE FLEET
Table 91 - World fleet detention rates(*), by type and class – 2005
Ship Type IACS Non IACS IACS Withdrawn Class not recorded Overall
General Cargo Ships 4,42% 18,49% 13,17% 14,60% 6,77%
Specialized Cargo Ships 4,17% 12,50% 50,00% 16,67% 5,86%
Container Ships 2,10% 0,00% 0,00% 2,20% 2,08%
Ro-Ro Cargo Ships 1,98% 34,78% 8,82% 6,52% 2,55%
Bulk Carriers 3,76% 13,23% 8,99% 6,54% 4,15%
Oil and Chemical Tankers 2,09% 23,73% 6,38% 12,43% 2,64%
Gas Tankers 1,34% 33,33% 11,11% 12,50% 1,88%
Other Tankers 1,18% 0,00% 6,67% 37,50% 3,09%
Passenger Ships 1,10% 5,71% 3,28% 1,75% 1,35%
Offshore Vessels 3,00% 0,00% 0,00% 0,00% 2,76%
Service Ships 3,58% 40,00% 40,00% 12,66% 6,52%
Tugs 5,11% 0,00% 3,06% 4,18%
Leisure Vessels 0,00% 0,00%
Total 3,19% 17,30% 10,64% 11,95% 4,29%
Source : Equasis processed by Emsa - IACS membership on 31/12/2005 - (*) Detentions in Paris MoU, Tokyo MoU and USCG divided by total number of inspections
SMALL SHIPS
Table 92 - Small(1) ships detention rates(*), by type and class - 2005
Ship Type IACS Non IACS IACS Withdrawn Class not recorded Overall
General Cargo Ships 12,70% 42,86% 40,00% 42,20% 34,68%
Specialized Cargo Ships 0,00% 100,00% 20,00%
Container Ships
Ro-Ro Cargo Ships 0,00% 0,00%
Bulk Carriers 0,00% 0,00% 0,00%
Oil and Chemical Tankers 5,26% 0,00% 0,00% 9,09% 6,25%
Gas Tankers 0,00% 0,00% 0,00%
Other Tankers 0,00% 0,00%
Passenger Ships 0,00% 0,00% 25,00% 2,50% 2,61%
Offshore Vessels 11,11% 0,00% 7,41%
Service Ships 4,17% 0,00% 10,00% 6,52%
Tugs 6,02% 0,00% 2,44% 3,98%
Leisure Vessels 0,00% 0,00%
Total 7,00% 20,00% 12,50% 20,77% 15,48% Source : Equasis processed by Emsa - IACS membership on 31/12/2005 - (*) Detentions in Paris MoU, Tokyo MoU and USCG divided by total number of inspections

Equasis statistics The world merchant fleet in 2005
55
MEDIUM SHIPS
Table 93 - Medium(1) ships detention rates(*), by type and class - 2005
Ship Type IACS Non IACS IACS Withdrawn Class not recorded Overall
General Cargo Ships 6,66% 28,70% 29,67% 32,55% 12,16%
Specialized Cargo Ships 4,91% 16,67% 50,00% 9,09% 6,38%
Container Ships 4,21% 0,00% 0,00% 8,51% 4,23%
Ro-Ro Cargo Ships 6,03% 34,78% 10,91% 8,57% 7,04%
Bulk Carriers 5,24% 22,99% 21,65% 10,40% 6,76%
Oil and Chemical Tankers 5,02% 35,71% 11,88% 29,93% 6,49%
Gas Tankers 4,06% 100,00% 21,74% 20,00% 5,35%
Other Tankers 3,70% 0,00% 6,67% 50,00% 5,91%
Passenger Ships 2,10% 6,67% 9,09% 6,45% 2,68%
Offshore Vessels 3,19% 0,00% 0,00% 0,00% 2,99%
Service Ships 3,59% 60,00% 66,67% 41,38% 11,99%
Tugs 8,60% 0,00% 31,25% 11,71%
Leisure Vessels 0,00% 0,00%
Total 5,64% 27,00% 25,45% 28,35% 9,08% Source : Equasis processed by Emsa - IACS membership on 31/12/2005 - (*) Detentions in Paris MoU, Tokyo MoU and USCG divided by total number of inspections
LARGE SHIPS
Table 94 - Large(1) ships detention rates(*), by type and class - 2005
Ship Type IACS Non IACS IACS Withdrawn Class not recorded Overall
General Cargo Ships 2,61% 0,00% 2,60%
Specialized Cargo Ships 3,45% 3,45%
Container Ships 4,34% 0,00% 0,00% 0,00% 4,25%
Ro-Ro Cargo Ships 1,77% 0,00% 0,00% 1,75%
Bulk Carriers 5,40% 0,00% 9,62% 4,26% 5,46%
Oil and Chemical Tankers 2,05% 14,29% 8,33% 0,00% 2,21%
Gas Tankers 0,00% 0,00% 0,00%
Other Tankers 0,00% 0,00%
Passenger Ships 0,89% 0,00% 0,00% 0,87%
Offshore Vessels 0,00% 0,00%
Service Ships 0,00% 0,00% 0,00%
Tugs
Leisure Vessels
Total 3,80% 5,26% 7,33% 1,89% 3,84% Source : Equasis processed by Emsa - IACS membership on 31/12/2005 - (*) Detentions in Paris MoU, Tokyo MoU and USCG divided by total number of inspections

Equasis statistics The world merchant fleet in 2005
56
VERY LARGE SHIPS
Table 95 - Very large(1) ships detention rates(*), by type and class - 2005
Ship Type IACS Non IACS IACS Withdrawn Class not recorded Overall
General Cargo Ships
Specialized Cargo Ships
Container Ships 0,46% 0,00% 0,00% 0,45%
Ro-Ro Cargo Ships 0,00% 0,00% 0,00%
Bulk Carriers 7,06% 0,00% 25,00% 6,67% 7,52%
Oil and Chemical Tankers 0,54% 0,00% 0,00% 0,00% 0,51%
Gas Tankers 0,00% 0,00% 0,00% 0,00%
Other Tankers
Passenger Ships 0,00% 0,00% 0,00%
Offshore Vessels 0,00% 0,00%
Service Ships
Tugs
Leisure Vessels
Total 2,46% 0,00% 6,56% 1,96% 2,58% Source : Equasis processed by Emsa - IACS membership on 31/12/2005 - (*) Detentions in Paris MoU, Tokyo MoU and USCG divided by total number of inspections

Equasis statistics The world merchant fleet in 2005
57
4. P&I Clubs
INTRODUCTION
Protection and Indemnity (P&I) Clubs
provide third party insurance cover to ship
owners. Members of the International Group
of P&I Clubs provide EQUASIS with
information on ships entered in their clubs.
The following tables show the proportion of
the fleet, in each size and type category,
which is entered in those Clubs. The
proportion of ships which is shown as non-
P&I covers those ships which are either
entered with a Club for which information is
unavailable or which are not covered by P&I
insurance.
In chapter 4.4 the fleet is analysed
according to P&I and flag status. Flags are
grouped in two categories, black and non-
black. The so-called black flags are those
whose safety performance as measured by
the detention rate of their ships leads to
them being targeted for inspection by port
state control authorities. The Paris MoU,
Tokyo MoU and USCG each publish annually
a list of targeted flags. The black flag group
used in the tables in chapter 3.3 includes
those flags which appear on at least one of
the annual lists for 2004. A list of these flags
is at Annex II.
In chapter 4.5 the detention rate of ships is
the ratio between the number of detentions
and the number of inspections in the Paris
MoU, Tokyo MoU and USCG regions in 2005.
RESULTS
Graph 91 indicates that while only 36% of
the total number of ships is covered by one
of the members of the International Group
this accounts for 88% of the fleet by
tonnage.
Within the large and very large fleet the
vast majority of ships (96%) are covered by
the International Group. Within the medium
fleet just under half are entered in the
Group.
Comparing Graph 101 with 111 indicates
that those ships not entered in the Group
have an older age profile than those which
are. Over half of the non-P&I fleet is over 25
years old compared with a fourth of the P&I
fleet.
The safety performance of the whole fleet as
measured by detention rates shows a good
record with just 4,29% of inspections
resulting in detention in 2005. Table 136
indicates that ships outside the Group were
more likely to be detained in 2005 than
those inside the Group particularly among
cargo ships.
Chapter 4

Equasis statistics The world merchant fleet in 2005
58
4.1. P&I STATUS
WHOLE FLEET
Table 96 - P&I status : world fleet, total number of ships, by type – 2005
Ship Type
General Cargo Ships 4 188 19,0% 11 681 29,8% 15 869 25,9%
Specialized Cargo Ships 85 0,4% 107 0,3% 192 0,3%
Container Ships 2 713 12,3% 283 0,7% 2 996 4,9%
Ro-Ro Cargo Ships 964 4,4% 420 1,1% 1 384 2,3%
Bulk Carriers 4 869 22,1% 1 452 3,7% 6 321 10,3%
Oil and Chemical Tankers 4 612 21,0% 4 518 11,5% 9 130 14,9%
Gas Tankers 753 3,4% 327 0,8% 1 080 1,8%
Other Tankers 88 0,4% 262 0,7% 350 0,6%
Passenger Ships 1 427 6,5% 4 344 11,1% 5 771 9,4%
Offshore Vessels 1 001 4,5% 2 691 6,9% 3 692 6,0%
Service Ships 461 2,1% 3 262 8,3% 3 723 6,1%
Tugs 827 3,8% 9 234 23,5% 10 061 16,4%
Leisure Vessels 26 0,1% 632 1,6% 658 1,1%
Total 22 014 100% 39 213 100% 61 227 100%
P&I Non P&I Total
Source : Equasis processed by Emsa
Table 97 - P&I status : gross tonnage (in 1000 t) of ships, by type - 2005
Ship Type
General Cargo Ships 29 627 5,6% 21 455 28,7% 51 081 8,5%
Specialized Cargo Ships 1 113 0,2% 286 0,4% 1 398 0,2%
Container Ships 78 963 15,0% 3 880 5,2% 82 843 13,8%
Ro-Ro Cargo Ships 27 603 5,2% 2 201 2,9% 29 804 5,0%
Bulk Carriers 163 485 31,1% 13 271 17,7% 176 756 29,4%
Oil and Chemical Tankers 166 727 31,7% 13 189 17,6% 179 916 30,0%
Gas Tankers 24 354 4,6% 845 1,1% 25 199 4,2%
Other Tankers 533 0,1% 252 0,3% 785 0,1%
Passenger Ships 20 631 3,9% 5 834 7,8% 26 465 4,4%
Offshore Vessels 9 073 1,7% 6 024 8,1% 15 097 2,5%
Service Ships 3 236 0,6% 4 993 6,7% 8 229 1,4%
Tugs 419 0,1% 2 334 3,1% 2 752 0,5%
Leisure Vessels 26 0,0% 263 0,4% 288 0,0%
Total 525 788 100% 74 826 100% 600 614 100%
P&I Non P&I Total
Source : Equasis processed by Emsa
Graph 91 - Number of ships, by P&I status – 2005
Non P&I
64%
P&I
36%
Graph 92 - Gross tonnage (in 1000 t) of ships, by P&I status – 2005
Non P&I
12%
P&I
88%

Equasis statistics The world merchant fleet in 2005
59
SMALL SHIPS
Table 98 - P&I status : total number of small(1) ships, by type - 2005
Ship Type
General Cargo Ships 55 5,4% 4 836 21,4% 4 891 20,7%
Specialized Cargo Ships 30 0,1% 30 0,1%
Container Ships
Ro-Ro Cargo Ships 1 0,1% 32 0,1% 33 0,1%
Bulk Carriers 3 0,3% 431 1,9% 434 1,8%
Oil and Chemical Tankers 36 3,5% 1 977 8,7% 2 013 8,5%
Gas Tankers 1 0,1% 48 0,2% 49 0,2%
Other Tankers 2 0,2% 149 0,7% 151 0,6%
Passenger Ships 215 21,0% 2 875 12,7% 3 090 13,1%
Offshore Vessels 42 4,1% 1 216 5,4% 1 258 5,3%
Service Ships 48 4,7% 1 736 7,7% 1 784 7,5%
Tugs 606 59,2% 8 811 38,9% 9 417 39,8%
Leisure Vessels 14 1,4% 496 2,2% 510 2,2%
Total 1 023 100% 22 637 100% 23 660 100%
P&I Non P&I Total
Source : Equasis processed by Emsa - (1) GT<500
Table 99 - P&I status : gross tonnage (in 1000 t) of small(1) ships, by type - 2005
Ship Type
General Cargo Ships 21 7,7% 1 531 25,6% 1 552 24,8%
Specialized Cargo Ships 11 0,2% 11 0,2%
Container Ships
Ro-Ro Cargo Ships 0 0,1% 12 0,2% 13 0,2%
Bulk Carriers 1 0,4% 164 2,7% 165 2,6%
Oil and Chemical Tankers 15 5,4% 636 10,6% 650 10,4%
Gas Tankers 0 0,2% 17 0,3% 18 0,3%
Other Tankers 1 0,3% 40 0,7% 41 0,7%
Passenger Ships 58 21,6% 713 11,9% 771 12,3%
Offshore Vessels 13 4,9% 343 5,7% 357 5,7%
Service Ships 13 4,7% 450 7,5% 463 7,4%
Tugs 148 54,7% 1 961 32,8% 2 109 33,7%
Leisure Vessels 0 0,1% 101 1,7% 101 1,6%
Total 271 100% 5 980 100% 6 251 100%
P&I Non P&I Total
Source : Equasis processed by Emsa - (1) GT<500
Graph 93 - Number of small ships, by P&I status – 2005
P&I
4%
Non P&I
96%
Graph 94 - Gross tonnage (in 1000 t) of small ships, by P&I status – 2005
P&I
4%
Non P&I
96%

Equasis statistics The world merchant fleet in 2005
60
MEDIUM SHIPS
Table 100 - P&I status : total number of medium(1) ships, by type - 2005
Ship Type
General Cargo Ships 3 956 29,4% 6 842 42,1% 10 798 36,3%
Specialized Cargo Ships 69 0,5% 75 0,5% 144 0,5%
Container Ships 1 419 10,5% 235 1,4% 1 654 5,6%
Ro-Ro Cargo Ships 482 3,6% 382 2,4% 864 2,9%
Bulk Carriers 2 081 15,4% 895 5,5% 2 976 10,0%
Oil and Chemical Tankers 2 512 18,6% 2 454 15,1% 4 966 16,7%
Gas Tankers 448 3,3% 275 1,7% 723 2,4%
Other Tankers 83 0,6% 113 0,7% 196 0,7%
Passenger Ships 925 6,9% 1 461 9,0% 2 386 8,0%
Offshore Vessels 878 6,5% 1 432 8,8% 2 310 7,8%
Service Ships 389 2,9% 1 512 9,3% 1 901 6,4%
Tugs 221 1,6% 423 2,6% 644 2,2%
Leisure Vessels 12 0,1% 136 0,8% 148 0,5%
Total 13 475 100% 16 235 100% 29 710 100%
P&I Non P&I Total
Source : Equasis processed by Emsa - (1) 500≤GT<25.000
Table 101 - P&I status : gross tonnage (in 1000 t) of medium(1) ships, by type - 2005
Ship Type
General Cargo Ships 24 432 20,8% 19 827 39,2% 44 260 26,3%
Specialized Cargo Ships 600 0,5% 203 0,4% 803 0,5%
Container Ships 18 043 15,4% 1 540 3,0% 19 583 11,6%
Ro-Ro Cargo Ships 5 808 4,9% 1 944 3,8% 7 751 4,6%
Bulk Carriers 33 780 28,7% 8 584 17,0% 42 363 25,2%
Oil and Chemical Tankers 21 056 17,9% 6 174 12,2% 27 230 16,2%
Gas Tankers 2 922 2,5% 488 1,0% 3 410 2,0%
Other Tankers 436 0,4% 212 0,4% 648 0,4%
Passenger Ships 6 186 5,3% 4 689 9,3% 10 874 6,5%
Offshore Vessels 1 931 1,6% 2 320 4,6% 4 251 2,5%
Service Ships 2 021 1,7% 4 106 8,1% 6 127 3,6%
Tugs 271 0,2% 373 0,7% 643 0,4%
Leisure Vessels 25 0,0% 162 0,3% 187 0,1%
Total 117 512 100% 50 619 100% 168 131 100%
P&I Non P&I Total
Source : Equasis processed by Emsa - (1) 500≤GT<25.000
Graph 95 - Number of medium ships, by P&I status – 2005
Non P&I
55%
P&I
45%
Graph 96 - Gross tonnage (in 1000 t) of medium ships, by P&I status – 2005
Non P&I
30%
P&I
70%

Equasis statistics The world merchant fleet in 2005
61
LARGE SHIPS
Table 102 - P&I status : total number of large(1) ships, by type - 2005
Ship Type
General Cargo Ships 177 3,3% 3 1,2% 180 3,2%
Specialized Cargo Ships 16 0,3% 2 0,8% 18 0,3%
Container Ships 985 18,1% 34 13,3% 1 019 17,9%
Ro-Ro Cargo Ships 451 8,3% 5 2,0% 456 8,0%
Bulk Carriers 2 155 39,6% 118 46,3% 2 273 39,9%
Oil and Chemical Tankers 1 263 23,2% 54 21,2% 1 317 23,1%
Gas Tankers 151 2,8% 1 0,4% 152 2,7%
Other Tankers 3 0,1% 3 0,1%
Passenger Ships 205 3,8% 5 2,0% 210 3,7%
Offshore Vessels 22 0,4% 19 7,5% 41 0,7%
Service Ships 17 0,3% 14 5,5% 31 0,5%
Tugs
Leisure Vessels
Total 5 445 100% 255 100% 5 700 100%
P&I Non P&I Total
Source : Equasis processed by Emsa - (1) 25.000≤GT<60.000
Table 103 - P&I status : gross tonnage (in 1000 t) of large(1) ships, by type - 2005
Ship Type
General Cargo Ships 5 173 2,5% 96 1,0% 5 270 2,5%
Specialized Cargo Ships 512 0,2% 72 0,8% 584 0,3%
Container Ships 38 276 18,7% 1 228 13,3% 39 504 18,4%
Ro-Ro Cargo Ships 19 872 9,7% 182 2,0% 20 055 9,4%
Bulk Carriers 74 995 36,6% 3 879 42,2% 78 874 36,8%
Oil and Chemical Tankers 50 837 24,8% 2 319 25,2% 53 156 24,8%
Gas Tankers 6 360 3,1% 47 0,5% 6 407 3,0%
Other Tankers 96 0,0% 96 0,0%
Passenger Ships 7 233 3,5% 176 1,9% 7 409 3,5%
Offshore Vessels 1 055 0,5% 766 8,3% 1 821 0,8%
Service Ships 706 0,3% 438 4,8% 1 144 0,5%
Tugs
Leisure Vessels
Total 205 116 100% 9 203 100% 214 319 100%
P&I Non P&I Total
Source : Equasis processed by Emsa - (1) 25.000≤GT<60.000
Graph 97 - Number of large ships, by P&I status – 2005
Non P&I
4%
P&I
96%
Graph 98 - Gross tonnage (in 1000 t) of large ships, by P&I status – 2005
Non P&I
4%
P&I
96%

Equasis statistics The world merchant fleet in 2005
62
VERY LARGE SHIPS
Table 104 - P&I status : total number of very large(1) ships, by type - 2005
Ship Type
General Cargo Ships
Specialized Cargo Ships
Container Ships 309 14,9% 14 16% 323 15,0%
Ro-Ro Cargo Ships 30 1,4% 1 1% 31 1,4%
Bulk Carriers 630 30,4% 8 9% 638 29,6%
Oil and Chemical Tankers 801 38,7% 33 38% 834 38,7%
Gas Tankers 153 7,4% 3 3% 156 7,2%
Other Tankers
Passenger Ships 82 4,0% 3 3% 85 3,9%
Offshore Vessels 59 2,8% 24 28% 83 3,8%
Service Ships 7 0,3% 7 0,3%
Tugs
Leisure Vessels
Total 2 071 100% 86 100% 2 157 100%
P&I Non P&I Total
Source : Equasis processed by Emsa - (1) GT≥60.000
Table 105 - P&I status : gross tonnage (in 1000 t) of very large(1) ships, by type - 2005
Ship Type
General Cargo Ships
Specialized Cargo Ships
Container Ships 22 643 11,2% 1 112 12% 23 755 11,2%
Ro-Ro Cargo Ships 1 922 0,9% 63 1% 1 985 0,9%
Bulk Carriers 54 710 27,0% 644 7% 55 353 26,1%
Oil and Chemical Tankers 94 820 46,7% 4 061 45% 98 880 46,7%
Gas Tankers 15 071 7,4% 293 3% 15 365 7,3%
Other Tankers
Passenger Ships 7 154 3,5% 257 3% 7 411 3,5%
Offshore Vessels 6 074 3,0% 2 595 29% 8 668 4,1%
Service Ships 496 0,2% 496 0,2%
Tugs
Leisure Vessels
Total 202 889 100% 9 023 100% 211 913 100%
P&I Non P&I Total
Source : Equasis processed by Emsa - (1) GT≥60.000
Graph 99 - Number of large ships, by P&I status – 2005
P&I
96%
Non P&I
4%
Graph 100 - Gross tonnage (in 1000 t) of large ships, by P&I status – 2005
P&I
96%
Non P&I
4%

Equasis statistics The world merchant fleet in 2005
63
4.2. P&I AND AGE
WHOLE FLEET
Table 106 - P&I world fleet, total number of ships, by type and age – 2005
Ship Type
General Cargo Ships 429 9,9% 1 363 18,6% 1 497 23,9% 899 21,9% 4 188 19,0%
Specialized Cargo Ships 6 0,1% 13 0,2% 34 0,5% 32 0,8% 85 0,4%
Container Ships 765 17,7% 1 276 17,4% 483 7,7% 189 4,6% 2 713 12,3%
Ro-Ro Cargo Ships 140 3,2% 287 3,9% 328 5,2% 209 5,1% 964 4,4%
Bulk Carriers 1 052 24,3% 1 562 21,3% 1 592 25,4% 663 16,2% 4 869 22,1%
Oil and Chemical Tankers 1 253 29,0% 1 665 22,7% 1 195 19,1% 499 12,2% 4 612 21,0%
Gas Tankers 139 3,2% 287 3,9% 183 2,9% 144 3,5% 753 3,4%
Other Tankers 11 0,3% 18 0,2% 25 0,4% 34 0,8% 88 0,4%
Passenger Ships 198 4,6% 444 6,1% 298 4,8% 487 11,9% 1 427 6,5%
Offshore Vessels 201 4,6% 188 2,6% 328 5,2% 284 6,9% 1 001 4,5%
Service Ships 48 1,1% 98 1,3% 157 2,5% 158 3,9% 461 2,1%
Tugs 81 1,9% 127 1,7% 134 2,1% 485 11,8% 827 3,8%
Leisure Vessels 3 0,1% 7 0,1% 3 0,0% 13 0,3% 26 0,1%
Total 4 326 100% 7 335 100% 6 257 100% 4 096 100% 22 014 100%
0-4 5-14 Total25+15-24
Source : Equasis processed by Emsa
Table 107 - P&I gross tonnage (in 1000 t) of ships, by type and age - 2005
Ship Type
General Cargo Ships 3 331 2,2% 9 763 4,9% 10 031 8,1% 6 501 13,5% 29 627 5,6%
Specialized Cargo Ships 101 0,1% 95 0,0% 366 0,3% 551 1,1% 1 113 0,2%
Container Ships 30 136 19,6% 32 434 16,3% 12 265 9,8% 4 128 8,6% 78 963 15,0%
Ro-Ro Cargo Ships 5 587 3,6% 8 488 4,3% 9 517 7,6% 4 011 8,3% 27 603 5,2%
Bulk Carriers 40 793 26,5% 59 038 29,6% 52 106 41,8% 11 547 24,0% 163 485 31,1%
Oil and Chemical Tankers 57 531 37,4% 71 353 35,8% 30 234 24,3% 7 609 15,8% 166 727 31,7%
Gas Tankers 7 357 4,8% 8 117 4,1% 4 078 3,3% 4 803 10,0% 24 354 4,6%
Other Tankers 104 0,1% 108 0,1% 130 0,1% 191 0,4% 533 0,1%
Passenger Ships 6 487 4,2% 7 290 3,7% 3 648 2,9% 3 207 6,7% 20 631 3,9%
Offshore Vessels 1 385 0,9% 1 796 0,9% 1 089 0,9% 4 803 10,0% 9 073 1,7%
Service Ships 891 0,6% 717 0,4% 980 0,8% 649 1,3% 3 236 0,6%
Tugs 55 0,0% 84 0,0% 83 0,1% 197 0,4% 419 0,1%
Leisure Vessels 3 0,0% 20 0,0% 2 0,0% 0 0,0% 26 0,0%
Total 153 761 100% 199 301 100% 124 528 100% 48 198 100% 525 788 100%
0-4 5-14 Total25+15-24
Source : Equasis processed by Emsa
Graph 101 - P&I whole fleet, by age – 2005
5-14 years
33% 15-24 years
28%
0-4 years
20%
25+ years
19%
Graph 102 - Gross tonnage (in 1000 t) of P&I whole fleet, by age – 2005
5-14 years
38% 15-24 years
24%
0-4 years
29%
25+ years
9%

Equasis statistics The world merchant fleet in 2005
64
SMALL SHIPS
Table 108 - P&I total number of small(1) ships, by type and age - 2005
Ship Type
General Cargo Ships 4 2,4% 20 9,2% 31 5,4% 55 5,4%
Specialized Cargo Ships 0,0%
Container Ships 0,0%
Ro-Ro Cargo Ships 1 0,2% 1 0,1%
Bulk Carriers 2 0,9% 1 0,2% 3 0,3%
Oil and Chemical Tankers 2 3,2% 3 1,8% 10 4,6% 21 3,6% 36 3,5%
Gas Tankers 1 0,5% 1 0,1%
Other Tankers 1 0,6% 1 0,5% 2 0,2%
Passenger Ships 12 19,4% 69 42,1% 53 24,3% 81 14,0% 215 21,0%
Offshore Vessels 2 1,2% 18 8,3% 22 3,8% 42 4,1%
Service Ships 1 1,6% 6 3,7% 19 8,7% 22 3,8% 48 4,7%
Tugs 47 75,8% 79 48,2% 93 42,7% 387 66,8% 606 59,2%
Leisure Vessels 1 0,5% 13 2,2% 14 1,4%
Total 62 100% 164 100% 218 100% 579 100% 1 023 100%
0-4 5-14 15-24 25+ Total
Source : Equasis processed by Emsa - (1) GT<500
Table 109 - P&I gross tonnage (in 1000 t) of small(1) ships, by type and age - 2005
Ship Type
General Cargo Ships 2 3,1% 8 12,8% 11 8,1% 21 7,7%
Specialized Cargo Ships
Container Ships
Ro-Ro Cargo Ships 0 0,3% 0 0,1%
Bulk Carriers 1 1,5% 0 0,1% 1 0,4%
Oil and Chemical Tankers 1 4,8% 1 3,0% 4 6,8% 8 5,8% 15 5,4%
Gas Tankers 0 0,8% 0 0,2%
Other Tankers 0 0,8% 0 0,5% 1 0,3%
Passenger Ships 5 22,6% 18 35,5% 15 23,4% 21 15,3% 58 21,6%
Offshore Vessels 1 1,8% 5 8,1% 7 5,2% 13 4,9%
Service Ships 0 1,6% 2 4,0% 6 9,5% 4 3,1% 13 4,7%
Tugs 15 71,0% 26 51,8% 23 36,2% 84 62,2% 148 54,7%
Leisure Vessels 0 0,5% 0 0,0% 0 0,1%
Total 21 100% 50 100% 65 100% 135 100% 271 100%
0-4 5-14 15-24 25+ Total
Source : Equasis processed by Emsa - (1) GT<500
Graph 103 - P&I small ships, by age – 2005
25+ years
57%
0-4 years
6%
15-24 years
21%
5-14 years
16%
Graph 104 - Gross tonnage (in 1000 t) of P&I small ships, by age – 2005
5-14 years
19%
15-24 years
24%
0-4 years
8%
25+ years
49%

Equasis statistics The world merchant fleet in 2005
65
MEDIUM SHIPS
Table 110 - P&I total number of medium(1) ships, by type and age - 2005
Ship Type
General Cargo Ships 411 22,6% 1 288 29,7% 1 422 33,3% 835 27,5% 3 956 29,4%
Specialized Cargo Ships 5 0,3% 13 0,3% 31 0,7% 20 0,7% 69 0,5%
Container Ships 243 13,3% 796 18,3% 262 6,1% 118 3,9% 1 419 10,5%
Ro-Ro Cargo Ships 43 2,4% 155 3,6% 137 3,2% 147 4,8% 482 3,6%
Bulk Carriers 235 12,9% 448 10,3% 833 19,5% 565 18,6% 2 081 15,4%
Oil and Chemical Tankers 471 25,9% 847 19,5% 778 18,2% 416 13,7% 2 512 18,6%
Gas Tankers 51 2,8% 196 4,5% 135 3,2% 66 2,2% 448 3,3%
Other Tankers 9 0,5% 17 0,4% 24 0,6% 33 1,1% 83 0,6%
Passenger Ships 83 4,6% 272 6,3% 181 4,2% 389 12,8% 925 6,9%
Offshore Vessels 193 10,6% 166 3,8% 301 7,0% 218 7,2% 878 6,5%
Service Ships 40 2,2% 90 2,1% 128 3,0% 131 4,3% 389 2,9%
Tugs 34 1,9% 48 1,1% 41 1,0% 98 3,2% 221 1,6%
Leisure Vessels 3 0,2% 7 0,2% 2 0,0% 12 0,1%
Total 1 821 100% 4 343 100% 4 275 100% 3 036 100% 13 475 100%
25+ Total0-4 5-14 15-24
Source : Equasis processed by Emsa - (1) 500≤GT<25.000
Table 111 - P&I gross tonnage (in 1000 t) of medium(1) ships, by type and age - 2005
Ship Type
General Cargo Ships 2 748 16,3% 7 614 20,4% 8 495 21,5% 5 575 23,4% 24 432 20,8%
Specialized Cargo Ships 71 0,4% 95 0,3% 264 0,7% 171 0,7% 600 0,5%
Container Ships 2 987 17,7% 9 988 26,8% 3 425 8,7% 1 643 6,9% 18 043 15,4%
Ro-Ro Cargo Ships 676 4,0% 1 920 5,1% 1 460 3,7% 1 752 7,3% 5 808 4,9%
Bulk Carriers 3 925 23,3% 6 975 18,7% 15 049 38,2% 7 831 32,8% 33 780 28,7%
Oil and Chemical Tankers 4 540 26,9% 6 483 17,4% 7 237 18,4% 2 796 11,7% 21 056 17,9%
Gas Tankers 392 2,3% 1 266 3,4% 937 2,4% 327 1,4% 2 922 2,5%
Other Tankers 38 0,2% 107 0,3% 130 0,3% 161 0,7% 436 0,4%
Passenger Ships 513 3,0% 1 739 4,7% 1 229 3,1% 2 704 11,3% 6 185 5,3%
Offshore Vessels 554 3,3% 437 1,2% 586 1,5% 354 1,5% 1 931 1,6%
Service Ships 395 2,3% 628 1,7% 553 1,4% 446 1,9% 2 021 1,7%
Tugs 40 0,2% 57 0,2% 60 0,2% 113 0,5% 271 0,2%
Leisure Vessels 3 0,0% 20 0,1% 2 0,0% 26 0,0%
Total 16 883 100% 37 329 100% 39 427 100% 23 873 100% 117 512 100%
0-4 5-14 15-24 25+ Total
Source : Equasis processed by Emsa - (1) 500≤GT<25.000
Graph 105 - P&I medium ships, by age – 2005
5-14 years
31%15-24 years
32%
0-4 years
14%25+ years
23%
Graph 106 - Gross tonnage (in 1000 t) of P&I medium ships, by age – 2005
5-14 years
32%15-24 years
34%
0-4 years
14%
25+ years
20%

Equasis statistics The world merchant fleet in 2005
66
LARGE SHIPS
Table 112 - P&I total number of large(1) ships, by type and age - 2005
Ship Type
General Cargo Ships 18 1,1% 71 3,6% 55 3,8% 33 8,7% 177 3,3%
Specialized Cargo Ships 1 0,1% 3 0,2% 12 3,2% 16 0,3%
Container Ships 322 19,3% 376 19,2% 216 15,0% 71 18,8% 985 18,1%
Ro-Ro Cargo Ships 78 4,7% 124 6,3% 188 13,0% 61 16,1% 451 8,3%
Bulk Carriers 668 40,1% 835 42,6% 563 39,0% 89 23,5% 2 155 39,6%
Oil and Chemical Tankers 477 28,6% 439 22,4% 315 21,8% 32 8,5% 1 263 23,2%
Gas Tankers 32 1,9% 42 2,1% 26 1,8% 51 13,5% 151 2,8%
Other Tankers 2 0,1% 1 0,3% 3 0,1%
Passenger Ships 66 4,0% 62 3,2% 60 4,2% 17 4,5% 205 3,8%
Offshore Vessels 1 0,1% 8 0,4% 7 0,5% 6 1,6% 22 0,4%
Service Ships 2 0,1% 10 0,7% 5 1,3% 17 0,3%
Tugs
Leisure Vessels
Total 1 665 100% 1 959 100% 1 443 100% 378 100% 5 445 100%
0-4 5-14 15-24 25+ Total
Source : Equasis processed by Emsa - (1) 25.000≤GT<60.000
Table 113 - P&I gross tonnage (in 1000 t) of large(1) ships, by type and age - 2005
Ship Type
General Cargo Ships 584 0,9% 2 148 2,9% 1 527 2,8% 915 6,8% 5 173 2,5%
Specialized Cargo Ships 30 0,0% 102 0,2% 381 2,8% 512 0,2%
Container Ships 12 199 19,6% 15 062 20,1% 8 530 15,7% 2 486 18,4% 38 276 18,7%
Ro-Ro Cargo Ships 3 731 6,0% 6 025 8,0% 7 857 14,5% 2 259 16,7% 19 872 9,7%
Bulk Carriers 23 444 37,6% 28 687 38,3% 19 763 36,4% 3 100 22,9% 74 995 36,6%
Oil and Chemical Tankers 18 521 29,7% 18 476 24,6% 12 483 23,0% 1 356 10,0% 50 837 24,8%
Gas Tankers 1 353 2,2% 1 800 2,4% 1 135 2,1% 2 071 15,3% 6 360 3,1%
Other Tankers 66 0,1% 30 0,2% 96 0,0%
Passenger Ships 2 374 3,8% 2 251 3,0% 2 126 3,9% 482 3,6% 7 233 3,5%
Offshore Vessels 34 0,1% 427 0,6% 346 0,6% 248 1,8% 1 055 0,5%
Service Ships 87 0,1% 421 0,8% 199 1,5% 706 0,3%
Tugs
Leisure Vessels
Total 62 337 100% 74 962 100% 54 291 100% 13 526 100% 205 116 100%
0-4 5-14 15-24 25+ Total
Source : Equasis processed by Emsa - (1) 25.000≤GT<60.000
Graph 107 - P&I large ships, by age – 2005
5-14 years
35%
15-24 years
27%
0-4 years
31%
25+ years
7%
Graph 108 - Gross tonnage (in 1000 t) of P&I large ships, by age – 2005
5-14 years
37%
15-24 years
26%
0-4 years
30%
25+ years
7%

Equasis statistics The world merchant fleet in 2005
67
VERY LARGE SHIPS
Table 114 - P&I total number of very large(1) ships, by type and age - 2005
Ship Type
General Cargo Ships
Specialized Cargo Ships
Container Ships 200 25,7% 104 12,0% 5 1,6% 309 14,9%
Ro-Ro Cargo Ships 19 2,4% 8 0,9% 3 0,9% 30 1,4%
Bulk Carriers 149 19,2% 279 32,1% 194 60,4% 8 7,8% 630 30,4%
Oil and Chemical Tankers 303 38,9% 376 43,3% 92 28,7% 30 29,1% 801 38,7%
Gas Tankers 56 7,2% 49 5,6% 21 6,5% 27 26,2% 153 7,4%
Other Tankers
Passenger Ships 37 4,8% 41 4,7% 4 1,2% 82 4,0%
Offshore Vessels 7 0,9% 12 1,4% 2 0,6% 38 36,9% 59 2,8%
Service Ships 7 0,9% 7 0,3%
Tugs
Leisure Vessels
Total 778 100% 869 100% 321 100% 103 100% 2 071 100%
0-4 5-14 15-24 25+ Total
Source : Equasis processed by Emsa - (1) GT≥60.000
Table 115 - P&I gross tonnage (in 1000 t) of very large(1) ships, by type and age - 2005
Ship Type
General Cargo Ships
Specialized Cargo Ships
Container Ships 14 950 20,1% 7 384 8,5% 310 1,0% 22 643 11,2%
Ro-Ro Cargo Ships 1 179 1,6% 543 0,6% 200 0,6% 1 922 0,9%
Bulk Carriers 13 423 18,0% 23 377 26,9% 17 293 56,2% 616 5,8% 54 710 27,0%
Oil and Chemical Tankers 34 469 46,3% 46 392 53,3% 10 510 34,2% 3 449 32,3% 94 820 46,7%
Gas Tankers 5 611 7,5% 5 051 5,8% 2 005 6,5% 2 404 22,5% 15 071 7,4%
Other Tankers
Passenger Ships 3 595 4,8% 3 282 3,8% 277 0,9% 7 154 3,5%
Offshore Vessels 797 1,1% 931 1,1% 151 0,5% 4 193 39,3% 6 073 3,0%
Service Ships 496 0,7% 496 0,2%
Tugs
Leisure Vessels
Total 74 520 100% 86 961 100% 30 746 100% 10 662 100% 202 889 100%
0-4 5-14 15-24 25+ Total
Source : Equasis processed by Emsa - (1) GT≥60.000
Graph 109 - P&I very large ships, by age – 2005
5-14 years
42%
15-24 years
15%
0-4 years
38%
25+ years
5%
Graph 110 - Gross tonnage (in 1000 t) of P&I very large ships, by age – 2005
25+ years
5%
0-4 years
37%
15-24 years
15%
5-14 years
43%

Equasis statistics The world merchant fleet in 2005
68
4.3. NON P&I AND AGE
WHOLE FLEET
Table 116 - Non P&I world fleet, total number of ships, by type and age – 2005
Ship Type
General Cargo Ships 710 9,6% 1 617 17,8% 4 281 21,5% 6 608 16,9%
Specialized Cargo Ships 1 071 14,5% 1 157 12,7% 2 549 12,8% 4 777 12,2%
Container Ships 243 8,6% 70 1,0% 55 0,6% 131 0,7% 499 1,3%
Ro-Ro Cargo Ships 162 5,7% 73 1,0% 91 1,0% 232 1,2% 558 1,4%
Bulk Carriers 23 0,8% 244 3,3% 421 4,6% 671 3,4% 1 359 3,5%
Oil and Chemical Tankers 39 1,4% 859 11,7% 1 060 11,6% 2 353 11,8% 4 311 11,0%
Gas Tankers 189 6,7% 77 1,0% 82 0,9% 156 0,8% 504 1,3%
Other Tankers 15 0,5% 56 0,8% 59 0,6% 161 0,8% 291 0,7%
Passenger Ships 378 13,3% 1 046 14,2% 1 117 12,3% 1 858 9,3% 4 399 11,2%
Offshore Vessels 339 11,9% 290 3,9% 762 8,4% 1 342 6,7% 2 733 7,0%
Service Ships 232 8,2% 487 6,6% 969 10,6% 1 591 8,0% 3 279 8,4%
Tugs 1 038 36,6% 2 238 30,4% 1 616 17,8% 4 357 21,9% 9 249 23,6%
Leisure Vessels 179 6,3% 147 2,0% 98 1,1% 222 1,1% 646 1,6%
Total 2 837 100% 7 368 100% 9 104 100% 19 904 100% 39 213 100%
15-240-4 5-14 Total25+
Source : Equasis processed by Emsa
Table 117 - Non P&I gross tonnage (in 1000 t) of ships, by type and age - 2005
Ship Type
General Cargo Ships 2 100 16,6% 5 126 28,1% 11 807 34,7% 19 032 25,4%
Specialized Cargo Ships 380 3,0% 385 2,1% 914 2,7% 1 679 2,2%
Container Ships 1 563 15,7% 771 6,1% 449 2,5% 843 2,5% 3 626 4,8%
Ro-Ro Cargo Ships 378 3,8% 344 2,7% 469 2,6% 1 087 3,2% 2 277 3,0%
Bulk Carriers 350 3,5% 715 5,6% 2 921 16,0% 6 256 18,4% 10 242 13,7%
Oil and Chemical Tankers 2 266 22,8% 1 591 12,5% 2 165 11,9% 4 965 14,6% 10 986 14,7%
Gas Tankers 642 6,5% 429 3,4% 182 1,0% 229 0,7% 1 482 2,0%
Other Tankers 47 0,5% 443 3,5% 203 1,1% 176 0,5% 868 1,2%
Passenger Ships 1 031 10,4% 1 550 12,2% 2 792 15,3% 2 209 6,5% 7 581 10,1%
Offshore Vessels 1 930 19,4% 1 878 14,8% 1 405 7,7% 2 309 6,8% 7 523 10,1%
Service Ships 1 112 11,2% 1 238 9,8% 1 381 7,6% 2 123 6,2% 5 853 7,8%
Tugs 362 3,6% 975 7,7% 571 3,1% 1 040 3,1% 2 949 3,9%
Leisure Vessels 252 2,5% 269 2,1% 165 0,9% 41 0,1% 727 1,0%
Total 9 932 100% 12 682 100% 18 214 100% 33 997 100% 74 826 100%
15-240-4 5-14 Total25+
Source : Equasis processed by Emsa
Graph 111 - Non P&I whole fleet, by age – 2005
5-14 years
19%
15-24 years
23%
0-4 years
7%
25+ years
51%
Graph 112 - Gross tonnage (in 1000 t) of non P&I whole fleet, by age – 2005
5-14 years
17%
15-24 years
24%
0-4 years
13%
25+ years
46%

Equasis statistics The world merchant fleet in 2005
69
SMALL SHIPS
Table 118 - Non P&I total number of small(1) ships, by type and age - 2005
Ship Type
General Cargo Ships
Specialized Cargo Ships 1 066 20,8% 1 142 22,5% 2 494 23,3% 4 702 20,8%
Container Ships 1 0,0% 4 0,1% 25 0,2% 30 0,1%
Ro-Ro Cargo Ships 134 7,8% 8 0,2% 5 0,1% 18 0,2% 165 0,7%
Bulk Carriers 1 0,1% 120 2,3% 169 3,3% 141 1,3% 431 1,9%
Oil and Chemical Tankers 1 0,1% 529 10,3% 508 10,0% 880 8,2% 1 918 8,5%
Gas Tankers 60 3,5% 5 0,1% 14 0,3% 27 0,3% 106 0,5%
Other Tankers 2 0,1% 22 0,4% 34 0,7% 93 0,9% 151 0,7%
Passenger Ships 224 13,1% 731 14,3% 730 14,4% 1 190 11,1% 2 875 12,7%
Offshore Vessels 77 4,5% 88 1,7% 333 6,6% 718 6,7% 1 216 5,4%
Service Ships 104 6,1% 263 5,1% 569 11,2% 800 7,5% 1 736 7,7%
Tugs 997 58,1% 2 178 42,5% 1 496 29,5% 4 140 38,6% 8 811 38,9%
Leisure Vessels 116 6,8% 108 2,1% 73 1,4% 199 1,9% 496 2,2%
Total 1 716 100% 5 119 100% 5 077 100% 10 725 100% 22 637 100%
0-4 5-14 15-24 25+ Total
Source : Equasis processed by Emsa - (1) GT<500
Table 119 - Non P&I gross tonnage (in 1000 t) of small(1) ships, by type and age - 2005
Ship Type
General Cargo Ships
Specialized Cargo Ships 367 26,2% 334 24,2% 775 28,6% 1 477 24,7%
Container Ships 1 0,1% 10 0,4% 11 0,2%
Ro-Ro Cargo Ships 54 11,1% 4 0,3% 2 0,1% 7 0,2% 66 1,1%
Bulk Carriers 50 3,5% 69 5,0% 45 1,7% 163 2,7%
Oil and Chemical Tankers 171 12,2% 152 11,0% 290 10,7% 613 10,2%
Gas Tankers 23 4,7% 2 0,1% 6 0,4% 9 0,3% 40 0,7%
Other Tankers 1 0,2% 6 0,4% 9 0,7% 25 0,9% 41 0,7%
Passenger Ships 61 12,5% 184 13,1% 179 12,9% 290 10,7% 713 11,9%
Offshore Vessels 31 6,4% 26 1,9% 98 7,1% 188 6,9% 343 5,7%
Service Ships 25 5,1% 69 5,0% 168 12,2% 188 6,9% 450 7,5%
Tugs 256 52,5% 496 35,4% 345 24,9% 864 31,9% 1 961 32,8%
Leisure Vessels 37 7,5% 27 2,0% 19 1,4% 18 0,7% 101 1,7%
Total 489 100% 1 401 100% 1 382 100% 2 707 100% 5 979 100%
25+ Total0-4 5-14 15-24
Source : Equasis processed by Emsa - (1) GT<500
Graph 113 - Non P&I small ships, by age – 2005
25+ years
47%
0-4 years
8%
15-24 years
22%
5-14 years
23%
Graph 114 - Gross tonnage (in 1000 t) of non P&I small ships, by age – 2005
5-14 years
23%
15-24 years
23%
0-4 years
8%
25+ years
46%

Equasis statistics The world merchant fleet in 2005
70
MEDIUM SHIPS
Table 120 - Non P&I total number of medium(1) ships, by type and age - 2005
Ship Type
General Cargo Ships 710 32,8% 1 617 41,1% 4 281 47,0% 6 608 40,7%
Specialized Cargo Ships 5 0,2% 15 0,4% 55 0,6% 75 0,5%
Container Ships 234 22,6% 64 3,0% 51 1,3% 93 1,0% 442 2,7%
Ro-Ro Cargo Ships 27 2,6% 65 3,0% 86 2,2% 211 2,3% 389 2,4%
Bulk Carriers 20 1,9% 124 5,7% 247 6,3% 502 5,5% 893 5,5%
Oil and Chemical Tankers 22 2,1% 324 15,0% 546 13,9% 1 456 16,0% 2 348 14,5%
Gas Tankers 128 12,4% 69 3,2% 66 1,7% 128 1,4% 391 2,4%
Other Tankers 12 1,2% 24 1,1% 21 0,5% 68 0,7% 125 0,8%
Passenger Ships 145 14,0% 312 14,4% 338 8,6% 666 7,3% 1 461 9,0%
Offshore Vessels 237 22,9% 171 7,9% 413 10,5% 611 6,7% 1 432 8,8%
Service Ships 112 10,8% 213 9,8% 399 10,1% 788 8,7% 1 512 9,3%
Tugs 39 3,8% 50 2,3% 117 3,0% 217 2,4% 423 2,6%
Leisure Vessels 60 5,8% 32 1,5% 21 0,5% 23 0,3% 136 0,8%
Total 1 036 100% 2 163 100% 3 937 100% 9 099 100% 16 235 100%
0-4 5-14 15-24 25+ Total
Source : Equasis processed by Emsa - (1) 500≤GT<25.000
Table 121 - Non P&I gross tonnage (in 1000 t) of medium(1) ships, by type and age - 2005
Ship Type
General Cargo Ships 2 100 30,9% 5 126 38,9% 11 807 43,5% 19 032 37,6%
Specialized Cargo Ships 13 0,2% 51 0,4% 139 0,5% 203 0,4%
Container Ships 795 22,5% 426 6,3% 448 3,4% 405 1,5% 2 074 4,1%
Ro-Ro Cargo Ships 261 7,4% 340 5,0% 467 3,5% 981 3,6% 2 049 4,0%
Bulk Carriers 156 4,4% 665 9,8% 2 463 18,7% 5 278 19,5% 8 561 16,9%
Oil and Chemical Tankers 178 5,0% 719 10,6% 1 474 11,2% 3 457 12,7% 5 829 11,5%
Gas Tankers 523 14,8% 193 2,9% 105 0,8% 173 0,6% 994 2,0%
Other Tankers 16 0,5% 30 0,4% 31 0,2% 151 0,6% 228 0,5%
Passenger Ships 560 15,8% 1 206 17,8% 1 081 8,2% 1 842 6,8% 4 689 9,3%
Offshore Vessels 498 14,1% 357 5,3% 611 4,6% 854 3,2% 2 320 4,6%
Service Ships 429 12,1% 657 9,7% 1 186 9,0% 1 834 6,8% 4 106 8,1%
Tugs 35 1,0% 49 0,7% 113 0,9% 176 0,6% 373 0,7%
Leisure Vessels 87 2,5% 31 0,5% 20 0,2% 23 0,1% 162 0,3%
Total 3 538 100% 6 786 100% 13 175 100% 27 119 100% 50 619 100%
25+ Total0-4 5-14 15-24
Source : Equasis processed by Emsa - (1) 500≤GT<25.000
Graph 115 - Non P&I medium ships, by age – 2005
5-14 years
13%
15-24 years
24%
0-4 years
6%
25+ years
57%
Graph 116 - Gross tonnage (in 1000 t) of non P&I medium ships, by age – 2005
5-14 years
13%
15-24 years
26%
0-4 years
7%
25+ years
54%

Equasis statistics The world merchant fleet in 2005
71
LARGE SHIPS
Table 122 - Non P&I total number of large(1) ships, by type and age - 2005
Ship Type
General Cargo Ships
Specialized Cargo Ships
Container Ships 13 20,6% 13 5,1%
Ro-Ro Cargo Ships 3 4,8% 3 1,2%
Bulk Carriers 27 42,9% 27 10,6%
Oil and Chemical Tankers 1 1,3% 11 17,5% 12 4,7%
Gas Tankers 1 1,6% 2 2,5% 1 1,6% 4 1,6%
Other Tankers 1 2,1% 10 15,6% 4 5,0% 15 5,9%
Passenger Ships 7 14,6% 2 3,1% 49 61,3% 2 3,2% 60 23,5%
Offshore Vessels 19 39,6% 23 35,9% 16 20,0% 3 4,8% 61 23,9%
Service Ships 16 33,3% 11 17,2% 1 1,3% 3 4,8% 31 12,2%
Tugs 2 4,2% 10 15,6% 3 3,8% 15 5,9%
Leisure Vessels 3 6,3% 7 10,9% 4 5,0% 14 5,5%
Total 48 100% 64 100% 80 100% 63 100% 255 100%
0-4 5-14 15-24 25+ Total
Source : Equasis processed by Emsa - (1) 25.000≤GT<60.000
Table 123 - Non P&I gross tonnage (in 1000 t) of large(1) ships, by type and age - 2005
Ship Type
General Cargo Ships
Specialized Cargo Ships
Container Ships 429 19,7% 429 4,7%
Ro-Ro Cargo Ships 99 4,6% 99 1,1%
Bulk Carriers 873 40,2% 873 9,5%
Oil and Chemical Tankers 30 1,1% 453 20,8% 483 5,2%
Gas Tankers 36 1,5% 72 2,6% 47 2,2% 155 1,7%
Other Tankers 30 1,7% 407 16,4% 163 5,9% 599 6,5%
Passenger Ships 230 12,9% 83 3,4% 1 532 55,5% 78 3,6% 1 923 20,9%
Offshore Vessels 671 37,5% 803 32,4% 697 25,2% 94 4,3% 2 265 24,6%
Service Ships 658 36,8% 512 20,6% 27 1,0% 101 4,6% 1 297 14,1%
Tugs 71 4,0% 431 17,3% 114 4,1% 615 6,7%
Leisure Vessels 128 7,2% 211 8,5% 126 4,6% 465 5,0%
Total 1 786 100% 2 483 100% 2 760 100% 2 174 100% 9 203 100%
25+ Total0-4 5-14 15-24
Source : Equasis processed by Emsa - (1) 25.000≤GT<60.000
Graph 117 - Non P&I large ships, by age – 2005
5-14 years
25%
15-24 years
31%
0-4 years
19%
25+ years
25%
Graph 118 - Gross tonnage (in 1000 t) of non P&I large ships, by age – 2005
5-14 years
27%
15-24 years
30%
0-4 years
19%
25+ years
24%

Equasis statistics The world merchant fleet in 2005
72
VERY LARGE SHIPS
Table 124 - Non P&I total number of very large(1) ships, by type and age - 2005
Ship Type
General Cargo Ships
Specialized Cargo Ships
Container Ships 9 24,3% 5 22,7% 14 16,3%
Ro-Ro Cargo Ships 1 2,7% 1 1,2%
Bulk Carriers 2 5,4% 5 50,0% 1 5,9% 8 9,3%
Oil and Chemical Tankers 16 43,2% 6 27,3% 5 50,0% 6 35,3% 33 38,4%
Gas Tankers 1 2,7% 2 9,1% 3 3,5%
Other Tankers
Passenger Ships 2 5,4% 1 4,5% 3 3,5%
Offshore Vessels 6 16,2% 8 36,4% 10 58,8% 24 27,9%
Service Ships
Tugs
Leisure Vessels
Total 37 100% 22 100% 10 100% 17 100% 86 100%
25+ Total0-4 5-14 15-24
Source : Equasis processed by Emsa - (1) GT≥60.000
Table 125 - Non P&I gross tonnage (in 1000 t) of very large(1) ships, by type and age - 2005
Ship Type
General Cargo Ships
Specialized Cargo Ships
Container Ships 768 18,6% 344 17,1% 1 112 12,3%
Ro-Ro Cargo Ships 63 1,5% 63 0,7%
Bulk Carriers 194 4,7% 389 43,4% 60 3,0% 644 7,1%
Oil and Chemical Tankers 2 087 50,7% 701 34,9% 508 56,6% 765 38,3% 4 061 45,0%
Gas Tankers 96 2,3% 198 9,8% 293 3,2%
Other Tankers
Passenger Ships 180 4,4% 77 3,8% 257 2,8%
Offshore Vessels 730 17,7% 692 34,4% 1 173 58,7% 2 595 28,8%
Service Ships
Tugs
Leisure Vessels
Total 4 118 100% 2 011 100% 897 100% 1 998 100% 9 023 100%
25+ Total0-4 5-14 15-24
Source : Equasis processed by Emsa - (1) GT≥60.000
Graph 119 - Non P&I very large ships, by age – 2005
5-14 years
26%15-24 years
12%
0-4 years
42%
25+ years
20%
Graph 120 - Gross tonnage (in 1000 t) of non P&I very large ships, by age – 2005
25+ years
22%
0-4 years
46%
15-24 years
10%5-14 years
22%

Equasis statistics The world merchant fleet in 2005
73
4.4. P&I STATUS AND FLAG
WHOLE FLEET
Table 126 - P&I status : world fleet, total number of ships, by type and flag– 2005
Total Total
General Cargo Ships 1 305 22,8% 4 979 44,0% 6 284 2 883 17,7% 6 702 24,0% 9 585
Specialized Cargo Ships 18 0,3% 60 0,5% 78 67 0,4% 47 0,2% 114
Container Ships 674 11,8% 94 0,8% 768 2 039 12,5% 189 0,7% 2 228
Ro-Ro Cargo Ships 335 5,9% 163 1,4% 498 629 3,9% 257 0,9% 886
Bulk Carriers 1 746 30,5% 392 3,5% 2 138 3 123 19,2% 1 060 3,8% 4 183
Oil and Chemical Tankers 1 001 17,5% 1 263 11,2% 2 264 3 611 22,2% 3 255 11,7% 6 866
Gas Tankers 211 3,7% 72 0,6% 283 542 3,3% 255 0,9% 797
Other Tankers 17 0,3% 83 0,7% 100 71 0,4% 179 0,6% 250
Passenger Ships 91 1,6% 817 7,2% 908 1 336 8,2% 3 527 12,6% 4 863
Offshore Vessels 193 3,4% 645 5,7% 838 808 5,0% 2 046 7,3% 2 854
Service Ships 52 0,9% 571 5,0% 623 409 2,5% 2 691 9,6% 3 100
Tugs 76 1,3% 2 138 18,9% 2 214 751 4,6% 7 096 25,4% 7 847
Leisure Vessels 45 0,4% 45 26 0,2% 587 2,1% 613
Total 5 719 100% 11 322 100% 17 041 16 295 100% 27 891 100% 44 186
Ship TypeBlack flag Non black flag
Non P&IP&I P&INon P&I
Source : Equasis processed by Emsa
Table 127 - P&I status : gross tonnage (in 1000 t) of ships, by type and flag - 2005
Total Total
General Cargo Ships 8 163 5,7% 9 818 39,4% 17 982 21 463 5,6% 11 636 23,3% 33 100
Specialized Cargo Ships 316 0,2% 122 0,5% 438 797 0,2% 164 0,3% 960
Container Ships 20 683 14,5% 919 3,7% 21 602 58 280 15,2% 2 961 5,9% 61 241
Ro-Ro Cargo Ships 10 877 7,6% 851 3,4% 11 728 16 726 4,4% 1 350 2,7% 18 076
Bulk Carriers 61 507 43,2% 4 628 18,6% 66 134 101 978 26,6% 8 643 17,3% 110 621
Oil and Chemical Tankers 31 279 22,0% 3 890 15,6% 35 169 135 448 35,3% 9 299 18,6% 144 747
Gas Tankers 4 969 3,5% 318 1,3% 5 286 19 385 5,1% 528 1,1% 19 913
Other Tankers 51 0,0% 118 0,5% 169 482 0,1% 134 0,3% 616
Passenger Ships 2 364 1,7% 1 339 5,4% 3 702 18 268 4,8% 4 495 9,0% 22 763
Offshore Vessels 1 960 1,4% 1 536 6,2% 3 495 7 113 1,9% 4 488 9,0% 11 601
Service Ships 154 0,1% 836 3,4% 990 3 082 0,8% 4 158 8,3% 7 240
Tugs 59 0,0% 539 2,2% 598 360 0,1% 1 795 3,6% 2 155
Leisure Vessels 22 0,1% 22 26 0,0% 241 0,5% 266
Total 142 381 100% 24 934 100% 167 315 383 407 100% 49 892 100% 433 299
Ship TypeBlack flag Non black flag
P&I Non P&I P&I Non P&I
Source : Equasis processed by Emsa Graph 121 - Total number of ships, by P&I status and flag – 2005
Non Black
flag
Non P&I
46%
Black flag
P&I
9%
Non Black
flag
P&I
27%
Black flag
Non P&I
18%
Graph 122 - Gross tonnage (in 1000 t) of ships, by P&I status and flag – 2005
Black flag
Non P&I
4%
Non Black
flag
P&I
64%
Black flag
P&I
24%
Non Black
flag
Non P&I
8%

Equasis statistics The world merchant fleet in 2005
74
SMALL SHIPS
Table 128 - P&I status : total number of small(1) ships, by type and flag- 2005
Total Total
General Cargo Ships 14 18,7% 1 563 30,3% 1 577 41 4,3% 3 273 18,7% 3 314
Specialized Cargo Ships 16 0,3% 16 14 0,1% 14
Container Ships 0
Ro-Ro Cargo Ships 10 0,2% 10 1 0,1% 22 0,1% 23
Bulk Carriers 1 1,3% 51 1,0% 52 2 0,2% 380 2,2% 382
Oil and Chemical Tankers 10 13,3% 365 7,1% 375 26 2,7% 1 612 9,2% 1 638
Gas Tankers 5 0,1% 5 1 0,1% 43 0,2% 44
Other Tankers 41 0,8% 41 2 0,2% 108 0,6% 110
Passenger Ships 2 2,7% 466 9,0% 468 213 22,5% 2 409 13,8% 2 622
Offshore Vessels 7 9,3% 291 5,6% 298 35 3,7% 925 5,3% 960
Service Ships 5 6,7% 273 5,3% 278 43 4,5% 1 463 8,4% 1 506
Tugs 36 48,0% 2 044 39,6% 2 080 570 60,1% 6 767 38,7% 7 337
Leisure Vessels 32 0,6% 32 14 1,5% 464 2,7% 478
Total 75 100% 5 157 100% 5 232 948 100% 17 480 100% 18 428
Ship TypeBlack flag Non black flag
P&I Non P&IP&I Non P&I
Source : Equasis processed by Emsa - (1) GT<500
Table 129 - P&I status : gross tonnage (in 1000 t) of small(1) ships, by type and flag- 2005
Total Total
General Cargo Ships 6 23,3% 497 35,1% 503 15 6,0% 1 034 22,7% 1 049
Specialized Cargo Ships 7 0,5% 7 5 0,1% 5
Container Ships
Ro-Ro Cargo Ships 4 0,3% 4 0 0,2% 8 0,2% 9
Bulk Carriers 0,5 1,7% 20 1,4% 20 1 0,2% 144 3,2% 145
Oil and Chemical Tankers 5 18,2% 126 8,9% 131 10 4,1% 510 11,2% 520
Gas Tankers 2 0,2% 2 15 0,3% 15
Other Tankers 11 0,8% 11 1 0,3% 29 0,6% 29
Passenger Ships 0,4 1,5% 122 8,6% 123 58 23,8% 591 12,9% 649
Offshore Vessels 2 9,3% 86 6,1% 88 11 4,4% 257 5,6% 268
Service Ships 2 6,6% 72 5,1% 73 11 4,5% 379 8,3% 390
Tugs 10 39,5% 458 32,4% 468 138 56,4% 1 503 32,9% 1 641
Leisure Vessels 9 0,7% 9 0,3 0,1% 92 2,0% 92
Total 26 100% 1 414 100% 1 440 244 100% 4 566 100% 4 810
Ship TypeBlack flag Non black flag
P&I Non P&I P&I Non P&I
Source : Equasis processed by Emsa - (1) GT<500
Graph 123 - Total number of small ships, by P&I status and flag– 2005
Non Black
flag Non P&I
63%
Black flag
P&I
0%
Non Black
flag P&I
19%
Black flag
Non P&I
18%
Graph 124 - Gross tonnage (in 1000 t) of small ships, by P&I status and flag – 2005
Black flag
Non P&I
23%
Non Black
flag P&I
4%
Black flag
P&I
0%
Non Black
flag
Non P&I
73%

Equasis statistics The world merchant fleet in 2005
75
MEDIUM SHIPS
Table 130 - P&I status : total number of medium(1) ships, by type and flag- 2005
Total Total
General Cargo Ships 1 280 35,2% 3 416 56,2% 4 696 2 676 27,2% 3 426 33,7% 6 102
Specialized Cargo Ships 10 0,3% 44 0,7% 54 59 0,6% 31 0,3% 90
Container Ships 357 9,8% 87 1,4% 444 1 062 10,8% 148 1,5% 1 210
Ro-Ro Cargo Ships 124 3,4% 150 2,5% 274 358 3,6% 232 2,3% 590
Bulk Carriers 725 19,9% 302 5,0% 1 027 1 356 13,8% 593 5,8% 1 949
Oil and Chemical Tankers 663 18,2% 877 14,4% 1 540 1 849 18,8% 1 577 15,5% 3 426
Gas Tankers 144 4,0% 65 1,1% 209 304 3,1% 210 2,1% 514
Other Tankers 17 0,5% 42 0,7% 59 66 0,7% 71 0,7% 137
Passenger Ships 62 1,7% 351 5,8% 413 863 8,8% 1 110 10,9% 1 973
Offshore Vessels 168 4,6% 344 5,7% 512 710 7,2% 1 088 10,7% 1 798
Service Ships 47 1,3% 296 4,9% 343 342 3,5% 1 216 12,0% 1 558
Tugs 40 1,1% 94 1,5% 134 181 1,8% 329 3,2% 510
Leisure Vessels 13 0,2% 13 12 0,1% 123 1,2% 135
Total 3 637 100% 6 081 100% 9 718 9 838 100% 10 154 100% 19 992
Ship TypeBlack flag Non black flag
P&I Non P&IP&I Non P&I
Source : Equasis processed by Emsa - (1) 500≤GT<25.000
Table 131 - P&I status : gross tonnage (in 1000 t) of medium(1) ships, by type and flag- 2005
Total Total
General Cargo Ships 7 869 24,4% 9 321 50,3% 17 190 16 564 19,4% 10 506 32,7% 27 070
Specialized Cargo Ships 72 0,2% 115 0,6% 188 528 0,6% 87 0,3% 615
Container Ships 4 703 14,6% 535 2,9% 5 238 13 340 15,7% 1 005 3,1% 14 345
Ro-Ro Cargo Ships 1 456 4,5% 699 3,8% 2 155 4 352 5,1% 1 245 3,9% 5 597
Bulk Carriers 11 509 35,6% 3 036 16,4% 14 545 22 271 26,1% 5 547 17,3% 27 818
Oil and Chemical Tankers 4 792 14,8% 2 033 11,0% 6 825 16 264 19,1% 4 141 12,9% 20 405
Gas Tankers 775 2,4% 118 0,6% 893 2 148 2,5% 370 1,2% 2 517
Other Tankers 51 0,2% 106 0,6% 158 385 0,5% 106 0,3% 490
Passenger Ships 594 1,8% 1 216 6,6% 1 810 5 592 6,6% 3 472 10,8% 9 064
Offshore Vessels 265 0,8% 544 2,9% 809 1 666 2,0% 1 776 5,5% 3 441
Service Ships 152 0,5% 702 3,8% 854 1 869 2,2% 3 404 10,6% 5 273
Tugs 49 0,2% 81 0,4% 129 222 0,3% 292 0,9% 514
Leisure Vessels 12 0,1% 12 25 0,0% 149 0,5% 174
Total 32 286 100% 18 519 100% 50 806 85 225 100% 32 100 100% 117 325
Ship TypeBlack flag Non black flag
P&I Non P&I P&I Non P&I
Source : Equasis processed by Emsa - (1) 500≤GT<25.000
Graph 125 - Total number of medium ships, by P&I status and flag– 2005
Black flag
Non P&I
21%
Non Black
flag
P&I
33%
Black flag
P&I
12%
Non Black
flag
Non P&I
34%
Graph 126 - Gross tonnage (in 1000 t) of medium ships, by P&I status and flag – 2005
Black flag
Non P&I
11%
Non Black
flag
P&I
51%
Black flag
P&I
19%
Non Black
flag
Non P&I
19%

Equasis statistics The world merchant fleet in 2005
76
LARGE SHIPS
Table 132 - P&I status : total number of large(1) ships, by type and flag- 2005
Total Total
General Cargo Ships 11 0,8% 11 166 4,2% 3 1,5% 169
Specialized Cargo Ships 8 0,6% 8 8 0,2% 2 1,0% 10
Container Ships 221 15,3% 4 6,8% 225 764 19,1% 30 15,3% 794
Ro-Ro Cargo Ships 199 13,8% 2 3,4% 201 252 6,3% 3 1,5% 255
Bulk Carriers 754 52,1% 34 57,6% 788 1 401 35,0% 84 42,9% 1 485
Oil and Chemical Tankers 194 13,4% 14 23,7% 208 1 069 26,7% 40 20,4% 1 109
Gas Tankers 44 3,0% 44 107 2,7% 1 0,5% 108
Other Tankers 3 0,1% 3
Passenger Ships 13 0,9% 13 192 4,8% 5 2,6% 197
Offshore Vessels 3 0,2% 3 5,1% 6 19 0,5% 16 8,2% 35
Service Ships 2 3,4% 2 17 0,4% 12 6,1% 29
Tugs
Leisure Vessels
Total 1 447 100% 59 100% 1 506 3 998 100% 196 100% 4 194
Ship TypeBlack flag Non black flag
P&I Non P&IP&I Non P&I
Source : Equasis processed by Emsa - (1) 25.000≤GT<60.000
Table 133 - P&I status : gross tonnage (in 1000 t) of large(1) ships, by type and flag- 2005
Total Total
General Cargo Ships 289 0,5% 289 4 885 3,3% 96 1,4% 4 981
Specialized Cargo Ships 244 0,4% 244 268 0,2% 72 1,0% 340
Container Ships 9 119 16,6% 148 6,7% 9 267 29 157 19,4% 1 080 15,4% 30 238
Ro-Ro Cargo Ships 8 684 15,8% 86 3,9% 8 770 11 188 7,4% 97 1,4% 11 285
Bulk Carriers 26 480 48,3% 1 141 52,0% 27 622 48 514 32,3% 2 738 39,1% 51 252
Oil and Chemical Tankers 7 394 13,5% 627 28,6% 8 021 43 443 28,9% 1 692 24,1% 45 135
Gas Tankers 1 964 3,6% 1 964 4 396 2,9% 47 0,7% 4 443
Other Tankers 0 96 0,1% 96
Passenger Ships 526 1,0% 526 6 707 4,5% 176 2,5% 6 883
Offshore Vessels 136 0,2% 130 5,9% 267 919 0,6% 636 9,1% 1 555
Service Ships 63 2,9% 63 706 0,5% 375 5,3% 1 081
Tugs
Leisure Vessels
Total 54 837 100% 2 194 100% 57 031 150 279 100% 7 009 100% 157 288
Ship TypeBlack flag Non black flag
P&I Non P&I P&I Non P&I
Source : Equasis processed by Emsa - (1) 25.000≤GT<60.000
Graph 127 - Total number of large ships, by P&I status
and flag– 2005
Black flag
Non P&I
2%
Non Black
flag
P&I
47%
Black flag
P&I
45%
Non Black
flag
Non P&I
6%
Graph 128 - Gross tonnage (in 1000 t) of large ships, by
P&I status and flag – 2005
Black flag
Non P&I
1%
Non Black
flag
P&I
64%
Black flag
P&I
26%
Non Black
flag
Non P&I
8%

Equasis statistics The world merchant fleet in 2005
77
VERY LARGE SHIPS
Table 134 - P&I status : total number of very large(1) ships, by type and flag- 2005
Total Total
General Cargo Ships
Specialized Cargo Ships
Container Ships 96 17,1% 3 12,0% 99 213 14,1% 11 18,0% 224
Ro-Ro Cargo Ships 12 2,1% 1 4,0% 13 18 1,2% 18
Bulk Carriers 266 47,5% 5 20,0% 271 364 24,1% 3 4,9% 367
Oil and Chemical Tankers 134 23,9% 7 28,0% 141 667 44,1% 26 42,6% 693
Gas Tankers 23 4,1% 2 8,0% 25 130 8,6% 1 1,6% 131
Other Tankers
Passenger Ships 14 2,5% 14 68 4,5% 3 4,9% 71
Offshore Vessels 15 2,7% 7 28,0% 22 44 2,9% 17 27,9% 61
Service Ships 7 0,5% 7
Tugs
Leisure Vessels
Total 560 100% 25 100% 585 1 511 100% 61 100% 1 572
Ship TypeBlack flag Non black flag
P&I Non P&IP&I Non P&I
Source : Equasis processed by Emsa - (1) GT≥60.000
Table 135 - P&I status : gross tonnage (in 1000 t) of very large(1) ships, by type and flag- 2005
Total Total
General Cargo Ships
Specialized Cargo Ships
Container Ships 6 862 12,4% 236 8,4% 7 097 15 782 10,7% 876 14,1% 16 658
Ro-Ro Cargo Ships 737 1,3% 63 2,2% 800 1 185 0,8% 1 185
Bulk Carriers 23 517 42,6% 430 15,3% 23 947 31 193 21,1% 214 3,4% 31 407
Oil and Chemical Tankers 19 088 34,6% 1 105 39,4% 20 192 75 732 51,3% 2 956 47,5% 78 688
Gas Tankers 2 230 4,0% 198 7,0% 2 428 12 841 8,7% 96 1,5% 12 937
Other Tankers
Passenger Ships 1 243 2,3% 1 243 5 911 4,0% 257 4,1% 6 167
Offshore Vessels 1 555 2,8% 776 27,6% 2 331 4 518 3,1% 1 819 29,3% 6 337
Service Ships 496 0,3% 496
Tugs
Leisure Vessels
Total 55 232 100% 2 806 100% 58 038 147 658 100% 6 217 100% 153 875
Ship TypeBlack flag Non black flag
P&I Non P&I P&I Non P&I
Source : Equasis processed by Emsa - (1) GT≥60.000
Graph 129 - Total number of very large ships, by P&I status and flag– 2005
Black flag
Non P&I
2%
Non Black
flag
P&I
48%
Black flag
P&I
45%
Non Black
flag
Non P&I
5%
Graph 130 - Gross tonnage (in 1000 t) of very large ships, by P&I status and flag – 2005
Non Black
flag
Non P&I
2%
Black flag
P&I
26%
Non Black
flag
P&I
41%
Black flag
Non P&I
1%
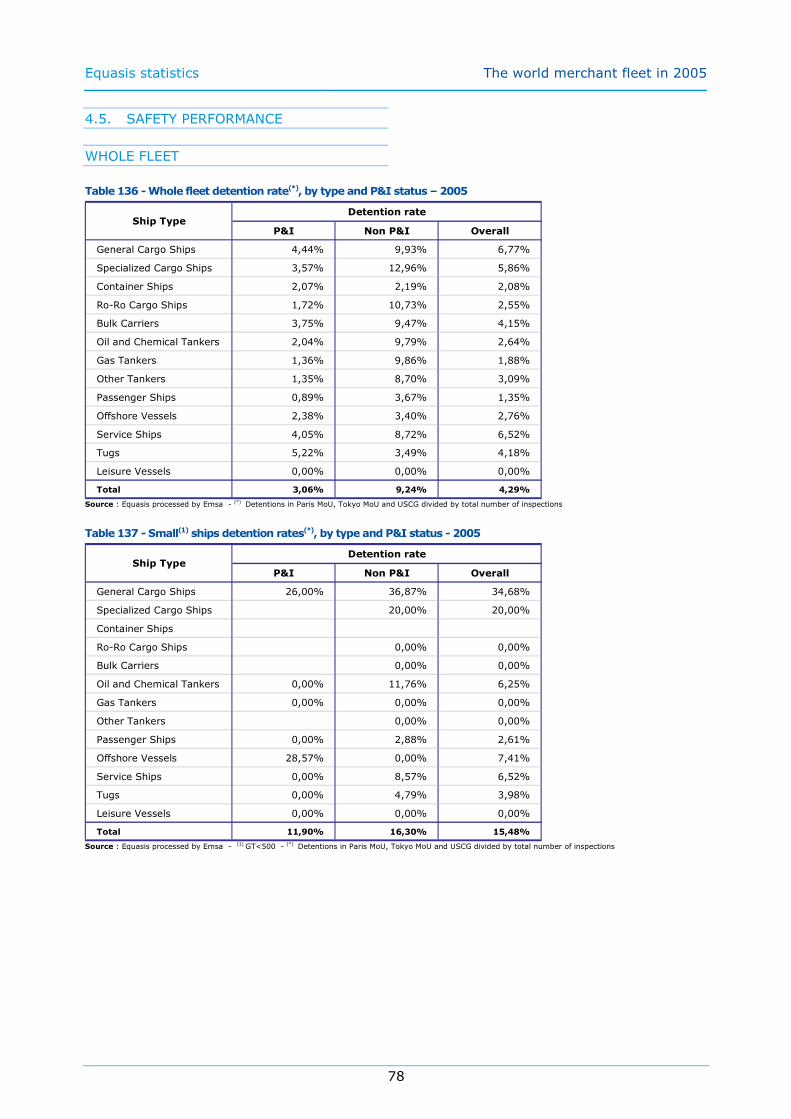
Equasis statistics The world merchant fleet in 2005
78
4.5. SAFETY PERFORMANCE
WHOLE FLEET
Table 136 - Whole fleet detention rate(*), by type and P&I status – 2005
P&I Non P&I Overall
General Cargo Ships 4,44% 9,93% 6,77%
Specialized Cargo Ships 3,57% 12,96% 5,86%
Container Ships 2,07% 2,19% 2,08%
Ro-Ro Cargo Ships 1,72% 10,73% 2,55%
Bulk Carriers 3,75% 9,47% 4,15%
Oil and Chemical Tankers 2,04% 9,79% 2,64%
Gas Tankers 1,36% 9,86% 1,88%
Other Tankers 1,35% 8,70% 3,09%
Passenger Ships 0,89% 3,67% 1,35%
Offshore Vessels 2,38% 3,40% 2,76%
Service Ships 4,05% 8,72% 6,52%
Tugs 5,22% 3,49% 4,18%
Leisure Vessels 0,00% 0,00% 0,00%
Total 3,06% 9,24% 4,29%
Ship TypeDetention rate
Source : Equasis processed by Emsa - (*) Detentions in Paris MoU, Tokyo MoU and USCG divided by total number of inspections
Table 137 - Small(1) ships detention rates(*), by type and P&I status - 2005
P&I Non P&I Overall
General Cargo Ships 26,00% 36,87% 34,68%
Specialized Cargo Ships 20,00% 20,00%
Container Ships
Ro-Ro Cargo Ships 0,00% 0,00%
Bulk Carriers 0,00% 0,00%
Oil and Chemical Tankers 0,00% 11,76% 6,25%
Gas Tankers 0,00% 0,00% 0,00%
Other Tankers 0,00% 0,00%
Passenger Ships 0,00% 2,88% 2,61%
Offshore Vessels 28,57% 0,00% 7,41%
Service Ships 0,00% 8,57% 6,52%
Tugs 0,00% 4,79% 3,98%
Leisure Vessels 0,00% 0,00% 0,00%
Total 11,90% 16,30% 15,48%
Ship TypeDetention rate
Source : Equasis processed by Emsa - (1) GT<500 - (*) Detentions in Paris MoU, Tokyo MoU and USCG divided by total number of inspections

Equasis statistics The world merchant fleet in 2005
79
Table 138 - Medium(1) ships detention rates(*), by type and P&I status - 2005
P&I Non P&I Overall
General Cargo Ships 8,82% 16,52% 12,16%
Specialized Cargo Ships 4,26% 12,77% 6,38%
Container Ships 4,40% 2,43% 4,23%
Ro-Ro Cargo Ships 4,79% 15,42% 7,04%
Bulk Carriers 5,30% 18,33% 6,76%
Oil and Chemical Tankers 5,02% 17,00% 6,49%
Gas Tankers 4,01% 19,35% 5,35%
Other Tankers 4,26% 11,11% 5,91%
Passenger Ships 1,67% 6,78% 2,68%
Offshore Vessels 2,07% 4,76% 2,99%
Service Ships 8,86% 15,09% 11,99%
Tugs 14,12% 3,85% 11,71%
Leisure Vessels 0,00% 0,00%
Total 6,39% 15,90% 9,08%
Detention rateShip Type
Source : Equasis processed by Emsa - (1) 500≤GT<25.000 - (*) Detentions in Paris MoU, Tokyo MoU and USCG divided by total number of inspections
Table 139 - Large(1) ships detention rates(*), by type and P&I status - 2005
P&I Non P&I Overall
General Cargo Ships 2,67% 0,00% 2,60%
Specialized Cargo Ships 3,70% 0,00% 3,45%
Container Ships 4,12% 7,87% 4,25%
Ro-Ro Cargo Ships 1,76% 0,00% 1,75%
Bulk Carriers 5,22% 11,06% 5,46%
Oil and Chemical Tankers 2,27% 0,00% 2,21%
Gas Tankers 0,00% 0,00% 0,00%
Other Tankers 0,00% 0,00%
Passenger Ships 0,88% 0,00% 0,87%
Offshore Vessels 0,00% 0,00% 0,00%
Service Ships 0,00% 0,00% 0,00%
Tugs
Leisure Vessels
Total 3,72% 7,49% 3,84%
Detention rateShip Type
Source : Equasis processed by Emsa - (1) 25.000≤GT<60.000 - (*) Detentions in Paris MoU, Tokyo MoU and USCG divided by total number of inspections

Equasis statistics The world merchant fleet in 2005
80
Table 140 - Very large(1) ships detention rates(*), by type and P&I status - 2005
P&I Non P&I Overall
General Cargo Ships
Specialized Cargo Ships
Container Ships 0,46% 0,00% 0,45%
Ro-Ro Cargo Ships 0,00% 0,00% 0,00%
Bulk Carriers 7,56% 0,00% 7,52%
Oil and Chemical Tankers 0,41% 5,26% 0,51%
Gas Tankers 0,00% 0,00% 0,00%
Other Tankers
Passenger Ships 0,00% 0,00% 0,00%
Offshore Vessels 0,00% 0,00%
Service Ships
Tugs
Leisure Vessels
Total 2,61% 1,28% 2,58%
Detention rateShip Type
Source : Equasis processed by Emsa - (1) GT≥60.000 - (*) Detentions in Paris MoU, Tokyo MoU and USCG divided by total number of inspections

Equasis statistics The world merchant fleet in 2005
81
5. Port State Control
INTRODUCTION
Port State authorities check the compliance
with international conventions of foreign
ships visiting their ports. EQUASIS includes
inspection data provided by three of the
regional ports state control regimes, Paris
MoU, Tokyo MoU and U.S. Coastguard
(USCG).
OVER-INSPECTION
A concern of the industry and regulators
alike is that ships should not be subject to
unnecessarily frequent inspections. The
following tables show the level of annual
inspections by the three regional port state
control regimes which contribute to
EQUASIS for the period 2000 to 2005.
UN-INSPECTED SHIPS
Many vessels do not trade to the PSC
regions considered by EQUASIS or have not
been inspected when they have visited these
regions (some vessels are not eligible to
PSC inspections either because of their size
and type or they are only engaged on
domestic trade, but these are mainly
confined to small ships). Therefore a portion
of the eligible fleet has no records of port
state control inspections. A significant
portion of this un-inspected fleet,
particularly very large, large and medium
ships, can potentially trade in these PSC
regimes. The inspection figures show the
proportion of the fleet which have not been
inspected by one of the three PSC regimes
IN THE LAST 3 YEARS (2003 to 2005). It
has been sorted by type and age ranges;
type and flag; type and class status; type
and P&I coverage.
RESULTS
Table 141 shows that the number of
individual ships inspected has risen steadily
in the period 2000 to 2005. The frequency
of inspection of ships has remained fairly
constant with around a third of inspected
ships inspected once and a third inspected
twice in each year. Table 142 does not
indicate a significant difference among the
three PSC regions.
Of the 23244 individual ships inspected in at
least one of the regions, 1098 (4.7%) were
inspected at least once in all three regions
during 2005. 7898 (40%) were inspected in
two regions.
A comparison of the totals in Table 1 and
Table 144 shows that most small ships
(23035 out of 23660) have not been
inspected by port state control. The exact
proportion is not known but it is believed
that the majority of these ships are not
subject to port state control because they do
not trade internationally (Table 1 shows that
52.9% of small ships are either tugs or
passenger ships which are likely to be
engaged on domestic voyages). Around
49% of all medium–sized ships were not
inspected in 2005. Table 170 indicates that
for these ships the ratio of non-inspection
was lower for black flagged ships than for
other flags (14% compared with 35%). For
large and very large ships the proportion of
un-inspected ships falls to 6% and 10%
respectively – these ratios are similar for
both black flagged and non-black flagged
ships.
Chapter 5

Equasis statistics The world merchant fleet in 2005
82
5.1. OVER INSPECTION
MULTIPLE INSPECTIONS
Table 141 - Total number of individual ships inspected(*), by number of inspections per ship – 2000/2005
1 7 297 38,2% 7 180 35,3% 6 966 33,7% 6 640 31,0% 6 518 29,4% 6 998 30,1%
2 5 700 29,8% 6 394 31,4% 6 691 32,4% 6 514 30,4% 6 956 31,4% 7 470 32,1%
3 3 177 16,6% 3 681 18,1% 4 090 19,8% 4 233 19,7% 4 621 20,8% 4 627 19,9%
4 1 593 8,3% 1 826 9,0% 1 908 9,2% 2 319 10,8% 2 374 10,7% 2 397 10,3%
5 747 3,9% 760 3,7% 733 3,5% 1 027 4,8% 981 4,4% 1 049 4,5%
More than 5 612 3,2% 525 2,6% 292 1,4% 700 3,3% 726 3,3% 703 3,0%
Total 19 126 100% 20 366 100% 20 680 100% 21 433 100% 22 176 100% 23 244 100%
2004 2005
Number of ships inspectedNumber of
inspections
per ship 2001 2002 20032000
Source : Equasis processed by Emsa – Paris MoU, Tokyo MoU, US Coast guard - (*) All existing ship types
Graph 131 - Total number of individual ships inspected(*), by number of inspections per ship – 2000/2005
0
1000
2000
3000
4000
5000
6000
7000
8000
2 0 0 0 2 0 0 1 2 0 0 2 2 0 0 3 2 0 0 4 2 0 0 5
1 inspect ion
2 inspect ion
3 inspect ion
4 inspect ion
5 inspect ion
More than 5
(*) All existing ship types
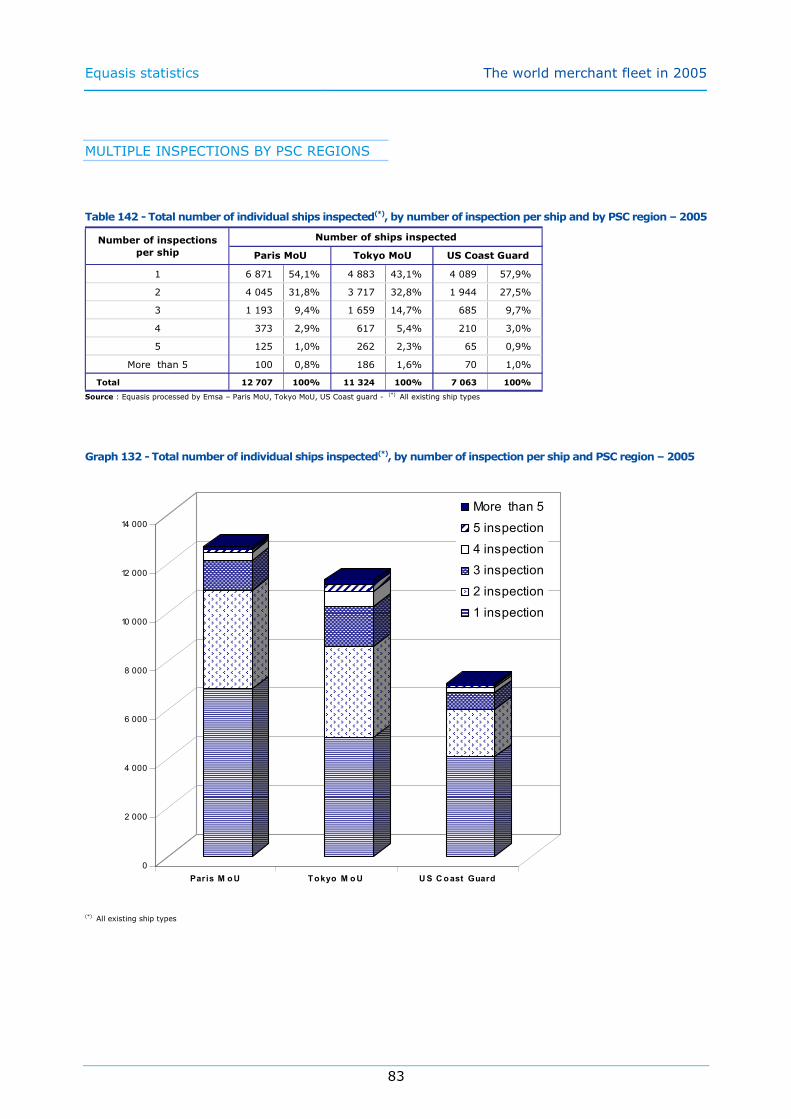
Equasis statistics The world merchant fleet in 2005
83
MULTIPLE INSPECTIONS BY PSC REGIONS
Table 142 - Total number of individual ships inspected(*), by number of inspection per ship and by PSC region – 2005
1 6 871 54,1% 4 883 43,1% 4 089 57,9%
2 4 045 31,8% 3 717 32,8% 1 944 27,5%
3 1 193 9,4% 1 659 14,7% 685 9,7%
4 373 2,9% 617 5,4% 210 3,0%
5 125 1,0% 262 2,3% 65 0,9%
More than 5 100 0,8% 186 1,6% 70 1,0%
Total 12 707 100% 11 324 100% 7 063 100%
Number of ships inspectedNumber of inspections
per ship Tokyo MoU US Coast GuardParis MoU
Source : Equasis processed by Emsa – Paris MoU, Tokyo MoU, US Coast guard - (*) All existing ship types
Graph 132 - Total number of individual ships inspected(*), by number of inspection per ship and PSC region – 2005
0
2 000
4 000
6 000
8 000
10 000
12 000
14 000
Par is M oU Tokyo M oU US Coast Guard
More than 5
5 inspection
4 inspection
3 inspection
2 inspection
1 inspection
(*) All existing ship types
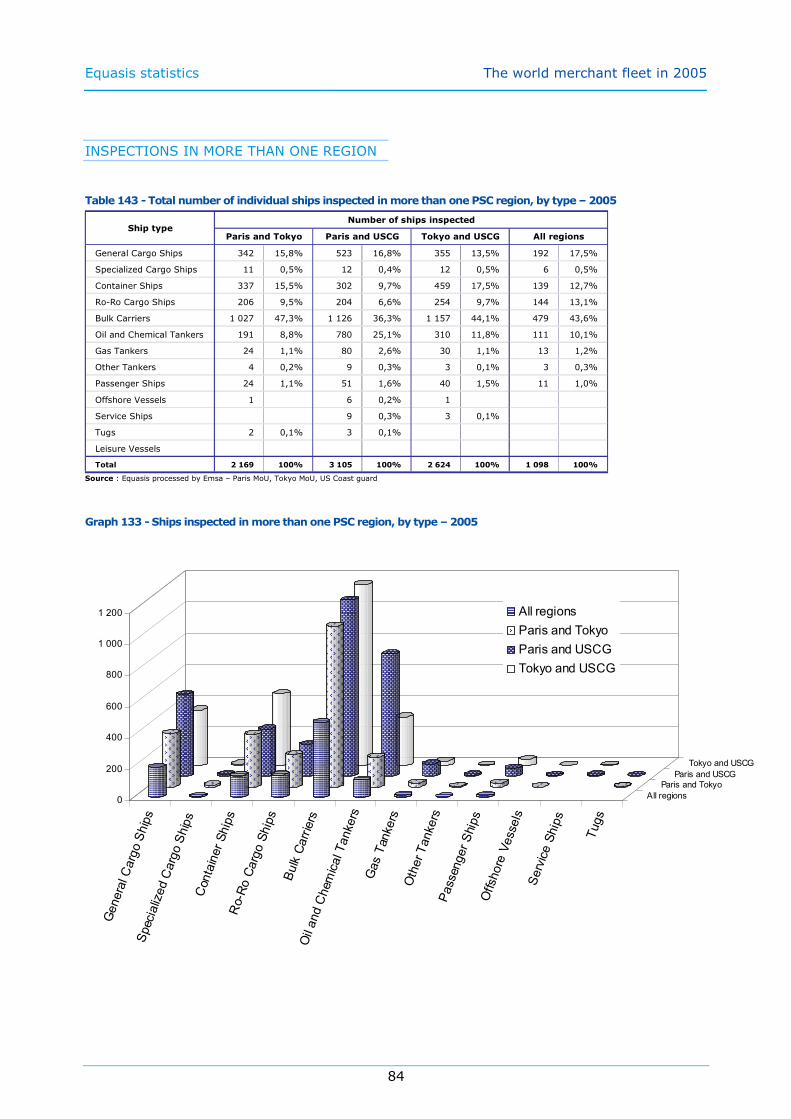
Equasis statistics The world merchant fleet in 2005
84
INSPECTIONS IN MORE THAN ONE REGION
Table 143 - Total number of individual ships inspected in more than one PSC region, by type – 2005
General Cargo Ships 342 15,8% 523 16,8% 355 13,5% 192 17,5%
Specialized Cargo Ships 11 0,5% 12 0,4% 12 0,5% 6 0,5%
Container Ships 337 15,5% 302 9,7% 459 17,5% 139 12,7%
Ro-Ro Cargo Ships 206 9,5% 204 6,6% 254 9,7% 144 13,1%
Bulk Carriers 1 027 47,3% 1 126 36,3% 1 157 44,1% 479 43,6%
Oil and Chemical Tankers 191 8,8% 780 25,1% 310 11,8% 111 10,1%
Gas Tankers 24 1,1% 80 2,6% 30 1,1% 13 1,2%
Other Tankers 4 0,2% 9 0,3% 3 0,1% 3 0,3%
Passenger Ships 24 1,1% 51 1,6% 40 1,5% 11 1,0%
Offshore Vessels 1 6 0,2% 1
Service Ships 9 0,3% 3 0,1%
Tugs 2 0,1% 3 0,1%
Leisure Vessels
Total 2 169 100% 3 105 100% 2 624 100% 1 098 100%
Number of ships inspectedShip type
Paris and USCG All regionsParis and Tokyo Tokyo and USCG
Source : Equasis processed by Emsa – Paris MoU, Tokyo MoU, US Coast guard
Graph 133 - Ships inspected in more than one PSC region, by type – 2005
0
200
400
600
800
1 000
1 200
General Cargo Ships
Specialized Cargo Ships
Container Ships
Ro-Ro Cargo Ships
Bulk Carriers
Oil and Chemical Tankers
Gas Tankers
Other Tankers
Passenger Ships
Offshore Vessels
Service Ships
Tugs
All regions
Paris and Tokyo
Paris and USCG
Tokyo and USCG
All regions
Paris and Tokyo
Paris and USCG
Tokyo and USCG

Equasis statistics The world merchant fleet in 2005
85
5.2. UN-INSPECTED SHIPS
WHOLE FLEET
Table 144 - Total number of un-inspected(*) ships, by type and size – 2005
Ship Type
General Cargo Ships 4 742 20,6% 3 870 26,6% 2 0,5% 8 614 22,5%
Specialized Cargo Ships 28 0,1% 55 0,4% 2 0,5% 85 0,2%
Container Ships 252 1,7% 36 8,5% 10 3,4% 298 0,8%
Ro-Ro Cargo Ships 30 0,1% 325 2,2% 14 3,3% 2 0,7% 371 1,0%
Bulk Carriers 429 1,9% 688 4,7% 96 22,7% 12 4,1% 1 225 3,2%
Oil and Chemical Tankers 1 979 8,6% 2 842 19,6% 147 34,8% 146 49,3% 5 114 13,4%
Gas Tankers 46 0,2% 313 2,2% 12 2,8% 39 13,2% 410 1,1%
Other Tankers 147 0,6% 98 0,7% 245 0,6%
Passenger Ships 2 996 13,0% 1 979 13,6% 48 11,4% 1 0,3% 5 024 13,1%
Offshore Vessels 1 225 5,3% 1 843 12,7% 37 8,8% 79 26,7% 3 184 8,3%
Service Ships 1 736 7,5% 1 582 10,9% 28 6,6% 7 2,4% 3 353 8,8%
Tugs 9 173 39,8% 544 3,7% 9 717 25,4%
Leisure Vessels 504 2,2% 145 1,0% 649 1,7%
Total 23 035 100% 14 536 100% 422 100% 296 100% 38 289 100%
Small(1) TotalMedium
(2)Large
(3)Very Large
(4)
Source : Equasis processed by Emsa / (1) GT<500 - (2) 500≤GT<25.000 - (3) 25.000≤GT<60.000 - (4) GT≥60.000 - (*)Inspections in the period 2003/2005
Table 145 - Gross tonnage (in 1000 t) of un-inspected(*) ships, by type and size - 2005
Ship Type
General Cargo Ships 1 493 24,7% 10 580 23,1% 53 0,3% 12 126 12,0%
Specialized Cargo Ships 10 0,2% 142 0,3% 76 0,5% 229 0,2%
Container Ships 2 244 4,9% 1 227 7,8% 936 2,8% 4 406 4,4%
Ro-Ro Cargo Ships 11 0,2% 1 721 3,8% 524 3,3% 131 0,4% 2 387 2,4%
Bulk Carriers 163 2,7% 5 997 13,1% 3 233 20,6% 1 103 3,3% 10 496 10,4%
Oil and Chemical Tankers 635 10,5% 9 126 19,9% 5 719 36,5% 18 627 55,2% 34 107 33,7%
Gas Tankers 16 0,3% 683 1,5% 512 3,3% 4 137 12,2% 5 348 5,3%
Other Tankers 39 0,6% 194 0,4% 234 0,2%
Passenger Ships 744 12,3% 6 699 14,6% 1 630 10,4% 80 0,2% 9 154 9,0%
Offshore Vessels 345 5,7% 3 033 6,6% 1 669 10,7% 8 265 24,5% 13 312 13,1%
Service Ships 451 7,5% 4 676 10,2% 1 021 6,5% 496 1,5% 6 643 6,6%
Tugs 2 041 33,7% 510 1,1% 2 551 2,5%
Leisure Vessels 101 1,7% 179 0,4% 280 0,3%
Total 6 051 100% 45 785 100% 15 664 100% 33 774 100% 101 274 100%
TotalSmall(1)
Medium(2)
Large(3)
Very Large(4)
Source : Equasis processed by Emsa / (1) GT<500 - (2) 500≤GT<25.000 - (3) 25.000≤GT<60.000 - (4) GT≥60.000 - (*)Inspections in the period 2003/2005
Graph 134 - Total number of un-inspected ships, by size – 2005
Medium
38%
Large
1%
Small
60%
Very large
1%
Graph 135 - Gross tonnage (in 1000 t) of un-inspected ships, by size – 2005
Very large
33%
Small
6%
Large
15%
Medium
46%

Equasis statistics The world merchant fleet in 2005
86
5.3. UN-INSPECTED SHIPS BY AGE
WHOLE FLEET
Table 146 - Total number of un-inspected(*) ships, by type and age – 2005
Ship Type
General Cargo Ships 232 7,5% 1 430 18,8% 1 725 20,2% 5 227 27,4% 8 614 22,5%
Specialized Cargo Ships 6 0,1% 18 0,2% 61 0,3% 85 0,2%
Container Ships 67 2,2% 64 0,8% 63 0,7% 104 0,5% 298 0,8%
Ro-Ro Cargo Ships 31 1,0% 77 1,0% 79 0,9% 184 1,0% 371 1,0%
Bulk Carriers 54 1,7% 250 3,3% 360 4,2% 561 2,9% 1 225 3,2%
Oil and Chemical Tankers 320 10,3% 1 061 14,0% 1 268 14,8% 2 465 12,9% 5 114 13,4%
Gas Tankers 31 1,0% 103 1,4% 97 1,1% 179 0,9% 410 1,1%
Other Tankers 44 0,6% 51 0,6% 150 0,8% 245 0,6%
Passenger Ships 468 15,1% 1 249 16,5% 1 202 14,0% 2 105 11,0% 5 024 13,1%
Offshore Vessels 409 13,2% 374 4,9% 919 10,7% 1 482 7,8% 3 184 8,3%
Service Ships 234 7,6% 504 6,6% 987 11,5% 1 628 8,5% 3 353 8,8%
Tugs 1 067 34,5% 2 280 30,1% 1 692 19,8% 4 678 24,6% 9 717 25,4%
Leisure Vessels 179 5,8% 145 1,9% 97 1,1% 228 1,2% 649 1,7%
Total 3 092 100% 7 587 100% 8 558 100% 19 052 100% 38 289 100%
0-4 Total5-14 15-24 25+
Source : Equasis processed by Emsa / (1) GT<500 - (*)Inspections in the period 2003/2005
Table 147 - Gross tonnage (in 1000 t) of un-inspected(*) ships, by type and age - 2005
Ship Type
General Cargo Ships 335 1,6% 1 140 5,5% 2 128 9,8% 8 523 22,2% 12 126 12,0%
Specialized Cargo Ships 12 0,1% 107 0,5% 110 0,3% 229 0,2%
Container Ships 2 017 9,9% 556 2,7% 958 4,4% 875 2,3% 4 406 4,4%
Ro-Ro Cargo Ships 543 2,7% 512 2,5% 418 1,9% 915 2,4% 2 387 2,4%
Bulk Carriers 1 757 8,6% 903 4,3% 2 523 11,6% 5 312 13,8% 10 496 10,4%
Oil and Chemical Tankers 8 586 42,1% 7 809 37,6% 9 059 41,7% 8 652 22,5% 34 107 33,7%
Gas Tankers 1 154 5,7% 2 654 12,8% 879 4,0% 660 1,7% 5 348 5,3%
Other Tankers 25 0,1% 27 0,1% 181 0,5% 234 0,2%
Passenger Ships 2 055 10,1% 2 549 12,3% 1 654 7,6% 2 896 7,5% 9 154 9,0%
Offshore Vessels 2 377 11,7% 2 837 13,6% 1 555 7,2% 6 543 17,0% 13 312 13,1%
Service Ships 1 096 5,4% 1 132 5,4% 1 883 8,7% 2 533 6,6% 6 643 6,6%
Tugs 325 1,6% 585 2,8% 500 2,3% 1 141 3,0% 2 551 2,5%
Leisure Vessels 127 0,6% 72 0,3% 42 0,2% 38 0,1% 280 0,3%
Total 20 374 100% 20 786 100% 21 732 100% 38 381 100% 101 274 100%
Total0-4 5-14 15-24 25+
Source : Equasis processed by Emsa / (1) GT<500 - (*)Inspections in the period 2003/2005
Graph 136 - Total number of un-inspected ships, by age – 2003/2005
5-14 years
20%
15-24 years
22%
0-4 years
8%
25+ years
50%
Graph 137 - Gross tonnage (in 1000 t) of un-inspected ships, by age – 2003/2005
25+ years
38%
0-4 years
20%
15-24 years
21%
5-14 years
21%

Equasis statistics The world merchant fleet in 2005
87
SMALL UN-INSPECTED SHIPS
Table 148 - Total number of small(1) un-inspected(*) ships, by type and age – 2005
Ship Type
General Cargo Ships 127 7,4% 1 061 20,6% 1 114 21,6% 2 440 22,2% 4 742 20,6%
Specialized Cargo Ships 1 0,0% 4 0,1% 23 0,2% 28 0,1%
Container Ships
Ro-Ro Cargo Ships 1 0,1% 6 0,1% 5 0,1% 18 0,2% 30 0,1%
Bulk Carriers 1 0,1% 120 2,3% 168 3,3% 140 1,3% 429 1,9%
Oil and Chemical Tankers 61 3,6% 526 10,2% 503 9,8% 889 8,1% 1 979 8,6%
Gas Tankers 2 0,1% 5 0,1% 13 0,3% 26 0,2% 46 0,2%
Other Tankers 23 0,4% 34 0,7% 90 0,8% 147 0,6%
Passenger Ships 229 13,3% 759 14,7% 765 14,8% 1 243 11,3% 2 996 13,0%
Offshore Vessels 76 4,4% 89 1,7% 343 6,7% 717 6,5% 1 225 5,3%
Service Ships 103 6,0% 264 5,1% 575 11,2% 794 7,2% 1 736 7,5%
Tugs 1 001 58,3% 2 194 42,6% 1 556 30,2% 4 422 40,2% 9 173 39,8%
Leisure Vessels 116 6,8% 107 2,1% 74 1,4% 207 1,9% 504 2,2%
Total 1 717 100% 5 155 100% 5 154 100% 11 009 100% 23 035 100%
0-4 Total5-14 15-24 25+
Source : Equasis processed by Emsa / (*)Inspections in the period 2003/2005
Table 149 - Gross tonnage (in 1000 t) of small(1) un-inspected(*) ships, by type and age - 2005
Ship Type
General Cargo Ships 52 10,5% 365 25,9% 323 23,2% 753 27,4% 1 493 24,7%
Specialized Cargo Ships 0,5 0,0% 1 0,1% 9 0,3% 10 0,2%
Container Ships
Ro-Ro Cargo Ships 0,3 0,1% 3 0,2% 2 0,1% 7 0,2% 11 0,2%
Bulk Carriers 0,5 0,1% 50 3,5% 69 4,9% 44 1,6% 163 2,7%
Oil and Chemical Tankers 24 4,8% 169 12,0% 150 10,7% 292 10,6% 635 10,5%
Gas Tankers 1 0,2% 2 0,1% 5 0,4% 9 0,3% 16 0,3%
Other Tankers 6 0,4% 9 0,7% 24 0,9% 39 0,6%
Passenger Ships 64 13,0% 190 13,4% 189 13,5% 302 11,0% 744 12,3%
Offshore Vessels 31 6,3% 27 1,9% 101 7,2% 186 6,8% 345 5,7%
Service Ships 24 5,0% 70 5,0% 170 12,1% 187 6,8% 451 7,5%
Tugs 258 52,6% 503 35,6% 359 25,7% 921 33,5% 2 041 33,7%
Leisure Vessels 37 7,5% 27 1,9% 19 1,4% 17 0,6% 101 1,7%
Total 490 100% 1 411 100% 1 397 100% 2 752 100% 6 051 100%
Total0-4 5-14 15-24 25+
Source : Equasis processed by Emsa / (*)Inspections in the period 2003/2005
Graph 138 - Total number of small un-inspected ships, by age – 2003/2005
5-14 years
22%
15-24 years
22%
0-4 years
7%
25+ years
49%
Graph 139 - Gross tonnage (in 1000 t) of small un-inspected ships, by age – 2003/2005
25+ years
46%
0-4 years
8%
15-24 years
23%
5-14 years
23%
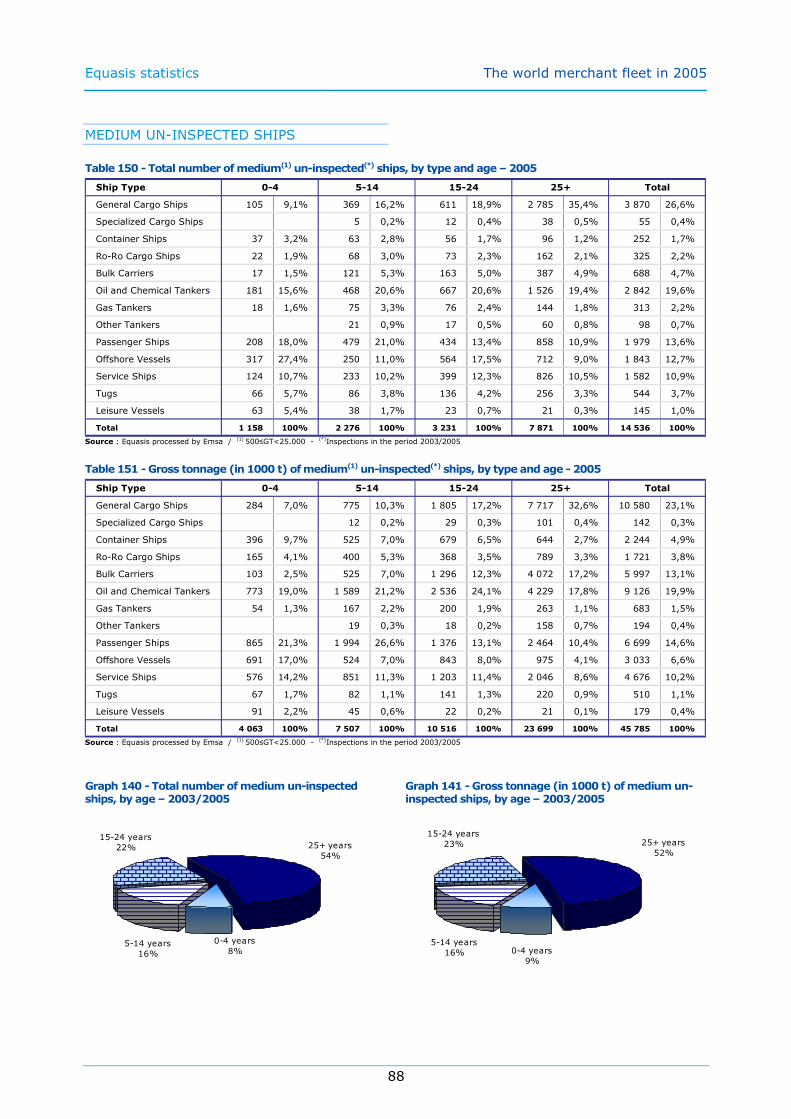
Equasis statistics The world merchant fleet in 2005
88
MEDIUM UN-INSPECTED SHIPS
Table 150 - Total number of medium(1) un-inspected(*) ships, by type and age – 2005
Ship Type
General Cargo Ships 105 9,1% 369 16,2% 611 18,9% 2 785 35,4% 3 870 26,6%
Specialized Cargo Ships 5 0,2% 12 0,4% 38 0,5% 55 0,4%
Container Ships 37 3,2% 63 2,8% 56 1,7% 96 1,2% 252 1,7%
Ro-Ro Cargo Ships 22 1,9% 68 3,0% 73 2,3% 162 2,1% 325 2,2%
Bulk Carriers 17 1,5% 121 5,3% 163 5,0% 387 4,9% 688 4,7%
Oil and Chemical Tankers 181 15,6% 468 20,6% 667 20,6% 1 526 19,4% 2 842 19,6%
Gas Tankers 18 1,6% 75 3,3% 76 2,4% 144 1,8% 313 2,2%
Other Tankers 21 0,9% 17 0,5% 60 0,8% 98 0,7%
Passenger Ships 208 18,0% 479 21,0% 434 13,4% 858 10,9% 1 979 13,6%
Offshore Vessels 317 27,4% 250 11,0% 564 17,5% 712 9,0% 1 843 12,7%
Service Ships 124 10,7% 233 10,2% 399 12,3% 826 10,5% 1 582 10,9%
Tugs 66 5,7% 86 3,8% 136 4,2% 256 3,3% 544 3,7%
Leisure Vessels 63 5,4% 38 1,7% 23 0,7% 21 0,3% 145 1,0%
Total 1 158 100% 2 276 100% 3 231 100% 7 871 100% 14 536 100%
0-4 Total5-14 15-24 25+
Source : Equasis processed by Emsa / (1) 500≤GT<25.000 - (*)Inspections in the period 2003/2005
Table 151 - Gross tonnage (in 1000 t) of medium(1) un-inspected(*) ships, by type and age - 2005
Ship Type
General Cargo Ships 284 7,0% 775 10,3% 1 805 17,2% 7 717 32,6% 10 580 23,1%
Specialized Cargo Ships 12 0,2% 29 0,3% 101 0,4% 142 0,3%
Container Ships 396 9,7% 525 7,0% 679 6,5% 644 2,7% 2 244 4,9%
Ro-Ro Cargo Ships 165 4,1% 400 5,3% 368 3,5% 789 3,3% 1 721 3,8%
Bulk Carriers 103 2,5% 525 7,0% 1 296 12,3% 4 072 17,2% 5 997 13,1%
Oil and Chemical Tankers 773 19,0% 1 589 21,2% 2 536 24,1% 4 229 17,8% 9 126 19,9%
Gas Tankers 54 1,3% 167 2,2% 200 1,9% 263 1,1% 683 1,5%
Other Tankers 19 0,3% 18 0,2% 158 0,7% 194 0,4%
Passenger Ships 865 21,3% 1 994 26,6% 1 376 13,1% 2 464 10,4% 6 699 14,6%
Offshore Vessels 691 17,0% 524 7,0% 843 8,0% 975 4,1% 3 033 6,6%
Service Ships 576 14,2% 851 11,3% 1 203 11,4% 2 046 8,6% 4 676 10,2%
Tugs 67 1,7% 82 1,1% 141 1,3% 220 0,9% 510 1,1%
Leisure Vessels 91 2,2% 45 0,6% 22 0,2% 21 0,1% 179 0,4%
Total 4 063 100% 7 507 100% 10 516 100% 23 699 100% 45 785 100%
Total0-4 5-14 15-24 25+
Source : Equasis processed by Emsa / (1) 500≤GT<25.000 - (*)Inspections in the period 2003/2005
Graph 140 - Total number of medium un-inspected ships, by age – 2003/2005
5-14 years
16%
15-24 years
22%
0-4 years
8%
25+ years
54%
Graph 141 - Gross tonnage (in 1000 t) of medium un-inspected ships, by age – 2003/2005
25+ years
52%
0-4 years
9%
15-24 years
23%
5-14 years
16%

Equasis statistics The world merchant fleet in 2005
89
LARGE UN-INSPECTED SHIPS
Table 152 - Total number of large(1) un-inspected(*) ships, by type and age – 2005
Ship Type
General Cargo Ships 2 2,0% 2 0,5%
Specialized Cargo Ships 2 1,5% 2 0,5%
Container Ships 20 17,5% 1 1,4% 7 5,2% 8 8,1% 36 8,5%
Ro-Ro Cargo Ships 6 5,3% 3 4,1% 1 0,7% 4 4,0% 14 3,3%
Bulk Carriers 29 25,4% 8 10,8% 27 20,0% 32 32,3% 96 22,7%
Oil and Chemical Tankers 26 22,8% 26 35,1% 70 51,9% 25 25,3% 147 34,8%
Gas Tankers 1 1,4% 2 1,5% 9 9,1% 12 2,8%
Other Tankers
Passenger Ships 30 26,3% 11 14,9% 3 2,2% 4 4,0% 48 11,4%
Offshore Vessels 3 2,6% 17 23,0% 10 7,4% 7 7,1% 37 8,8%
Service Ships 7 9,5% 13 9,6% 8 8,1% 28 6,6%
Tugs
Leisure Vessels
Total 114 100% 74 100% 135 100% 99 100% 422 100%
0-4 Total5-14 15-24 25+
Source : Equasis processed by Emsa / (1) 25.000≤GT<60.000 - (*)Inspections in the period 2003/2005
Table 153 - Gross tonnage (in 1000 t) of large(1) un-inspected(*) ships, by type and age - 2005
Ship Type
General Cargo Ships 53 1,5% 53 0,3%
Specialized Cargo Ships 76 1,5% 76 0,5%
Container Ships 686 16,7% 32 1,2% 279 5,3% 231 6,4% 1 227 7,8%
Ro-Ro Cargo Ships 247 6,0% 110 4,1% 48 0,9% 119 3,3% 524 3,3%
Bulk Carriers 982 23,9% 246 9,2% 936 17,8% 1 069 29,5% 3 233 20,6%
Oil and Chemical Tankers 1 012 24,7% 866 32,4% 2 782 52,9% 1 060 29,2% 5 719 36,5%
Gas Tankers 41 1,5% 82 1,6% 389 10,7% 512 3,3%
Other Tankers
Passenger Ships 1 045 25,5% 366 13,7% 89 1,7% 131 3,6% 1 630 10,4%
Offshore Vessels 128 3,1% 806 30,1% 460 8,7% 275 7,6% 1 669 10,7%
Service Ships 211 7,9% 510 9,7% 300 8,3% 1 021 6,5%
Tugs
Leisure Vessels
Total 4 100 100% 2 676 100% 5 262 100% 3 626 100% 15 664 100%
Total0-4 5-14 15-24 25+
Source : Equasis processed by Emsa / (1) 25.000≤GT<60.000 - (*)Inspections in the period 2003/2005
Graph 142 - Total number of large un-inspected ships, by age – 2003/2005
5-14 years
18%
15-24 years
32%
0-4 years
27%
25+ years
23%
Graph 143 - Gross tonnage (in 1000 t) of large un-inspected ships, by age – 2003/2005
25+ years
23%
0-4 years
26%
15-24 years
34%
5-14 years
17%

Equasis statistics The world merchant fleet in 2005
90
VERY LARGE UN-INSPECTED SHIPS
Table 154 - Total number of very large(1) un-inspected(*) ships, by type and age – 2005
Ship Type
General Cargo Ships
Specialized Cargo Ships
Container Ships 10 9,7% 10 3,4%
Ro-Ro Cargo Ships 2 1,9% 2 0,7%
Bulk Carriers 7 6,8% 1 1,2% 2 5,3% 2 2,7% 12 4,1%
Oil and Chemical Tankers 52 50,5% 41 50,0% 28 73,7% 25 34,2% 146 49,3%
Gas Tankers 11 10,7% 22 26,8% 6 15,8% 39 13,2%
Other Tankers
Passenger Ships 1 1,0% 1 0,3%
Offshore Vessels 13 12,6% 18 22,0% 2 5,3% 46 63,0% 79 26,7%
Service Ships 7 6,8% 7 2,4%
Tugs
Leisure Vessels
Total 103 100% 82 100% 38 100% 73 100% 296 100%
0-4 Total5-14 15-24 25+
Source : Equasis processed by Emsa / (1) GT≥60.000 - (*)Inspections in the period 2003/2005
Table 155 - Gross tonnage (in 1000 t) of very large(1) un-inspected(*) ships, by type and age - 2005
Ship Type
General Cargo Ships
Specialized Cargo Ships
Container Ships 936 8,0% 936 2,8%
Ro-Ro Cargo Ships 131 1,1% 131 0,4%
Bulk Carriers 672 5,7% 82 0,9% 222 4,9% 127 1,5% 1 103 3,3%
Oil and Chemical Tankers 6 778 57,8% 5 185 56,4% 3 592 78,8% 3 071 37,0% 18 627 55,2%
Gas Tankers 1 100 9,4% 2 444 26,6% 592 13,0% 4 137 12,2%
Other Tankers
Passenger Ships 80 0,7% 80 0,2%
Offshore Vessels 1 528 13,0% 1 480 16,1% 151 3,3% 5 107 61,5% 8 265 24,5%
Service Ships 496 4,2% 496 1,5%
Tugs
Leisure Vessels
Total 11 720 100% 9 192 100% 4 558 100% 8 305 100% 33 774 100%
Total0-4 5-14 15-24 25+
Source : Equasis processed by Emsa / (1) GT≥60.000 - (*)Inspections in the period 2003/2005
Graph 144 - Total number of very large un-inspected ships, by age – 2003/2005
5-14 years
28%
15-24 years
13%
0-4 years
34%
25+ years
25%
Graph 145 - Gross tonnage (in 1000 t) of very large un-inspected ships, by age – 2003/2005
25+ years
25%
0-4 years
35%
15-24 years
13%5-14 years
27%
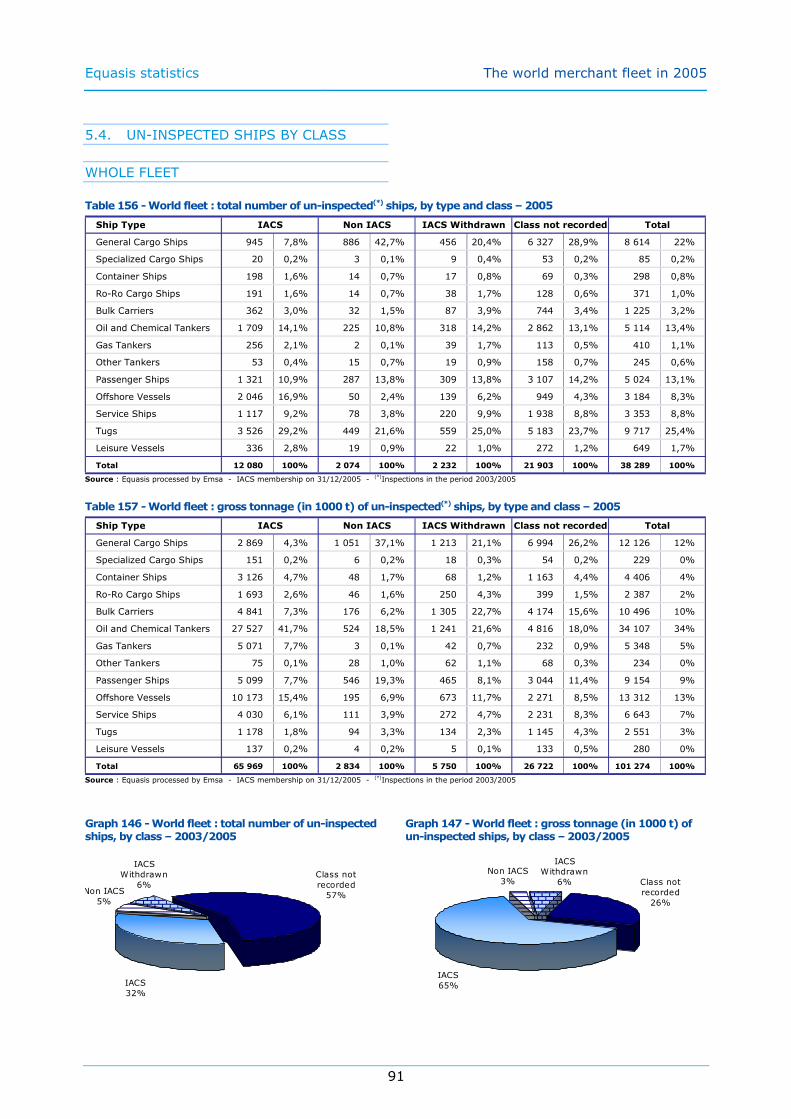
Equasis statistics The world merchant fleet in 2005
91
5.4. UN-INSPECTED SHIPS BY CLASS
WHOLE FLEET
Table 156 - World fleet : total number of un-inspected(*) ships, by type and class – 2005
Ship Type
General Cargo Ships 945 7,8% 886 42,7% 456 20,4% 6 327 28,9% 8 614 22%
Specialized Cargo Ships 20 0,2% 3 0,1% 9 0,4% 53 0,2% 85 0,2%
Container Ships 198 1,6% 14 0,7% 17 0,8% 69 0,3% 298 0,8%
Ro-Ro Cargo Ships 191 1,6% 14 0,7% 38 1,7% 128 0,6% 371 1,0%
Bulk Carriers 362 3,0% 32 1,5% 87 3,9% 744 3,4% 1 225 3,2%
Oil and Chemical Tankers 1 709 14,1% 225 10,8% 318 14,2% 2 862 13,1% 5 114 13,4%
Gas Tankers 256 2,1% 2 0,1% 39 1,7% 113 0,5% 410 1,1%
Other Tankers 53 0,4% 15 0,7% 19 0,9% 158 0,7% 245 0,6%
Passenger Ships 1 321 10,9% 287 13,8% 309 13,8% 3 107 14,2% 5 024 13,1%
Offshore Vessels 2 046 16,9% 50 2,4% 139 6,2% 949 4,3% 3 184 8,3%
Service Ships 1 117 9,2% 78 3,8% 220 9,9% 1 938 8,8% 3 353 8,8%
Tugs 3 526 29,2% 449 21,6% 559 25,0% 5 183 23,7% 9 717 25,4%
Leisure Vessels 336 2,8% 19 0,9% 22 1,0% 272 1,2% 649 1,7%
Total 12 080 100% 2 074 100% 2 232 100% 21 903 100% 38 289 100%
Class not recordedIACS Non IACS TotalIACS Withdrawn
Source : Equasis processed by Emsa - IACS membership on 31/12/2005 - (*)Inspections in the period 2003/2005
Table 157 - World fleet : gross tonnage (in 1000 t) of un-inspected(*) ships, by type and class – 2005
Ship Type
General Cargo Ships 2 869 4,3% 1 051 37,1% 1 213 21,1% 6 994 26,2% 12 126 12%
Specialized Cargo Ships 151 0,2% 6 0,2% 18 0,3% 54 0,2% 229 0%
Container Ships 3 126 4,7% 48 1,7% 68 1,2% 1 163 4,4% 4 406 4%
Ro-Ro Cargo Ships 1 693 2,6% 46 1,6% 250 4,3% 399 1,5% 2 387 2%
Bulk Carriers 4 841 7,3% 176 6,2% 1 305 22,7% 4 174 15,6% 10 496 10%
Oil and Chemical Tankers 27 527 41,7% 524 18,5% 1 241 21,6% 4 816 18,0% 34 107 34%
Gas Tankers 5 071 7,7% 3 0,1% 42 0,7% 232 0,9% 5 348 5%
Other Tankers 75 0,1% 28 1,0% 62 1,1% 68 0,3% 234 0%
Passenger Ships 5 099 7,7% 546 19,3% 465 8,1% 3 044 11,4% 9 154 9%
Offshore Vessels 10 173 15,4% 195 6,9% 673 11,7% 2 271 8,5% 13 312 13%
Service Ships 4 030 6,1% 111 3,9% 272 4,7% 2 231 8,3% 6 643 7%
Tugs 1 178 1,8% 94 3,3% 134 2,3% 1 145 4,3% 2 551 3%
Leisure Vessels 137 0,2% 4 0,2% 5 0,1% 133 0,5% 280 0%
Total 65 969 100% 2 834 100% 5 750 100% 26 722 100% 101 274 100%
TotalIACS Non IACS IACS Withdrawn Class not recorded
Source : Equasis processed by Emsa - IACS membership on 31/12/2005 - (*)Inspections in the period 2003/2005
Graph 146 - World fleet : total number of un-inspected ships, by class – 2003/2005
Class not
recorded
57%
IACS
32%
IACS
Withdrawn
6%Non IACS
5%
Graph 147 - World fleet : gross tonnage (in 1000 t) of un-inspected ships, by class – 2003/2005
Class not
recorded
26%
IACS
65%
IACS
Withdrawn
6%
Non IACS
3%

Equasis statistics The world merchant fleet in 2005
92
SMALL SHIPS
Table 158 - Total number of small(1) un-inspected(*) ships, by type class – 2005
Ship Type
General Cargo Ships 236 4,2% 457 39,6% 102 9,5% 3 947 25,9% 4 742 21%
Specialized Cargo Ships 1 0,0% 2 0,2% 25 0,2% 28 0%
Container Ships
Ro-Ro Cargo Ships 8 0,1% 1 0,1% 21 0,1% 30 0%
Bulk Carriers 4 0,1% 5 0,4% 5 0,5% 415 2,7% 429 2%
Oil and Chemical Tankers 223 4,0% 44 3,8% 70 6,5% 1 642 10,8% 1 979 9%
Gas Tankers 9 0,2% 0 0,0% 5 0,5% 32 0,2% 46 0%
Other Tankers 16 0,3% 6 0,5% 4 0,4% 121 0,8% 147 1%
Passenger Ships 615 11,1% 137 11,9% 176 16,4% 2 068 13,6% 2 996 13%
Offshore Vessels 523 9,4% 19 1,6% 55 5,1% 628 4,1% 1 225 5%
Service Ships 478 8,6% 25 2,2% 103 9,6% 1 130 7,4% 1 736 8%
Tugs 3 200 57,6% 442 38,3% 530 49,4% 5 001 32,8% 9 173 40%
Leisure Vessels 245 4,4% 18 1,6% 20 1,9% 221 1,4% 504 2%
Total 5 558 100% 1 154 100% 1 072 100% 15 251 100% 23 035 100%
Class not recordedIACS Non IACS TotalIACS Withdrawn
Source : Equasis processed by Emsa - (1) GT<500 - IACS membership on 31/12/2005 - (*)Inspections in the period 2003/2005
Table 159 - Gross tonnage (in 1000 t) of small(1) un-inspected(*) ships, by type and class – 2005
Ship Type
General Cargo Ships 72 4,9% 142 46,9% 31 12,0% 1 248 31,1% 1 493 25%
Specialized Cargo Ships 0 0,0% 1 0,3% 10 0,2% 10 0%
Container Ships
Ro-Ro Cargo Ships 3 0,2% 0 0,1% 8 0,2% 11 0%
Bulk Carriers 2 0,1% 2 0,7% 2 0,8% 157 3,9% 163 3%
Oil and Chemical Tankers 82 5,6% 15 4,9% 26 10,1% 512 12,8% 635 10%
Gas Tankers 4 0,3% 2 0,8% 11 0,3% 16 0%
Other Tankers 5 0,3% 2 0,6% 1 0,4% 32 0,8% 39 1%
Passenger Ships 170 11,5% 38 12,6% 44 16,9% 492 12,3% 744 12%
Offshore Vessels 157 10,6% 5 1,6% 15 5,7% 169 4,2% 345 6%
Service Ships 114 7,7% 5 1,7% 23 8,9% 309 7,7% 451 7%
Tugs 832 56,3% 90 29,6% 110 42,6% 1 009 25,1% 2 041 34%
Leisure Vessels 36 2,4% 4 1,2% 4 1,4% 57 1,4% 101 2%
Total 1 477 100% 304 100% 258 100% 4 013 100% 6 051 100%
TotalIACS Non IACS IACS Withdrawn Class not recorded
Source : Equasis processed by Emsa - (1) GT<500 - IACS membership on 31/12/2005 - (*)Inspections in the period 2003/2005
Graph 148 - Total number of small un-inspected ships, by class – 2003/2005
Non IACS
5%
IACS
Withdrawn
5%
IACS
24%
Class not
recorded
66%
Graph 149 - Gross tonnage (in 1000 t) of small un-inspected ships, by class – 2003/2005
Class not
recorded
67%
IACS
24%
IACS
Withdrawn
4%Non IACS
5%

Equasis statistics The world merchant fleet in 2005
93
MEDIUM SHIPS
Table 160 - Total number of medium(1) un-inspected(*) ships, by type and class– 2005
Ship Type
General Cargo Ships 707 11,9% 429 46,9% 354 31,4% 2 380 36,3% 3 870 27%
Specialized Cargo Ships 17 0,3% 3 0,3% 7 0,6% 28 0,4% 55 0,4%
Container Ships 165 2,8% 14 1,5% 17 1,5% 56 0,9% 252 1,7%
Ro-Ro Cargo Ships 171 2,9% 13 1,4% 36 3,2% 105 1,6% 325 2,2%
Bulk Carriers 297 5,0% 25 2,7% 69 6,1% 297 4,5% 688 4,7%
Oil and Chemical Tankers 1 226 20,6% 181 19,8% 237 21,0% 1 198 18,3% 2 842 19,6%
Gas Tankers 198 3,3% 2 0,2% 34 3,0% 79 1,2% 313 2,2%
Other Tankers 37 0,6% 9 1,0% 15 1,3% 37 0,6% 98 0,7%
Passenger Ships 662 11,1% 149 16,3% 131 11,6% 1 037 15,8% 1 979 13,6%
Offshore Vessels 1 436 24,2% 29 3,2% 79 7,0% 299 4,6% 1 843 12,7%
Service Ships 609 10,2% 53 5,8% 117 10,4% 803 12,3% 1 582 10,9%
Tugs 326 5,5% 7 0,8% 29 2,6% 182 2,8% 544 3,7%
Leisure Vessels 91 1,5% 1 0,1% 2 0,2% 51 0,8% 145 1,0%
Total 5 942 100% 915 100% 1 127 100% 6 552 100% 14 536 100%
Class not recordedIACS Non IACS TotalIACS Withdrawn
Source : Equasis processed by Emsa - (1) 500≤GT<25.000 - IACS membership on 31/12/2005 - (*)Inspections in the period 2003/2005
Table 161 - Gross tonnage (in 1000 t) of medium(1) un-inspected(*) ships, by type and class – 2005
Ship Type
General Cargo Ships 2 744 11,9% 908 39,8% 1 183 30,8% 5 746 34,5% 10 580 23%
Specialized Cargo Ships 74 0,3% 6 0,3% 18 0,5% 45 0,3% 142 0%
Container Ships 1 888 8,2% 48 2,1% 68 1,8% 239 1,4% 2 244 5%
Ro-Ro Cargo Ships 1 207 5,2% 46 2,0% 164 4,3% 304 1,8% 1 721 4%
Bulk Carriers 2 232 9,7% 114 5,0% 895 23,3% 2 756 16,6% 5 997 13%
Oil and Chemical Tankers 5 530 24,0% 509 22,3% 627 16,4% 2 459 14,8% 9 126 20%
Gas Tankers 557 2,4% 3 0,1% 40 1,0% 83 0,5% 683 1%
Other Tankers 70 0,3% 27 1,2% 62 1,6% 36 0,2% 194 0%
Passenger Ships 3 366 14,6% 480 21,1% 354 9,2% 2 499 15,0% 6 699 15%
Offshore Vessels 2 360 10,2% 26 1,2% 152 4,0% 494 3,0% 3 033 7%
Service Ships 2 556 11,1% 106 4,6% 249 6,5% 1 765 10,6% 4 676 10%
Tugs 346 1,5% 5 0,2% 24 0,6% 136 0,8% 510 1%
Leisure Vessels 101 0,4% 1 0,0% 2 0,0% 76 0,5% 179 0%
Total 23 031 100% 2 279 100% 3 836 100% 16 638 100% 45 785 100%
TotalIACS Non IACS IACS Withdrawn Class not recorded
Source : Equasis processed by Emsa - (1) 500≤GT<25.000 - IACS membership on 31/12/2005 - (*)Inspections in the period 2003/2005
Graph 150 - Total number of medium un-inspected ships, by class – 2003/2005
Non IACS
6%
IACS
Withdrawn
8%
IACS
41%
Class not
recorded
45%
Graph 151 - Gross tonnage (in 1000 t) of medium un-inspected ships, by class – 2003/2005
Non IACS
5%
IACS
Withdrawn
8%IACS
51%Class not
recorded
36%

Equasis statistics The world merchant fleet in 2005
94
LARGE SHIPS
Table 162 - Total number of large(1) un-inspected(*) ships, by type and class – 2005
Ship Type
General Cargo Ships 2 0,6% 2 0,5%
Specialized Cargo Ships 2 0,6% 2 0,5%
Container Ships 31 9,4% 5 8,1% 36 8,5%
Ro-Ro Cargo Ships 10 3,0% 2 7,4% 2 3,2% 14 3,3%
Bulk Carriers 52 15,8% 2 67% 13 48,1% 29 46,8% 96 22,7%
Oil and Chemical Tankers 128 38,8% 9 33,3% 10 16,1% 147 34,8%
Gas Tankers 11 3,3% 1 1,6% 12 2,8%
Other Tankers
Passenger Ships 43 13,0% 1 33% 2 7,4% 2 3,2% 48 11,4%
Offshore Vessels 28 8,5% 1 3,7% 8 12,9% 37 8,8%
Service Ships 23 7,0% 5 8,1% 28 6,6%
Tugs
Leisure Vessels
Total 330 100% 3 100% 27 100% 62 100% 422 100%
Class not recordedIACS Non IACS TotalIACS Withdrawn
Source : Equasis processed by Emsa - (1) 25.000≤GT<60.000 - IACS membership on 31/12/2005 - (*)Inspections in the period 2003/2005
Table 163 - Gross tonnage (in 1000 t) of large(1) un-inspected(*) ships, by type and class – 2005
Ship Type
General Cargo Ships 53 0,4% 53 0%
Specialized Cargo Ships 76 0,6% 76 0%
Container Ships 1 048 8,5% 179 8,0% 1 227 8%
Ro-Ro Cargo Ships 352 2,8% 86 8,7% 87 3,9% 524 3%
Bulk Carriers 1 760 14,3% 60 69% 409 41,5% 1 005 44,8% 3 233 21%
Oil and Chemical Tankers 4 962 40,2% 375 38,1% 381 17,0% 5 719 37%
Gas Tankers 471 3,8% 41 1,8% 512 3%
Other Tankers
Passenger Ships 1 482 12,0% 27 31% 68 6,9% 53 2,4% 1 630 10%
Offshore Vessels 1 281 10,4% 47 4,8% 341 15,2% 1 669 11%
Service Ships 864 7,0% 156 7,0% 1 021 7%
Tugs
Leisure Vessels
Total 12 349 100% 87 100% 985 100% 2 243 100% 15 664 100%
TotalIACS Non IACS IACS Withdrawn Class not recorded
Source : Equasis processed by Emsa - (1) 25.000≤GT<60.000 - IACS membership on 31/12/2005 - (*)Inspections in the period 2003/2005
Graph 152 - Total number of large un-inspected ships, by classification societies – 2003/2005
Non IACS
1%
IACS
Withdrawn
6%
IACS
78%
Class not
recorded
15%
Graph 153 - Gross tonnage (in 1000 t) of large un-inspected ships, by class – 2003/2005
Class not
recorded
14%
IACS
79%
IACS
Withdrawn
6%
Non IACS
1%
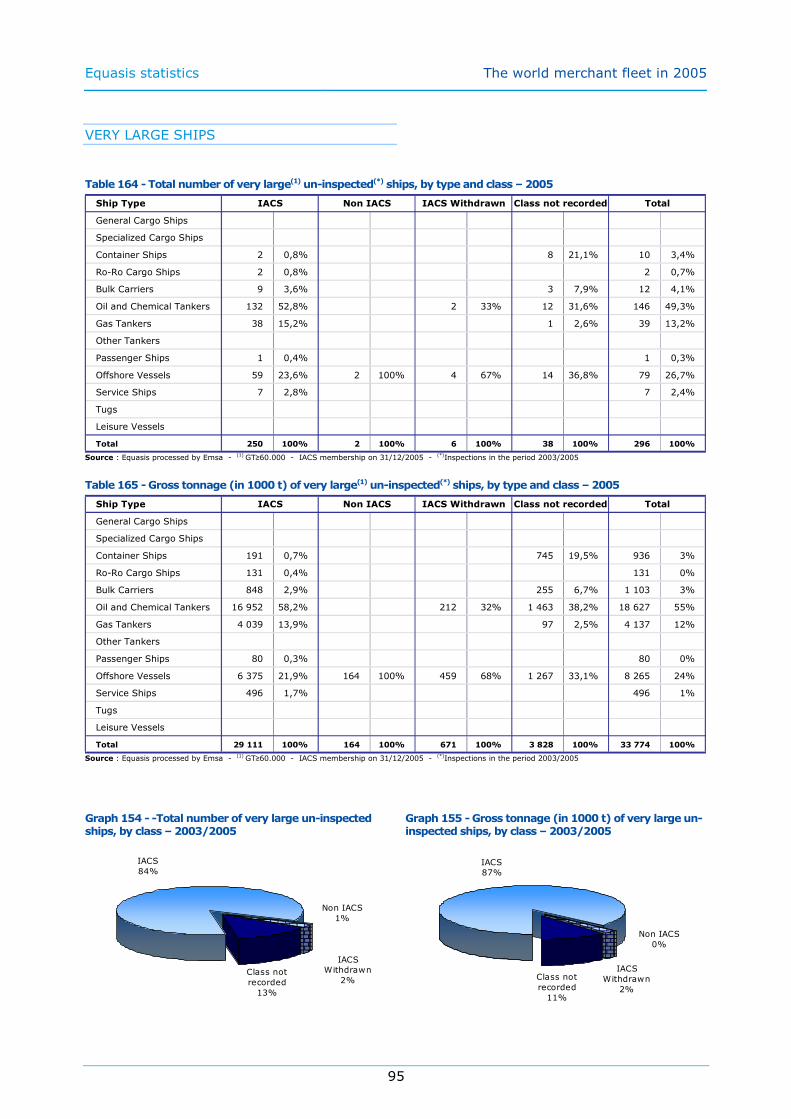
Equasis statistics The world merchant fleet in 2005
95
VERY LARGE SHIPS
Table 164 - Total number of very large(1) un-inspected(*) ships, by type and class – 2005
Ship Type
General Cargo Ships
Specialized Cargo Ships
Container Ships 2 0,8% 8 21,1% 10 3,4%
Ro-Ro Cargo Ships 2 0,8% 2 0,7%
Bulk Carriers 9 3,6% 3 7,9% 12 4,1%
Oil and Chemical Tankers 132 52,8% 2 33% 12 31,6% 146 49,3%
Gas Tankers 38 15,2% 1 2,6% 39 13,2%
Other Tankers
Passenger Ships 1 0,4% 1 0,3%
Offshore Vessels 59 23,6% 2 100% 4 67% 14 36,8% 79 26,7%
Service Ships 7 2,8% 7 2,4%
Tugs
Leisure Vessels
Total 250 100% 2 100% 6 100% 38 100% 296 100%
Class not recordedIACS Non IACS TotalIACS Withdrawn
Source : Equasis processed by Emsa - (1) GT≥60.000 - IACS membership on 31/12/2005 - (*)Inspections in the period 2003/2005
Table 165 - Gross tonnage (in 1000 t) of very large(1) un-inspected(*) ships, by type and class – 2005
Ship Type
General Cargo Ships
Specialized Cargo Ships
Container Ships 191 0,7% 745 19,5% 936 3%
Ro-Ro Cargo Ships 131 0,4% 131 0%
Bulk Carriers 848 2,9% 255 6,7% 1 103 3%
Oil and Chemical Tankers 16 952 58,2% 212 32% 1 463 38,2% 18 627 55%
Gas Tankers 4 039 13,9% 97 2,5% 4 137 12%
Other Tankers
Passenger Ships 80 0,3% 80 0%
Offshore Vessels 6 375 21,9% 164 100% 459 68% 1 267 33,1% 8 265 24%
Service Ships 496 1,7% 496 1%
Tugs
Leisure Vessels
Total 29 111 100% 164 100% 671 100% 3 828 100% 33 774 100%
TotalIACS Non IACS IACS Withdrawn Class not recorded
Source : Equasis processed by Emsa - (1) GT≥60.000 - IACS membership on 31/12/2005 - (*)Inspections in the period 2003/2005
Graph 154 - -Total number of very large un-inspected ships, by class – 2003/2005
Non IACS
1%
IACS
Withdrawn
2%
IACS
84%
Class not
recorded
13%
Graph 155 - Gross tonnage (in 1000 t) of very large un-inspected ships, by class – 2003/2005
Class not
recorded
11%
IACS
87%
IACS
Withdrawn
2%
Non IACS
0%

Equasis statistics The world merchant fleet in 2005
96
5.5. SHIP INSPECTIONS BY FLAG
WHOLE FLEET
Table 166 - World fleet : total number of inspected(*) ships, by type and flag – 2005
Ship Type
General Cargo Ships 86 43,0% 1 491 29,6% 1 577 30,1% 63 14,8% 3 251 18,1% 3 314 18%
Specialized Cargo Ships 2 1,0% 14 0,3% 16 0,3% 14 0,1% 14 0%
Container Ships
Ro-Ro Cargo Ships 2 1,0% 8 0,2% 10 0,2% 1 0,2% 22 0,1% 23 0%
Bulk Carriers 2 1,0% 50 1,0% 52 1,0% 3 0,7% 379 2,1% 382 2%
Oil and Chemical Tankers 18 9,0% 357 7,1% 375 7,2% 16 3,8% 1 622 9,0% 1 638 9%
Gas Tankers 0 0,0% 5 0,1% 5 0,1% 3 0,7% 41 0,2% 44 0%
Other Tankers 2 1,0% 39 0,8% 41 0,8% 2 0,5% 108 0,6% 110 1%
Passenger Ships 34 17,0% 434 8,6% 468 8,9% 60 14,1% 2 562 14,2% 2 622 14%
Offshore Vessels 11 5,5% 287 5,7% 298 5,7% 22 5,2% 938 5,2% 960 5%
Service Ships 11 5,5% 267 5,3% 278 5,3% 37 8,7% 1 469 8,2% 1 506 8%
Tugs 32 16,0% 2 048 40,7% 2 080 39,8% 212 49,9% 7 125 39,6% 7 337 40%
Leisure Vessels 32 0,6% 32 0,6% 6 1,4% 472 2,6% 478 3%
Total 200 100% 5 032 100% 5 232 100% 425 100% 18 003 100% 18 428 100%
Black flag Non black flag
Non inspectedInspected Non inspected TotalInspectedTotal
Source : Equasis processed by Emsa - (*)Inspections in the period 2003/2005
Table 167 - World fleet : gross tonnage (in 1000 t) of inspected(*) ships, by type and flag – 2005
Ship Type
General Cargo Ships 13 465 8,9% 4 517 18,2% 17 982 10% 25 490 6,7% 7 610 9,9% 33 100 7%
Specialized Cargo Ships 383 0,3% 56 0,2% 438 0% 787 0,2% 173 0,2% 960 0%
Container Ships 21 196 14,0% 673 2,7% 21 869 12% 58 176 15,2% 3 733 4,9% 61 909 13%
Ro-Ro Cargo Ships 11 289 7,5% 439 1,8% 11 728 7% 16 258 4,3% 1 948 2,5% 18 206 4%
Bulk Carriers 64 243 42,5% 2 482 10,0% 66 725 38% 103 120 27,0% 8 014 10,5% 111 134 24%
Oil and Chemical Tankers 30 146 20,0% 10 284 41,5% 40 429 23% 134 290 35,1% 23 823 31,1% 158 114 34%
Gas Tankers 4 915 3,3% 464 1,9% 5 379 3% 19 073 5,0% 4 884 6,4% 23 957 5%
Other Tankers 83 0,1% 86 0,3% 169 0% 468 0,1% 148 0,2% 616 0%
Passenger Ships 2 521 1,7% 1 182 4,8% 3 702 2% 14 871 3,9% 7 972 10,4% 22 843 5%
Offshore Vessels 2 532 1,7% 3 214 13,0% 5 746 3% 7 518 2,0% 10 098 13,2% 17 616 4%
Service Ships 202 0,1% 788 3,2% 990 1% 1 880 0,5% 5 856 7,7% 7 735 2%
Tugs 47 0,0% 550 2,2% 598 0% 154 0,0% 2 001 2,6% 2 155 0%
Leisure Vessels 2 0,0% 20 0,1% 22 0% 7 0,0% 259 0,3% 266 0%
Total 151 024 100% 24 754 100% 175 777 100% 382 091 100% 76 520 100% 458 611 100%
Non inspected TotalInspected Non inspected Total Inspected
Black flag Non black flag
Source : Equasis processed by Emsa - (*)Inspections in the period 2003/2005
Graph 156 - World fleet : total number of inspected ships, by flag – 2003/2005
Black Non
Inspected
15%
Non Black
Inspected
25%
Black
Inspected
13%
Non Black
Non
Inspected
47%
Graph 157 - World fleet : gross tonnage (in 1000 t) of inspected ships, by flag – 2003/2005
Non Black
Non
Inspected
12%
Black
Inspected
24%
Non Black
Inspected
60%
Black Non
Inspected
4%

Equasis statistics The world merchant fleet in 2005
97
SMALL SHIPS
Table 168 - Total number of small(1) inspected(*) ships, by type and flag – 2005
Ship Type
General Cargo Ships 86 43,0% 1 491 29,6% 1 577 30,1% 63 14,8% 3 251 18,1% 3 314 18%
Specialized Cargo Ships 2 1,0% 14 0,3% 16 0,3% 14 0,1% 14 0%
Container Ships
Ro-Ro Cargo Ships 2 1,0% 8 0,2% 10 0,2% 1 0,2% 22 0,1% 23 0%
Bulk Carriers 2 1,0% 50 1,0% 52 1,0% 3 0,7% 379 2,1% 382 2%
Oil and Chemical Tankers 18 9,0% 357 7,1% 375 7,2% 16 3,8% 1 622 9,0% 1 638 9%
Gas Tankers 0 0,0% 5 0,1% 5 0,1% 3 0,7% 41 0,2% 44 0%
Other Tankers 2 1,0% 39 0,8% 41 0,8% 2 0,5% 108 0,6% 110 1%
Passenger Ships 34 17,0% 434 8,6% 468 8,9% 60 14,1% 2 562 14,2% 2 622 14%
Offshore Vessels 11 5,5% 287 5,7% 298 5,7% 22 5,2% 938 5,2% 960 5%
Service Ships 11 5,5% 267 5,3% 278 5,3% 37 8,7% 1 469 8,2% 1 506 8%
Tugs 32 16,0% 2 048 40,7% 2 080 39,8% 212 49,9% 7 125 39,6% 7 337 40%
Leisure Vessels 32 0,6% 32 0,6% 6 1,4% 472 2,6% 478 3%
Total 200 100% 5 032 100% 5 232 100% 425 100% 18 003 100% 18 428 100%
Black flag Non black flag
Non inspectedInspected Non inspected TotalInspectedTotal
Source : Equasis processed by Emsa - (1) GT<500 - (*)Inspections in the period 2003/2005
Table 169 - Gross tonnage (in 1000 t) of small(1) inspected(*) ships, by type and flag – 2005
Ship Type
General Cargo Ships 36 49,2% 467 34,2% 503 35% 23 17,9% 1 026 21,9% 1 049 22%
Specialized Cargo Ships 1 1,4% 6 0,4% 7 0% 5 0,1% 5 0%
Container Ships
Ro-Ro Cargo Ships 1 1,4% 3 0,2% 4 0% 0 0,4% 8 0,2% 9 0%
Bulk Carriers 1 20 1,4% 20 1% 1 0,9% 143 3,1% 145 3%
Oil and Chemical Tankers 8 11,3% 123 9,0% 131 9% 7 5,5% 513 10,9% 520 11%
Gas Tankers 2 0,2% 2 0% 1 1,2% 14 0,3% 16 0%
Other Tankers 1 1,4% 10 0,8% 11 1% 1 0,5% 29 0,6% 29 1%
Passenger Ships 9 12,3% 114 8,3% 123 9% 18 14,0% 631 13,5% 649 13%
Offshore Vessels 3 4,8% 85 6,2% 88 6% 8 6,3% 260 5,6% 268 6%
Service Ships 4 5,0% 70 5,1% 73 5% 8 6,3% 382 8,1% 390 8%
Tugs 9 12,0% 460 33,6% 468 33% 60 46,6% 1 581 33,8% 1 641 34%
Leisure Vessels 9 0,7% 9 1% 1 0,5% 91 1,9% 92 2%
Total 72 99% 1 368 100% 1 440 100% 128 100% 4 683 100% 4 811 100%
Black flag Non black flag
Non inspected TotalInspected Non inspected Total Inspected
Source : Equasis processed by Emsa - (1) GT<500 - (*)Inspections in the period 2003/2005
Graph 158 - Total number of small inspected ships, by flag – 2003/2005
Black Non
Inspected
21%
Non Black
Inspected
2%
Black
Inspected
1%
Non Black
Non
Inspected
76%
Graph 159 - Gross tonnage (in 1000 t) of small inspected ships, by flag – 2003/2005
Non Black
Non
Inspected
75%
Black
Inspected
1%
Non Black
Inspected
2% Black Non
Inspected
22%

Equasis statistics The world merchant fleet in 2005
98
MEDIUM SHIPS
Table 170 - Total number of medium(1) inspected(*) ships, by type and flag– 2005
Ship Type
General Cargo Ships 3 050 54,8% 1 646 39,7% 4 696 48,3% 3 878 40,4% 2 224 21,4% 6 102 31%
Specialized Cargo Ships 27 0,5% 27 0,7% 54 0,6% 62 0,6% 28 0,3% 90 0%
Container Ships 384 6,9% 60 1,4% 444 4,6% 1 018 10,6% 192 1,8% 1 210 6%
Ro-Ro Cargo Ships 184 3,3% 90 2,2% 274 2,8% 355 3,7% 235 2,3% 590 3%
Bulk Carriers 911 16,4% 116 2,8% 1 027 10,6% 1 377 14,3% 572 5,5% 1 949 10%
Oil and Chemical Tankers 610 11,0% 930 22,4% 1 540 15,8% 1 514 15,8% 1 912 18,4% 3 426 17%
Gas Tankers 125 2,2% 84 2,0% 209 2,2% 285 3,0% 229 2,2% 514 3%
Other Tankers 30 0,5% 29 0,7% 59 0,6% 68 0,7% 69 0,7% 137 1%
Passenger Ships 76 1,4% 337 8,1% 413 4,2% 331 3,4% 1 642 15,8% 1 973 10%
Offshore Vessels 74 1,3% 438 10,6% 512 5,3% 393 4,1% 1 405 13,5% 1 798 9%
Service Ships 65 1,2% 278 6,7% 343 3,5% 254 2,6% 1 304 12,6% 1 558 8%
Tugs 32 0,6% 102 2,5% 134 1,4% 68 0,7% 442 4,3% 510 3%
Leisure Vessels 1 0,0% 12 0,3% 13 0,1% 2 0,0% 133 1,3% 135 1%
Total 5 569 100% 4 149 100% 9 718 100% 9 605 100% 10 387 100% 19 992 100%
Black flag Non black flag
Non inspectedInspected Non inspected TotalInspectedTotal
Source : Equasis processed by Emsa - (1) 500≤GT<25.000 - (*)Inspections in the period 2003/2005
Table 171 - Gross tonnage (in 1000 t) of medium(1) inspected(*) ships, by type and flag – 2005
Ship Type
General Cargo Ships 13 141 33,7% 4 049 34,4% 17 190 34% 20 539 24,7% 6 531 19,2% 27 070 23%
Specialized Cargo Ships 138 0,4% 50 0,4% 188 0% 523 0,6% 92 0,3% 615 1%
Container Ships 4 832 12,4% 405 3,4% 5 238 10% 12 507 15,0% 1 838 5,4% 14 345 12%
Ro-Ro Cargo Ships 1 776 4,5% 379 3,2% 2 155 4% 4 254 5,1% 1 342 3,9% 5 597 5%
Bulk Carriers 13 500 34,6% 1 046 8,9% 14 545 29% 22 867 27,4% 4 951 14,6% 27 818 24%
Oil and Chemical Tankers 3 772 9,7% 3 053 25,9% 6 825 13% 14 331 17,2% 6 073 17,9% 20 405 17%
Gas Tankers 654 1,7% 238 2,0% 893 2% 2 073 2,5% 445 1,3% 2 517 2%
Other Tankers 82 0,2% 75 0,6% 158 0% 371 0,4% 119 0,4% 490 0%
Passenger Ships 742 1,9% 1 068 9,1% 1 810 4% 3 433 4,1% 5 631 16,6% 9 064 8%
Offshore Vessels 163 0,4% 646 5,5% 809 2% 1 054 1,3% 2 387 7,0% 3 441 3%
Service Ships 199 0,5% 655 5,6% 854 2% 1 253 1,5% 4 021 11,8% 5 273 4%
Tugs 39 0,1% 90 0,8% 129 0% 95 0,1% 420 1,2% 514 0%
Leisure Vessels 2 0,0% 11 0,1% 12 0% 6 0,0% 168 0,5% 174 0%
Total 39 039 100% 11 766 100% 50 806 100% 83 306 100% 34 019 100% 117 325 100%
Non inspected TotalInspected Non inspected Total Inspected
Black flag Non black flag
Source : Equasis processed by Emsa - (1) 500≤GT<25.000 - (*)Inspections in the period 2003/2005
Graph 160 - Total number of medium inspected ships, by flag – 2003/2005
Black Non
Inspected
14%
Non Black
Inspected
32%
Black
Inspected
19%
Non Black
Non
Inspected
35%
Graph 161 - Gross tonnage (in 1000 t) of medium inspected ships, by flag – 2003/2005
Non Black
Non
Inspected
20%
Black
Inspected
23%
Non Black
Inspected
50%
Black Non
Inspected
7%
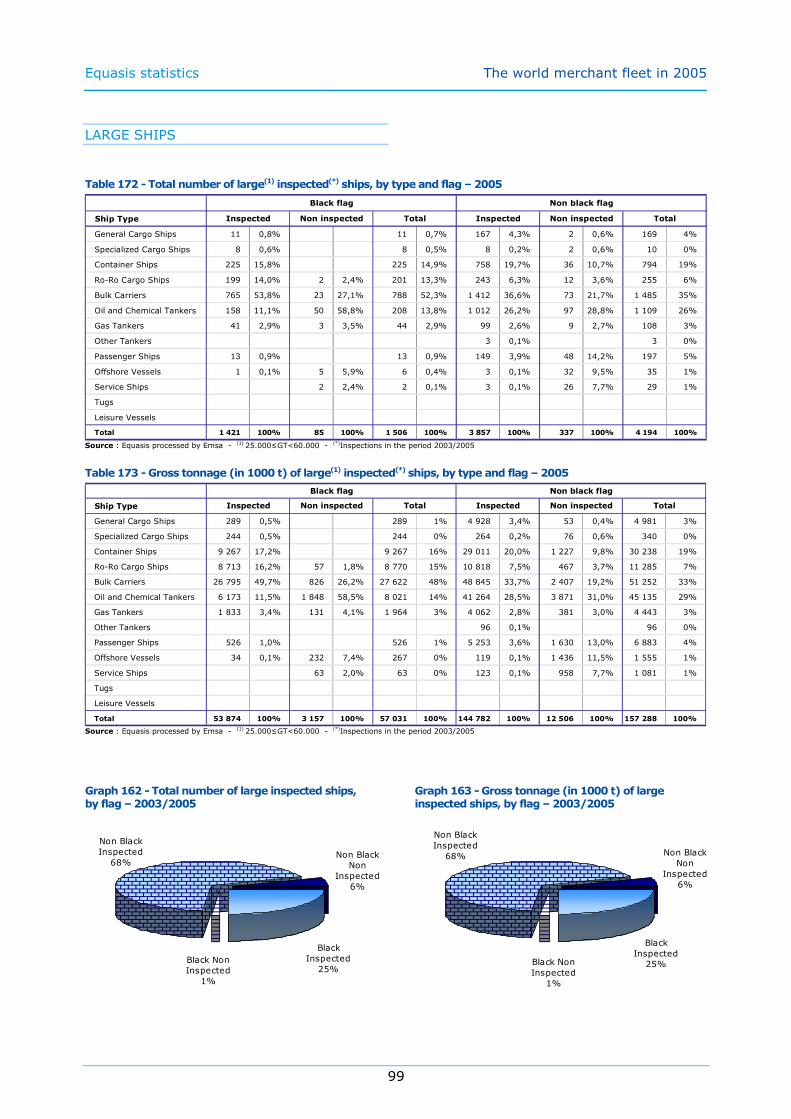
Equasis statistics The world merchant fleet in 2005
99
LARGE SHIPS
Table 172 - Total number of large(1) inspected(*) ships, by type and flag – 2005
Ship Type
General Cargo Ships 11 0,8% 11 0,7% 167 4,3% 2 0,6% 169 4%
Specialized Cargo Ships 8 0,6% 8 0,5% 8 0,2% 2 0,6% 10 0%
Container Ships 225 15,8% 225 14,9% 758 19,7% 36 10,7% 794 19%
Ro-Ro Cargo Ships 199 14,0% 2 2,4% 201 13,3% 243 6,3% 12 3,6% 255 6%
Bulk Carriers 765 53,8% 23 27,1% 788 52,3% 1 412 36,6% 73 21,7% 1 485 35%
Oil and Chemical Tankers 158 11,1% 50 58,8% 208 13,8% 1 012 26,2% 97 28,8% 1 109 26%
Gas Tankers 41 2,9% 3 3,5% 44 2,9% 99 2,6% 9 2,7% 108 3%
Other Tankers 3 0,1% 3 0%
Passenger Ships 13 0,9% 13 0,9% 149 3,9% 48 14,2% 197 5%
Offshore Vessels 1 0,1% 5 5,9% 6 0,4% 3 0,1% 32 9,5% 35 1%
Service Ships 2 2,4% 2 0,1% 3 0,1% 26 7,7% 29 1%
Tugs
Leisure Vessels
Total 1 421 100% 85 100% 1 506 100% 3 857 100% 337 100% 4 194 100%
Black flag Non black flag
Non inspectedInspected Non inspected TotalInspectedTotal
Source : Equasis processed by Emsa - (1) 25.000≤GT<60.000 - (*)Inspections in the period 2003/2005
Table 173 - Gross tonnage (in 1000 t) of large(1) inspected(*) ships, by type and flag – 2005
Ship Type
General Cargo Ships 289 0,5% 289 1% 4 928 3,4% 53 0,4% 4 981 3%
Specialized Cargo Ships 244 0,5% 244 0% 264 0,2% 76 0,6% 340 0%
Container Ships 9 267 17,2% 9 267 16% 29 011 20,0% 1 227 9,8% 30 238 19%
Ro-Ro Cargo Ships 8 713 16,2% 57 1,8% 8 770 15% 10 818 7,5% 467 3,7% 11 285 7%
Bulk Carriers 26 795 49,7% 826 26,2% 27 622 48% 48 845 33,7% 2 407 19,2% 51 252 33%
Oil and Chemical Tankers 6 173 11,5% 1 848 58,5% 8 021 14% 41 264 28,5% 3 871 31,0% 45 135 29%
Gas Tankers 1 833 3,4% 131 4,1% 1 964 3% 4 062 2,8% 381 3,0% 4 443 3%
Other Tankers 96 0,1% 96 0%
Passenger Ships 526 1,0% 526 1% 5 253 3,6% 1 630 13,0% 6 883 4%
Offshore Vessels 34 0,1% 232 7,4% 267 0% 119 0,1% 1 436 11,5% 1 555 1%
Service Ships 63 2,0% 63 0% 123 0,1% 958 7,7% 1 081 1%
Tugs
Leisure Vessels
Total 53 874 100% 3 157 100% 57 031 100% 144 782 100% 12 506 100% 157 288 100%
Black flag Non black flag
Non inspected TotalInspected Non inspected Total Inspected
Source : Equasis processed by Emsa - (1) 25.000≤GT<60.000 - (*)Inspections in the period 2003/2005
Graph 162 - Total number of large inspected ships, by flag – 2003/2005
Black Non
Inspected
1%
Non Black
Inspected
68%
Black
Inspected
25%
Non Black
Non
Inspected
6%
Graph 163 - Gross tonnage (in 1000 t) of large inspected ships, by flag – 2003/2005
Black Non
Inspected
1%
Non Black
Inspected
68%
Black
Inspected
25%
Non Black
Non
Inspected
6%

Equasis statistics The world merchant fleet in 2005
100
VERY LARGE SHIPS
Table 174 - Total number of very large(1) inspected(*) ships, by type and flag – 2005
Ship Type
General Cargo Ships
Specialized Cargo Ships
Container Ships 99 16,9% 3 4,3% 102 15,6% 224 14,3% 7 3,1% 231 13%
Ro-Ro Cargo Ships 13 2,2% 13 2,0% 18 1,2% 2 0,9% 20 1%
Bulk Carriers 271 46,3% 6 8,7% 277 42,4% 367 23,5% 6 2,6% 373 21%
Oil and Chemical Tankers 141 24,1% 38 55,1% 179 27,4% 693 44,3% 108 47,6% 801 45%
Gas Tankers 25 4,3% 1 1,4% 26 4,0% 131 8,4% 38 16,7% 169 9%
Other Tankers
Passenger Ships 14 2,4% 14 2,1% 71 4,5% 1 0,4% 72 4%
Offshore Vessels 22 3,8% 21 30,4% 43 6,6% 61 3,9% 58 25,6% 119 7%
Service Ships 7 3,1% 7 0%
Tugs
Leisure Vessels
Total 585 100% 69 100% 654 100% 1 565 100% 227 100% 1 792 100%
Black flag Non black flag
Non inspectedInspected Non inspected TotalInspectedTotal
Source : Equasis processed by Emsa - (1) GT≥60.000 - (*)Inspections in the period 2003/2005
Table 175 - Gross tonnage (in 1000 t) of very large(1) inspected(*) ships, by type and flag – 2005
Ship Type
General Cargo Ships
Specialized Cargo Ships
Container Ships 7 097 12,2% 268 3,2% 7 365 11% 16 658 10,9% 668 2,6% 17 326 10%
Ro-Ro Cargo Ships 800 1,4% 800 1% 1 185 0,8% 131 0,5% 1 316 1%
Bulk Carriers 23 947 41,3% 591 7,0% 24 538 37% 31 407 20,5% 512 2,0% 31 919 18%
Oil and Chemical Tankers 20 192 34,8% 5 260 62,2% 25 453 38% 78 688 51,3% 13 367 52,8% 92 054 52%
Gas Tankers 2 428 4,2% 93 1,1% 2 520 4% 12 937 8,4% 4 044 16,0% 16 981 10%
Other Tankers
Passenger Ships 1 243 2,1% 1 243 2% 6 167 4,0% 80 0,3% 6 248 3%
Offshore Vessels 2 331 4,0% 2 251 26,6% 4 582 7% 6 337 4,1% 6 014 23,8% 12 352 7%
Service Ships 496 2,0% 496 0%
Tugs
Leisure Vessels
Total 58 038 100% 8 462 100% 66 500 100% 153 380 100% 25 312 100% 178 692 100%
Non inspected TotalInspected Non inspected Total Inspected
Black flag Non black flag
Source : Equasis processed by Emsa - (1) GT≥60.000 - (*)Inspections in the period 2003/2005
Graph 164 - -Total number of very large inspected ships, by flag – 2003/2005
Black Non
Inspected
3%
Non Black
Inspected
64%
Black
Inspected
24%
Non Black
Non
Inspected
9%
Graph 165 - Gross tonnage (in 1000 t) of very large inspected ships, by flag – 2003/2005
Black Non
Inspected
3%
Non Black
Inspected
63%
Black
Inspected
24%
Non Black
Non
Inspected
10%
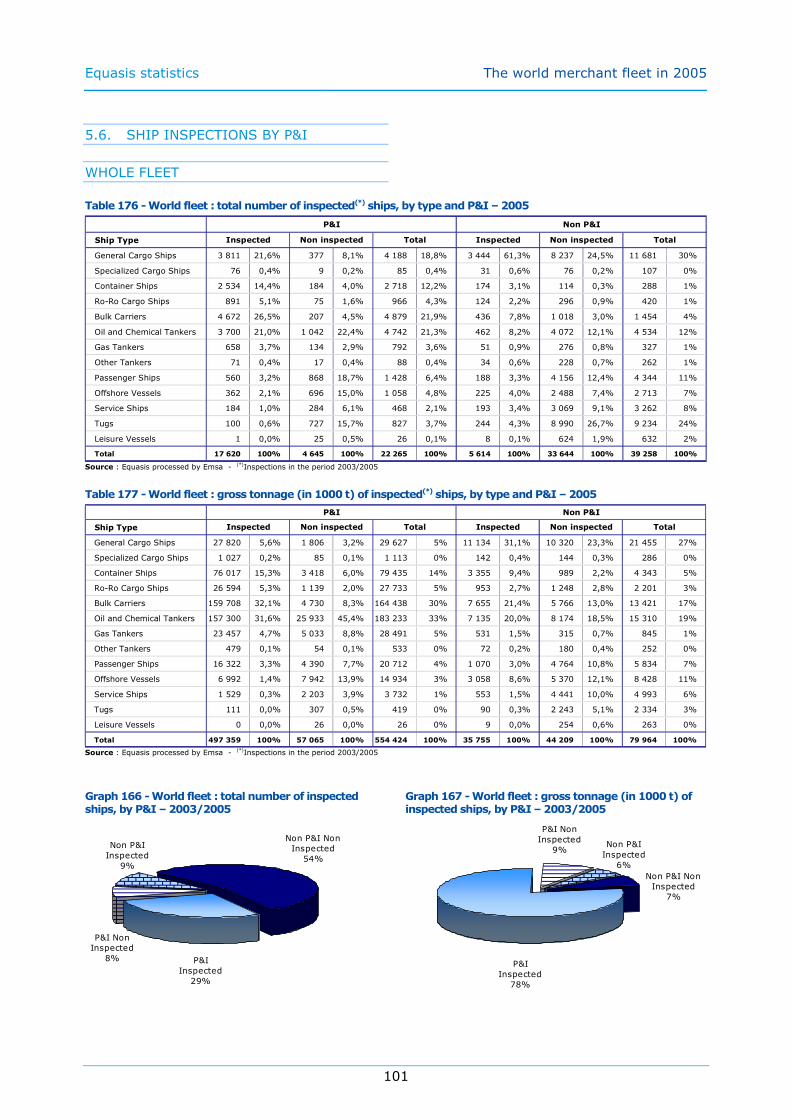
Equasis statistics The world merchant fleet in 2005
101
5.6. SHIP INSPECTIONS BY P&I
WHOLE FLEET
Table 176 - World fleet : total number of inspected(*) ships, by type and P&I – 2005
Ship Type
General Cargo Ships 3 811 21,6% 377 8,1% 4 188 18,8% 3 444 61,3% 8 237 24,5% 11 681 30%
Specialized Cargo Ships 76 0,4% 9 0,2% 85 0,4% 31 0,6% 76 0,2% 107 0%
Container Ships 2 534 14,4% 184 4,0% 2 718 12,2% 174 3,1% 114 0,3% 288 1%
Ro-Ro Cargo Ships 891 5,1% 75 1,6% 966 4,3% 124 2,2% 296 0,9% 420 1%
Bulk Carriers 4 672 26,5% 207 4,5% 4 879 21,9% 436 7,8% 1 018 3,0% 1 454 4%
Oil and Chemical Tankers 3 700 21,0% 1 042 22,4% 4 742 21,3% 462 8,2% 4 072 12,1% 4 534 12%
Gas Tankers 658 3,7% 134 2,9% 792 3,6% 51 0,9% 276 0,8% 327 1%
Other Tankers 71 0,4% 17 0,4% 88 0,4% 34 0,6% 228 0,7% 262 1%
Passenger Ships 560 3,2% 868 18,7% 1 428 6,4% 188 3,3% 4 156 12,4% 4 344 11%
Offshore Vessels 362 2,1% 696 15,0% 1 058 4,8% 225 4,0% 2 488 7,4% 2 713 7%
Service Ships 184 1,0% 284 6,1% 468 2,1% 193 3,4% 3 069 9,1% 3 262 8%
Tugs 100 0,6% 727 15,7% 827 3,7% 244 4,3% 8 990 26,7% 9 234 24%
Leisure Vessels 1 0,0% 25 0,5% 26 0,1% 8 0,1% 624 1,9% 632 2%
Total 17 620 100% 4 645 100% 22 265 100% 5 614 100% 33 644 100% 39 258 100%
P&I Non P&I
Non inspectedInspected Non inspected TotalInspectedTotal
Source : Equasis processed by Emsa - (*)Inspections in the period 2003/2005
Table 177 - World fleet : gross tonnage (in 1000 t) of inspected(*) ships, by type and P&I – 2005
Ship Type
General Cargo Ships 27 820 5,6% 1 806 3,2% 29 627 5% 11 134 31,1% 10 320 23,3% 21 455 27%
Specialized Cargo Ships 1 027 0,2% 85 0,1% 1 113 0% 142 0,4% 144 0,3% 286 0%
Container Ships 76 017 15,3% 3 418 6,0% 79 435 14% 3 355 9,4% 989 2,2% 4 343 5%
Ro-Ro Cargo Ships 26 594 5,3% 1 139 2,0% 27 733 5% 953 2,7% 1 248 2,8% 2 201 3%
Bulk Carriers 159 708 32,1% 4 730 8,3% 164 438 30% 7 655 21,4% 5 766 13,0% 13 421 17%
Oil and Chemical Tankers 157 300 31,6% 25 933 45,4% 183 233 33% 7 135 20,0% 8 174 18,5% 15 310 19%
Gas Tankers 23 457 4,7% 5 033 8,8% 28 491 5% 531 1,5% 315 0,7% 845 1%
Other Tankers 479 0,1% 54 0,1% 533 0% 72 0,2% 180 0,4% 252 0%
Passenger Ships 16 322 3,3% 4 390 7,7% 20 712 4% 1 070 3,0% 4 764 10,8% 5 834 7%
Offshore Vessels 6 992 1,4% 7 942 13,9% 14 934 3% 3 058 8,6% 5 370 12,1% 8 428 11%
Service Ships 1 529 0,3% 2 203 3,9% 3 732 1% 553 1,5% 4 441 10,0% 4 993 6%
Tugs 111 0,0% 307 0,5% 419 0% 90 0,3% 2 243 5,1% 2 334 3%
Leisure Vessels 0 0,0% 26 0,0% 26 0% 9 0,0% 254 0,6% 263 0%
Total 497 359 100% 57 065 100% 554 424 100% 35 755 100% 44 209 100% 79 964 100%
Non inspected TotalInspected Non inspected Total Inspected
P&I Non P&I
Source : Equasis processed by Emsa - (*)Inspections in the period 2003/2005
Graph 166 - World fleet : total number of inspected ships, by P&I – 2003/2005
P&I Non
Inspected
8%
Non P&I
Inspected
9%
P&I
Inspected
29%
Non P&I Non
Inspected
54%
Graph 167 - World fleet : gross tonnage (in 1000 t) of inspected ships, by P&I – 2003/2005
Non P&I Non
Inspected
7%
P&I
Inspected
78%
Non P&I
Inspected
6%
P&I Non
Inspected
9%
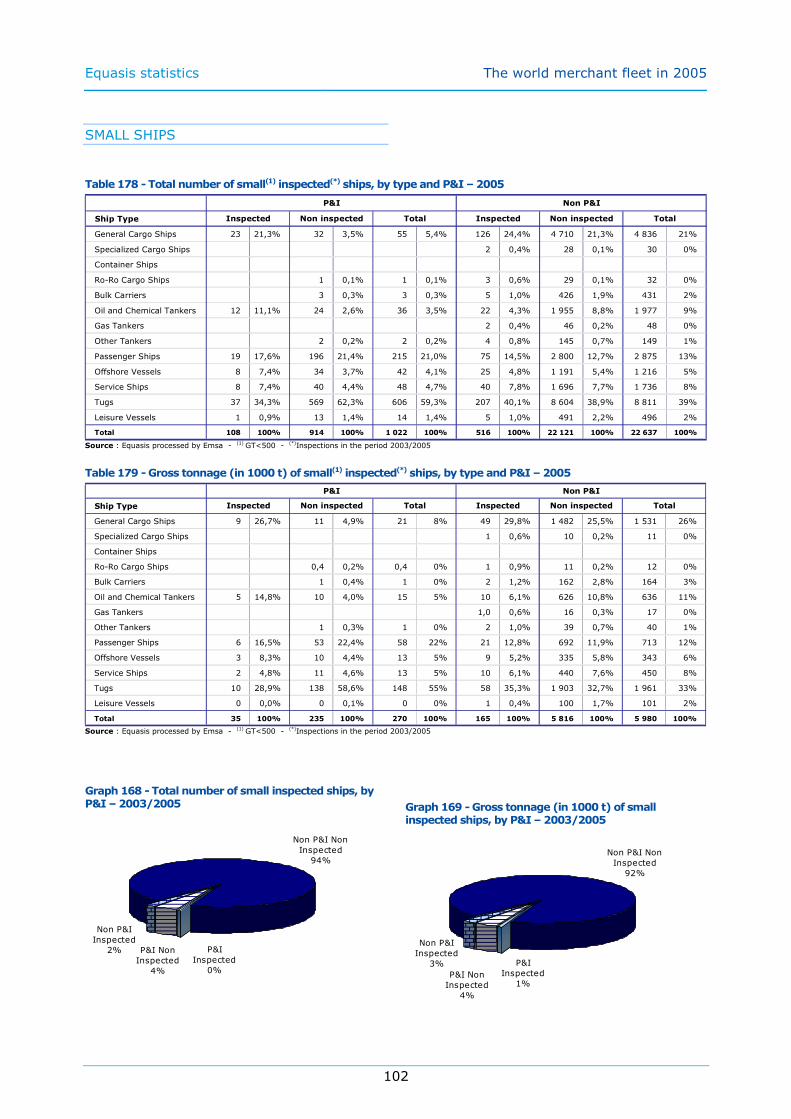
Equasis statistics The world merchant fleet in 2005
102
SMALL SHIPS
Table 178 - Total number of small(1) inspected(*) ships, by type and P&I – 2005
Ship Type
General Cargo Ships 23 21,3% 32 3,5% 55 5,4% 126 24,4% 4 710 21,3% 4 836 21%
Specialized Cargo Ships 2 0,4% 28 0,1% 30 0%
Container Ships
Ro-Ro Cargo Ships 1 0,1% 1 0,1% 3 0,6% 29 0,1% 32 0%
Bulk Carriers 3 0,3% 3 0,3% 5 1,0% 426 1,9% 431 2%
Oil and Chemical Tankers 12 11,1% 24 2,6% 36 3,5% 22 4,3% 1 955 8,8% 1 977 9%
Gas Tankers 2 0,4% 46 0,2% 48 0%
Other Tankers 2 0,2% 2 0,2% 4 0,8% 145 0,7% 149 1%
Passenger Ships 19 17,6% 196 21,4% 215 21,0% 75 14,5% 2 800 12,7% 2 875 13%
Offshore Vessels 8 7,4% 34 3,7% 42 4,1% 25 4,8% 1 191 5,4% 1 216 5%
Service Ships 8 7,4% 40 4,4% 48 4,7% 40 7,8% 1 696 7,7% 1 736 8%
Tugs 37 34,3% 569 62,3% 606 59,3% 207 40,1% 8 604 38,9% 8 811 39%
Leisure Vessels 1 0,9% 13 1,4% 14 1,4% 5 1,0% 491 2,2% 496 2%
Total 108 100% 914 100% 1 022 100% 516 100% 22 121 100% 22 637 100%
P&I Non P&I
Non inspectedInspected Non inspected TotalInspectedTotal
Source : Equasis processed by Emsa - (1) GT<500 - (*)Inspections in the period 2003/2005
Table 179 - Gross tonnage (in 1000 t) of small(1) inspected(*) ships, by type and P&I – 2005
Ship Type
General Cargo Ships 9 26,7% 11 4,9% 21 8% 49 29,8% 1 482 25,5% 1 531 26%
Specialized Cargo Ships 1 0,6% 10 0,2% 11 0%
Container Ships
Ro-Ro Cargo Ships 0,4 0,2% 0,4 0% 1 0,9% 11 0,2% 12 0%
Bulk Carriers 1 0,4% 1 0% 2 1,2% 162 2,8% 164 3%
Oil and Chemical Tankers 5 14,8% 10 4,0% 15 5% 10 6,1% 626 10,8% 636 11%
Gas Tankers 1,0 0,6% 16 0,3% 17 0%
Other Tankers 1 0,3% 1 0% 2 1,0% 39 0,7% 40 1%
Passenger Ships 6 16,5% 53 22,4% 58 22% 21 12,8% 692 11,9% 713 12%
Offshore Vessels 3 8,3% 10 4,4% 13 5% 9 5,2% 335 5,8% 343 6%
Service Ships 2 4,8% 11 4,6% 13 5% 10 6,1% 440 7,6% 450 8%
Tugs 10 28,9% 138 58,6% 148 55% 58 35,3% 1 903 32,7% 1 961 33%
Leisure Vessels 0 0,0% 0 0,1% 0 0% 1 0,4% 100 1,7% 101 2%
Total 35 100% 235 100% 270 100% 165 100% 5 816 100% 5 980 100%
P&I Non P&I
Non inspected TotalInspected Non inspected Total Inspected
Source : Equasis processed by Emsa - (1) GT<500 - (*)Inspections in the period 2003/2005
Graph 168 - Total number of small inspected ships, by P&I – 2003/2005
P&I Non
Inspected
4%
Non P&I
Inspected
2% P&I
Inspected
0%
Non P&I Non
Inspected
94%
Graph 169 - Gross tonnage (in 1000 t) of small inspected ships, by P&I – 2003/2005
Non P&I Non
Inspected
92%
P&I
Inspected
1%
Non P&I
Inspected
3%
P&I Non
Inspected
4%

Equasis statistics The world merchant fleet in 2005
103
MEDIUM SHIPS
Table 180 - Total number of medium(1) inspected(*) ships, by type and P&I– 2005
Ship Type
General Cargo Ships 3 613 35,0% 343 10,9% 3 956 29,4% 3 315 68,4% 3 527 31,0% 6 842 42,1%
Specialized Cargo Ships 61 0,6% 8 0,3% 69 0,5% 28 0,6% 47 0,4% 75 0,5%
Container Ships 1 275 12,3% 144 4,6% 1 419 10,5% 127 2,6% 108 0,9% 235 1,4%
Ro-Ro Cargo Ships 422 4,1% 60 1,9% 482 3,6% 117 2,4% 265 2,3% 382 2,4%
Bulk Carriers 1 953 18,9% 128 4,1% 2 081 15,4% 335 6,9% 560 4,9% 895 5,5%
Oil and Chemical Tankers 1 751 16,9% 761 24,2% 2 512 18,6% 373 7,7% 2 081 18,3% 2 454 15,1%
Gas Tankers 365 3,5% 83 2,6% 448 3,3% 45 0,9% 230 2,0% 275 1,7%
Other Tankers 68 0,7% 15 0,5% 83 0,6% 30 0,6% 83 0,7% 113 0,7%
Passenger Ships 299 2,9% 626 19,9% 925 6,9% 108 2,2% 1 353 11,9% 1 461 9,0%
Offshore Vessels 294 2,8% 584 18,6% 878 6,5% 173 3,6% 1 259 11,1% 1 432 8,8%
Service Ships 167 1,6% 222 7,1% 389 2,9% 152 3,1% 1 360 11,9% 1 512 9,3%
Tugs 63 0,6% 158 5,0% 221 1,6% 37 0,8% 386 3,4% 423 2,6%
Leisure Vessels 12 0,4% 12 0,1% 3 0,1% 133 1,2% 136 0,8%
Total 10 331 100% 3 144 100% 13 475 100% 4 843 100% 11 392 100% 16 235 100%
P&I Non P&I
Non inspectedInspected Non inspected TotalInspectedTotal
Source : Equasis processed by Emsa - (1) 500≤GT<25.000 - (*)Inspections in the period 2003/2005
Table 181 - Gross tonnage (in 1000 t) of medium(1) inspected(*) ships, by type and P&I – 2005
Ship Type
General Cargo Ships 22 690 22,3% 1 742 11,2% 24 432 20,8% 10 989 53,8% 8 838 29,3% 19 827 39,2%
Specialized Cargo Ships 553 0,5% 47 0,3% 600 0,5% 108 0,5% 95 0,3% 203 0,4%
Container Ships 16 290 16,0% 1 753 11,2% 18 043 15,4% 1 049 5,1% 491 1,6% 1 540 3,0%
Ro-Ro Cargo Ships 5 270 5,2% 538 3,4% 5 808 4,9% 760 3,7% 1 184 3,9% 1 944 3,8%
Bulk Carriers 32 303 31,7% 1 477 9,5% 33 780 28,7% 4 063 19,9% 4 520 15,0% 8 584 17,0%
Oil and Chemical Tankers 16 514 16,2% 4 542 29,1% 21 056 17,9% 1 590 7,8% 4 584 15,2% 6 174 12,2%
Gas Tankers 2 538 2,5% 385 2,5% 2 922 2,5% 189 0,9% 298 1,0% 488 1,0%
Other Tankers 383 0,4% 53 0,3% 436 0,4% 70 0,3% 142 0,5% 212 0,4%
Passenger Ships 3 442 3,4% 2 744 17,6% 6 186 5,3% 734 3,6% 3 955 13,1% 4 689 9,3%
Offshore Vessels 882 0,9% 1 049 6,7% 1 931 1,6% 336 1,6% 1 984 6,6% 2 320 4,6%
Service Ships 945 0,9% 1 076 6,9% 2 021 1,7% 506 2,5% 3 599 11,9% 4 106 8,1%
Tugs 101 0,1% 169 1,1% 271 0,2% 32 0,2% 341 1,1% 373 0,7%
Leisure Vessels 25 0,2% 25 0,0% 8 0,0% 154 0,5% 162 0,3%
Total 101 911 100% 15 600 100% 117 512 100% 20 435 100% 30 184 100% 50 619 100%
Non inspected TotalInspected Non inspected Total Inspected
P&I Non P&I
Source : Equasis processed by Emsa - (1) 500≤GT<25.000 - (*)Inspections in the period 2003/2005
Graph 170 - Total number of medium inspected ships, by P&I – 2003/2005
P&I Non
Inspected
11%
Non P&I
Inspected
16%
P&I
Inspected
35%
Non P&I Non
Inspected
38%
Graph 171 - Gross tonnage (in 1000 t) of medium inspected ships, by P&I – 2003/2005
Non P&I Non
Inspected
18%
P&I
Inspected
61%
Non P&I
Inspected
12%
P&I Non
Inspected
9%

Equasis statistics The world merchant fleet in 2005
104
LARGE SHIPS
Table 182 - Total number of large(1) inspected(*) ships, by type and P&I – 2005
Ship Type
General Cargo Ships 175 3,4% 2 0,6% 177 3,3% 3 1,8% 3 1,2%
Specialized Cargo Ships 15 0,3% 1 0,3% 16 0,3% 1 0,6% 1 1,2% 2 0,8%
Container Ships 950 18,6% 35 10,4% 985 18,1% 33 19,5% 1 1,2% 34 13,3%
Ro-Ro Cargo Ships 439 8,6% 12 3,6% 451 8,3% 3 1,8% 2 2,3% 5 2,0%
Bulk Carriers 2 089 40,9% 66 19,6% 2 155 39,6% 88 52,1% 30 34,9% 118 46,3%
Oil and Chemical Tankers 1 136 22,2% 127 37,8% 1 263 23,2% 34 20,1% 20 23,3% 54 21,2%
Gas Tankers 139 2,7% 12 3,6% 151 2,8% 1 0,6% 1 0,4%
Other Tankers 3 0,1% 3 0,1%
Passenger Ships 160 3,1% 45 13,4% 205 3,8% 2 1,2% 3 3,5% 5 2,0%
Offshore Vessels 1 0,0% 21 6,3% 22 0,4% 3 1,8% 16 18,6% 19 7,5%
Service Ships 2 0,0% 15 4,5% 17 0,3% 1 0,6% 13 15,1% 14 5,5%
Tugs
Leisure Vessels
Total 5 109 100% 336 100% 5 445 100% 169 100% 86 100% 255 100%
P&I Non P&I
Non inspectedInspected Non inspected TotalInspectedTotal
Source : Equasis processed by Emsa - (1) 25.000≤GT<60.000 - (*)Inspections in the period 2003/2005
Table 183 - Gross tonnage (in 1000 t) of large(1) inspected(*) ships, by type and P&I – 2005
Ship Type
General Cargo Ships 5 121 2,7% 53 0,4% 5 173 2,5% 96 1,6% 96 1,0%
Specialized Cargo Ships 474 0,2% 38 0,3% 512 0,2% 33 0,5% 38 1,2% 72 0,8%
Container Ships 37 084 19,3% 1 193 9,5% 38 276 18,7% 1 194 19,5% 34 1,1% 1 228 13,3%
Ro-Ro Cargo Ships 19 402 10,1% 470 3,7% 19 872 9,7% 129 2,1% 54 1,7% 182 2,0%
Bulk Carriers 72 695 37,8% 2 299 18,3% 74 995 36,6% 2 945 48,0% 934 30,4% 3 879 42,2%
Oil and Chemical Tankers 45 962 23,9% 4 875 38,7% 50 837 24,8% 1 475 24,0% 844 27,5% 2 319 25,2%
Gas Tankers 5 848 3,0% 512 4,1% 6 360 3,1% 47 0,8% 47 0,5%
Other Tankers 96 0,1% 96 0,0%
Passenger Ships 5 721 3,0% 1 513 12,0% 7 233 3,5% 58 0,9% 118 3,8% 176 1,9%
Offshore Vessels 34 0,0% 1 021 8,1% 1 055 0,5% 119 1,9% 648 21,1% 766 8,3%
Service Ships 87 0,0% 620 4,9% 706 0,3% 36 0,6% 401 13,1% 438 4,8%
Tugs
Leisure Vessels
Total 192 523 100% 12 593 100% 205 116 100% 6 133 100% 3 071 100% 9 203 100%
P&I Non P&I
Non inspected TotalInspected Non inspected Total Inspected
Source : Equasis processed by Emsa - (1) 25.000≤GT<60.000 - (*)Inspections in the period 2003/2005
Graph 172 - Total number of large inspected ships, by P&I – 2003/2005
P&I Non
Inspected
6%
Non P&I
Inspected
3%
P&I
Inspected
89%
Non P&I Non
Inspected
2%
Graph 173 - Gross tonnage (in 1000 t) of large inspected ships, by P&I – 2003/2005
Non P&I Non
Inspected
1%
P&I
Inspected
90%
Non P&I
Inspected
3%
P&I Non
Inspected
6%
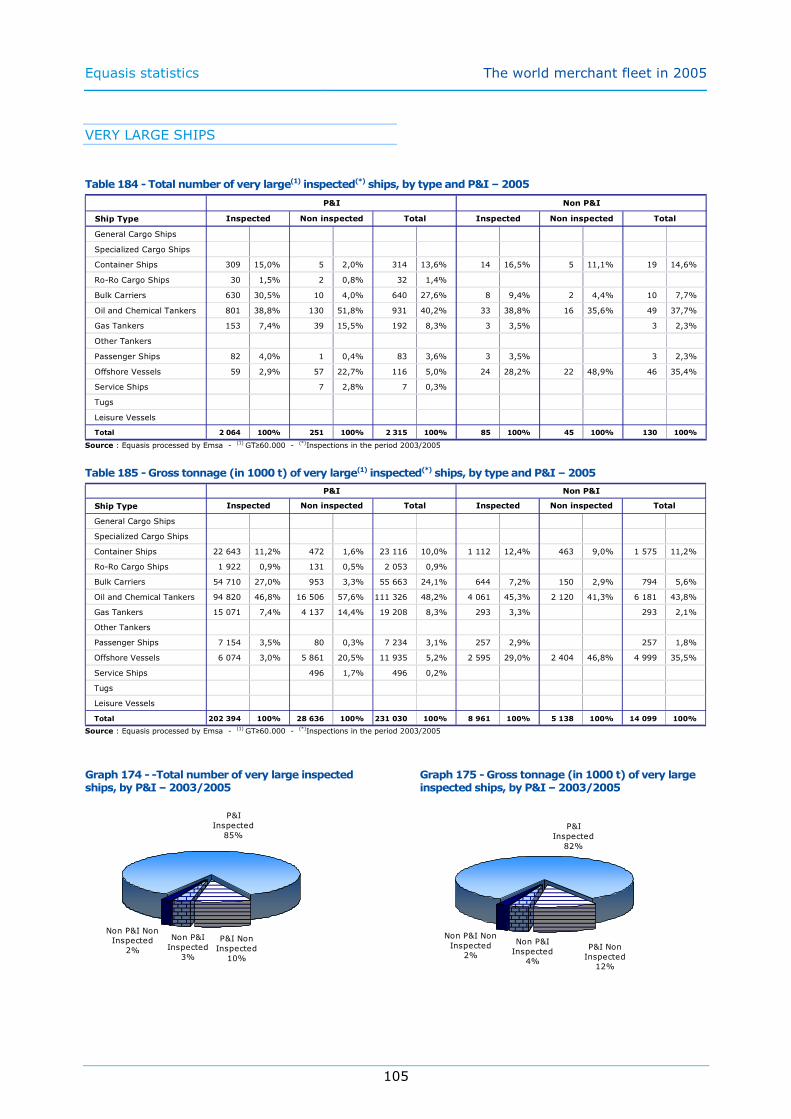
Equasis statistics The world merchant fleet in 2005
105
VERY LARGE SHIPS
Table 184 - Total number of very large(1) inspected(*) ships, by type and P&I – 2005
Ship Type
General Cargo Ships
Specialized Cargo Ships
Container Ships 309 15,0% 5 2,0% 314 13,6% 14 16,5% 5 11,1% 19 14,6%
Ro-Ro Cargo Ships 30 1,5% 2 0,8% 32 1,4%
Bulk Carriers 630 30,5% 10 4,0% 640 27,6% 8 9,4% 2 4,4% 10 7,7%
Oil and Chemical Tankers 801 38,8% 130 51,8% 931 40,2% 33 38,8% 16 35,6% 49 37,7%
Gas Tankers 153 7,4% 39 15,5% 192 8,3% 3 3,5% 3 2,3%
Other Tankers
Passenger Ships 82 4,0% 1 0,4% 83 3,6% 3 3,5% 3 2,3%
Offshore Vessels 59 2,9% 57 22,7% 116 5,0% 24 28,2% 22 48,9% 46 35,4%
Service Ships 7 2,8% 7 0,3%
Tugs
Leisure Vessels
Total 2 064 100% 251 100% 2 315 100% 85 100% 45 100% 130 100%
P&I Non P&I
Non inspectedInspected Non inspected TotalInspectedTotal
Source : Equasis processed by Emsa - (1) GT≥60.000 - (*)Inspections in the period 2003/2005
Table 185 - Gross tonnage (in 1000 t) of very large(1) inspected(*) ships, by type and P&I – 2005
Ship Type
General Cargo Ships
Specialized Cargo Ships
Container Ships 22 643 11,2% 472 1,6% 23 116 10,0% 1 112 12,4% 463 9,0% 1 575 11,2%
Ro-Ro Cargo Ships 1 922 0,9% 131 0,5% 2 053 0,9%
Bulk Carriers 54 710 27,0% 953 3,3% 55 663 24,1% 644 7,2% 150 2,9% 794 5,6%
Oil and Chemical Tankers 94 820 46,8% 16 506 57,6% 111 326 48,2% 4 061 45,3% 2 120 41,3% 6 181 43,8%
Gas Tankers 15 071 7,4% 4 137 14,4% 19 208 8,3% 293 3,3% 293 2,1%
Other Tankers
Passenger Ships 7 154 3,5% 80 0,3% 7 234 3,1% 257 2,9% 257 1,8%
Offshore Vessels 6 074 3,0% 5 861 20,5% 11 935 5,2% 2 595 29,0% 2 404 46,8% 4 999 35,5%
Service Ships 496 1,7% 496 0,2%
Tugs
Leisure Vessels
Total 202 394 100% 28 636 100% 231 030 100% 8 961 100% 5 138 100% 14 099 100%
Non inspected TotalInspected Non inspected Total Inspected
P&I Non P&I
Source : Equasis processed by Emsa - (1) GT≥60.000 - (*)Inspections in the period 2003/2005
Graph 174 - -Total number of very large inspected ships, by P&I – 2003/2005
Non P&I Non
Inspected
2%
P&I
Inspected
85%
Non P&I
Inspected
3%
P&I Non
Inspected
10%
Graph 175 - Gross tonnage (in 1000 t) of very large inspected ships, by P&I – 2003/2005
Non P&I Non
Inspected
2%
P&I
Inspected
82%
Non P&I
Inspected
4%
P&I Non
Inspected
12%
Equasis statistics The world merchant fleet in 2005
106
Equasis statistics The world merchant fleet in 2005
107
6. Vetting program
and trade associations
INTRODUCTION
Several professional maritime trade
associations and vetting programs supply
information to EQUASIS on ships covered by
their schemes. Such schemes are either
ship-based (e.g. OCIMF) or company-based
(e.g. Intertanko) and relate to certain ships
types. They aim to provide a mark of quality
for ships covered by them.
For each relevant ship type and size
category the following tables show the
proportion of the fleet covered by each of
the schemes which provide information to
EQUASIS.
The ships types covered by each body are as
follows:
1. Intertanko Oil & chemical tankers
Gas carriers
2. Intercargo Bulk carriers
General cargo ships
3. Green Awards Oil & chemical tankers
4. CDI Oil & chemical tankers
Gas carriers
5. OCIMF Oil & chemical tankers
Gas carriers
The tables in chapter 6.2 show the detention
rates of ships covered by each of the
schemes compared with ships of the same
type which are outside the relevant scheme.
The detention rate is the ratio between the
number of detentions and the number of
inspections in the Paris MoU, Tokyo MoU and
USCG regions in 2005.
RESULTS
Table 186 indicates that a majority of
relevant ships are not covered by the
vetting schemes and trade associations
providing data to EQUASIS. However of the
large and very large oil, chemical and gas
tankers around one half are covered by
Intertanko while nearly 90% (2213 out of
2502) are covered by OCIMF.
Tables 189 to 191 suggest that medium,
large and very large ships covered by one of
the vetting schemes and trade associations
are inspected more frequently than those
ships not covered, with – for example, large
ships covered by Intertanko were each
inspected on average 2.25 times (225,3%)
compared with 1.53 times (153.5%) for the
relevant types not covered by Intertanko.
Chapter 6

Equasis statistics The world merchant fleet in 2005
108
6.1. SCHEME STATUS
Table 186 - Total number of ships, by size and vetting program and trade associations – 2005
Within Outside Within Outside Within Outside Within Outside Within Outside
Intertanko 1 2 062 774 4 926 726 785 444 576 1 945 8 349
% of Total 24,7% 39,8% 59,0% 37,3% 9,4% 22,8% 6,9%
Intercargo 0 5 325 175 13 603 428 2 027 106 532 709 21 487
% of Total 24,8% 24,7% 63,3% 60,4% 9,4% 15,0% 2,5%
Green Award 0 2 013 12 4 954 72 1 245 102 732 186 8 944
% of Total 22,5% 6,5% 55,4% 38,7% 13,9% 54,8% 8,2%
CDI 0 2 062 1 088 4 604 128 1 345 0 990 1 216 9 001
% of Total 22,9% 89,5% 51,1% 10,5% 14,9% 11,0%
OCIMF 100 1 969 2 227 3 525 1 328 172 885 117 4 540 5 783
% of Total 2,2% 34,0% 49,1% 61,0% 29,3% 3,0% 19,5% 2,0%
SchemeSmall
(1) TotalMedium(2)
Large(3)
Very Large(4)
Source : Equasis processed by Emsa / (1) GT<500 - (2) 500≤GT<25.000 - (3) 25.000≤GT<60.000 - (4) GT≥60.000
Table 187 - Gross tonnage (in 1000 t) of ships, by size and vetting program and trade associations – 2005
Within Outside Within Outside Within Outside Within Outside Within Outside
Intertanko 0 668 9 639 21 072 30 340 31 092 50 643 66 116 90 622 118 949
% of Total 0,6% 10,6% 17,7% 33,5% 26,1% 55,9% 55,6%
Intercargo 0 1 717 3 209 83 473 14 593 69 629 9 049 46 304 26 851 201 122
% of Total 0,9% 11,9% 41,5% 54,3% 34,6% 33,7% 23,0%
Green Award 0 650 280 26 950 3 573 49 582 11 428 87 452 15 281 164 635
% of Total 0,4% 1,8% 16,4% 23,4% 30,1% 74,8% 53,1%
CDI 0 668 9 202 21 445 4 350 55 337 0 114 245 13 551 191 695
% of Total 0,3% 67,9% 11,2% 32,1% 28,9% 59,6%
OCIMF 37 634 18 804 12 193 54 374 6 522 102 572 12 450 175 786 31 799
% of Total 0,0% 2,0% 10,7% 38,3% 30,9% 20,5% 58,4% 39,2%
SchemeTotalSmall
(1)Medium
(2)Large
(3)Very Large
(4)
Source : Equasis processed by Emsa / (1) GT<500 - (2) 500≤GT<25.000 - (3) 25.000≤GT<60.000 - (4) GT≥60.000
6.2. SAFETY PERFORMANCE
Table 188 - Safety performance of ships, by inspections and detentions rates(*) – 2005
Within Outside Total Within Outside Total Within Outside Total
Intertanko 1,7% 3,1% 2,5% 62 155 217 3 670 4 958 8 628
in % of total 28,6% 71,4% 42,5% 57,5%
Intercargo 2,7% 5,8% 5,6% 52 1 494 1 546 1 928 25 609 27 537
in % of total 3,4% 96,6% 7,0% 93,0%
Green Award 0,0% 2,8% 2,6% 0 192 192 320 6 960 7 280
in % of total 100% 4,4% 95,6%
CDI 1,7% 2,9% 2,5% 44 170 214 2 536 5 934 8 470
in % of total 20,6% 79,4% 29,9% 70,1%
OCIMF 1,2% 9,3% 2,5% 91 125 216 7 301 1 343 8 644
in % of total 42,1% 57,9% 84,5% 15,5%
Detentions InspectionsScheme
Detention rate
Source : Equasis processed by Emsa - (*)Detentions in Paris MoU, Tokyo MoU and USCG divided by total number of inspections
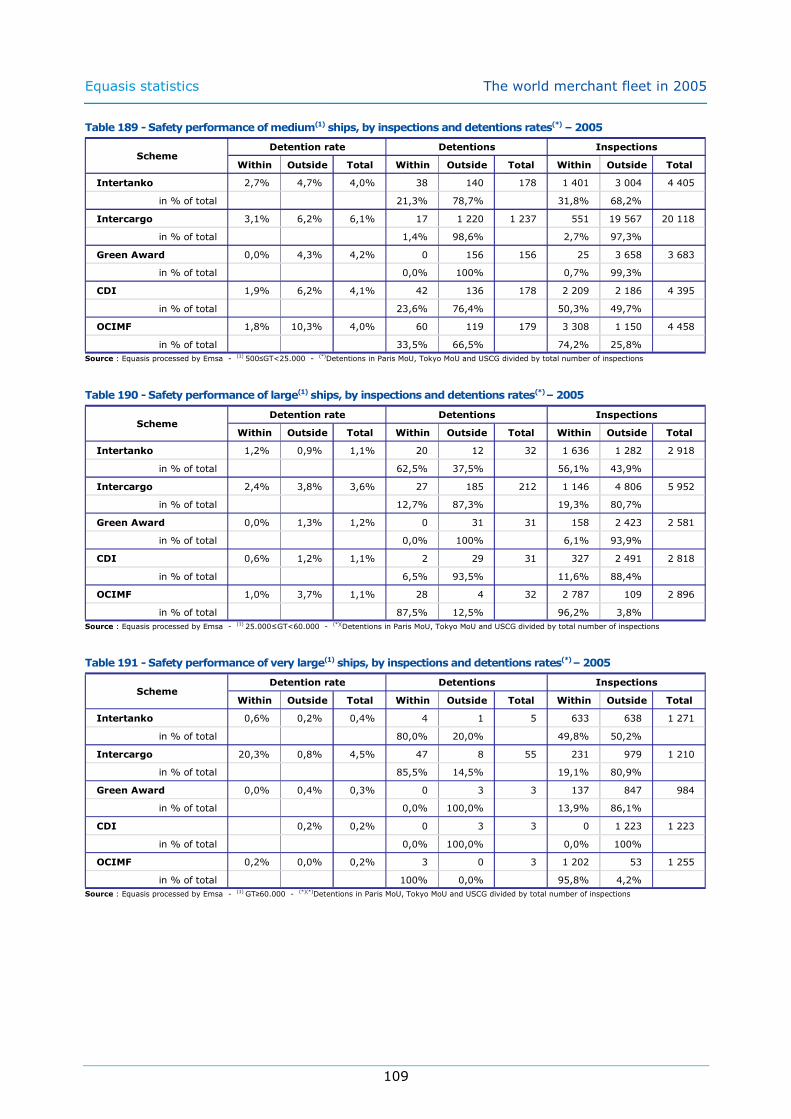
Equasis statistics The world merchant fleet in 2005
109
Table 189 - Safety performance of medium(1) ships, by inspections and detentions rates(*) – 2005
Within Outside Total Within Outside Total Within Outside Total
Intertanko 2,7% 4,7% 4,0% 38 140 178 1 401 3 004 4 405
in % of total 21,3% 78,7% 31,8% 68,2%
Intercargo 3,1% 6,2% 6,1% 17 1 220 1 237 551 19 567 20 118
in % of total 1,4% 98,6% 2,7% 97,3%
Green Award 0,0% 4,3% 4,2% 0 156 156 25 3 658 3 683
in % of total 0,0% 100% 0,7% 99,3%
CDI 1,9% 6,2% 4,1% 42 136 178 2 209 2 186 4 395
in % of total 23,6% 76,4% 50,3% 49,7%
OCIMF 1,8% 10,3% 4,0% 60 119 179 3 308 1 150 4 458
in % of total 33,5% 66,5% 74,2% 25,8%
Detentions InspectionsScheme
Detention rate
Source : Equasis processed by Emsa - (1) 500≤GT<25.000 - (*)Detentions in Paris MoU, Tokyo MoU and USCG divided by total number of inspections
Table 190 - Safety performance of large(1) ships, by inspections and detentions rates(*) – 2005
Within Outside Total Within Outside Total Within Outside Total
Intertanko 1,2% 0,9% 1,1% 20 12 32 1 636 1 282 2 918
in % of total 62,5% 37,5% 56,1% 43,9%
Intercargo 2,4% 3,8% 3,6% 27 185 212 1 146 4 806 5 952
in % of total 12,7% 87,3% 19,3% 80,7%
Green Award 0,0% 1,3% 1,2% 0 31 31 158 2 423 2 581
in % of total 0,0% 100% 6,1% 93,9%
CDI 0,6% 1,2% 1,1% 2 29 31 327 2 491 2 818
in % of total 6,5% 93,5% 11,6% 88,4%
OCIMF 1,0% 3,7% 1,1% 28 4 32 2 787 109 2 896
in % of total 87,5% 12,5% 96,2% 3,8%
Detentions InspectionsScheme
Detention rate
Source : Equasis processed by Emsa - (1) 25.000≤GT<60.000 - (*)(Detentions in Paris MoU, Tokyo MoU and USCG divided by total number of inspections
Table 191 - Safety performance of very large(1) ships, by inspections and detentions rates(*) – 2005
Within Outside Total Within Outside Total Within Outside Total
Intertanko 0,6% 0,2% 0,4% 4 1 5 633 638 1 271
in % of total 80,0% 20,0% 49,8% 50,2%
Intercargo 20,3% 0,8% 4,5% 47 8 55 231 979 1 210
in % of total 85,5% 14,5% 19,1% 80,9%
Green Award 0,0% 0,4% 0,3% 0 3 3 137 847 984
in % of total 0,0% 100,0% 13,9% 86,1%
CDI 0,2% 0,2% 0 3 3 0 1 223 1 223
in % of total 0,0% 100,0% 0,0% 100%
OCIMF 0,2% 0,0% 0,2% 3 0 3 1 202 53 1 255
in % of total 100% 0,0% 95,8% 4,2%
Detentions InspectionsScheme
Detention rate
Source : Equasis processed by Emsa - (1) GT≥60.000 - (*)(*)Detentions in Paris MoU, Tokyo MoU and USCG divided by total number of inspections

Equasis statistics The world merchant fleet in 2005
110
6.3. COMPANY PERFORMANCE
Table 192 - Total number of companies and ships, by fleet size and flag – 2005
Company fleet size
(by number of ships)
Total share of
black flag(2)
1 ship 11 971 62,0% 11 971 19,6% 3 891 22,8% 32,5%
2 2 783 14,4% 5 566 9,1% 1 746 10,2% 31,4%
3 1 286 6,7% 3 858 6,3% 1 125 6,6% 29,2%
4 784 4,1% 3 136 5,1% 886 5,2% 28,3%
5 488 2,5% 2 440 4,0% 816 4,8% 33,4%
5-10 1 077 5,6% 7 988 13,1% 2 348 13,8% 29,4%
11-50 822 4,3% 15 691 25,7% 3 825 22,4% 24,4%
51-100 65 0,3% 4 402 7,2% 753 4,4% 17,1%
100+ 17 0,1% 5 987 9,8% 1 651 9,7% 27,6%
Total 19 293 100% 61 039 100% 17 041 100% 27,9%
Number of ships(1) Number of ships
under black flag
Number of
companies
Source : Equasis processed by Emsa - (1)As percentage of total - (2)Within the same company fleet size category
Graph 176 - Total number of companies and ships, by fleet size – 2005
0
2 000
4 000
6 000
8 000
10 000
12 000
14 000
16 000
1 ship 2 3 4 5
5-10
11-50
51-100
100+
Number of companies
Number of ships
Graph 177 - Total number of companies and ships, by fleet size and flag – 2005
0
2 000
4 000
6 000
8 000
10 000
12 000
14 000
16 000
1 ship 2 3 4 5
5-10
11-50
51-100
100+
Non Black Flag
Black Flag

Equasis statistics The world merchant fleet in 2005
111
Table 193 - Total number of inspections and detention rates(*), by company fleet size – 2005
Company fleet size
(by number of ships)
% of ships
detained (1)
1 ship 3 985 8,7% 407 20,5% 10,21%
2 1 262 2,8% 180 9,1% 14,26%
3 2 673 5,8% 190 9,6% 7,11%
4 2 410 5,3% 147 7,4% 6,10%
5 2 057 4,5% 84 4,2% 4,08%
5-10 6 883 15,1% 284 14,3% 4,13%
11-50 15 922 34,8% 441 22,2% 2,77%
51-100 5 846 12,8% 136 6,9% 2,33%
100+ 4 665 10,2% 115 5,8% 2,47%
Total 45 703 100% 1 984 100% 4,34%
Number of
detentions
Number of
inspections
Source : Equasis processed by Emsa - (1)Within the same company fleet size category - (*) Detentions in Paris MoU, Tokyo MoU and USCG divided by total number of inspections
Graph 178 - Total number of inspections and detention, by fleet size – 2005
0
500
1 000
1 500
2 000
2 500
3 000
3 500
4 000
1 ship 2 3 4 5
5-10
11-50
51-100
100+
Number of inspections
Number of detentions

Equasis statistics The world merchant fleet in 2005
112

Equasis statistics The world merchant fleet in 2005
113
Ship type aggregations
General Cargo Ships
Refrigerated Cargo Ship Passenger/General Cargo Ship Deck Cargo Ship Palletized Cargo Ship General Cargo Ship
Specialized Cargo Ships
Stone Carrier Log-Tipping Ship Nuclear Fuel Carrier Heavy Load Carrier Barge Carrier Livestock Carrier
Container Ships
Container Ship Passenger/Container Ship
Ro-Ro Cargo Ships
Ro-Ro Cargo Ship Vehicles Carrier Container Ro-Ro Cargo Ship
Bulk Carriers
Ore/Oil Carrier Bulk Carrier Powder Carrier Bulk/Oil Carrier Aggregates Carrier Self-Discharging Bulk Carrier Cement Carrier Wood Chips Carrier Refined Sugar Carrier Alumina Carrier Limestone Carrier Ore Carrier
Oil and Chemical Tankers
Chemical Tanker Chemical/Oil Products Tanker Crude Oil Tanker Oil Products Tanker
Gas Tankers
LPG Tanker LNG Tanker
Other Tankers
Wine Tanker Vegetable Oil Tanker Water Tanker Fruit Juice Tanker Molasses Tanker Oil-Sludge Tanker Edible Oil Tanker Bitumen Tanker
Passenger Ships
Passenger/Ro-Ro Cargo Ship Passenger (Cruise) Ship Passenger Ship
Offshore Vessels
Pipe-Layer Offshore Supply Ship Offshore Tug/Supply Ship Drilling Ship Supply Vessel Offshore Processing Ship Well-Stimulation Vessel Standby-Safety Vessel Production Testing Vessel Offshore Support Vessel
Service Ships
Search & Rescue Vessel Salvage Ship Buoy/Lighthouse Vessel Work/Repair Vessel Hospital Vessel Other Non-Merchant Ships Sail Training Ship Utility Vessel Research Vessel Naval/Naval Auxiliary Training Ship Pollution Control Vessel Fire-Fighting Vessel Waste Disposal Vessel Cable-Layer Icebreaker Crane Ship Dredger Hopper Dredger
Tugs
Pusher Tug Tug
Leisure Vessels
Yacht
Annex I

Equasis Statistics The world merchant fleet – Statistics from Equasis
114
Black flags list 2004
Black flags of the Paris MoU, Tokyo MoU and USCG published in their respective 2004
reports.
A
Albania Algeria
B
Bangladesh Belize Bolivia Brazil
C
Cambodia Comoros
E
Egypt
G
Georgia
H
Honduras
I
Indonesia
K
Korea Democratic Republic
L
Lebanon
M
Mexico Mongolia
P
Panama Papua New Guinea
R
Romania
S
Slovakia St Vincent and Grenadines Syrian Arab Republic
T
Taiwan Thailand Tonga Turkey Tuvalu
U
Ukrainia
V
Venezuela Vietnam
Annex II