equipment - local site visit aug 2006 - iis windows...
TRANSCRIPT
• Introduction
• Southern Africa
• Northern Cape
• Siberia
Barloworld Equipment team
� Lester Day
� Chris Gibb
� Wayne Witherspoon
� Gerhard Vorster
� Peter Tapson
Agenda
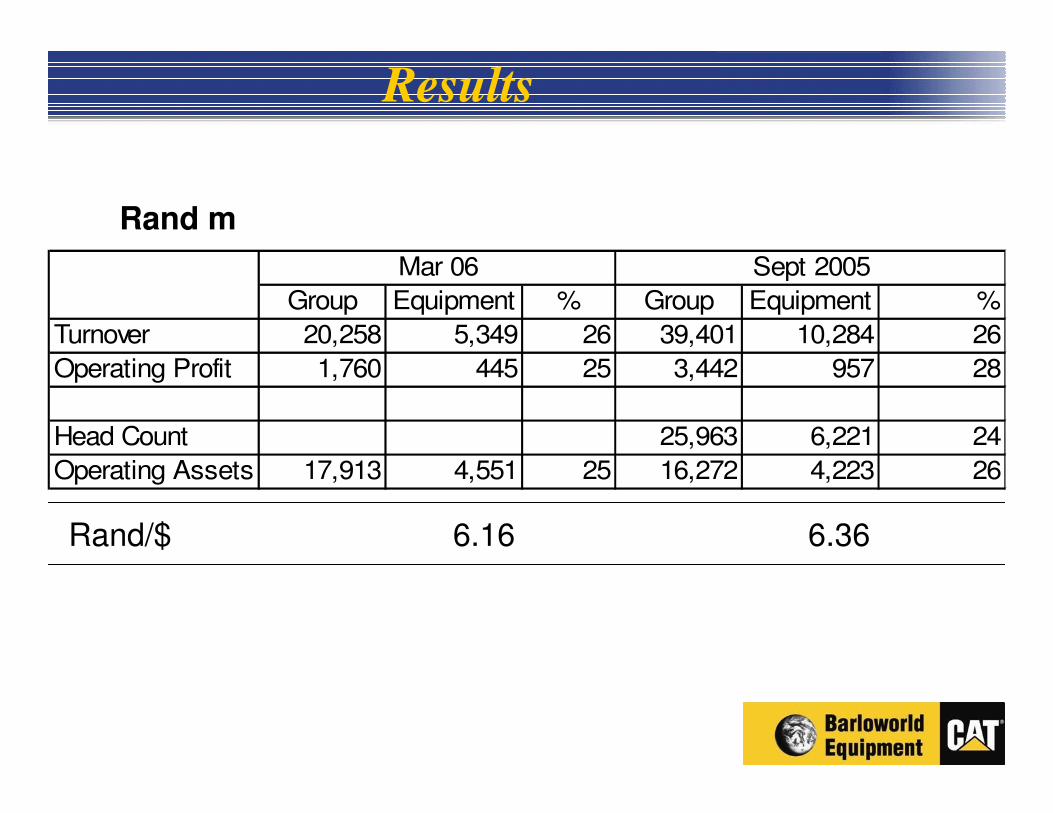
Group Equipment % Group Equipment %
Turnover 20,258 5,349 26 39,401 10,284 26
Operating Profit 1,760 445 25 3,442 957 28
Head Count 25,963 6,221 24
Operating Assets 17,913 4,551 25 16,272 4,223 26
Mar 06 Sept 2005
Rand m
Rand/$ 6.16 6.36
Results
Closing rateAverage monthly rate
Closing Rate
Average RateClosing rate
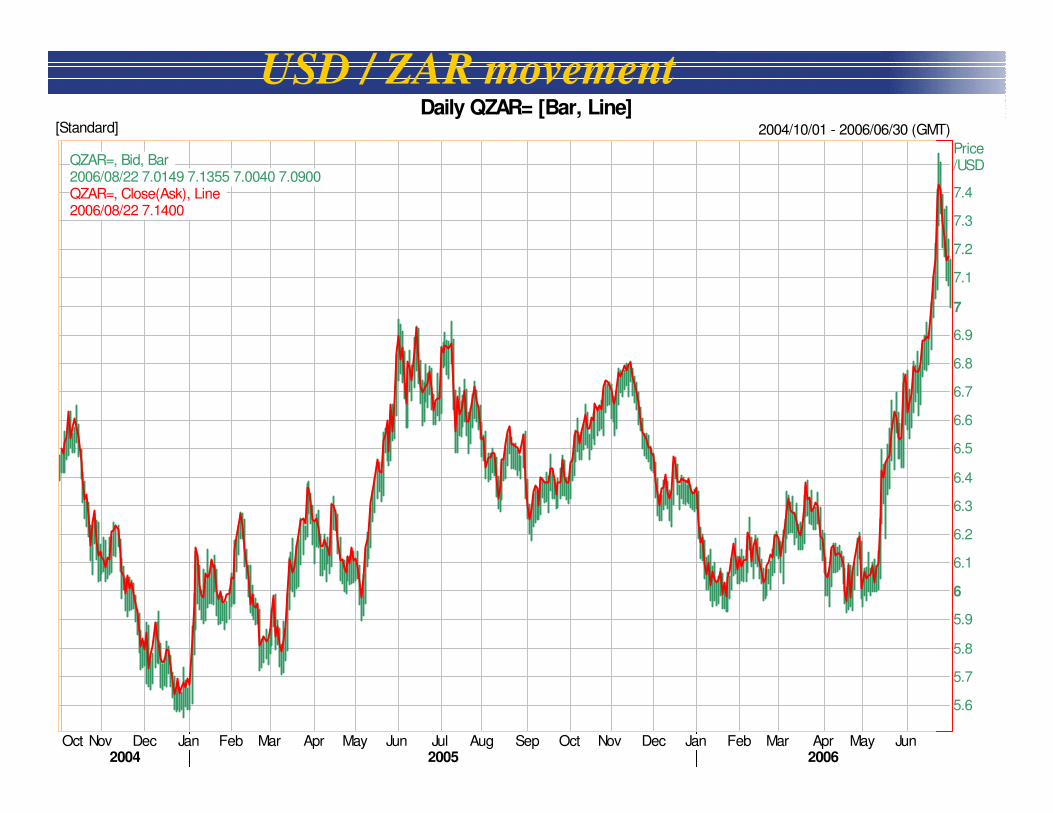
Daily QZAR= [Bar, Line]2004/10/01 - 2006/06/30 (GMT)[Standard]
Oct Nov Dec Jan Feb Mar Apr May Jun Jul Aug Sep Oct Nov Dec Jan Feb Mar Apr May Jun2004 2005 2006
Price/USD
5.6
5.7
5.8
5.9
6.1
6.2
6.3
6.4
6.5
6.6
6.7
6.8
6.9
7.1
7.2
7.3
7.4
6
7
QZAR=, Bid, Bar2006/08/22 7.0149 7.1355 7.0040 7.0900QZAR=, Close(Ask), Line2006/08/22 7.1400
USD / ZAR movement
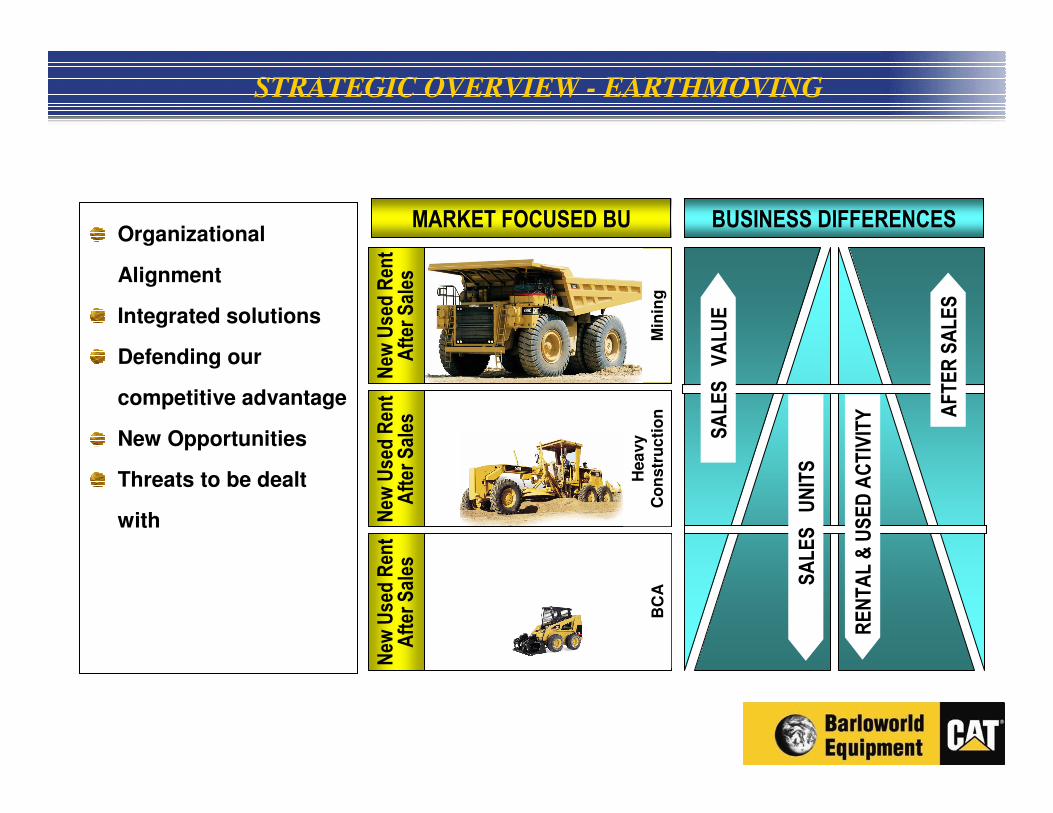
STRATEGIC OVERVIEW - EARTHMOVING
New
Use
d Ren
tAfter Sales
New
Use
d Ren
tAfter Sales
New
Use
d Ren
tAfter Sales
SALES VALUE
SALES UNITS
RENTAL & USED ACTIVITY AFTER SALES
MARKET FOCUSED BU BUSINESS DIFFERENCES
Min
ing
Hea
vy
Co
ns
tru
cti
on
BC
A
Organizational
Alignment
Integrated solutions
Defending our
competitive advantage
New Opportunities
Threats to be dealt
with
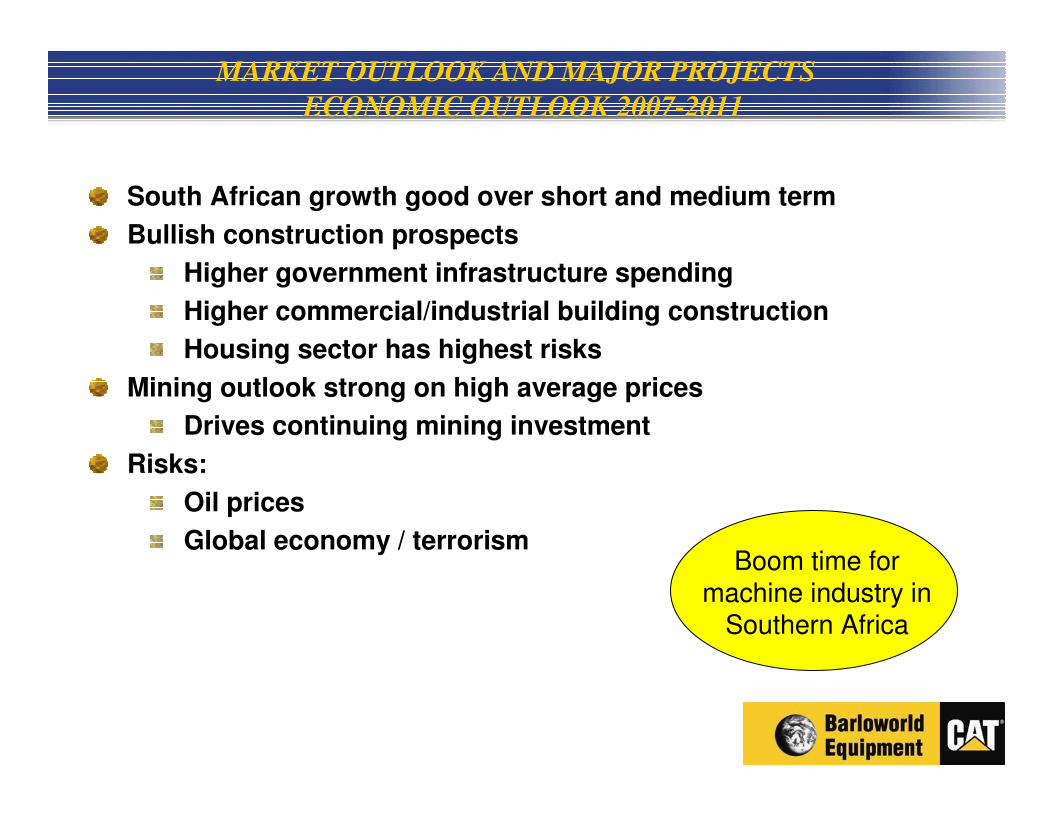
South African growth good over short and medium term
Bullish construction prospects
Higher government infrastructure spending
Higher commercial/industrial building construction
Housing sector has highest risks
Mining outlook strong on high average prices
Drives continuing mining investment
Risks:
Oil prices
Global economy / terrorismBoom time for
machine industry in Southern Africa
MARKET OUTLOOK AND MAJOR PROJECTS
ECONOMIC OUTLOOK 2007-2011
0
500
1000
1500
2000
2500
3000
3500
1970 1975 1980 1985 1990 1995 2000 2005
0.0%
2.0%
4.0%
6.0%
8.0%
10.0%
12.0%
14.0%
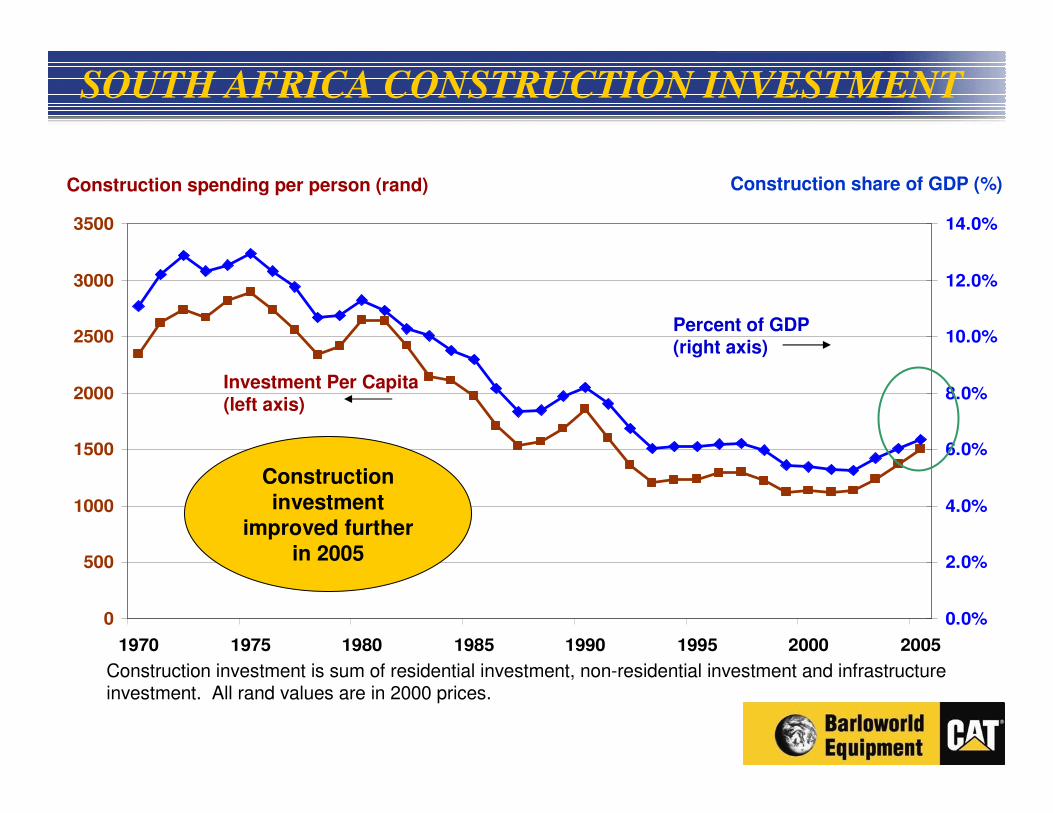
Construction spending per person (rand) Construction share of GDP (%)
Investment Per Capita(left axis)
Percent of GDP(right axis)
Construction investment
improved further in 2005
Construction investment is sum of residential investment, non-residential investment and infrastructure investment. All rand values are in 2000 prices.
SOUTH AFRICA CONSTRUCTION INVESTMENT
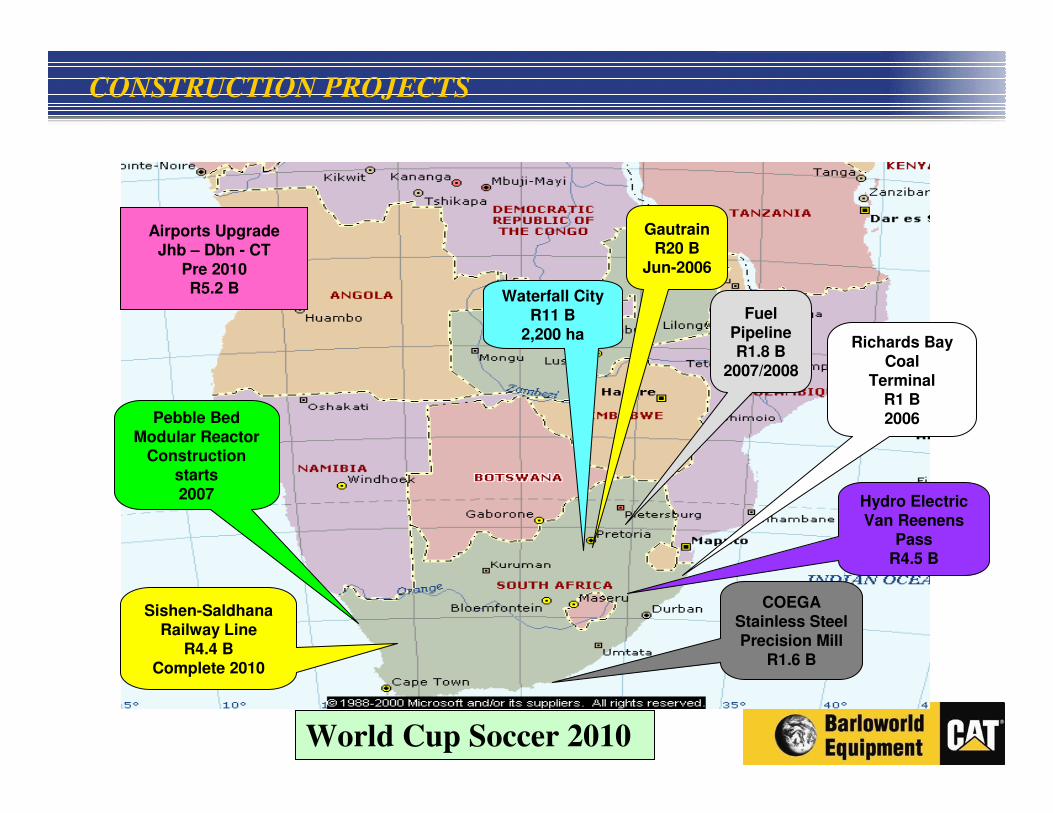
CONSTRUCTION PROJECTS
GautrainR20 B
Jun-2006
Sishen-SaldhanaRailway Line
R4.4 BComplete 2010
Pebble BedModular Reactor
Construction starts2007
Waterfall CityR11 B
2,200 ha
Hydro ElectricVan Reenens
PassR4.5 B
COEGAStainless SteelPrecision Mill
R1.6 B
Fuel PipelineR1.8 B
2007/2008
Richards Bay Coal
TerminalR1 B2006
Airports UpgradeJhb – Dbn - CT
Pre 2010R5.2 B
World Cup Soccer 2010

MARKET OUTLOOK – MAJOR PROJECTS
(GOVERNMENT INFRASTRUCTURE SPENDING – 2006 TO 2009)
Provincial - R109bn
(26%)
Municipal - R82bn
(22%)
Public Enterprise -
R123bn
(33%)
National - R 32bn
(9%)
Other public - 26bn
(7%)
R372 billion
Source: ASGISA
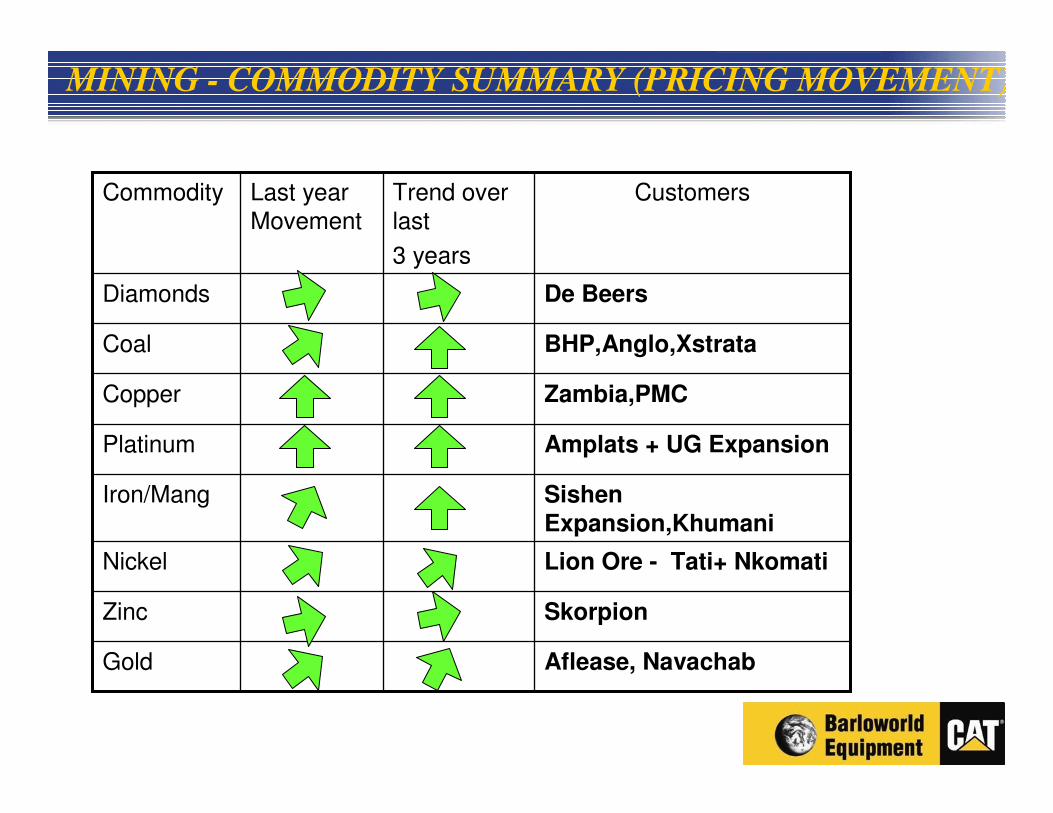
MINING - COMMODITY SUMMARY (PRICING MOVEMENT)
Aflease, NavachabGold
SkorpionZinc
Lion Ore - Tati+ NkomatiNickel
SishenExpansion,Khumani
Iron/Mang
Amplats + UG ExpansionPlatinum
Zambia,PMCCopper
BHP,Anglo,XstrataCoal
De BeersDiamonds
CustomersTrend over last
3 years
Last year Movement
Commodity

MINING PROJECTS - New machine expansion prospects
Coal
R 2436m
Moatise
R 900m
Diamonds
R 750m
Copper
R 600m
Diamonds
R 840m
Platinum
R 982mIron/Manganese
R 750m
Uranium
R 250m
Projects R 7,8b
0
1000
2000
3000
4000
5000
6000
7000
8000
9000
1997 1998 1999 2000 2001 2002 2003 2004 2005 2006 2007 2008 2009 2010 2011
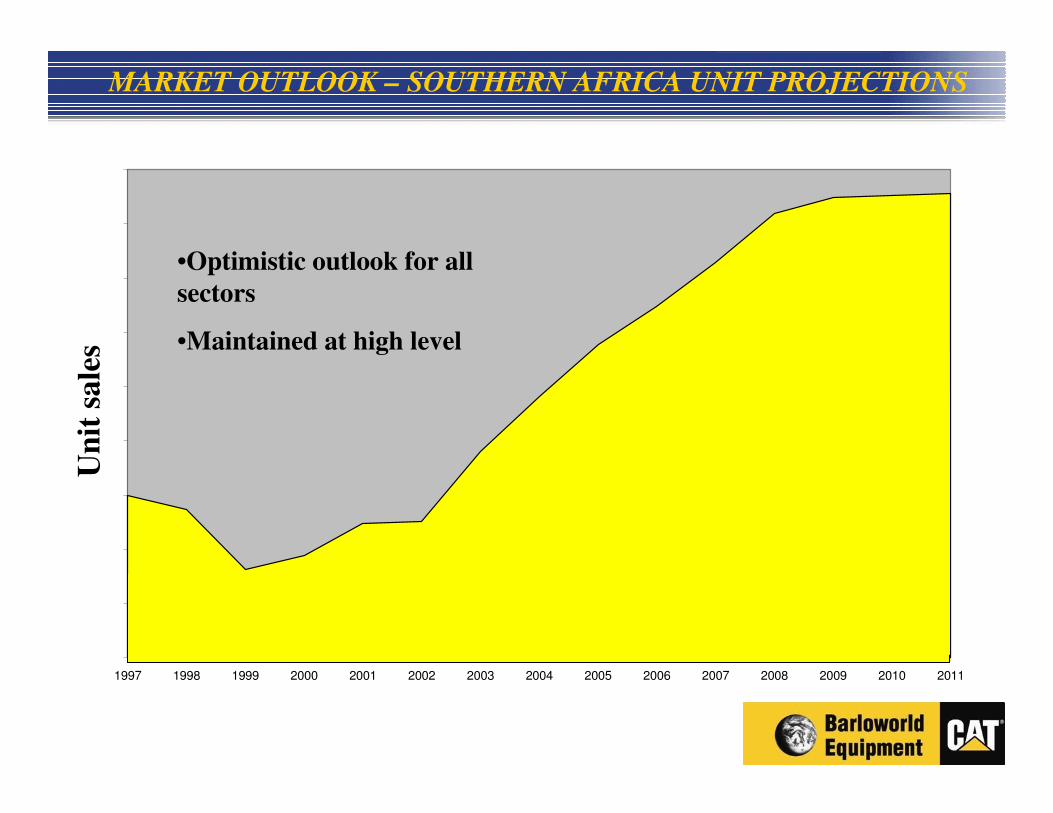
MARKET OUTLOOK – SOUTHERN AFRICA UNIT PROJECTIONS
•Optimistic outlook for all
sectors
•Maintained at high level
Un
it s
ale
s

KEY ISSUES
• Emergence of China as an opportunity/threat
• Significant growth in all territories/markets
• Challenge of up-skilling to meet growth
– Retention of BEE staff
– Remote sites
• Currency volatility
• Impact of CAT delivery constraints
– Equipment
– Tyres
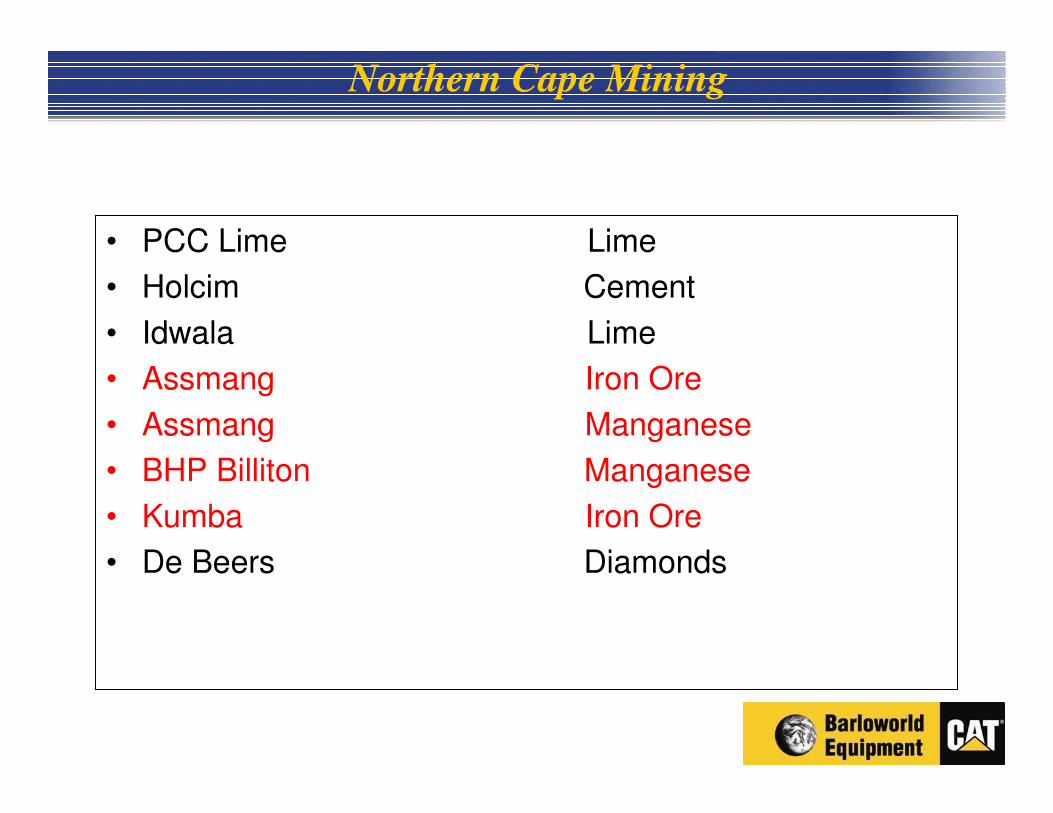
Northern Cape Mining
• PCC Lime Lime
• Holcim Cement
• Idwala Lime
• Assmang Iron Ore
• Assmang Manganese
• BHP Billiton Manganese
• Kumba Iron Ore
• De Beers Diamonds
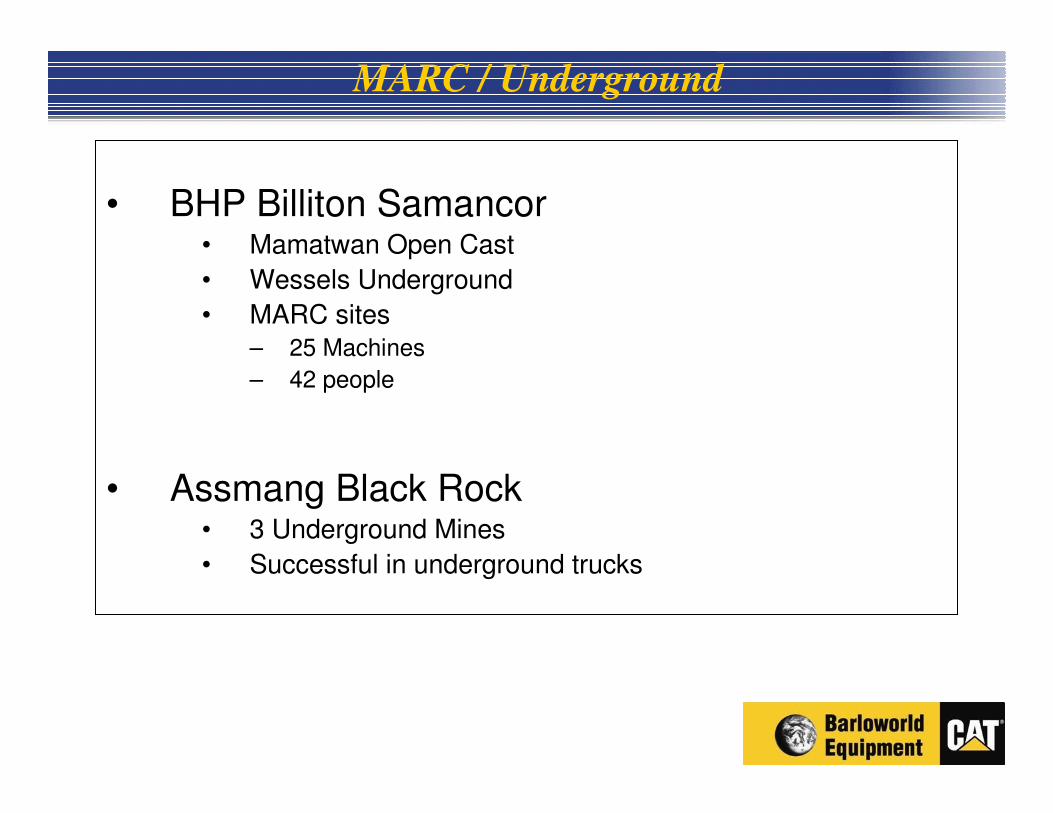
MARC / Underground
• BHP Billiton Samancor• Mamatwan Open Cast
• Wessels Underground
• MARC sites– 25 Machines
– 42 people
• Assmang Black Rock• 3 Underground Mines
• Successful in underground trucks
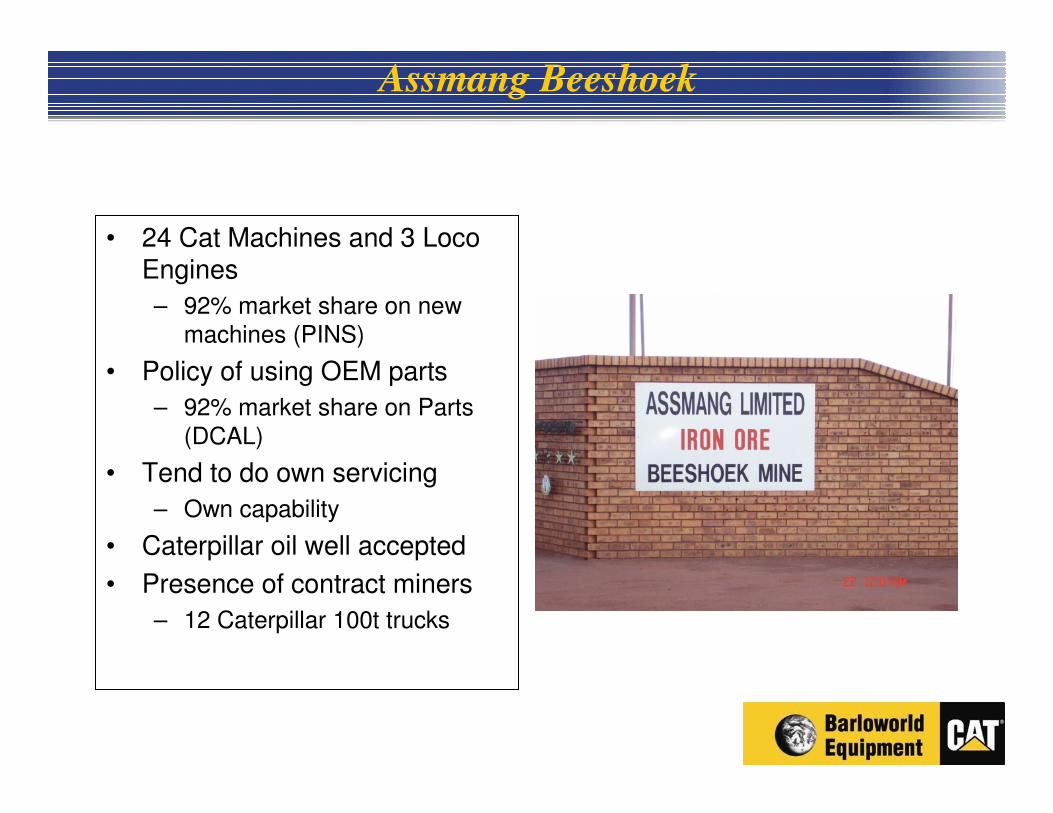
Assmang Beeshoek
• 24 Cat Machines and 3 Loco Engines
– 92% market share on new machines (PINS)
• Policy of using OEM parts
– 92% market share on Parts (DCAL)
• Tend to do own servicing
– Own capability
• Caterpillar oil well accepted
• Presence of contract miners
– 12 Caterpillar 100t trucks
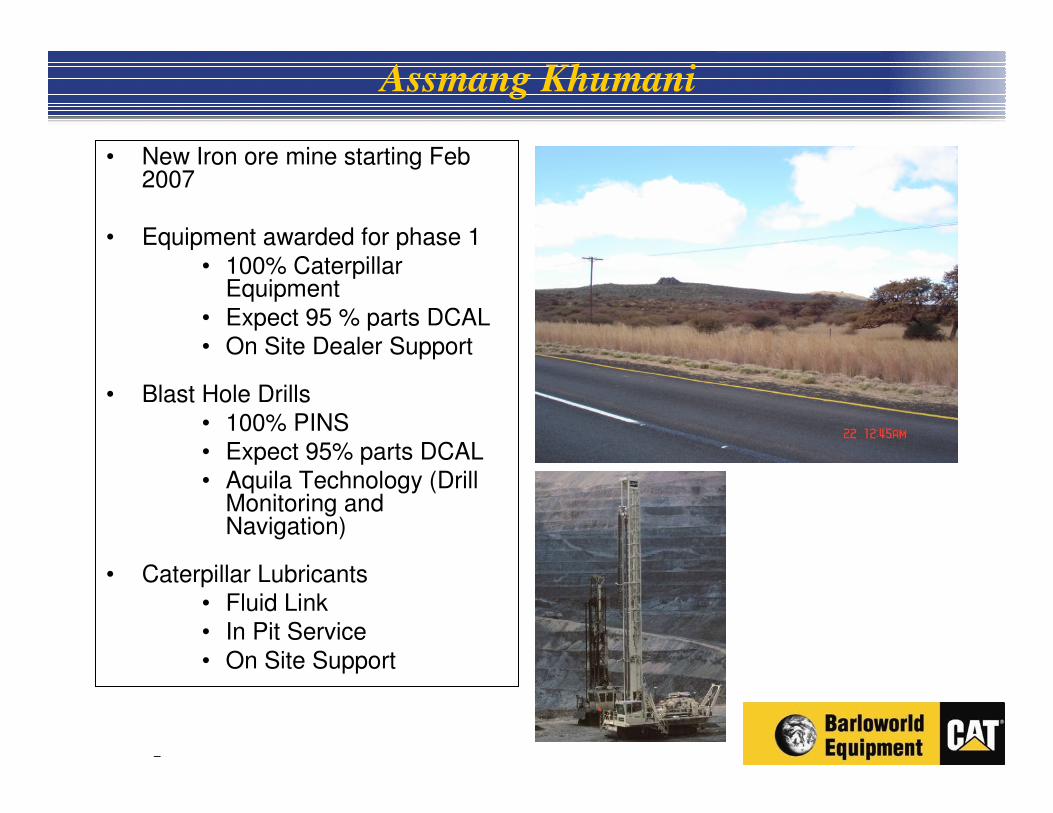
Assmang Khumani
• New Iron ore mine starting Feb 2007
• Equipment awarded for phase 1• 100% Caterpillar
Equipment• Expect 95 % parts DCAL• On Site Dealer Support
• Blast Hole Drills• 100% PINS• Expect 95% parts DCAL• Aquila Technology (Drill
Monitoring and Navigation)
• Caterpillar Lubricants• Fluid Link• In Pit Service• On Site Support
–
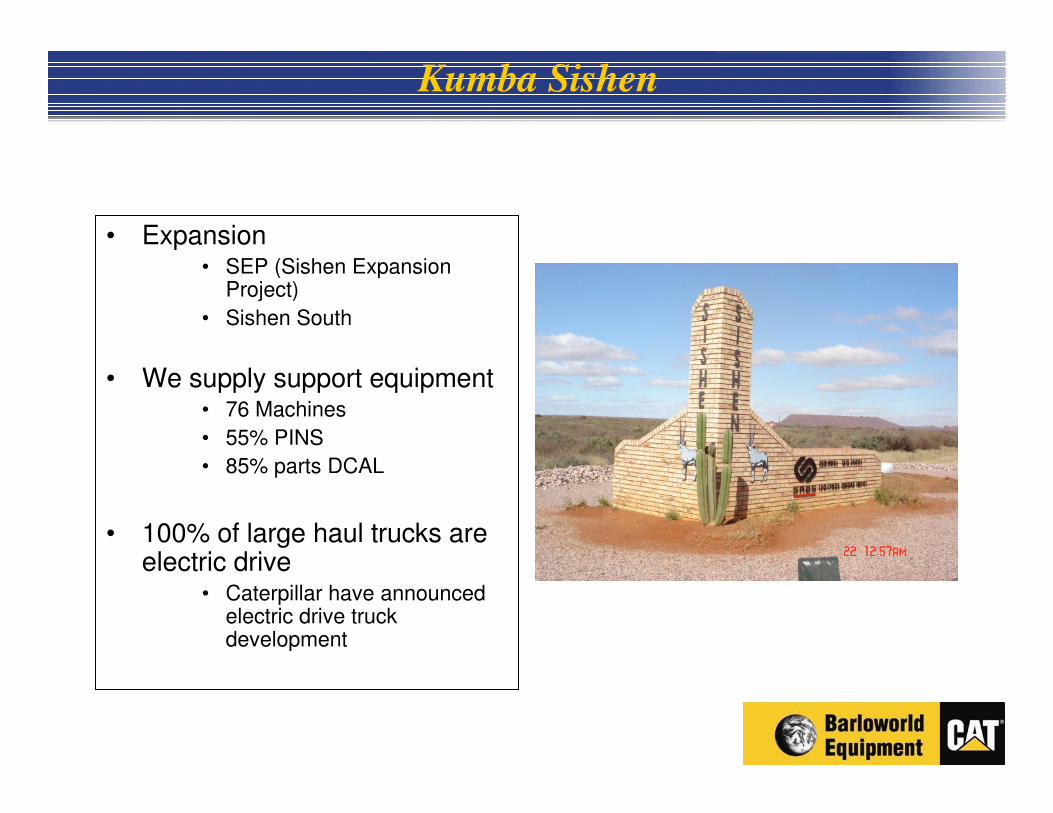
Kumba Sishen
• Expansion• SEP (Sishen Expansion
Project)
• Sishen South
• We supply support equipment• 76 Machines
• 55% PINS
• 85% parts DCAL
• 100% of large haul trucks are electric drive
• Caterpillar have announced electric drive truck development
Northern Cape Logistics
• Staff compliment 72
• Limited infrastructure
– On site presence
– Parts satellite stores
• Field service capability
– Local learnership program
• Parts deliver to mines
– Daily run from Isando to Kuruman
• Receive parts 6 am in Kuruman
• Dispatch to mines at 7am
– Emergency parts can be supplied within 6 hours from Isando
Microsoft PowerPoint
PresentationMicrosoft PowerPoint
Presentation
Microsoft PowerPoint
Presentation
Microsoft PowerPoint
Presentation
Microsoft PowerPoint
Presentation
Microsoft PowerPoint
Presentation
Microsoft PowerPoint
Presentation
Microsoft PowerPoint
Presentation
Microsoft PowerPoint
Presentation
Microsoft PowerPoint
Presentation
Microsoft PowerPoint
Presentation
Microsoft PowerPoint
Presentation
Microsoft PowerPoint
Presentation
Microsoft PowerPoint
Presentation
Microsoft PowerPoint
Presentation
Microsoft PowerPoint
Presentation Microsoft PowerPoint
Presentation
Microsoft PowerPoint
Presentation
Microsoft PowerPoint
Presentation
Microsoft PowerPoint
Presentation
Isando
SishenMicrosoft PowerPoint
Presentation
Microsoft PowerPoint
Presentation
Microsoft PowerPoint
Presentation
Microsoft PowerPoint
Presentation
Saldanha
Microsoft PowerPoint
Presentation
Microsoft PowerPoint
Presentation
Microsoft PowerPoint
Presentation
Microsoft PowerPoint
Presentation
Microsoft PowerPoint
Presentation
KurumanMicrosoft PowerPoint
Presentation
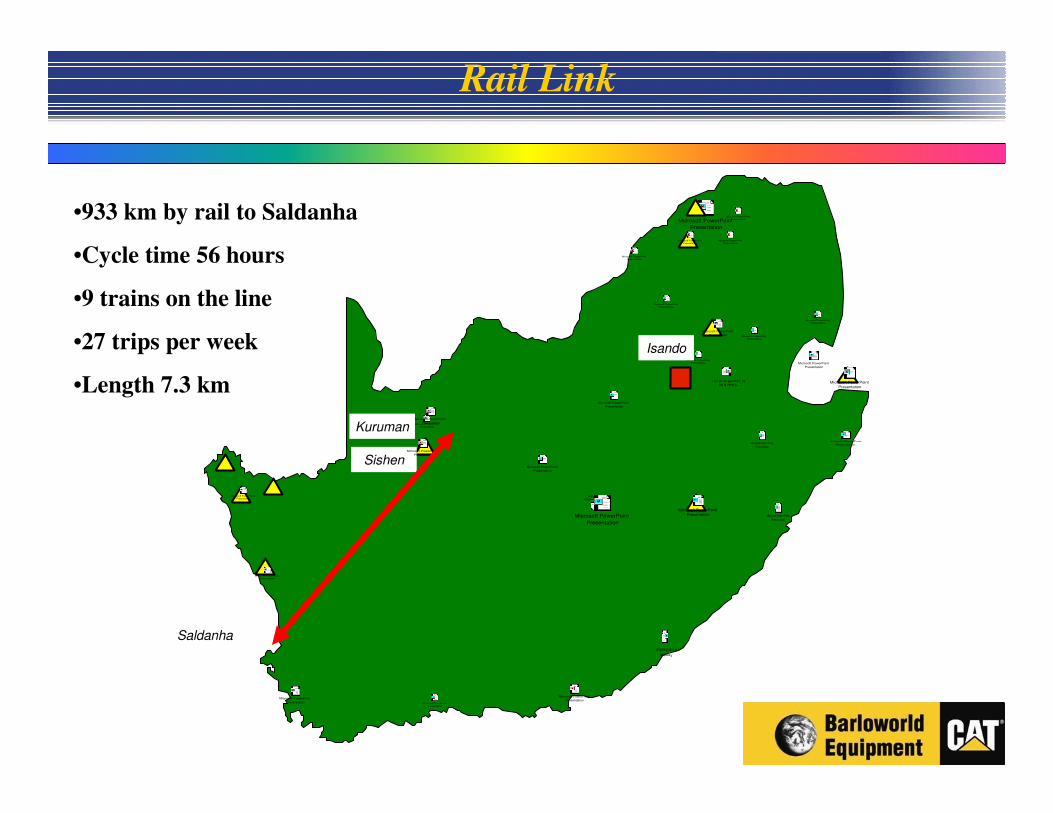
•933 km by rail to Saldanha
•Cycle time 56 hours
•9 trains on the line
•27 trips per week
•Length 7.3 km
Rail Link
Rail Link cont.
• Single biggest influencing factor in Northern Cape.
• Upgrade of Saldanha harbor underway
• Upgrade of line in progress• Add in additional loops
• Increase amount of wagons in a train
• Upgrade wagons from 85t to 100t
• Improve turnaround time of the train
• Rail replacement programme 2008
• Target completion date 2009/10
• Transport of manganese and iron ore constitutes a large part of final cost
Northern Cape Market Overview
• Increase in Contract mining
– Kumba Sishen, Beeshoek and starting at Khumani
• Production increase
– Iron ore (Khumani and Sishen) and cement at Holcim.
• Equipment requirements for the long term
– Technology driven
– Operator safety and comfort
– Environmental control

The land of opportunity

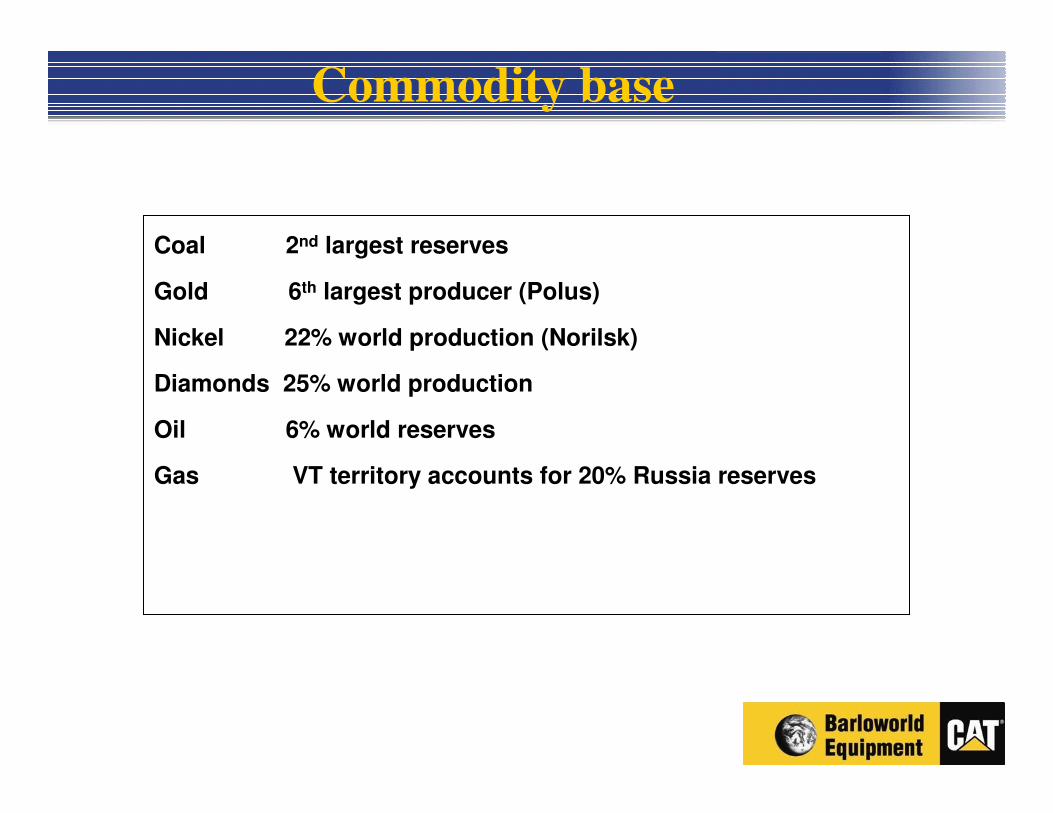
Coal 2nd largest reserves
Gold 6th largest producer (Polus)
Nickel 22% world production (Norilsk)
Diamonds 25% world production
Oil 6% world reserves
Gas VT territory accounts for 20% Russia reserves
Commodity base
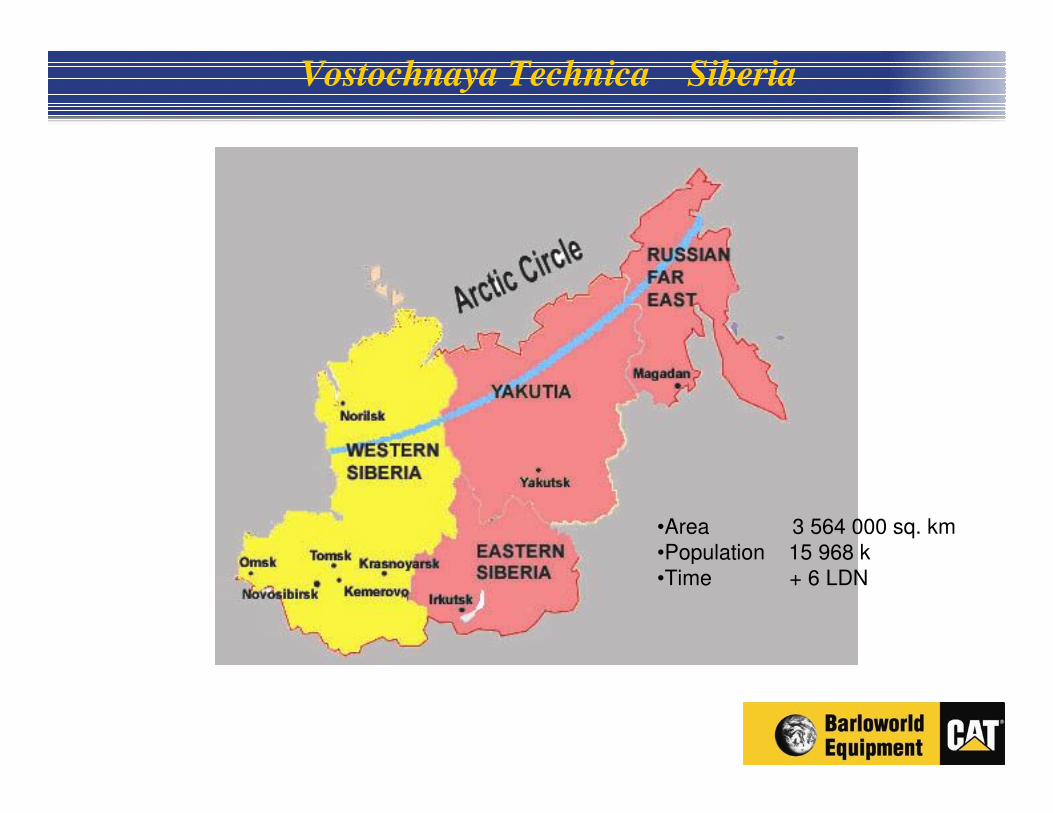
Vostochnaya Technica Siberia
•Area 3 564 000 sq. km•Population 15 968 k•Time + 6 LDN
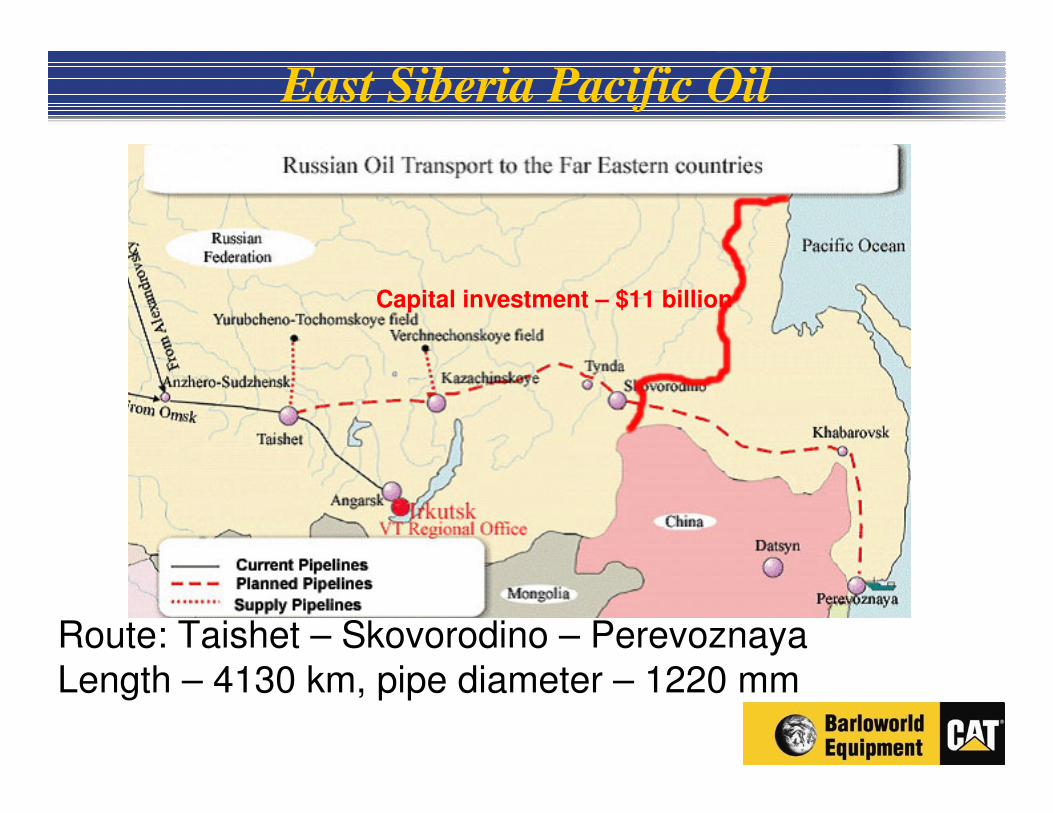
East Siberia Pacific Oil
Route: Taishet – Skovorodino – PerevoznayaLength – 4130 km, pipe diameter – 1220 mm
Capital investment – $11 billion

On track for $100m target

Conclusion
• Machine Cycle from Replacement to Expansion
• Customer Backorder at R4,3bn (6/06) R 3bn (3/06)
• Truck availability constrained by tyre shortages
• Demand for quality people