equity factor investing - frinfo.assetmanagement.hsbc.com · 8 non contractual document hsbc equity...
TRANSCRIPT

25 January 2018
Minimising unintended risks to enhance client outcomes
This document is intended for Professional Clients as defined by MIFID only and should not be distributed to or relied upon by Non
professional clients. The information contained in this publication is not intended as investment advice or recommendation. This
information has no contractual value and is not by any means intended as a solicitation, nor an investment advice for the purchase or
sale of any financial instrument in any jurisdiction in which such an offer is not lawful.
Non contractual document
Equity Factor Investing

2
• Smart Beta / Factor Investing Landscape Section 1
• Equity Factor Investing: our Story Section 2
• Multi-factor equity: our approach Section 3
• Multi-factor equity: pure factor solutions Section 4
− Equity Multi-factor Core Section 5
− Equity Multi-Factor Income Section 6
− Equity Multi-Factor Stable Volatility Section 7
− Equity Multi-factor Stable ESG Section 8
− Equity Multi-Factor Stable Lower Carbon Section 9
• Conclusions Section 10
• Key risks to consider when investing
• Appendix
− Biographies
− Thought leadership
− GIPS® reporting
− Important information
Contents

Smart Beta / Factor Investing Landscape
4 Non contractual document
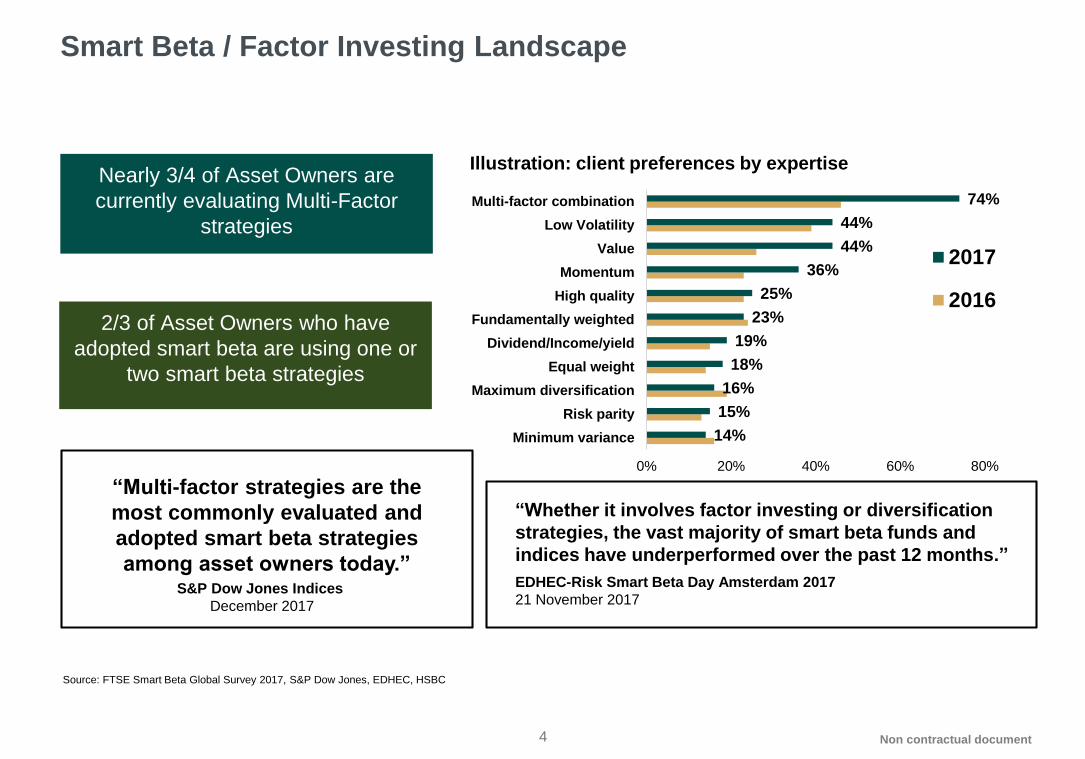
Smart Beta / Factor Investing Landscape
Nearly 3/4 of Asset Owners are
currently evaluating Multi-Factor
strategies
2/3 of Asset Owners who have
adopted smart beta are using one or
two smart beta strategies
14%
15%
16%
18%
19%
23%
25%
36%
44%
44%
74%
0% 20% 40% 60% 80%
Minimum variance
Risk parity
Maximum diversification
Equal weight
Dividend/Income/yield
Fundamentally weighted
High quality
Momentum
Value
Low Volatility
Multi-factor combination
2017
2016
Source: FTSE Smart Beta Global Survey 2017, S&P Dow Jones, EDHEC, HSBC
S&P Dow Jones Indices
December 2017
EDHEC-Risk Smart Beta Day Amsterdam 2017
21 November 2017
“Whether it involves factor investing or diversification
strategies, the vast majority of smart beta funds and
indices have underperformed over the past 12 months.”
Illustration: client preferences by expertise
“Multi-factor strategies are the
most commonly evaluated and
adopted smart beta strategies
among asset owners today.”

5 Non contractual document
Smart Beta / Factor Investing LandscapeFTSE 2017 Smart Beta global survey key findings
Why are investors moving into Smart Beta strategies?
• In 2017, Risk reduction (55%) took the lead vs return enhancement
• Cost savings’ is becoming more important
Source: FTSE Smart Beta Global Survey 2017
0% 10% 20% 30% 40% 50% 60% 70%
Other
Income generation
Provide specific factor exposure
Cost savings
Improve diversification
Return Enhancement
Risk reduction2017
2016
2015
2014

Equity Factor Investing
Our story

7 Non contractual document
1st Mandate
launched for
Institutional
client seeking
to outperform
the MSCI World
(gross)
benchmark
Global Equities
(MSCI ACWI
based) strategy
launched
UK Mutual
funds launched
– US, UK and
Japan country
funds
Systematic
Research team
restructured
within HSBC
Global Asset
Management
Research
alignment and
model
alignment
Resource
increase within
Systematic
Equity
Research team
and update to
risk modeling
February 2017
Income
strategy
launched
September
2017
HSBC GIF
Global Equity
Lower Carbon
Fund Launch
October 2017
Multi-Factor
Worldwide ETF
launched
Resource
increase in
both Research
and Portfolio
Management
alongside AUM
growth
HSBC Global Asset ManagementA story of strong growth in equity factor investing
Any performance information shown refers to the past and should not be seen as an indication of future returns.
Source: HSBC Global Asset Management as at end of December 2017. For illustrative purposes only.
HSBC Equity
Factor
Investing
1st mandate: Launched in 2004; benchmark MSCI World (gross)
MSCI ACWI mandate running for over 10 years : Launched in 2006
Track record Information Ratio of 0.7 since inception
Pooled funds: core, income tilted & Carbon constrained exposure
USD 10+ bnAUM USD 5+ bn
2011
2013
20
17
2006
20
04
2016
2015

8 Non contractual document
HSBC Equity capabilitiesAll strategies share a responsible investment philosophy
Source: HSBC Global Asset Management as at 31 December 2017. Representative overview of the investment process, which may differ by product, client mandate or market conditions.
For informational purposes only and should not be construed as a recommendation for any investment product or strategy. Not an exhaustive list of capabilities. For illustrative purposes only.
Cost efficient index replication
Efficient exposure to reference cap-weighted indices
Transparent end-to-end process focused on minimising implementation costs
Risk managed efficient portfolio replication
Physical replication; fully replicated or optimised
Intelligent implementation of index changes
Passive Strategies
Global, regional & single country
Customised implementation
– Full replication
– Enhanced Implementation
– Optimised implementation
Enhanced risk adjusted returns
Aims to improve risk-adjusted return relative to cap-weighted indices
Cost efficient equity fulfilment & customized solutions
Proprietary insights driven by experienced & well resourced research & portfolio
management teams
Diversifies risk through portfolio construction & the combination of multiple factors
Intelligent implementation of portfolio rebalances
Active Systematic Global, regional & single country
– Core Multi Factor
– Stable Volatility
– Enhanced Income
– Lower Carbon and ESG Tilt
– Fundamental weighting
Stock selection driving alpha
Common philosophy across strategies: captures deviations from the well established
relationship between profitability & valuation
Proprietary fundamental research & integrated ESG analysis confirms the
opportunity
Shared insights & perspectives from the broad global investment team
Proprietary decision-support tools reinforce disciplined approach
Active Fundamental
Global, regional & single country
– Core
– Volatility Focus
– Income
– Small Cap
– Thematic/ESG
Integregated
ESG Research
Active Ownership
Policy & Advocacy
HSBC
Equity
Factor
Investing

9 Non contractual document
Investment and product teamIndex and systematic equities
An experienced investment team with strong industry experience (Yrs in HSBC in brackets)
1. Also provide implementation support in Hong Kong
Source: HSBC Global Asset Management as of 31 December 2017.
Vis Nayar, Deputy CIO Equities (22) Head of Systematic Strategies
CORE TRADING TEAMTrade Execution and
Analysis
CORE RESEARCH TEAMStrategy, Portfolio Construction and
Research
CORE IMPLEMENTATION TEAMPortfolio management and
Implementation
PRODUCT SPECIALIST TEAMPassive Equities: Market Capitalisation
and Smart Beta
Vis Nayar (22)
Head of Systematic Strategies
London
Ioannis Kampouris
(5)
Shan Jiang (2)
Lucy Dimtcheva (2)
Olivia Skilbeck (4)
Paul Denham (3)
Stamatis Sivitos (2)
Hans Hlynsson (7)
Helgi Magnusson (4)
Tunde Ajekigbe (3)
Antony Giles (2)
Vadim Karp (1)
Peng Xiao (<1)
Hong Kong
Wai Man Ko (13)
Cecil Li1 (13)
Plennie Mak1 (10)
Taipei
Scott Yu (8)
Weikuo Lin (6)
Paris
Cedric Carpentier
(15)
Joseph Molloy (3)
Head of Index and Systematic Equity
Portfolio Management
Natalie Kedgley
(10)
Portfolio Manager
Ed Gurung (10)
Portfolio Manager
Tiphaine
Kannangara (7)
Portfolio Manager
Nelson Gu (4)
Index Analyst
Peter Gray (6)
Portfolio Manager
Patricia
Keogh (5)
Portfolio Manager
Nina Assamany (3)
Assistant Fund
Manager
Haodong Gu (<1)
Assistant Fund
Manager
Simon Conroy (9)
Passive Technology
Puspal Roy (1)
Passive Technology
James Levy
Global Head Of Dealing
London
Steve Chappell
Kerem Onder
Adam Ottewill
John Stafford
Elena Ripca
David Carter
Aaron Water
Hong Kong
Samuel Lai
Anand Narayan
Kee Mung
Danny Kwok
Bosco Mok
Alexander Davey
Senior Product Specialist
Carmen Gonzalez-Calatayud
Senior Product Specialist
Emmanuelle Harboun
Passive Product Specialist
George Taylor
Passive Product Specialist
Michael (Xiaochen) Sun
Smart Beta Product Specialist

Equity Factor Investing: our approach
11 Non contractual document
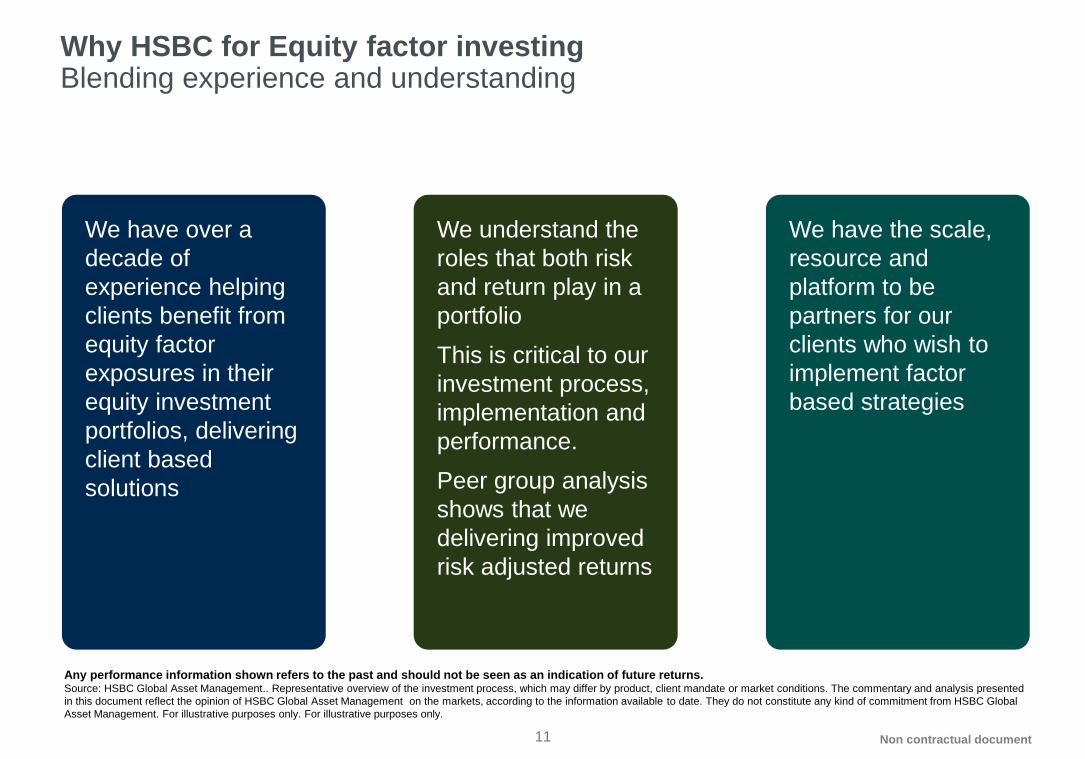
Why HSBC for Equity factor investingBlending experience and understanding
Any performance information shown refers to the past and should not be seen as an indication of future returns. Source: HSBC Global Asset Management.. Representative overview of the investment process, which may differ by product, client mandate or market conditions. The commentary and analysis presented
in this document reflect the opinion of HSBC Global Asset Management on the markets, according to the information available to date. They do not constitute any kind of commitment from HSBC Global
Asset Management. For illustrative purposes only. For illustrative purposes only.
We have the scale,
resource and
platform to be
partners for our
clients who wish to
implement factor
based strategies
We have over a
decade of
experience helping
clients benefit from
equity factor
exposures in their
equity investment
portfolios, delivering
client based
solutions
We understand the
roles that both risk
and return play in a
portfolio
This is critical to our
investment process,
implementation and
performance.
Peer group analysis
shows that we
delivering improved
risk adjusted returns

12 Non contractual document
Why use a Multi-Factor equity solution?Equity factors and how they may be helpful
Value Momentum
Quality Low Risk
Size
Best
Performer
Worst
Performer
0
Value Quality Momentum Low Risk Size
1998 1999 2000 2001 2002 2003 2004 2005 2006 2007 2008 2009 2010 2011 2012 2013 2014 2015 2016 2017 YTD
18.2% 7.9% 19.1%
17.5% 22.6% 10.7% 7.6% 11.9% 2.4%
12.6% 44.2% 13.2% 16.4% 9.2% 7.3% 6.8% 17.6% 12.7% 3.9% 28.2% 10.7% 2.2% 11.3%
16.0% 22.9% 4.9% 12.5% 11.0% 16.0% 5.1% 4.2% 1.3% 12.2% 11.2% 46.5% 2.8% 7.0% 9.7% 2.1% 14.5% 2.3%
3.1% 9.4% 4.0% 5.6% 10.0% 9.0% 2.0% 2.3% 0.5% 10.3% 8.2% 10.6% 2.3% 5.5% 0.8% 4.4% 0.8% 22.0% 5.9% 0.9%
-5.5% -3.6% -3.6% -2.8% -7.5% -5.8% -0.8% -5.9% -1.6% -3.6% -2.8% -1.1% -0.9% -1.0% -0.2% -1.6% -0.2%
-7.2% -6.8% -9.9% -11.9% -16.9% -2.8% -4.1% -7.4% -2.0% -1.2% -1.7% -2.2% -2.1% -4.1%
-14.3% -26.1% -16.5% -2.5% -5.6% -8.0%
-5.1% -13.1%
Simulated data is shown for illustrative purposes only, refers to the past and should not be relied on as indication for future returns. Source: HSBC Global Asset Management, FactSet, Worldscope, IBES, Bloomberg as of June 2017. Figures have been calculated using monthly total returns in USD from 30/01/1998 – 28/04/2017 with
S&P 500 Index as universe.
Simulations are based on Back Testing assuming that the optimisation models and rules in place today are applied to historical data. As with any mathematical model that calculates results from inputs,
results may vary significantly according to the values inputted. Prospective investors should understand the assumptions and evaluate whether they are appropriate for their purposes. Some relevant
events or conditions may not have been considered in the assumptions. Actual events or conditions may differ materially from assumptions.
• Factors drive stock risk and return, potentially enabling
outperformance of a standard ‘index’
• 5 key factors have been identified by academics and more
widely adopted by investors over the years
• Individual factors perform differently in different economic
cycles, multi-factor strategies highlight the benefits of
diversification and potentially enhancing returns across a
variety of economic regimes
Equity Multi-Factor Investing
“Pure” factor solutions
14 Non contractual document
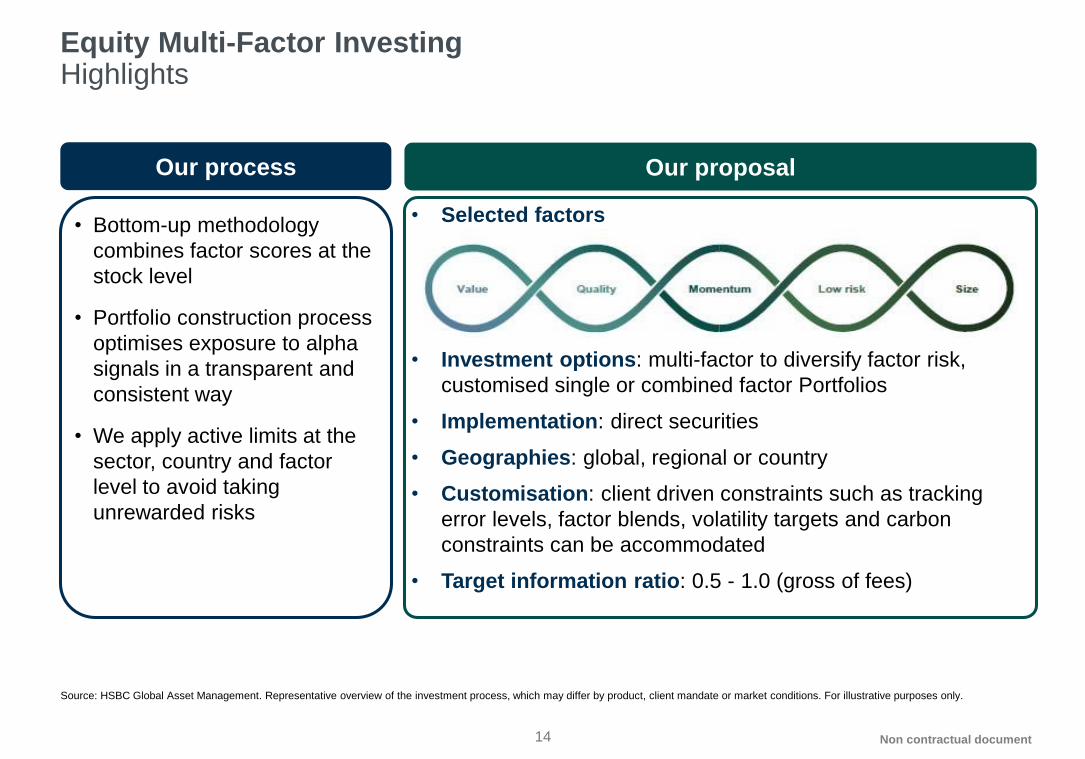
• Bottom-up methodology
combines factor scores at the
stock level
• Portfolio construction process
optimises exposure to alpha
signals in a transparent and
consistent way
• We apply active limits at the
sector, country and factor
level to avoid taking
unrewarded risks
Equity Multi-Factor InvestingHighlights
• Selected factors
• Investment options: multi-factor to diversify factor risk,
customised single or combined factor Portfolios
• Implementation: direct securities
• Geographies: global, regional or country
• Customisation: client driven constraints such as tracking
error levels, factor blends, volatility targets and carbon
constraints can be accommodated
• Target information ratio: 0.5 - 1.0 (gross of fees)
Our proposalOur process
Source: HSBC Global Asset Management. Representative overview of the investment process, which may differ by product, client mandate or market conditions. For illustrative purposes only.
15 Non contractual document
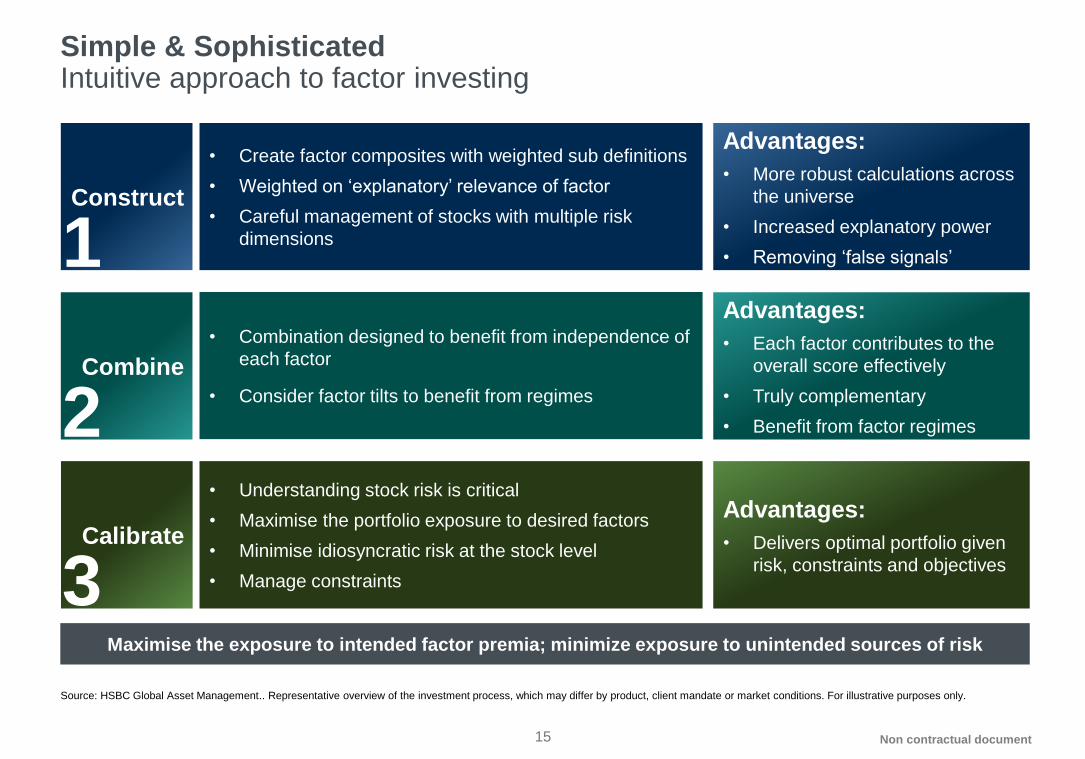
Simple & SophisticatedIntuitive approach to factor investing
Maximise the exposure to intended factor premia; minimize exposure to unintended sources of risk
Construct
• Create factor composites with weighted sub definitions
• Weighted on ‘explanatory’ relevance of factor
• Careful management of stocks with multiple risk
dimensions
Advantages:
• More robust calculations across
the universe
• Increased explanatory power
• Removing ‘false signals’
Combine
• Combination designed to benefit from independence of
each factor
• Consider factor tilts to benefit from regimes
Advantages:
• Each factor contributes to the
overall score effectively
• Truly complementary
• Benefit from factor regimes
Calibrate
• Understanding stock risk is critical
• Maximise the portfolio exposure to desired factors
• Minimise idiosyncratic risk at the stock level
• Manage constraints
Advantages:
• Delivers optimal portfolio given
risk, constraints and objectives
1
2
3
Source: HSBC Global Asset Management.. Representative overview of the investment process, which may differ by product, client mandate or market conditions. For illustrative purposes only.

16 Non contractual document
I. Constructing a composite factorCarefully considered factor composites
Historic value
Current value
Risk adjusted
value
Forward value
Profitability
Leverage
Earnings quality
Group
momentum
Multiple
specification
periods
Predicted beta
Uses estimated
volatilities and
correlations
Market
capitalization
Sales
Total assets
Value Quality Momentum Low risk Size
Typically
pro-cyclicalTypically
defensiveDynamic
Typically
pro-cyclical
Typically
defensive
Construct
II. Combine
Advantages:
• More robust calculations across the universe
• Increased explanatory power
• Removing ‘false signals’
• Create factor composites with weighted sub components
• Weighted on ‘explanatory’ relevance of components
• Careful management of stocks with multiple risk dimensions1
Source: HSBC Global Asset Management.. Representative overview of the investment process, which may differ by product, client mandate or market conditions. For illustrative purposes only.

17 Non contractual document
II. Combine - the Multi Factors Signal TiltTilted Weights – small but positive expected benefits
• Portfolios can benefit from the observation that factor regimes:
― Tend to be persistent for a number of months
― Transition points are difficult to time
• We focus our portfolios on a tilt towards factors that are working today, however this tilt is anchored around an equal weighting point.
• This ‘tilt’ enables capital to remain deployed in less correlated factors, which can be advantageous as performance regimes develop
0
200
400
600
800
avr.-01 avr.-03 avr.-05 avr.-07 avr.-09 avr.-11 avr.-13 avr.-15
Equally Weighted Raw Factor
Equally Weighted StatisticallyIndependentTilted Model
0%
20%
40%
60%
80%
100%
Mar-01 Mar-03 Mar-05 Mar-07 Mar-09 Mar-11 Mar-13 Mar-15Value Quality Momentum Lowbeta Size
Simulated data is shown for illustrative purposes only, refers to the past and should not be relied on as indication for future returns. Source: HSBC Global Asset Management, FactSet, Worldscope, IBES, Bloomberg as of 31 December 2016. Figures have been calculated using monthly total returns in USD from 01 March 2001 – 31
December 2016. Simulations are based on Back Tested results. Backtested results have inherent limitations, some of which are described below. Backtested returns do not represent the performance
results of actual trading or portfolio asset allocations for any client assets or portfolios. Backtested returns are calculated through the retroactive application of the proposed asset allocation to its relevant
benchmark and are produced with the benefit of hindsight. Therefore, the performance results are not indicative of the skill of HSBC Global Asset Management or of future results. Since backtested
performance results do not represent actual trading or portfolio asset allocations they may not reflect the impact that material economic and market factors might have had on decisions made in actual
trading or portfolio asset allocations. No representation is being made that any portfolio will or is likely to achieve profits or losses similar to those shown. In fact, there are frequently significant material
differences between backtested performance and performance results subsequently achieved by following a particular strategy. See the Important Information section for additional information on
backtested results. Representative overview of the investment process, which may differ by product, client mandate or market conditions. For illustrative purposes only.
Combine
Advantages:
• Each factor contributes to the overall
score effectively
• Truly complementary
• Benefit from factor cyclicality
• Combination designed to benefit from independence of each
factor
• Consider factor tilts to benefit from regimes2

18 Non contractual document
Calibrate
II. Combine
Advantages:
• Delivers optimal portfolio given risk,
constraints and objectives
• Understanding stock risk is critical
• Maximise the portfolio exposure to desired factors
• Minimise idiosyncratic risk at the stock level
• Manage constraints3
III. Calibrate – Understanding stock risk is criticalStocks exhibit multiple factor characteristics
Source: HSBC Global Asset Management, illustration as of April 2017. Representative overview of the investment process, which may differ by product, client mandate or market conditions.
For illustrative purposes only.
• Stocks may exhibit multiple factor characteristics simultaneously
• Issue: If we combine multiple stocks ‘naively’, we may suffer a loss of diversification
• Why: Simple or naïve combinations of factors may lead to one set of factor exposures - quality, low risk,
size - cancelling exposures to another factor, such as value
• Risk can potentially increase, and the benefits of factor diversification are diluted
-3,00
-1,00
1,00
3,00Value
Quality
MomentumLow Risk
Size
JOHNSON & JOHNSON
-3,00
-2,00
-1,00
0,00
1,00
2,00
3,00Value
Quality
MomentumLow Risk
Size
APPLE INC
-3,00
-2,00
-1,00
0,00
1,00
2,00
3,00Value
Quality
MomentumLow Risk
Size
MICROSOFT CORP

19 Non contractual document
III. Calibrate - Intuitive Portfolio ConstructionCalibrated signal serves to drive stock weightings
Name Sector Country
Multi-
Factor
Score
Value Quality MomentumLow
RiskSize
Trade
Weight
KLA TENCORInformation
TechnologyUS 2.43 -0.37 1.04 2.79 0.72 0.5 0.2
STAPLESConsumer
DiscretionaryUS 1.76 1.43 -0.11 0.63 -0.27 -0.1 0.13
CONOCOPHILLIPS Energy US -0.26 0.16 -1.78 1.12 -1.05 -1.38 0.13
SEGATE
TECHNOLOGY
Information
TechnologyUS -0.48 0.27 -0.27 -0.5 -1.34 -0.07 -0.18
PAY CHEXInformation
TechnologyUS -0.44 -1.47 1.4 -0.93 1.57 0.09 -0.23
driven by the initial portfolio’s underweight in the Energy
sector.
driven by a high ranking on our combined multi-factor score
due to a low ranking on our combined multi-factor score
Individual factor scores are made independent to
enable us to calibrate the final multi factor score with
tilting towards factors that are working today
Portfolio Optimisation
Initial Portfolio
Optimal Portfolio
Multi-Factor Score
Risk Model
Constraints
Information Coefficient
\
Simulated data is shown for illustrative purposes only, refers to the past and should not be relied on as indication for future returns. Source: HSBC Global Asset Management. Simulated data is shown for illustrative purposes only, and should not be relied on as indication for future returns. Simulations are based on Back Tested results.
Backtested results have inherent limitations, some of which are described below. Backtested returns do not represent the performance results of actual trading or portfolio asset allocations for any client
assets or portfolios. Backtested returns are calculated through the retroactive application of the proposed asset allocation to its relevant benchmark and are produced with the benefit of hindsight.
Therefore, the performance results are not indicative of the skill of HSBC Global Asset Management or of future results. Since backtested performance results do not represent actual trading or portfolio
asset allocations they may not reflect the impact that material economic and market factors might have had on decisions made in actual trading or portfolio asset allocations. No representation is being
made that any portfolio will or is likely to achieve profits or losses similar to those shown. In fact, there are frequently significant material differences between backtested performance and performance
results subsequently achieved by following a particular strategy. See the Important Information section for additional information on backtested results. Representative overview of the investment process,
which may differ by product, client mandate or market conditions. For illustrative purposes only.

20 Non contractual document
Passive and Systematic Equity InvestingFocus on investment process and efficient implementation
Teams input Process flow for each trade
Investment universe: liquid, investable stocks on-benchmark
Add value on rebalancing & benchmark events: ultimate goal of maximising risk-adjusted returns after all costs
Recommended trades: cost effective implementation, compatible with portfolio risk parameters
Continuous Review : Post-trade stock and Attribution analysis, Performance impact & monitoring
Active Systematic Models
Proprietary risk model
Corporate Actions
Transaction Costs
Tracking Error Budget Allocation
Defined Operating Parameters
Customised portfolio tools
Generate optimised basket trades
Corporate Actions
Client Exclusions
Dividend Elections
Proprietary Index Predictions
Additional Analytics & Data
Tracking Error Budget Allocation
Multi horizon trading periods
Best Execution
Portfolio Implementation
Enhancement strategy
Portfolio construction
Trading strategy
Model Portfolio Changes
Filters & Exclusions
Holdings
Optimisation / Replicated
Pre Trade Analysis
Size
Timing
Liquidity & Risk
Portfolio Construction
Corporate Actions
Index Changes
Implementation
Systematic Equity Research
Systematic and Index Equity
Portfolio Management
Global Trading Team
Source: HSBC Global Asset Management.. Representative overview of the investment process, which may differ by product, client mandate or market conditions. For illustrative purposes only.

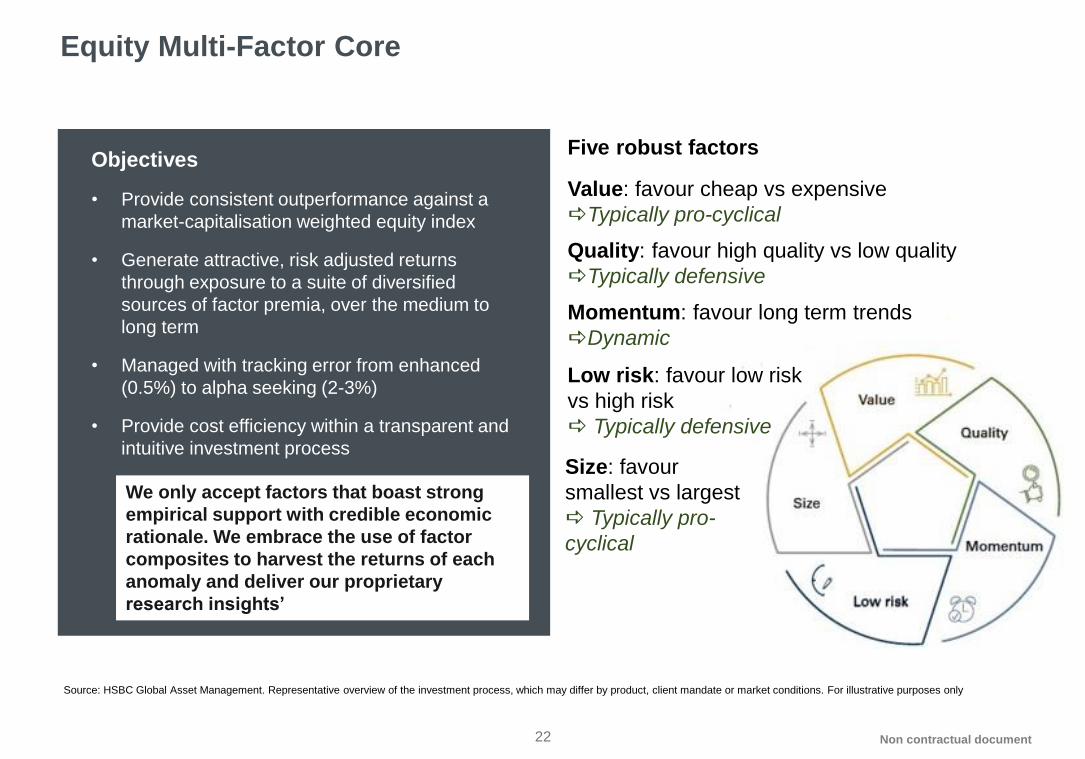
Equity Multi-Factor CoreControlled exposure to 5 robust factors
22 Non contractual document
Equity Multi-Factor Core
Objectives
• Provide consistent outperformance against a
market-capitalisation weighted equity index
• Generate attractive, risk adjusted returns
through exposure to a suite of diversified
sources of factor premia, over the medium to
long term
• Managed with tracking error from enhanced
(0.5%) to alpha seeking (2-3%)
• Provide cost efficiency within a transparent and
intuitive investment process
We only accept factors that boast strong
empirical support with credible economic
rationale. We embrace the use of factor
composites to harvest the returns of each
anomaly and deliver our proprietary
research insights’
Five robust factors
Value: favour cheap vs expensive
aTypically pro-cyclical
Quality: favour high quality vs low quality
aTypically defensive
Momentum: favour long term trends
aDynamic
Low risk: favour low risk
vs high risk
a Typically defensive
Size: favour
smallest vs largest
a Typically pro-
cyclical
Source: HSBC Global Asset Management. Representative overview of the investment process, which may differ by product, client mandate or market conditions. For illustrative purposes only

23 Non contractual document
Multi-Factor Global Equity – superior risk-adjusted returnsSupplemental information and external peer comparison
Performance % in USD – low tracking error (~50bps)1
Any performance information shown refers to the past and should not be seen as an indication of future returns.
Performance is gross of fees and would be lowered after deduction of management and administrative fees. 1 Source: HSBC Global Asset Management as at end of September 2017. * Annualised Returns.3 Prior to Oct 2006 benchmark was MSCI World ex Energy. From Oct 2006-Dec07 the benchmark was 45% S&P 500 Gross, 30% DJ Euro Stoxx Gross 50, 10% Nikkei 225 Price, 10% FTSE 100 Gross,
5% S&P / ASX 200 Gross. From Jan 08 to Nov 11 benchmark was 40% S&P 500 Gross, 35% DJ Euro Stoxx 50 Gross, 10% Nikkei 225 Price, 10% FTSE 100 Gross, 5% S&P / ASX 200 Gross. From
Nov11 the benchmark is MSCI World Index with Gross Dividend reinvested, unhedged.2 Source: eVestment Alliance, LLC and its affiliated entities (collectively, “eVestment”) collect information directly from investment management firms and other sources believed to be reliable, however,
eVestment does not guarantee or warrant the accuracy, timeliness, or completeness of the information provided and is not responsible for any errors or omissions. Performance results may be provided
with additional disclosures available on eVestment’s systems and other important considerations such as fees that may be applicable. Not for general distribution and limited distribution may only be made
pursuant to client’s agreement terms. All categories not necessarily included, Totals may not equal 100%. Copyright 2012-2017 eVestment Alliance, LLC. All Rights Reserved.
2,3
4,9
16,3
8,5
11,8
2,3
5,0
16,5
8,3
11,6
0,0
2,0
4,0
6,0
8,0
10,0
12,0
14,0
16,0
18,0
1m 3m YTD 3Y* 5Y*
Composite - Equity Enhanced Global Low TE
Benchmark: MSCI World (Gross)
1 2
We have a strong track record of delivering strong risk adjusted returns in core Multi-Factor Equity
portfolios
3
Three year statistics vs. eVestment Global Smart Beta Equity vs.
MSCI World-ND displayed in vehicle base currency USD2
The commentary and analysis presented in this document reflect the opinion of HSBC Global Asset Management on the markets, according to the information available to date. They do not constitute
any kind of commitment from HSBC Global Asset Management
From Core to Customised Solutions

Equity Multi-Factor IncomeTilted to enhance portfolio income

26 Non contractual document
Equity Multi-Factor IncomeTilted for income & minimise risk characteristics
How do we tilt for ‘income’?
1. Identify stocks from a universe of investable securities
2. Rank the stocks based on income characteristics: dividend yield, cash flow
yield & return of investment capital
3. Screen the universe of stocks according to the amount of dividends paid to
stock holders relative to the amount of total income of a company
How do we implement a multi-factor portfolio for income?
1. We seek to isolate income opportunities within our ‘bottom up’ process
− We have embedded income embedded into our proprietary
systematic investment process
− We will build a portfolio that maximises exposure to stocks with the
most attractive income characteristics
2. Alongside, we will minimise the portfolio’s risk characteristics by applying a
series of constraints:
− Sector, country and stock weights
Source: HSBC Global Asset Management. Representative overview of the investment process, which may differ by product, client mandate or market conditions. For illustrative purposes only
We view ‘income
characteristics’ as
embedded in our
broader factor
definitions
MSCI defines ‘Dividend’
as a ‘6th’ factor’

Equity Multi-Factor Stable VolatilityTilted for sensitivity to volatility

28 Non contractual document
Equity Multi-Factor Stable VolatilityPortfolio implementation and management
• The portfolio combines equities, cash & index futures
• Ongoing volatility is monitored (1) on a weekly basis & (2) based on a volatility target
• Participation rate: we increase money allocated to cash if we are running close to the volatility target
• Smaller drawdowns & smoother ride over time by balancing downside mitigation with upside
participation regardless of the market environment
• We optionally short the market to hedge against the “allocation volatility”, maintaining (1) lower
turnover & (2) higher average equity exposure
We aim to be fully invested over the cycle to enhance returns
Source: HSBC Global Asset Management. Representative overview of the investment process, which may differ by product, client mandate or market conditions. For illustrative purposes only

29 Non contractual document
Existing sell-side solutions
Volatility targeting is attractive under Solvency II (and lower
option costs)
Underlying typically limited to index strategies (market beta)
Frequent rebalancing between cash and equities is
unappealing
Multi Factor Stable Volatility aims to improve
risk-adjusted returns
• We can customize for clients, incorporating additional
requirements such as ESG improvement
• Manage volatility through weekly rebalances and use short
index futures as appropriate. Only allocate to cash if absolutely
necessary. This will improve participation rate
0%
20%
40%
60%
80%
100%
120%
févr.
05
août 05
févr.
06
août 06
févr.
07
août 07
févr.
08
août 08
févr.
09
août 09
févr.
10
août 10
févr.
11
août 11
févr.
12
août 12
févr.
13
août 13
févr.
14
août 14
févr.
15
août 15
févr.
16
août 16
févr.
17
août 17
Equity Multi-Factor Stable Volatility Innovation aligned with Clients needs
Source: HSBC Global Asset Management, 15 December 2017. Source: HSBC Global Asset Management, 15 November 2017. Since strategy inception in 2004.
Participation: Standard Target Volatility Strategy (10%)Participation: Stable Volatility Multi-Factor Strategy 10%
Target
Simulated data is shown for illustrative purposes only, refers to the past and should not be relied on as indication for future returns. Simulations are based on Back Tested results. Backtested results have inherent limitations, some of which are described below. Backtested returns do not represent the performance results of actual
trading or portfolio asset allocations for any client assets or portfolios. Backtested returns are calculated through the retroactive application of the proposed asset allocation to its relevant benchmark and
are produced with the benefit of hindsight. Therefore, the performance results are not indicative of the skill of HSBC Global Asset Management or of future results. Since backtested performance results
do not represent actual trading or portfolio asset allocations they may not reflect the impact that material economic and market factors might have had on decisions made in actual trading or portfolio
asset allocations. No representation is being made that any portfolio will or is likely to achieve profits or losses similar to those shown. In fact, there are frequently significant material differences between
backtested performance and performance results subsequently achieved by following a particular strategy. See the Important Information section for additional information on backtested results
0%
20%
40%
60%
80%
100%
120%
févr.
05
août 05
févr.
06
août 06
févr.
07
août 07
févr.
08
août 08
févr.
09
août 09
févr.
10
août 10
févr.
11
août 11
févr.
12
août 12
févr.
13
août 13
févr.
14
août 14
févr.
15
août 15
févr.
16
août 16
févr.
17
août 17
The commentary and analysis presented in this document reflect the opinion of HSBC Global Asset Management on the markets, according to the information available to date. They do not constitute
any kind of commitment from HSBC Global Asset Management
Equity Multi-Factor ESGTilted to beat an index with ESG improvement

31 Non contractual document
Equity Factor-based ESG investingYour options…
Source: HSBC Global Asset Management. For illustrative purposes only.
Passive
tiltingTrack the index
with ESG
improvement
Factor
ESGBeat the index
with ESG
improvement
ESG is a risk
& an opportunity
ESG is integrated
in our processVoting and engagement
Our investment approach…

Equity Multi-Factor Lower Carbon
HSBC GIF Global Equity Lower CarbonTilted to reduce climate-related financial risk

33 Non contractual document
Global landscape: our changing climate
Temperature rising
Source: NASA. Temperature data from four international science institutions show rapid
warming in the past few decades and that the last decade has been the warmest on record.
NASA Goddard Institute for Space Studies
Hadley Centre/Climatic Research Unit
NOAA National Centre for Environmental Information
Japanese Meteorological Agency
0.8
0.6
0.4
0.2
0.0
0.2
0.4
0.6
1880 1900 1920 1940 1960 1980 2000 2020
Temperature Anomaly (0C)
Source: Earth System Research Laboratory (NOAA)
CO2 concentration on the rise
385
390
395
400
405
410
Jan Feb Mar Apr May Jun Jul Aug Sep Oct Nov Dec
ppm
2015 2016 2014
2013
Source: NSIDC, NOAA
March Arctic sea ice extent
14.25
14.75
15.25
15.75
16.25
1981 1987 1993 1999 2005 2011 2017
Million km2
Mean sea level rise
9.0
Cm
7.0
5.0
3.0
1.0
-1.0
1996 1998 2001 2003 2005 2008 2010 2012 2014 2016
Source: Univ. of Colorado; Shows the global mean sea level rise over 1996 level

34 Non contractual document
Viewpoint: we believe that climate change is an investment risk
Source: World Economic Forum Global Risks Perception Survey 2016, 12th edition
1 Extreme weather events
2 Large-scale involuntary migration
3 Natural disasters
4 Terrorist attacks
5 Data fraud or theft
6 Cyber attacks
7 Illicit Trade
8 Man-made environmental disasters
9 Interstate conflict
10 Failure of national governance
1 Weapons of mass destruction
2 Extreme weather events
3 Water crises
4 Natural disasters
5 Failure of climate-change mitigation and adaptation
6 Large-scale involuntary migration
7 Food crises
8 Terrorist attacks
9 interstate conflict
10 Unemployment or underemployment
Top 10 risks in terms of
Likelihood
Top 10 risks in terms of
Impact
Economic
Environmental
Geopolitical
Societal
Technological
Categories

35 Non contractual document
Viewpoint: investors are taking action to address climate risk
Source: HSBC Global Asset Management. For illustrative purposes only. The views expressed were held at the time of preparation and are subject to change without notice.
• Investors globally are under pressure from regulators and beneficiaries to reduce climate risks
• Analysis indicates that stranded asset risk has already led to financial losses in extractive industries
and power generation
• Carbon-intensive companies and industries face the greatest challenge, but stock exchanges and
market-cap based indices are carbon intensive
• Energy transition will drive new technology solutions and reduce the cost of existing clean
technology
• Effective carbon pricing will drive the energy transition
Managing climate-related investment risk for our clients is a material priority

36 Non contractual document
HSBC GIF Global Equity Lower CarbonKey portfolio characteristics
Base currency USD
Investment Universe /
Target Asset Allocation
Primarily in lower- carbon equities
issued by companies in developed
markets
Reference Benchmark MSCI World Net
Performance Target Aims to outperform the reference
benchmark over the medium to long
term with a 2-3% TE
Expected returns: aims to outperform
its reference benchmark per annum
before fees
Ex-ante TE range versus the
reference benchmark of 2-3%
Country Exposure Developed markets
Share Class Offering Denominated in USD and other
dealing currencies
Base currency hedged share classes
subject to approval
Objectives
• The strategy is intended to benefit from the
returns of equities, deliver outperformance
and reduce meaningfully the carbon impact
of the equity portfolio
• To achieve this we use a multi-factor
investment process to benefit from the
opportunity factors offer for outperformance
• All stocks in the portfolio undergo a
rigorous carbon footprint analysis
• A proprietary systematic investment
process is used to create a portfolio which
maximises the exposure to the most
attractive stocks and reduces the total
portfolio carbon footprint
Source: HSBC Global Asset Management, illustrations at 30 September 2017. Representative overview of the investment process, which may differ by product, client mandate or market conditions. For
illustrative purposes only

37 Non contractual document
HSBC GIF Global Equity Lower CarbonMaximise equity returns while reducing portfolio carbon intensity
• Investment objective is to outperform the benchmark with a lower carbon footprint
• Portfolio stock selection & sizing is driven with consideration of company carbon intensity data
• As per our Multi-Factor equity process, we maximise exposure to 5 factors, with carbon &
governance integrated into our model
• Broad ESG constraints deliver ESG enhancement
• We minimise the portfolio’s risk characteristics by applying a series of constraints: Sector, country &
stock weights
Quality Momentum Low risk SizeValue
We use carbon footprint analysis to measure the carbon associated with the fund, assess
climate-related investment risk & capture the market shift to a lower-carbon economy
ESG
Source: HSBC Global Asset Management. Representative overview of the investment process, which may differ by product, client mandate or market conditions. For illustrative purposes only

38
HSBC GIF Global Equity Lower Carbon Focused on carbon constraints to reduce carbon risk exposure
Carbon constrained (Lower Carbon) portfolio
• Improved benchmark returns - controlling
volatility & TE with a 60% carbon reduction
• Achieved by integrating into the investment
management process an assessment of the
carbon intensity of all stocks
Source: Data provided by independent third party carbon data providers, providing data on every company in the model portfolio, as at end of December 2017.
Representative overview of the investment process, which may differ by product, client mandate or market conditions. The commentary and analysis presented in this document reflect the opinion of HSBC
Global Asset Management on the markets, according to the information available to date. They do not constitute any kind of commitment from HSBC Global Asset Management. For illustrative purposes
only. For illustrative purposes only
0
50
100
150
200
CO2e mt/$ m revenue
Benchmark - MSCI World Lower Carbon
-60 %
Reduction
Outcome comparison
Relative carbon intensities of MSCI World vs a carbon constrained portfolio Carbon Intensity (tCO2e/USD mn revenue)
Our process and portfolio construction integrate carbon
constraints, allowing us to significantly reduce carbon risk
exposure (as measured by portfolio carbon intensity) while at the
same time seeking to generate returns that are better than the
benchmark
This investment solutions allows clients to maintain or outperform
their existing benchmark and also meet fiduciary obligations
We believe that “exclusion” is of
limited appeal given fiduciary
concerns that portfolio
performance may differ
substantially relative to a
traditional benchmark such as
the MSCI World
39
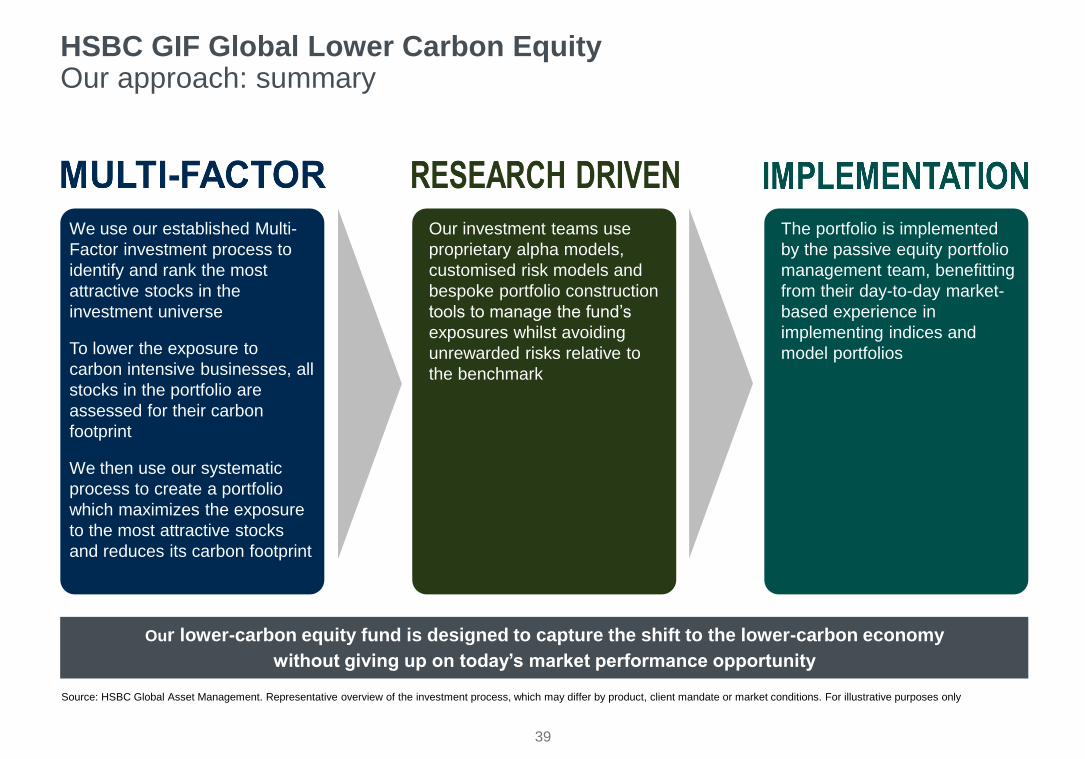
HSBC GIF Global Lower Carbon Equity Our approach: summary
Our lower-carbon equity fund is designed to capture the shift to the lower-carbon economy
without giving up on today’s market performance opportunity
The portfolio is implemented
by the passive equity portfolio
management team, benefitting
from their day-to-day market-
based experience in
implementing indices and
model portfolios
We use our established Multi-
Factor investment process to
identify and rank the most
attractive stocks in the
investment universe
To lower the exposure to
carbon intensive businesses, all
stocks in the portfolio are
assessed for their carbon
footprint
We then use our systematic
process to create a portfolio
which maximizes the exposure
to the most attractive stocks
and reduces its carbon footprint
Our investment teams use
proprietary alpha models,
customised risk models and
bespoke portfolio construction
tools to manage the fund’s
exposures whilst avoiding
unrewarded risks relative to
the benchmark
Source: HSBC Global Asset Management. Representative overview of the investment process, which may differ by product, client mandate or market conditions. For illustrative purposes only
Conclusions

41 Non contractual document
We understand the roles that
both risk and return play in a
portfolio – this is critical to
our investment process,
implementation and
performance. We deliver
better risk adjusted returns
than many of our peers
We have the scale, resource
and platform to be partners
for our clients who wish to
implement factor based
strategies
We have over a decade of
experience helping clients
benefit from equity factor
exposures in their equity
investment portfolios,
delivering client based
solutions
Equity Factor investing? Why consider HSBC as a partner?
Source: HSBC Global Asset Management.. For illustrative purposes only.

42
Key risks HSBC Multi Factor Equity Strategies & HSBC GIF Lower Carbon Equity
The value of an investment in the portfolios and any income from them can go down as well as up and as with
any investment you may not receive back the amount originally invested.
• Exchange Rate risk: Investing in assets denominated in a currency other than that of the investor’s own currency
perspective exposes the value of the investment to exchange rate fluctuations.
• Operational risk: The main risks are related to systems and process failures. Investment processes are overseen by
independent risk functions which are subject to independent audit and supervised by regulators.
• Derivative risk: The value of derivative contracts is dependent upon the performance of an underlying asset. A small
movement in the value of the underlying can cause a large movement in the value of the derivative. Unlike exchange
traded derivatives, over-the-counter (OTC) derivatives have credit risk associated with the counterparty or institution
facilitating the trade.

Appendix
44 Non contractual document
Source : HSBC Global Asset Management.
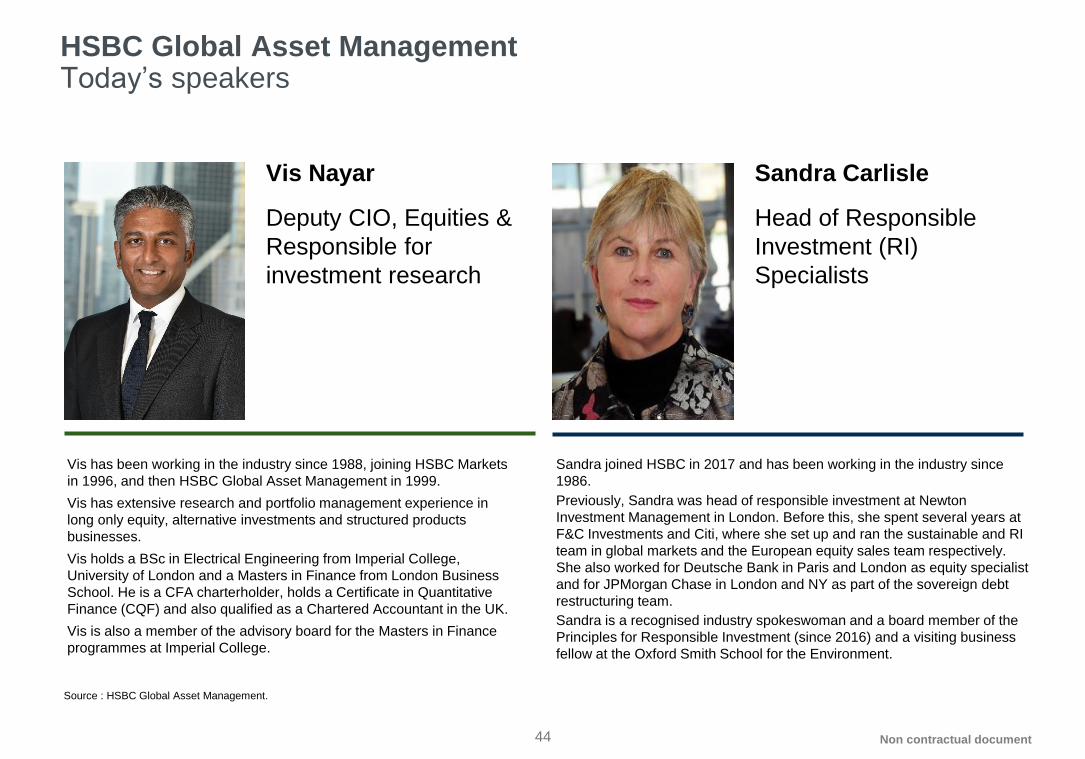
HSBC Global Asset ManagementToday’s speakers
Vis has been working in the industry since 1988, joining HSBC Markets
in 1996, and then HSBC Global Asset Management in 1999.
Vis has extensive research and portfolio management experience in
long only equity, alternative investments and structured products
businesses.
Vis holds a BSc in Electrical Engineering from Imperial College,
University of London and a Masters in Finance from London Business
School. He is a CFA charterholder, holds a Certificate in Quantitative
Finance (CQF) and also qualified as a Chartered Accountant in the UK.
Vis is also a member of the advisory board for the Masters in Finance
programmes at Imperial College.
Vis Nayar
Deputy CIO, Equities &
Responsible for
investment research
Sandra joined HSBC in 2017 and has been working in the industry since
1986.
Previously, Sandra was head of responsible investment at Newton
Investment Management in London. Before this, she spent several years at
F&C Investments and Citi, where she set up and ran the sustainable and RI
team in global markets and the European equity sales team respectively.
She also worked for Deutsche Bank in Paris and London as equity specialist
and for JPMorgan Chase in London and NY as part of the sovereign debt
restructuring team.
Sandra is a recognised industry spokeswoman and a board member of the
Principles for Responsible Investment (since 2016) and a visiting business
fellow at the Oxford Smith School for the Environment.
Sandra Carlisle
Head of Responsible
Investment (RI)
Specialists
45 Non contractual document
Source : HSBC Global Asset Management.
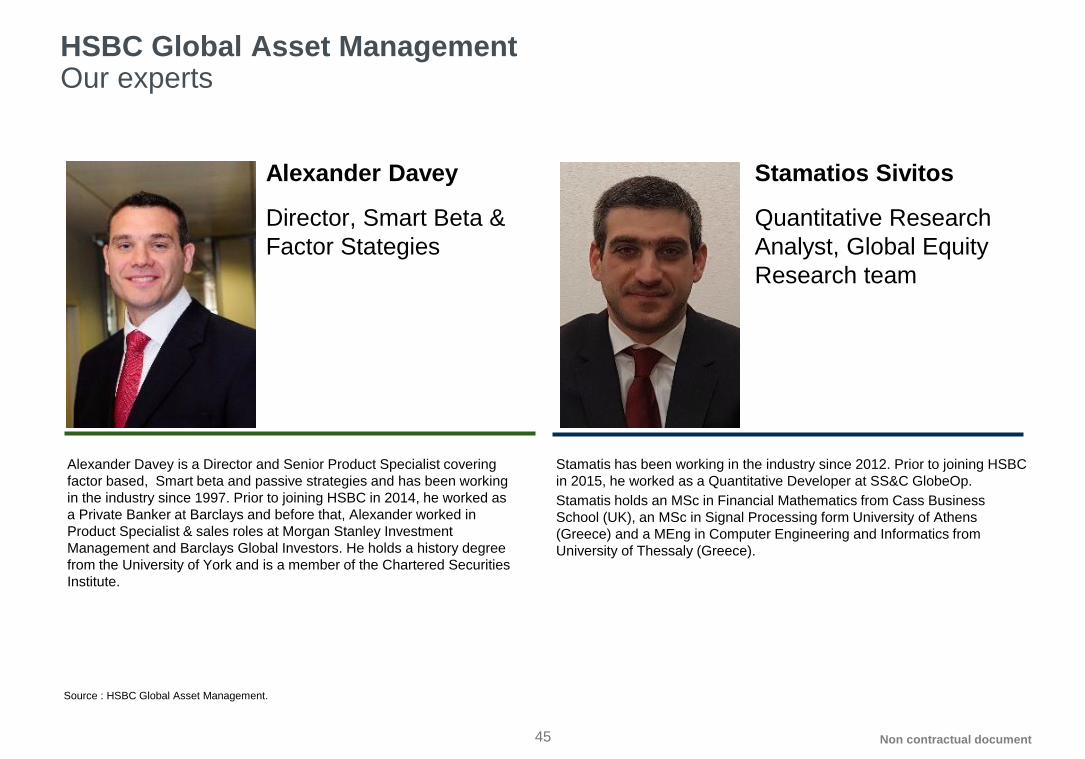
HSBC Global Asset ManagementOur experts
Alexander Davey is a Director and Senior Product Specialist covering
factor based, Smart beta and passive strategies and has been working
in the industry since 1997. Prior to joining HSBC in 2014, he worked as
a Private Banker at Barclays and before that, Alexander worked in
Product Specialist & sales roles at Morgan Stanley Investment
Management and Barclays Global Investors. He holds a history degree
from the University of York and is a member of the Chartered Securities
Institute.
Alexander Davey
Director, Smart Beta &
Factor Stategies
Stamatis has been working in the industry since 2012. Prior to joining HSBC
in 2015, he worked as a Quantitative Developer at SS&C GlobeOp.
Stamatis holds an MSc in Financial Mathematics from Cass Business
School (UK), an MSc in Signal Processing form University of Athens
(Greece) and a MEng in Computer Engineering and Informatics from
University of Thessaly (Greece).
Stamatios Sivitos
Quantitative Research
Analyst, Global Equity
Research team

46
HSBC Factor InvestingEquity factor investing landing page

47 Non contractual document
HSBC Active SystematicAn illustration of our research
For illustrative purposes only.

48 Non contractual document
Multi Factor Global EquitySupplemental information
Any performance information shown refers to the past and should not be seen as an indication of future returns.
Performance is gross of fees and would be lowered after deduction of management and administrative fees.
Source: HSBC Global Asset Management, as at 30 September 2017. Data is supplemental to the GIPS compliant report in the appendix.
Rolling year returns (%)
Equity Enhanced Global Low TE Combined30/09/2016
to 30/09/2017
30/09/2015 to
30/09/2016
30/09/2014 to
30/09/2015
30/09/2013 to
30/09/2014
30/09/2012 to
30/09/2013
Cumulated Composite Return 18.99 12.19 -4.29 13.11 20.92
Cumulated Benchmark Return 18.83 12.02 -4.57 12.80 20.90
Relative Difference 0.16 0.17 0.27 0.31 0.02
Strategy presented on pg 23
Low tracking error (~50bps)

49 Non contractual document
Equity Enhanced Global Low TE CombinedGIPS® report
Any performance information shown refers to the past and should not be seen as an indication of future returns.
Performance is gross of fees and would be lowered after deduction of management and administrative fees.
Multi-Factor Global Equity
Low tracking error (~50bps)
Strategy presented on pg 23
50 Non contractual document
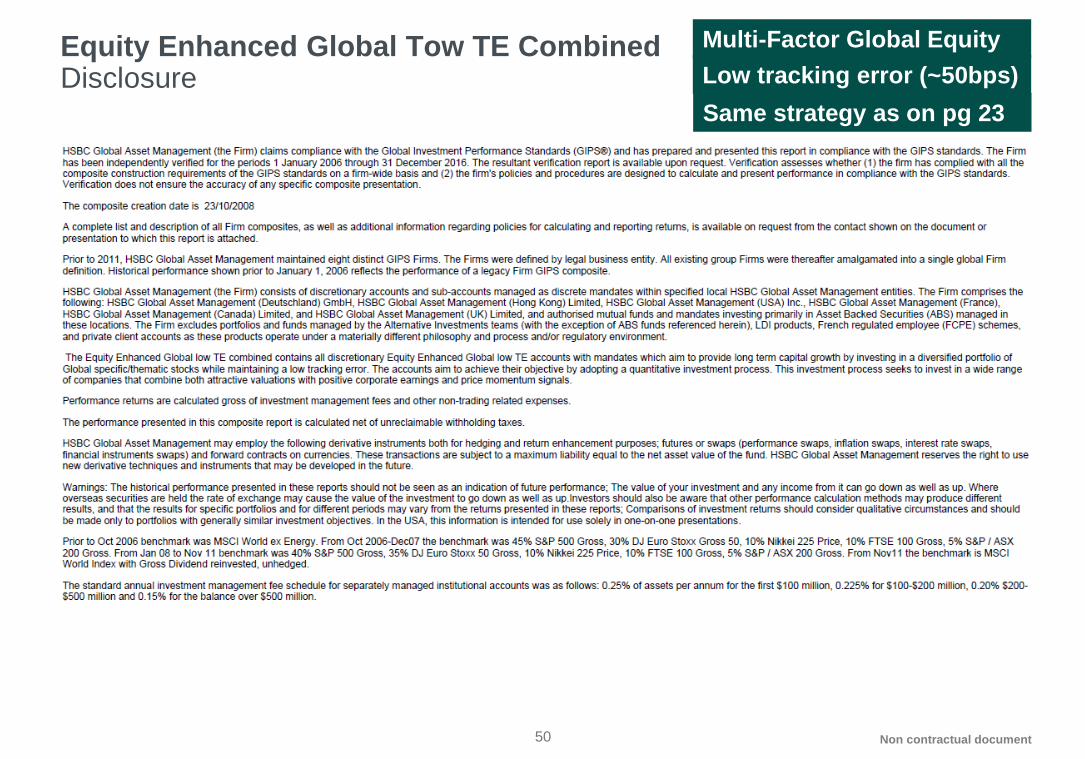
Equity Enhanced Global Tow TE CombinedDisclosure
Multi-Factor Global Equity
Low tracking error (~50bps)
Same strategy as on pg 23
Important information

52 Non contractual document
Important information
This document is distributed in France, Italy, Spain and Sweden by HSBC Global Asset Management (France), in Switzerland by HSBC Global Asset Management (Switzerland) Ltd and is only intended for professional investors as defined
by MIFID. It is incomplete without the oral briefing provided by the representatives of HSBC Global Asset Management. The information contained herein is subject to change without notice. All non-authorised reproduction or use of this
commentary and analysis will be the responsibility of the user and will be likely to lead to legal proceedings. This document has no contractual value and is not by any means intended as a solicitation, nor a recommendation for the purchase
or sale of any financial instrument in any jurisdiction in which such an offer is not lawful. The commentary and analysis presented in this document reflect the opinion of HSBC Global Asset Management on the markets, according to the
information available to date. They do not constitute any kind of commitment from HSBC Global Asset Management. Consequently, HSBC Global Asset Management will not be held responsible for any investment or disinvestment decision
taken on the basis of the commentary and/or analysis in this document. All data from HSBC Global Asset Management unless otherwise specified. Any third party information has been obtained from sources we believe to be reliable, but
which we have not independently verified.
The performance figures displayed in the document relate to the past and past performance should not be seen as an indication of future returns. The value of investments and any income from them can go down as well as up.
Capital is not guaranteed. Investments in emerging markets are by their nature higher risk and potentially more volatile than those inherent in established markets.
The value of investments and any income from them can go down as well as up and investors may not get back the amount originally invested. Where overseas investments are held the rate of currency exchange may cause the value of
such investments to go down as well as up. Stock market investments should be viewed as a medium to long term investment and should be held for at least five years. Investments in emerging markets are by their nature higher risk and
potentially more volatile than those inherent in some established markets.
The funds presented in this document may not be registered and/or authorised for sale in your country. It is important to remember that the value of investments and any income from them can go down as well as up and is not guaranteed.
Capital is not guaranteed. Where overseas investments are held the rate of exchange may cause the value to go down as well as up. Investments in emerging markets are by their nature higher risk and potentially more volatile than those
inherent in established markets. Funds that invest in securities listed on a stock exchange or market could be affected by general changes in the stock market. The value of investments can go down as well as up due to equity markets
movements.
HSBC Global Equity Lower Carbon is a subfund of HSBC Global Investment Funds, a Luxemburg domiciled SICAV. Shares of the Company may not be offered or sold for sale or sold to any "U.S. Person within the meaning of the Articles
of Incorporation, i.e. a citizen or resident of the United States of America (the "United States"), a partnership organised or existing under the laws of any state, territory or possession of the United States, or a corporation organised or
existing under the laws of the United States or of any state, territory or possession thereof, or any estate or trust, other than an estate or trust the income of which from sources outside the United States is not includible in gross income for
purposes of computing United States income tax payable by it. All subscriptions in any fund presented in this document are accepted only on the basis of the current prospectus, available on request from HSBC Global Asset Management
(France), the centralisation agent, the financial department or the usual representative. Before subscription, investors should refer to the Key Investors Information Document (KIID) of the fund as well as its complete prospectus. For more
detailed information on the risk associated with this fund, investors should refer to the complete prospectus of the fund. Subscriptions are accepted only on the basis of the current prospectus accompanied by the latest annual or half-yearly
report, available on request.
Source: MSCI. The MSCI information may only be used for your internal use, may not be reproduced or redisseminated in any form and may not be used to create any financial instruments or products or any indices. The MSCI information
is provided on an 'as is' basis and the user of this information assumes the entire risk of any use it may make or permit to be made of this information. Neither MSCI, any of its affiliates or any other person involved in or related to compiling,
computing or creating the MSCI information (collectively, the 'MSCI Parties') makes any express or implied warranties or representations with respect to such information or the results to be obtained by the use thereof, and the MSCI
Parties hereby expressly disclaim all warranties (including, without limitation, all warranties of originality, accuracy, completeness, timeliness, non-infringement, merchantability and fitness for a particular purpose) with respect to this
information. Without limiting any of the foregoing, in no event shall any MSCI Party have any liability for any direct, indirect, special, incidental, punitive, consequential or any other damages (including, without limitation, lost profits) even if
notified of, or if it might otherwise have anticipated, the possibility of such damages.
Important information for Luxembourg investors: HSBC entities in Luxembourg are regulated and authorised by the Commission de Surveillance du Secteur Financier (CSSF).
Important information for Swiss investors: This document may be distributed in Switzerland only to qualified investors according to Art. 10 para 3, 3bis and 3ter of the Federal Collective Investment Schemes Act (CISA). The presented fund
is authorised for distribution in Switzerland in the meaning of Art. 120 of the Federal Collective Investment Schemes Act. (Potential) investors are kindly asked to consult the latest issued Key Investor Information Document (KIID),
prospectus, articles of incorporation and the (semi-)annual report of the fund which may be obtained free of charge at the head office of the representative: HSBC Global Asset Management (Switzerland) Ltd., Gartenstrasse 26, P.O. Box,
CH-8002 Zurich. Paying agent in Switzerland: HSBC Private Bank (Suisse) SA, Quai des Bergues 9-17, P.O Box 2888, CH-1211 Genève 1.
HSBC Global Asset Management is the brand name for the asset management business of HSBC Group. The above document has been produced by HSBC Global Asset Management (France) and has been approved for
distribution/issue by the following entities :
HSBC Global Asset Management (France)
HSBC Global Asset Management (France) - 421 345 489 RCS Nanterre. Portfolio management company authorised by the French regulatory authority AMF (no. GP99026) with capital of 8.050.320 euros.
Offices: HSBC Global Asset Management (France) - Immeuble Coeur Défense - 110, esplanade du Général Charles de Gaulle - 92400 Courbevoie - La Défense 4 – France.
(Website: www.assetmanagement.hsbc.com/fr).
HSBC Global Asset Management (Switzerland) Limited
Gartenstrasse 26, P.O. Box, CH-8002 Zurich. Paying agent: HSBC Private Bank (Suisse) S.A., Quai des Bergues 9-17, P. O. Box 2888, CH-1211 Geneva 1(Website: www.assetmanagement.hsbc.com/ch)
Copyright © 2018. HSBC Global Asset Management (France). All rights reserved.
Non contractual document updated in January 2018 - AMFR_Ext_66_2018