september 2009 hsbc gif bric equity · hsbc gif bric equity . september 2009. for investment...
TRANSCRIPT

HSBC GIF BRIC Equity September 2009
For investment professionals only

Brazil

3
Source: Consensus by Brazilian Central Bank, HSBC Forecasts.
CPI Forecast 12M ahead(Grey lines = center and band of the target)
0
1
2
3
4
5
6
7
8
9
10
11
12
2003 2004 2005 2006 2007 2008 2009 2010
Macroeconomic framework: Successful inflation control…
•
Inflation target since Jun/99
•
Operational independence of CB
•
Full transparency
•
Proven track record

4
Household credit composition
Source: Brazilian Central Bank.
4
6
8
10
12
14
16
18
2001 2003 2005 2007 2009
Corporate Individuals
Credit volume(% of GDP)
… supported by credit expansion...
31,7%
28,1%
1,3%38,9%
Payroll Vehicles Mortgage Personal
31.7%
28.1%
1.3%38.9%

5
48%
50%
52%
54%
56%
58%
60%
62%
1990 1992 1994 1996 1998 2000 2002 2004 2006 2008
Source: MDIC, Funcex, Brazilian Central Bank, HSBC.
Ranking* Products
1st
Quartz and Niobium
2nd
Iron Ore and Bauxite
3rd
Manganese
5th
Tin Ore
Source: US Department of the Interior and US Geological Survey
*Production
Ranking* Products
1st
Ethanol
1st
Sugar
1st
Beef
1st
Coffee
2nd
Soybeans
2nd
Corn
2nd
Poultry
3rd
Pork
Source: USDA
*Production
Commodities exports(Exports directly or indirectly related to commodities)
Brazil is a key global commodities supplier…

6
Urban population% of total
Source: UN.
0
10
20
30
40
50
60
70
80
90
100
1950 1955 1960 1965 1970 1975 1980 1985 1990 1995 2000 2005 2010 2015
Brazil More developed countries Less developed countries
From the domestic point of view, Brazil has an attractive consumer market…
E E

7
15.0%
16.0%
17.0%
18.0%
19.0%
20.0%
1991 1993 1995 1997 1999 2001 2003 2005 2007 2009
Investment rate(Investments over GDP; Constant prices)
“PAC” project(In billion USD)
0
50
100
150
200
250
300
Energy Social /Urban
Logistics Total
Source: IBGE; Federal Government. “PAC” refers to Growth Acceleration Program.
“PAC”
project is a proxy for the size of potential investments…
E

8
What typeInvestments costs(Estimative in USD billion)
Source: “Valor Especial” Magazine based on Federal and Regional Governments.
World Cup offers an opportunity for speeding up these investments
Stadiums
Airports
Metro
Light Rail Vehicle construction
Port improvement
Highway expansion
Hotel construction
Bridges
Urban mobility works
Downtown revitalization
Training and Marketing in tourism
Drainage works and sanitation
Manaus 0.8Fortaleza 5.1Natal 1.9Recife 2.7Salvador 2.7Cuiabá 1.6Brasília 1.9São Paulo 18.1Rio de Janeiro 5.9Belo Horizonte 0.8Curitiba 2.4Porto Alegre 2.7
Total 46.6

9
67%
47%
5%
21%24%
53%
21%
14%
37%39%
26% 22%
0
20
40
60
80
100
120
Net
herla
nds
UK
US
Irela
nd
Spa
in
S A
frica
Chi
le
Hun
gary
Mex
ico
Cze
ch R
epub
lic
Pol
and
Bra
zil
Mortgage / GDP (%) Mortgage / Total Loan
4,5
5,0
5,5
6,0
6,5
7,0
7,5
1984
1986
1988
1990
1992
1994
1996
1998
2000
2002
2004
2006
Housing credit(as % of GDP by country)
Brazil housing deficit
Source: BNDES/SAE, IBGE.
Some measures could have a huge impact on the housing market
7.5
7.0
6.5
6.0
5.5
5.0
4.5
Million

10
Source: OECD, Abrapp, Previ, Watson Wyatt, HSBC Global Asset Management.
Pension funds equities allocation as % of total assets
-
10
20
30
40
50
60
70
Hong K
ong
Austra
liaIre
land
Finlan
d
United
King
dom
United
Stat
es
Peru
Nether
lands
Icelan
dSwitz
erlan
dCan
ada
Fran
ceColo
mbiaPola
ndPor
tugal
Brazil
Chile
Denmar
kMex
ico
Average = 34%
Brazilian equity allocation is still low compared with other countries…

11
Source: IBES, MSCI.
Selected emerging markets forward P/E
02
46
810
1214
1618
20
Russia
Turk
eyHun
gary
Brazil
Ex -
Pet
ro &
Vale
Czech
Rep
ublic
Thail
and
South
Afri
ca
Brazil
South
Kor
ea
China
Indon
esia
Mexico
Poland
Philip
pines
Malays
ia
India
Chile
Taiw
an
Expected EPS Growth 2010/2008 2010/2009MSCI Brazil 11,9% 27,0%MSCI EM 10,6% 24,3%
… but it is still relatively attractive in terms of valuation and
earnings growth
11.9%
10.6%
27.0%
24.3%
12
3.7%
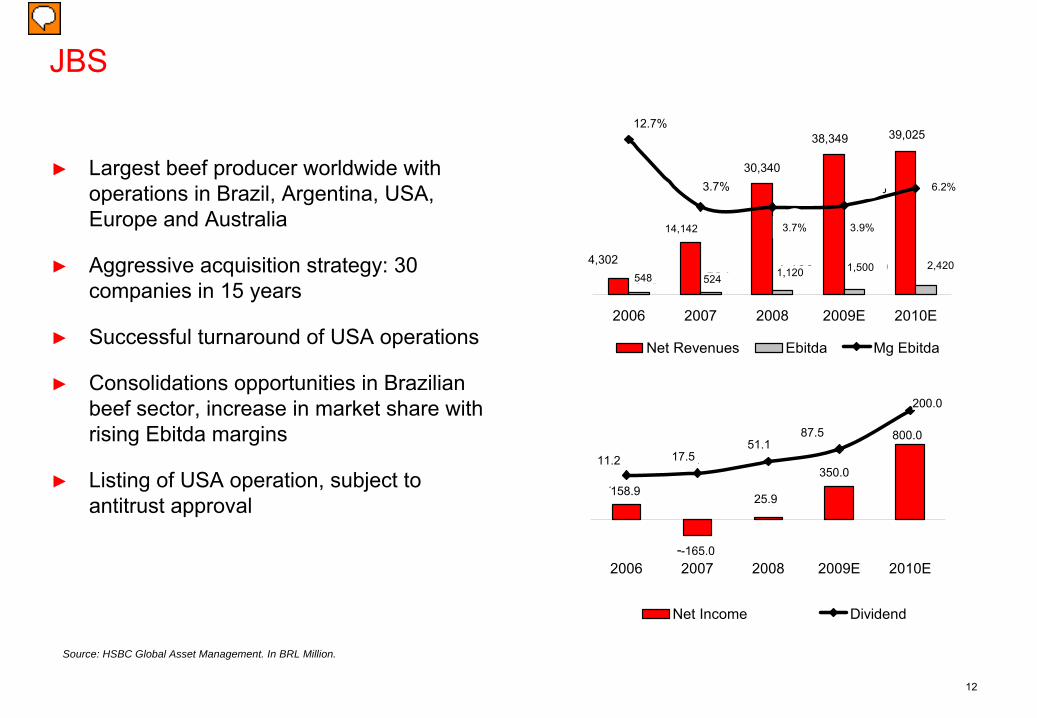
JBS
►
Largest beef producer worldwide with operations in Brazil, Argentina, USA, Europe and Australia
►
Aggressive acquisition strategy: 30 companies in 15 years
►
Successful turnaround of USA operations
►
Consolidations opportunities in Brazilian beef sector, increase in market share with rising Ebitda margins
►
Listing of USA operation, subject to antitrust approval
158,9
-165,0
25,9
350,0
800,0
11,2 17,551,1
87,5
200,0
2006 2007 2008 2009E 2010E
Net Income Dividend
4.302
39.02538.349
30.340
14.142
2.4201.5001.120524548
6,2%3,9%
3,7%
3,7%
12,7%
2006 2007 2008 2009E 2010E
Net Revenues Ebitda Mg Ebitda
Source: HSBC Global Asset Management. In BRL Million.
12.7%
3.7%30,340
38,349 39,025
4,302
3.7% 3.9%
6.2%
2,4201,5001,120524
14,142
548
11.2 17.551.1
87.5
200.0
158.9
-165.0
25.9
350.0
800.0
13
Russia

14
Summary
►
Russian equities have de-rated relative to own history and peers
►
While YTD one of best performing markets in the world, on a 12-month scale still the worst, thus valuations are cheap
►
Economic indicators remain negative, although signs of turnaround are appearing, driven by stronger commodity prices. A return of consumer confidence and investment would enhance recovery
►
Long-term investment case remains solid: Macroeconomic base remains healthy
Stronger for longer commodity prices will drive growth
Secular growth case remains in place
Infrastructure spend increasing
►
Corporate earnings is expected to recover in 2010
►
More than just an oil play

15
Valuations: relative to peers
12-month forward P/E versus 2009-11E earnings CAGR for Russia and Global Markets
Russia’s P/E discount to GEM
Source: Goldman Sachs Research estimates. Data as at September 2009. Source: IBES, Troika Dialog estimates. Data as at August 2009.
%
India
US ChinaEurope
Brazil
Russia
20.0x
15.0x
10.0x
5.0x
0 10% 20% 30% 40% 50% 60% 70% 80% 90% 100%
12M FW P/E
2009-2011E Earnings CAGR
125
100%
75%
50%
25%
0%’09 ’00 ’02 ’04 ’06 ’08
Trailing P/BV Forward P/E Forward EV/EBITDA
12M
FW
P/E

16
Market drivers -
oil price, currency, global risk appetite
►
S&P 500 –
correlation reached 70% in spring this year, and remains high.
►
Oil prices –
correlation increased as oil price dipped below “threshold”
level of taxation. Remains high, but likely to fall provided oil price remains strong.
►
Strong inverse correlation between RTS and Ruble, Russian Bond Eurobonds yields and spreads
►
Two peaks in correlation –
in 3Q08 as devaluation weighed on market, then in 2Q09 as stronger Ruble contributed to equity market recovery
►
Negative correlation increased in Autumn ’08 as reassessment of Russia Risk translated to sell off in Russian equities
►
Correlation now strong and close to peak as yields and spreads have now declined
►
Stock return drivers likely to become more nuanced as the recovery progresses
Correlation of the RTS Index vs S&P500, oil price and Rb/basket rate
Correlation of the RTS Index vs Russia Eurobonds yields and Russia’s Eurobond spreads
Source: Bloomberg, Deutsche Bank. Data as at August 2009.
80%
70%
60%
50%
40%
30%
20%
10%
0%
10%
30%
2005 2006 2007 2008 2009 2010
Correlation of RTS vs
Russia’s spread
Correlation of RTS vs
Urals oil price Correlation of RTS vs
S&P500Correlation of RTS vs
Rb/basket
Correlation of RTS vs
Russia’s yield
10%
-10%
-30%
-50%
-70%
-90%
2005 2006 2007 2008 2009 2010
-80%S&P500
Oil prices
Roub le(inverted, RHS)
-70%
-60%
-50%
-40%
-30%
-20%
-10%
0%
10%

17
Domestic growth: signs of the bottom
►
Economic indicators are declining at double-digit rates
►
Data are showing signs of a bottom
►
Retail sales showing most resilience, declining only 4.0% YoY
Russia’s key economic indicators
Source: Rosstat, Deutsche bank research estimates. Data as at August 2009.
Retail sales, YoY, real, % Construction, YoY, real, %
40%
30%
20%
10%
0%
-10%
-20%
-30%Jan-06 Jul-06
IP, YoY, real, % Fixed investment, YoY, real, %Jan-07 Jul-07 Jan-08 Jul-08 Jan-09 Jul-09 Jan-10

18
Aggressive fiscal stimulus underway
Ministry of Finance announced anti-crisis measures
Source: Ministry of Finance. Data as at May 2009.
MeasuresUSD bn % of GDP
Tax measuresReduction of corporate profit tax from 24% to 20% 12.0-15.0 1.0%-1.3%Reduction of the amortization premium from 30% to 10% 4.5 0.4%Change in the calculation mechanism of the oil export duty 7.5 0.6%Other (increase in housing benefits, reduction of taxes for small business, etc) 3.0 0.3%TOTAL tax measures 26.9-29.9 2.3%-2.6%Budget expenditure measuresInjections of funds into the equity of Russian corporates, of which: 13.1 1.1%
RosSelkhozBank (support for agriculture) 2.2 0.2%State Mortgage Agency (restructuring of mortgages) 1.8 0.2%
RosAgroLeasing (support for the agroindustrial complex) 0.9 0.1%VEB (support for the corporates) 2.2 0.2%
Deposit Insurance Agency (support for deposit holders) 6.0 0.5%Subordinated loans: 13.4 1.1%
VTB 6.0 0.5%RosSelkhozBank 0.7 0.1%
others 6.7 0.6%Subsidization of interest rates for the agroindustrial
complex 0.5 0.0%Support for airliners 1.0 0.1%Support for autoproducers 1.2 0.1%Support for exporters 0.2 0.0%Support for SME 0.2 0.0%Support for military-industrial complex 1.5 0.1%Support package for the labour
market (unemployment benefits, etc) 2.6 0.2%Other 0.6 0.1%TOTAL budget expenditure measures 34.3 2.9%GRAND TOTAL 61.2-64.2 5.2%-5.5%Source: Ministry of Finance
Total amount

19
Budget balance sensitivity to the oil price Current account balance sensitivity to oil price
M2 Growth sensitivity to oil price
Source: Ministry of Finance., Renaissance Capital Estimates. Data as at April 2009.
Domestic growth drivers: oil price sensitivity
Budget Balance 2009, % GDP
GDP growth, %
Current account deficit, % GDP
M2 growth, %
GDP growth sensitivity to oil price
US
$30
US
$40
US
$50
US
$60
US
$70
US
$80
US
$90
US
$100
6.0%
-12.0%
-10.0%
-8.0%
-6.0%
-4.0%
-2.0%
0.0%
2.0%
4.0%
10.0
8.0
6.0
4.0
2.0
0.0
-2.0
-4.0
-6.0
-8.0
-10.0
US
$30
US
$40
US
$50
US
$60
US
$70
US
$80
US
$90
US
$100
6.0%
-6.0%
-4.0%
-2.0%
0.0%
2.0%
4.0%
US
$30
US
$40
US
$50
US
$60
US
$70
US
$80
US
$90
US
$100
45.0%
0.0%
5.0%
10.0%
15.0%
20.0%
25.0%
30.0%
35.0%
40.0%
US
$30
US
$40
US
$50
US
$60
US
$70
US
$80
US
$90
US
$100

20
Russian domestic growth drivers –
rise of the consumer
►
Russian wages (in terms of US dollar) increased 7 fold between 1999 and 2008
►
Wage distribution has also materially shifted in a positive direction
►
This may sparked a retail boom, although by global standards remains in its infancy
►
Top five retailers account for only 5.5% of total market –
consolidation will accelerate top line and enhance already high margins
►
Food retailing CAGR 2006 –
2010E is 20%
►
Consumer spending has been more resilient than the broader economy during recent turmoil
Wage distribution by share of wage earners (RUB per month)
Source: Rosstat, Nomura estimates. Data as at January 2009
100%90%80%70%60%50%40%30%20%10%
0%
2002
Above 12,000 8,000 to 12,000 4,500 to 8,000 2,500 to 4,000 Less than 2,500
2004 2006 2008

21
Long-term investment case remains
►
Macroeconomic backdrop is relatively healthy
►
Sovereign and household debt is low
►
Currency reserves remain substantial
►
Stronger for longer commodity prices will support growth
►
Secular growth story remains in place
►
Infrastructure spend
►
China effect
Debt/GDP levels 2008E
Source: IMF, Troika estimates. Data as at April 2009.
Current account deficit, 2009E
0%
30%
60%
90%
120%
150%
Government Household Corporate Financial
US Russia Eastern Europe
-21.5-13.3
-8.7-8.7-8.3
-6.1-5.7
-4.7-2.5
1.42.8
-25 -20 -15 -10 -5 0 5
BulgariaRomania
Estonia
LithuaniaLatvia
Hungary
PolandSlovak Republic
Czech Republic
Russia at $30/bbl oilRussia at $60/bbl oil

22
Source: IMF, AEB, Troika estimates and Euromonitor. Data as at April 2009.
Population, 2007, mn Beer sales volumes, 2007, bn I
Secular growth story: large internal market
►
Largest population in Europe and already the largest market for most consumer goods
Rus
sia
Ger
man
y
Turk
ey
Fran
ce UK
Italy
Ukr
aine
Spa
in
Pol
and
5
0
30
60
90
120
1 0
0
2
4
6
10
8
12
Rus
sia
Ger
man
y
Rom
ania
Fran
ceUK
Italy
Ukr
aine
Spa
in
Pol
and
0 1 2 3 4
Car sales in Europe, 2008E, mnGermany
RussiaItalyUK
FranceSpain
BelgiumNetherlands
AustriaGreece

23
Secular growth story: low penetration levels
►
Russia has much lower levels of penetration of key consumer goods and services than the rest of Europe
Mortgage loans / GDP, 2008E Internet penetration
Source: ECB, Central bank, ComScore. Data as at December 2008.
0% 10% 20% 30% 40% 50% 60%
Netherlands
Spain
Germany
France
Belgium
Italy
Russia
Netherlands
0% 20% 40% 60% 80% 100%
Spain
UK
Germany
France
Belgium
Italy
Russia

24
Secular growth: infrastructure spend
►
Investment/GDP ratio has been very low since early 1990s, in both absolute terms and relative to rest of world
►
Commodity investment in Far East
►
Sochi Winter Olympics
Index of Russian investment
Investment as a % of GDPInvestment / GDP, 2007
Source: CIA world factbook. Data as at January 2009 Source: IMF, State statistics service. Data as at January 2009.
Kaz
akhs
tan
Sou
th K
orea
Sou
th A
frica
50%
40%
30%
20%
10%
0%
50%
40%
30%
20%
10%
0%
Chi
na
Indi
a
Ukr
aine
Japa
n
Wor
ld
Pol
and
EU
Turk
ey
Rus
sia
US
2008
E20
09E
120%
100%
80%
60%
40%
20%
0%
120%
100%
80%
60%
40%
20%
0%
1990
1991
1992
1993
1994
1995
1996
1997
1998
1999
2000
2001
2002
2003
2004
2005
2006
2007
40%
35%
30%
25%
20%
15%
10%
40%
35%
30%
25%
20%
15%
10%
1992
1993
1994
1995
1996
1997
1998
1999
2000
2001
2002
2003
2004
2005
2006
2007
2008
E
Global Emerging markets Emerging Asia Russia

25
Year Investor Country Target company/ project
Industry Amount ($mn) Stake (%)
2004-2006 ConocoPhilips US Lukoil Oil and gas $7,500 20%
2005 Coca-cola US Multon Food $600mn 100%
2005 Sta
da Germany Nizhphaarm Pharma $108mn 97%
2006 Societe
Generale France Rosbank Banking $2,334 50%+1
2007 E.On Germany OGK-4 Utilities $5,740 61%
2007-10 13 automakers (Peugeot-Citroen, Suzuki, Hundai, Ford, Volkswagen, Toyota, volvo, etc)
New plants Automobile $1,800 in 2-3 years
YTD Shell, Mitsui, Mitsubishi Holland
/ Japan Sakhalin-2 Oil and gas $14,100 49%
0100
2 003 004 005006 00
19 98 2000 20 02 200 4 2 006 200 8 2 010
Y ea r
FD I inf lows
FD I sto ck
Foreign Direct Investment (FDI) Inflows and FDI stock ($bn)
FDI: High and rising –
an attractive market for multinationals
1998 2000 2002 2004 2006 2008 2010
FDI inflowsFDI stock$b
n
0100200300400500600
Data as at May 2009

26
India

27
Incredible India –
seductive investment story
►
Strong GDP growth
►
Favourable
demographics
►
Improving macro economic trends
►
Poor infrastructure to improve –
social & physical >> investment spend
►
Renewed focus on rural India

28
Incredible India vs
China –
great growth potential
►
GDP growth to accelerate compared to past decade
►
India liberalisation
began in 1991 -
12 years after China brought reforms in 1979
Source: World Economic Outlook, IMF, Deutsche Bank. Data as at April 2009
Nominal GDP (US$ bn)
0100020003000400050006000700080009000
Yea
r 1Y
ear 2
Yea
r 3Y
ear 4
Yea
r 5Y
ear 6
Yea
r 7Y
ear 8
Yea
r 9Y
ear 1
0Y
ear 1
1Y
ear 1
2Y
ear 1
3Y
ear 1
4Y
ear 1
5Y
ear 1
6Y
ear 1
7Y
ear 1
8Y
ear 1
9Y
ear 2
0Y
ear 2
1Y
ear 2
2Y
ear 2
3Y
ear 2
4Y
ear 2
5Y
ear 2
6Y
ear 2
7Y
ear 2
8Y
ear 2
9Y
ear 3
0Y
ear 3
1Y
ear 3
2Y
ear 3
3Y
ear 3
4Y
ear 3
5
China (1980 onwards) India (1991 onwards)
China's 2009 GDP
India's 2009 GDP

29
Great growth potential >> GDP per capita on a ppp
basis
►
India > China in 1991
►
China > 2 x India in 2009
India China
China inflection point
India inflection point?
872
910
956
1,00
7
1,06
9
1,14
7
1,23
3
1,28
6
1,35
2
1,44
2
1,50
9
1,57
6
1,65
1
1,77
4
1,95
0
2,15
7
2,40
6
2,65
9
2,88
6
3,12
9
3,39
6 3,69
4 4,01
0
796
888 1,02
5
1,18
2
1,35
0
1,51
2
1,67
7
1,84
5
1,99
3
2,15
8
2,37
2
2,61
2
2,88
1 3,21
7 3,61
4 4,06
4
4,65
8
5,37
8 5,96
3 6,37
9 6,78
6
7,41
3
8,20
2
-
1,000
2,000
3,000
4,000
5,000
6,000
7,000
8,000
9,000
1990
1991
1992
1993
1994
1995
1996
1997
1998
1999
2000
2001
2002
2003
2004
2005
2006
2007
2008
2009
2010
E
2011
E
2012
E
(US$)
Source: IMF, Deutsche Bank. Data as at April 2009

30
China’s present GDP, India’s future GDP?
►
At 8% GDP growth, India is expected to take about 9 years to get
to where China is today
Source: India Infoline. Data as at 26 August 2009.
800
900
1,000
1,100
1,200
1,300
1,400
1,500
1,600
1,700
1,800
2008
2009
2010
E
2011
E
2012
E
2013
E
2014
E
2015
E
2016
E
2017
E
2018
E
2019
E
2020
E
2021
E
US$bn
China Real GDPIndia's Real GDP @ 6%7%8%9%

31
So, where are we in the cycle?
►
Services which is at > 50% of GDP still growing at > 9%
►
Slowing exports hurt industry and services; agriculture to hurt going forward
►
But resilient rural economy
►
Very aggressive monetary easing, 3 fiscal stimulus packages, falling price points and pent up demand growth to recover
►
US$100bn stimulus = 10% of GDP 10.0 Real GDP %y/y
3.0
4.0
5.0
6.0
7.0
8.0
9.0
Jun-
08
Sep-
08
Dec-0
8
Mar-0
9
Jun-
09
Sep-
09E
Dec-0
9E
Mar-1
0E
Jun-
10E
Sep-
10E
Dec-1
0E
Mar-1
1E
Recovery in growth
%y/y
-15
-10
-5
0
5
10
15
20
25
Mar-9
8
Mar-9
9
Mar-0
0
Mar-0
1
Mar-0
2
Mar-0
3
Mar-0
4
Mar-0
5
Mar-0
6
Mar-0
7
Mar-0
8
Mar-0
9
Mar-1
0E
Mar-1
1E
Services Industry (from Mar-09 changed to incl. constr.)Real GDP Agriculture, Forestry and Fishing
Source: UBS. Halbis As at 16 September 2009. Quarters are calendar year wiseSource: UBS. As at 31st August 2009.

32
Favourable
Demographics >> positive for consumer stories
Source: UBS. Data as at 16 September 2009.
13.7
17.5
20.4
20.5
22.0
26.4
27.4
31.7
10 15 20 25 30 35
Germany
UK
US
China
Thailand
Brazil
Indonesia
India
Percentage of the population below the age of 15

33
-
5
10
15
20
25
30
CY97 CY98 CY99 CY00 CY01 CY02 CY03 CY04 CY05 CY06 CY07 CY08
India ChinaCar/1000
Penetration –
2 wheelers and cars
►
Higher 2 wheeler penetration in India!
►
Higher car penetration too till CY1999
►
Potential for higher car penetration in India given Chinese experience
-
10
20
30
40
50
60
70
80
CY97 CY98 CY99 CY00 CY01 CY02 CY03 CY04 CY05 CY06 CY07 CY08
India China2Ws/1000
Source: Bloomberg, CEIC database. Data as at 15 September 2009.

34
Domestic car sales volumes
India: Domestic car sales volumes
60,000
70,000
80,000
90,000
100,000
110,000
120,000
130,000
140,000
150,000
Jan Feb Mar Apr May Jun Jul Aug Sep Oct Nov Dec
CY04 CY05 CY06 CY07 CY08 CY09
Festival season boosts in Sep-Oct
Sales spike up in March
Dip in Dec due to model-year change
Source: SIAM. Data as at 15 September 2009.
Unit

35
Maruti
Suzuki (Auto company) –
stock positioning
Source: Factset ( Provisional). Data as at 31 Aug 2009. Example included for illustration purposes. Does not constitute investment advice
Overweight
Underweight
0.0
1.0
2.0
3.0
4.0
5.0
6.0
7.0Ja
n-04
Mar
-04
May
-04
Jul-0
4
Sep-
04
Nov
-04
Jan-
05
Mar
-05
May
-05
Jul-0
5
Sep-
05
Nov
-05
Jan-
06
Mar
-06
May
-06
Jul-0
6
Sep-
06
Nov
-06
Jan-
07
Mar
-07
May
-07
Jul-0
7
Sep-
07
Nov
-07
Jan-
08
Mar
-08
May
-08
Jul-0
8
Sep-
08
Nov
-08
Jan-
09
Mar
-09
May
-09
Jul-0
9
Maruti
Suzuki India Ltd.

36
Maruti relative to Nifty
100.00
150.00
200.00
250.00
300.00
18-Ju
l-03
18-Ju
l-04
18-Ju
l-05
18-Ju
l-06
18-Ju
l-07
18-Ju
l-08
18-Ju
l-09
Maruti
Suzuki –
relative to market
►
Over 50% market share in Indian market
►
Cash rich –
its key competitor have cash flow/debt issues
►
Most extensive distribution network
►
Exporting small cars to Europe for Nissan and Suzuki
►
Record exports to Europe
Source: Bloomberg. Data as at 31 August 2009. The figures used are for illustrative purposes only, actual asset allocation may differ. Individual stock performance does not represent fund performance.

37
Improving Macro Trends –
Foreign Direct Investment (FDI)
►
India attracting relatively more FDI
0.0
1.0
2.0
3.0
4.0
5.0
6.0
7.0
1990
1991
1992
1993
1994
1995
1996
1997
1998
1999
2000
2001
2002
2003
2004
2005
2006
2007
2008
India China
FDI % of GDP
Source : India Infoline. Data as at 14 September 2009.

38
-4.0
0.0
4.0
8.0
12.0
1QC
Y00
2QC
Y00
3QC
Y00
4QC
Y00
1QC
Y01
2QC
Y01
3QC
Y01
4QC
Y01
1QC
Y02
2QC
Y02
3QC
Y02
4QC
Y02
1QC
Y03
2QC
Y03
3QC
Y03
4QC
Y03
1QC
Y04
2QC
Y04
3QC
Y04
4QC
Y04
1QC
Y05
2QC
Y05
3QC
Y05
4QC
Y05
1QC
Y06
2QC
Y06
3QC
Y06
4QC
Y06
1QC
Y07
2QC
Y07
3QC
Y07
4QC
Y07
1QC
Y08
2QC
Y08
3QC
Y08
4QC
Y08
1QC
Y09
2QC
Y09
3QC
Y09
QTD
Net FII Investments (US$B)
Net foreign direct & portfolio investments >>> inflection point in strategic buys
Source : RBI, Motilal Oswal. FDI data for 3QCY09 QTD is as at July 2009 and FII data for 3QCY09 QTD is as at 14 September 2009.
Big contrast
0.0
3.0
6.0
9.0
12.0
1QC
Y00
2QC
Y00
3QC
Y00
4QC
Y00
1QC
Y01
2QC
Y01
3QC
Y01
4QC
Y01
1QC
Y02
2QC
Y02
3QC
Y02
4QC
Y02
1QC
Y03
2QC
Y03
3QC
Y03
4QC
Y03
1QC
Y04
2QC
Y04
3QC
Y04
4QC
Y04
1QC
Y05
2QC
Y05
3QC
Y05
4QC
Y05
1QC
Y06
2QC
Y06
3QC
Y06
4QC
Y06
1QC
Y07
2QC
Y07
3QC
Y07
4QC
Y07
1QC
Y08
2QC
Y08
3QC
Y08
4QC
Y08
1QC
Y09
2QC
Y09
3QC
Y09
QTD
Net FDI (US$B)

39
Valuations >> Rapid reaction from lows
Source: FactSet, MSCI, Morgan Stanley. Data as at 15 September 2009.
9
12
15
18
21
24
27
30
33
1995
1996
1997
1998
1999
2000
2001
2002
2003
2004
2005
2006
2007
2008
2009
MSCI India Trailing PE
5 Yr Avg
10 Yr Avg
MSCI India Trailing PE, 1995-2008

40
Portfolio strategy
►
Focus on domestic cyclicals
–
consumer discretionary, real estate, infrastructure –
and defensives –
consumer staples, healthcare
Sectors in Favour Key RationaleConsumer –
Discretionary & Staples
Declining demand recently but huge potential favourable demographics attractive interest rates and easing credit availability recovery in domestic consumption; Government focus on rural India
Real Estate Shortage of housing fast falling property prices affordability at record lows recovery in demand improvement in cash flows for real estate sector
Infrastructure
Healthcare
Poor infrastructure to improve Government stimulus packages lower commodity prices strong order books provide visibility
Undemanding valuations attractive growth profile defensive

41
China

42
Strong economic growth continues into 2009
►
GDP growth at 7.1% (1H09 --
1Q09: 6.1%, 2Q09: 7.9%)
►
Retail sales rose 15.1% y-o-y
(Jan –
Aug 09)
►
Fixed asset investment growth up 33.0% (Jan –
Aug 09) vs
26.1% in 2008
►
Export still down 22.2% y-o-y
(Jan –
Aug 09) vs. 17.2% growth in 2008
►
CPI inflation remained negative at -1.2% (Aug 09)
►
High foreign exchange reserve: US$2.18 trillion (Jun 09)
Source: Morgan Stanley.
43
Major impacts of global financial crisis on China
►
Sharp export decline forced weaker players out of business and new orders going to larger manufacturers which should improve China's production efficiency
and bargaining power over the longer run
►
China has become more focused on growing its domestic economy to
reduce reliance on export for the country’s long term economic growth
►
The crisis has opened a huge window of opportunity for Chinese companies to gain market share globally as many large foreign players face financial difficulties
►
With strong cash positions, Chinese companies have been able to buy quality assets around the world at distressed valuations during this credit crisis

44
Population becoming more affluent higher spending power
►
Strong GDP/capita growth
351 412 517 467601 699 771 817 861 946 1,038 1,132
1,2701,486
1,701
1,998
2,458
3,258
91 92 93 94 95 96 97 98 99 00 01 02 03 04 05 06 07 08
China's GDP / Capita (USD)CAGR (1991 -
2008) = 14.0%
32.5%
Source: CEIC, ABN Amro. Source: SIAM. Data as at 15 September 2009.

45
China income growth trend vs. other Asian economies
►
After reaching US$1,000 in GDP/capita, other Asian economies had
experienced an acceleration. China may follow the same trend
Source: Morgan Stanley. Data as at December 2008
0
1,000
2,000
3,000
4,000
5,000
6,000
7,000
1960 1964 1968 1972 1976 1980 1984 1988 1992 1996 2000 2004 2008
GDP / Capita (USD)
19661971 2001
1977
JapanHong Kong
ChinaKorea

46
China has abundant cash deposits
Individual Bank Deposits (Rmb trn) Government Foreign Exchange Reserve (US$bn)
Source: JP Morgan. Data as at June 2009
7.48.7
10.412.0
14.1
16.217.3
21.8
24.9
0.0
5.0
10.0
15.0
20.0
25.0
30.0
2001 2002 2003 2004 2005 2006 2007 2008 Jun-09
212.2286.4
403.3
609.9
818.9
1066.3
1528.2
1946.0
2131.6
0.0
500.0
1000.0
1500.0
2000.0
2500.0
2001 2002 2003 2004 2005 2006 2007 2008 Jun-09

47
All “China Shares”
are not created equal –
valuation comparison
2009 PBV (x)
2009 PE (x)
Mkt Cap (US$ bn)
No. of Listed Companies
'H' Shares 2.1 14.8 514.0 151
Red chips 2.1 14.1 456.9 91
Shanghai A 2.7 18.2 2,133.3 856
Shenzhen A 3.0 25.4 585.7 739
Shanghai B 1.5 14.8 9.3 54
Shenzhen B 1.5 15.3 10.5 55
Source: SSE; SZE; Wind Info; Bloomberg; BNP Paribas estimates. Data as at 31 August 2009

48
Valuation have rebounded but are still significantly below peak levels
MSCI China Index – Price/Book ratioMSCI China Index – Price/Earnings ratio
Source: Datastream, Goldman Sachs. Data from November 1994 to September 2009
0
20
40
60
80
100
120
140
160
94 95 96 98 99 00 01 02 03 04 05 06 08 09
Index Level
10X
20X
15X
25X
5X
0
50
100
150
200
250
300
94 95 96 98 99 00 01 02 03 04 05 06 08 09
Index Level
2.0X
4.0X
3.0X
5.0X
1.0X

49
Improving earnings growth outlook for Chinese companies
Source: Datastream. Data as at 15 September 2009
MSCI China 2009 earnings growth (Consensus)
-10%
-5%
0%
5%
10%
15%
20%
25%
Jan-08 Apr-08 Jul-08 Oct-08 Dec-08 Mar-09 Jun-09 Sep-09

50
Portfolio strategy
►
Sector focus
Sectors Key rationaleConsumer Discretionary Strong retail sales growth and domestic consumption driven by rising
income and favorable government policies
Commodities Strong fixed asset investment growth expected to generate rising
demand for selected commodities
Export Plays Export decline stabilised
with potential for demand pickup as global economic outlook improves

51
Investment conclusion
►
China has the policy tools and financial capacity to maintain strong domestic economic growth as demonstrated by strong GDP rebound
►
Beijing’s policies are effective in reviving domestic economic activities as seen in auto and property sales recovery
►
Domestic consumption and investment are expected to continue to drive China’s economic growth, export recovery a potential positive surprise
►
Potential upward corporate earnings revision in 2H09 may trigger
further market advance
►
The current financial crisis offers China a unique opportunity to gain global market shares and international political status
►
Renminbi will likely resume its appreciation as the global credit crisis subsides
►
China offers excellent value for long term investors despite potential short term market volatility

52
HSBC GIF BRIC Equity

53
Important information
►
The Fund invests primarily in Brazilian, Russian, Indian and Chinese equities.
►
The Fund is subject to the risks of investing in emerging markets.
►
The Fund’s investments may involve substantial market, currency, volatility, regulatory and political risks. Investors may suffer substantial loss of their investments in the Fund.
►
The investment decision is yours but you should not invest unless the intermediary which sells you the Fund has advised you that the Fund is suitable for
you and has explained why, including how investing in the Fund would be consistent with your investment objectives.
►
Investors should not invest in the Fund solely based on the information provided in this document and should read the offering document of the Fund for details.

54
How do the investment views translate into fund strategy?
►
Today we have a positive outlook for all four markets, hence the
near equal weightings in each market
►
Current preference for Brazil and Russia based on cheaper valuations, and strong commodity demand from India and China
Brazil Russia India China Cash
Current Target Portfolio Weight 26% 26% 24% 23% 1%
Portfolio Weight (Dec 08) 23% 22% 23% 30% 2%
Country PER 2009E PER 2010E EPS Growth 2010
Brazil 13.3x 10.9x 19.5%
Russia 13.1x 8.3x 57.4%
India 17.5x 14.6x 20.3%
China 17.9x 14.5x 23.0%
Asset allocation between the individual BRIC markets remains flexible, depending on market outlook and investment conditions
Source: Thomson Financial, UBS. Data as at 14 September 2009. Past performance should not be seen as an indication of future returns. Any forecast, projection or target where provided is indicative only and is not guaranteed in any way.

55
The beauty of HSBC Global Investment Funds -
BRIC Freestyle
►
High conviction
Flexible asset allocation: e.g. single country allocation in the past has moved between 15-34%
The Fund can take relatively high weightings on specific stocks
►
Non-benchmark
The Fund does not follow the weightings of any particular index.
For example, the MSCI BRIC Index as at end August 2009 had the following weights –Brazil: 32.2%, Russia: 12.8%, India: 15.8%, China: 39.3%
►
Luxury of tapping the finest single country BRIC investment experts
Among the one of largest portfolio managers in the world for Brazilian, Russian, Indian and Chinese equities
Source: HSBC Global Asset Management. Data as at 31 August 2009.

56
An experienced BRIC Freestyle Equity Team 6 leading investment professionals
Jose CuervoBased in LondonSenior Fund ManagerBrazil Equity
Douglas HelferBased in London
Senior Fund ManagerRussian Equity
Sanjiv DuggalBased in Singapore
Portfolio ManagerIndian Equity
Richard C. WongBased in Hong Kong
Portfolio ManagerChinese Equity
Nick TimberlakeNick TimberlakeBased in LondonBased in LondonBRIC Fund ManagerBRIC Fund ManagerHead of Global Emerging MarketsHead of Global Emerging Markets
Guillaume Guillaume RabaultRabaultBased in ParisBased in Paris
Global Head of GEMGlobal Head of GEMResearchResearch

57
Year-to-date performance is now top quartile
►
Following last year’s crash, emerging markets have bounced back strongly
►
The Fund has delivered excellent returns this year, achieving top quartile performance
►
Tactical country allocation has been a positive contributor to performance
1-Month 3-Month 6-Month YTD
HSBC GIF BRIC Freestyle 2.5% 11.6% 88.7% 72.9%
Morningstar’s mean -0.4% 5.8% 72.7% 58.7%
Fund ranking 1/7 1/7 1/7 1/7
Quartile ranking 1 1 1 1
Source: Morningstar, data as at 31 August 2009. Calendar year performance of the Fund – Since launch to 31 December 2005: 42.2%; 2006: 45.0%; 2007: 47.5%; 2008: -63.1%. Bid to Bid price with dividend reinvested in USD terms. Fund launch date: 1 April 2005 (Class M2C)

58
The potential of BRIC….
►
Key ingredients for BRIC success are abundant -
Growth, Liquidity, Balance sheet, Valuation
►
Structurally the centre of global economic activity is moving East
►
BRIC markets are becoming more closely linked and less reliant on outside drivers
►
There are always risks -
double dip, Inflation, policy miss steps, Bolt from the blue
►
One of the best times to invest in BRIC markets

59
Important information
This presentation is for professional clients only. The contents
of this presentation are confidential and may not be reproduced
or further distributed to any person or entity, whether in whole or in part, for any purpose. The material contained in this presentation is for information only and does not constitute investment advice or a recommendation to any reader of this material to buy or sell investments.
The HSBC Global Investment Fund (‘GIF’) range is a Luxembourg domiciled SICAV and is regulated by the CSSF. The funds mentioned in this document may not be registered for sale or available in all jurisdictions. For available funds please contact your local HSBC office.
HSBC Global Investment Funds range cannot be sold by anyone in any jurisdiction in which such offer or solicitation is not lawful or in which the person making such an offer or solicitation is not qualified to do so or to anyone to whom it is unlawful to make such offer or solicitation. All applications are made on the basis of the current HSBC Global Investment Funds Prospectus, simplified prospectus and most recent annual and semi-annual reports. These can be obtained on request and free of charge from HSBC Global Asset Management (UK) Limited or the local distributors. The value of investments may go down as well as up and you may not get back the full amount you invested. Where overseas investments are held the rate of exchange may cause the value of investments to go down as well as up. Markets in some countries can be described as ‘emerging markets’. Some of these may involve a higher risk than where an investment is within a more established market. Where a sub-fund invests predominately in one geographical area, any decline
in economic conditions may affect prices and the value of underlying investments.
The securities representing interests in the HSBC Global Investment Funds range have not been and will not be registered under the US Securities Act of 1933 and will not be offered for sale or sold in the United States of
America, its territories or possessions and all areas subject to its jurisdiction, or United States person, except in a transaction which does not violate the Securities Law of the United States of America.
This document is issued by HSBC Global Asset Management (UK) Limited, 8 Canada Square, Canary Wharf, London, E14 5HQ, UK. Authorised and regulated by the Financial Services Authority and registered as number 122335. ©
Copyright. HSBC Global Asset Management 2009. All Rights Reserved.
This product is marketed in a sub-distributing capacity on a principal –
to –
principal basis by the HSBC Global Asset Management MENA, a unit that is part of HSBC Bank Middle East Limited, PO Box 66, Dubai, UAE, which is incorporated and regulated by the Jersey Financial Services Commission. Services are subject to the Bank’s terms and conditions. HSBC Bank Middle East Limited is a member of the HSBC Group.
The information provided has not been prepared taking into account the particular investment objectives, financial situation and
needs of any particular investor. As a result, investors using this information should assess whether it is appropriate in the light of their own individual circumstances before acting on it. The information in this document is derived from sources believed to
be reliable, but which have not been independently verified. However, HSBC Bank Middle East Limited makes no guarantee of its accuracy and completeness and is not responsible for errors of transmission of factual or analytical data, nor shall HSBC Bank Middle East Limited be liable for damages arising out of any person’s reliance upon this information. All charts and graphs are from
publicly available sources or proprietary data. The opinions in this document constitute the present judgment of the issuer, which is subject to change without notice.
This document is neither an offer to sell, purchase or subscribe
for any investment nor a solicitation of such an offer. This document is intended for the use of institutional and professional customers and is not intended for
the use of private customers. This document is intended to be distributed in its entirety. No consideration has been given to the particular investment objectives, financial situation or particular needs of any recipient. Any transaction will be subject to HSBC Bank’s Terms of Business.17387/ME/0909/MB
www.assetmanagement.hsbc.com/MENA