macroeconomía: to bric or not to bric
DESCRIPTION
* Un rápido crecimiento económico no implica necesariamente una oportunidad de negocio * México tiene ventajas clave sobre los BRIC´s * Los BRICs y México tienen en común 2 situaciones: corrupción y fragilidad institucional * Los hogares mexicanos tienen mayor poder adquisitivo * La economía se vuelve cada vez más sofisticada * El ambiente para hacer negocios en México es relativamente mejor * Un mercado con gran densidad de población y un ingreso relativamente mayor es más atractivo que un país con ingresos relativamente menores, incluso si la población de éste crece rápidamenteTRANSCRIPT

To BRIC or not to BRIC?

To BRIC or not to BRIC?
• Sheer size and rapid growth do not necessarily equate good business
• Mexico has key advantages over BRICS
–Richer households
– Increasingly sophisticated economy
–Better business environment across the board
• BRICs and Mx share corruption and poor institutions

Sheer size & Rapid growth don’t
equate good business

BRICs are much larger than Mx
DB Research: BRIC Capital Markets Monitor June 2010.

BRICS are growing faster than Mx
-2%
0%
2%
4%
6%
8%
10%
12%
14%
2000 2001 2002 2003 2004 2005 2006 2007 2008
Brazil
RussianFederation
India
China
Mexico
Urban population (% of total)
World Bank. World Development Indicators

But Mexicans are still richer
$0
$2,000
$4,000
$6,000
$8,000
$10,000
$12,000
$14,000
2000 2001 2002 2003 2004 2005 2006 2007 2008
RUS
MEX
BRA
CHN
IND
World Bank. World Development Indicators
GDP per capita (current US$)

Mexico’s key advantages

Demographics and
purchasing power of
households are key
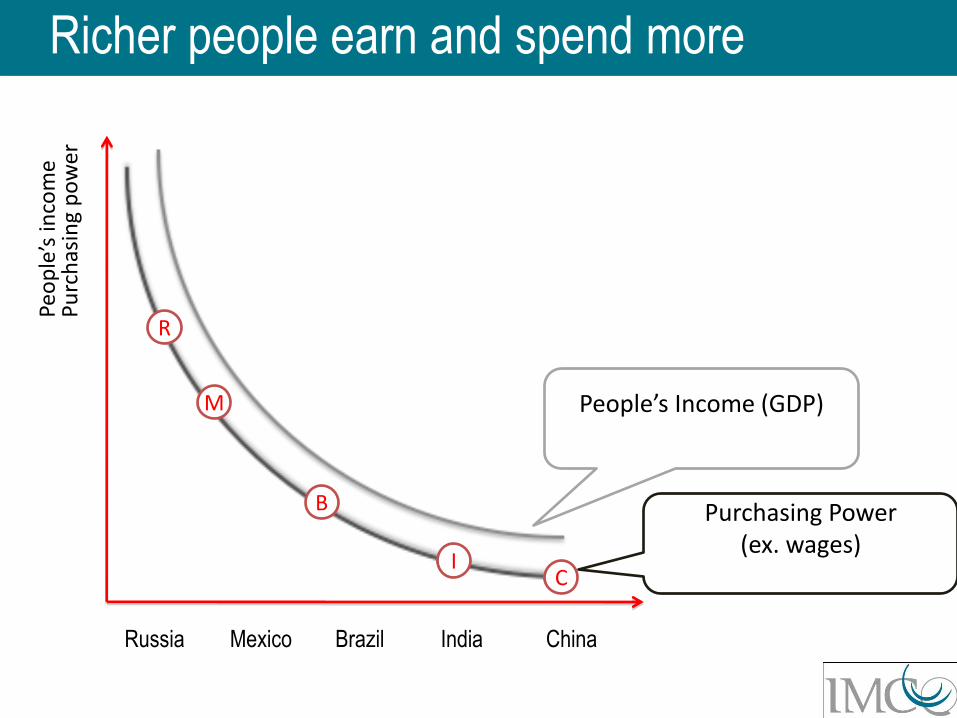
Richer people earn and spend more P
urc
has
ing
po
wer
Russia Mexico Brazil India China
R
Purchasing Power (ex. wages)
People’s Income (GDP)
M
B
I C
Peo
ple
’s in
com
e

0%
10%
20%
30%
40%
50%
60%
70%
80%
2000 2001 2002 2003 2004 2005 2006 2007 2008
BRA
RUS
IND
CHI
MEX
World Bank. World Development Indicators
Household final consumption expenditure(% GDP)

$0
$1,000
$2,000
$3,000
$4,000
$5,000
$6,000
2000 2001 2002 2003 2004 2005 2006 2007 2008
BRA
RUS
IND
CHI
MEX
World Bank. World Development Indicators
Household final consumption expenditure per capita
(current 2000 US$)
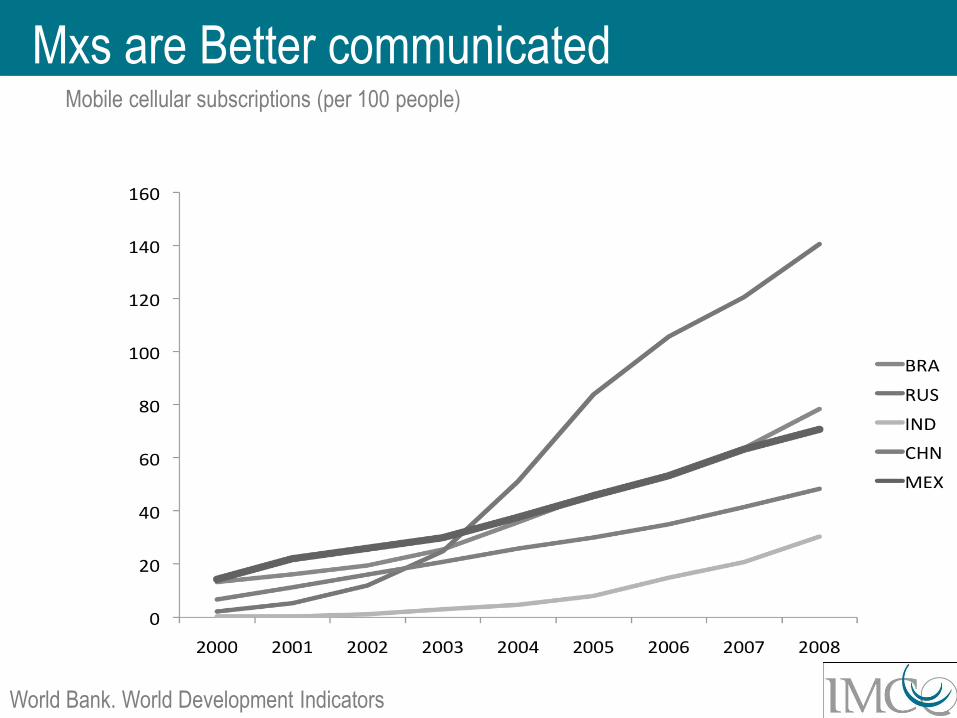
Mxs are Better communicated Mobile cellular subscriptions (per 100 people)
World Bank. World Development Indicators

…more connected,
0
1
2
3
4
5
6
7
8
2000 2001 2002 2003 2004 2005 2006 2007 2008
BRA
RUS
IND
CHI
MEX
World Bank. World Development Indicators
Fixed broadband Internet subscribers (per 100 people)

… and more urban
0
10
20
30
40
50
60
70
80
90
2000 2001 2002 2003 2004 2005 2006 2007 2008
BRA
RUS
IND
CHN
MEX
World Bank. World Development Indicators
Do BRICS even belong in the same club?
Urban population (% of total)

The Mexican economy is
more manufacture oriented
than most BRICS

World Trade Organization . Statistics Data Base & DB Research: BRIC Capital Markets Monitor June
2010.
Oil economy?…been there, done that
0%
10%
20%
30%
40%
50%
60%
70%
80%
90%
100%
Brazil Russian Federation India China Mexico
Exports by main commodity group & services, % of total exports
Manufactures Fuels and mining products Services Agricultural Products Other
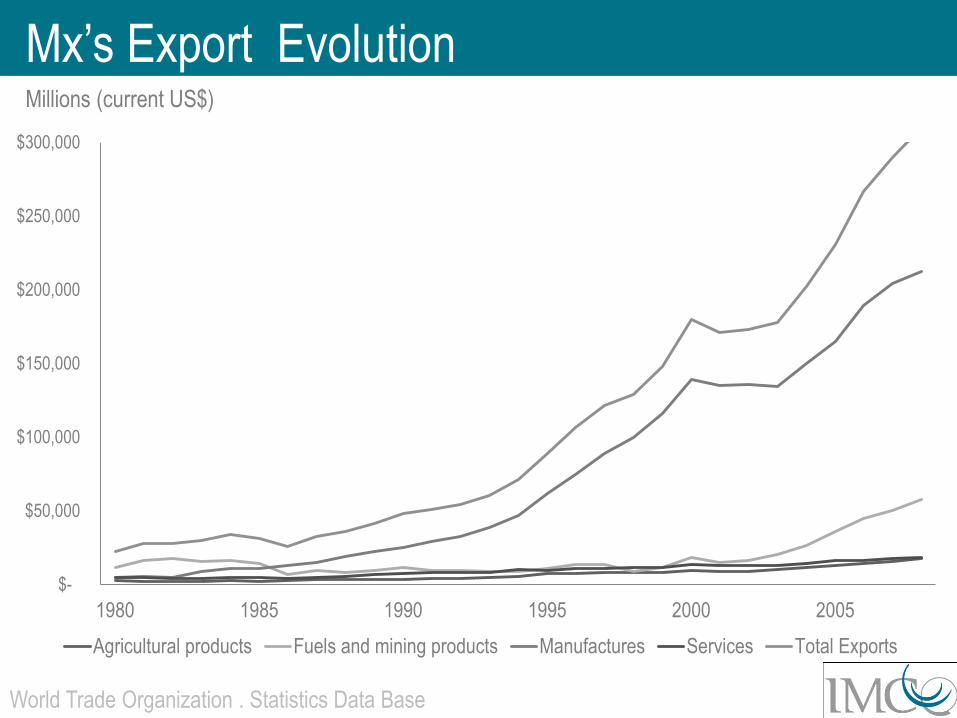
Mx’s Export Evolution
$-
$50,000
$100,000
$150,000
$200,000
$250,000
$300,000
1980 1985 1990 1995 2000 2005
Agricultural products Fuels and mining products Manufactures Services Total Exports
Millions (current US$)
World Trade Organization . Statistics Data Base
BRICs and Mexico share
corruption and institutional
problems…

Índice General IMCO (48)
• Sectores económicos en vigorosa competencia
• Relaciones internacionales benignas
• Gobiernos eficientes y eficaces
• Sectores precursores de clase mundial
• Mercados de factores eficientes
• Sistema político estable y funcional
• Macroeconomía estable
• Sociedad incluyente, preparada y sana
• Manejo sustentable del medio ambiente
• Sistema de derecho confiable y objetivo
México Brazil Russia India China
32 29 25 48 35
41 39 38 17 32
32 28 36 38 35
34 45 32 48 41
43 34 32 41 33
38 34 44 31 48
30 33 34 29 15
30 40 23 47 31
45 27 35 47 36
33 29 46 38 45
32 31 33 43 38

Corruption across the board
Ranking (out of 180) Country Score (out of 10)
1 New Zealand 9.4
5 Switzerland 9.0
19 United States 7.5
75 Brazil 3.7
79 China 3.6
84 India 3.4
89 Mexico 3.3
146 Russia 2.2
Corruption Perception Index
Comparable countries: Colombia (3.7), Burkina Faso (3.6), Thailand (3.4) Rwanda, Malawi, Moldova,
Morocco (3.3), Albania (3.2), Sierra Leone (2.2)
Transparency International. Corruption Perception Index 2009

World Economic Forum: Public Institutions
Ranking: 133 countries
The Global Competitiveness Report 2009-2010
Public Institutions 101 97 110 55 46
1. Property Rights 86 76 119 55 43
1.01 Property Rights 86 70 121 54 39
1.02 Intellectual Property Protection 81 92 102 61 45
2. Ethics and Corruption 100 125 99 73 43
2.01 Diversion of Public Funds 100 121 106 58 55
2.02 Public trust of Politicians 94 127 80 79 26
3. Undue Influence 89 72 111 44 50
3.01 Judicial Independence 91 78 116 37 62
3.02 Favoritism in Decisions of
Government Officials
85 74 96 54 35
Mexico Brazil Russia India China

4. Government Inefficiency 89 120 110 43 37
4.01 Wastefulness of government
spending
69 129 81 55 35
4.02 Burden of government regulation 117 132 124 95 21
4.03 Efficiency of legal framework in
settling disputes
94 95 109 37 43
4.04 Efficiency of legal framework in
challenging regulations
80 81 111 21 57
4.05 Transparency of Government policy
making
75 96 114 43 32
Mexico Brazil Russia India China
World Economic Forum: Public Institutions
Ranking: 133 countries
The Global Competitiveness Report 2009-2010

5. Security 125 93 94 70 53
5.01 Business cost of terrorism 91 5 80 117 66
5.02 Business cost of crime and violence 124 118 71 50 43
5.03 Organized Crime 129 111 96 63 71
5.04 Reliability of Police Services 124 89 112 52 49
Mexico Brazil Russia India China
World Economic Forum: Public Institutions
133 countries
The Global Competitiveness Report 2009-2010

Sistema Político IMCO
• Índice de Estabilidad Política
• Índice de control de la corrupción
• Probabilidad de ataque terrorista
• Interferencia Militar
• Libertad de prensa
México Brazil Russia India China
35 46 29 21 43
41 22 3 18 10
73 18 73 62 35
73 64 73 64 45
52 58 25 65 16
Índices clave (0 peor – 100 mejor)

All in all… Mx’s Business
environment is
relatively better

Ease of Doing Business
Ranking (out 183) Brazil Russia India China Mexico
Ease of doing business 129 120 133 89 51
Starting a business 126 106 169 151 90
Dealing with construction
permits
113 82 175 180 37
Employing workers 138 109 104 140 136
Registering property 120 45 93 32 99
Getting credit 87 87 30 61 61
Protecting investors 73 93 41 93 41
Paying taxes 150 103 169 130 106
Trading across borders 100 162 94 44 74
Enforcing contracts 100 19 182 18 81
Closing a business 131 92 138 65 24
Doing Business Report 2010

Difficulty of Doing Business
Ranking (183) Brazil Russia India China Mexico
Ease of doing business 129 120 133 89 51
Starting a business 126 106 169 151 90
Dealing with construction permits
113 82 175 180 37
Employing workers 138 109 104 140 136
Registering property 120 45 93 32 99
Getting credit 87 87 30 61 61
Protecting investors 73 93 41 93 41
Paying taxes 150 103 169 130 106
Trading across borders 100 162 94 44 74
Enforcing contracts 100 19 182 18 81
Closing a business 131 92 138 65 24
Doing Business Report 2010
To BRIC or not to BRIC?

To BRIC or not to BRIC? • Sheer size and rapid growth do not
necessarily equate good business
• Mexico has key advantages over BRICS
–Richer households
– Increasingly sophisticated economy
–Better business environment across the board
• A highly populated market with a relatively high income seems more compelling than a relatively low income country, even if growing rapidly