equity research: nestle nigeria plc research: nestle nigeria plc ... the cost of sales also...
TRANSCRIPT
FSDH Research www.fsdhgroup.com
Equity Research: Nestle Nigeria Plc
Table 1: BUY
Current Price 850.10
Fair Value 937.29
Expanding Through Innovation
1.0 FY 2014 Performance Analysis:
The audited Financial Year (FY) 2014 result for Nestlé Nigeria Plc (Nestlé) for the
period ended December 31, 2014 shows that its Turnover (T/O) increased by 7.70% to
N143.33bn, compared with N133.08bn recorded in the corresponding period of 2013.
The cost of sales also increased by 7.60% to N82.10bn from N76.30bn recorded in FY
2013. The cost of sales as a percentage of Turnover fell marginally to 57.28% from
57.33% as at FY 2013. The administrative, selling and distribution expenses increased
by 10.63% to N32.03bn. These expenses as a percentage of turnover increased to
22.35% in FY 2014 from 21.76% in FY 2013.
The investment income stood at N551.59mn as at FY 2014, representing an increase of
52.67%, compared with N361.31mn recorded in the corresponding period. The
company also recorded a significant increase of 147.16% in its finance cost of N5.31bn
from N2.15bn in 2013. This increase in finance costs was largely due to a substantial
rise in the net foreign exchange loss, which stood at N3.04bn in FY 2014 from
N609.07mn in FY 2013.
The Profit Before Tax (PBT) fell to N24.45bn, a decrease of 6.15% from N26.05bn
recorded in the corresponding period of 2013. This is a reflection of the challenges the
company is facing with regards to stiff competition in the industry and increased finance
costs. The tax provision also decreased by 41.67% to N2.21bn from N3.79bn, the
decrease in the tax provision was due to the recognition of previously unrecognised tax
credits and the origination and reversal of temporary differences resulting in a deduction
of N815.76mn from the current tax expense leading to a Profit After Tax (PAT) of
N22.24bn in FY 2014 from N22.26bn in the corresponding period of 2013, representing
a marginal decrease of 0.10%.
Table 2: Financial Performance (N’bn)
FY 2014 FY 2013 %∆
T/O 143.33 133.08 7.70%
EBIT 29.20 27.83 4.91%
PBT 24.45 26.05 (6.15%)
PAT 22.24 22.26 (0.10%)
The turnover in FY 2014 increased by 7.70% to N143.33bn from N133.08bn in the previous year.
PBT stood at N24.45bn in 2014, a fall of 6.15% from N26.05bn recorded in the corresponding period of 2013.
Thursday June 18, 2015 2015

Equity Research Report
Nestlé Nigeria Plc
FSDH Merchant Bank
2 FSDH Research www.fsdhgroup.com
The company’s profit margins in FY 2014 were impacted by various factors thus
showing mixed performance from the figures recorded in FY 2013. Gross Profit margin
increased marginally to 42.72% in FY 2014 from 42.67% in FY 2013. The PBT Margin
in FY 2014 decreased over the FY 2013 figure. The PBT margin decreased to 17.06%
in FY 2014 from 19.57% as at FY 2013. The PAT margin currently stands at 15.51%,
down from 16.72% in the corresponding period of 2013. The Earnings Before Interest
and Tax (EBIT) margin declined to 20.37% from 20.91% in 2013.
Table 3: Quarterly Result Highlights (N'bn)
Q1 2015 Q4 2014 Q3 2014 Q2 2014 Q1 2014 Q4 2013
Turnover 27.56 40.66 35.47 33.78 33.43 37.67
PBT 3.49 4.29 6.23 6.86 7.07 5.67
PAT 2.95 5.37 5.03 5.83 6.00 5.16
Table 4: Profitability Margins
FY 2014 FY 2013
GP* Margin 42.72% 42.67%
EBIT Margin 20.37% 20.91%
PBT Margin 17.06% 19.57%
PAT Margin 15.51% 16.72%
*GP – Gross Profit
Profit margins in FY 2014 declined marginally from the figures recorded in FY 2013.
Q4 2011 Q4 2012 Q4 2013 Q4 2014
Revenue 27.42 31.68 37.67 40.66
-
5.00
10.00
15.00
20.00
25.00
30.00
35.00
40.00
45.00
N'b
n
Q4 Revenue Trend

Equity Research Report
Nestlé Nigeria Plc
FSDH Merchant Bank
3 FSDH Research www.fsdhgroup.com
A cursory look at the balance sheet position as at FY 2014 compared with the position
as at FY 2013 reveals an increase in the company’s fixed assets. Fixed assets
increased by 2.48% to N67.51bn from N65.88bn in FY 2013. The company’s inventory
increased to N10.96bn from N9.85bn in FY 2013. Trade debtors and other receivables
also went up by 24.86% to N22.33bn in FY 2014 from N17.88bn in FY 2013. Cash and
bank balances decreased significantly by 72.99% from N13.72bn in FY 2013 to
N3.70bn in FY 2014. This decrease was primarily due to a significant decrease in call
deposits. The call deposits fell to N2.43bn in FY 2014 from N9.62bn in 2013. The trade
creditors and other payables decreased by 8.29% to N26.66bn from N29.07bn as at FY
2013. Borrowings increased by 13.48% to N31.12bn from N27.42bn in FY 2013. The
increase in loans and borrowings in FY 2014 was mostly due to an increase in foreign
related party loans from Nestlé Treasury Centre-Middle East and Africa Limited. These
foreign loans as at FY 2014 stood at N22.15bn.
The total assets of the company which stood at N106.06bn as at FY 2014 were
financed by a mix of equities and liabilities in the ratio of 33.89% and 66.11%
respectively. Our analysis of the liabilities shows that the short-term liabilities stood at
N44.64bn, accounting for 63.66% of the total liabilities, while the long-term liabilities
stood at N25.48bn accounting for 36.34% of the total liabilities. The long-term liabilities
constituted mainly of long term loans and borrowings, which stood at N18.39bn. The
current liabilities constituted mainly of trade & other payables. Working capital stood at
a negative N7.25bn from N8.52bn recorded in FY 2013. Net assets for the period
decreased by 11.47% to stand at N35.94bn from N40.59bn as at FY 2013.
The total assets of the company which stood at N106.06bn as at FY 2014 were financed by a mix of equities and liabilities in the ratio of 33.89% and 66.11% respectively.
Fixed assets increased by 2.48%
to N67.51bn from N65.88bn in FY
2013.
650
750
850
950
1050
1150
1250
11-Jun-14 11-Sep-14 11-Dec-14 11-Mar-15 11-Jun-15
Nestle VS NSE ASI Rebased (June'14-June'15)
Nestle NSE ASI Rebased
Equity34%
Liabilities66%
Financing Mix

Equity Research Report
Nestlé Nigeria Plc
FSDH Merchant Bank
4 FSDH Research www.fsdhgroup.com
1.1 Q1 2015 Performance Analysis:
As at Q1 2015, turnover (T/O) decreased by 17.56% to N27.56bn, compared with
N33.43bn recorded in the corresponding period of 2014. The administrative, selling and
distribution expenses increased by 25.61% to N1.88bn. The company also recorded a
significant increase of 167.54% in its finance cost of N2.34bn from N873mn in 2014.
The Profit Before Tax (PBT) fell to N3.49bn, a decrease of 50.69% from N7.07bn
recorded in the corresponding period of 2014. The tax provision also decreased by
50.08% to N533mn from N1.07bn, leading to a Profit After Tax (PAT) of N2.95bn in Q1
2015 from N6bn in the corresponding period of 2014, representing a decrease of
50.80%.
The PBT Margin decreased over the Q1 2014, and the Financial Year ended December
(FY), 2014 figure. The PBT margin decreased to 12.65% in Q1 2015 from 21.16% as at
Q1 2014, and from 17.06% as at the end of FY 2014. Also, the PAT margin currently
stands at 10.72%, down from 17.96% in the corresponding period of 2014, and also
down from 15.51% as at FY 2014. The result also indicates that the percentage of T/O,
PBT, and PAT in the Q1 2015 to the Audited T/O, PBT and PAT for the period ended
December 2014 are: 19.23%, 14.26% and 13.29%, respectively. Given the run rate, the
company would need to remain focused on marketing development to meet its previous
year’s performance. We however note the low business activities in Q1 2015 as a result
of the security challenges in the country and the general elections.
Table 6: Financial Performance (N’bn)
Q1 2015 Q1 2014 Change T/O 27.56 33.43 (17.56%) EBIT 5.65 7.73 (26.92%) PBT 3.49 7.07 (50.69%) PAT 2.95 6.00 (50.80%)
Table 5: Profitability Margins
Q1 2015 Q1 2014 Q1 2013 Q1 2012
GP* Margin 44.23% 44.47% 43.12% 41.84%
EBIT Margin 20.49% 23.12% 24.49% 23.87%
PBT Margin 12.65% 21.16% 22.98% 25.63%
PAT Margin 10.72% 17.96% 19.53% 21.53%
*GP – Gross Profit
Given the run rate, the company
would need to remain focused on
marketing development to meet its
previous year’s performance.

Equity Research Report
Nestlé Nigeria Plc
FSDH Merchant Bank
5 FSDH Research www.fsdhgroup.com
.
2.0 Drivers of Performance and Strategic Focus:
Nestlé’s performance during the period was driven by the following factors:
Diversified product portfolio which are essential for healthy living.
Its backward integration strategy to secure raw materials locally by partnering
with farmers to provide quality raw materials.
Investments in plants upgrade to produce products more efficiently.
The Naira devaluation.
The security challenges in the country and the general elections in 2015.
However, the company’s increased finance costs especially the exposure to foreign
exchange adversely affected profit in FY 2014 and Q1 2015. In FY 2014, Nestlé’s
foreign exchange exposure was estimated at N63.24bn with imported raw materials of
N41.10bn dominating the foreign exposure. In Q1 2015, finance costs rose by 167.54%
to N2.34bn from N872.90mn in Q1 2014.
The Naira devaluation had an
adverse impact on the foreign debt
of the company.
Q1 2012 Q1 2013 Q1 2014 Q1 2015
Revenue 28.67 30.70 33.43 27.56
-
5.00
10.00
15.00
20.00
25.00
30.00
35.00
40.00
N'b
n
Q1 Revenue Trend

Equity Research Report
Nestlé Nigeria Plc
FSDH Merchant Bank
6 FSDH Research www.fsdhgroup.com
2.1 Strategic Focus:
Nestlé’s priorities remain unchanged from its standard corporate business principles. In
respect to its brand and product, the company’s focus is to ensure its brands and
products undergo continuous innovation. Also, Nestlé seeks to ensure that its products
are available wherever, whenever and however the customer wants them.
A key part of Nestlé’s business principles is its commitment to environmentally sound
business practices that will benefit the communities it operates in. Consequently, to
further reduce its environmental footprint and ensure efficient use of energy for
manufacturing operation, Nestlé has built a Tri-Generation power plant at its Agbara
factory. The plant generates power, while chilled and hot water are generated using
heat from the power plant exhaust gases. This enables the company to increase overall
energy efficiency from 42% to 74% and to reduce carbon dioxide emissions by 5,000
tonnes per year. Also, in 2014 Nestlé laid the foundation for its ultra-modern N4.8bn
Nestlé Waters factory in Abaji near Abuja. This facility is key to the growth of Nestlé’s
water operation in Nigeria. The Company chose the rural location for the factory with
the aim of contributing to the rural development by providing local employment and
purchasing directly from small scale suppliers and intermediaries.
3.0 Business:
Nestlé manufactures and markets a range of high quality brands: Infant Cereals -
Nestlé Nutrend, NAN Lactogen and Nestlé Cerelac; Family Cereals-Nestlé, and Golden
Morn; Beverage Drink - Nestlé Milo; Confectionary- Nestlé Chocomilo; Nestlé Kitkat
Bullion- Maggi cube, Maggi Chicken, Maggi Crayfish, Maggi Mix’PY, and Nestlé Pure
Life table water. Nestlé also markets Coffee - Nescafe Classic Coffee, Nescafe 3-in-1
Coffee and Nescafe breakfast, as well as Nestlé’s Full Cream Milk product- Nestlé
Nido. Globally, Nestlé companies are organized into regional groupings to leverage
expertise and the size of the company. In the case of Nigeria, the company is a part of
Central and West Africa region. The region is managed through Nestlé Central & West
Africa Limited, which is based in Accra. As at FY 2014, Nigerian market contributed
98.91% to the turnover of the company, while Niger, Senegal, Togo, Ghana, Guinea
and others contributed the balance of 1.09%.
Nestlé priorities moving forward
remain unchanged from its
standard corporate business
principles.
As at FY 2014, Nigerian market
contributed 98.91% to the turnover
of the company 1.09%.
The company has the policy to
positively impact the communities
in which it operates.
Equity Research Report
Nestlé Nigeria Plc
FSDH Merchant Bank
7 FSDH Research www.fsdhgroup.com
On a continuing basis, to stimulate industrial growth the company is committed to long
term sustainable business practices. Nearly all of the company’s key ingredients for
products which are manufactured in Nigeria are sourced locally through farmers and
suppliers where available. As part of this policy, it has successfully introduced the use
of locally produced items such as soya bean, maize, cocoa, palm oil and sorghum in a
number of its products. Also, the company has successfully substituted imported corn
starch with locally produced cassava starch.
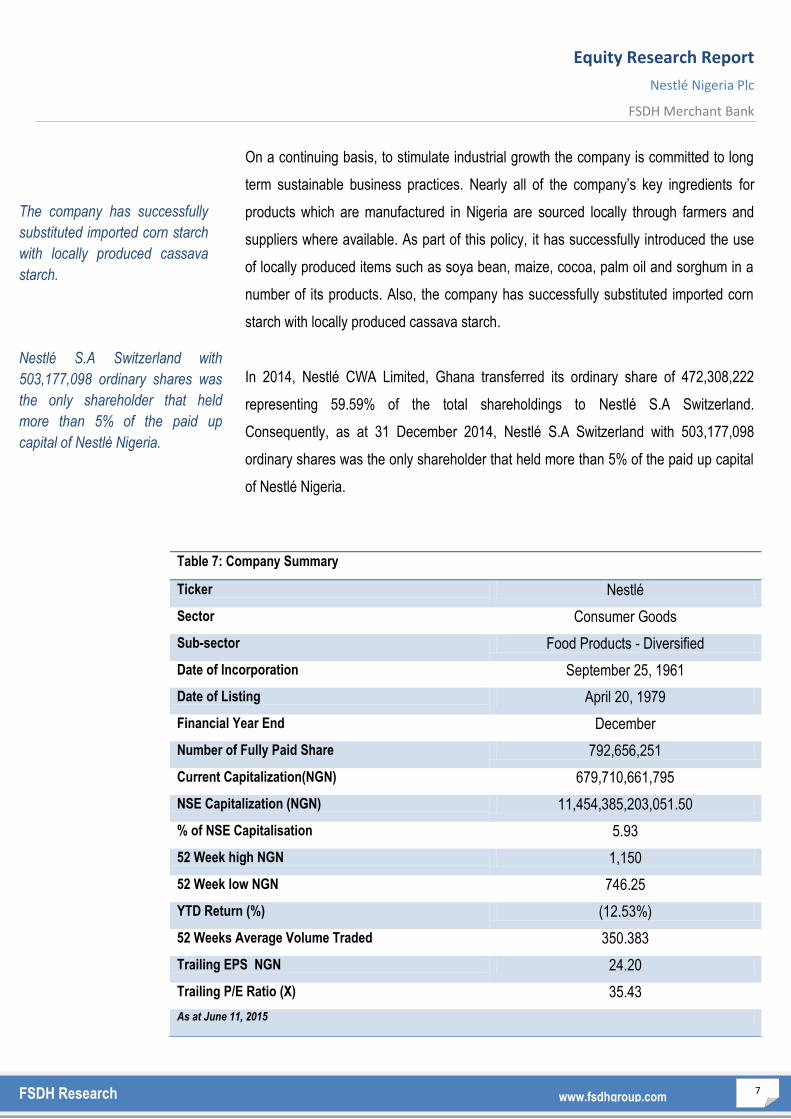
In 2014, Nestlé CWA Limited, Ghana transferred its ordinary share of 472,308,222
representing 59.59% of the total shareholdings to Nestlé S.A Switzerland.
Consequently, as at 31 December 2014, Nestlé S.A Switzerland with 503,177,098
ordinary shares was the only shareholder that held more than 5% of the paid up capital
of Nestlé Nigeria.
Table 7: Company Summary
Ticker Nestlé
Sector Consumer Goods
Sub-sector Food Products - Diversified
Date of Incorporation September 25, 1961
Date of Listing April 20, 1979
Financial Year End December
Number of Fully Paid Share 792,656,251
Current Capitalization(NGN) 679,710,661,795
NSE Capitalization (NGN) 11,454,385,203,051.50
% of NSE Capitalisation 5.93
52 Week high NGN 1,150
52 Week low NGN 746.25
YTD Return (%) (12.53%)
52 Weeks Average Volume Traded 350.383
Trailing EPS NGN 24.20
Trailing P/E Ratio (X) 35.43
As at June 11, 2015
The company has successfully
substituted imported corn starch
with locally produced cassava
starch.
Nestlé S.A Switzerland with
503,177,098 ordinary shares was
the only shareholder that held
more than 5% of the paid up
capital of Nestlé Nigeria.

Equity Research Report
Nestlé Nigeria Plc
FSDH Merchant Bank
8 FSDH Research www.fsdhgroup.com
Table 8: Directors’ Shareholding as at December 31, 2014
Director Position Holdings
Mr. David Ifezulike Chairman 56,255
Mr. Dharnesh Gordhon MD/CEO Nil
Mr. Syed Saiful Islam* Executive Nil
Mr. Martin Kruegel** Executive Nil
Mrs. Iquo Ukoh Executive 37,500
Mr. Giuseppe Bonanno Non-Executive Nil
Mr. Kais Marzouki Non-Executive Nil
Mr. Gbenga Oyebode Non-Executive Nil
Mrs. Ndidi Okonkwo Nwuneli Non-Executive Nil
*Appointed October 1, 2014 **Resigned September 30, 2014
Table 9: Shareholding Structure as at December 31, 2014
Name No. Of Ordinary Shares % of Shareholding
Nestlé S.A., Switzerland 503,177,098 63.48%
Others 289,479,154 36.52%
Total Number of Shares 792,656,252 100.00%
Equity Research Report
Nestlé Nigeria Plc
FSDH Merchant Bank
9 FSDH Research www.fsdhgroup.com
4.0 Product Analysis:
Nestlé has two reportable business segments, which are its strategic business units.
The units are Food Products and Beverages. This strategic business units offer
different products and services, and are managed separately because they require
different technology and marketing strategies. The food products segment contributed
58.49% to the company’s revenue in FY 2014, compared with the contribution of
41.51% by the beverages range.
4.1 Food Products:
This includes the production and sale of Maggi, Cerelac, Nutrend, NAN, Lactogen and
Golden Morn. The company launched the Nestlé Golden Morn Millet in 2013; because
of the need to provide consumers with high quality foods that provide nutritional value at
an affordable cost. The product offers consumers the opportunity to increase their
intake of two essential micronutrients (Iron and Vitamin A) as part of their daily
breakfast. The introduction of millet variety expanded the product portfolio of Golden
Morn to three in addition to maize enriched and maize cocoa. Products in this category
compete with a lot of imported food products in the market. There are smaller
competitors in the food products market in Nigeria but Nestlé maintains the lead in the
market. Nestlé’s other products in this category includes: Maggi Cube, Maggi Mix’py,
Maggi Chicken Tablet and Maggi Crayfish Tablet. Competitors include Unilever’s Knorr
and Royco Cubes.
4.2 Beverages:
This includes the production and sale of Milo, Chocomilo, Nido, Nescafe and Nestlé
Pure Life (water). The company launched 60cl Nestlé Pure Life Protect in 2013, a
variant of its bottled water brand fortified with zinc (an essential mineral to support the
immune system). To further increase its market share, the company launched Nestlé
Pure Life 5litre family size bottle in 2013, the first of its kind in Nigeria. Some of the
other competing products in the market are Bournvita, Ovaltine, Eva Water, Peak Milk,
Cowbell Milk, RichChocó, etc.
The food products segment
contributed 58.49% to the
company’s revenue in FY 2014,
compared with the contribution
of 41.51% by the beverages
range.

Equity Research Report
Nestlé Nigeria Plc
FSDH Merchant Bank
10 FSDH Research www.fsdhgroup.com
5.0 SWOT Analysis
Strengths: Weakness:
o Strong brand name.
o Quality products in the market.
o Stable Board and Management.
o Technical partnership with parent company.
o Access to cheaper foreign funding.
o Securing raw materials via backward
integration.
o Consistent dividend payment.
o Energy efficient production process.
o Diversified products.
o Increased loans and borrowings.
o Declining profit margins.
o Increased foreign exchange exposure.
Opportunities: Threats:
o Large market size in Nigeria and
neighbouring countries.
o The CBN efforts to improve funding to the
agriculture and the manufacturing sectors.
o Improvement in products regulations and
enforcements.
o Stiff competition in all its products.
o Naira devaluation.
o Poor state of basic infrastructure in the
country.
o Pressure of other imported products in the
market.
o Weak consumers’ purchasing power.

Equity Research Report
Nestlé Nigeria Plc
FSDH Merchant Bank
11 FSDH Research www.fsdhgroup.com
6.0 Forecast:
6.1 Forecast Drivers:
We considered the following factors in arriving at our 5-year forecasts:
Positive Drivers:
Investment and innovation in plants, which should improve efficiency.
Technical partnership with the parent company.
Large market size in Nigeria and stable growing population.
Strong demand for product at all levels.
Negative Drivers:
The prevailing stiff competition in the industry.
The company’s foreign exchange exposure and possibility of a further
depreciation.
Taking the foregoing factors into consideration we estimate a Turnover of N144.91bn,
N168.96bn, N202.92bn, N243.71bn and N291.47bn for the periods ending December
2015, 2016, 2017, 2018 and 2019 respectively. We estimate EBIT of N26.90bn,
N35.19bn, N45.95bn, N56.32bn and N67.97bn, and EBITDA of N32.79bn, N41.61bn,
N53.02bn, N64.16bn and N76.74bn for the same period using EBIT margins of 18.56%,
20.83%, 22.65%, 23.11% and 23.32% respectively. Our PBT forecasts for the periods
are: N21.98bn, N31.08bn, N42.03bn, N53.36bn and N65.07bn. Adjusting for tax, our
PAT forecasts are N18.55bn, N21.75bn, N29.40bn, N37.33bn and N45.52bn. PAT
Margin for the period are 15.17%, 18.40%, 20.71%, 21.90% and 22.32%. Our forecast
final dividend for the FY 2015 is N20.58 per share.
We estimate a dividend per share of N20.58 for the FY 2015.
We estimate a dividend per share of N5.25 for the FY 2014.

Equity Research Report
Nestlé Nigeria Plc
FSDH Merchant Bank
12 FSDH Research www.fsdhgroup.com
Table 8: FSDH Research Income Forecast for Nestle Nigeria Plc (2015 - 2019)
Profit and Loss =N='bn Dec-15 Dec-16 Dec-17 Dec-18 Dec-19
Turnover (Net Sales) 144.91 168.96 202.92 243.71 291.47
Cost of Sales (85.56) (96.39) (112.72) (134.88) (161.32)
Gross Profit 59.34 72.57 90.21 108.82 130.15
Admin, Selling & Distribution Expenses (26.55) (30.96) (37.19) (44.66) (53.41)
Depreciation (5.89) (6.42) (7.07) (7.84) (8.77)
EBIT 26.90 35.19 45.95 56.32 67.97
EBITDA 32.79 41.61 53.02 64.16 76.74
Net Finance Cost (4.92) (4.10) (3.93) (2.96) (2.91)
PBT 21.98 31.08 42.03 53.36 65.07
Taxation (3.44) (9.34) (12.63) (16.03) (19.55)
PAT 18.55 21.75 29.40 37.33 45.52
Table 9: FSDH Research Earnings Forecast for Nestle Nigeria Plc (2015 - 2019)
Dec-15 Dec-16 Dec-17 Dec-18 Dec-19
EBITDA Margin 22.63% 24.63% 26.13% 26.33% 26.33%
EBIT Margin 18.56% 20.83% 22.65% 23.11% 23.32%
PBT Margin 15.17% 18.40% 20.71% 21.90% 22.32%
PAT Margin 12.80% 12.87% 14.49% 15.32% 15.62%
EPS(N) 23.40 27.43 37.09 47.10 57.43
DPS(N) 20.58 24.13 32.62 41.42 50.50
Dividend Payout 87.95% 87.95% 87.95% 87.95% 87.95%
Earnings Yield * 2.50% 2.93% 3.96% 5.02% 6.13%
Dividend Yield * 2.20% 2.57% 3.48% 4.42% 5.39%
P/E Ratio* 40.06x 34.16x 25.27x 19.90x 16.32x
Number of Shares (‘bn) 0.79 0.79 0.79 0.79 0.79
ROE 47.55% 50.97% 60.63% 71.47% 92.99%
Collection Days 47.60 47.60 47.60 47.60 47.60
Payment Days 77.34 77.34 77.34 77.34 77.34
Inventory Turnover 6.75x 6.75x 6.75x 6.75x 6.75x
Interest Cover 5.90 8.35 11.54 19.53 25.57
*At Our Fair Value of N937.29

Equity Research Report
Nestlé Nigeria Plc
FSDH Merchant Bank
13 FSDH Research www.fsdhgroup.com
Table 10: Comparable Analysis (Nbn)
Company Nestle Cadbury
Turnover (Net Sales) 143.33 30.52
Gross Profit 61.23 7.93
EBIT 29.20 1.14
PBT 24.45 1.47
PAT 22.24 1.51
GP Margin 42.72% 25.99%
PBT Margin 17.06% 4.81%
PAT Margin 15.51% 4.96%
ROE 61.87% 13.11%
Net Assets 35.94 11.54
Net Assets Per Share 45.34 6.15
Trailing EPS 24.20 1220.06
PE Ratio 35.12x 1220.06x
Earnings Yield 2.85% 0.08%
As at June 18, 2015

Equity Research Report
Nestlé Nigeria Plc
FSDH Merchant Bank
14 FSDH Research www.fsdhgroup.com
7.0 Valuation:
We employed relative valuation method using Enterprise Value (EV) to Earnings Before
Interest Tax Depreciation and Amortization (EBITDA) multiple. The assumptions and
results of the valuation are:
Assumptions:
EV/EBITDA Multiple: 23.61x
Debt: N31.12bn
Cash: N3.70bn
Number of shares in issue: 792.66mn
Applying the EV/EBITDA multiple of 23.61x, we arrived at N937.29 per share as the fair
value.
The current market value of Nestle share is N850.10, the highest and the lowest closing
prices in the last 52 weeks are N1,150 and N746.25 respectively. The forward earnings
yield and dividend yield of the company at our fair value are 2.50% and 2.20%
respectively. The total return, a combination of the capital appreciation and the
dividend, generates 12.68%. The company has a track record of consistent dividend
payment (both interim and final) which makes a good stock to hold for large fund
managers. Going by historic trend the company shares would always trade at a
premium to its fair value. We therefore place a BUY on the shares of Nestle at the
current price of N850.10 as of June 18, 2015.
The fair value for Nestle shares is N937.29
The fair value for Guinness shares is N185.72.
Equity Research Report
Nestlé Nigeria Plc
FSDH Merchant Bank
15 FSDH Research www.fsdhgroup.com
For enquiries please contact us at our offices: Lagos Office: 5th-8th floors UAC House, 1/5 Odunlami Street, P.M.B 12913 Lagos. Tel: 234-1-2702881-2 (Fax): 234-1-2702890. Port Harcourt Office: Mainstreet Bank Building, (2nd floor, 5 Trans Amadi Road, Port Harcourt. Tel: 234-802 408 1331 (Fax) 234-084-463174. Abuja Office: Abia House, Plot 979, 1st Avenue, Off Ahmadu Bello Way, Cadastral Zone AO, Central Business District, Abuja. Tel: 09-8700465 Website: www.fsdhgroup.com Email: [email protected] Our Reports and Prices are also Available on Bloomberg {FSDH<GO>}
Disclaimer Policy
This publication is produced by FSDH Merchant Bank Limited solely for the information of users who are expected to
make their own investment decisions without undue reliance on any information or opinions contained herein. The
opinions contained in the report should not be interpreted as an offer to sell, or a solicitation of any offer to buy any
investment. FSDH Merchant Bank Limited may invest substantially in securities of companies using information contained
herein and may also perform or seek to perform investment services for companies mentioned herein. Whilst every care
has been taken in preparing this document, no responsibility or liability is accepted by any member of FSDH Merchant
Bank Limited for actions taken as a result of Information provided in this publication.