escape plan · work ethic and a positive attitude was regularly highlighted in the qualitative...
TRANSCRIPT

resolutionfoundation.org [email protected] +44 (0)203 372 2960 @resfoundation
REPORT
Escape PlanUnderstanding who progresses from low pay and who gets stuck
Conor D’Arcy & Alex HurrellNovember 2014
This publication is available in the Wages & Income section of our website @resfoundation
Escape Plan: Understanding who progresses from low pay and who gets stuck Aknowledgements 2
Acknowledgements
The authors would like to thank all those who gave advice and comments on the research including Abigail McKnight, Barry Brooks, Damian Grimshaw, Jack Feintuck, John Philpott, Kate Webb, Norman Pickavance, Simon Blake and Tim Buchanan as well as all those who attended and provided feedback at a discussion seminar at which preliminary results were presented. Liz Diez and Becki Harrison at Acumen Fieldwork provided attentive and responsive assistance in arranging the interviews and focus groups. Dilan Ciftci and Aaliyah Jameela’s help in researching progression policies and transcribing
the qualitative work was greatly appreciated.
The research was conducted by the Resolution Foundation and prepared for and funded by the Social Mobility and Child Poverty Commission. The Social Mobility and Child Poverty Commission is an advisory non-departmental public body of the Department for Education, the
Department for Work & Pensions and the Cabinet Office.
The Commission was established with a remit to:
» publish an annual report setting out progress made in improving social mobility and reducing child poverty in Great Britain;
» provide published advice to ministers at their request on social mobility and child poverty; and
» act as an advocate for social mobility beyond government by challenging employers, the professions and universities amongst
others to play their part in improving life chances.
The content of the report, and any errors contained, remain the sole responsibility of the authors.
This work contains statistical data from ONS which is Crown Copyright. The use of the
ONS statistical data in this work does not imply the endorsement of the ONS in relation
to the interpretation or analysis of the statistical data. This work uses research datasets
which may not exactly reproduce National Statistics aggregates.
3Escape Plan: Understanding who progresses from low pay and who gets stuck Contents
This publication is available in the Wages & Income section of our website @resfoundation
Contents
Executive summary ���������������������������������������������������������������������������������6
Section 1
Introduction ������������������������������������������������������������������������������������������10
Context and relevance ��������������������������������������������������������������������������10
Previous work ���������������������������������������������������������������������������������������11
Methodology ����������������������������������������������������������������������������������������14
Definitions and categories���������������������������������������������������������������������15
Section 2
New findings �����������������������������������������������������������������������������������������17
Descriptive characteristics���������������������������������������������������������������������18
Living standards & household incomes �������������������������������������������������19
Conclusion ��������������������������������������������������������������������������������������������21
Section 3
Individual and household factors ����������������������������������������������������������23
Key factors ��������������������������������������������������������������������������������������������23
Conclusion ��������������������������������������������������������������������������������������������26
Section 4
Employees, firms and progression ��������������������������������������������������������27
Key factors ��������������������������������������������������������������������������������������������27
Enablers ������������������������������������������������������������������������������������������������29
4Escape Plan: Understanding who progresses from low pay and who gets stuck Contents
This publication is available in the Wages & Income section of our website @resfoundation
Progression policies ������������������������������������������������������������������������������29
Fair and well-trained management ������������������������������������������������������30
Attitude ������������������������������������������������������������������������������������������������30
Key life stages ��������������������������������������������������������������������������������������30
Barriers �������������������������������������������������������������������������������������������������31
Small wage increases and low pay ��������������������������������������������������������31
Career progression vs� pay progression ������������������������������������������������33
Fewer full-time contracts ����������������������������������������������������������������������34
Ineffective implementation of policies ��������������������������������������������������34
Churn at a managerial level ������������������������������������������������������������������34
Pressure on training time ����������������������������������������������������������������������34
‘Less than total flexibility’ ���������������������������������������������������������������������34
Internal limits to progression ����������������������������������������������������������������35
Unequal treatment ��������������������������������������������������������������������������������35
Cultural gap ������������������������������������������������������������������������������������������35
Risk aversion �����������������������������������������������������������������������������������������35
Conclusion ��������������������������������������������������������������������������������������������36
Section 5
Sectors and occupations �����������������������������������������������������������������������37
Key factors ��������������������������������������������������������������������������������������������37
Zooming into sectors ����������������������������������������������������������������������������37
Structure of sectors ������������������������������������������������������������������������������41
Conclusion ��������������������������������������������������������������������������������������������46
5Escape Plan: Understanding who progresses from low pay and who gets stuck Contents
This publication is available in the Wages & Income section of our website @resfoundation
Section 6
Conclusion ��������������������������������������������������������������������������������������������47
References ��������������������������������������������������������������������������������������������49
Annex A: NESPD methodology ������������������������������������������������������������51
Annex B: British Household Panel Survey and Understanding Society
Methodology ����������������������������������������������������������������������������������������53
Annex C: Sample size and attrition �������������������������������������������������������56
Annex D: Regression analysis results ����������������������������������������������������57
Annex E: Additional tables��������������������������������������������������������������������61

This publication is available in the Wages & Income section of our website @resfoundation
Escape Plan: Understanding who progresses from low pay and who gets stuck Executive Summary
6
Executive summary
The escapers
Do low-paying jobs act as the first rung on the career ladder? Understanding for whom entry-level positions lead to higher earnings – and for whom they don’t – is crucial to improving labour market outcomes for the UK’s 5.2 million low paid employees. Previous Resolution Foundation research examined how much pay progression was occurring among all low paid employees, tracking the same group of people over time. Here, we focus primarily on those who were low paid in 2001 and remained in employment for most of the subsequent decade.
Our analysis finds that of those who were predominantly in work over the following ten years, one in four people (25 per cent) escaped from low pay. Among those who didn’t escape, the majority (64 per cent) moved onto wages above the low pay threshold – equivalent to £7.69 in 2013 – at some point but had not succeeded in earning consistently higher wages by the end of the period. A smaller group (12 per cent) remained in low pay throughout.
Progression and living standards
Escapers appear to have left low pay well behind as their wages grew by on average 7.5 per cent a year in real-terms (RPI) over the course of the decade, bringing their pay up to around the level of typical workers. Those who didn’t escape saw their wages grow half as fast, at 3.6 per cent annually after controlling for inflation. What impact do these varying trajectories have on living standards?
Our analysis finds that while the household incomes of the low paid look relatively similar at the beginning of the period, a significant gap opens up over the following decade. In households in which escapers live, incomes – unsurprisingly – increased by on average 80 per cent whereas the incomes of households of those who were regularly in work but didn’t escape increased by 11 per cent.
This publication is available in the Wages & Income section of our website @resfoundation
7Escape Plan: Understanding who progresses from low pay and who gets stuck Contents
Understanding the escapers
What explains the pay progression experienced by the escapers but not by the others? To answer this, three datasets – British Household Panel Survey, Understanding Society and the New Earnings Survey Panel Dataset – were analysed. A series of interviews and focus groups were held with low-paid staff and managers to explore how these issues play out in the workplace.
Personal, household and attitudinal factors
Two groups potentially in need of more support and flexibility from employers in order to progress –single parents and people with disabilities – were less likely to progress, with their characteristics negatively associated with progression. The analysis highlighted that having a degree at the beginning of the period or receiving one during the following decade significantly boosted a person’s likelihood of escaping low pay. The importance of a strong work ethic and a positive attitude was regularly highlighted in the qualitative research. This was reinforced in the quantitative analysis by the finding that people who felt that the ‘future looks good’ were more likely to progress.
The employee-employer relationship
The analysis underscores that staying in regular employment is important to progress from low paid work but by no means guarantees it. Among those who are usually in work however, doing so on a part-time basis is negatively associated with escaping from low pay. The findings of our qualitative research prompt a number of explanations for this, in particular that in many firms moving into higher paid positions was only possible for those working full-time, as well as ‘softer’ factors including limited knowledge of progression opportunities and a less developed relationship with managers.
Working for a large employer (1000+ employees) is positively correlated with moving out of low pay. There may be a number of factors involved, notably that large firms are often higher paying and have more senior positions for staff to progress into.
The respondents to the qualitative research worked primarily for large employers, among whom the vast majority reported that there were progression policies in place. While staff appreciated these and those among the managers who had progressed themselves had often availed of such
This publication is available in the Wages & Income section of our website @resfoundation
8Escape Plan: Understanding who progresses from low pay and who gets stuck Contents
schemes, there was a consensus that in many firms, the policies were not implemented in an effective way. The processes were often completed with an attitude of ‘box-ticking’ by managers whose primary focus was on meeting their own sales and performance targets and had usually received little or no training on how to develop their staff.
Importantly, the data analysis found that training – with a variety of types specified in the data – did not play a significant role in improving people’s chances of progressing. This again was echoed by respondents working in retail and hospitality who made the point that training was completed once progression had been agreed upon but to find oneself in the position to move up, other hurdles had to be cleared first.
Is progression worth it?
Perhaps the most vital conceptual factor emerging from the qualitative research was the difference between pay progression and career progression i.e. being promoted into more senior positions. For most respondents, moving from an entry-level role to the next rank up resulted in a pay increase of often less than 50p per hour. Progression brings with it disruption to a settled work-life balance and the risk involved with leaving any steady job. The pyramidal shape of the workforce means progressing further becomes more competitive the higher you rise. Taken together, the choice to remain in their current role felt like a rational one for many respondents.
Sectoral factors
Our analysis finds that, overall, working in the private sector is negatively linked to escaping compared with the public or third sectors. It also highlights how pay progression varies across industrial sectors and occupations, with remaining in the hospitality or sales roles negatively linked to escaping.
‘Progression pathways’ are often put forward as a tool to promote upward mobility but limits to that may be posed by a sector or firm’s hierarchical structure, in that a dearth of higher paid roles to progress into curtails an individual’s chances of moving up. Low-paying industries often did have a higher share of stuck employees, but a number of sub-sectors manage to combine better than average rates of employees escaping with offering many low paid roles.
This publication is available in the Wages & Income section of our website @resfoundation
9Escape Plan: Understanding who progresses from low pay and who gets stuck Contents
Conclusion
Given one in five employees is low paid, it is unrealistic to expect every low paid employee to escape. Our findings highlight that employees can move into higher paying roles but escaping completely from low pay is more difficult. Overall, the evidence presented here suggests that employers and government do have scope to develop the progression prospects of low paid staff. While much is already being done, there are particular groups of people – part-timers, single parents, employees outside of large companies – who are not feeling the benefits.
The report argues that employers and government alike should review their policies and approaches to pay progression to ensure that this large part of the UK’s workforce is not denied the opportunity to move up in work. But the research also revealed that in many ways, progression is just one part of the wider low pay story, with small wage increases for perceived significant increases in responsibility discouraging many from moving off the first rung.
This publication is available in the Wages & Income section of our website @resfoundation
10Escape Plan: Understanding who progresses from low pay and who gets stuck Section 1: Introduction
Section 1
Introduction
Context and relevance
For all the ups and downs in the UK’s economic performance since 2008, one measure has remained stubbornly constant: low pay. One in five (22 per cent) employees earn less than two-thirds of the hourly median wage – £7.69 in 2013 – with that share changing little over the past 20 years.[1] But how concerned should we be?
If in most cases low pay acts as a stepping stone to higher long-term earnings, the argument could be made that it is fulfilling a useful role although elevated levels of low pay will be a worry regardless of its dynamics. But in part, the answer depends on the function of low paid jobs in people’s careers and lives. If it is less a transitory period through which people move while developing experience and skills, and more a position in which they find themselves for years or even decades, the picture looks rather different.[2]
The ability to move from lower onto higher wages over time is a central part of what any society eager to promote social mobility should aspire to. It could be argued however that this issue is even more crucial at our current juncture. In recent decades many middle-skill jobs have been outsourced from the UK or rendered obsolete by technological advances leaving most growth in low and high skill roles.[3] If the middle rungs of the career ladder are growing weaker, making meaningful upward progress may become a more remote prospect for low paid workers.
Pay progression may also impact upon the distribution of household incomes. If those consist-ently on low hourly wages are in better off households then, from a living standards perspective, pay progression may be a less pressing focus for policy. But as just one in three low paid workers live in a household in the top half of the income distribution, limited levels of upward movement out of low paid jobs could be acting as a brake on the incomes of many ordinary families.
The national roll-out of Universal Credit (UC) – the government’s combination of six benefits into one monthly payment – is another reason pay progression is of great relevance currently. The application of conditionality to in-work claimants for the first time means understanding the barriers and enablers of upward wage mobility is valuable for both employees and employers who will also be affected. Under in-work conditionality, UC claimants will, depending on their status, be set a minimum earnings level. While one approach will be simply to take on additional hours – for a childless adult the threshold is expected to be 35 times the National Minimum Wage per week – another reaction would be to increase hourly wages. Pilots are being run and evaluated with a variety of tactics employed to help people boost their earnings.[4] The lessons of
[1] Corlett and Whittaker (2014)
[2] Of course, some people may be perfectly happy being low paid even if they are not in a high income household. The
purpose of this report is not to contend that every low paid person should progress or be eager to do so but instead to better
understand the factors associated with staying low paid and the potential remedies.
[3] See for example Plunkett and Pessoa (2013), UKCES (2014).
[4] https://www.gov.uk/government/speeches/universal-credit-and-in-work-support
This publication is available in the Wages & Income section of our website @resfoundation
11Escape Plan: Understanding who progresses from low pay and who gets stuck Section 1: Introduction
these pilots, along with progression components of City Deals in Plymouth and Glasgow[5] aimed at Work Programme clients and a £2m UKCES and Department of Work and Pensions-funded competition to boost progression in hospitality and retail, will all be valuable resources in the design of such interventions for both employers and government.
An additional concern for government will be the potentially negative effect which low pay will have on future tax and National Insurance receipts. If workers entering low paid jobs – especially younger workers – are unlikely to progress on to higher earnings, and thus higher income tax payments, in the long run limited progression could be costly for the Exchequer. If successful, the cost of UC and Work Programme initiatives to support progression could be dwarfed by the boost it provides to the national coffers.
It is little wonder that pay progression is increasingly recognised as a challenge but it is not, however, a new topic. A body of literature has set out examples of best practice within companies and industries.[6] Most frequently mentioned are ‘progression pathways’ within firms and sectors to help staff develop a clearer understanding of what opportunities are available and what skills they need to improve upon or display to move up. Similarly, embedding progression within the HR practices of the firm, for example discussing promotion prospects within appraisals is widely cited as being beneficial. But despite this store of knowledge of what firms keen to promote progression can put in place, progression levels vary across groups and industries, suggesting that more could be done in some areas.
Previous work
Previous Resolution Foundation analysis sought to establish how much pay progression occurs in the UK.[7] Building upon other work on this topic,[8] Starting out or getting stuck? followed a group of people who were low paid in 2002 over the subsequent decade (2003-2012) to assess the likelihood that, over a given period, low paid people moved onto sustained higher pay. Three categories of people were identified through the data:
» Escapers – people who were initially low paid but managed to move consistently above the low pay threshold a decade later i.e. in each of the final three years of the decade.
» Cyclers – people who at one point or another had earned above the low pay threshold but who had not managed to move consistently out of low pay by the end of the period.
» Stuck – this group was composed of people who had never earned above low pay during the ten-year period.
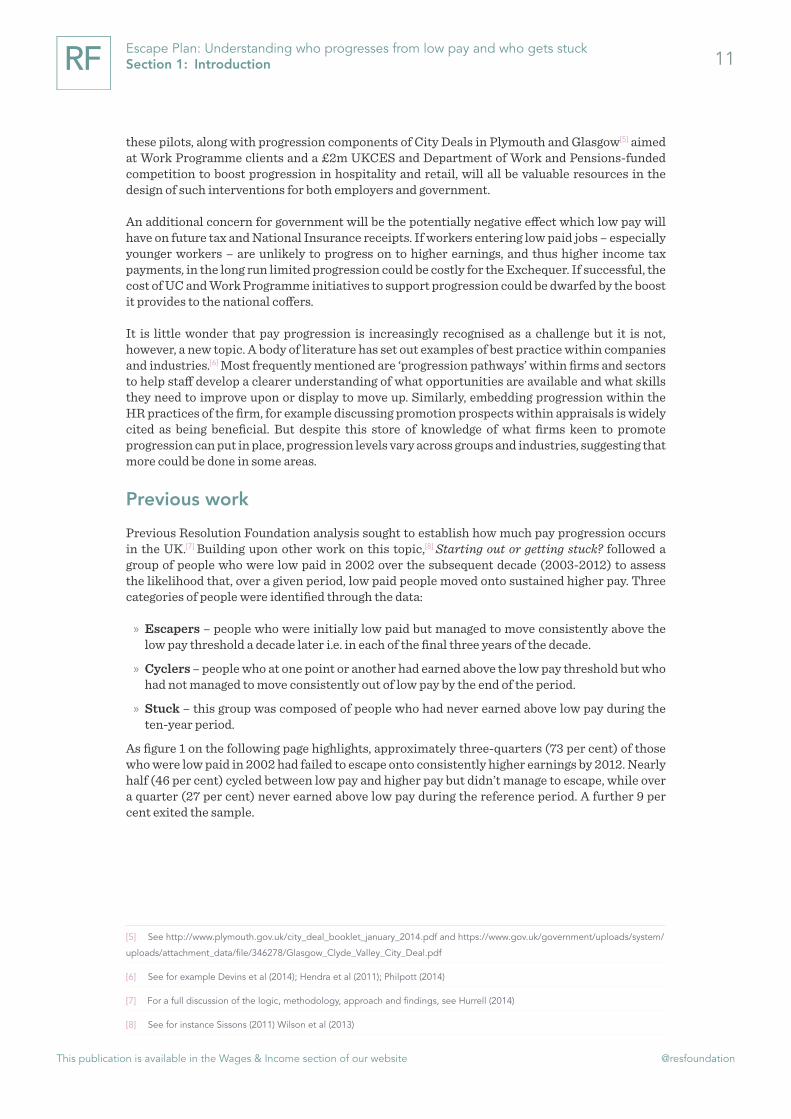
As figure 1 on the following page highlights, approximately three-quarters (73 per cent) of those who were low paid in 2002 had failed to escape onto consistently higher earnings by 2012. Nearly half (46 per cent) cycled between low pay and higher pay but didn’t manage to escape, while over a quarter (27 per cent) never earned above low pay during the reference period. A further 9 per cent exited the sample.
[5] See http://www.plymouth.gov.uk/city_deal_booklet_january_2014.pdf and https://www.gov.uk/government/uploads/system/
uploads/attachment_data/file/346278/Glasgow_Clyde_Valley_City_Deal.pdf
[6] See for example Devins et al (2014); Hendra et al (2011); Philpott (2014)
[7] For a full discussion of the logic, methodology, approach and findings, see Hurrell (2014)
[8] See for instance Sissons (2011) Wilson et al (2013)
This publication is available in the Wages & Income section of our website @resfoundation
12Escape Plan: Understanding who progresses from low pay and who gets stuck Section 1: Introduction
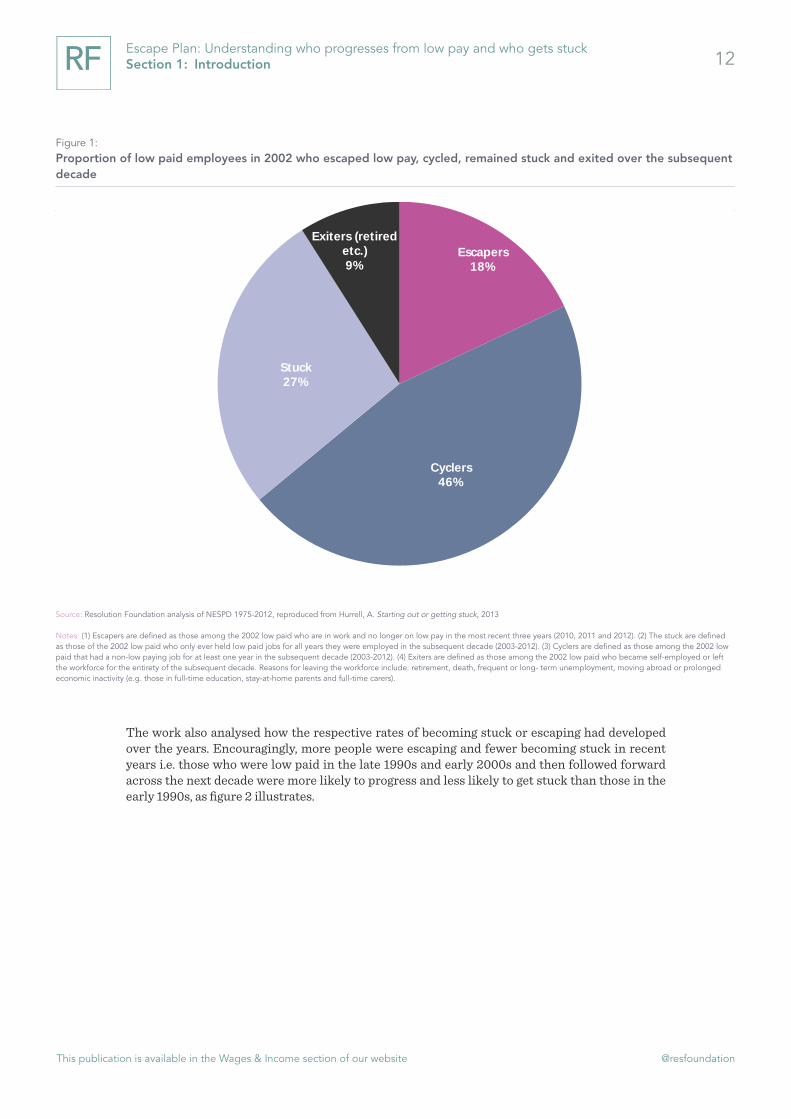
The work also analysed how the respective rates of becoming stuck or escaping had developed over the years. Encouragingly, more people were escaping and fewer becoming stuck in recent years i.e. those who were low paid in the late 1990s and early 2000s and then followed forward across the next decade were more likely to progress and less likely to get stuck than those in the early 1990s, as figure 2 illustrates.
Figure 1: Proportion of low paid employees in 2002 who escaped low pay, cycled, remained stuck and exited over the subsequent decade
This is the line that explains the chart below
Source: Resolution Foundation analysis of NESPD 1975-2012, reproduced from Hurrell, A. Starting out or getting stuck, 2013
Notes: (1) Escapers are defined as those among the 2002 low paid who are in work and no longer on low pay in the most recent three years (2010, 2011 and 2012). (2) The stuck are defined as those of the 2002 low paid who only ever held low paid jobs for all years they were employed in the subsequent decade (2003-2012). (3) Cyclers are defined as those among the 2002 low paid that had a non-low paying job for at least one year in the subsequent decade (2003-2012). (4) Exiters are defined as those among the 2002 low paid who became self-employed or left the workforce for the entirety of the subsequent decade. Reasons for leaving the workforce include: retirement, death, frequent or long- term unemployment, moving abroad or prolonged economic inactivity (e.g. those in full-time education, stay-at-home parents and full-time carers).
Escapers 18%
Cyclers 46%
Stuck 27%
Exiters (retired etc.) 9%
This publication is available in the Wages & Income section of our website @resfoundation
13Escape Plan: Understanding who progresses from low pay and who gets stuck Section 1: Introduction
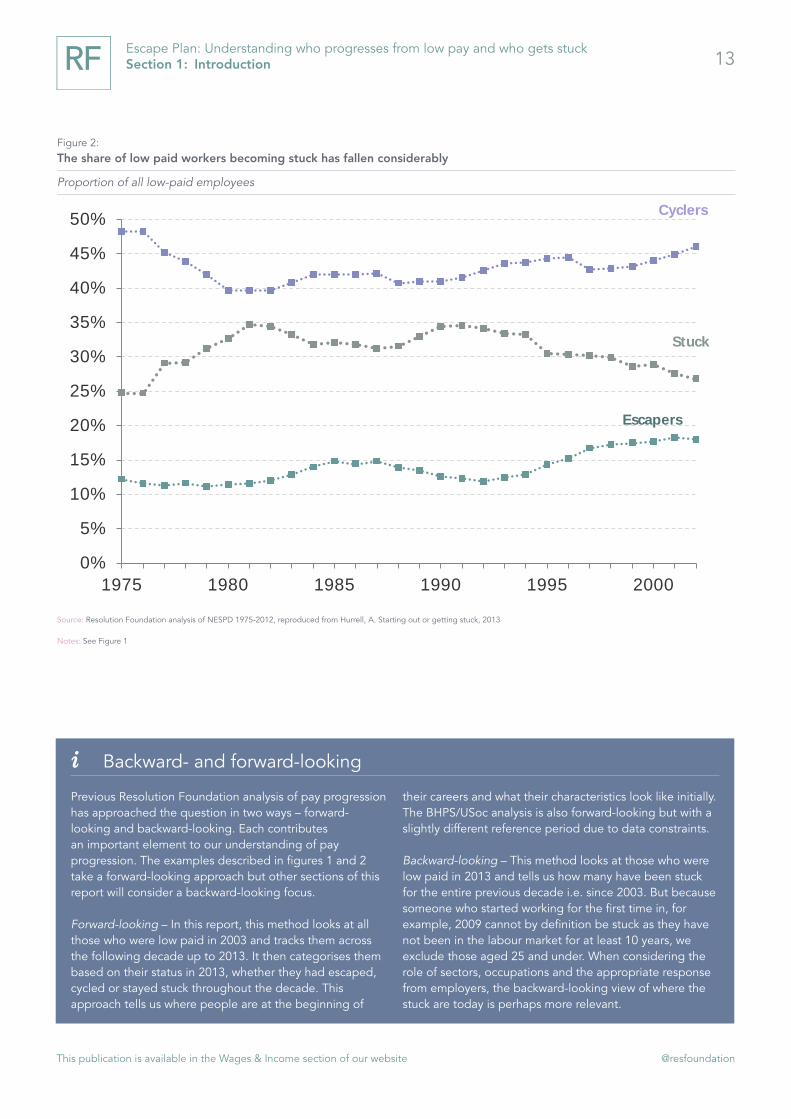
Figure 2: The share of low paid workers becoming stuck has fallen considerably
Proportion of all low-paid employees
Source: Resolution Foundation analysis of NESPD 1975-2012, reproduced from Hurrell, A. Starting out or getting stuck, 2013
Notes: See Figure 1
Escapers
Cyclers
Stuck
0%
5%
10%
15%
20%
25%
30%
35%
40%
45%
50%
1975 1980 1985 1990 1995 2000
i Backward- and forward-looking
Previous Resolution Foundation analysis of pay progression has approached the question in two ways – forward-looking and backward-looking. Each contributes an important element to our understanding of pay progression. The examples described in figures 1 and 2 take a forward-looking approach but other sections of this report will consider a backward-looking focus.
Forward-looking – In this report, this method looks at all those who were low paid in 2003 and tracks them across the following decade up to 2013. It then categorises them based on their status in 2013, whether they had escaped, cycled or stayed stuck throughout the decade. This approach tells us where people are at the beginning of
their careers and what their characteristics look like initially. The BHPS/USoc analysis is also forward-looking but with a slightly different reference period due to data constraints.
Backward-looking – This method looks at those who were low paid in 2013 and tells us how many have been stuck for the entire previous decade i.e. since 2003. But because someone who started working for the first time in, for example, 2009 cannot by definition be stuck as they have not been in the labour market for at least 10 years, we exclude those aged 25 and under. When considering the role of sectors, occupations and the appropriate response from employers, the backward-looking view of where the stuck are today is perhaps more relevant.
This publication is available in the Wages & Income section of our website @resfoundation
14Escape Plan: Understanding who progresses from low pay and who gets stuck Section 1: Introduction
Methodology
Starting out or getting stuck? was based on the New Earnings Survey Panel Dataset (NESPD), a longitudinal version of the Annual Survey for Hours and Earnings (New Earnings Survey prior to 2004). The sample is drawn from HMRC PAYE records and represents a 1 per cent sample of individuals registered for National Insurance. This dataset records hourly earnings far more accurately than other data, enabling us to see when the low paid improve their income through higher wages rather than from working longer hours. Having data as accurate and extensive as this allows us to identify and then examine low pay persistence in the UK over multiple periods.
But while the NESPD has very accurate information on hourly pay and an extremely large sample size, it has three shortcomings for the purposes of analysing pay progression:
» It is limited to just those individuals in employment in any given year. We thus have no information on what a person is doing when they are not in the data, whether they are unemployed, self-employed or inactive.
» A perhaps more fundamental shortcoming of the NESPD for this analysis is that it only captures a relatively basic range of employment-related characteristics. Our ability to understand what lies behind the high share of low paid people who fail to escape without information on crucial variables such as education level, training received and attitudes towards work is likely to be limited.
» Another limitation of the NESPD is its recording of individuals only. If part of our concern with progression is the living standards of households within which low paid people live then not knowing whether the stuck are mostly comfortable second earners or people trying to support themselves solely on their own wage is essential.
This study uses the British Household Panel Survey (BHPS) and Understanding Society (USoc), two datasets which like the NESPD follow a panel of the same individuals over time but are not focused so centrally on earnings and employment. They include information on work, educational history, attitudes, training, caring responsibilities and a broad selection of other questions which have been put forward as potentially integral to understanding pay progression. Furthermore, the BHPS/USoc operates on a household level. This means we are able to assess the extent to which household income plays a role. One disadvantage is that the BHPS/USoc sample sizes are a lot smaller than that of the NESPD which limits the significance of findings.
As the BHPS was discontinued in 2008, the data from 2001-2008 was combined with USoc, another dataset which incorporates similarly broad questions to enable the most up-to-date research reference period possible (2001 to 2011).[9] Our analysis specifically relates to adult individuals (aged 16 and over) who were low paid at the start of the 2001-2011 period. As in the previous analysis, low pay is defined as having a gross hourly wage less than two thirds of the contemporary median.[10][11] These (initially) low paid individuals were then classified into pay progression categories, according to how their hourly pay was observed to evolve over the subsequent decade (2002-2011). The analysis excluded ‘temporary sample members’ – individuals who were only temporarily captured in the survey data because they happened to be living with a permanent sample member and were therefore not systematically tracked over time. To maximise the available sample size, the BHPS
[9] The BHPS covers the period 1991 to 2008, with USoc providing an additional two years (2010 and 2011). Note that there is
therefore a ‘gap’ in the data for the 2009 survey year.
[10] The hourly wage was derived based on usual pay and hours worked (usual normal hours plus usual overtime).
[11] Recent work on pay progression by Kumar et al (2014) replicated the methodology of Starting out or getting stuck. Where
this report and that of Kumar et al differs is in its choice of low pay threshold, with Kumar et al using the contemporary National
Minimum Wage plus 20 per cent as the relevant level which an employee must cross before being deemed to be out of low pay.
This publication is available in the Wages & Income section of our website @resfoundation
15Escape Plan: Understanding who progresses from low pay and who gets stuck Section 1: Introduction
Wales, Scotland and Northern Ireland booster samples are included in the analysis.[12][13]
To understand the factors associated with progression out of low pay regression, we then ran probit regressions using a wide range of time-invariant (unchanging), initial (status in 2001) and ‘dynamic’ characteristics. By ‘dynamic’ characteristics, we mean characteristics that relate to the initial seven years of the subsequent period (2002-2008).[14]
Because the analysis is focused on only those individuals in the panel sample that were low paid in 2001, the sample size for the analysis is relatively small (1,710 individuals). Therefore, for all descriptive statistics presented here the statistical significance of differences in means is specified. The standard errors are calculated taking into account the stratified and clustered BHPS survey design according to the BHPS documentation.
With regard to the time period under discussion, there are a number of caveats worth bearing in mind. Most importantly, the period in which we measure escaping in the BHPS/USoc falls in the immediate post-crisis years of 2008, 2010 and 2011. Due to the steep fall in the employment rate in 2008 and 2009, a person who had progressed out of low pay but was made redundant in 2008 would not be included among the escapees. This arguably makes escaping more challenging. Another issue is that 2009 is unavailable in the data due to the transition from the BHPS to USoc. As such, this may raise the bar for escaping, with a person needing to be out of low pay from 2008 through to 2011, thus making our estimate for the proportion of the escapers potentially conservative.
Definitions and categories
The categories used in the previous research and outlined above – escapers, cyclers and stuck – were decided upon through a combination of judgement on what constitutes progression and what can be measured within the dataset. The additional variables available to us in the BHPS/USoc mean that the limitations necessarily imposed by what was asked in the NESPD need not apply in our categorisation here. For this new work, the definition of escapers remains the same: earning above the relevant low pay threshold in each of the last three years in the sample.
It is with the other two categories – the cyclers and the stuck – where a new definition is employed. The NESPD does not tell us what the individual is doing when they are not an employee while the BHPS/USoc does. From a policy perspective, this ability to differentiate between a person who is in or out of work is helpful. Although this group will be far from homogeneous, if someone is regularly in and out of employment the obstacles which are likely to be facing them – having the basic skills and employability to find steady work, disability, caring responsibilities or other issues – may require an alternative response to those who are usually in employment but unable to propel themselves up the ladder.
To that end, this analysis adds two new categories. Working non-escapers are those who do not escape low paid jobs and are working at least five out of nine years of the sample. They may or may
[12] All descriptive statistics are estimated using the BHPS UK cross-sectional weights (xrwtuk1), and are thus representative of
the UK.
[13] For a complete discussion of the methodological approach taken in this research, please refer to Annexes A and B.
[14] The reason why the ‘dynamic’ variables are not defined over the entire subsequent period (i.e. 2002-2011) is partly concep-
tual and partly pragmatic. Conceptually, since pay progression is defined here as being observed in non-low-paid employment in
the 2008, 2010 and 2011 survey rounds, it makes sense to focus on factors at play over the intervening period, i.e. in the period
up to and including 2008. From a pragmatic perspective, the fact that the data corresponding to the 2010 and 2011 survey
rounds are merged in from the USoc dataset (BHPS-sample), and many key variables are not consistently recorded between BHPS
and USoc, means that defining ‘dynamic’ variables using just the survey rounds covered by the BHPS (i.e. up to 2008) is more
reliable. The only exception to this are the ‘dynamic’ employment status variables which were possible to derive reliably over the
entire subsequent period (2002-2011).
This publication is available in the Wages & Income section of our website @resfoundation
16Escape Plan: Understanding who progresses from low pay and who gets stuck Section 1: Introduction
not earn above the low pay threshold at some point during the period but in the final three years they are not consistently out of low pay. The second group is the non-working non-escapers. This group consists of people who are not normally in work i.e. out of work at least five out of the nine years of the sample. These will be people with difficulty maintaining steady work but also people with disabilities or illnesses, or with caring responsibilities.
Alongside these data sources is a series of in-depth interviews and focus groups completed in July and August 2014. The respondents were low paid employees and managers overseeing them. The majority were employed by large firms. Twelve in-depth interviews and two focus groups were held across the North West, West Midlands, East Midlands and London. Respondents varied by age, sex and location (urban vs. rural) to account for any differences which might impact on progression opportunities. A variety of sectors employing a large proportion of the low paying workforce were chosen to build a picture of progression policies within industries and occupations.
Talking to staff in charge of low paid employees represented an additional perspective on the progression opportunities available to people in low paid jobs. It allowed for a sense of what the barriers were from a different point of view. A number of HR and reward staff were also consulted about the progression policies within their companies. This was helpful in understanding the logic behind the companies’ decisions to offer these resources to their staff and what they viewed as the end goal of this work. But in terms of the barriers and enablers to progression, low paid staff and their managers have a more ‘hands-on’ view of the issue.
Using these new data, this report aims to shed more light on progression. In particular, there are four elements which this research reflects upon:
» To assess how substantial a problem pay progression is, the report begins by setting out the share of low paid people who manage to escape. It provides a basic overview of these people, touching on their age, sex and region among other characteristics. The analysis then explores how pay progression impacts upon living standards.
» What are the personal and household factors which influence pay progression? This analysis reports on basic elements but also other personal and household factors such as education levels, caring responsibilities and attitudes.
» To understand how the employee-employer relationship affects progression, the research assesses how a firm’s size, training, policies and pressures impact progression. It addresses the trade-offs involved in progression, balancing pay increases against any additional diffi-culties arising out of moving up.
» Finally, the role of sectors and occupations is explored, identifying sectors with the highest share of escapers and stuck. It then examines to what extent the make-up of industries, in terms of their pay profile and structure, determines how much progression goes on or is possible.
» The report concludes by combining the findings of each of these areas and discussing the consequences for policy to improve pay progression.
This publication is available in the Wages & Income section of our website @resfoundation
17Escape Plan: Understanding who progresses from low pay and who gets stuck Section 2: New findings
Section 2
New findings
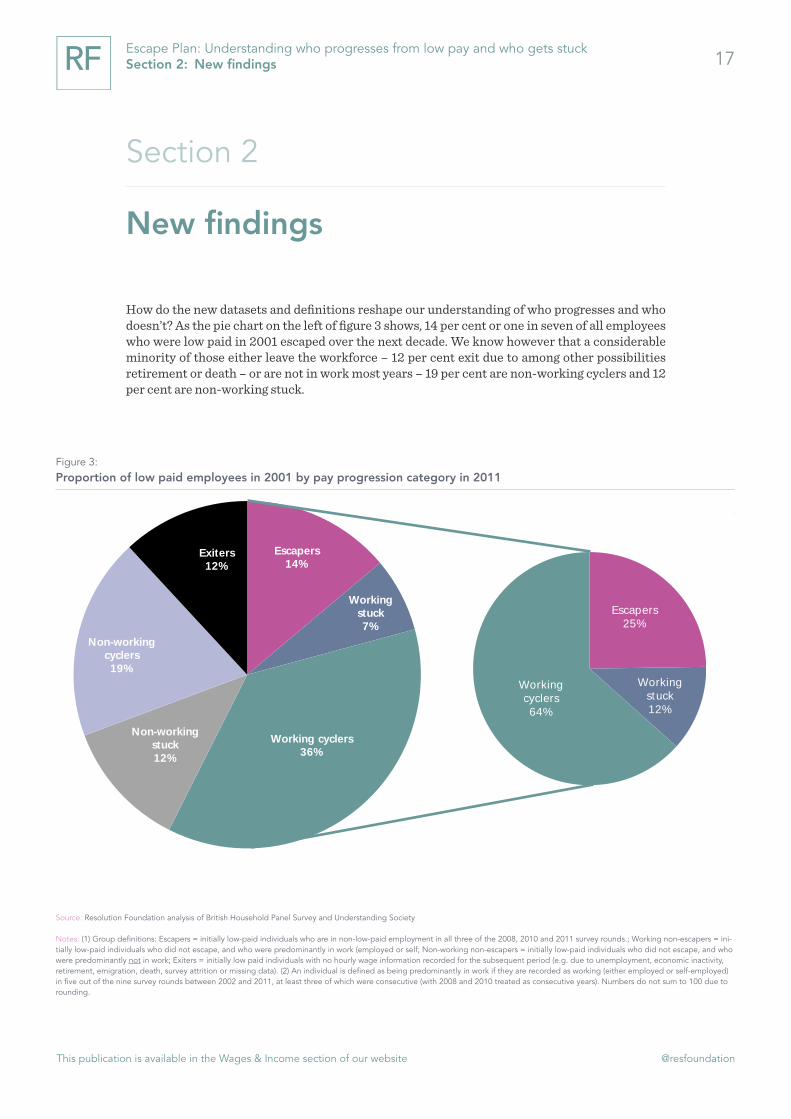
How do the new datasets and definitions reshape our understanding of who progresses and who doesn’t? As the pie chart on the left of figure 3 shows, 14 per cent or one in seven of all employees who were low paid in 2001 escaped over the next decade. We know however that a considerable minority of those either leave the workforce – 12 per cent exit due to among other possibilities retirement or death – or are not in work most years – 19 per cent are non-working cyclers and 12 per cent are non-working stuck.
Figure 3: Proportion of low paid employees in 2001 by pay progression category in 2011
This is the line that explains the chart below
Source: Resolution Foundation analysis of British Household Panel Survey and Understanding Society
Notes: (1) Group definitions: Escapers = initially low-paid individuals who are in non-low-paid employment in all three of the 2008, 2010 and 2011 survey rounds.; Working non-escapers = ini-tially low-paid individuals who did not escape, and who were predominantly in work (employed or self; Non-working non-escapers = initially low-paid individuals who did not escape, and who were predominantly not in work; Exiters = initially low paid individuals with no hourly wage information recorded for the subsequent period (e.g. due to unemployment, economic inactivity, retirement, emigration, death, survey attrition or missing data). (2) An individual is defined as being predominantly in work if they are recorded as working (either employed or self-employed) in five out of the nine survey rounds between 2002 and 2011, at least three of which were consecutive (with 2008 and 2010 treated as consecutive years). Numbers do not sum to 100 due to rounding.
Escapers 14%
Working stuck 7%
Working cyclers 36%
Non-working stuck 12%
Non-working cyclers 19%
Exiters 12%
Escapers 25%
Working stuck 12%
Working cyclers 64%
This publication is available in the Wages & Income section of our website @resfoundation
18Escape Plan: Understanding who progresses from low pay and who gets stuck Section 2: New findings
As it is unrealistic to expect people to progress if they are usually not in employment, a more instructive comparison may be to consider the share of those who are regularly in work that escape. The right-hand pie chart in figure 3 focuses in on just this working group. When we consider those who were mostly in work over the decade, 25 per cent escaped. This suggests that simply being regularly in work is not sufficient to propel people out of low pay, even over a number of years.
The remaining 75 per cent who do not escape are not a homogeneous group however. The vast majority – 64 per cent – fall into the cycler category, that is they earn above low pay at some point during the decade but fail to escape. 12 per cent never earn above low pay despite remaining in work in most years of the period.[15]
Descriptive characteristics
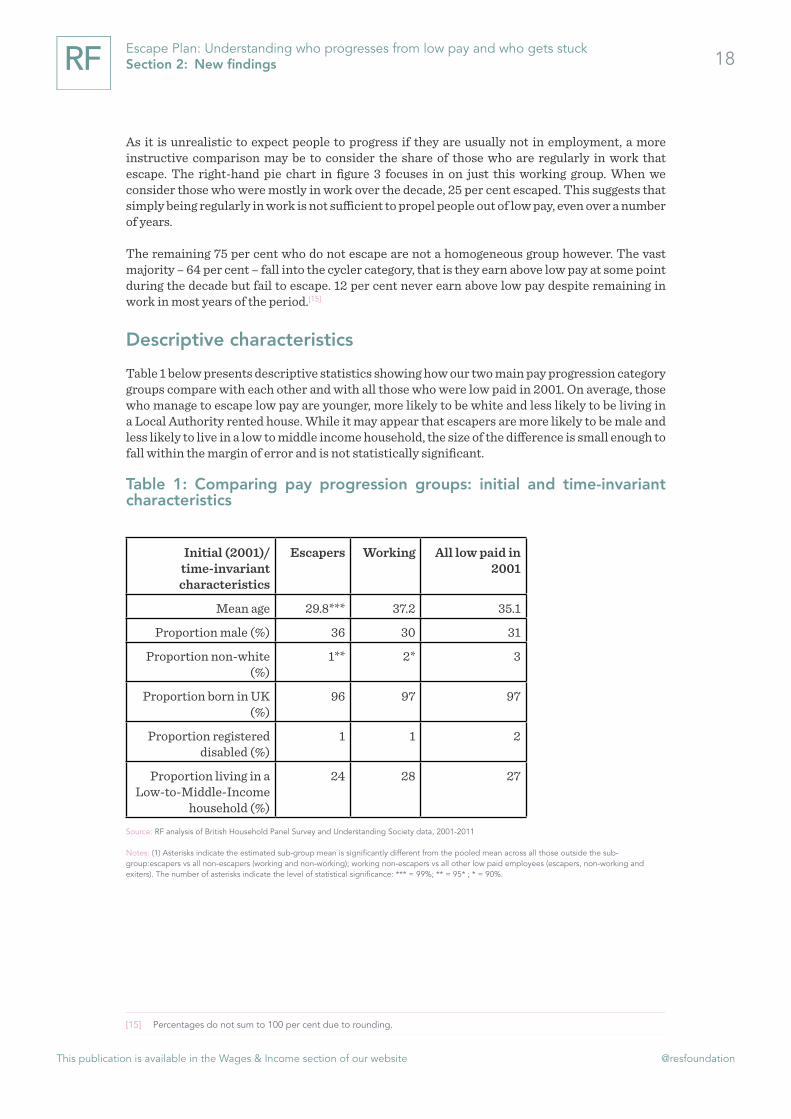
Table 1 below presents descriptive statistics showing how our two main pay progression category groups compare with each other and with all those who were low paid in 2001. On average, those who manage to escape low pay are younger, more likely to be white and less likely to be living in a Local Authority rented house. While it may appear that escapers are more likely to be male and less likely to live in a low to middle income household, the size of the difference is small enough to fall within the margin of error and is not statistically significant.
Table 1: Comparing pay progression groups: initial and time-invariant characteristics
Initial (2001)/ time-invariant characteristics
Escapers Working All low paid in 2001
Mean age 29.8*** 37.2 35.1
Proportion male (%) 36 30 31
Proportion non-white (%)
1** 2* 3
Proportion born in UK (%)
96 97 97
Proportion registered disabled (%)
1 1 2
Proportion living in a Low-to-Middle-Income
household (%)
24 28 27
Source: RF analysis of British Household Panel Survey and Understanding Society data, 2001-2011
Notes: (1) Asterisks indicate the estimated sub-group mean is significantly different from the pooled mean across all those outside the sub-group:escapers vs all non-escapers (working and non-working); working non-escapers vs all other low paid employees (escapers, non-working and exiters). The number of asterisks indicate the level of statistical significance: *** = 99%; ** = 95* ; * = 90%.
[15] Percentages do not sum to 100 per cent due to rounding.
This publication is available in the Wages & Income section of our website @resfoundation
19Escape Plan: Understanding who progresses from low pay and who gets stuck Section 2: New findings
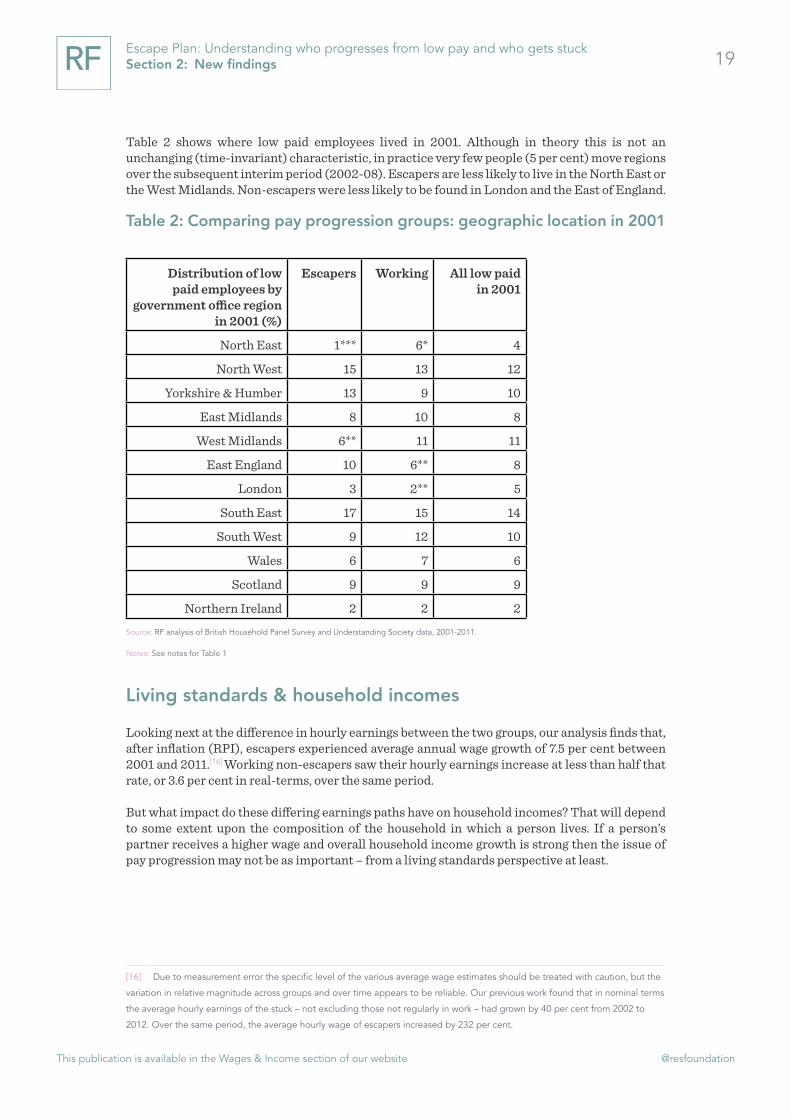
Table 2 shows where low paid employees lived in 2001. Although in theory this is not an unchanging (time-invariant) characteristic, in practice very few people (5 per cent) move regions over the subsequent interim period (2002-08). Escapers are less likely to live in the North East or the West Midlands. Non-escapers were less likely to be found in London and the East of England.
Table 2: Comparing pay progression groups: geographic location in 2001
Distribution of low paid employees by
government office region in 2001 (%)
Escapers Working All low paid in 2001
North East 1*** 6* 4
North West 15 13 12
Yorkshire & Humber 13 9 10
East Midlands 8 10 8
West Midlands 6** 11 11
East England 10 6** 8
London 3 2** 5
South East 17 15 14
South West 9 12 10
Wales 6 7 6
Scotland 9 9 9
Northern Ireland 2 2 2
Source: RF analysis of British Household Panel Survey and Understanding Society data, 2001-2011.
Notes: See notes for Table 1
Living standards & household incomes
Looking next at the difference in hourly earnings between the two groups, our analysis finds that, after inflation (RPI), escapers experienced average annual wage growth of 7.5 per cent between 2001 and 2011.[16] Working non-escapers saw their hourly earnings increase at less than half that rate, or 3.6 per cent in real-terms, over the same period.
But what impact do these differing earnings paths have on household incomes? That will depend to some extent upon the composition of the household in which a person lives. If a person’s partner receives a higher wage and overall household income growth is strong then the issue of pay progression may not be as important – from a living standards perspective at least.
[16] Due to measurement error the specific level of the various average wage estimates should be treated with caution, but the
variation in relative magnitude across groups and over time appears to be reliable. Our previous work found that in nominal terms
the average hourly earnings of the stuck – not excluding those not regularly in work – had grown by 40 per cent from 2002 to
2012. Over the same period, the average hourly wage of escapers increased by 232 per cent.
This publication is available in the Wages & Income section of our website @resfoundation
20Escape Plan: Understanding who progresses from low pay and who gets stuck Section 2: New findings
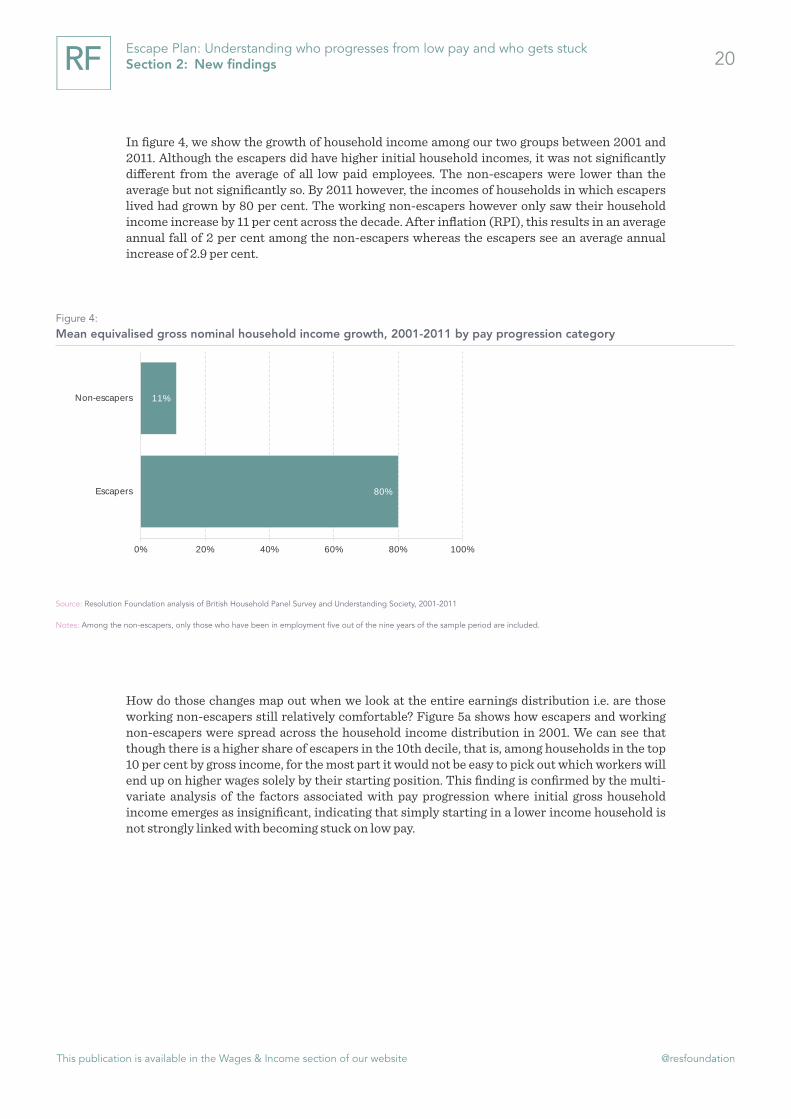
In figure 4, we show the growth of household income among our two groups between 2001 and 2011. Although the escapers did have higher initial household incomes, it was not significantly different from the average of all low paid employees. The non-escapers were lower than the average but not significantly so. By 2011 however, the incomes of households in which escapers lived had grown by 80 per cent. The working non-escapers however only saw their household income increase by 11 per cent across the decade. After inflation (RPI), this results in an average annual fall of 2 per cent among the non-escapers whereas the escapers see an average annual increase of 2.9 per cent.
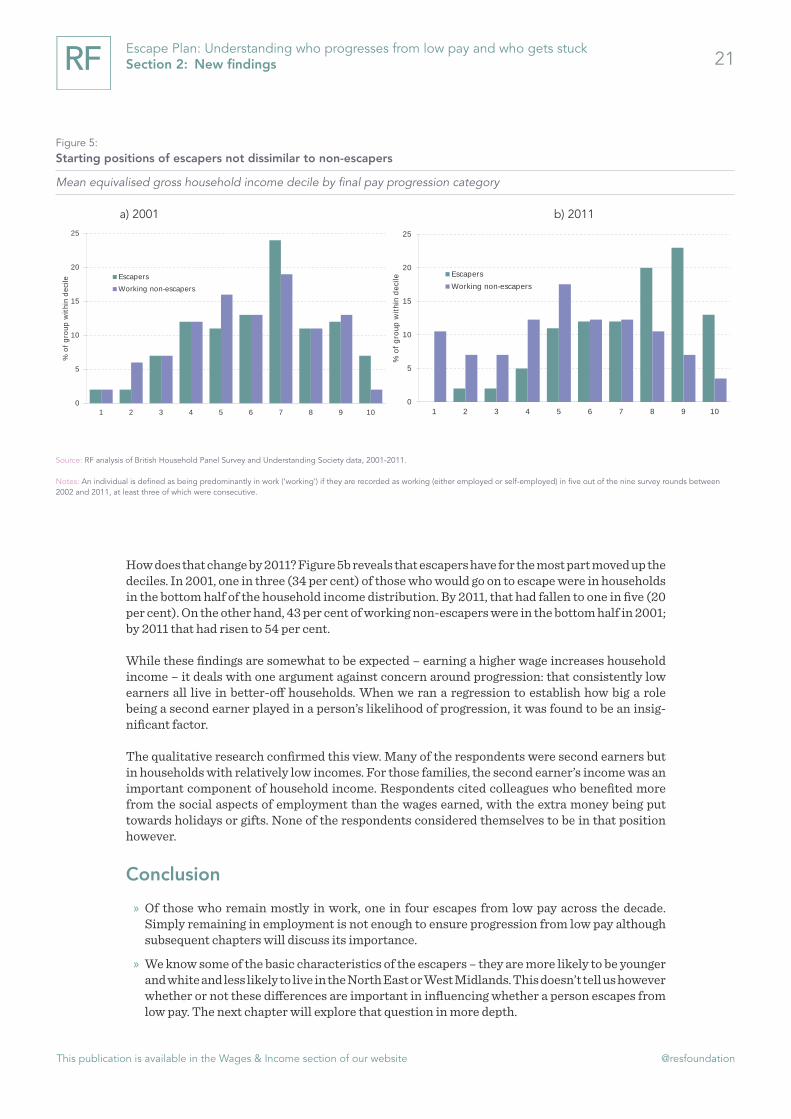
How do those changes map out when we look at the entire earnings distribution i.e. are those working non-escapers still relatively comfortable? Figure 5a shows how escapers and working non-escapers were spread across the household income distribution in 2001. We can see that though there is a higher share of escapers in the 10th decile, that is, among households in the top 10 per cent by gross income, for the most part it would not be easy to pick out which workers will end up on higher wages solely by their starting position. This finding is confirmed by the multi-variate analysis of the factors associated with pay progression where initial gross household income emerges as insignificant, indicating that simply starting in a lower income household is not strongly linked with becoming stuck on low pay.
Figure 4: Mean equivalised gross nominal household income growth, 2001-2011 by pay progression category
This is the line that explains the chart below
Source: Resolution Foundation analysis of British Household Panel Survey and Understanding Society, 2001-2011
Notes: Among the non-escapers, only those who have been in employment five out of the nine years of the sample period are included.
80%
11%
0% 20% 40% 60% 80% 100%
Escapers
Non-escapers
This publication is available in the Wages & Income section of our website @resfoundation
21Escape Plan: Understanding who progresses from low pay and who gets stuck Section 2: New findings
How does that change by 2011? Figure 5b reveals that escapers have for the most part moved up the deciles. In 2001, one in three (34 per cent) of those who would go on to escape were in households in the bottom half of the household income distribution. By 2011, that had fallen to one in five (20 per cent). On the other hand, 43 per cent of working non-escapers were in the bottom half in 2001; by 2011 that had risen to 54 per cent.
While these findings are somewhat to be expected – earning a higher wage increases household income – it deals with one argument against concern around progression: that consistently low earners all live in better-off households. When we ran a regression to establish how big a role being a second earner played in a person’s likelihood of progression, it was found to be an insig-nificant factor.
The qualitative research confirmed this view. Many of the respondents were second earners but in households with relatively low incomes. For those families, the second earner’s income was an important component of household income. Respondents cited colleagues who benefited more from the social aspects of employment than the wages earned, with the extra money being put towards holidays or gifts. None of the respondents considered themselves to be in that position however.
Conclusion
» Of those who remain mostly in work, one in four escapes from low pay across the decade. Simply remaining in employment is not enough to ensure progression from low pay although subsequent chapters will discuss its importance.
» We know some of the basic characteristics of the escapers – they are more likely to be younger and white and less likely to live in the North East or West Midlands. This doesn’t tell us however whether or not these differences are important in influencing whether a person escapes from low pay. The next chapter will explore that question in more depth.
Figure 5: Starting positions of escapers not dissimilar to non-escapers
Mean equivalised gross household income decile by final pay progression category
Source: RF analysis of British Household Panel Survey and Understanding Society data, 2001-2011.
Notes: An individual is defined as being predominantly in work (‘working’) if they are recorded as working (either employed or self-employed) in five out of the nine survey rounds between 2002 and 2011, at least three of which were consecutive.
a) 2001 b) 2011
0
5
10
15
20
25
1 2 3 4 5 6 7 8 9 10
% o
f g
roup
wit
hin
deci
le Escapers
Working non-escapers
0
5
10
15
20
25
1 2 3 4 5 6 7 8 9 10
% o
f g
roup
wit
hin
deci
le Escapers
Working non-escapers
This publication is available in the Wages & Income section of our website @resfoundation
22Escape Plan: Understanding who progresses from low pay and who gets stuck Section 2: New findings
» The importance of pay progression as a broader policy concern is borne out by its links to household income growth. Low paid workers are more likely to be in the bottom half of the household income distribution, experiencing growth far below that seen by escaper households. Addressing the progression prospects of these workers will therefore not only have impacts on individuals but also on households, poverty levels and benefit entitlement.
We know then the impact that pay progression has on individual earnings and household incomes. But given that two potentially explanatory factors – being a second earner or being in a higher-earning household – have been ruled out, it raises the question of what does determine pay progression prospects. The next chapter analyses which individual and household characteristics affect this process.

This publication is available in the Wages & Income section of our website @resfoundation
23Escape Plan: Understanding who progresses from low pay and who gets stuck Section 3 : Individual and household factors
Section 3
Individual and household factors
We have already discussed how escapers and non-escapers differ on basic characteristics. This tells us what each group looks like but it does not illuminate whether these are the real determi-nants of pay progression. To do that, a regression model is used to identify those factors which have a significant impact. The following chapters will discuss each of the significant charac-teristics grouped with qualitative research at an individual, household, employee-employer or sectoral level.
Key factors
We ran regressions using a wide range of time-invariant (unchanging e.g. ethnicity), initial (in 2001) and ‘dynamic’ (between 2002 and 2008, before the ‘escape’ period of the final three years begins) characteristics.[17] Table 3 below presents the individual and household characteristics that are positively or negatively linked with progression. This does not mean that if someone possesses some or all of the negative characteristics that they cannot progress. Rather, if low pay is considered as a maze from which employees try to work their way out of, those with positive characteristics start off somewhat nearer to the exit while those with negative characteristics find themselves closer to the centre. Some of the factors are stronger than others in terms of the size of the effect they appear to have on a person’s chances of progressing, as displayed in table D2 in Annex D.
On the question of education, only previously holding or being awarded a degree emerges as being linked with progression. None of the other educational qualification levels such as having completed GCSEs or A-levels are associated with progression. While this may appear unusual given that the wage returns to a person with A-levels tend to be higher than to someone with no qualifications,[18] the make-up of the group needs to be borne in mind. Because we are looking solely at those who remain regularly in work, it may be that having basic and intermediate quali-fications are important in helping people into work but not to progress.
This finding was broadly supported by the interviews and focus groups. For many people, a degree was seen as a route to higher pay in the long run. A lack of mathematical or reading and writing skills was cited as an obstacle by only a few respondents. While more senior positions would require people to ‘brush up on their maths’, most felt that the primary barriers to progression lay elsewhere and that a number of firms would offer support with building confidence around basic skills.
More broadly, experiences in school among participants tended not to be particularly negative or positive. Respondents discussed the role that bad experiences in school could have in later life, with a ‘mind-set of failure’ developing as a result. This lack of self-belief and fear of failure was seen by many of the managers as holding back staff whom they considered capable and suited for progression.[19]
[17] For a full discussion of the methodology used, refer to Annex B.
[18] http://www.ons.gov.uk/ons/dcp171776_229888.pdf
[19] The policy implemented by Morrisons of offering NVQ training to staff partly to give them a sense of achievement rather
than building skills is an interesting example of how this might be counteracted. See Devins et al (2010)
This publication is available in the Wages & Income section of our website @resfoundation
24Escape Plan: Understanding who progresses from low pay and who gets stuck Section 3 : Individual and household factors
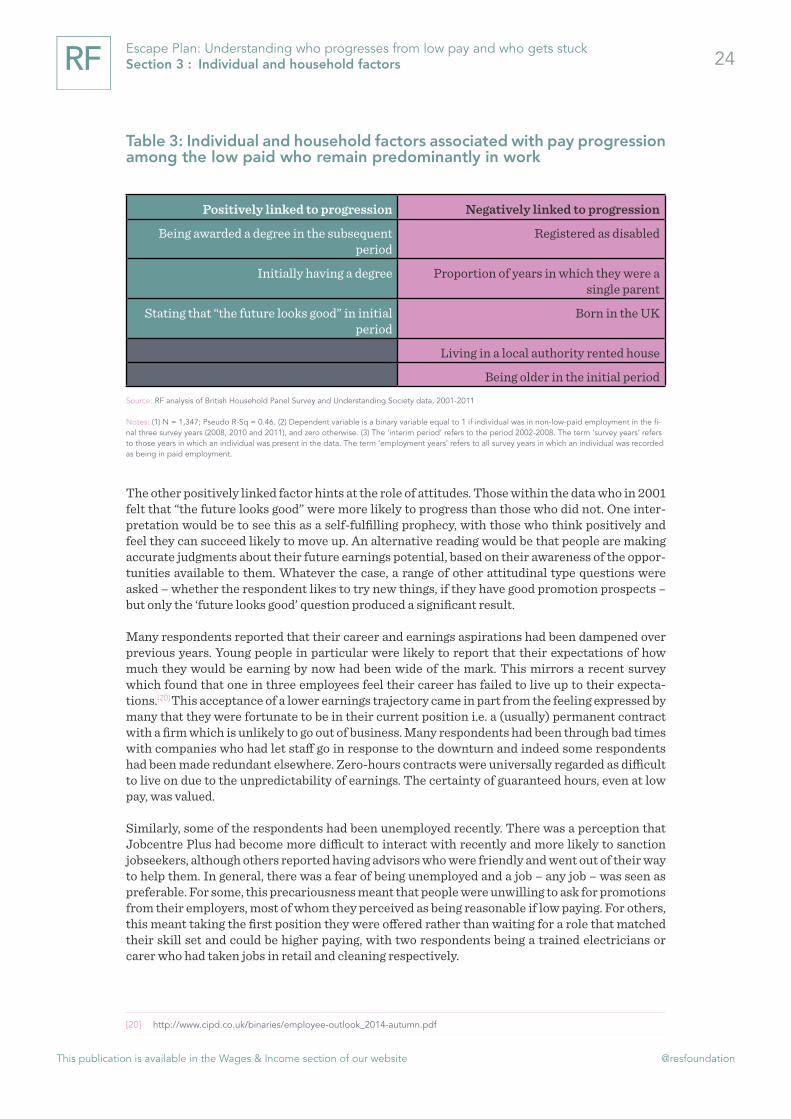
Table 3: Individual and household factors associated with pay progression among the low paid who remain predominantly in work
Positively linked to progression Negatively linked to progression
Being awarded a degree in the subsequent period
Registered as disabled
Initially having a degree Proportion of years in which they were a single parent
Stating that “the future looks good” in initial period
Born in the UK
Living in a local authority rented house
Being older in the initial period
Source: RF analysis of British Household Panel Survey and Understanding Society data, 2001-2011
Notes: (1) N = 1,347; Pseudo R-Sq = 0.46. (2) Dependent variable is a binary variable equal to 1 if individual was in non-low-paid employment in the fi-nal three survey years (2008, 2010 and 2011), and zero otherwise. (3) The ‘interim period’ refers to the period 2002-2008. The term ‘survey years’ refers to those years in which an individual was present in the data. The term ‘employment years’ refers to all survey years in which an individual was recorded as being in paid employment.
The other positively linked factor hints at the role of attitudes. Those within the data who in 2001 felt that “the future looks good” were more likely to progress than those who did not. One inter-pretation would be to see this as a self-fulfilling prophecy, with those who think positively and feel they can succeed likely to move up. An alternative reading would be that people are making accurate judgments about their future earnings potential, based on their awareness of the oppor-tunities available to them. Whatever the case, a range of other attitudinal type questions were asked – whether the respondent likes to try new things, if they have good promotion prospects – but only the ‘future looks good’ question produced a significant result.
Many respondents reported that their career and earnings aspirations had been dampened over previous years. Young people in particular were likely to report that their expectations of how much they would be earning by now had been wide of the mark. This mirrors a recent survey which found that one in three employees feel their career has failed to live up to their expecta-tions.[20] This acceptance of a lower earnings trajectory came in part from the feeling expressed by many that they were fortunate to be in their current position i.e. a (usually) permanent contract with a firm which is unlikely to go out of business. Many respondents had been through bad times with companies who had let staff go in response to the downturn and indeed some respondents had been made redundant elsewhere. Zero-hours contracts were universally regarded as difficult to live on due to the unpredictability of earnings. The certainty of guaranteed hours, even at low pay, was valued.
Similarly, some of the respondents had been unemployed recently. There was a perception that Jobcentre Plus had become more difficult to interact with recently and more likely to sanction jobseekers, although others reported having advisors who were friendly and went out of their way to help them. In general, there was a fear of being unemployed and a job – any job – was seen as preferable. For some, this precariousness meant that people were unwilling to ask for promotions from their employers, most of whom they perceived as being reasonable if low paying. For others, this meant taking the first position they were offered rather than waiting for a role that matched their skill set and could be higher paying, with two respondents being a trained electricians or carer who had taken jobs in retail and cleaning respectively.
[20] http://www.cipd.co.uk/binaries/employee-outlook_2014-autumn.pdf
This publication is available in the Wages & Income section of our website @resfoundation
25Escape Plan: Understanding who progresses from low pay and who gets stuck Section 3 : Individual and household factors
Turning now to the personal and household factors negatively linked to progression, the strongest among those is being registered as disabled. It is worth remembering that these are people with disabilities but who are in work most years in the sample. This echoes previous research which found that disabled people were more likely to be low paid and less likely to progress.[21][22] There may be issues such as transport arrangements or other practical difficulties involved in taking on more demanding roles. That said, it is interesting that the analysis found that poor health – measured by frequent visits to GP, self-reported health problems and whether health limits type or amount of work done – was not significant. This indicates there may be factors above and beyond an inability to carry out work that hold people registered as disabled back from progressing, with the interaction of the tax and benefit system with employment a potential component.
Our analysis finds that those born in the UK are less likely to escape from low pay than non-UK-born workers. The type of people who move to the UK and their reasons for doing so may partly explain this, with many likely to be in the country primarily for employment opportunities. Although a number of attitudinal questions are asked in the questionnaire for the BHPS or USoc, it may be that unobserved opinions towards employment explain some of this difference.
One issue which is frequently discussed in relation to pay progression is the opportunities available to women and mothers in particular. Our research finds no significant positive or negative effect of being a woman or having young children in the household. This is somewhat surprising given previous findings and the potential difficulties around organising childcare. But again, these are people who are already regularly in work so they have managed to arrange a work-life balance that, to some degree at least, works for them. It may be however that it is not having school-age children which presents a problem but rather working part-time that limits their opportunities. This is a topic we will return to in the following chapter. One characteristic which is negatively associated with progression, even controlling for these other factors, is being a lone parent. They will most likely face the barriers that other mothers do around part-time work, childcare and travel but these may be exacerbated without the help of a partner.[23] Rearranging these for the sake of pay progression therefore may seem more trouble than it is worth, as will be unpacked further in subsequent chapters. Again, as with people with disabilities, the interaction between the benefits system and work also be influential.
Living in a local authority rented property in the initial period also appears as a potential roadblock to higher hourly earnings. There is an existing body of evidence exploring the relationship between social housing and employment.[24] As with single parents, there may be specific concerns around benefit entitlement and how that might be affected if their hourly wage increased. Social housing tenants may have less incentive to earn more as a large part of their outgoings – rent – is affordable and hence the need to earn more is not as pressing as for those in private rented accommodation.
Finally, moving onto age, being older was negatively linked to becoming trapped in low pay. This finding may be connected in a way to qualification levels although as discussed, education does not feature as a key factor. Interestingly however, being young (16-24) did not emerge as statis-tically significant in terms of helping people to escape over and above the general age effect.[25]
There was a feeling among some staff – not necessarily restricted to those who were older – that managers made assumptions about which staff would be interested in progression and which [21] MacInnes et al (2014)
[22] Wilson et al (2013)
[23] Gingerbread (2012)
[24] See for instance Hills (2007)
[25] Of the low paid in 2001, some of them are likely to have been students working part-time low paid roles alongside their
studies. When we exclude all those aged 16-20 from the data, all of the findings remain significant. When we exclude all those
aged 16 to 25 we once again get consistent results, but in this case some factors become insignificant: gaining a degree and be-
ing a single parent, as well as working mostly in hospitality. However excluding all young people aged 16 to 25 involves losing a
large proportion of our sample, so it may simply be the small sample size that is driving some of these insignificant results.
This publication is available in the Wages & Income section of our website @resfoundation
26Escape Plan: Understanding who progresses from low pay and who gets stuck Section 3 : Individual and household factors
wouldn’t. Among these were part-time workers but also older workers and single mothers.
Aside from the factors which were found to be positively or negatively significant, a number of variables which one may have expected to be of importance were found to be consistently insig-nificant. These include some of the areas discussed above – having young children, being female, being in poor health, being young, initial household income – as well as the region in which one lives. This suggests that many of the issues which are sometimes thought of as key to progression may need to be re-evaluated, at least for those who are regularly in employment but fail to escape.
Conclusion
This chapter has highlighted the interaction between personal and household characteristics and pay progression.
» Degree-level education does make a difference to a person’s chances of progressing but gaining or having lower level qualifications does not. The relationship between experiences in school and those in the workplace merits further attention to fully understand how those links filter through into confidence, aspirations and progression.[26]
» Both the qualitative and quantitative research flags the role of attitudes in pay progression. In one sense, this may be more personality driven, with having a more optimistic outlook leading to better progression. On the other hand, the expectations and confidence of many respondents was closely tied to prevailing local labour market conditions and the cutbacks and layoffs of the past few years.
» Being female or having children does not appear to be significant influences on pay progression. Being a single parent however is negatively linked with escaping low pay, as is having a disability and being older. It may be that some of the barriers facing these groups – difficulty rearranging already complex work-life balances, assumptions on behalf of managers regarding who would be interested in progressing – look quite similar.
While these individual and household factors are obviously important, the domain in which pay progression plays out is within the workplace. Understanding how low paid people as employees and firms as employers negotiate the tricky territory of progression is vital. The next chapter will investigate how that relationship operates.
[26] Research by Ashby and Schoon (2010) for instance find that “teenage career aspirations are linked to adult social status attainment, and
suggest that family background factors, teenage aspirations and ambition value interact to influence social status attainment and earnings in
adulthood“.
This publication is available in the Wages & Income section of our website @resfoundation
27Escape Plan: Understanding who progresses from low pay and who gets stuck Section 4: Employees, firms and progression
Section 4
Employees, firms and progression
This chapter begins by outlining the employee- and firm-level factors identified as positively or negatively associated with progression. The results of the interviews and focus groups are then presented in more depth, revealing issues which are unobservable within the data. Instances of good and bad practice are highlighted, drawing out the enablers of progression as well as the barriers.
Key factors
Which elements of the employee-employer relationship appear to influence pay progression, for better or for worse? Presented in table 4 below are the characteristics which our regression analysis finds play an influential role.
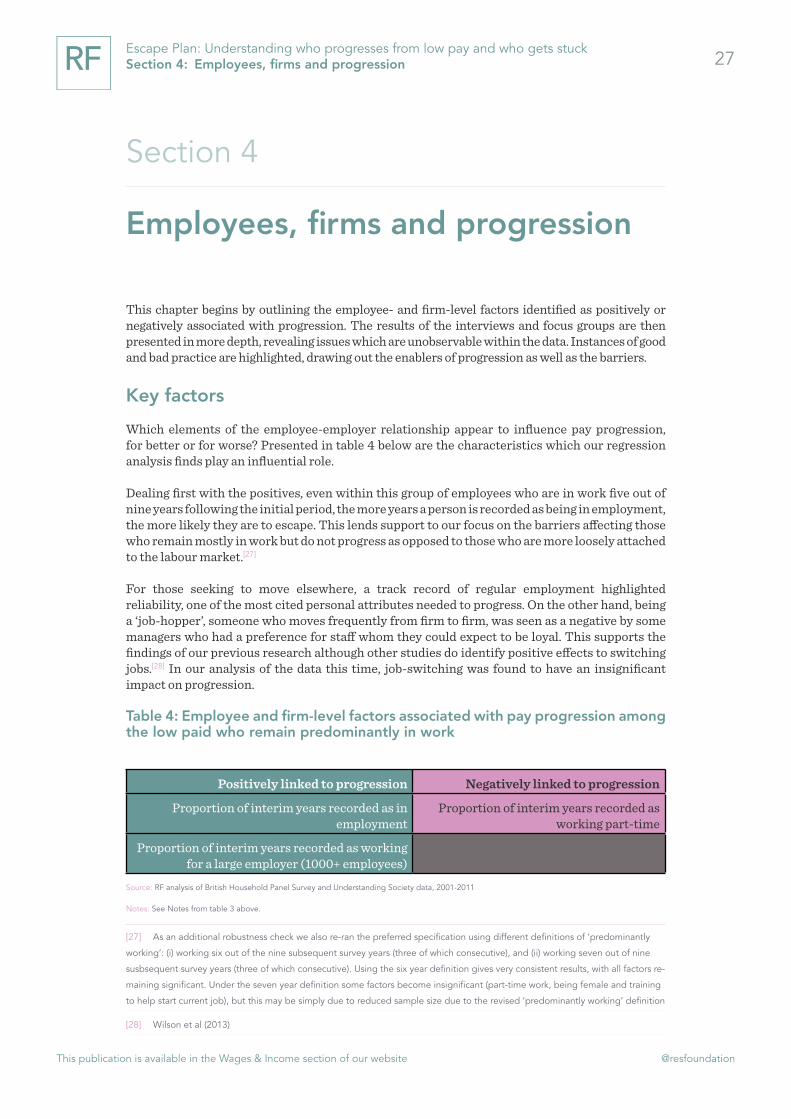
Dealing first with the positives, even within this group of employees who are in work five out of nine years following the initial period, the more years a person is recorded as being in employment, the more likely they are to escape. This lends support to our focus on the barriers affecting those who remain mostly in work but do not progress as opposed to those who are more loosely attached to the labour market.[27]
For those seeking to move elsewhere, a track record of regular employment highlighted reliability, one of the most cited personal attributes needed to progress. On the other hand, being a ‘job-hopper’, someone who moves frequently from firm to firm, was seen as a negative by some managers who had a preference for staff whom they could expect to be loyal. This supports the findings of our previous research although other studies do identify positive effects to switching jobs.[28] In our analysis of the data this time, job-switching was found to have an insignificant impact on progression.
Table 4: Employee and firm-level factors associated with pay progression among the low paid who remain predominantly in work
Positively linked to progression Negatively linked to progression
Proportion of interim years recorded as in employment
Proportion of interim years recorded as working part-time
Proportion of interim years recorded as working for a large employer (1000+ employees)
Source: RF analysis of British Household Panel Survey and Understanding Society data, 2001-2011
Notes: See Notes from table 3 above.
[27] As an additional robustness check we also re-ran the preferred specification using different definitions of ‘predominantly
working’: (i) working six out of the nine subsequent survey years (three of which consecutive), and (ii) working seven out of nine
susbsequent survey years (three of which consecutive). Using the six year definition gives very consistent results, with all factors re-
maining significant. Under the seven year definition some factors become insignificant (part-time work, being female and training
to help start current job), but this may be simply due to reduced sample size due to the revised ‘predominantly working’ definition
[28] Wilson et al (2013)
This publication is available in the Wages & Income section of our website @resfoundation
28Escape Plan: Understanding who progresses from low pay and who gets stuck Section 4: Employees, firms and progression
We find that working for a large employer (1000+ employees) is positively associated with progression. What explains this ‘progression premium’ of large employers? On a practical level, the size of large employers may well be crucial. Because they will usually be spread across a number of sites, a person who is keen to escape low pay is unlikely to have a long wait until a suitable vacancy opens up. Most respondents we spoke to said that vacancies were advertised in the staff room with their experience and knowledge of processes being highly transferrable. Large
employers are more likely to have HR departments which can focus on the needs of staff and put best practice into place.
The literature puts forward other reasons why progression may be higher in large employers. The relationship between firm size and wages has been widely examined and generally finds a
premium attached to large companies, even in low-paying industries.[29] There was consensus among interviewees that it was only large employers that would “do anything for you” in terms of progression. This was partly because their size meant they regularly had new positions to fill but reputational effects also played a role with firms keen to be seen in “Best Employers” lists.
Turning to the negatives, the more years a person spent working part-time the less likely they were to progress.[30] The qualitative interviews attempted to tease out what it was about part-time jobs that meant progression was so difficult. In the eyes of some respondents, part-time workers were often thought of as older women in relatively comfortable households who derive as much value from the social element of the workplace as the financial reward. There will undoubtedly be people in this position but our analysis of BHPS/USoc which found that household income or being a second earner are not strongly associated with pay progression and points towards other considerations being of greater importance. While being female was not in itself found to be a negative factor for pay progression, it is difficult to ignore the highly gendered impact which low progression out of part-time jobs will have, with 77 per cent of all part-time roles filled by women, as of October 2014.
Perhaps the most pervasive issue was the ingrained idea that “part-timers don’t progress”. For the most part, this appeared to be well-grounded. From the point of view of managers, having two part-time supervisors rather than one working full-time was more work for them, having to oversee two people instead of one and coordinating their schedules and responsibilities. The hassle of committing time and effort in training up people who were only in the store half the amount of other people was also discussed. Many part-time respondents explained they felt at somewhat of a remove from the full range of processes within their workplace. This discouraged some from trying to progress as they did not know the full extent of the additional responsibilities, training and skills which would be required and whether there would be any costs. As a resulted, some assumed it would be a long, complicated and perhaps expensive journey.
Training was a factor which emerged as consistently insignificant for progression, despite a variety of types of training being featured in the data including courses to improve skills current
[29] See for instance Lallemand et al (2005) or Cardiff-Hicks et al (2014)
[30] We define part-time work as 20 hours or fewer per week. Interestingly, when the regression was run with 30 hours or fewer
set as the threshold, part-time working did not emerge as a significant negative factor.
The more years a person spent working part-time the less
likely they were to progress
This publication is available in the Wages & Income section of our website @resfoundation
29Escape Plan: Understanding who progresses from low pay and who gets stuck Section 4: Employees, firms and progression
job or courses to prepare for future jobs.[31] Despite this finding, it should be acknowledged that a number of other studies have found positive wage returns to training.[32] Moreover, we cannot say from this study that training will always be ineffective for boosting progression prospects among low earners. Instead, the training that is currently offered to low paid workers at risk of being stuck in low paid jobs may not be high quality training of the type that would assist progression out of low pay.
The limited effectiveness of training in and of itself chimed with the experiences of many respondents. For those who had progressed, training was a step on the path once moving up had been set in motion. Even in industries like childcare, within which training and qualifications are more common, completing training or acquiring a degree were not seen as a guarantee of higher earnings. Across many retail and hospitality positions, the skills required to progress were seen as those for which it is difficult to train, with people skills and personality ranking highest. For many low paid employees, training primarily functioned as a break from their everyday routine and an indicator that the company was willing to invest in them. Training from external providers was valued more highly as it felt more ‘real’ than another member of staff talking them through a manual. External training though was discussed as one of the first expenses to be cut in response to the recession with only a handful of companies having returned to their pre-2008 patterns.
For pay progression, the role of trade unions appears limited with both union membership and having a union or employee voice mechanism present in the workplace found to be insignificant. Taken together with training, this indicates that two of the most relied upon tools to boost the wages of low earners appear to have a limited effect on the share of people escaping.
Enablers
Among our respondents, what were the policies or cultures present within firms which facilitated progression?
Progression policies
An initial question which this project considered was whether there was a group of large employers who were shirking their responsibilities to their staff in terms of pay progression, while others who faced the same pressures chose to do more. While the small sample of the qualitative work undertaken here cannot provide a definitive answer, it was notable that the majority of large employers had some kind of progression policy in place. Most offered at least one of the following:
» internal vacancies were advertised among all staff members
» progression and required next steps were discussed during appraisals
» employees were given training beyond that needed to fulfil their current position
» employees were offered the opportunity to try out different roles within the firm
» managers who had progressed through the firm themselves championed the progression policies in place
These policies were generally well-regarded by managers and employees. Even for those employees who described themselves as not looking to progress, getting to try someone else’s job for a day or taking part in training was appreciated for the break it represented from their routine, as well as making them feel valued by their employer, improving morale.
[31] Other training variables which were found to have an insignificant effect were: courses to help start current job; courses
to increase skills in current job; courses to improve skills current job; courses to prepare for future jobs; courses to develop skills
generally; courses paid for by employer or future employer; courses paid for by a new deal scheme; courses paid for by training-
for-work, yth or tec scheme; workplace or employer training centre course; private training centre course; courses leading directly
to a formal qualification or part of a qualification
[32] CBI (2014)
This publication is available in the Wages & Income section of our website @resfoundation
30Escape Plan: Understanding who progresses from low pay and who gets stuck Section 4: Employees, firms and progression
Fair and well-trained management
There was a consensus among employees that having a fair manager who encouraged and respected your contribution in the workplace was a prerequisite to progress. Many of the managers who had escaped from low pay themselves credited helpful and understanding management for assisting them. There were a number of softer, implicit approaches that employees held in high regard such as being acknowledged for good work (most contact with senior staff was being told off for mistakes) and managers who were willing to ‘get their hands dirty’ on the shop floor.
Those who had risen up through the ranks felt they were better positioned than graduates to advise their low paid employees. Staff members strongly agreed that managers who had progressed intuitively understood their position and were more likely to help them with their own development.
Attitude
Almost universally, when asked what was the most important characteristic needed to progress, employees and managers both said ‘the right attitude’. Maxims such as “employ for attitude, train for skills”, “you can teach people anything” and “you can’t coach character” were frequently cited. Quality management was seen as one way to develop a positive attitude and stronger work ethic in someone who showed little interest in progressing.
Key life stages
Linked closely to the earlier discussion of personal and household factors was the importance of key life stages. There were a number of points at which employers had the opportunity to assist employees:
» Recruitment – the language used when advertising the role was seen to be important. The standard format was to list the role, pay and experience required. Some managers (see box on positive case studies) chose to use this as an opportunity to make it clear that progression was “built-in” to the role to highlight the potential for progression to prospective employees.
» First weeks on the job – after being hired, employees generally felt keen to learn and were eager to develop. Making use of these early weeks of enthusiasm to communicate the culture of progression was an opportunity the best-regarded firms made the most of.
» Changes outside work – developments in the lives of employees could act as trigger points for progression. The most commonly raised example was when children start attending school, as parents are likely to have more time. A good employee-manager relationship facilitated these conversations as they knew more about the worker’s personal life.
» 18-24 months – a touchstone for several respondents was that after an extended period without any progression, employees could become “turned off ” at work. Feeling comfortable within their role but seeing little chance of progression on the horizon, their interest in the role diminishes. Interventions before this point were deemed to be more effective.
» Times of expansion – from the point of view of the life cycle of a company, hiring staff during periods of growth, when new stores are opening regularly with positions to be filled meant employees who showed promise could expect to move into higher paying roles more quickly.
This publication is available in the Wages & Income section of our website @resfoundation
31Escape Plan: Understanding who progresses from low pay and who gets stuck Section 4: Employees, firms and progression
Barriers
Barriers
While many firms put in place some of the helpful practices and behaviours described above, others fell short or created barriers.
Small wage increases and low pay
An initial assumption of this research was that if an employee moves up from a low paid position into a role with more responsibilities, they could expect to be getting close to, if not moving above, the low pay threshold. The qualitative research suggests that in many instances this is not in fact occurring.
Just under half of the low paid staff we interviewed were earning within 30p of the National Minimum Wage (NMW). In most firms, an employee who remained in their role for five or ten years was unlikely to be earning significantly more than those who had started recently.[33] For many workers, the only time they saw a wage increase was just before the NMW rose and would generally be in line with the size of the increase i.e. 10-20p and below the rate of inflation of late.
With no expectation of regular real wage increases, the only way for many of these staff to move onto higher earnings was to be promoted. The next step on the ladder was usually a supervisor position. In the eyes of most employees and managers, the step up from these basic roles to supervisory positions brought with it increased stress levels, pressures upon a person’s work-life balance with demands to work longer hours and no guarantee of further progression.
Given the extra responsibilities placed upon supervisors, it might be expected that there would be a significant wage increase attached for moving up into this role. In most firms however, a promotion would usually bring with it an extra 30-50p per hour. The small increases meant that despite the progression policies, encouragement and training some employers put in place, there was no strong incentive for staff to move up. Some worried that earning a higher wage would mean reduced benefit entitlement and actually being in a worse position overall financially.[33] Staff usually began on a probation wage – either the NMW or a few pence above it – before moving onto a wage a step
beyond that.
i Positive case studies
A franchise of a large chain in the hospitality sector: In the advertisement for their jobs, the role was described as a first step on a ladder and used statistics on how many of their managers had started at bottom. When selecting who to hire, the manager was aware that by hiring those eager to progress he would likely have to devote more time to recruitment as they would seek better opportu-nities elsewhere. A staff member who was less interested in progression would be more likely to stay long term but was often seen as a less effective worker and less eager to take on responsibilities normally held by the manager. Every staff member was enrolled in an NVQ programme to gain qualifications, boost confidence and develop skills.
A specialist retail store: The firm operate a ‘progression book’ from day one of the employee’s time with the company. This sets out the competencies required to move up to the next level, the expected pay increase
and the necessary time period. Management work with staff who are interested in progressing to fit in training or build knowledge of products at times convenient to the employee, often outside of store hours but at a time which suits childcare arrangements or other responsibilities.
A large hospitality chain: A store owner had worked with Jobcentre Plus to find young unemployed staff for newly opening stores. The manager admitted to being sceptical about the idea initially fearing that claimants would be lazy. The company ran two sessions in different towns with contrasting results. The first session had roughly 20 JSA claimants sign up but only two attended. For the other session, 40 people signed up and all of them attended. The manager hired eight of the attendees, a number of whom had already progressed to assistant managerial positions and were keen to go further.
This publication is available in the Wages & Income section of our website @resfoundation
32Escape Plan: Understanding who progresses from low pay and who gets stuck Section 4: Employees, firms and progression
Another frequent complaint was that staff who were let go in response to the recession had never been replaced, despite the volume of trade and customers returning to pre-recession levels.[34] This meant that employees were now effectively doing the work of two people, for the same money.
As result of this combination of factors, the conclusion which many employees and managers reached was that unless you expected to rise further than the supervisory level, the trade-off involved in moving up was often not worth it. When asked whether such changes looked likely to be rolled back in coming months or years, most respondents were pessimistic. One shared a recent example of an expanding supermarket chain in which new entrants received 15p less an hour for the exact same role with the only difference being the six months between their starting dates. Starting closer to the NMW – and further from the low pay threshold – means climbing high enough within the company to escape is likely to be even more challenging. One manager articulated it as the result of head office seeing that they could operate the stores on this limited staffing basis and with minimal ‘perks’. Many respondents felt this was unsustainable however and that good staff would not tolerate worsening conditions over a long period.
[34] This corresponds with the earlier findings of Grimshaw et al (2002) on the process of ‘delayering’ within firms.
i Pay progression and the National Minimum Wage
There may be a connection between promotions from low paying roles bringing with them only small increases in wages and the effect of the National Minimum Wage (NMW). (It is important to note that this study has not explored to what extent this has changed since the NMW was introduced.) One of the unknowns prior to the NMW’s introduction in 1999 was how far up the earnings distribution the wage increase would spread. In fact, these ‘ripple effects’ turned out to be much smaller than anticipated with wage compression seen instead i.e. the gap between the lowest paid workers and those slightly above narrowed.
Figure 6 below shows that around one in 20 employees (1.2 million) were paid the NMW in April 2013, the highest proportion since its introduction. Looking higher up the earnings distribution, we see that 7.6 per cent of employees were paid within 25p of the minimum wage,
while 10.5 per cent were within 50p. This growing band of workers at close proximity to the NMW seem to mirror the experiences of many of the respondents we spoke with.
It is not straightforward however to say that the NMW has reduced the possibility of escaping low pay. As we know from figure 2, the proportion of low paid workers escaping from low pay has been at its highest level of late. This is due in part to the relationship between the wages of NMW workers increasing faster than those at the median. Taken together, the picture is not clear on the exact impact which the NMW may have had on pay progression but it certainly raises questions for how progression develops in an economy with a sharply higher wage floor. As previous Resolution Foundation work has discussed, the need to embed the NMW into a broader policy taking in low pay and progression will be vital.
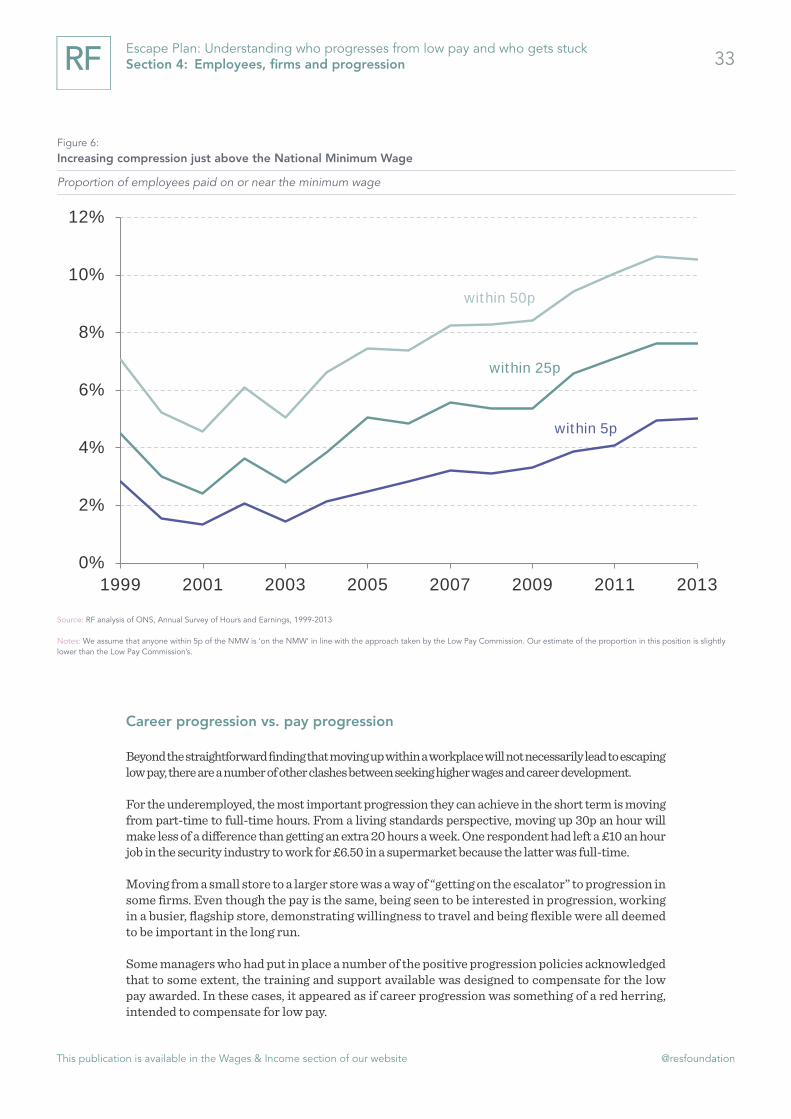
This publication is available in the Wages & Income section of our website @resfoundation
33Escape Plan: Understanding who progresses from low pay and who gets stuck Section 4: Employees, firms and progression
Career progression vs� pay progression
Beyond the straightforward finding that moving up within a workplace will not necessarily lead to escaping low pay, there are a number of other clashes between seeking higher wages and career development.
For the underemployed, the most important progression they can achieve in the short term is moving from part-time to full-time hours. From a living standards perspective, moving up 30p an hour will make less of a difference than getting an extra 20 hours a week. One respondent had left a £10 an hour job in the security industry to work for £6.50 in a supermarket because the latter was full-time.
Moving from a small store to a larger store was a way of “getting on the escalator” to progression in some firms. Even though the pay is the same, being seen to be interested in progression, working in a busier, flagship store, demonstrating willingness to travel and being flexible were all deemed to be important in the long run.
Some managers who had put in place a number of the positive progression policies acknowledged that to some extent, the training and support available was designed to compensate for the low pay awarded. In these cases, it appeared as if career progression was something of a red herring, intended to compensate for low pay.
Figure 6: Increasing compression just above the National Minimum Wage
Proportion of employees paid on or near the minimum wage
Source: RF analysis of ONS, Annual Survey of Hours and Earnings, 1999-2013
Notes: We assume that anyone within 5p of the NMW is ‘on the NMW’ in line with the approach taken by the Low Pay Commission. Our estimate of the proportion in this position is slightly lower than the Low Pay Commission’s.
within 25p
within 5p
within 50p
0%
2%
4%
6%
8%
10%
12%
1999 2001 2003 2005 2007 2009 2011 2013
This publication is available in the Wages & Income section of our website @resfoundation
34Escape Plan: Understanding who progresses from low pay and who gets stuck Section 4: Employees, firms and progression
Fewer full-time contracts
A number of respondents reported that full-time contracts were becoming increasingly rare. [35] In some firms, short hours contracts had become the norm with additional hours regularly available but by no means guaranteed. Many of the respondents who were on these contracts were under-employed and expressed a preference for a standard full-time contract. Extra hours were seen to be offered to those who had a close relationship with managers and were another instance in the eyes of respondents of where less than complete flexibility could see an employee frozen out. This suggests many of the same concerns seen around zero-hours contracts could be repeated among workers on more standard contracts. One potential upside of this development was that in one firm where the balance had shifted entirely towards part-time contracts, there was no preference for full-time workers ahead of part-time workers for progression into supervisory roles.
Ineffective implementation of policies
Simply having progression policies in place was not enough. Frequently mentioned was an impression that head office or HR staff had put a lot of time and effort into developing progression tools and training but poor implementation on the shop-floor meant they were ineffective. It was there that ‘hard’ targets took precedence over concerns like progression. Processes such as discussing promotion prospects within appraisals became seen by some as ‘box-ticking’ with the manager keen to move through the exercise as quickly as possible so they could return to the ‘real work’ of sales figures and safeguarding their own position. Managers admitted to falling into this habit themselves at times of stress.
Churn at a managerial level
An often unacknowledged but vital element of pay progression was having stability among management. A number of respondents cited frequent changing of their managers or supervisors as an important barrier to their own progression. While they understood that if a store was deemed to be underperforming then change could be required, they felt the disruption that resulted from drafting in new senior staff – in some stores this happened on average every six months – not only harmed the employees’ prospects but reduced efficiency more generally, with managers only beginning to settle into the role before being moved on again.
Pressure on training time
A consequence of staffing levels being reduced was that the time away needed for training to move into more senior positions was hard won. While training of staff for progression usually took place in another store to ensure the trainee could focus on learning new skills and not have to fulfil their normal role, in one firm this had been suspended. Due to the demands placed on training time and repeated requests to attend to problems in the store, for one respondent this meant she was unable to finish her training within the allotted year with the modules she had completed now worthless.
‘Less than total flexibility’
As mentioned, the key attribute discussed among employees for progression was attitude. People who were willing to work hard, often ‘beyond the call of duty’, doing unpaid overtime or covering shifts of people who were sick or hadn’t turned up were more likely to be chosen to progress. Unfair management could sometimes mean this extra effort was not taken into account however.
[35] This is supported by the results of a survey undertaken by Usdaw in which more than half of respondents reported working
additional hours each week with 25 per cent working nine or more additional hours on average each week. http://www.usdaw.org.
uk/adviceresources/resources/ecstatements/2014/zerohoursandshorthours.aspx
This publication is available in the Wages & Income section of our website @resfoundation
35Escape Plan: Understanding who progresses from low pay and who gets stuck Section 4: Employees, firms and progression
But in turn, this revealed one of the most difficult barriers to overcome. Without the flexibility to be able to work later than planned or to take a shift at the last minute, it was difficult to build up a positive relationship with your manager. This obviously creates a barrier for those with caring responsibilities who have duties outside of the workplace. A frequent complaint was that for employees, particularly those in retail, it was “all give and no take”.
Internal limits to progression
Other than the largest firms where a higher position can be expected to become available at any time, there are limits to how many people can progress within a firm. Managers spoke of instances in which they had followed best practice with regard to setting out the competencies and targets for staff to reach to be promoted. The difficulty emerged when 40 sales assistants had met all the criteria for progression but positions only became available every few months. This concern has been highlighted in other literature with some firms concluding that raising hopes of progression only for the majority of those to be dashed would be more discouraging than offering little chance to move up.[36]
Unequal treatment
As with other enablers, many of the positive approaches to progression can quickly become negatives if not handled well. A reluctance to ‘brown nose’ or their ‘face not fitting’ was the explanation many respondents gave when asked what held them back from progression. Many spoke quite bitterly of working particularly hard only for a manager to reward one of their ‘favourites’. This acted as one of the biggest disincentives to progress.
Cultural gap
An overarching cultural factor was the distance between management and staff with one employee describing how the managers were unlikely to speak to junior staff and received their own Christmas parties. Some managers described how they had moved up “in spite of themselves” because of the negative experiences they had had with managers in the past. The fear of becoming more like those people, or simply being seen in that way by colleagues, was another obstacle.
Risk aversion
Some respondents admitted to worries around the consequences of progression. They feared not being capable of fulfilling the role, not enjoying the work or disliking new colleagues. The underlying concern behind this was that if the new position did not work out, it would be impossible to return to their previous role and they could end up unemployed with a ‘better the devil you know’ attitude prevailing. This attitude towards change is perhaps part of the reason that some traditional progression policies such as filling in for absent staff can deter some from progression, leaving them feeling overwhelmed, while for others it can be an ideal confidence boost and next step on the ladder.[37]
[36] Schultz and Seith (2011)
[37] On how being ‘dropped in at the deep end’ can help potential ‘high flyers’ see Devins et al (2010)
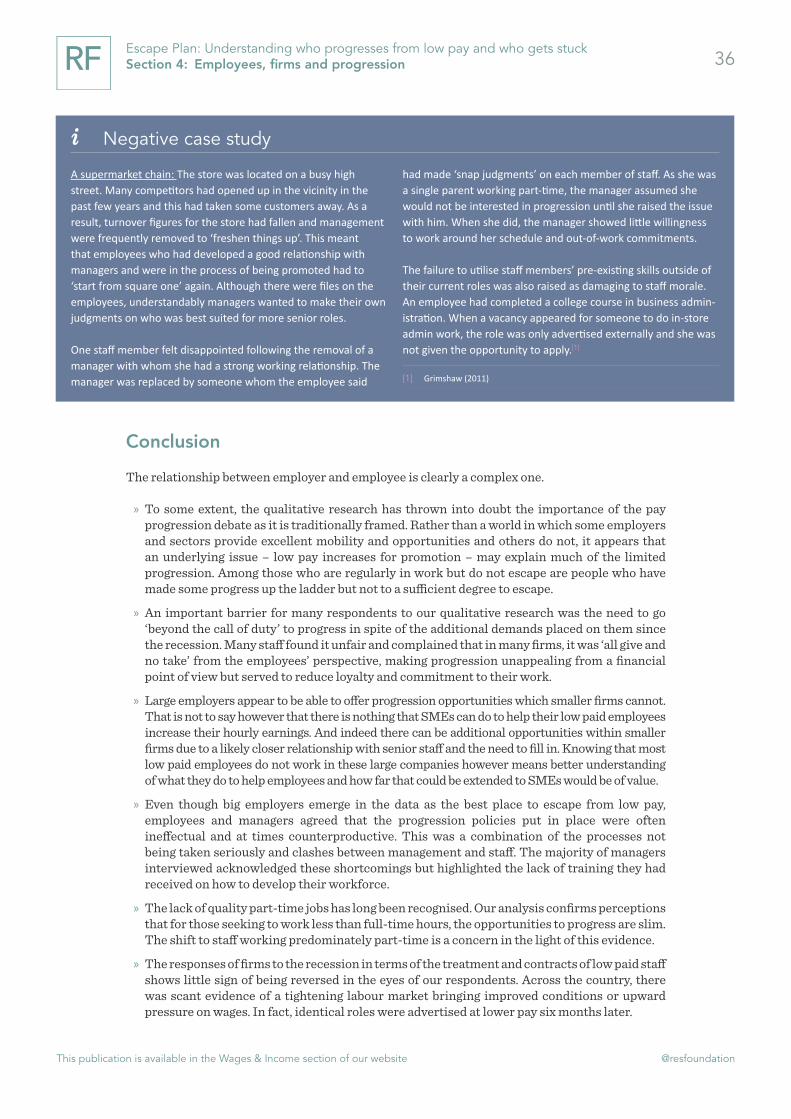
This publication is available in the Wages & Income section of our website @resfoundation
36Escape Plan: Understanding who progresses from low pay and who gets stuck Section 4: Employees, firms and progression
Conclusion
The relationship between employer and employee is clearly a complex one.
» To some extent, the qualitative research has thrown into doubt the importance of the pay progression debate as it is traditionally framed. Rather than a world in which some employers and sectors provide excellent mobility and opportunities and others do not, it appears that an underlying issue – low pay increases for promotion – may explain much of the limited progression. Among those who are regularly in work but do not escape are people who have made some progress up the ladder but not to a sufficient degree to escape.
» An important barrier for many respondents to our qualitative research was the need to go ‘beyond the call of duty’ to progress in spite of the additional demands placed on them since the recession. Many staff found it unfair and complained that in many firms, it was ‘all give and no take’ from the employees’ perspective, making progression unappealing from a financial point of view but served to reduce loyalty and commitment to their work.
» Large employers appear to be able to offer progression opportunities which smaller firms cannot. That is not to say however that there is nothing that SMEs can do to help their low paid employees increase their hourly earnings. And indeed there can be additional opportunities within smaller firms due to a likely closer relationship with senior staff and the need to fill in. Knowing that most low paid employees do not work in these large companies however means better understanding of what they do to help employees and how far that could be extended to SMEs would be of value.
» Even though big employers emerge in the data as the best place to escape from low pay, employees and managers agreed that the progression policies put in place were often ineffectual and at times counterproductive. This was a combination of the processes not being taken seriously and clashes between management and staff. The majority of managers interviewed acknowledged these shortcomings but highlighted the lack of training they had received on how to develop their workforce.
» The lack of quality part-time jobs has long been recognised. Our analysis confirms perceptions that for those seeking to work less than full-time hours, the opportunities to progress are slim. The shift to staff working predominately part-time is a concern in the light of this evidence.
» The responses of firms to the recession in terms of the treatment and contracts of low paid staff shows little sign of being reversed in the eyes of our respondents. Across the country, there was scant evidence of a tightening labour market bringing improved conditions or upward pressure on wages. In fact, identical roles were advertised at lower pay six months later.
i Negative case study
A supermarket chain: The store was located on a busy high street. Many competitors had opened up in the vicinity in the past few years and this had taken some customers away. As a result, turnover figures for the store had fallen and management were frequently removed to ‘freshen things up’. This meant that employees who had developed a good relationship with managers and were in the process of being promoted had to ‘start from square one’ again. Although there were files on the employees, understandably managers wanted to make their own judgments on who was best suited for more senior roles.
One staff member felt disappointed following the removal of a manager with whom she had a strong working relationship. The manager was replaced by someone whom the employee said
had made ‘snap judgments’ on each member of staff. As she was a single parent working part-time, the manager assumed she would not be interested in progression until she raised the issue with him. When she did, the manager showed little willingness to work around her schedule and out-of-work commitments.
The failure to utilise staff members’ pre-existing skills outside of their current roles was also raised as damaging to staff morale. An employee had completed a college course in business admin-istration. When a vacancy appeared for someone to do in-store admin work, the role was only advertised externally and she was not given the opportunity to apply.[1]
[1] Grimshaw (2011)
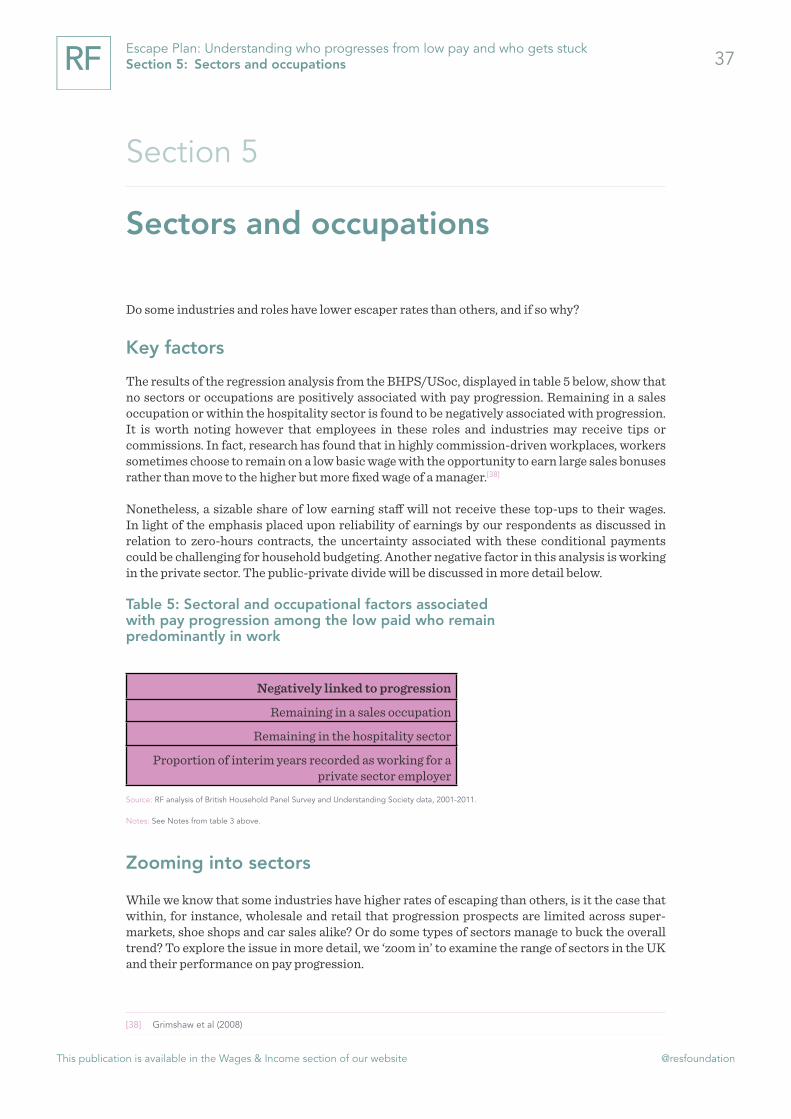
This publication is available in the Wages & Income section of our website @resfoundation
37Escape Plan: Understanding who progresses from low pay and who gets stuck Section 5: Sectors and occupations
Section 5
Sectors and occupations
Do some industries and roles have lower escaper rates than others, and if so why?
Key factors
The results of the regression analysis from the BHPS/USoc, displayed in table 5 below, show that no sectors or occupations are positively associated with pay progression. Remaining in a sales occupation or within the hospitality sector is found to be negatively associated with progression. It is worth noting however that employees in these roles and industries may receive tips or commissions. In fact, research has found that in highly commission-driven workplaces, workers sometimes choose to remain on a low basic wage with the opportunity to earn large sales bonuses rather than move to the higher but more fixed wage of a manager.[38]
Nonetheless, a sizable share of low earning staff will not receive these top-ups to their wages. In light of the emphasis placed upon reliability of earnings by our respondents as discussed in relation to zero-hours contracts, the uncertainty associated with these conditional payments could be challenging for household budgeting. Another negative factor in this analysis is working in the private sector. The public-private divide will be discussed in more detail below.
Table 5: Sectoral and occupational factors associated with pay progression among the low paid who remain predominantly in work
Negatively linked to progression
Remaining in a sales occupation
Remaining in the hospitality sector
Proportion of interim years recorded as working for a private sector employer
Source: RF analysis of British Household Panel Survey and Understanding Society data, 2001-2011.
Notes: See Notes from table 3 above.
Zooming into sectors
While we know that some industries have higher rates of escaping than others, is it the case that within, for instance, wholesale and retail that progression prospects are limited across super-markets, shoe shops and car sales alike? Or do some types of sectors manage to buck the overall trend? To explore the issue in more detail, we ‘zoom in’ to examine the range of sectors in the UK and their performance on pay progression.
[38] Grimshaw et al (2008)
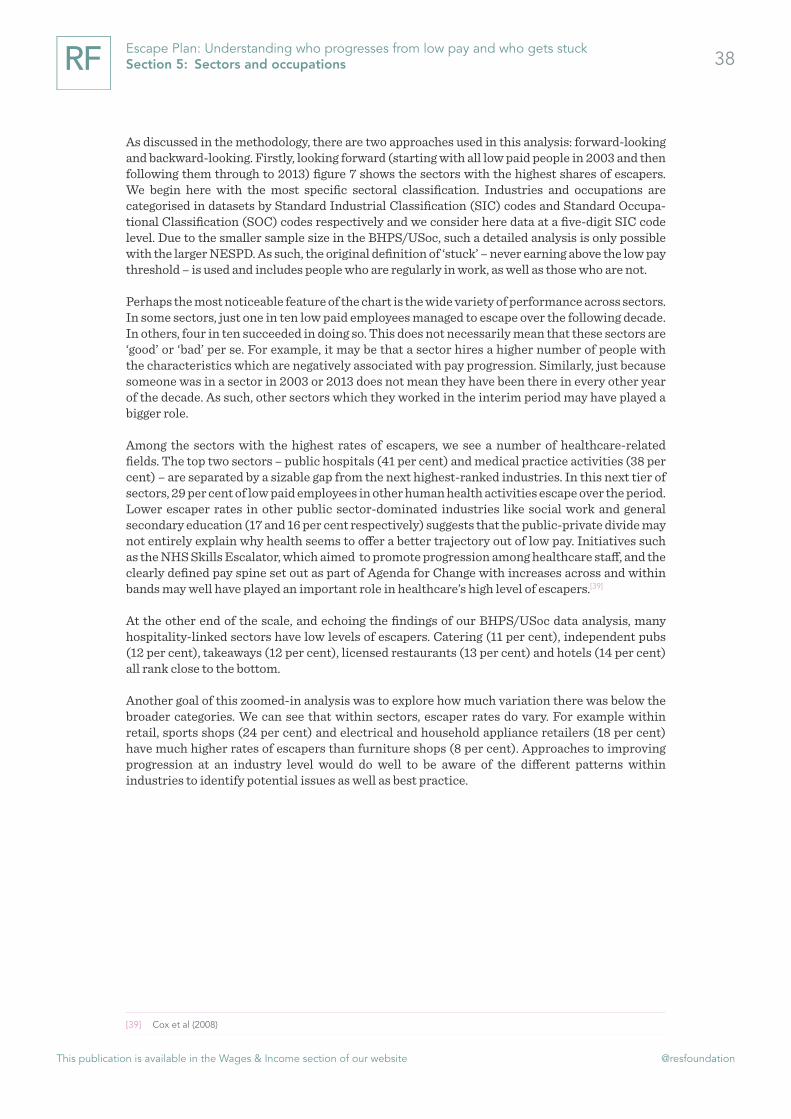
This publication is available in the Wages & Income section of our website @resfoundation
38Escape Plan: Understanding who progresses from low pay and who gets stuck Section 5: Sectors and occupations
As discussed in the methodology, there are two approaches used in this analysis: forward-looking and backward-looking. Firstly, looking forward (starting with all low paid people in 2003 and then following them through to 2013) figure 7 shows the sectors with the highest shares of escapers. We begin here with the most specific sectoral classification. Industries and occupations are categorised in datasets by Standard Industrial Classification (SIC) codes and Standard Occupa-tional Classification (SOC) codes respectively and we consider here data at a five-digit SIC code level. Due to the smaller sample size in the BHPS/USoc, such a detailed analysis is only possible with the larger NESPD. As such, the original definition of ‘stuck’ – never earning above the low pay threshold – is used and includes people who are regularly in work, as well as those who are not.
Perhaps the most noticeable feature of the chart is the wide variety of performance across sectors. In some sectors, just one in ten low paid employees managed to escape over the following decade. In others, four in ten succeeded in doing so. This does not necessarily mean that these sectors are ‘good’ or ‘bad’ per se. For example, it may be that a sector hires a higher number of people with the characteristics which are negatively associated with pay progression. Similarly, just because someone was in a sector in 2003 or 2013 does not mean they have been there in every other year of the decade. As such, other sectors which they worked in the interim period may have played a bigger role.
Among the sectors with the highest rates of escapers, we see a number of healthcare-related fields. The top two sectors – public hospitals (41 per cent) and medical practice activities (38 per cent) – are separated by a sizable gap from the next highest-ranked industries. In this next tier of sectors, 29 per cent of low paid employees in other human health activities escape over the period. Lower escaper rates in other public sector-dominated industries like social work and general secondary education (17 and 16 per cent respectively) suggests that the public-private divide may not entirely explain why health seems to offer a better trajectory out of low pay. Initiatives such as the NHS Skills Escalator, which aimed to promote progression among healthcare staff, and the clearly defined pay spine set out as part of Agenda for Change with increases across and within bands may well have played an important role in healthcare’s high level of escapers.[39]
At the other end of the scale, and echoing the findings of our BHPS/USoc data analysis, many hospitality-linked sectors have low levels of escapers. Catering (11 per cent), independent pubs (12 per cent), takeaways (12 per cent), licensed restaurants (13 per cent) and hotels (14 per cent) all rank close to the bottom.
Another goal of this zoomed-in analysis was to explore how much variation there was below the broader categories. We can see that within sectors, escaper rates do vary. For example within retail, sports shops (24 per cent) and electrical and household appliance retailers (18 per cent) have much higher rates of escapers than furniture shops (8 per cent). Approaches to improving progression at an industry level would do well to be aware of the different patterns within industries to identify potential issues as well as best practice.
[39] Cox et al (2008)
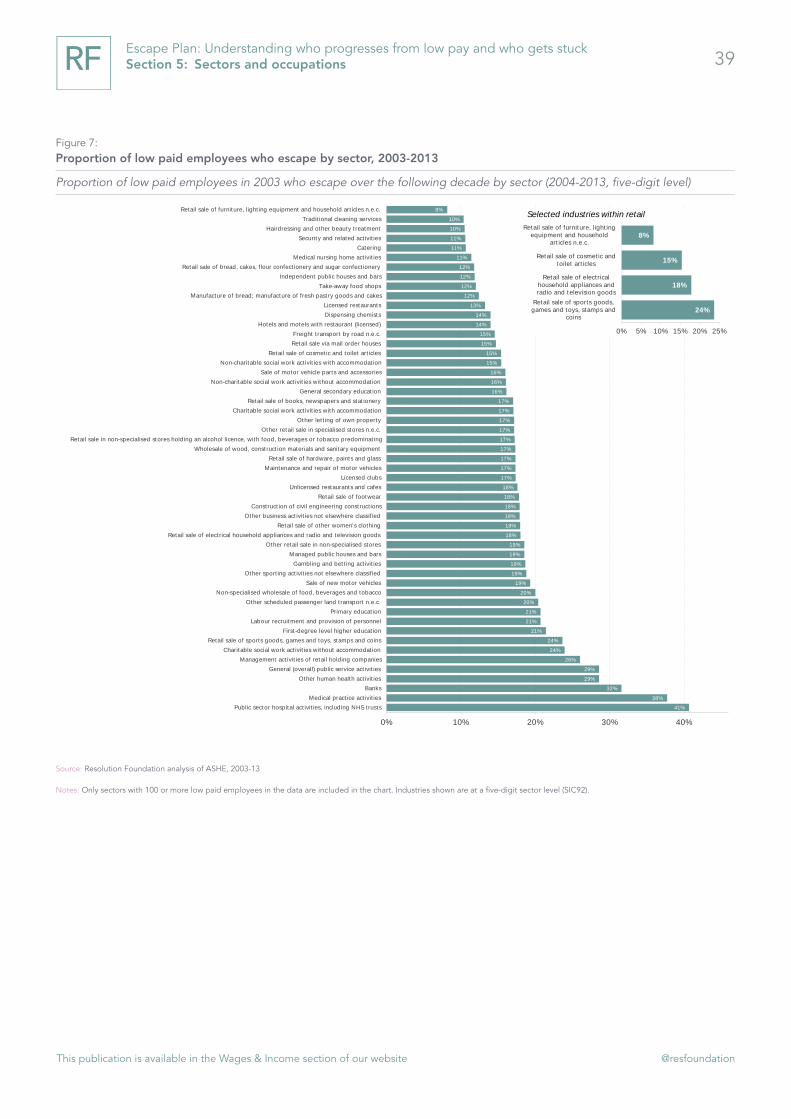
This publication is available in the Wages & Income section of our website @resfoundation
39Escape Plan: Understanding who progresses from low pay and who gets stuck Section 5: Sectors and occupations
Figure 7: Proportion of low paid employees who escape by sector, 2003-2013
Proportion of low paid employees in 2003 who escape over the following decade by sector (2004-2013, five-digit level)
Source: Resolution Foundation analysis of ASHE, 2003-13
Notes: Only sectors with 100 or more low paid employees in the data are included in the chart. Industries shown are at a five-digit sector level (SIC92).
41%
38%
32%
29%
29%
26%
24%
24%
21%
21%
21%
20%
20%
19%
19%
19%
19%
19%
18%
18%
18%
18%
18%
18%
17%
17%
17%
17%
17%
17%
17%
17%
17%
16%
16%
16%
15%
15%
15%
15%
14%
14%
13%
12%
12%
12%
12%
11%
11%
11%
10%
10%
8%
0% 10% 20% 30% 40%
Public sector hospital activities, including NHS trusts
Medical practice activities
Banks
Other human health activities
General (overall) public service activities
Management activities of retail holding companies
Charitable social work activities without accommodation
Retail sale of sports goods, games and toys, stamps and coins
First-degree level higher education
Labour recruitment and provision of personnel
Primary education
Other scheduled passenger land transport n.e.c.
Non-specialised wholesale of food, beverages and tobacco
Sale of new motor vehicles
Other sporting activities not elsewhere classified
Gambling and betting activities
Managed public houses and bars
Other retail sale in non-specialised stores
Retail sale of electrical household appliances and radio and television goods
Retail sale of other women's clothing
Other business activities not elsewhere classified
Construction of civil engineering constructions
Retail sale of footwear
Unlicensed restaurants and cafes
Licensed clubs
Maintenance and repair of motor vehicles
Retail sale of hardware, paints and glass
Wholesale of wood, construction materials and sanitary equipment
Retail sale in non-specialised stores holding an alcohol licence, with food, beverages or tobacco predominating
Other retail sale in specialised stores n.e.c.
Other letting of own property
Charitable social work activities with accommodation
Retail sale of books, newspapers and stationery
General secondary education
Non-charitable social work activities without accommodation
Sale of motor vehicle parts and accessories
Non-charitable social work activities with accommodation
Retail sale of cosmetic and toilet articles
Retail sale via mail order houses
Freight transport by road n.e.c.
Hotels and motels with restaurant (licensed)
Dispensing chemists
Licensed restaurants
Manufacture of bread; manufacture of fresh pastry goods and cakes
Take-away food shops
Independent public houses and bars
Retail sale of bread, cakes, flour confectionery and sugar confectionery
Medical nursing home activities
Catering
Security and related activities
Hairdressing and other beauty treatment
Traditional cleaning services
Retail sale of furniture, lighting equipment and household articles n.e.c.
15%
24%
18%
15%
8%
0% 5% 10% 15% 20% 25%
Retail sale of sports goods,games and toys, stamps and
coins
Retail sale of electricalhousehold appliances andradio and television goods
Retail sale of cosmetic andtoilet articles
Retail sale of furniture, lightingequipment and household
articles n.e.c.
Selected industries within retail
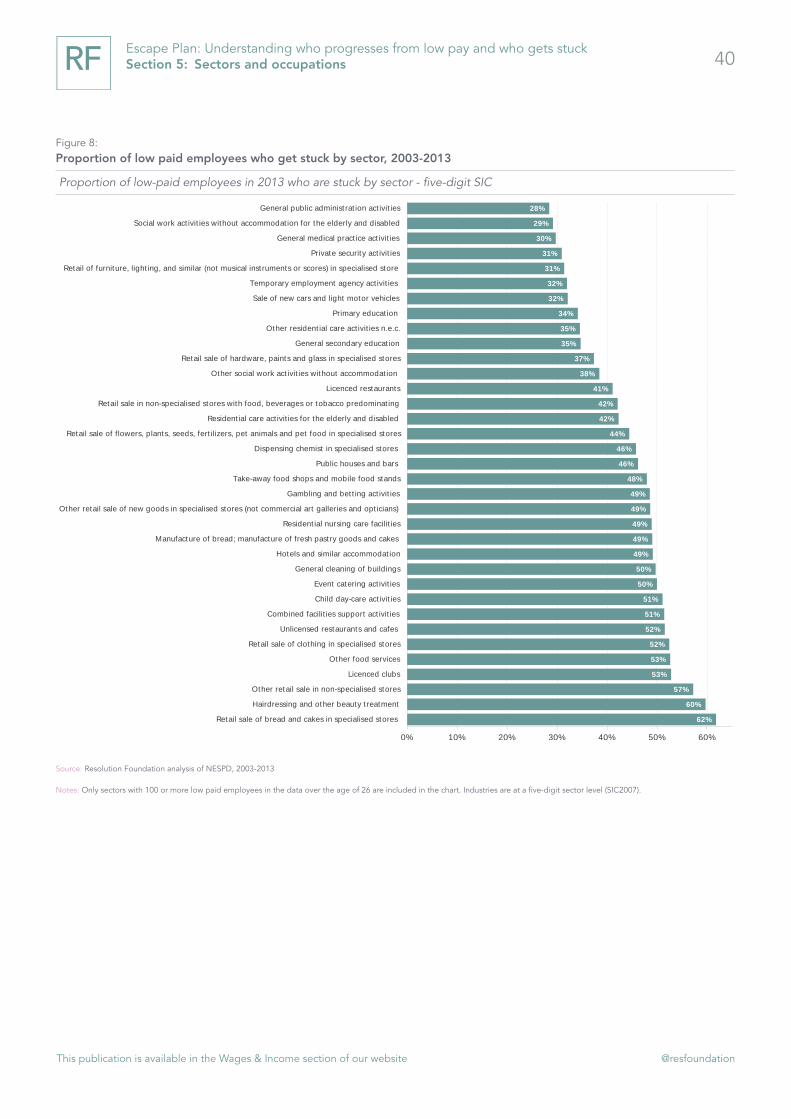
This publication is available in the Wages & Income section of our website @resfoundation
40Escape Plan: Understanding who progresses from low pay and who gets stuck Section 5: Sectors and occupations
Figure 8: Proportion of low paid employees who get stuck by sector, 2003-2013
Proportion of low-paid employees in 2013 who are stuck by sector - five-digit SIC
Source: Resolution Foundation analysis of NESPD, 2003-2013
Notes: Only sectors with 100 or more low paid employees in the data over the age of 26 are included in the chart. Industries are at a five-digit sector level (SIC2007).
62%
60%
57%
53%
53%
52%
52%
51%
51%
50%
50%
49%
49%
49%
49%
49%
48%
46%
46%
44%
42%
42%
41%
38%
37%
35%
35%
34%
32%
32%
31%
31%
30%
29%
28%
0% 10% 20% 30% 40% 50% 60%
Retail sale of bread and cakes in specialised stores
Hairdressing and other beauty treatment
Other retail sale in non-specialised stores
Licenced clubs
Other food services
Retail sale of clothing in specialised stores
Unlicensed restaurants and cafes
Combined facilities support activities
Child day-care activities
Event catering activities
General cleaning of buildings
Hotels and similar accommodation
Manufacture of bread; manufacture of fresh pastry goods and cakes
Residential nursing care facilities
Other retail sale of new goods in specialised stores (not commercial art galleries and opticians)
Gambling and betting activities
Take-away food shops and mobile food stands
Public houses and bars
Dispensing chemist in specialised stores
Retail sale of flowers, plants, seeds, fertilizers, pet animals and pet food in specialised stores
Residential care activities for the elderly and disabled
Retail sale in non-specialised stores with food, beverages or tobacco predominating
Licenced restaurants
Other social work activities without accommodation
Retail sale of hardware, paints and glass in specialised stores
General secondary education
Other residential care activities n.e.c.
Primary education
Sale of new cars and light motor vehicles
Temporary employment agency activities
Retail of furniture, lighting, and similar (not musical instruments or scores) in specialised store
Private security activities
General medical practice activities
Social work activities without accommodation for the elderly and disabled
General public administration activities
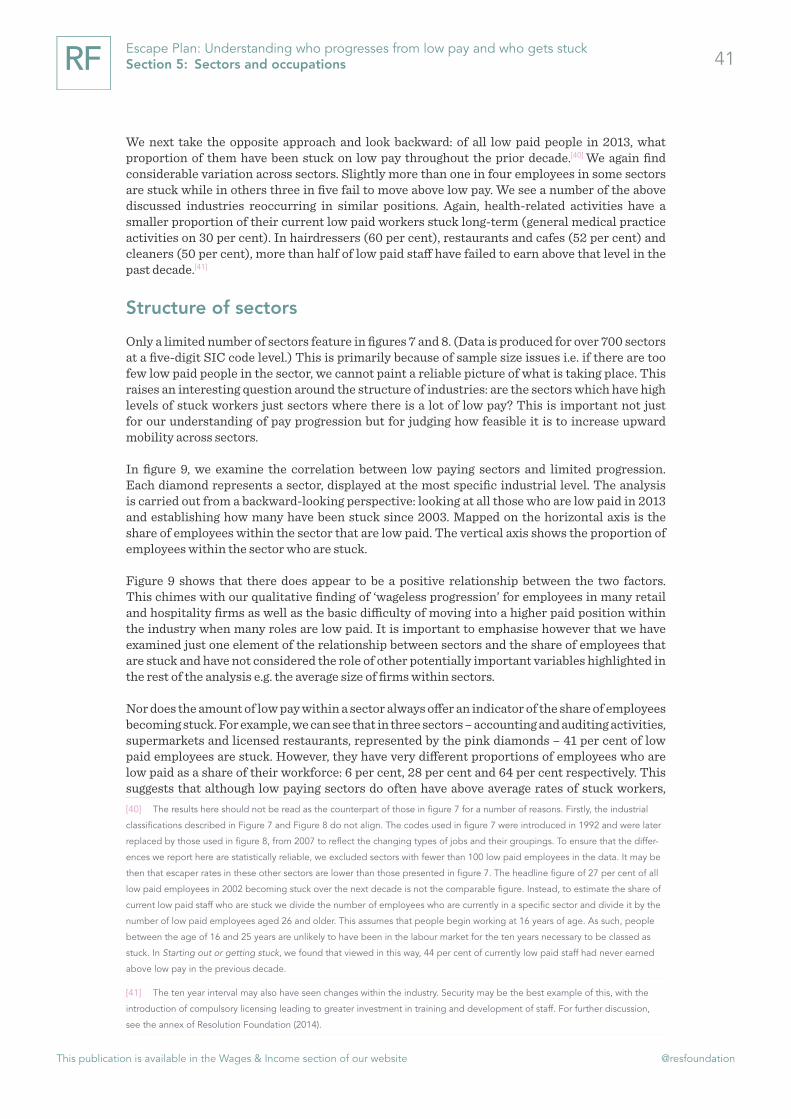
This publication is available in the Wages & Income section of our website @resfoundation
41Escape Plan: Understanding who progresses from low pay and who gets stuck Section 5: Sectors and occupations
We next take the opposite approach and look backward: of all low paid people in 2013, what proportion of them have been stuck on low pay throughout the prior decade.[40] We again find considerable variation across sectors. Slightly more than one in four employees in some sectors are stuck while in others three in five fail to move above low pay. We see a number of the above discussed industries reoccurring in similar positions. Again, health-related activities have a smaller proportion of their current low paid workers stuck long-term (general medical practice activities on 30 per cent). In hairdressers (60 per cent), restaurants and cafes (52 per cent) and cleaners (50 per cent), more than half of low paid staff have failed to earn above that level in the past decade.[41]
Structure of sectors
Only a limited number of sectors feature in figures 7 and 8. (Data is produced for over 700 sectors at a five-digit SIC code level.) This is primarily because of sample size issues i.e. if there are too few low paid people in the sector, we cannot paint a reliable picture of what is taking place. This raises an interesting question around the structure of industries: are the sectors which have high levels of stuck workers just sectors where there is a lot of low pay? This is important not just for our understanding of pay progression but for judging how feasible it is to increase upward mobility across sectors.
In figure 9, we examine the correlation between low paying sectors and limited progression. Each diamond represents a sector, displayed at the most specific industrial level. The analysis is carried out from a backward-looking perspective: looking at all those who are low paid in 2013 and establishing how many have been stuck since 2003. Mapped on the horizontal axis is the share of employees within the sector that are low paid. The vertical axis shows the proportion of employees within the sector who are stuck.
Figure 9 shows that there does appear to be a positive relationship between the two factors. This chimes with our qualitative finding of ‘wageless progression’ for employees in many retail and hospitality firms as well as the basic difficulty of moving into a higher paid position within the industry when many roles are low paid. It is important to emphasise however that we have examined just one element of the relationship between sectors and the share of employees that are stuck and have not considered the role of other potentially important variables highlighted in the rest of the analysis e.g. the average size of firms within sectors.
Nor does the amount of low pay within a sector always offer an indicator of the share of employees becoming stuck. For example, we can see that in three sectors – accounting and auditing activities, supermarkets and licensed restaurants, represented by the pink diamonds – 41 per cent of low paid employees are stuck. However, they have very different proportions of employees who are low paid as a share of their workforce: 6 per cent, 28 per cent and 64 per cent respectively. This suggests that although low paying sectors do often have above average rates of stuck workers, [40] The results here should not be read as the counterpart of those in figure 7 for a number of reasons. Firstly, the industrial
classifications described in Figure 7 and Figure 8 do not align. The codes used in figure 7 were introduced in 1992 and were later
replaced by those used in figure 8, from 2007 to reflect the changing types of jobs and their groupings. To ensure that the differ-
ences we report here are statistically reliable, we excluded sectors with fewer than 100 low paid employees in the data. It may be
then that escaper rates in these other sectors are lower than those presented in figure 7. The headline figure of 27 per cent of all
low paid employees in 2002 becoming stuck over the next decade is not the comparable figure. Instead, to estimate the share of
current low paid staff who are stuck we divide the number of employees who are currently in a specific sector and divide it by the
number of low paid employees aged 26 and older. This assumes that people begin working at 16 years of age. As such, people
between the age of 16 and 25 years are unlikely to have been in the labour market for the ten years necessary to be classed as
stuck. In Starting out or getting stuck, we found that viewed in this way, 44 per cent of currently low paid staff had never earned
above low pay in the previous decade.
[41] The ten year interval may also have seen changes within the industry. Security may be the best example of this, with the
introduction of compulsory licensing leading to greater investment in training and development of staff. For further discussion,
see the annex of Resolution Foundation (2014).
This publication is available in the Wages & Income section of our website @resfoundation
42Escape Plan: Understanding who progresses from low pay and who gets stuck Section 5: Sectors and occupations
having a high proportion of low paid employees alone does not explain why workers in some sectors are more likely to get stuck than in others.
Returning to the concept of career ladders and the hourglass economy, the bubble chart in figure 10 demonstrates an illustrative way of thinking about pay progression across industries and occupations. Each bubble represents an occupation within one of four chosen sectors, moving from occupations with the lowest median pay on the left to those with higher median pay on the right with the ten lowest paying occupations displayed for each.[42] The area of the bubble indicates the number of employees working in that occupation.[43] Hypothetically, a sector which had evenly sized bubbles with steady vertical increases between the bubbles would be beneficial for progression as there would be (i) higher paid positions to move up into with (ii) appreciable but not unrealistic increases in median wages between occupations.
[42] Occupations with a weighted count of fewer than 12,000 employees or median wages above £13 were excluded from this
analysis to focus attention on occupations which are of greater importance by virtue of their size and that were not so high paid
that making the move to there from low paid roles was not unlikely.
[43] It is important to note that this is at a one-digit SIC level i.e. less specific than the five-digit sectors discussed above.
Figure 9: Relationship between proportion of low pay within the sector and proportion of low paid employees who are stuck in sector
This is the line that explains the chart below
Source: Resolution Foundation analysis of ASHE, 2003-201.
Notes: Only sectors (5 digit level SIC2007) with 30 or more low paid employees in the data over the age of 26 are included in the chart. R-squared = 0.3388. The view is backward-looking, i.e. takes all the low paid people in 2013 and assess how many of them have been stuck for ten years.
0%
10%
20%
30%
40%
50%
60%
70%
80%
0% 10% 20% 30% 40% 50% 60% 70% 80%
Pro
po
rtio
n o
f em
plo
yees
that
are
stu
ck
Proportion of employees that are low paid
This publication is available in the Wages & Income section of our website @resfoundation
43Escape Plan: Understanding who progresses from low pay and who gets stuck Section 5: Sectors and occupations
If on the other hand the lowest paying bubbles are the largest with much smaller bubbles in the middle – as per the hourglass concept – or there are large vertical ‘jumps’ between bubbles – suggesting the middle rungs are being removed – opportunities to progress into higher paying roles may be difficult to come by. To what extent this paints an accurate picture of progression up will vary depending on sectors and roles. For instance, the number of people who progress from the third lowest bubble in manufacturing – sales occupations – to the next highest – textiles, printing and other skilled trades – may be small. Nonetheless, it acts as an indicative guide to how pay is dispersed across occupations within sectors.
Beginning with manufacturing, median pay in even the lowest paying occupation (the furthest left bubble) is above the low pay threshold. Although many of the employees within that occupation will be low paid, there appears to be reasonable scope to earn more within the same general role. Perhaps more importantly, the bubbles are not much smaller as the median wage goes higher. This suggests there may be an availability of positions to move into if a person seeks to change occupation. The largest occupation within manufacturing – process, plant and machine operatives – has a median wage of £9.40. The steadily rising median wage levels between occupations with meaningful but relatively small vertical wage ‘jumps’ between the bubbles seem ideal to encourage pay progression and reflect the generally low levels of employees becoming stuck on low pay in manufacturing.
Health presents a similar case with a reasonably small number of jobs with low median pay. The largest bubble within health covers nurses. Median pay here is £8.11, indicating a considerable minority of those within this occupation may be low paid. But given median pay is above the low pay threshold, the scope to move onto higher earnings appears to be present. As discussed above, the progression policies put in place by the NHS may account for part of this. Unlike manufac-turing there appear to be fewer roles to progress into with larger jumps between bubbles. This most likely represents the diversity of workers and earnings within health.
Moving onto what would be regarded as a more problematic sector, progression prospects within wholesale and retail seem less promising. A very large share of the jobs within retail are in the lowest paid occupation – sales. As we discussed above, sales roles are negatively associated with escaping from low pay. Figure 10 may give us another insight into why this is. The median pay within the occupation is £6.90 meaning over half the employees in these roles are low paid. The shallowness of the curve across the bubbles reflects the findings of the qualitative research, in which moving from sales assistant to supervisor or assistant manager did not result in sizable pay increases.
Finally we come to the most challenging sector – accommodation and food services. The lowest paying occupation is elementary administration and service occupations. With a median hourly wage of just £6.20, a high percentage of staff within these roles will be paid at, just above or just below the National Minimum Wage. In occupations with higher median wages, the bubbles are small, indicating the limited availability of better rewarded positions to move into. It is only further up the scale at the bubble representing skilled trades – including bar and catering managers but also chefs – that median pay moves above the low pay threshold. Beyond that, there are large jumps in median pay to small bubbles, the furthest right of which represents corporate managers or directors, likely to include owners of small hotels, restaurants and pubs.[44]
[44] This occupation has the largest gap between the earnings of those at the median (£11.58) and those at the 90th percentile (£30.24).
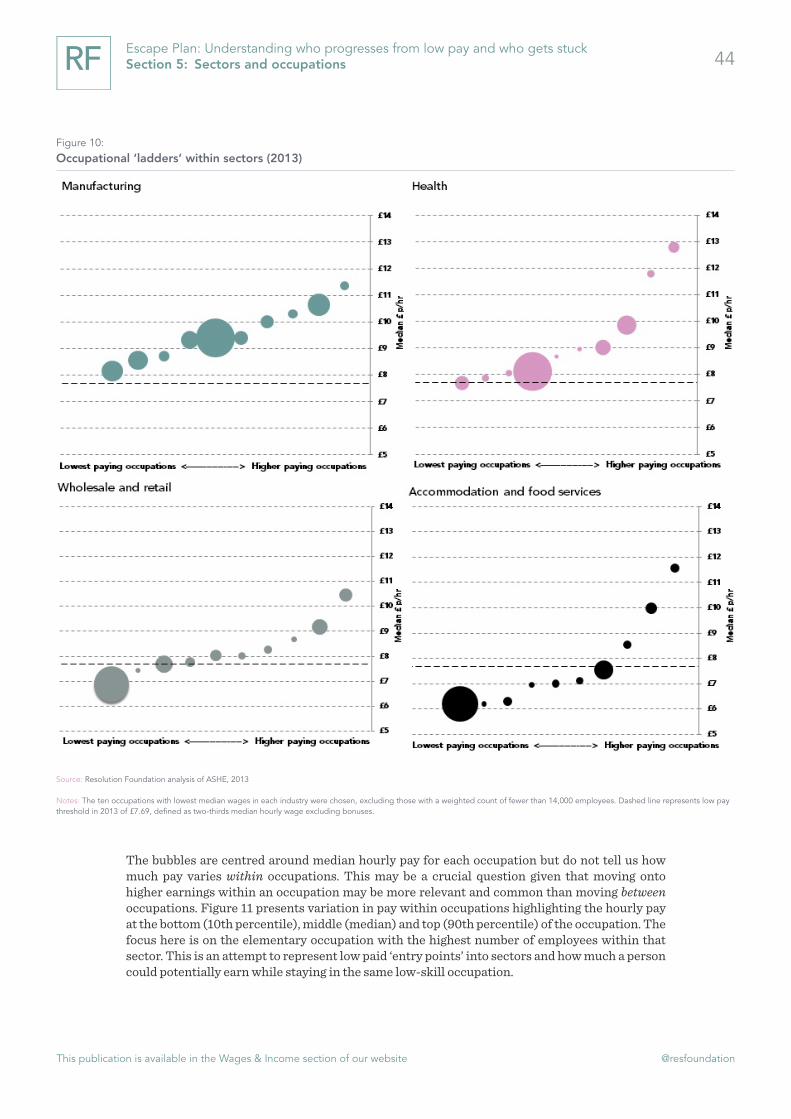
This publication is available in the Wages & Income section of our website @resfoundation
44Escape Plan: Understanding who progresses from low pay and who gets stuck Section 5: Sectors and occupations
The bubbles are centred around median hourly pay for each occupation but do not tell us how much pay varies within occupations. This may be a crucial question given that moving onto higher earnings within an occupation may be more relevant and common than moving between occupations. Figure 11 presents variation in pay within occupations highlighting the hourly pay at the bottom (10th percentile), middle (median) and top (90th percentile) of the occupation. The focus here is on the elementary occupation with the highest number of employees within that sector. This is an attempt to represent low paid ‘entry points’ into sectors and how much a person could potentially earn while staying in the same low-skill occupation.
Figure 10: Occupational ‘ladders’ within sectors (2013)
This is the line that explains the chart below
Source: Resolution Foundation analysis of ASHE, 2013
Notes: The ten occupations with lowest median wages in each industry were chosen, excluding those with a weighted count of fewer than 14,000 employees. Dashed line represents low pay threshold in 2013 of £7.69, defined as two-thirds median hourly wage excluding bonuses.
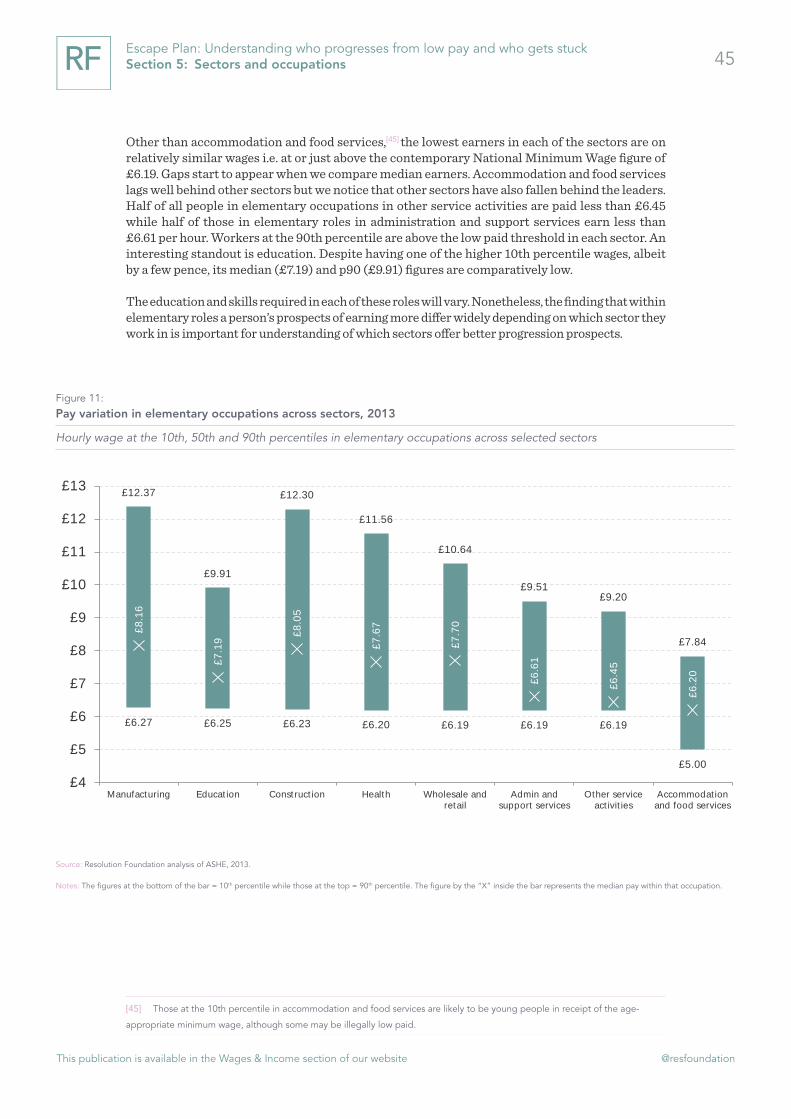
This publication is available in the Wages & Income section of our website @resfoundation
45Escape Plan: Understanding who progresses from low pay and who gets stuck Section 5: Sectors and occupations
Other than accommodation and food services,[45] the lowest earners in each of the sectors are on relatively similar wages i.e. at or just above the contemporary National Minimum Wage figure of £6.19. Gaps start to appear when we compare median earners. Accommodation and food services lags well behind other sectors but we notice that other sectors have also fallen behind the leaders. Half of all people in elementary occupations in other service activities are paid less than £6.45 while half of those in elementary roles in administration and support services earn less than £6.61 per hour. Workers at the 90th percentile are above the low paid threshold in each sector. An interesting standout is education. Despite having one of the higher 10th percentile wages, albeit by a few pence, its median (£7.19) and p90 (£9.91) figures are comparatively low.
The education and skills required in each of these roles will vary. Nonetheless, the finding that within elementary roles a person’s prospects of earning more differ widely depending on which sector they work in is important for understanding of which sectors offer better progression prospects.
[45] Those at the 10th percentile in accommodation and food services are likely to be young people in receipt of the age-
appropriate minimum wage, although some may be illegally low paid.
Figure 11: Pay variation in elementary occupations across sectors, 2013
Hourly wage at the 10th, 50th and 90th percentiles in elementary occupations across selected sectors
Source: Resolution Foundation analysis of ASHE, 2013.
Notes: The figures at the bottom of the bar = 10th percentile while those at the top = 90th percentile. The figure by the “X” inside the bar represents the median pay within that occupation.
£12.37
£9.91
£12.30
£11.56
£10.64
£9.51 £9.20
£7.84
£6.27 £6.25 £6.23 £6.20 £6.19 £6.19 £6.19
£5.00
£8.1
6
£7.1
9 £
8.0
5
£7.6
7
£7.7
0
£6.6
1
£6.4
5
£6.2
0
£4
£5
£6
£7
£8
£9
£10
£11
£12
£13
Manufacturing Education Construction Health Wholesale andretail
Admin andsupport services
Other serviceactivities
Accommodationand food services
This publication is available in the Wages & Income section of our website @resfoundation
46Escape Plan: Understanding who progresses from low pay and who gets stuck Section 5: Sectors and occupations
In terms of variation within sectors, the respondents in the interviews and focus groups for the most part did not see the sector they were in as the primary dividing line for progression oppor-tunities. It was only in clothing retail that staff who had worked there felt the demands placed upon them if they wanted to progress were excessive. Elsewhere, the factors raised in the other chapters of this report were more influential. When it came to occupations, there was agreement that some roles offered better chances to escape. One respondent who worked in a hotel felt that housekeeping staff were less likely to move up because they only had the chance to do one role whereas reception, kitchen and waiting staff were more likely to be given the opportunity to learn new positions.
Conclusion
While our analysis of the BHPS/USoc makes clear that most sectors and occupations are not the crucial influence on whether or not a person progresses, this chapter has discussed how the structures of pay and roles within industries may contribute to our understanding of why some workers find it easier than others to move up.
» It is clear that there is huge diversity across and within sectors in terms of the share of employees who escape or get stuck. While this report has not set any recommended level of progression that each sector should aspire to, it appears as if certain sectors could do more.
» Hospitality emerges as one potential problem sector. Examples of good practice do, however, exist within the sector. People 1st, the sector skills council for hospitality, has developed a career map which shows the opportunities for progression, the average salary and the skills or qualifications required to move up. Initiatives such as this could help in making progression routes more visible and better understood.
» In many sectors, it may be that higher shares of low paid employees contribute to fewer employees escaping. For that reason, setting progression up as a separate concern to that of the UK’s broader low pay problem may be misguided.
This publication is available in the Wages & Income section of our website @resfoundation
47Escape Plan: Understanding who progresses from low pay and who gets stuck Section 6: Conclusion
Section 6
Conclusion
For the majority of low paid workers, their jobs do not appear to be a first rung on a ladder to meaningfully higher earnings. This new analysis replicates our previous finding that three in four people fail to escape from low pay but has also added a number of important additional insights.
Our data analysis concludes that staying in employment is the most important factor in order to progress. Despite this, the largest group among those who do not progress are regularly in work. Although they will be far from homogeneous – some in work every single year of the decade with others only for six – it may be that the barriers facing this group and the support they require are different to those who have more difficulty finding steady employment.[46] Pilots run by DWP, UKCES and the Greater London Authority exploring the development of progression should all help to deepen our understanding of how best to assist working non-escapers.
The proportion of employees who escape varies widely across sectors. While our regression analysis shows that working in hospitality is negatively linked to escaping low pay, it is clear that within industries, sub-sectors are performing very differently. While to some extent this may be the result of other important factors such as the share of large firms within the sector, it is interesting that sectors with similar profiles in terms of predominant business models and levels of low pay produce such a gulf in results. Previous Resolution Foundation research has recommended that the Low Pay Commission investigate blockages to higher pay within sectors and it may well be that progression could form an important consideration within that work.[47] Examples such as the taskforce on the cleaning industry and its practices established by the Equality and Human Rights Commission could point the way towards improved pay progression within sectors.[48]
Part of the reason that many of these people who are usually in employment do not progress may be to do with the limited appeal of moving into positions of greater responsibility. The limited pay increases received for moving from an entry-level position to a supervisory role were often as little as 30p or 40p extra an hour. When weighed against the additional stress which comes with the role and the hassle of rearranging their work-life balance, for many people progression may not appeal. Pay progression is sometimes framed as its own issue, separate from wider concerns around low pay. The evidence of this report suggests however that we cannot understand the barriers and enablers of progression without placing it within the context of the UK’s chronic low pay problem.
While three-quarters of people regularly in work do not escape from low pay over a ten-year period, some groups appear to be particularly disadvantaged. Those working part-time, single parents, older workers and people with disabilities seem to find escaping from low pay especially difficult. Employers and government should consider how current support and funding could be better targeted at these groups to understand the obstacles preventing them from progressing and to assist them in their careers.
[46] For more discussion of how the needs of those who are regularly in work but unable to escape differ see http://www.
trustforlondon.org.uk/wp-content/uploads/2014/10/Trust-for-London-%C2%AD-Open-Space-what-can-we-do-to-suport-people-
to-mvoe-out-of-low-paid-work.pdf
[47] Resolution Foundation (2014)
[48] http://www.equalityhumanrights.com/about-us/our-work/key-projects/invisible-workforce-employment-practices-cleaning-
sector
This publication is available in the Wages & Income section of our website @resfoundation
48Escape Plan: Understanding who progresses from low pay and who gets stuck Section 6: Conclusion
That said, it was clear from the interviews and focus groups with low paid staff and their managers that many employers – particularly larger ones – do make an effort when it comes to progression. Progression policies are in place and a handful of examples of positive approaches are outlined in the body of the report. But the discussions did highlight how important it is to ensure that the policies are working effectively, particularly for staff members who may not be able to commit to the complete flexibility which some employers appear to require in order to progress. It is clear that many employers have already put much time and money into the training and development of low paid staff. The finding that the impact of training on pay progression is limited underlines the need for employers to ensure their policies are effective.
While employers are most directly involved in pay progression, government also has an important role to play. One area in which the two intersect will be the in-work conditionality element of Universal Credit, which if managed well could be a useful mechanism through which pay progression could be furthered. Previous Resolution Foundation work has set out how the National Minimum Wage could do more to boost the wages of the UK’s lowest paid workers. But moving to a higher wage-floor without considering how we boost opportunities for pay progression would be short-sighted. A broader low pay strategy which faces up to problems in the main low paying sectors is badly needed to tackle a problem which has dogged the UK for decades. The Resolution Foundation will publish a low pay manifesto in early 2015 setting out a variety of policies aimed at those on low pay.
This publication is available in the Wages & Income section of our website @resfoundation
Escape Plan: Understanding who progresses from low pay and who gets stuck References
49
References
Ashby, J. & Schoon, I. (2010) The role of aspirations, ambition and gender in predicting adult social status and earnings. Journal of Vocational Behavior, 77, issue 3, pp. 350 – 360 http://eprints.ioe.ac.uk/12189/1/Ashby_Schoon_2010_ambition.pdf
Brown, D., Dickens, R., Gregg, P., Machin, S. and Manning, A. (2001) Everything under a fiver: Recruitment and retention in lower paying labour markets, York: JRF http://www.jrf.org.uk/sites/files/jrf/1859354033.pdf
Cardiff-Hicks, B., Lafontaine, F., and Shaw, K. (2014) Do Large Modern Retailers Pay Premium Wages? (Working Paper No. 20313) http://www.nber.org/papers/w20313
CBI (2014) A better off Britain: Improving lives by making growth work for everyone, London: CBI http://news.cbi.org.uk/reports/better-off-britain/a-better-off-britain/
Corlett, A. and Whittaker, M. (2014) Low Pay Britain 2014, London: Resolution Foundation http://www.resolutionfoundation.org/wp-content/uploads/2014/10/Low-Pay-Britain-2014.pdf
Cox, A., Grimshaw, D., Carroll, M. and McBride, A. (2008) Reshaping internal labour markets in the National Health Service: new prospects for pay and training for lower skilled service workers? Human Resource Management Journal. 18(4):347-365
Devins, D., Bickerstaffe, T., Mitchell, B. and Halliday, S. (2014) Improving progression in low-paid, low-skilled retail, catering and care jobs, York: JRF http://www.jrf.org.uk/sites/files/jrf/employment-progression-skills-full.pdf
Devins, D., Stewart, J., Iles, P. (2010) From Shop Floor to Top Floor - An exploratory study of sustainable progression in the Retail Sector: the case of Morrisons. Wm Morrison Supermarkets. http://repository-intralibrary.leedsmet.ac.uk/open_virtual_file_path/i391n41111t/Morrisons_Social_Mobility_Report.pdf
Gingerbread (2012) The only way is up? The employment aspirations of single parents, London: Gingerbread http://www.gingerbread.org.uk/content/667/Policy-work---employment
Grimshaw, D., Beynon, H., Rubery, J. and Ward, K. (2002) The restructuring of career paths in large service sector organizations: ‘delayering’, upskilling and polarisation http://www.cardiff.ac.uk/socsi/resources/theRestructuringofCareerPaths.pdf
Grimshaw, D., Lloyd, C. and Warhurst, C. (2008) Low-Wage Work in the United Kingdom: Employment Practices, Institutional Effects and Policy Responses in Lloyd, C., Mason, G. and Mayhew, K. Low-Wage Work in the United Kingdom, London: Russell Sage
Grimshaw, D. (2011) What do we know about low-wage work and low-wage workers? Analysing the definitions, patterns, causes and consequences in international perspective, Geneva: ILO https://research.mbs.ac.uk/European-employment/Portals/0/docs/gendersocial/ILO%20Paper%202011%20-%20CWES28.pdf
This publication is available in the Wages & Income section of our website @resfoundation
Escape Plan: Understanding who progresses from low pay and who gets stuck References
50
Hendra, R., Riccio, J.A., Dorsett, R., Greenberg, D.H., Knight, G., Phillips, J., Robins, P.K., Vegeris, S., Walter, J., Hill, A., Ray, K., and Smith, J (2011) Breaking the low-pay, no-pay cycle: Final evidence from the UK Employment Retention and Advancement (ERA) demonstration. London: DWP https://www.gov.uk/government/uploads/system/uploads/attachment_data/file/214546/rrep765.pdf
Hills, J. (2007) Ends and means: The future roles of social housing in England, London: Centre for Analysis of Social Exclusion http://eprints.lse.ac.uk/5568/1/Ends_and_Means_The_future_roles_of_social_housing_in_England_1.pdf
Hurrell, A. (2013) Starting out or getting stuck? An analysis of who gets trapped in low paid work - and who escapes, London: Resolution Foundation http://www.resolutionfoundation.org/wp-content/uploads/2014/08/Starting-out-or-getting-stuck-FINAL.pdf
Kumar, A., Rotik, M. and Ussher, K. (2014) Pay progression Understanding the barriers for the lowest paid http://www.cipd.co.uk/binaries/pay-progression_2014-understanding-the-barriers-for-the-lowest-paid.pdf London: CIPD/John Lewis
Lallemand, T. and Rycx, F. (2005) Establishment Size and the Dispersion of Wages: Evidence from European Countries (Discussion Paper No. 1778), Bonn: IZA http://www.econstor.eu/bitstream/10419/33476/1/506431843.pdf
MacInnes, T., Tinson, A., Gaffney, D., Horgan, G. and Baumberg, B. (2014) Disability, long term conditions and poverty, York: JRF http://npi.org.uk/files/7814/0490/1005/Disability_long_term_conditions_and_poverty.pdf
Philpott, J. (2014) Rewarding work for low-paid workers, York: JRF http://www.jrf.org.uk/sites/files/jrf/employment-pay-rewards-full.pdf
Plunkett, J. and Pessoa, J.P. (2013) A Polarising Crisis? The changing shape of the UK and US labour markets from 2008 to 2012, London: Resolution Foundation http://www.resolutionfoun-dation.org/wp-content/uploads/2014/08/A-polarising-crisis.pdf
Resolution Foundation (2014) More than a minimum: The Resolution Foundation Review of the Future of the National Minimum Wage: The Final Report, London: Resolution Foundation http://www.resolutionfoundation.org/wp-content/uploads/2014/03/More_than_a_minimum1.pdf
Rolfe, H., Rienzo, C., Lalani, M. and Portes, J. (2013) Migration and productivity: employers’ practices, public attitudes and statistical evidence https://niesr.ac.uk/sites/default/files/publi-cations/Migration%20productivity%20final.pdf
Schultz and Seith (2011) Career Advancement and Work Support Services on the Job: Imple-menting the Fort Worth Work Advancement and Support Center Program, New York: MDRC http://www.mdrc.org/sites/default/files/full_51.pdf
Sissons, P. (2011) The hourglass and the Escalator: Labour market change and mobility. London: The Work Foundation http://www.theworkfoundation.com/DownloadPublication/Report/292_hourglass_escalator120711%20(2)%20(3).pdf
UKCES (2014) The Future of Work: Jobs and Skills in 2030 Evidence Report 84, London: UKCES https://www.gov.uk/government/uploads/system/uploads/attachment_data/file/303334/er84-the-future-of-work-evidence-report.pdf
Wilson, T., Gardiner, L. and Krasnowski, K. (2013). ‘Work in progress: low pay and progression in London and the UK’, Centre for Economic and Social Inclusion. http://www.cesi.org.uk/sites/default/files/publications/Work_in_progress_full.pdf
This publication is available in the Wages & Income section of our website @resfoundation
Escape Plan: Understanding who progresses from low pay and who gets stuck Annex A: NESPD methodology
51
Annex A: NESPD methodology
Survey design
The analysis uses the New Earnings Survey Panel Dataset (NESPD), a longitudinal version of the Annual Survey for Hours and Earnings (New Earnings Survey prior to 2004). The sample is drawn from HMRC PAYE records and represents a 1 per cent sample of individuals registered for National Insurance based on the last two digits of the National Insurance Number (NINO). Employers of these individuals are contacted each year and asked to complete a short question-naire and provide payroll information. As the same sample approach (including the same final two NINO digits) is used each year, this allows the creation of a longitudinal panel. The NESPD therefore tracks the same employees over time, from 1975 to 2013. This allows us to identify workers who remain stuck on the minimum wage from year to year. The key wage measure used is hourly wage excluding overtime (hexo).
Scope of the dataset
In addition to hourly, weekly and annual earnings, the NESPD dataset contains information on a range of other employment characteristics: age, sex, region (from 2003), whether working part-time or full-time, whether working in the same job continuously for the past year, whether pay was set with reference to a collective agreement (from 2005), industry (SIC), occupation (SOC), and sector (public, private, etc). In addition, where SIC and SOC coding frames are suffi-ciently consistent over time, we can also identify the degree to which employees have remained working in the same industry or occupation.
Calibration weights
The calibration weights that are used for cross-sectional analysis of ASHE are not available in the NESPD. Although the analysis presented in this paper exploits the longitudinal structure of the data (i.e. to identify the stuck, the escapers, etc), all the estimations are actually cross-sectional. So ideally we might have wanted to apply the ASHE weights, particularly to estimate aggregate totals (e.g. total number of employees that have been stuck on low pay, etc.). While technically feasible to link the ASHE weights to the NESPD dataset using employer national insurance numbers, these linking codes are not available in the publically accessible datasets. However, to the extent that the sample is a true 1 per cent random sample, the unweighted NESPD estimates of means and proportions of employees are still reliable.
Where aggregate totals are required, these are calculated by applying the NESPD proportion estimate (e.g. proportion of employees that are stuck) to the relevant aggregate total (e.g. total number of employees) calculated based on ASHE and using the survey weights.
Panel errors
The NESPD documentation highlights the fact that there may be some instances where records may have the same cross-year identifier (anonymised national insurance numbers) but may belong to different individuals. The ONS therefore recommend that users check for consistency of the sex and age variables before assuming that records with the same identifier necessarily correspond to the same individual. Checking for these age and sex inconsistencies does indeed reveal such cases. Based on the various documentation, it appears these errors are due to a combination of (a) age and sex errors in the sample frame data extracted from HMRC PAYE administration data and (b) national insurance numbers genuinely not uniquely identifying individuals over time (e.g. due to recycling of NINOs). Provided both occur more or less randomly we can drop these panel
This publication is available in the Wages & Income section of our website @resfoundation
Escape Plan: Understanding who progresses from low pay and who gets stuck Annex A: NESPD methodology
52
error cases from the analysis without any bias to the results. To check for this we compared the characteristics of the employees that were dropped due to having panel errors against those were weren’t dropped. Because the incidence of panel errors is not constant over time, this comparison was run separately for different years. This analysis suggests that panel error cases are slightly more likely to be female, younger, less well paid, in part-time employment and to have changed jobs in the last year.
SIC and SOC codes
The NESPD contains information on the industry and occupation in which employees are employed, with all jobs classified according to detailed SIC and SOC codes respectively. The SIC and SOC code coding frames have been periodically modified over time, which presents a challenge for this analysis, in particular when we want to identify individuals that remain working in the same industry or occupation over time.
Missing data
Not all individuals in the NESPD sample are present in the data for every year. This is due to both the scope and design of the sample, as well as data errors.
In terms of the sample scope, there are legitimate reasons why an individual will not appear in the data in every year. This is because those who are not in employment or are self-employed as of the survey reference period (April) will not be captured in the data. The possible reasons for not being in employment and therefore not appearing in the data in that particular year are unemployment, moving abroad or economic inactivity, which covers those in full-time education, stay-at-home parents and full-time carers. Some individuals will obviously also exit the workforce permanently due to retirement or death.
However, there are a number of reasons why individuals may not appear in the data even though they were in employment for that year.
First, they could be working for an employer with no employee earning above the employer National Insurance Contributions (NICs) threshold. Secondly, they may in fact be in work and in the dataset, but their wage information is simply missing (item non-response). Thirdly, they may be in work but switched jobs since the sample was extracted and were therefore untraceable, or their employer has failed to return the required information (survey non-response). Finally, in 2007 and 2008 only, they may not appear even if they were employed because the sample was cut (in an attempt to cut costs). Therefore for these two years an individual in the NESPD sample may have been in work but does not appear in the data because they were randomly selected to be dropped from the survey for that year (before being reinstated from 2009).
Apart from the first , these data limitations are problematic because they potentially upwardly bias our estimates of the proportion of employees that remain stuck on low pay, and bias downwards our estimates of the proportion of employees that escape.
Since the definition of the stuck is being in low paid work for all years in which an employee is working in the previous/subsequent decade, if an employee who is low paid in all years in which they appear in the data was in fact in employment for one or more years they appear absent missing due to non-response or the 2007 and 2008 sample reduction, provided they are working in low paid work in those absent years, this doesn’t affect their being classified as stuck and so won’t affect the estimates.
In summary, due to these data limitations, our estimates of the proportion stuck will be upwardly biased, but the magnitude of this bias is likely to be small.
This publication is available in the Wages & Income section of our website @resfoundation
Escape Plan: Understanding who progresses from low pay and who gets stuck Annex B: British Household Panel Survey and Understanding Society Methodology
53
Annex B: British Household Panel Survey and Understanding Society Methodology
This quantitative study builds on and extends the methodology used in a previous Resolution Foundation report on pay progression (‘Starting out of getting stuck?’, Nov 2013). However the key difference is that this previous research was based on the New Earnings Survey Panel Dataset (NESPD), while this work uses the BHPS. The BHPS data was combined with USoc to enable the most up-to-date research reference period possible (2001 to 2011).[49] The key feature of these datasets is that they relate to panel surveys that track the same individuals over time, allowing the evolution of individual employees’ pay to be tracked and analysed.
The motivation for extending this analysis using BHPS/USoc is that, while NESPD has very accurate information on hourly pay and an extremely large sample size, it is limited to just those individuals in employment in any given year and only captures a relatively limited range of employment-related characteristics. The combined BHPS/USoc data, by contrast, includes information on all individuals in the survey sample, regardless of their employment status, and provides an extremely wide range of data, including crucially household characteristics and educational qualifications. However, one important disadvantage is that the BHPS/USoc sample size is a lot smaller than that of NESPD. Another disadvantage is that survey attrition is much higher in BHPS/USOC, especially with the transition from BHPS to USOC when not all BHPS participants agreed to be carried over to the USOC study. The NESPD, by contrast, has a much higher survey response rate because the information is submitted by employers who are obliged to participate. The relatively high attrition rate in BHPS/USOC has implications for the analysis, and this is discussed below.
Our analysis specifically relates to adult individuals (aged 16 and over) who were low paid at the start of the 2001-2011 period. Low pay is defined as having an hourly wage less than two thirds of the contemporary median.[50] These (initially) low paid individuals were then classified into pay progression categories, according to how their hourly pay was observed to evolve over the subsequent decade (2002-2011). The details of how the pay progression categories were defined are set out in the introduction. The analysis excluded ‘temporary sample members’, which are individuals that were only temporarily captured in the survey data because they happened to be living with a permanent sample member, and were therefore not systematically tracked over time. To maximise the available sample size the BHPS Wales, Scotland and Northern Ireland booster samples are included in the analysis. All descriptive statistics are estimated using the BHPS UK cross-sectional weights (xrwtuk1) for 2001, and are thus representative of all UK low-paid employees in 2001.
To understand the factors associated with progression out of low pay regression, we ran probit regressions using a wide range of time-invariant, initial and ‘dynamic’ characteristics. By ‘dynamic’ characteristics, we mean characteristics that relate to the initial seven years of the
[49] The BHPS covers the period 1991 to 2008, with USoc providing an additional two years (2010 and 2011). Note that there is
therefore a ‘gap’ in the data for the 2009 survey year.
[50] The hourly wage was derived based on usual pay and hours worked (usual normal hours plus usual overtime).
This publication is available in the Wages & Income section of our website @resfoundation
Escape Plan: Understanding who progresses from low pay and who gets stuck Annex B: British Household Panel Survey and Understanding Society Methodology
54
subsequent period (2002-2008), which we refer to as the ‘interim period’.[51] For characteristics measured in the form of continuous variables (e.g. household size, number of dependent children etc.), the ‘dynamic’ characteristic measures were specified in the form of the mean value calculated for each individual across every subsequent survey year for which there were observations. For non-employment-related binary measures (e.g. whether or not caring for a dependent, whether or not currently undertaking training, whether or not living in a specific region, etc), the ‘dynamic’ characteristic measures were specified as proportions of all interim period survey years (where the individual was present in the data) in which that particular characteristic was observed. For employment-spell related binary measures (e.g. whether or not working in a specific industry or occupation, whether or not job is permanent, whether or not job is part-time, etc), the ‘dynamic’ characteristic measures were specified as proportions of interim period ‘employment years’ in which that particular characteristic was observed. By interim period employment years we mean all interim period survey years where an individual was recorded as being in employment.
Preferred model specifications were identified using a stepwise regression approach, whereby the model initially using the full set of potential explanatory variables and then run repeatedly with insignificant variables successively removed from the model. The stepwise specifications were used as a starting point, with key variables (especially those related to education and training) added, swapped and/or removed until a robust and stable preferred specification was identified. In estimating the probit regression models, the calculated standard errors are clustered according to the BHPS primary sample unit (PSU), but survey weights are not specified.
Because the analysis is focussed on only those individuals in the panel sample that were low paid in 2001, the sample size for the analysis is relatively small (1,710 individuals). Therefore for all descriptive statistics presented here the statistical significance of differences in means is specified. The standard errors are calculated taking into account the stratified and clustered BHPS survey design according to the BHPS documentation (and using the Stata svyset commands).
Measurement error is another potential concern, particularly in relation to the hourly pay variable that underpins the analysis since the pay progression categories are all based on low-pay status and how this changes over time. As mentioned above, the hourly pay measure used to determine low-pay status was based on usual pay and hours worked (usual normal hours plus usual overtime). Unlike the NESPD, in BHPS/USOC the pay and hours data is self-reported, and is therefore likely to be subject to measurement error since individuals will very often misremember and/or misreport this type of information. In fact comparing the distribution of the derived BHPS/USOC hourly wage variable to that in NESPD does indeed suggest such measurement error. However, for the purposes of this analysis we are most concerned about classifying employees as being low paid or not, and not their specific hourly pay rate. In this regard the derived hourly pay measure appears to be reliable, since the proportion of employees that are low paid in each year is very similar to that given by the NESPD data ( just over 20%). In summary, while the specific point estimates for our derived hourly pay measure may not be accurate, for our purposes of needing to define low-paid employees this is not a problem.
Survey attrition is another issue with potential implications for the analysis. Table C2 in Annex C presents the proportion of the study population (i.e. individuals who were low paid employees in 2001) present in the data for each of the subsequent survey years. For BHPS, around 3% of the study sample drop out in each year. However, there was a much bigger drop (18%) between the last year of BHPS (2008) and the first relevant year of USOC (2010). This is unsurprising given the
[51] The reason why the ‘dynamic’ variables are not defined over the entire subsequent period (i.e. 2002-2011) is partly concep-
tual and partly pragmatic. Conceptually, since pay progression is defined here as being observed in non-low-paid employment in
the 2008, 2010 and 2011 survey rounds, it makes sense to focus on factors at play over the intervening period, i.e. in the period
up to and including 2008. From a pragmatic perspective, the fact that the data corresponding to the 2010 and 2011 survey
rounds are merged in from the USoc dataset (BHPS-sample), and many key variables are not consistently recorded between BHPS
and USoc, means that defining ‘dynamic’ variables using just the ‘interim period’ survey rounds covered by the BHPS (i.e. up to
2008) is more reliable.
This publication is available in the Wages & Income section of our website @resfoundation
Escape Plan: Understanding who progresses from low pay and who gets stuck Annex B: British Household Panel Survey and Understanding Society Methodology
55
time between these survey rounds was longer and that not all of the BHPS panel sample agreed to be carried forward into the USOC survey. The analysis deals with attrition in a number of ways. Firstly, we do not require the members of our study sample (the 2001 low-paid) to remain in the data for all the subsequent period. An individual only needs to be observed as employed and with an hourly wage recorded in at least one survey year over the subsequent period 2002-2011 to be allocated to one of the non-exiter category groups. In other words, we do not exclude attritors from the analysis, which could potentially bias the analysis if the attritors are systematically different from those who remain in the panel. On the other hand, however, under our definition of pay progression (which is set out in the introduction) by construction those who escape low pay must be present in the data for the final three survey years (2008, 2010 and 2011). This means that we may be understating the proportion of employees that escape low pay because some of the attritors who are not present in 2008, 2010 and/or 2011 may in fact have been escapers.
There is also a specific concern that our analysis of the factors explain progression out of low pay may simply be picking up the factors associated with not dropping out of the panel sample between BHPS and USOC. To address this in the analysis we include (as one of our explanatory variables) a dummy variable indicating the individuals who were present in the data in the 2008 BHPS data, but were not present in the 2010 and 2011 USOC survey years. This is done in order to pick up and control for the specific effect of being among that group. As a robustness check we also re-ran our preferred models for predicting pay progression replacing a dummy variable indicating individuals who were present in the USOC data as the dependent variable instead of progression (excluding the other ‘USoc-attrition’ dummy variable just mentioned). Reassur-ingly, this revealed that out preferred models had almost no explanatory power for dropping out between the BHPS and USOC switch over, indicating that our results were not being driven by attrition between the BHPS and USOC survey rounds. To account for the potential impact of year-on-year attrition (i.e. over and above any USOC attrition affect) we also included a measure of the number of survey years an individual was missing from the data as an explanatory variable in our regression models, in order to pick up and control for this effect.
Finally, it is important to understand the characteristics of study population –BHPS individuals who were low-paid in 2001— in order that the broader implications and widely applicability of the results can be assessed. Table E1 in Annex E compares the basic demographic characteristics of our study population compared to (a) the characteristics of the low paid in 2001 and 2013 according to ASHE.
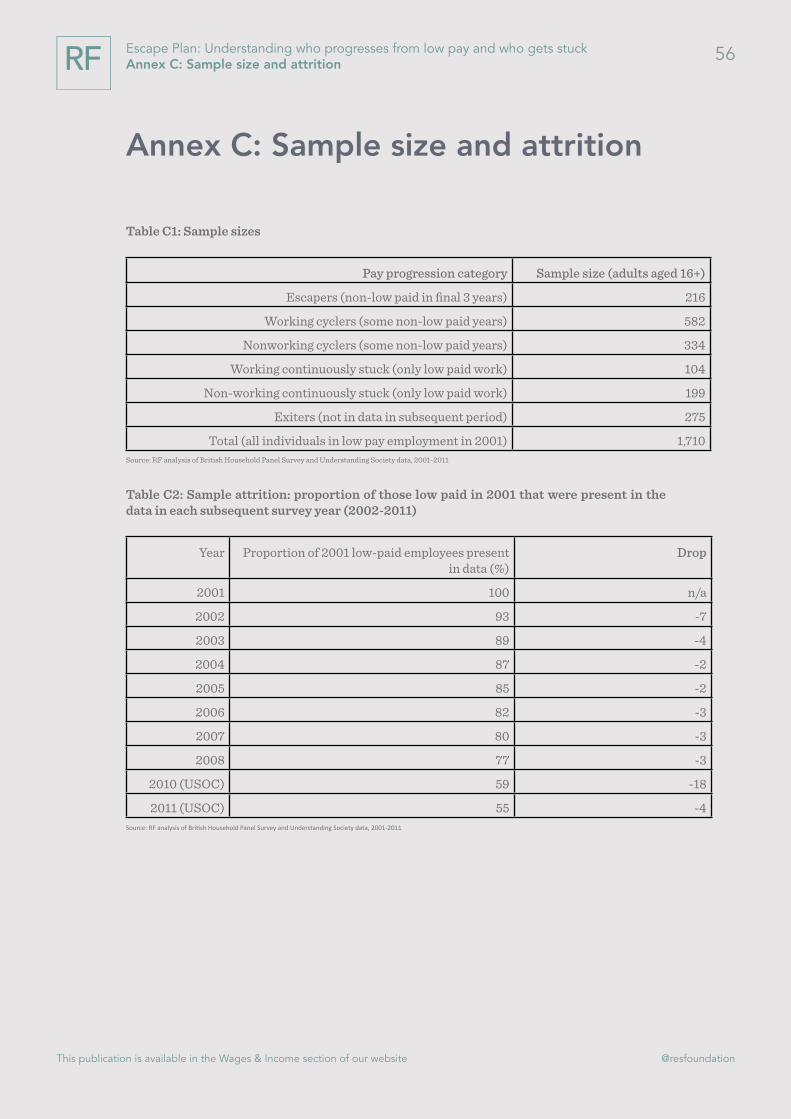
This publication is available in the Wages & Income section of our website @resfoundation
Escape Plan: Understanding who progresses from low pay and who gets stuck Annex C: Sample size and attrition
56
Annex C: Sample size and attrition
Table C1: Sample sizes
Pay progression category Sample size (adults aged 16+)
Escapers (non-low paid in final 3 years) 216
Working cyclers (some non-low paid years) 582
Nonworking cyclers (some non-low paid years) 334
Working continuously stuck (only low paid work) 104
Non-working continuously stuck (only low paid work) 199
Exiters (not in data in subsequent period) 275
Total (all individuals in low pay employment in 2001) 1,710Source: RF analysis of British Household Panel Survey and Understanding Society data, 2001-2011
Table C2: Sample attrition: proportion of those low paid in 2001 that were present in the data in each subsequent survey year (2002-2011)
Year Proportion of 2001 low-paid employees present in data (%)
Drop
2001 100 n/a
2002 93 -7
2003 89 -4
2004 87 -2
2005 85 -2
2006 82 -3
2007 80 -3
2008 77 -3
2010 (USOC) 59 -18
2011 (USOC) 55 -4Source: RF analysis of British Household Panel Survey and Understanding Society data, 2001-2011
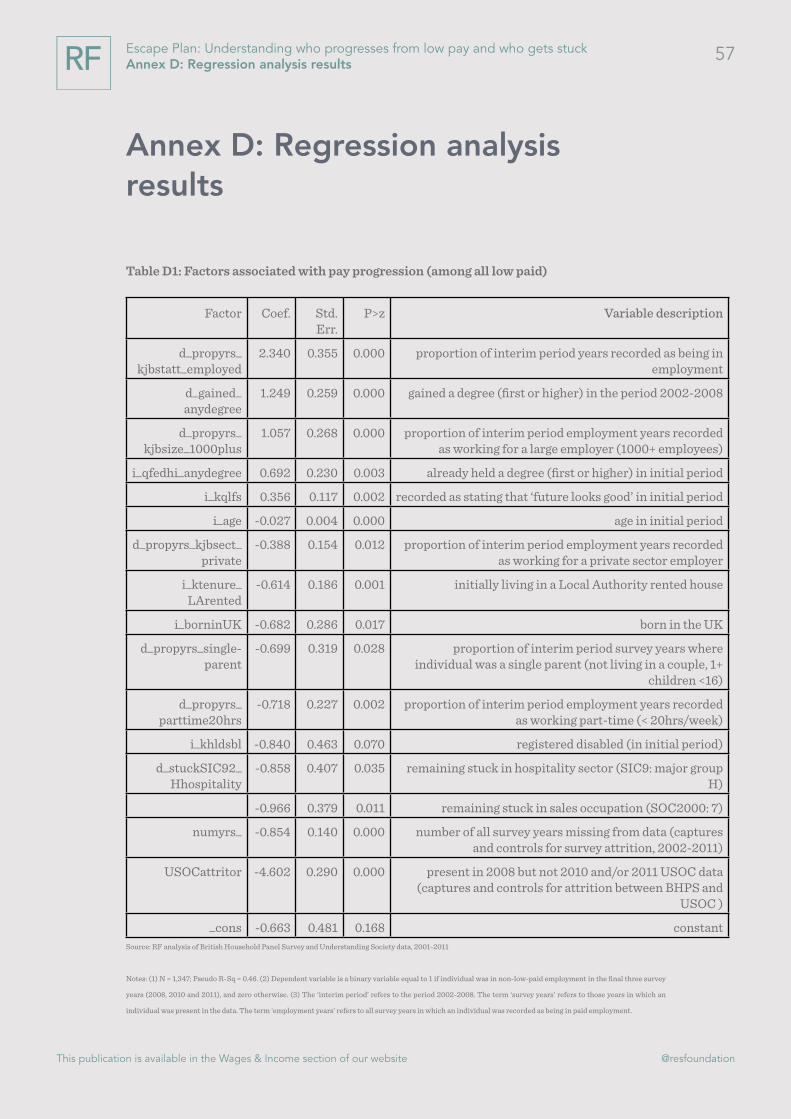
This publication is available in the Wages & Income section of our website @resfoundation
Escape Plan: Understanding who progresses from low pay and who gets stuck Annex D: Regression analysis results
57
Annex D: Regression analysis results
Table D1: Factors associated with pay progression (among all low paid)
Factor Coef. Std. Err.
P>z Variable description
d_propyrs_kjbstatt_employed
2.340 0.355 0.000 proportion of interim period years recorded as being in employment
d_gained_anydegree
1.249 0.259 0.000 gained a degree (first or higher) in the period 2002-2008
d_propyrs_kjbsize_1000plus
1.057 0.268 0.000 proportion of interim period employment years recorded as working for a large employer (1000+ employees)
i_qfedhi_anydegree 0.692 0.230 0.003 already held a degree (first or higher) in initial period
i_kqlfs 0.356 0.117 0.002 recorded as stating that ‘future looks good’ in initial period
i_age -0.027 0.004 0.000 age in initial period
d_propyrs_kjbsect_private
-0.388 0.154 0.012 proportion of interim period employment years recorded as working for a private sector employer
i_ktenure_LArented
-0.614 0.186 0.001 initially living in a Local Authority rented house
i_borninUK -0.682 0.286 0.017 born in the UK
d_propyrs_single-parent
-0.699 0.319 0.028 proportion of interim period survey years where individual was a single parent (not living in a couple, 1+
children <16)
d_propyrs_parttime20hrs
-0.718 0.227 0.002 proportion of interim period employment years recorded as working part-time (< 20hrs/week)
i_khldsbl -0.840 0.463 0.070 registered disabled (in initial period)
d_stuckSIC92_Hhospitality
-0.858 0.407 0.035 remaining stuck in hospitality sector (SIC9: major group H)
-0.966 0.379 0.011 remaining stuck in sales occupation (SOC2000: 7)
numyrs_ -0.854 0.140 0.000 number of all survey years missing from data (captures and controls for survey attrition, 2002-2011)
USOCattritor -4.602 0.290 0.000 present in 2008 but not 2010 and/or 2011 USOC data (captures and controls for attrition between BHPS and
USOC )
_cons -0.663 0.481 0.168 constantSource: RF analysis of British Household Panel Survey and Understanding Society data, 2001-2011
Notes: (1) N = 1,347; Pseudo R-Sq = 0.46. (2) Dependent variable is a binary variable equal to 1 if individual was in non-low-paid employment in the final three survey
years (2008, 2010 and 2011), and zero otherwise. (3) The ‘interim period’ refers to the period 2002-2008. The term ‘survey years’ refers to those years in which an
individual was present in the data. The term ‘employment years’ refers to all survey years in which an individual was recorded as being in paid employment.
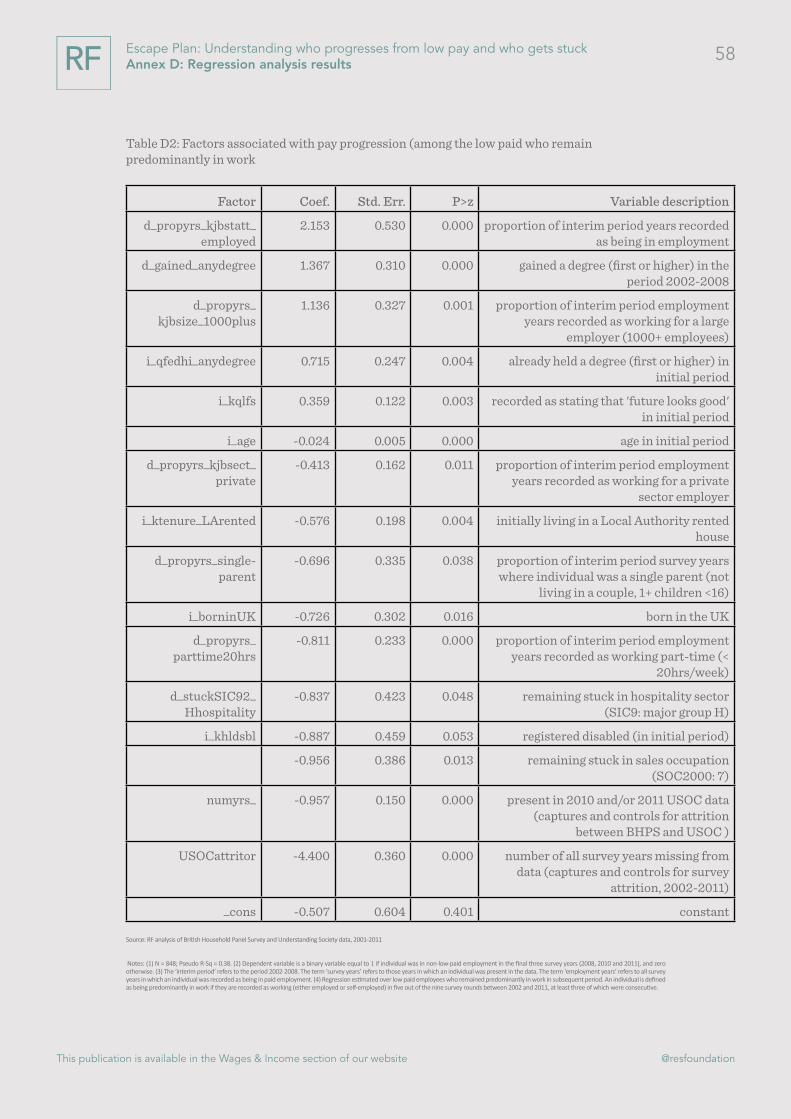
This publication is available in the Wages & Income section of our website @resfoundation
Escape Plan: Understanding who progresses from low pay and who gets stuck Annex D: Regression analysis results
58
Table D2: Factors associated with pay progression (among the low paid who remain predominantly in work
Factor Coef. Std. Err. P>z Variable description
d_propyrs_kjbstatt_employed
2.153 0.530 0.000 proportion of interim period years recorded as being in employment
d_gained_anydegree 1.367 0.310 0.000 gained a degree (first or higher) in the period 2002-2008
d_propyrs_kjbsize_1000plus
1.136 0.327 0.001 proportion of interim period employment years recorded as working for a large
employer (1000+ employees)
i_qfedhi_anydegree 0.715 0.247 0.004 already held a degree (first or higher) in initial period
i_kqlfs 0.359 0.122 0.003 recorded as stating that 'future looks good' in initial period
i_age -0.024 0.005 0.000 age in initial period
d_propyrs_kjbsect_private
-0.413 0.162 0.011 proportion of interim period employment years recorded as working for a private
sector employer
i_ktenure_LArented -0.576 0.198 0.004 initially living in a Local Authority rented house
d_propyrs_single-parent
-0.696 0.335 0.038 proportion of interim period survey years where individual was a single parent (not
living in a couple, 1+ children <16)
i_borninUK -0.726 0.302 0.016 born in the UK
d_propyrs_parttime20hrs
-0.811 0.233 0.000 proportion of interim period employment years recorded as working part-time (<
20hrs/week)
d_stuckSIC92_Hhospitality
-0.837 0.423 0.048 remaining stuck in hospitality sector (SIC9: major group H)
i_khldsbl -0.887 0.459 0.053 registered disabled (in initial period)
-0.956 0.386 0.013 remaining stuck in sales occupation (SOC2000: 7)
numyrs_ -0.957 0.150 0.000 present in 2010 and/or 2011 USOC data (captures and controls for attrition
between BHPS and USOC )
USOCattritor -4.400 0.360 0.000 number of all survey years missing from data (captures and controls for survey
attrition, 2002-2011)
_cons -0.507 0.604 0.401 constant
Source: RF analysis of British Household Panel Survey and Understanding Society data, 2001-2011
Notes: (1) N = 848; Pseudo R-Sq = 0.38. (2) Dependent variable is a binary variable equal to 1 if individual was in non-low-paid employment in the final three survey years (2008, 2010 and 2011), and zero otherwise. (3) The ‘interim period’ refers to the period 2002-2008. The term ‘survey years’ refers to those years in which an individual was present in the data. The term ‘employment years’ refers to all survey years in which an individual was recorded as being in paid employment. (4) Regression estimated over low paid employees who remained predominantly in work in subsequent period. An individual is defined as being predominantly in work if they are recorded as working (either employed or self-employed) in five out of the nine survey rounds between 2002 and 2011, at least three of which were consecutive.
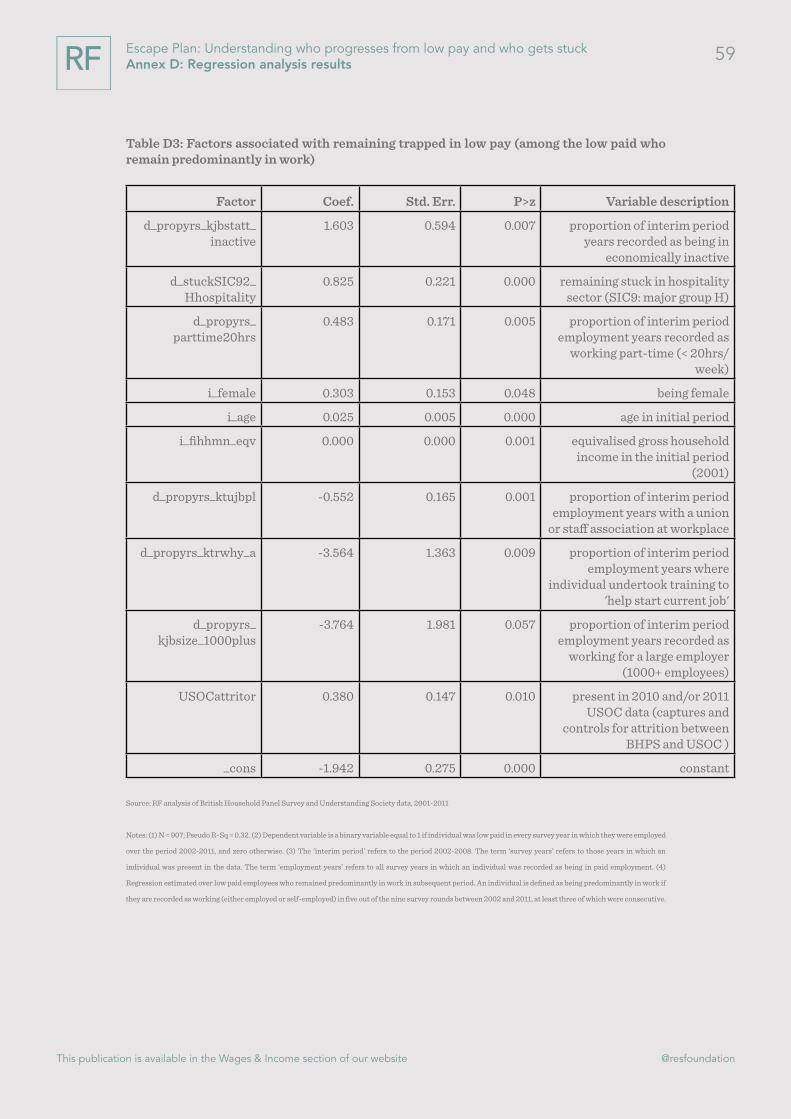
This publication is available in the Wages & Income section of our website @resfoundation
Escape Plan: Understanding who progresses from low pay and who gets stuck Annex D: Regression analysis results
59
Table D3: Factors associated with remaining trapped in low pay (among the low paid who remain predominantly in work)
Factor Coef. Std. Err. P>z Variable description
d_propyrs_kjbstatt_inactive
1.603 0.594 0.007 proportion of interim period years recorded as being in
economically inactive
d_stuckSIC92_Hhospitality
0.825 0.221 0.000 remaining stuck in hospitality sector (SIC9: major group H)
d_propyrs_parttime20hrs
0.483 0.171 0.005 proportion of interim period employment years recorded as
working part-time (< 20hrs/week)
i_female 0.303 0.153 0.048 being female
i_age 0.025 0.005 0.000 age in initial period
i_fihhmn_eqv 0.000 0.000 0.001 equivalised gross household income in the initial period
(2001)
d_propyrs_ktujbpl -0.552 0.165 0.001 proportion of interim period employment years with a union
or staff association at workplace
d_propyrs_ktrwhy_a -3.564 1.363 0.009 proportion of interim period employment years where
individual undertook training to 'help start current job'
d_propyrs_kjbsize_1000plus
-3.764 1.981 0.057 proportion of interim period employment years recorded as
working for a large employer (1000+ employees)
USOCattritor 0.380 0.147 0.010 present in 2010 and/or 2011 USOC data (captures and
controls for attrition between BHPS and USOC )
_cons -1.942 0.275 0.000 constant
Source: RF analysis of British Household Panel Survey and Understanding Society data, 2001-2011
Notes: (1) N = 907; Pseudo R-Sq = 0.32. (2) Dependent variable is a binary variable equal to 1 if individual was low paid in every survey year in which they were employed
over the period 2002-2011, and zero otherwise. (3) The ‘interim period’ refers to the period 2002-2008. The term ‘survey years’ refers to those years in which an
individual was present in the data. The term ‘employment years’ refers to all survey years in which an individual was recorded as being in paid employment. (4)
Regression estimated over low paid employees who remained predominantly in work in subsequent period. An individual is defined as being predominantly in work if
they are recorded as working (either employed or self-employed) in five out of the nine survey rounds between 2002 and 2011, at least three of which were consecutive.
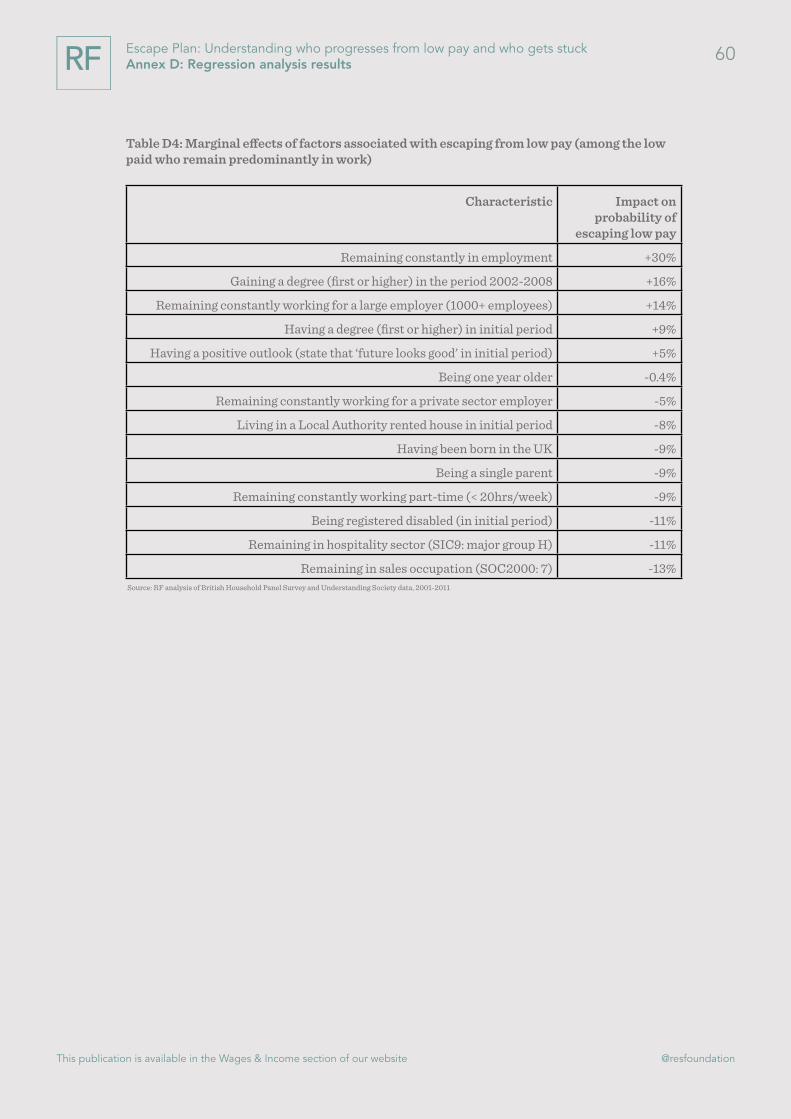
This publication is available in the Wages & Income section of our website @resfoundation
Escape Plan: Understanding who progresses from low pay and who gets stuck Annex D: Regression analysis results
60
Table D4: Marginal effects of factors associated with escaping from low pay (among the low paid who remain predominantly in work)
Characteristic Impact on probability of
escaping low pay
Remaining constantly in employment +30%
Gaining a degree (first or higher) in the period 2002-2008 +16%
Remaining constantly working for a large employer (1000+ employees) +14%
Having a degree (first or higher) in initial period +9%
Having a positive outlook (state that ‘future looks good’ in initial period) +5%
Being one year older -0.4%
Remaining constantly working for a private sector employer -5%
Living in a Local Authority rented house in initial period -8%
Having been born in the UK -9%
Being a single parent -9%
Remaining constantly working part-time (< 20hrs/week) -9%
Being registered disabled (in initial period) -11%
Remaining in hospitality sector (SIC9: major group H) -11%
Remaining in sales occupation (SOC2000: 7) -13% Source: RF analysis of British Household Panel Survey and Understanding Society data, 2001-2011
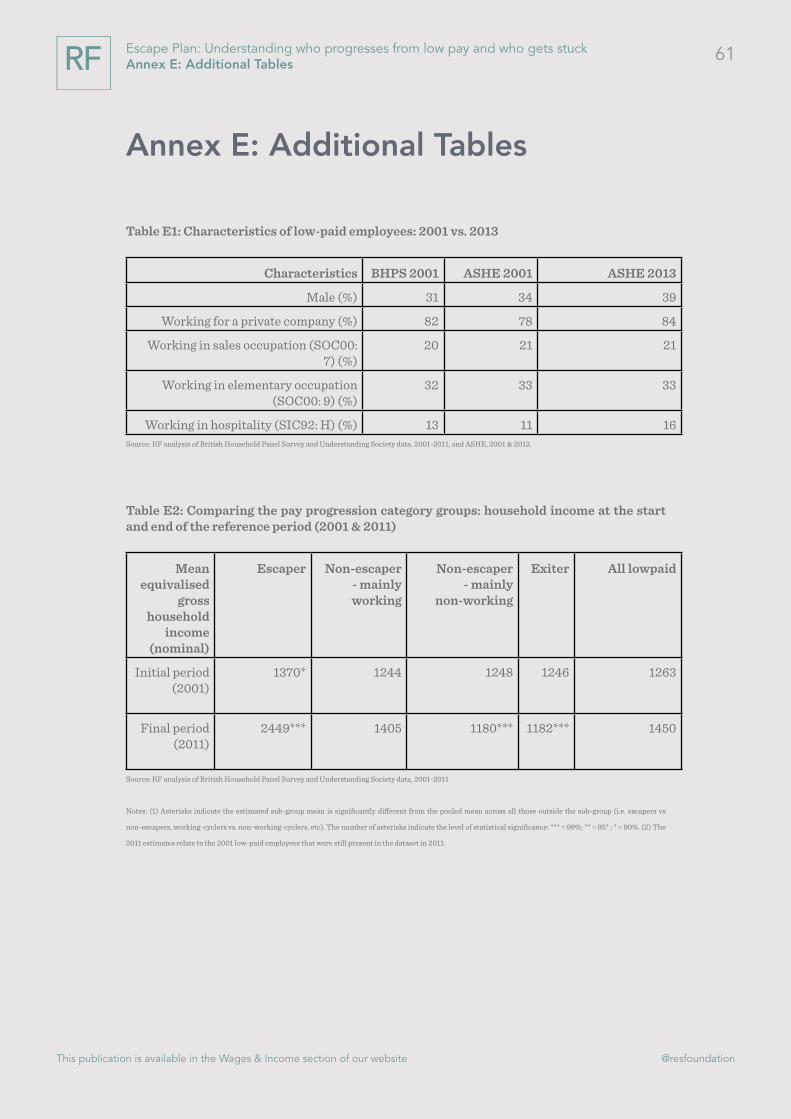
This publication is available in the Wages & Income section of our website @resfoundation
Escape Plan: Understanding who progresses from low pay and who gets stuck Annex E: Additional Tables
61
Annex E: Additional Tables
Table E1: Characteristics of low-paid employees: 2001 vs. 2013
Characteristics BHPS 2001 ASHE 2001 ASHE 2013
Male (%) 31 34 39
Working for a private company (%) 82 78 84
Working in sales occupation (SOC00: 7) (%)
20 21 21
Working in elementary occupation (SOC00: 9) (%)
32 33 33
Working in hospitality (SIC92: H) (%) 13 11 16Source: RF analysis of British Household Panel Survey and Understanding Society data, 2001-2011, and ASHE, 2001 & 2013.
Table E2: Comparing the pay progression category groups: household income at the start and end of the reference period (2001 & 2011)
Mean equivalised
gross household
income (nominal)
Escaper Non-escaper - mainly working
Non-escaper - mainly
non-working
Exiter All lowpaid
Initial period (2001)
1370* 1244 1248 1246 1263
Final period (2011)
2449*** 1405 1180*** 1182*** 1450
Source: RF analysis of British Household Panel Survey and Understanding Society data, 2001-2011
Notes: (1) Asterisks indicate the estimated sub-group mean is significantly different from the pooled mean across all those outside the sub-group (i.e. escapers vs
non-escapers, working-cyclers vs. non-working-cyclers, etc). The number of asterisks indicate the level of statistical significance: *** = 99%; ** = 95* ; * = 90%. (2) The
2011 estimates relate to the 2001 low-paid employees that were still present in the dataset in 2011.
resolutionfoundation.org [email protected] +44 (0)203 372 2960 @resfoundation
Resolution Foundation is an independent research and policy organisation. Our goal is to improve the lives of people with low to middle incomes by delivering change in areas where they are currently disadvantaged. We do this by:
» undertaking research and economic analysis to understand the challenges facing people on a low to middle income;
» developing practical and effective policy proposals; and » engaging with policy makers and stakeholders to influence
decision-making and bring about change.
For more information on this report, contact:
Conor D’ArcyPolicy [email protected] 020 3372 2981