essnetbig data · essnetbig data specific grant ... ask dirkzwager about the positions of the ......
TRANSCRIPT

1
ESSnetBig Data
S p e c i f i c G r a n t A g r e e m e n t N o 1 ( S G A - 1 )
h t t p s : / / w e b g a t e . e c . e u r o p a . e u / f p f i s / m w i k i s / e s s n e t b i g d a t a
h t t p : / / w w w . c r o s - p o r t a l . e u / . . . . . . . . .
Framework Partnership Agreement Number 11104.2015.006-2015.720
Specific Grant Agreement Number11104.2015.007-2016.085
W o rk P a c ka ge 4
A IS da ta
Mi l esto ne 4 . 5
P ro gre ss a nd t ec hni c a l repo r t o f 2 nd i nter n a l W P - meet i ng
Version 2016-11-04
ESSnet co-ordinator:
Peter Struijs (CBS, Netherlands)
telephone : +31 45 570 7441
mobile phone : +31 6 5248 7775
Prepared by: Anke Consten (CBS, The Netherlands)
Olav Grøndal (SD, Denmark) Maarten Pouwels (CBS, Netherlands)
Marco Puts (CBS, Netherlands) Tessa de Wit (CBS, Netherlands)
Christina Pierrakou (ELSTAT, Greece) Konstantinos Papandreou (ELSTAT, Greece)
Michal Bis (GUS, Poland) Anna Bilska (GUS, Poland)
OyvindLangsrud (SSB, Norway)

2
Index Participants 2nd internal WP-meeting (Copenhagen) ................................................................................................. 3
Introduction .................................................................................................................................................................. 3
Monday the 26th of September .................................................................................................................................... 3
1. Working with AIS data on the Sandbox ............................................................................................................ 3
2. First insights in quality of AIS data ................................................................................................................... 4
3. Reference frame of ships.................................................................................................................................. 6
4. Denmark’s progression in Java ......................................................................................................................... 9
Tuesday the 27th of September .................................................................................................................................. 10
5. First results on traffic analyses ....................................................................................................................... 10
6. Making a quality frame work based on one definition of a route ................................................................. 11
7. Experiences from Poland ................................................................................................................................ 11
8. Dataset of Greece ........................................................................................................................................... 12
3. Concrete actions from this meeting ....................................................................................................................... 13
ANNEX 1: description of variables in message- and location files ............................................................................. 14
ANNEX 2: CODE OF CREATING A REFERENCE FRAME FOR EUROPEAN WATERS ....................................................... 15
ANNEX 3: external Java libraries used at Statistics Denmark for executing AIS code ................................................ 16
ANNEX 4: Using Spark SQL to query data ................................................................................................................... 17

3
Participants 2nd internal WP-meeting (Copenhagen)
Christina Pierrakou √ Maarten Pouwels √
Tessa de Wit √ ØyvindLangsrud -
Marco Puts √ Olav Grøndal √
Anke Consten (Report) √ Anna Bilska √
Michal Bis √ Konstantinos Papandreou √
Introduction Most important aim of this second internal work package (WP) meeting was to show to all participants of WP4
how to work with AIS data on the Sandbox. So, after going home, everyone knows how to access and start analyse
the data on the Sandbox. Other aims of this meeting were sharing experiences on analysing data, share first
insights of the quality if the AIS data and share first results on the traffic analyses.
Monday the 26thof September (9:00 till 17:30 O’clock)
1. Working with AIS data on the Sandbox By Marco Puts (data scientist at Statistics Netherlands)
Marco gives an introduction in working with AIS data on the Sandbox. First he explained how to login on the Hadoop User Experience ( Hue). Hue is a Web interface for analysing data with Hadoop. On Hue you can see all the available tools (Hive, Pig, Hcatalog) for the Sandbox. You also find a filebrowser and a jobbrowser on Hue. In the file browser you find all AIS messages available on the Sandbox. Each file contains one hour of AIS data, with either locationfiles or messagefiles. In the jobbrowser you can monitor a running job. Marco also explains what variables are in a messagefile and in the location file (see annex I). In both files the field “timestamp” is added by Dirkzwager.The field “Destination” has to be filled in by crew of the
ship. As this is not always in the right format or not always updated, it is not reliable. There is also a field about
the GPS position of the ship. But the message file doesn’t contain the detailed information about the type of
vessel that is needed for the maritime statistics.
After this introduction we start a practical session on working with AIS data on the Sandbox. All the participants
tried to produce the next steps on their own laptop. Marco shows how putty (putty.com) can be used to
manipulate the data. A description can also be found here:
https://webgate.ec.europa.eu/fpfis/mwikis/essnetbigdata/index.php/WP4_AIS_data
These are the steps we did in this practical session:
Looking up all the AIS files on the Sandbox
Starting Spark
Making a link to the dataset
Counting the total amount of lines in the AIS files (Lines include the headers)
Filtering the headers out of the data

4
Selecting all unique MMSI’s from the AIS data
Counting the frequencies of MMSI’s
Writing the result of the next step into a textfile on the HDFS (Hadoop File System)
We found out that Scala (using Spark) is roughly 4400times faster than Python.
2. First insights in quality of AIS data
By Maarten Pouwels (expert on Maritime statistics at Statistics Netherlands) Maarten showed us the process of decoding the raw AIS data and told us some first insights into the quality of
AIS data.
The received AIS messages from Dirkzwager are in NMEA format, which is a text encoded binary format which has to be decoded.
As already mentioned in deliverable 1, the messages were decoded using the python AIS module. This library was already used at Statistics Netherlands. However, when decoding the European dataset, the program crashed several times. It took some time to figure out on which part of the dataset it actually crashed, since the error occurred 10 times on the in total 4.5 billion cases.
AIS consists of several types of records. We divided the messages into four file types. The first field type is about the position of the vessel (where the message id is 1, 2, 3 or 21).The second is about voyage related issues (where the message id is 5). The third was all other AIS messages we could decode, but the message type was not in the position report or voyage related. At this point we don’t see any information in this data, but perhaps in the future there will be some data we can use. The fourth is data we couldn’t decode. The records were written to different sets of files. The location files and the voyage related messages were put on the sandbox.
Some results about the decoded voyage messages are:
We see a lot of inland waterway vessels without an IMO number. In general we saw that IMO is not always reliable (see also “Reference frame of the ships, hereafter)
Blanks are sometimes filled with @, which has to be taken into account when decoding
The length of a ship can tell you a lot (dim_a + dim_b)
We have to realize that the motor of a vessel almost always runs, because of having electricity on board for
example for lights. That’s why the field “Speed” gives us more information than the field “course over ground” or
“navigationstatus”.
It is possible that in some messages all the fields contain default values. In that case this message is garbage. At
this time we decided to use all the data from Dirkzwager for analysing. We didn’t use a filter yet. For the Inland
waterways in the Netherlands we did use a filter, because in that case we are not interested in vessels which do
not move. More than 60% of all messages are from ships that aren’t moving.
After this introduction Maarten shows us some first results of the quality of the AIS data we received from
Dirkzwager. For analysing the coverage of the AIS data Maarten used Carto.com a free tool for visualising the
coverage of the AIS data.

5
Figure 1: screenshot of visualisation for the coverage of the AIS data
Figure 1shows a screenshot of a visualisation showing us the coverage of ships in the AIS data. The visualisationis
available on:https://maartenpouwels.carto.com/viz/8d319f16-8195-11e6-af04-0ecd1babdde5/public_map. As
seen on figure 1and even better on the mentioned link we see for example that there are a lot of ships in Greece,
but there is also data missing, for example there is no connection between Portugal and the Canal. We also see
noise, for example the vessels in the Sahara. We also see a pattern around Portugal which is possibly caused by
used filters on Portugal coastal service side.
Figure 2: screenshot of visualisation for following one ship using the AIS data from Dirkzwager

6
Figure 2 is a screenshot of a visualisation for following one ship based on the AIS data from Dirkzwager. The whole
visualisation you can find behind this link: https://maartenpouwels.carto.com/viz/8d2f3bde-8197-11e6-bf3f-
0ee66e2c9693/public_map. Following this ship during a couple of days gives us a detailed view of the route of a
ship. You can even see the different terminals in a port. But this visualisation also shows us that there is data
missing. We have to examine why this messages are missing. One hypothesis is that ships can turn of their AIS
signal. This is for example the case for some oil tankers. We agreed that missing data only becomes a problem if it
is not possible to reconstruct the data. We will try to find out if we can produce a methodology for reconstructing
missing data. Another solution is possibly getting the AIS satellite data.
Figure 1and 2 show that it is essential to further analyse the AIS data source. We agreed on the following steps
of further analysing the data:
1. Compare the Dirkzwager data with own national AIS data 2. Ask Dirkzwager for more background information (what filters were used) 3. Ask Dirkzwager about the positions of the receivers 4. Contact Eurostat and JRC (Joint Research Center) about their results on the quality of AIS data 5. Review and develop a quality and metadata framework
3. Reference frame of ships by Tessa de Wit (statistical expert at Statistics Netherlands)
Tessa explains to all the participants how to create a reference frame in European waters based on AIS data. For
this reference frame Tessa had to use the message records as these contain both MMSI and IMO. IMO’s are
needed to be able to select maritime ships, but these are not included in the location records, here only MMSI is
given. So valid MMSI’s can be selected from message records based on valid IMO’s.
Originally, Tessa made a preliminary reference frame of ships. Started by counting all valid MMSI’s for the
Netherlands for 6 months (result 26,044 MMSI’s). After that she compared the previous list to one hour
ofLocations( result 3,264 MMSI’s). In the next step Tessa confronted all ships in the port of Amsterdam with the
preliminary frame of ships (see figure 3). This result she confronted with maritime statistics for the sameday. We
found out that all ships in maritime statistics are also present in the Dirkzwager AIS data. An important finding is,
that, there are more ships in the AIS data than in the maritime statistics data. We need to examine this
furthermore.
Partly, these extra ships in the AIS data are anchored ships. In maritime statistics only arriving ships are selected.
However, It seems that we are missing ships in our maritime statistics. This seems to be caused by ships only
declaring the first port visit in the Netherlands and not the next visits. These extra visits are available in the AIS
data. This is one of the reasons we see more arrivals in the AIS data. Finally, noise on the signal (due to random
errors) causes more arrivals, which should be fairly easy to filter. We conclude that the accuracy of the AIS data is
sufficient for identifying internal ports.

7
Figure 3: preliminary reference frame of ships &port of Amsterdam
For the initial reference frame of ships only coupling IMO-MMSI is not a sufficient filter, as artificial couples are
formed due to random errors . Therefore, to improve the selection IMO-MMSIcouples, Tessa counted the
frequency of the combinations IMO-MMSI which were found in the AIS data. She chooses the combination with
the highest frequency as the right IMO-MMSI-couple. Remarkable was that there were a lot of IMO-MMSI couples
which occurred only once in the data. We think these ships do not belong to the reference frame of ship in the
European waters. Maybe they belong to the reference frame of America of some other continent, which could be
due to filtering in Dirkzwagerdata.
Figure 4: description of fields in table F2 (port visits)

8
Coupling this new reference frame of ships to port of Amsterdam visits, resulted in a lower number of ship visits,
that almost mirrored the ships found in the maritime statistics. Moreover, with these AIS data we found ships
that visited the port of Amsterdam, but lacked in the maritime statistics. Based on this findings it seems possible
to make table F2 (port visits, see figure 4 above) for the maritime statistics based on AIS data, that could actually
be more complete than the maritime statistics.
Only the fields “type of vessel” and “Size of vessel deadweight” are not present in the AIS data in the way we
need them for our maritime statistics as you can see in table 1. For example it is not possible to distinguish “Dry
bulk”, “Container”, “specialised”, “General cargo, non-specialised” and “Dry cargo bare” from AIS data because in
AIS all these types are called “cargo”. It also is not possible to distinguish “passenger” and “cruise passenger”
from the AIS data, because in the AIS data these types are both called “passenger”.
Type of vessel might be distracted from the AIS data by using the terminal the ship was (un)loading. If this is not
possible, we have to use another source (for example the Lloyd’s register) for filling this field in the F-table. Also
the field “Size of vessel deadweight” is presented in the Lloyd’s register. However, we want to investigate if there
are possibilities to base this information on other present variables in the AIS data.
In one way or the other, the big benefit of filling (most of) the F2-table based on AIS data is that all member
states have the same data and the table can be filled from one source using only one methodology.
Table 1: overview of the different types of vessel asked for maritime statistics and the types of vessel present in the
AIS data.
Maritimestatistics AIS
10Liquid bulk 80Tanker
20Dry bulk 70Cargo
31Container 70Cargo
32Specialised 59Special craft 70Cargo
33 General cargo, non-specialised 70Cargo
34 Dry cargo barge 70Cargo
35Passenger 60-69 Passenger
36Cruise passenger 60-69Passenger
41Fishing 30Fishing
42Offshore activities 33Dredger
59Special craft
43Tugs 52Tugs
49Miscellaneous 59Special craft
….
xxunknown
After this introduction by Tessa, Marco showed with what code he made this European reference frame. It took
20 minutes to execute this code and create a reference frame of European waters based on six months of data.
This code is available in annex 2 and on GitHub. We agreed that every country participating in this work package

9
and has the national AIS data will try to makea national reference frame for their own country based on the AIS
data we got from Dirkzwager.
4. Denmark’s progression in Java By Olav Grøndal (methodologist at Statistics Denmark)
Statistics Denmark uses Oracle and Java for handling and analysing AIS data. Denmark has a live data stream
(going back almost a year now) for national AIS data. Till now the results of Denmark are based on using the
national AIS data and not the dataset from Dirkzwager.
Statistics Denmark has found that an Oracle database and a modest amount of computing power is sufficient for
carrying out decoding of AIS messages and doing statistical analysis of these. However it is possible that some of
the more complex calculations will be moved to a Spark infrastructure, if faster speeds are needed for fast
publication of results.
Statistics Denmark uses a few external Java libraries (see annex 3) for executing its AIS code.
The data is not currently used for statistics, but Statistics Denmark is getting closer to production quality data.
Denmark has achieved the following :
1. Created a by-date reference frame of ships in Danish waters. Based on a polygon of Danish waters 2. The different types of AIS messages are weaved together into a common datastructure. This common
datastructure is called a route and can be used to calculate geodesic distances and be used as a basic unit of analysis. This datastructure also handles conversion to different map projections for further analysis.
3. Created a method for registering visits. The method is based comparing routes with a set of polygons representing harbours. Each time a ship enters a harbour polygon it is registered as a visit, if the ship stays in that harbour for a minimum of time calculated based on the size of the harbour polygon. Some small harbours, which simply hosts mainland ferries that have very short visit times of a few minutes each time. While for other harbours the minimum stay is around an hour.
4. Create basic statistics of activity in waters based on grids, and made traffic tables of select harbours.
Denmark has found several problems with the AIS data, closely mirroring those detected by the Netherlands.
Cleaning the data of misread observations is one of the central obstacles to producing quality statistics, because
noise and misread information significantly disturb routes and greatly exaggerate distance travelled.
As an error correction model, Statistics Denmark proposed considering each location reading in the context of
other location readings from the same ID that is close in time to the concrete location reading. The model would
the discard individual points if implausible inconsistency was detected. The route data object is a useful base
model for this work, as the routes can be considered route by route, and one can create a quality statistics on a
route basis.
A quality measure for each route could be the percentage of individual positions which draw a plausible linked
line, and have a certain minimum number of readings per hour in the relevant territory. Denmark proposed that
this could be the quality measure for further work. Enabling the project to disregard faulty readings and estimate
which routes need partial imputation and which routes can be used directly in the final statistical product.

10
Tuesday the 27th of September (9:00 till 13:00 O’clock) We started this second day of our meeting with summarizing the actions from the first day and dividing the
actions among the participants of this work package. We also changed and approved the agenda for this second
day. Because of time it was not achievable to have our brainstormsession about how we can improve the quality
of current maritime statistics by using European AIS data. We agreed to schedule this session for one of the next
WebEx meetings.
5. First results on traffic analyses By Marco Puts (data scientist at Statistics Netherlands)
In WP4 one of the deliverables is calculate a number of ships at certain coordinates and visualise the results to analyse variation in time. Marco explains his method to calculate a number of ships at certain coordinates. First of all it is important to make sure that all the areas are all of the same size. Marco chooses for a grid where all cells are10000 sq.km. After creating this grid, the program counted theamount of ships in each cell of the grid during one hour on a randomly chosen day. Marco also made a visualisation of this traffic analyses (figure 5). Figure 5 shows the amount of ships in each cell
of the grid during one hour on a randomly chosen day. In the grids presented with a light dot there were few
ships counted during the chosen hour(less than two). In the grids presented with a red dot there were a lot of
ships counted during the chosen hour (around2600).
The codes for defining the areas (latlon.scala) and then counting unique MMSI’s (countuniq.scala) can be found here: https://github.com/mputs/WP4/tree/master/locations/src/main/scala (note: this code only checks for unique MMSI’s, but it does not check for the correctness of the MMSI yet). We decide to let an expert check if Marco’s method is right. We also have to make these traffic analyses with the right coordinates so the whole of Europe is in the grid. This was not the case yet as you can see in figure5. Figure 5: result on traffic analyses: the amount of ships in each cell of the grid during one hour on a randomly
chosen day

11
6. Making a quality frame work based on one definition of a route By all
We start a discussion for making a quality framework for the European AIS data based on one definition of a
route. After discussing what the definition of a route should be for more than 1,5 hour, we decide to stop the
discussion for this moment. We agreed on making a proposal for a common definition of a route and a proposal
for a quality framework. Both of this proposals we will discuss in one of our next WebEx meetings. Table 2 shows
the different methods of observations of a route of a ship as discussed during this meeting.
Table 2: different methods of observations of a route of a ship expressed during this meeting
Country Used method of observation of a route of a ship
Netherlands Starting point such as port
Denmark A continuous stream of location and ID messages , for some time interval or until signal is lost / degraded according to a quality measure, for a single ship.
Poland Observation route of a ship of output port to the entering port
7. Experiences from Poland By Michal Bis (IT expertStatistics Poland)
In the first part Michal demonstrated how to work with Spark SQL on the Sandbox. More information you can find
in ANNEX 4.
In the second part Michal showed us results of experiences at Statistics Poland on working with AIS data. Aim of
the demonstration was to see if it is possible to link AIS data form Dirkzwager to the survey data on maritime
statistics from Poland based on the coordinates, because the survey data from Poland does not provide collecting
MMSI numbers, only IMO numbers.
In AIS there are two types of datasets: locations (message id 1,2,3 and 21) with MMSI only, and messages
(message id 5) with both IMO and MMSI. Number of records in the message is not proportional to the number of
locations. An obvious solution to the problem is a dictionary of ships containing both MMSI and IMO numbers.
Since the preparation of the dictionary is time-consuming, Statistics Poland decided to use coordinates of ports to
link AIS data to the statistical survey data.
The work was divided in stages:
- prepare source data for the reference day
- build a reference frame of ships for Poland (based on the geographic coordinates)
- link a reference frame of ships for Poland to datasets containing coordinates of ports
and divide the datasets into two groups: “ships in ports” and “ships not in ports”
- verify data with statistical survey
In the last stage we verified that “ships in ports” based on coordinates are indeed in Poland’s dataset from survey
data. For this purpose, we used a stored procedure where parameter is number of ship.
As a result of the stored procedure mentioned above we received the following information:
- statistical surveys from Poland (if was in ports)
- datasets location and message
12
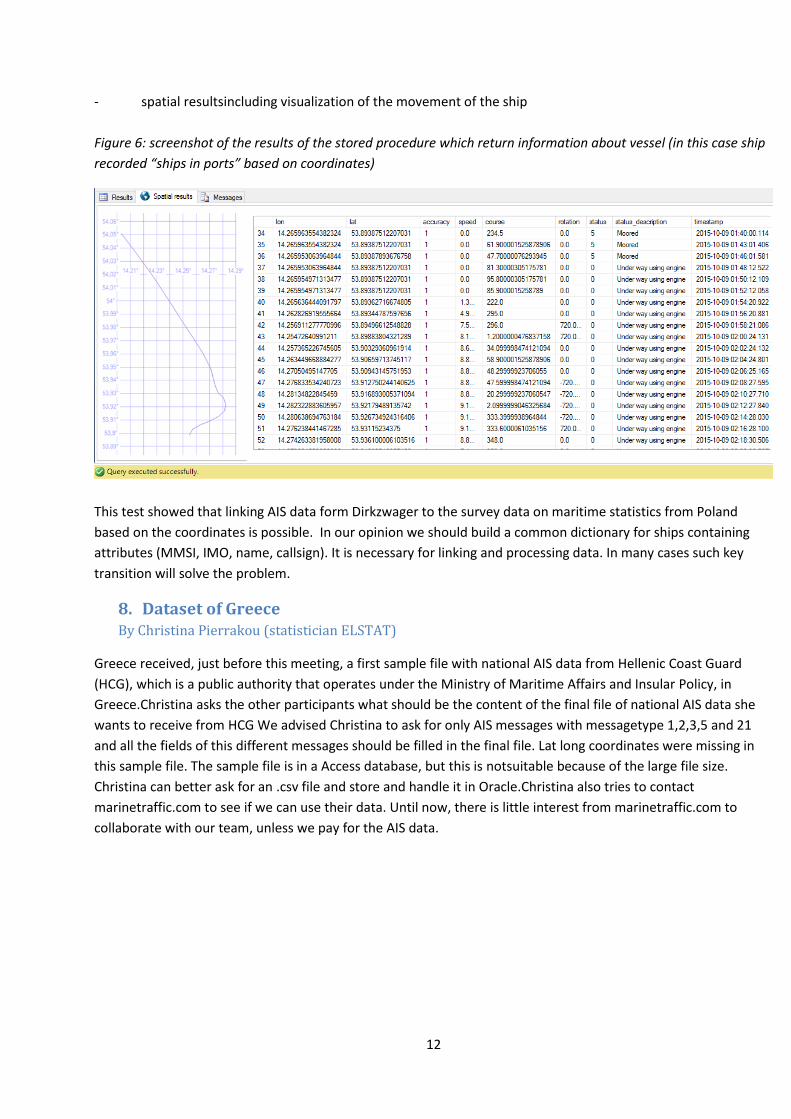
- spatial resultsincluding visualization of the movement of the ship
Figure 6: screenshot of the results of the stored procedure which return information about vessel (in this case ship
recorded “ships in ports” based on coordinates)
This test showed that linking AIS data form Dirkzwager to the survey data on maritime statistics from Poland
based on the coordinates is possible. In our opinion we should build a common dictionary for ships containing
attributes (MMSI, IMO, name, callsign). It is necessary for linking and processing data. In many cases such key
transition will solve the problem.
8. Dataset of Greece By Christina Pierrakou (statistician ELSTAT)
Greece received, just before this meeting, a first sample file with national AIS data from Hellenic Coast Guard
(HCG), which is a public authority that operates under the Ministry of Maritime Affairs and Insular Policy, in
Greece.Christina asks the other participants what should be the content of the final file of national AIS data she
wants to receive from HCG We advised Christina to ask for only AIS messages with messagetype 1,2,3,5 and 21
and all the fields of this different messages should be filled in the final file. Lat long coordinates were missing in
this sample file. The sample file is in a Access database, but this is notsuitable because of the large file size.
Christina can better ask for an .csv file and store and handle it in Oracle.Christina also tries to contact
marinetraffic.com to see if we can use their data. Until now, there is little interest from marinetraffic.com to
collaborate with our team, unless we pay for the AIS data.
13
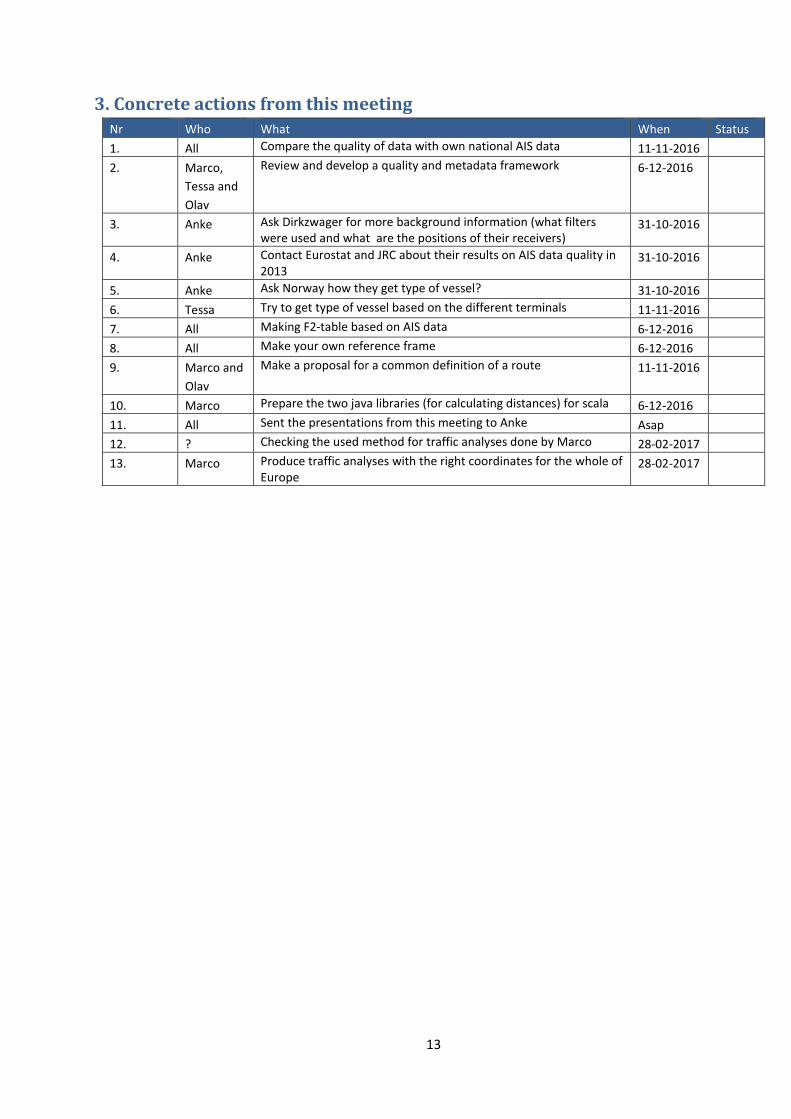
3. Concrete actions from this meeting Nr Who What When Status
1. All Compare the quality of data with own national AIS data 11-11-2016
2. Marco,
Tessa and
Olav
Review and develop a quality and metadata framework 6-12-2016
3. Anke Ask Dirkzwager for more background information (what filters were used and what are the positions of their receivers)
31-10-2016
4. Anke Contact Eurostat and JRC about their results on AIS data quality in 2013
31-10-2016
5. Anke Ask Norway how they get type of vessel? 31-10-2016
6. Tessa Try to get type of vessel based on the different terminals 11-11-2016
7. All Making F2-table based on AIS data 6-12-2016
8. All Make your own reference frame 6-12-2016
9. Marco and
Olav
Make a proposal for a common definition of a route 11-11-2016
10. Marco Prepare the two java libraries (for calculating distances) for scala 6-12-2016
11. All Sent the presentations from this meeting to Anke Asap
12. ? Checking the used method for traffic analyses done by Marco 28-02-2017
13. Marco Produce traffic analyses with the right coordinates for the whole of Europe
28-02-2017

14
ANNEX 1: description of variables in message- and location files Variables in the location file:
mmsi
lon
lat
accuracy
speed
course
rotation
status
timestamp
Variables in the message file:
mmsi
imo
name
callsign
destination
draught
dim_a
dim_b
dim_c
dim_d
fix_type
type and cargo
timestamp
15
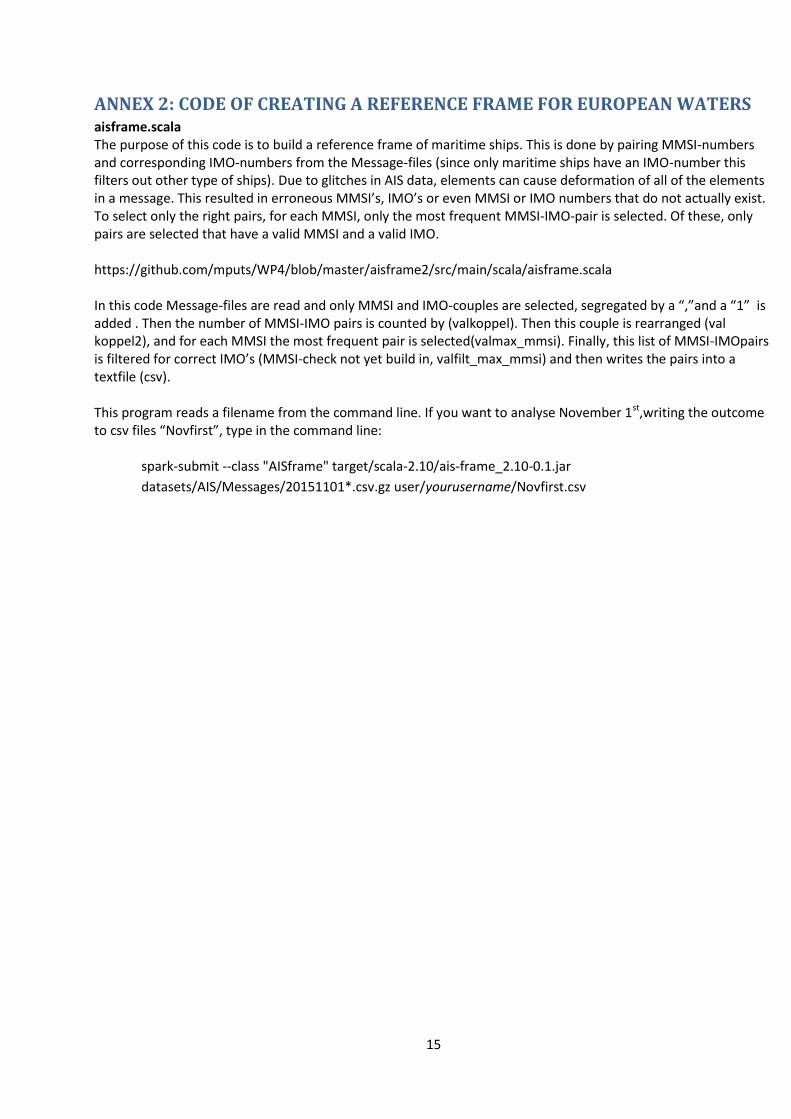
ANNEX 2: CODE OF CREATING A REFERENCE FRAME FOR EUROPEAN WATERS aisframe.scala The purpose of this code is to build a reference frame of maritime ships. This is done by pairing MMSI-numbers and corresponding IMO-numbers from the Message-files (since only maritime ships have an IMO-number this filters out other type of ships). Due to glitches in AIS data, elements can cause deformation of all of the elements in a message. This resulted in erroneous MMSI’s, IMO’s or even MMSI or IMO numbers that do not actually exist. To select only the right pairs, for each MMSI, only the most frequent MMSI-IMO-pair is selected. Of these, only pairs are selected that have a valid MMSI and a valid IMO. https://github.com/mputs/WP4/blob/master/aisframe2/src/main/scala/aisframe.scala In this code Message-files are read and only MMSI and IMO-couples are selected, segregated by a “,”and a “1” is added . Then the number of MMSI-IMO pairs is counted by (valkoppel). Then this couple is rearranged (val koppel2), and for each MMSI the most frequent pair is selected(valmax_mmsi). Finally, this list of MMSI-IMOpairs is filtered for correct IMO’s (MMSI-check not yet build in, valfilt_max_mmsi) and then writes the pairs into a textfile (csv). This program reads a filename from the command line. If you want to analyse November 1st,writing the outcome to csv files “Novfirst”, type in the command line:
spark-submit --class "AISframe" target/scala-2.10/ais-frame_2.10-0.1.jar
datasets/AIS/Messages/20151101*.csv.gz user/yourusername/Novfirst.csv

16
ANNEX 3: external Java libraries used at Statistics Denmark for executing AIS
code
Statistics Denmark uses a few external Java libraries for executing its AIS code:
1. AISLIB from the Danish Maritime Authority - this is used for converting AIS messages 2. GeoTools for converting lat/longs between different map projections and calculations geodesic distances. 3. JTS Topology for doing calculations on polygons, such as detecting if two polygons overlap and by how
much.

17
ANNEX 4: Using Spark SQL to query data This chapter demonstrateshow to query a Hive table using Spark SQL which is the component of Spark and supports reading and writing data stored in Apache Hive. It is assumed that in Apache Hive, we have created a database and tables and Spark context is available under the
name sc.
After we started the spark shell, we create a HiveContext which is an instance of the Spark SQL execution engine that integrates with data stored in Hive. valHiveContext = new org.apache.spark.sql.hive.HiveContext(sc)
In this step we prepare query to table in Apache Hive:
val results = hiveContext.sql("SELECTCOUNT(distinctmmsi)asnumber_unique_ships,vessel_country_origin_midas MID FROM AIS.v_location_201510090001_level_eu_extended WHEREvessel_country_origin_midin('Denmark','Greece','Netherlands','Norway','Poland') GROUPBYvessel_country_origin_mid ORDERBYnumber_unique_ships")
As a last step we prepare output and print all elements of an RDD on the command line. results.map(t => "number_unique_ships: " + t(0) + " vessel_country_origin_mid: " + t(1))).collect().foreach(println) If you need to print a few element of the RDD you can use results.map(t => "number_unique_ships: " + t(0) + " vessel_country_origin_mid: " + t(1))).take(5).foreach(println)