estimates of land subsidence based on analysis of
TRANSCRIPT

1
Estimates of Land Subsidence Based on Analysis
of Topographic Data
April 21, 2015
Presentation to
Coastal Bend, GCD
Wharton , Texas
By Steven Young, Ph.D., PE. PG.
2
Presentation Outline
Processes that Cause Land Subsidence
Previous Estimates of Land Subsidence
Approach for Using Topographic Data
Data Sources
Estimated Land Subsidence
Summary

3
Conceptualization of a Model for Land Subsidence
Land subsidence occurs only from
clay consolidating from above
Sand drain first and then clays
Clays drain much slower than sands
Subsidence =
Drawdown * Compressibility
When Water Level is less than a
Presconsolidation Water Level then
Clay Compressibility is non-elastic
and land subsidence occurs
Laboratory Values of Clay
Compressibility ≠ Field Values of
Clay Compressibility
Discharge
DRAWDOWN IN THE SUBSURFACE

4
Estimated Land Subsidence (Ratzlaff, 1982)
Land Subsidence (ft)
0.5 – 1
> 1
Victoria
El Campo
5
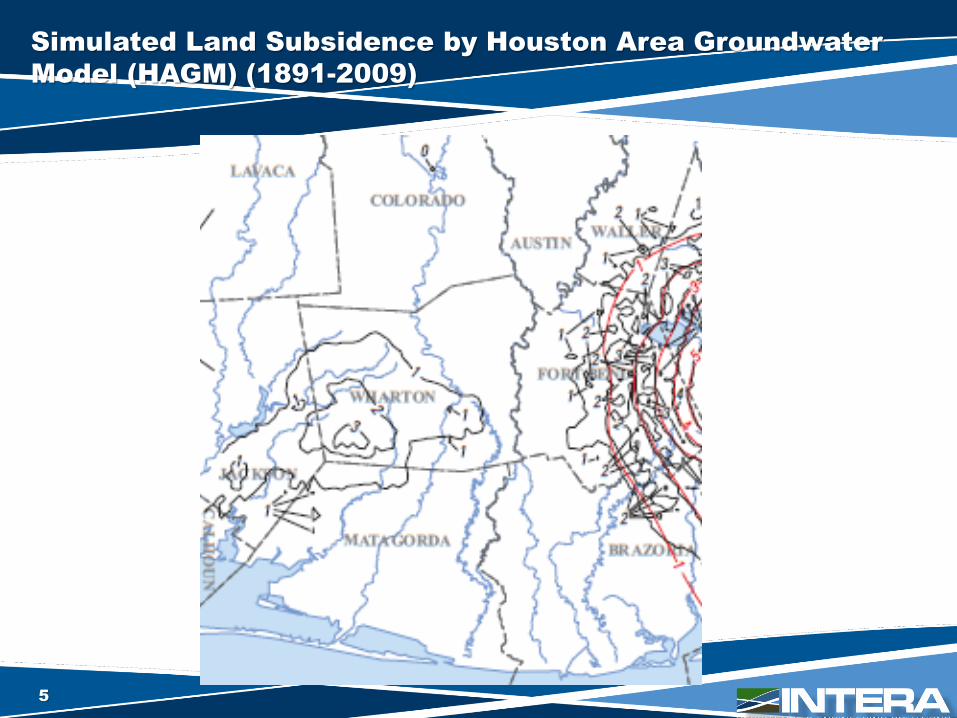
Simulated Land Subsidence by Houston Area Groundwater
Model (HAGM) (1891-2009)

6
Simulated Land Subsidence by Lower Colorado River Basin
(LCRB) Model

7
Approach for Using Topographic Data
Land Elevation (time 1) - Land Elevation (time 2)
Assemble measurements over area and perform statistical analysis to estimate an “average” value
Remove outliers (very high and low values) before statistical analyses
Point measurements of Land Elevation • Group across decades and across 20 – 30 square mile areas to increase count
• Calculate average difference based on values between 25% and 75% percentile
Maps of Land Elevation• Old Topography Maps
• Digitize and interpolate contour maps to generate continuous set of values
• Sample at 500-ft spacing
• LIDAR Maps • Mosiac tiles
• Sample at 500-ft spacing
• Group points within 1 mile square areas and then average using ESRI sofware
Identify regions of Possible Land Subsidence
8
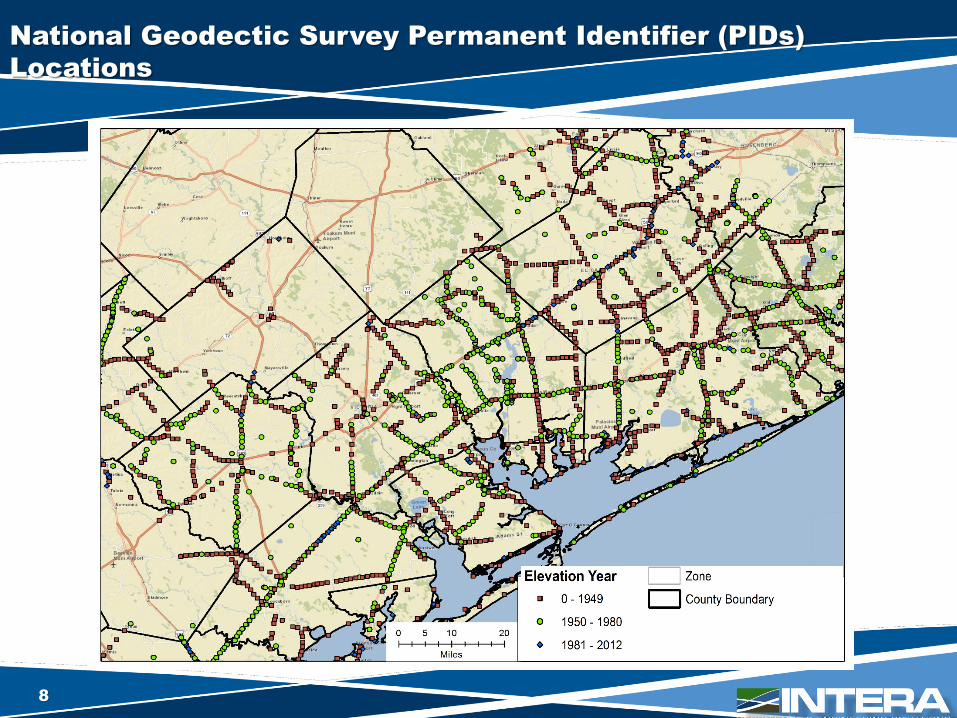
National Geodectic Survey Permanent Identifier (PIDs)
Locations

9
LIDAR (LIght & raDAR) Coverage

10
USGS Quadrangle Maps ( 1951 to 1962)
(5-ft to 10-ft contour interval)

11
Estimated Land Subsidence based on PIDS (pre 1950s)
Zones based on
Grouping of PIDS
with Similar Values
Top Value is
Weighted Average
Bottom Value is
Median
Weighted Average
based on values
between 25% and
75% percentile
Preliminary Results - do not cite

12
Estimated Land Subsidence based on PIDS (1950 -1980)
*Insufficient data is less than 5 data points
Preliminary Results - do not cite
Zones based on
Grouping of PIDS
with Similar Values
Top Value is
Weighted Average
Bottom Value is
Median
Weighted Average
based on values
between 25% and
75% percentile
13
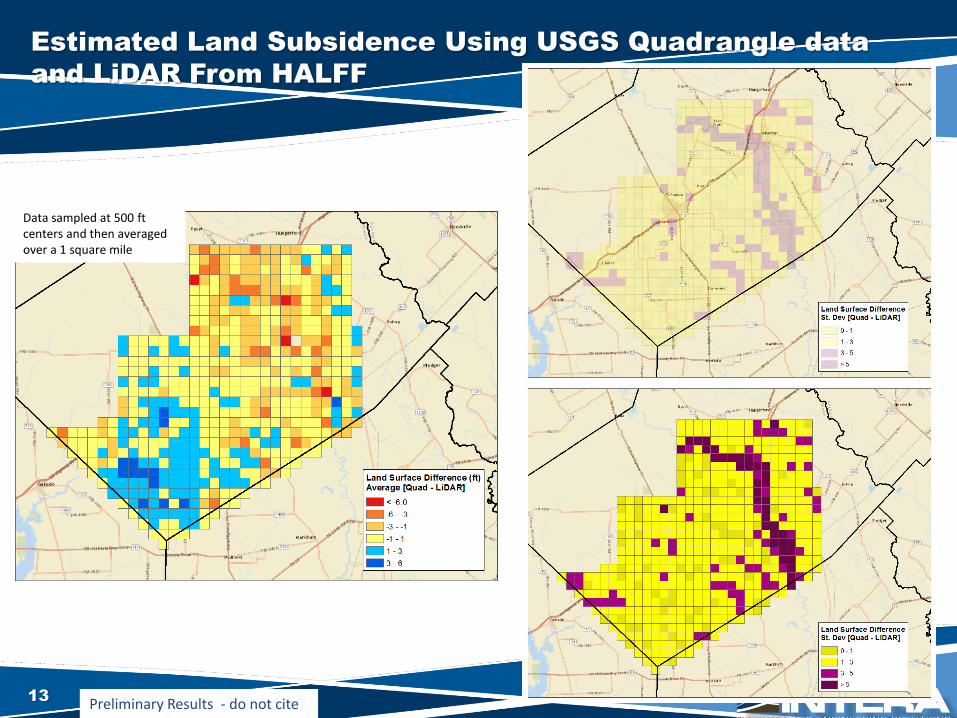
Estimated Land Subsidence Using USGS Quadrangle data
and LiDAR From HALFF
Data sampled at 500 ftcenters and then averaged over a 1 square mile
Preliminary Results - do not cite
14
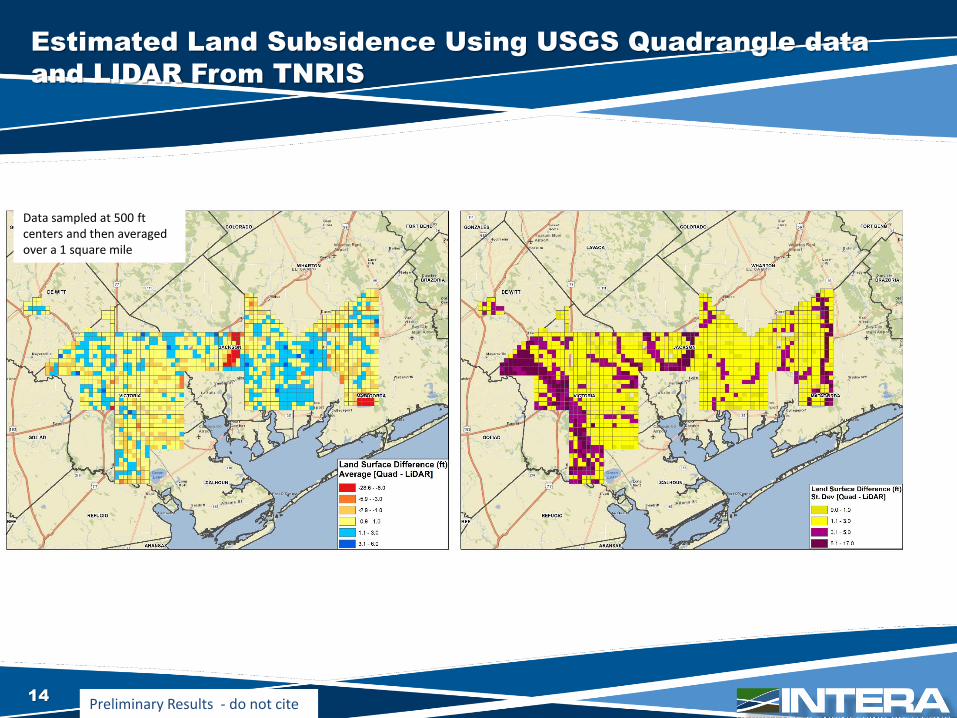
Estimated Land Subsidence Using USGS Quadrangle data
and LIDAR From TNRIS
Data sampled at 500 ftcenters and then averaged over a 1 square mile
Preliminary Results - do not cite

15
Summary
Land subsidence has occurred during last 70 years
Analysis of PID and LIDAR data• Time period from <1950 to >2010
• Most of Wharton County has experienced about 1 foot of subsidence has occurred
• Maximum subsidence occurred in southwest quadrant and is about 5 ftat a point and about 2.5 feet across a the area
• Error estimated at ±0.5 feet
Analysis of Quadrangle and LIDAR data• Time period from 1950-1960 to > 2010
• Not reliable near streams
• Indicates a smaller area in Wharton has experienced subsidence than the point data – Quadrangle data may be biased low 1-2 feet
• Maximum subsidence occurred in southwest quadrant and is about 5.5 ftat a point and about 2.5 feet across the area
• Error estimated at ±1.5 feet in area away from streams
Preliminary Results - do not cite