estimating aboveground biomass on forest land in the pacific
TRANSCRIPT
United States Department of Agriculture
Forest Service
Pacific Southwest Research Station
Research PaperPNW-RP-584November 2009
Estimating Aboveground Tree Biomass on Forest Land in the Pacific Northwest: A Comparison of ApproachesXiaoping Zhou and Miles A. Hemstrom
The Forest Service of the U.S. Department of Agriculture is dedicated to the principle of multiple use management of the Nation’s forest resources for sustained yields of wood, water, forage, wildlife, and recreation. Through forestry research, cooperation with the States and private forest owners, and management of the National Forests and National Grasslands, it strives—as directed by Congress—to provide increasingly greater service to a growing Nation.
The U.S. Department of Agriculture (USDA) prohibits discrimination in all its programs and activities on the basis of race, color, national origin, age, disability, and where applicable, sex, marital status, familial status, parental status, religion, sexual orientation, genetic information, political beliefs, reprisal, or because all or part of an individual’s income is derived from any public assistance program. (Not all prohibited bases apply to all programs.) Persons with disabilities who require alternative means for communication of program information (Braille, large print, audiotape, etc.) should contact USDA’s TARGET Center at (202) 720-2600 (voice and TDD). To file a complaint of discrimination, write USDA, Director, Office of Civil Rights, 1400 Independence Avenue, SW, Washington, DC 20250-9410 or call (800) 795-3272 (voice) or (202) 720-6382 (TDD). USDA is an equal opportunity provider and employer.
Authors Xiaoping Zhou is a forester and Miles A. Hemstrom is a research ecologist, Forestry Sciences Laboratory, P.O. Box 3890, Portland, OR 97208-3890.
AbstractZhou, Xiaoping; Hemstrom, Miles A. 2009. Estimating aboveground tree
biomass on forest land in the Pacific Northwest: a comparison of approaches. Res. Pap. PNW-RP-584. Portland, OR: U.S. Department of Agriculture, Forest Service, Pacific Northwest Research Station. 18 p.
Live tree biomass estimates are essential for carbon accounting, bioenergy feasi-bility studies, and other analyses. Several models are currently used for estimating tree biomass. Each of these incorporates different calculation methods that may significantly impact the estimates of total aboveground tree biomass, merchantable biomass, and carbon pools. Consequently, carbon markets, bioenergy projects, and similar efforts may be affected. In addition to differences in allometric equations, the various methods are most suitable for particular geographic scales of analysis. We examine three approaches that might be used for midscale analyses (e.g., 25,000 to several million acres) and compare the regional models with equations developed by Jenkins et al. and with the component ratio method (CRM). These three methods produce relatively similar estimates of total aboveground biomass for softwood species in Oregon, but substantially different estimates for the proportion of total biomass that is merchantable. For the major softwood species in Oregon, the total aboveground biomass using the CRM is 3 percent lower than estimates with regional equations, and the Jenkins models produce estimates that are 17 percent higher. However, on average, the proportion of softwood merchant-able biomass computed with CRM is about 83 percent of the total aboveground biomass with little variation from species to species, whereas regional models estimate that 72 percent is merchantable, and the Jenkins equations estimate that 78 percent is merchantable.
Keywords: Biomass equations, Jenkins equations, component ratio method, forest inventory.

1
Estimating Aboveground Tree Biomass on Forest Land in the Pacific Northwest: A Comparison of Approaches
IntroductionReasonable methods for estimating tree biomass and carbon stocks1 on forest land are increasingly important given concerns of global climate change, increasing interest in bioenergy projects, and carbon sequestration protocols for the voluntary and regulated markets. During the last two decades, scientists in the U.S. Depart-ment of Agriculture, Forest Service have put considerable effort into developing models for estimating tree biomass and carbon stock over areas as large as the entire United States. However, applying those broad-scale models to regional or fine-scale analyses can be challenging. For example, broad-scale estimates of merchantable tree biomass based on lumping many species may differ considerably from estimates made with more regionally representative models, and the potential success of a bioenergy project might hinge on these differences. Therefore, under-standing the potential alternative approaches for estimating forest biomass is very important for local analyses of biomass supply and forest carbon accounting. We review some of the current methods of calculating aboveground live tree biomass that might be used in the Pacific Northwest and compare the differences when they are applied to Forest Inventory and Analysis (FIA) tree data in Oregon. The three most common softwood tree species were analyzed: Douglas-fir (Pseudotsuga menziesii (Mirb.) Franco), western hemlock (Tsuga heterophylla (Raf.) Sarg.), and ponderosa pine (Pinus ponderosa C. Lawson).
Current Tree Biomass Calculation Methods Applied on Forest Land in United StatesVarious tree biomass calculation methods are applied on forest lands in the United States depending on scale of analysis, need for detail, user group interest, and purpose. The USDA Forest Service has used the Jenkins equation system (Jenkins et al. 2003, 2004) in recent years to assess national-scale biomass and for forest car-bon estimates used in official greenhouse gas inventories of the United States (US EPA 2008). The Jenkins model was originally designed for national-scale biomass estimation, but the differences in equation forms and species groupings may cause differences at fine scales depending on tree size and forest species composition (Jenkins et al. 2003). Regional models are usually tree species-specific based on various local tree studies, and result in different biomass estimation models for
1 In general, we calculate biomass to estimate carbon stock (C) and carbon dioxide ( CO2 ) emission equivalent: 1 unit of biomass = 0.5 unit carbon stored, and 1 unit carbon stored = 3.67 units CO2 emission equivalent.
2
RESEARCH PAPER PNW-RP-584
different FIA regions.2 But the regional models lack consistent methodology and component definitions, which makes them difficult to use for national estimates. National consistency has become a prime concern within FIA (Hansen 2002). Therefore, the national forest resources report for the Resources Planning Act has used the component ratio method (CRM) to estimate tree biomass for consistency across regions, and the CRM approach will be applied to FIA tree data for future biomass reporting (Heath et al. 2008). The objective of CRM is to get national biomass and carbon estimates that are consistent with FIA tree volume estimates (Heath et al. 2008). However, these methods produce generalized biomass estimates when compared to more local and detailed allometric equations. Users should understand the differences between estimates made with broad-scale methods and equations compared to regional representative equations and choose methods appropriate to their questions and scale of use.
Live tree biomass is generally divided into five major components, including merchantable stem biomass (also called bole biomass including both bark and wood), stump biomass, foliage biomass, branches/top biomass, and root biomass. We focus on aboveground live tree biomass estimation including stump, stem, branch, and top.
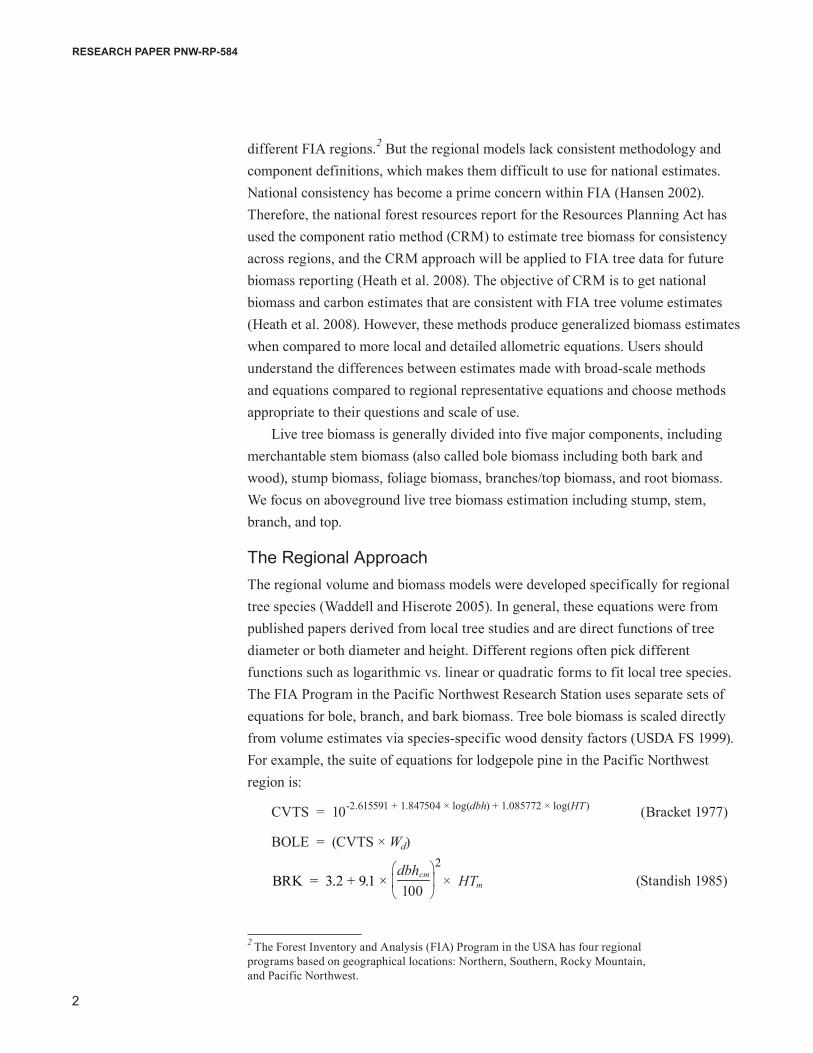
The Regional ApproachThe regional volume and biomass models were developed specifically for regional tree species (Waddell and Hiserote 2005). In general, these equations were from published papers derived from local tree studies and are direct functions of tree diameter or both diameter and height. Different regions often pick different functions such as logarithmic vs. linear or quadratic forms to fit local tree species. The FIA Program in the Pacific Northwest Research Station uses separate sets of equations for bole, branch, and bark biomass. Tree bole biomass is scaled directly from volume estimates via species-specific wood density factors (USDA FS 1999). For example, the suite of equations for lodgepole pine in the Pacific Northwest region is:
CVTS = 10-2.615591 + 1.847504 × log(dbh) + 1.085772 × log(HT) (Bracket 1977)
BOLE = (CVTS × Wd)
2 The Forest Inventory and Analysis (FIA) Program in the USA has four regional programs based on geographical locations: Northern, Southern, Rocky Mountain, and Pacific Northwest.
BRK = 3.2 + 9.1 ×
2dbhcm
100× HTm (Standish 1985)
3
Estimating Aboveground Tree Biomass on Forest Land in the Pacific Northwest: A Comparison of Approaches
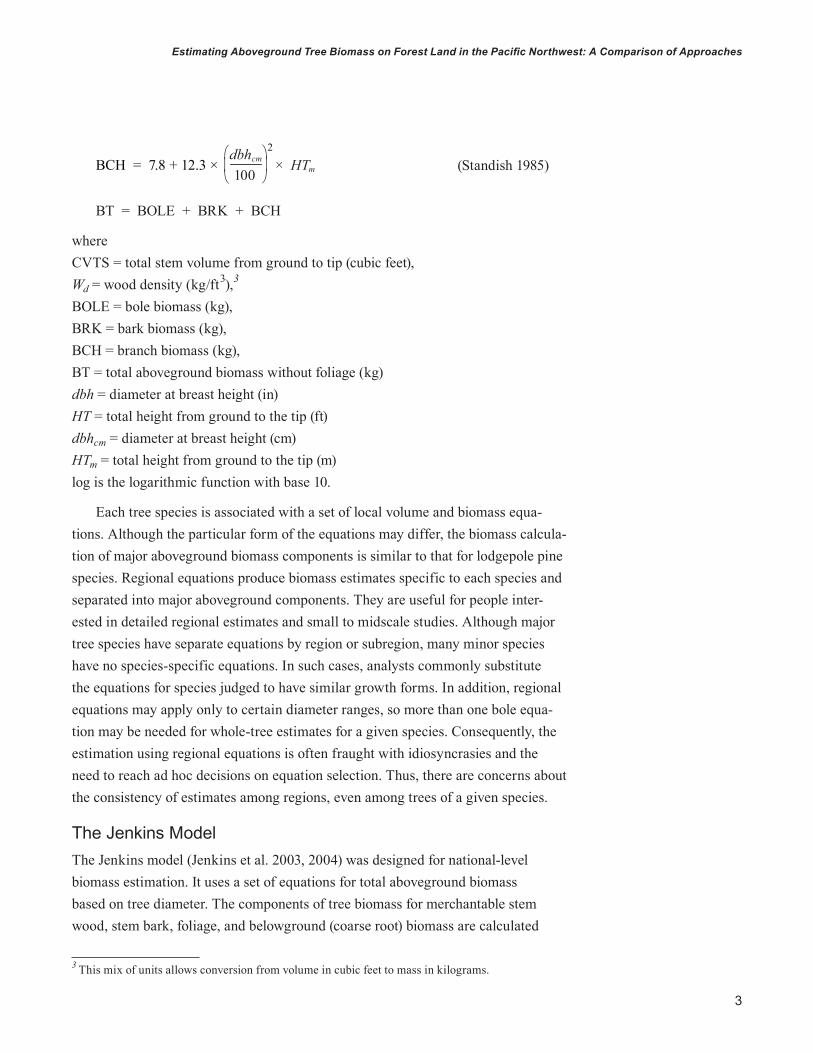
BT = BOLE + BRK + BCH
where CVTS = total stem volume from ground to tip (cubic feet),Wd = wood density (kg/ft3),3 BOLE = bole biomass (kg),BRK = bark biomass (kg),BCH = branch biomass (kg),BT = total aboveground biomass without foliage (kg)dbh = diameter at breast height (in)HT = total height from ground to the tip (ft)dbhcm = diameter at breast height (cm) HTm = total height from ground to the tip (m) log is the logarithmic function with base 10.
Each tree species is associated with a set of local volume and biomass equa-tions. Although the particular form of the equations may differ, the biomass calcula-tion of major aboveground biomass components is similar to that for lodgepole pine species. Regional equations produce biomass estimates specific to each species and separated into major aboveground components. They are useful for people inter-ested in detailed regional estimates and small to midscale studies. Although major tree species have separate equations by region or subregion, many minor species have no species-specific equations. In such cases, analysts commonly substitute the equations for species judged to have similar growth forms. In addition, regional equations may apply only to certain diameter ranges, so more than one bole equa-tion may be needed for whole-tree estimates for a given species. Consequently, the estimation using regional equations is often fraught with idiosyncrasies and the need to reach ad hoc decisions on equation selection. Thus, there are concerns about the consistency of estimates among regions, even among trees of a given species.
The Jenkins ModelThe Jenkins model (Jenkins et al. 2003, 2004) was designed for national-level biomass estimation. It uses a set of equations for total aboveground biomass based on tree diameter. The components of tree biomass for merchantable stem wood, stem bark, foliage, and belowground (coarse root) biomass are calculated
3 This mix of units allows conversion from volume in cubic feet to mass in kilograms.
BCH = 7.8 + 12.3 ×
2dbhcm
100× HTm (Standish 1985)
4
RESEARCH PAPER PNW-RP-584
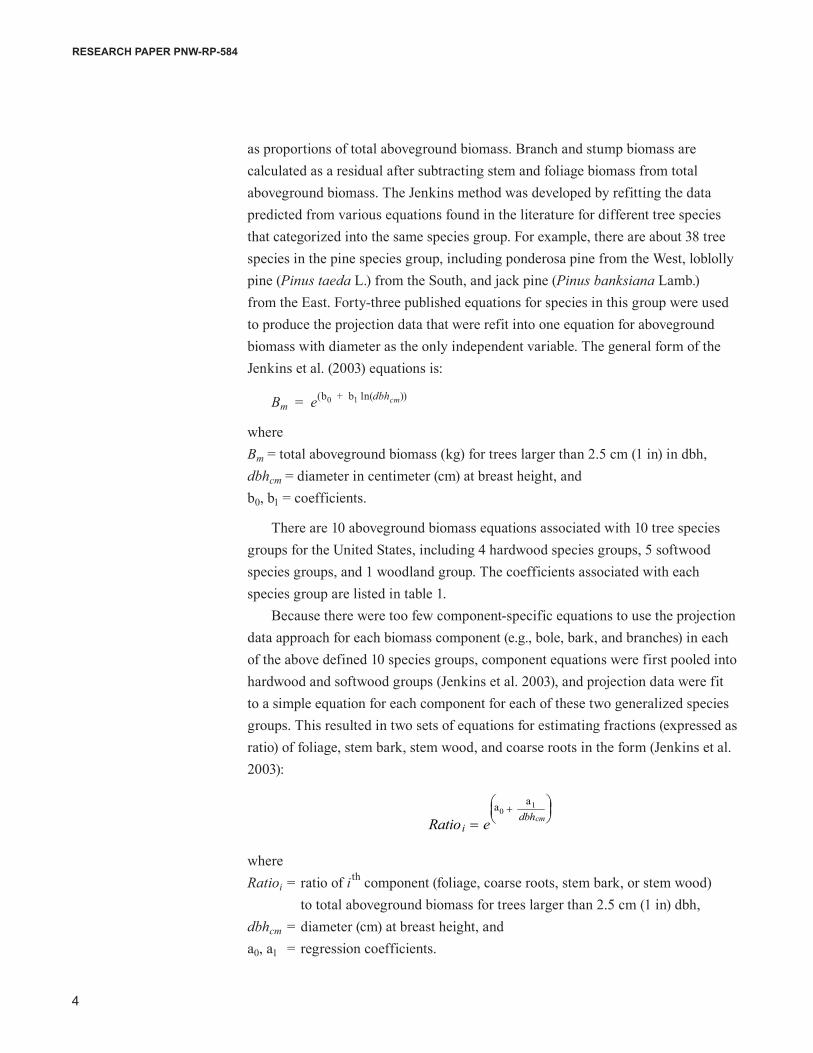
as proportions of total aboveground biomass. Branch and stump biomass are calculated as a residual after subtracting stem and foliage biomass from total aboveground biomass. The Jenkins method was developed by refitting the data predicted from various equations found in the literature for different tree species that categorized into the same species group. For example, there are about 38 tree species in the pine species group, including ponderosa pine from the West, loblolly pine (Pinus taeda L.) from the South, and jack pine (Pinus banksiana Lamb.) from the East. Forty-three published equations for species in this group were used to produce the projection data that were refit into one equation for aboveground biomass with diameter as the only independent variable. The general form of the Jenkins et al. (2003) equations is:
Bm = e(b0 + b1 ln(dbhcm))
where Bm = total aboveground biomass (kg) for trees larger than 2.5 cm (1 in) in dbh, dbhcm = diameter in centimeter (cm) at breast height, andb0, b1 = coefficients.
There are 10 aboveground biomass equations associated with 10 tree species groups for the United States, including 4 hardwood species groups, 5 softwood species groups, and 1 woodland group. The coefficients associated with each species group are listed in table 1.
Because there were too few component-specific equations to use the projection data approach for each biomass component (e.g., bole, bark, and branches) in each of the above defined 10 species groups, component equations were first pooled into hardwood and softwood groups (Jenkins et al. 2003), and projection data were fit to a simple equation for each component for each of these two generalized species groups. This resulted in two sets of equations for estimating fractions (expressed as ratio) of foliage, stem bark, stem wood, and coarse roots in the form (Jenkins et al. 2003):
cmdbhaa
i eRatio1
0
where Ratioi = ratio of i th component (foliage, coarse roots, stem bark, or stem wood) to total aboveground biomass for trees larger than 2.5 cm (1 in) dbh,dbhcm = diameter (cm) at breast height, anda0, a1 = regression coefficients.
5
Estimating Aboveground Tree Biomass on Forest Land in the Pacific Northwest: A Comparison of Approaches
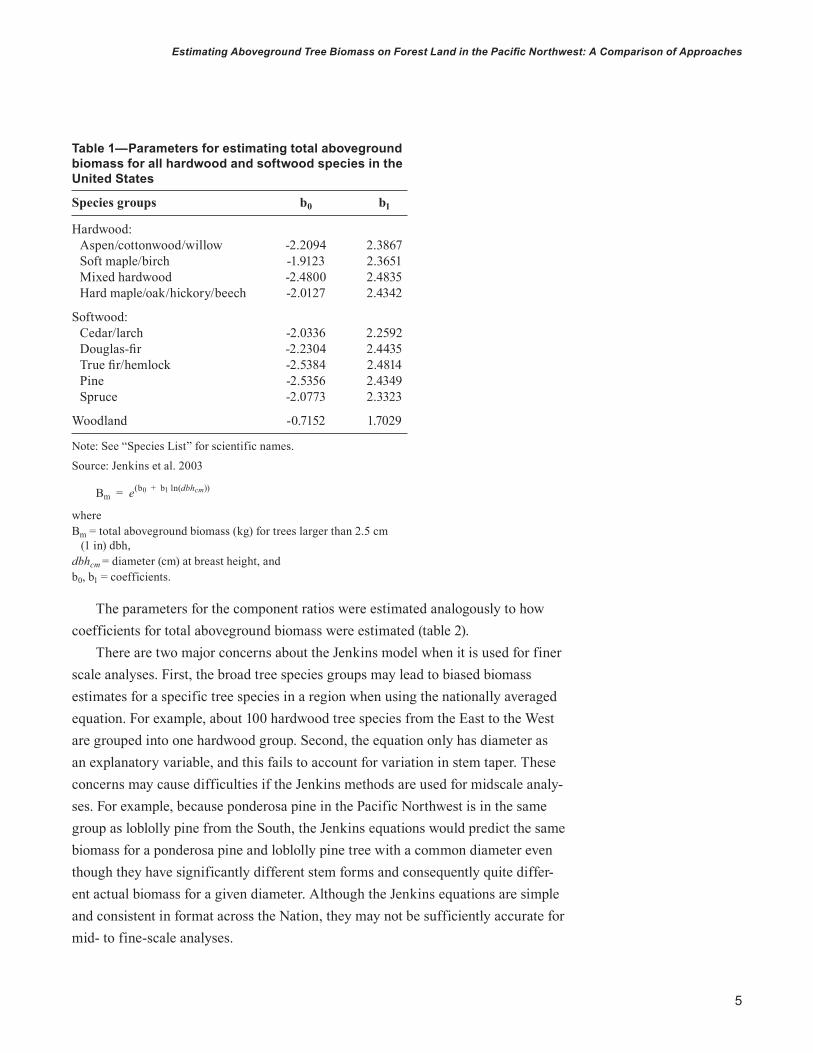
Table 1—Parameters for estimating total aboveground biomass for all hardwood and softwood species in the United States
Species groups b0 b1
Hardwood: Aspen/cottonwood/willow -2.2094 2.3867 Soft maple/birch -1.9123 2.3651 Mixed hardwood -2.4800 2.4835 Hard maple/oak/hickory/beech -2.0127 2.4342
Softwood: Cedar/larch -2.0336 2.2592 Douglas-fir -2.2304 2.4435 Truefir/hemlock -2.5384 2.4814 Pine -2.5356 2.4349 Spruce -2.0773 2.3323
Woodland -0.7152 1.7029
Note: See “Species List” for scientific names.
Source: Jenkins et al. 2003
Bm = e(b0 + b1 ln(dbhcm))
where Bm = total aboveground biomass (kg) for trees larger than 2.5 cm (1 in) dbh, dbhcm = diameter (cm) at breast height, andb0, b1 = coefficients.
The parameters for the component ratios were estimated analogously to how coefficients for total aboveground biomass were estimated (table 2).
There are two major concerns about the Jenkins model when it is used for finer scale analyses. First, the broad tree species groups may lead to biased biomass estimates for a specific tree species in a region when using the nationally averaged equation. For example, about 100 hardwood tree species from the East to the West are grouped into one hardwood group. Second, the equation only has diameter as an explanatory variable, and this fails to account for variation in stem taper. These concerns may cause difficulties if the Jenkins methods are used for midscale analy-ses. For example, because ponderosa pine in the Pacific Northwest is in the same group as loblolly pine from the South, the Jenkins equations would predict the same biomass for a ponderosa pine and loblolly pine tree with a common diameter even though they have significantly different stem forms and consequently quite differ-ent actual biomass for a given diameter. Although the Jenkins equations are simple and consistent in format across the Nation, they may not be sufficiently accurate for mid- to fine-scale analyses.
6
RESEARCH PAPER PNW-RP-584
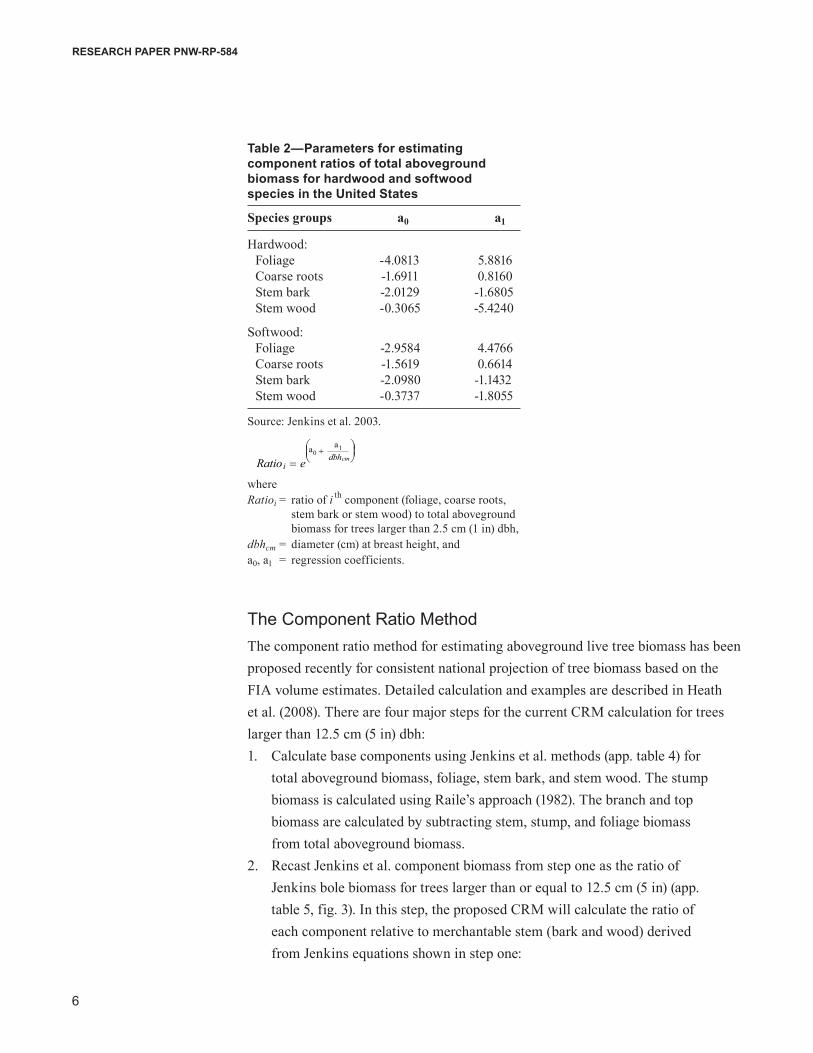
Table 2—Parameters for estimating component ratios of total aboveground biomass for hardwood and softwood species in the United States
Species groups a0 a1
Hardwood: Foliage -4.0813 5.8816 Coarse roots -1.6911 0.8160 Stem bark -2.0129 -1.6805 Stem wood -0.3065 -5.4240
Softwood: Foliage -2.9584 4.4766 Coarse roots -1.5619 0.6614 Stem bark -2.0980 -1.1432 Stem wood -0.3737 -1.8055
Source: Jenkins et al. 2003.
where Ratioi
= ratio of i th component (foliage, coarse roots, stem bark or stem wood) to total aboveground biomass for trees larger than 2.5 cm (1 in) dbh,dbhcm = diameter (cm) at breast height, anda0, a1 = regression coefficients.
The Component Ratio MethodThe component ratio method for estimating aboveground live tree biomass has been proposed recently for consistent national projection of tree biomass based on the FIA volume estimates. Detailed calculation and examples are described in Heath et al. (2008). There are four major steps for the current CRM calculation for trees larger than 12.5 cm (5 in) dbh:1. Calculate base components using Jenkins et al. methods (app. table 4) for
total aboveground biomass, foliage, stem bark, and stem wood. The stump biomass is calculated using Raile’s approach (1982). The branch and top biomass are calculated by subtracting stem, stump, and foliage biomass from total aboveground biomass.
2. Recast Jenkins et al. component biomass from step one as the ratio of Jenkins bole biomass for trees larger than or equal to 12.5 cm (5 in) (app. table 5, fig. 3). In this step, the proposed CRM will calculate the ratio of each component relative to merchantable stem (bark and wood) derived from Jenkins equations shown in step one:
cmdbhaa
i eRatio1
0
7
Estimating Aboveground Tree Biomass on Forest Land in the Pacific Northwest: A Comparison of Approaches
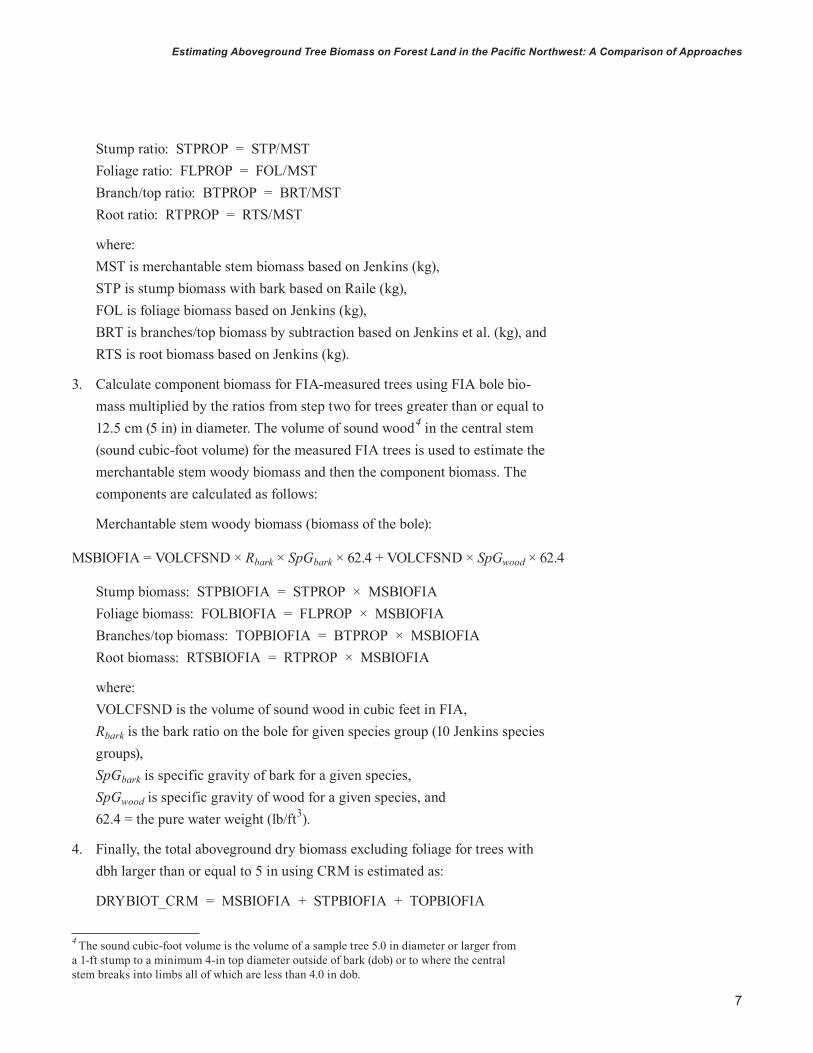
Stump ratio: STPROP = STP/MST Foliage ratio: FLPROP = FOL/MST Branch/top ratio: BTPROP = BRT/MST Root ratio: RTPROP = RTS/MST
where: MST is merchantable stem biomass based on Jenkins (kg), STP is stump biomass with bark based on Raile (kg),FOL is foliage biomass based on Jenkins (kg),BRT is branches/top biomass by subtraction based on Jenkins et al. (kg), andRTS is root biomass based on Jenkins (kg).
3. Calculate component biomass for FIA-measured trees using FIA bole bio-mass multiplied by the ratios from step two for trees greater than or equal to 12.5 cm (5 in) in diameter. The volume of sound wood4 in the central stem (sound cubic-foot volume) for the measured FIA trees is used to estimate the merchantable stem woody biomass and then the component biomass. The components are calculated as follows:
Merchantable stem woody biomass (biomass of the bole):
MSBIOFIA = VOLCFSND × Rbark × SpGbark × 62.4 + VOLCFSND × SpGwood × 62.4
Stump biomass: STPBIOFIA = STPROP × MSBIOFIAFoliage biomass: FOLBIOFIA = FLPROP × MSBIOFIABranches/top biomass: TOPBIOFIA = BTPROP × MSBIOFIARoot biomass: RTSBIOFIA = RTPROP × MSBIOFIA
where: VOLCFSND is the volume of sound wood in cubic feet in FIA,Rbark is the bark ratio on the bole for given species group (10 Jenkins species groups),SpGbark is specific gravity of bark for a given species, SpGwood is specific gravity of wood for a given species, and 62.4 = the pure water weight (lb/ft3).
4. Finally, the total aboveground dry biomass excluding foliage for trees with dbh larger than or equal to 5 in using CRM is estimated as:
DRYBIOT_CRM = MSBIOFIA + STPBIOFIA + TOPBIOFIA
4 The sound cubic-foot volume is the volume of a sample tree 5.0 in diameter or larger from a 1-ft stump to a minimum 4-in top diameter outside of bark (dob) or to where the central stem breaks into limbs all of which are less than 4.0 in dob.
8
RESEARCH PAPER PNW-RP-584
Although this hybrid model appears promising in concept as currently used, its limitations resemble those of the Jenkins method when used for mid- and fine-scale analysis. In large part, this is because the method uses only the two sets of coef-ficients from the Jenkins method for component ratios. For example, the foliage component ratios will be the same for all species within softwood or hardwood groups for a given dbh. There are 10 stump ratio equations and 10 branch/top ratio equations corresponding to 10 Jenkins species groups for total aboveground biomass. However, the sum of the stump ratio and branch/top ratio collapse to two generic softwood and hardwood groups (appendix). The merchantable biomass ratio calculated with CRM will also be the same for all softwoods and all hardwoods even though they are based on the sound volumes from individually measured trees (see appendix for calculation details).
Comparison of Biomass Estimates Using Measured Tree DataOver 50 tree species contribute to total biomass and sound wood volume on FIA plots in Oregon. Douglas-fir, ponderosa pine, and western hemlock are the most abundant of those species. Douglas-fir contributes about 51 percent of total above- ground biomass of trees larger than 12.5 cm (5 in) dbh on forest land in Oregon, and western hemlock and ponderosa pine contribute around 8 percent each. Hardwoods contribute a relatively minor amount to aboveground live tree biomass statewide; more than 90 percent is from softwood species.
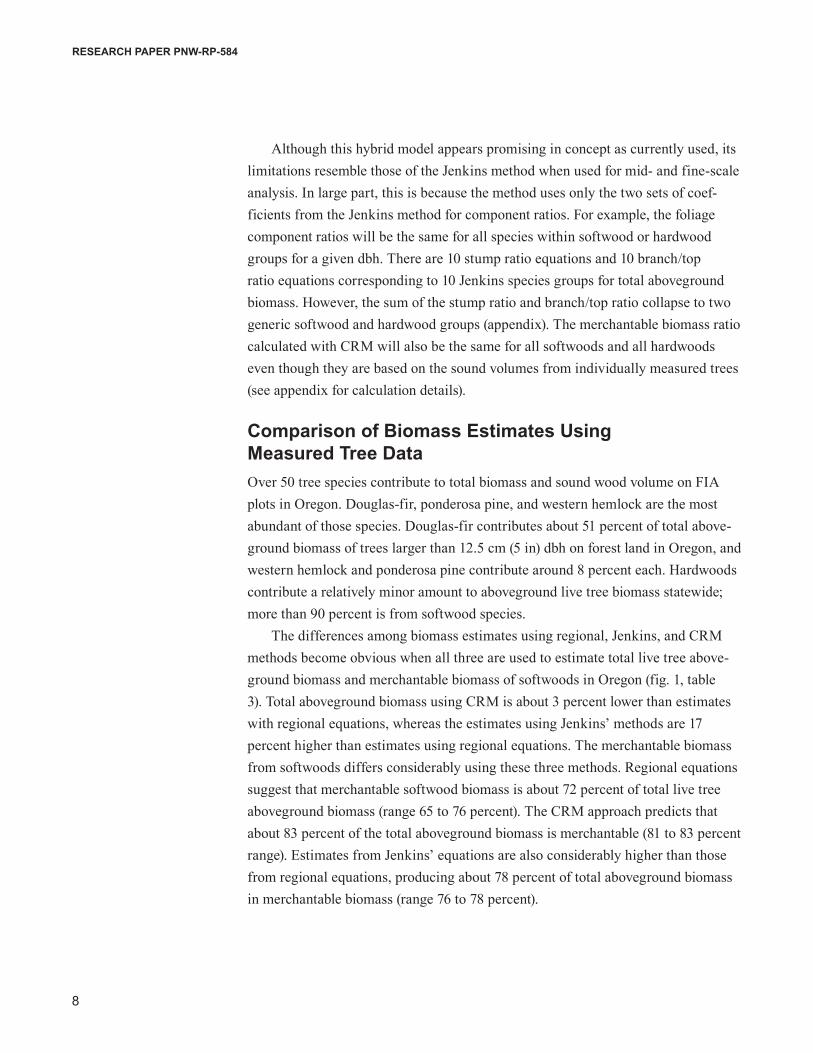
The differences among biomass estimates using regional, Jenkins, and CRM methods become obvious when all three are used to estimate total live tree above-ground biomass and merchantable biomass of softwoods in Oregon (fig. 1, table 3). Total aboveground biomass using CRM is about 3 percent lower than estimates with regional equations, whereas the estimates using Jenkins’ methods are 17 percent higher than estimates using regional equations. The merchantable biomass from softwoods differs considerably using these three methods. Regional equations suggest that merchantable softwood biomass is about 72 percent of total live tree aboveground biomass (range 65 to 76 percent). The CRM approach predicts that about 83 percent of the total aboveground biomass is merchantable (81 to 83 percent range). Estimates from Jenkins’ equations are also considerably higher than those from regional equations, producing about 78 percent of total aboveground biomass in merchantable biomass (range 76 to 78 percent).
9
Estimating Aboveground Tree Biomass on Forest Land in the Pacific Northwest: A Comparison of Approaches
0
10
20
30
40
50
60
70
80
90
100
Diameter group (inches)
Mer
chan
tabl
e bi
omas
s (p
erce
nt)
Regional Douglas-fir
Regional western hemlock
Regional ponderosa CRM softwoods
Jenkins softwoods
5 to 7
7 to 9
9 to 1
1
11 to
13
13 to
15
15 to
17
17 to
19
19 to
21
21 to
29
29 pl
us
Table 3—Aboveground biomass for trees at least 5 inches dbh on forest land in Oregon by major species
Regional Jenkins CRM Merch to total
Species Total Merch Total Merch Total Merch Regional Jenkins CRM
- - - - - - - - - - - - - - Million tons - - - - - - - - - - - - - - - - - - - Percent - - - - - Douglas-fir 899 684 1,094 858 888 738 76 78 83Ponderosa pine 153 104 190 148 148 122 68 78 83Western hemlock 145 98 130 101 135 112 67 78 83Whitefir 74 43 81 63 62 52 58 78 83Grandfir 52 37 70 54 54 44 72 78 83Mountain hemlock 50 35 62 48 48 40 70 78 83Lodgepole pine 44 31 50 38 47 38 70 76 81Other softwood 203 132 216 168 183 150 65 78 82
Total softwood 1,620 1,164 1,893 1,478 1,565 1,296 72 78 83
Note: CRM = Component Ratio Method, merch = merchantable.
The ratio of merchantable to total aboveground biomass increases with diam-eter for all three methods. The ratios from CRM and Jenkins’ equations follow the same trajectory with little variation by softwood species trees across diameter classes (fig. 1). In fact, the component ratios are the same within the group contain-ing all softwood species and within the group containing all hardwood species for a given diameter using the CRM approach (appendix). Conversely, the ratio changes significantly among species across diameter groups with regional equations.
Figure 1— Merchantable biomass as a percentage of total aboveground biomass without foliage in Oregon. CRM = component ratio method.
10
RESEARCH PAPER PNW-RP-584
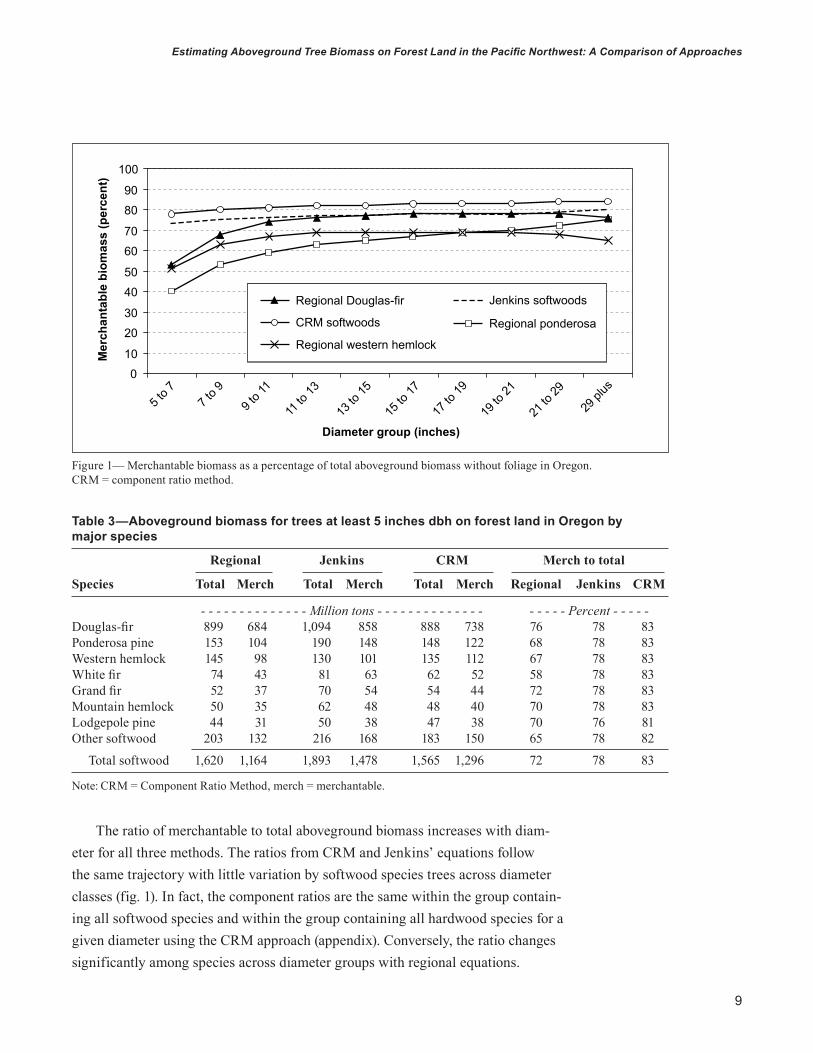
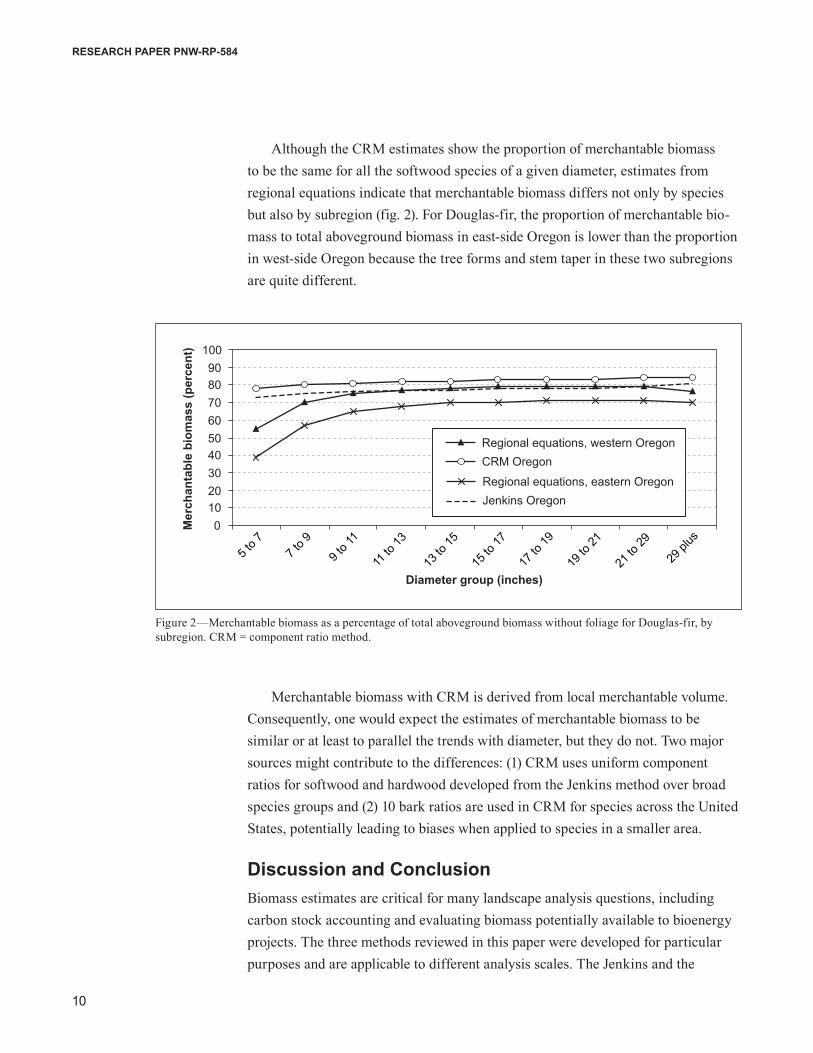
Although the CRM estimates show the proportion of merchantable biomass to be the same for all the softwood species of a given diameter, estimates from regional equations indicate that merchantable biomass differs not only by species but also by subregion (fig. 2). For Douglas-fir, the proportion of merchantable bio-mass to total aboveground biomass in east-side Oregon is lower than the proportion in west-side Oregon because the tree forms and stem taper in these two subregions are quite different.
0102030405060708090
100
Diameter group (inches)
Mer
chan
tabl
e bi
omas
s (p
erce
nt)
Regional equations, western Oregon
Regional equations, eastern Oregon
CRM Oregon
Jenkins Oregon
5 to 7
7 to 9
9 to 1
1
11 to
13
13 to
15
15 to
17
17 to
19
19 to
21
21 to
29
29 pl
us
Figure 2—Merchantable biomass as a percentage of total aboveground biomass without foliage for Douglas-fir, by subregion. CRM = component ratio method.
Merchantable biomass with CRM is derived from local merchantable volume. Consequently, one would expect the estimates of merchantable biomass to be similar or at least to parallel the trends with diameter, but they do not. Two major sources might contribute to the differences: (1) CRM uses uniform component ratios for softwood and hardwood developed from the Jenkins method over broad species groups and (2) 10 bark ratios are used in CRM for species across the United States, potentially leading to biases when applied to species in a smaller area.
Discussion and ConclusionBiomass estimates are critical for many landscape analysis questions, including carbon stock accounting and evaluating biomass potentially available to bioenergy projects. The three methods reviewed in this paper were developed for particular purposes and are applicable to different analysis scales. The Jenkins and the
11
Estimating Aboveground Tree Biomass on Forest Land in the Pacific Northwest: A Comparison of Approaches
component ratio methods were targeted at broad-scale analyses across collections of states or the entire United States. At those scales, detailed information about differ-ences among tree species and across smaller geographic areas may not be necessary for assessments of sufficient accuracy to address issues. In addition, the many equa-tions used to calculate biomass locally are inconsistent, even for the same species, across larger areas. Unfortunately, these broad-scale methods may be used more generally to compute biomass at a variety of scales and may, at least in our example, produce biomass estimates that are significantly different from local estimates at least for some diameter classes.
We found, in fact, that both the Jenkins and CRM methods estimate higher merchantable biomass, especially in smaller diameter classes, compared to esti-mates made with regionally derived equations. Jenkins and CRM estimate about 11 to 13 percent more merchantable volume for softwood biomass in Oregon than the regional equations. This difference may or may not be significant at the national scale, and to determine this would likely require a comprehensive comparison using hundreds of regional equations. However, the differences at local scale, for example as when analyzing the carbon dynamics of a proposed management regime on an ownership or watershed, or assessing a bioenergy project where profit margins are slim, could profoundly affect outcomes. We found that the Jenkins methods esti-mated about 17 percent more live tree aboveground softwood biomass and carbon stock in Oregon compared to that using regional equations, whereas CRM estimates were about 3 percent lower than regional estimates. It is unclear to what extent carbon flux assessed as stock change would be biased by the use of CRM.
Although it may be true that there is inconsistency of equation forms and component definitions among regions, the regional models use the results of local species studies and published equations, which will be more suitable for analyses of mid- and fine-scale landscapes. Although the Jenkins equations are very simple and easy to use, the results may be misleading when applied at fine scales. The CRM is a promising approach and may alleviate consistency problems associated with regional equations while providing refinement to the generalized Jenkins approach. However, the current CRM process uses homogeneous ratios for all softwoods and all hardwoods even though they use the locally estimated volumes. Given the highly variable form and taper of different tree species, this simplification overestimates biomass for some species and underestimates for others. Additional work to include more species and regional variability might considerably improve CRM results and could provide reasonable national-scale estimates while maintaining simplicity and consistency. In addition, analyses of biomass and carbon at the mid and fine scales (25,000 to several million acres) might better use locally derived biomass equations,

12
RESEARCH PAPER PNW-RP-584
especially if the results will be used to evaluate bioenergy projects or carbon markets where differences of a few percentage points could be important.
AcknowledgmentsThis work was supported by funding from the USDA Forest Service, Pacific Northwest Research Station.
Metric EquivalentsWhen you know Multiply by: To get:
Acres (ac) 0.405 Hectares (ha)Feet (ft) 0.305 Meters (m)Cubic feet (ft3) 0.0283 Cubic meters (m3)Inches (in) 2.54 Centimeters (cm)Pounds (lb) 0.454 Kilograms (kg)Tons 0.907 Metric tonnesPounds per cubic foot (lb/ft3) 16.02 Kilograms per cubic meter (kg/m3)
Species ListCommon name Scientific name
Aspen Populus grandidentata MichxBeech Fagus L.Birch Betula L.Cedar Chamaecyparis SpachCottonwood Populus L.Douglas-fir Pseudotsuga menziesii (Mirb.) FrancoGrand fir Abies grandis (Douglas ex D. Don) Lindl.Hickory Carya Nutt.Jack pine Pinus banksiana Lamb.Larch Larix Mill.Loblolly pine Pinus taeda L.Lodgepole pine Pinus contorta Douglas ex LoudenMaple Acer L.Mountain hemlock Tsuga mertensiana (Bong.) CarrièreOak Quercus L.Ponderosa pine Pinus ponderosa C. LawsonSpruce Picea A. Dietr.True fir Abies Mill.Western hemlock Tsuga heterophylla (Raf.) Sarg.White fir Abies concolor (Gord. & Glend.) Lindl. ex Hildebr.Willow Salix bicolor Fr.
13
Estimating Aboveground Tree Biomass on Forest Land in the Pacific Northwest: A Comparison of Approaches
ReferencesBrackett, M. 1977. Notes on TARIF tree-volume computation. DNR Rep. 24.
Olympia, WA: Washington Department of Natural Resources. 132 p.
Hansen, M. 2002. Volume and biomass estimation in FIA: national consistency vs. regional accuracy. In: McRoberts, R.E.; Reams, G.A.; Van Deusen, P.C.; Moser, J.W., eds. Proceedings of the third annual Forest Inventory and Analysis symposium. Gen. Tech. Rep. NC-230. St. Paul, MN: U.S. Department of Agriculture, Forest Service, North Central Research Station: 109–120.
Heath, L.S.; Hansen, M.H.; Smith, J.E.; Smith, W.B.; Miles, P.D. 2008. Investigation into calculating tree biomass and carbon in the FIADB using a biomass expansion factor approach, In: McWilliams, W.; Moisen, G.; Czaplewski, R., comps. 2008 Forest Inventory and Analysis (FIA) symposium. Proc. RMRS-P-56CD. Fort Collins, CO: U.S. Department of Agriculture, Forest Service, Rocky Mountain Research Station. [CD–ROM].
Jenkins, J.C.; Chojnacky, D.C.; Heath, L.S.; Birdsey, R.A. 2003. National-scale biomass estimators for United States tree species. Forest Science. 49: 12–35.
Jenkins, J.C.; Chojnacky, D.C.; Heath, L.S.; Birdsey, R.A. 2004. A comprehensive database of biomass regressions for North American tree species. Gen. Tech. Rep. NE-319. Newtown Square, PA: U.S. Department of Agriculture, Forest Service, Northeastern Research Station. 45 p. [CD-ROM].
Raile, G.K. 1982. Estimating stump volume. Res. Pap. NC-224. St. Paul, MN: U.S. Department of Agriculture, Forest Service, North Central Forest Experiment Station. 4 p.
Standish, J.T.; Manning, G.H.; Demaerschalk, J.P. 1985. Development of biomass equations for British Columbia tree species. Information Report BC-X-264.CanadianForestService,PacificForestResourceCenter.47p.
Summerfield, E.R. 1980. Volume equations for eastern Washington. Washington DepartmentofNaturalResources.Memo.3p.Onfilewith:ForestInventoryandAnalysisProgram,PacificNorthwestResearchStation,620SWMainSt.,Suite400, Portland, OR 97205.
U.S. Department of Agriculture, Forest Service [USDA FS]. 1999. Wood handbook—wood as an engineering material. Gen. Tech. Rep. FPL-GTR-113. Madison, WI: Forest Product Laboratory. 463 p
14
RESEARCH PAPER PNW-RP-584
U.S. Environmental Protection Agency [US EPA]. 2008. Inventory of U.S. greenhouse gas emissions and sinks: 1990–2006. EPA 430-R-08-005. Washington,DC:U.S.EnvironmentalProtectionAgency,Officeof Atmospheric Program. http://www.epa.gov/climatechange/emissions/downloads/08_CR.pdf (April 2009).
Waddell K.L.; Hiserote, B. 2005. The PNW–FIA integrated database user guideanddocumentation:version2.0.Internalpublication.Onfilewith: ForestInventoryandAnalysisProgram,PacificNorthwestResearchStation, 620 SW Main St., Suite 400, Portland, OR 97205. http://www.fs.fed.us/pnw/ fia/publications/data/data.shtml.(April2009).

15
Estimating Aboveground Tree Biomass on Forest Land in the Pacific Northwest: A Comparison of Approaches
Appendix: The Math Puzzle of the Current Proposed Component Ratio Method (CRM) The component ratios are the key for the success of the proposed component ratio method (CRM). The current method for calculating component ratios has some limitations. Except for the stump, the component ratios of live tree biomass are based on the total aboveground tree biomass (TAB) calculated from Jenkins et al. (2003, 2004) (table 4), and these ratios are then applied to merchantable stem biomass (MST), which is a subset of the total aboveground biomass (table 5). The Jenkins equation for total aboveground biomass can be expressed as:
TAB = e(b0 + b1 ln(dbh)) = eb0 dbhb1 (1)
Table 4—Equations used in component ratio method step one (biomass in kilograms)
Parts Explanation Equations Equation form
TAB = Total aboveground biomass 10 equations TAB = e(b0 + b1 ln(dbh))
(merchantable stem + top/limbs + stump + foliage)
MST = Merchantable stem biomass (Jenkins 2 equations MST = [e(bmb0 + bmb1/dbh + e(bmw0 + bmw1/dbh)] × TAB stem bark ratio × TAB + Jenkins stem wood ratio × TAB)
STP = Stump biomass with bark based 10 equations STP = bst1dia2[(1 – Rb) SGw + RbSGb] × 62.4/2.2 on Raile
FOL = Foliage biomass (foliage ratio × TAB) 2 equations FOL = [e(bf0 + bf 1/dbh)] × TAB
RTS = Root biomass (root ratio × TAB) 2 equations RTS = [e(br0 + br1/dbh)] × TAB
BRT = Branches/top biomass By subtraction BRT = TAB – MST – STP – FOL (TAB – MST – STP – FOL)
Note: [b0 and b1] are coefficients for estimating aboveground biomass (Jenkins) listed in table 1.[bmb0, bmb1; bmw0, bmw1] are coefficients for estimating biomass of bark and wood (Jenkins) listed in table 2 as a0 and a1.[bf0 and bf1] are coefficients for estimating foilage biomass (Jenkins) listed in table 2 as a0 and a1.[br0 and br1] are coefficients for estimating root biomass (Jenkins) listed in table 2 as a0 and a1.dbh is diameter at breast height in centimeters.[bst1] is volume coefficient of stump (Raile).Rb is stump bark ratio to total stump volume.dia is diameter at breast height in inches, dia = dbh/2.54.SG is specific gravity (w = wood, b = bark).62.4 = weight of water per cubic foot (lb/ft3).
16
RESEARCH PAPER PNW-RP-584
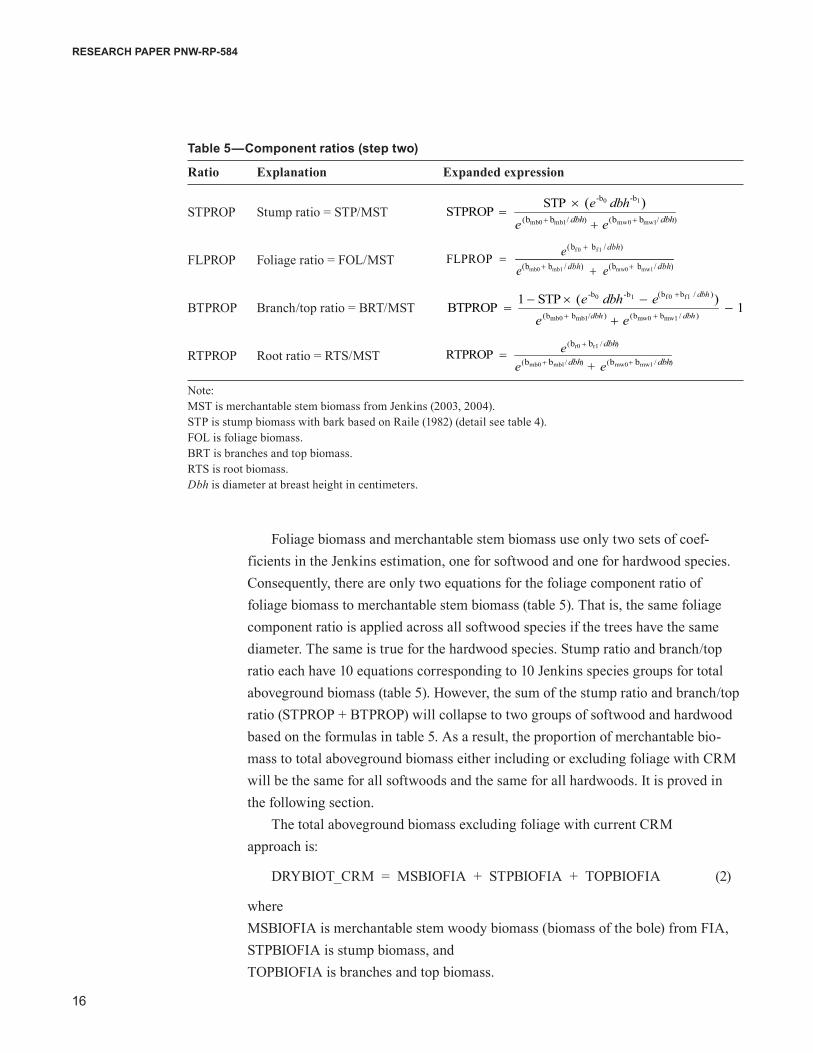
Table 5—Component ratios (step two)
Ratio Explanation Expanded expression
STPROP Stump ratio = STP/MST
FLPROP Foliage ratio = FOL/MST
BTPROP Branch/top ratio = BRT/MST
RTPROP Root ratio = RTS/MST
Note: MST is merchantable stem biomass from Jenkins (2003, 2004).STP is stump biomass with bark based on Raile (1982) (detail see table 4).FOL is foliage biomass.BRT is branches and top biomass.RTS is root biomass.Dbh is diameter at breast height in centimeters.
)/()/(
10 )(dbhbbdbhbb
-b -b
mw1mw0mb1mb0 ee
dbheSTPSTPROP
×
)/()/(
)/(
dbhbbdbhbb
dbhbb
mw1mw0mb1mb0
f1f 0
eeeFLPROP
1)(1)/()/(
)/(10
−
−×−
dbhbbdbhbb
dbhbb-b
mw1mw0mb1mb0
f1f0
eeedbheSTPBTPROP
-b
)/()/(
)/(
dbhbbdbhbb
dbhbb
mw1mw0mb1mb0
r1r0
eeeRTPROP
+
Foliage biomass and merchantable stem biomass use only two sets of coef-ficients in the Jenkins estimation, one for softwood and one for hardwood species. Consequently, there are only two equations for the foliage component ratio of foliage biomass to merchantable stem biomass (table 5). That is, the same foliage component ratio is applied across all softwood species if the trees have the same diameter. The same is true for the hardwood species. Stump ratio and branch/top ratio each have 10 equations corresponding to 10 Jenkins species groups for total aboveground biomass (table 5). However, the sum of the stump ratio and branch/top ratio (STPROP + BTPROP) will collapse to two groups of softwood and hardwood based on the formulas in table 5. As a result, the proportion of merchantable bio-mass to total aboveground biomass either including or excluding foliage with CRM will be the same for all softwoods and the same for all hardwoods. It is proved in the following section.
The total aboveground biomass excluding foliage with current CRM approach is:
DRYBIOT_CRM = MSBIOFIA + STPBIOFIA + TOPBIOFIA (2)
whereMSBIOFIA is merchantable stem woody biomass (biomass of the bole) from FIA,STPBIOFIA is stump biomass, and TOPBIOFIA is branches and top biomass.
17
Estimating Aboveground Tree Biomass on Forest Land in the Pacific Northwest: A Comparison of Approaches
Based on the current CRM, the above formula can be expanded as:
DRYBIOT_CRM = MSBIOFIA + STPROP × MSBIOFIA + BTPROP × MSBIOFIA = MSBIOFIA (1 + STPROP + BTPROP) (3)
)/(
)/(1
1[ [)(1
10
0
0 +
+
−
×− −
+
×+ +
dbhbb
dbhb
b ff
mb 1bmb
eSTP
e )/( 0 + dbhbmw bmw1e )/( + +dbhbmb0 bmb1e )/( + dbhbmw0 bmw1e
dbheSTP - 1b- )( 0b dbhe- 1b- -1
)/( dbhbmb0 bmb1e )/( dbhbmw0 bmw1
)/( dbhbf 0 bf 1
e1 – e
-1
=
)/( +dbhbmb0 bmb1e )/( + dbhbmw0 bmw1
)/( dbhbf 0 bf 1
e1 e–
(4)
whereSTPROP is stump biomass ratio, and BTPROP is branches and top biomass ratio.
Then, the proportion of merchantable biomass to total aboveground biomass with CRM is (refer to the ratio equations in table 5 for STPROP and BTPROP):
MSBIOFIA = (1 + STPROP + BTPROP)-1 =DRYBIOT_CRM
That means:
MSBIOFIA DRYBIOT_CRM
or
MSBIOFIADRYBIOT_CRM
As bmb0, bmb1, bmw0, and bmw1 are coefficients for estimating merchantable bio-mass of bark and wood, and bf0, bf1 are coefficients for foliage from Jenkins et al. (2004), there are only two sets of coefficients estimated in Jenkins for merchantable biomass (bark and wood) and foliage: all the softwood shares one equation and all the hardwood shares another equation. That leads to the merchantable stem biomass ratio (equation (4) above) being one for all softwoods and another for hardwoods no matter what species for trees.
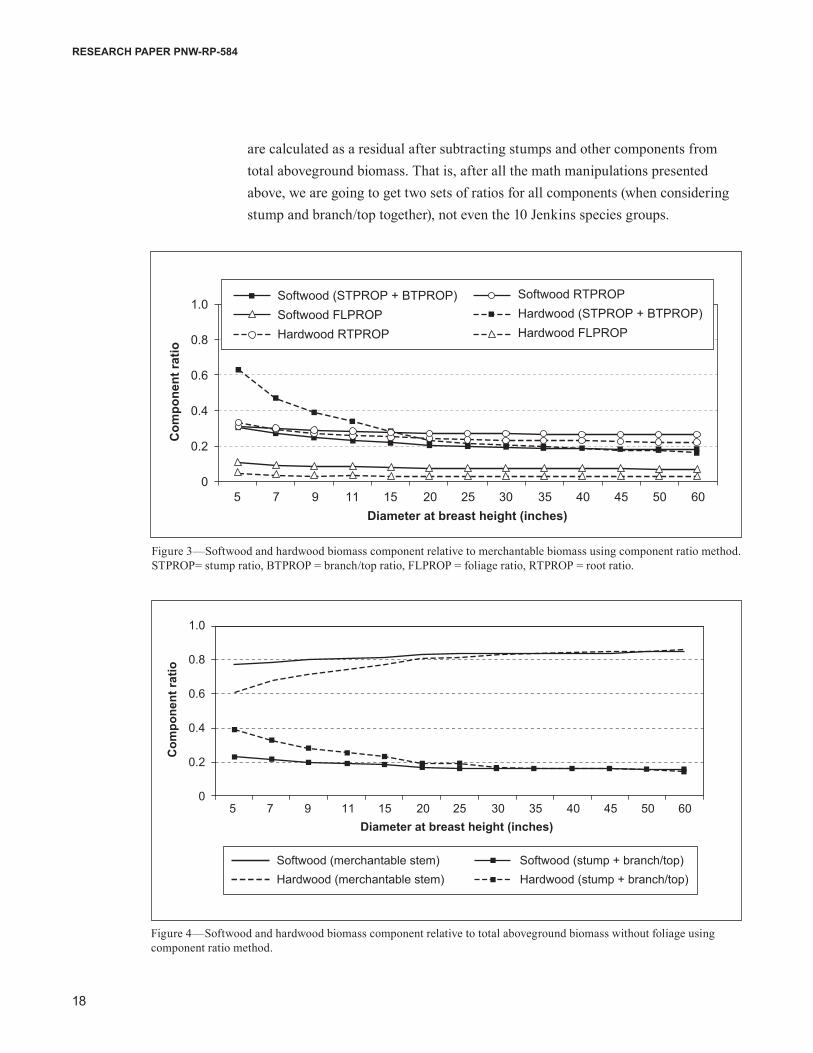
Figure 3 shows the component ratios relative to merchantable biomass (MST); those are the ratios applied to the FIA tree data. Figure 4 shows the component portions relative to total aboveground biomass without foliage. Because the total aboveground biomass estimates in the FIA database do not include the foliage, the total biomass aboveground using the CRM will also not include the foliage, as indicated in equation (2) for comparison. As we discussed, although the individual ratios for stump or branch/top are specific to 10 species groups, the sum of these two ratios collapse to only two—softwood and hardwood—because branch ratios
18
RESEARCH PAPER PNW-RP-584
are calculated as a residual after subtracting stumps and other components from total aboveground biomass. That is, after all the math manipulations presented above, we are going to get two sets of ratios for all components (when considering stump and branch/top together), not even the 10 Jenkins species groups.
1.0
0.8
0.6
0.4
0.2
05 7 9 11 15 20 25 30 35 40 45 50 60
Diameter at breast height (inches)
Com
pone
nt ra
tio
Softwood (STPROP + BTPROP)Softwood FLPROPHardwood RTPROP
Softwood RTPROPHardwood (STPROP + BTPROP)Hardwood FLPROP
Figure 3—Softwood and hardwood biomass component relative to merchantable biomass using component ratio method. STPROP= stump ratio, BTPROP = branch/top ratio, FLPROP = foliage ratio, RTPROP = root ratio.
Figure 4—Softwood and hardwood biomass component relative to total aboveground biomass without foliage using component ratio method.
Softwood (merchantable stem) Softwood (stump + branch/top)Hardwood (merchantable stem) Hardwood (stump + branch/top)
5 7 9 11 15 20 25 30 35 40 45 50 60
1.0
0.8
0.6
0.4
0.2
0
Com
pone
nt ra
tio
Diameter at breast height (inches)

Pacific Northwest Research Station
Web site http://www.fs.fed.us/pnw/Telephone (503) 808-2592Publication requests (503) 808-2138FAX (503) 808-2130E-mail [email protected] address Publications Distribution PacificNorthwestResearchStation P.O. Box 3890 Portland,OR97208-3890

Pacific Northwest Research Station
Web site http://www.fs.fed.us/pnw/Telephone (503) 808-2592Publication requests (503) 808-2138FAX (503) 808-2130E-mail [email protected] address Publications Distribution PacificNorthwestResearchStation P.O. Box 3890 Portland,OR97208-3890

U.S.DepartmentofAgriculture PacificNorthwestResearchStation 333SWFirstAvenue P.O. Box 3890 Portland,OR97208-3890
OfficialBusiness PenaltyforPrivateUse,$300