estimating carbon dioxide emission reduction by waste ... · estimating carbon dioxide emission...
TRANSCRIPT

Estimating Carbon Dioxide emission reduction by waste minimization in civil construction through the use of BIM
methodology.
Hans Peter van Putten
Marco Antonio Rocha

1
Table of Contents
1 Introduction ____________________________________________________3
2 Research Questions _____________________________________________5
3 Background ____________________________________________________6
3.1 Carbon dioxide emissions in C&D Industry ____________________________6
3.2 Building Information Modeling (BIM) ________________________________11
3.3 Information Delivery Manuals (IDM) ________________________________14
4 Thoughts and Ideas for Problem Solving _____________________________16
5 Research Development __________________________________________19
6 Conclusion ____________________________________________________34
7 Bibliography ___________________________________________________35

2
Figures List
Figure 01 – Clinkering process in a rotary kiln
Figure 02 – Production of lime in a rotary kiln
Figure 03 – The phases to produce clay bricks
Figure 04 – Quarried aggregates production
Figure 05 – Mechanism of the steelmaking in a blast oven
Figure 06 – Steelmaking processes
Figure 07 – Building Information Modelling (BIM)
Figure 08 – The ICC BIM platform for managing sustainable construction
Figure 09 – IDM support for business processes
Figure 10 – BIM methodology including a Virtual Waste Generation Stage, in an attempt
to reduce waste
Figure 11 - BIM based clash detection chart for preconstruction and construction
phases.
Figure 12 – Comparison of compositions of construction materials and construction
waste prevented by BIM in the two cases
Figure 13 – Carbon dioxide prevented by BIM-based design validation example

3
1. Introduction
In the last decades we have seen, on scientific publications, on TV and other
media, a big concern in the increasing of Greenhouse Gases (GHG) in Earth’s
atmosphere. By the definition in the Kyoto Protocol to the United Nations
Framework Convention on Climate Change (UNFCCC), GHG is a group that
includes six types of gas: carbon dioxide (CO2), methane (CH4), nitrous oxide
(N2O), hydrofluorocarbons (HFCs), perfluorocarbons (PFCs) and sulphur
hexafluoride (SF6). (1)
These gases retain part of the sun’s heat, by trapping infra-red and other long
wave radiation that is otherwise reflected back into space, what is called the
Greenhouse Effect. The scientific debate now is about the increasing on Earth’s
temperatures, or Global Warming, probably caused by the high degrees in GHG’s
emissions by human activity. The main gas in these concerns is carbon dioxide.
(2)
The great concern in Global Warming comes from its many possible negative
effects to mankind: reduce the food offer in many countries, increasing the
number of hungry people all around the world; increase in global temperatures
between 1,8 and 4 celsius degrees; increase in the sea levels up to 58
centimeters, generating heat waves and dry weathers; extinction of some animal
species; and the emigration of around 200 million climate refugees until the end
of this century. (3)
One of the main human activity sectors that emits GHG’s is the civil construction
one, or the Construction and Demolition sector (C&D), representing one third of
the GHG’s emitted by mankind. Its emissions are associated: to raw material
extraction used in building materials; to the fabrication processes of these
materials; to the energy spent during the lifecycle of the constructions; to the
operation and maintenance of the constructions; and to the materials transport
and waste disposal. (4)
The waste generation is an important factor in research today, not only because
its reduction brings lower costs, but it may help in the reduction of GHG’s emitted
during the lifecycle of these disposable materials. The amount of waste generated
in C&D processes is enormous. This waste represented 26% of the solid waste
4
in the United States in 2007 and 48% of the solid waste in South Korea in 2013.
And these numbers still growing in most of the countries in the world, usually
because of design errors, commonly detected in the construction industry. (5)
Buildings most commonly consist of elements which are designed by different
project participants and companies, and its corrections are made only after the
construction work has already begun on-site. This leads to rework and tons of
construction waste. Improper design and unexpected changes in the project were
identified, by many researchers, as major causes of construction waste
generation, with the possibility of a 33% increase in the volume of waste. (5) This
roughly means that with the waste of three buildings, you could build a new one.
A solution for this waste generation caused by rework would be an integrated
building design, avoiding design problems and changes. For many years,
researchers had studied one tool and methodology that facilitates building design,
the Building Information Modeling (BIM).(5)
BIM is a methodology which uses intelligent graphic and data modeling software
to create optimized and integrated building design solutions, to produce,
communicate and analyse building models. This tool includes the use of three-
dimensional, real-time, intelligent and dynamic modeling, facilitating successful
coordination and collaboration in the construction process. This technology is
already used to reduce cost and time, improving productivity in construction
industry. The use of BIM is already reported as well to reduce rework in
construction industry, reducing waste generation as a consequence.(5,6) But
what about the reduction in emissions of GHG’s, or in the case of this study, the
reduction in weight of carbon dioxide emissions to the atmosphere?

5
2. Research Questions
How much waste is generated in common building projects?
How much of this waste can be reduced with the same results in C&D industry by applying a specific methodology in integrated building design?
How much carbon dioxide is emitted in the life-cycle of this waste?
How much would this reduction be beneficial to the environment?
Project Goals
The main goal is to research the amount of CO2 emitted in the lifecycle of the
materials that become waste in civil construction, and through this data, calculate
the reduction of these emissions in constructions built using BIM methodology.

6
3. Background
3.1. Carbon dioxide emissions in C&D industry
The industries, the forest burnings and the fossil fuel utilization in transport and
in the generation of energy are the main emitters of GHG’s to the atmosphere.
Despite the 'in development' classified countries’ need to adhere to Kyoto
Protocol’s principles in 2012, the five biggest emerging markets, Brazil, China,
India, Mexico and South Africa, will increase their emissions of greenhouse gases
as their economies grow, according to the NGO Fund World for Nature– WWF.(3)
The C&D industry emits large amounts of greenhouse gases. According to
studies, carbon dioxide emissions from the construction industry account for
approximately 30% of total emissions in European cities. Only the cement
industry accounts for 7% of CO2 emissions. The production of the materials used
in constructions have a big participation in these carbon emissions. So the next
topics will discuss about the part of the main construction materials in the carbon
emissions to Earth’s atmosphere.(3)
3.1.1. Cement
The cement industry is responsible for around 5% of the global carbon
dioxide emissions. Cement is the main ingredient in concrete, the second
most consumed substance on the planet, water being the first one.
Cement’s main component is limestone, which is heated in a kiln at
1400ºC and then ground to form the clinker, as seen in Figure 01.
Combining clinker with gypsum results in cement.
Figure 01 – Clinkering process in a rotary kiln

7
In the whole process, greenhouse gases are emitted both directly and
indirectly. The direct emissions come from the limestone heating, in a
process called calcination. Limestone is made mainly of calcium carbonate
(CaCO3) which, when heated, is decomposed in carbon dioxide, and
calcium oxide (CaO), as seen in Equation 01. The indirect emissions are
produced when heating the kiln, as this energy is provided by the burning
of fossil fuels, lke coal, natural gas, or oil, as seen in Equation 01.(10)
Equation 01 – CO2 emissions during the production of cement clinker and lime originate from either combustion or process CO2. CaCO3 is the main mineral in both cement
clinker and lime production.(11)
If following exactly the stoichiometry of this reaction, for each 1 ton of
cement produced, about 0,6 ton of carbon dioxide is emitted to the
atmosphere. It is not difficult to see how important it is to study ways to
minimize the use of this material.(3)
3.1.2. Lime
Lime, also known as calcium oxide, is a white powder, usually applied for
the preparation of mortars used in buildings, or even in painting
arrangements. It is obtained from the calcination of limestone in a rotary
kiln, as in Figure 02, and following Equation 01. This means that it emits
carbon dioxide in its lifecycle by the same mechanisms as in the
manufacturing of cement.3
Figure 02 – Production of lime in a rotary kiln

8
3.1.3. Clay Bricks
Clay bricks are made by a process that includes: excavating the soil for
raw material, treatment of this brick earth or brick clay; hand or machine
molding of the bricks, with the treated and watered brick earth; air drying
of the bricks; burning in a clamp or in a flame kiln (Figure 02). (12)
Most of the red ceramic industry uses biomass as its source of energy in
the burning phase, like firewood, or sawdust. This means that it emits
amounts of CO2, although the energy source usually is more “green” than
the fossil fuels. But the use of fossil fuels, like coal, is still present in this
industry in the burning phase. (3)
Figure 03 – The phases to produce clay bricks (12)
3.1.4. Aggregates: sand and gravel
Aggregates are vastly used around the world, as they are part of the
concrete. They usually consist of crushed stone, gravel and sand, and are
mainly used in the construction of roads, rail track beds, the manufacturing
of concrete, concrete products, and asphalt. The sand and gravel used in
many building processes is natural, extracted directly from riverbeds and

9
fluvial deposits, using dredges moved by diesel. But the use of aggregates
quarried from hard rock is very usual.
The aggregates extracted from quarries, follow through steps like: drilling
of the rock; blasting of the rock with explosives; extraction of the material;
processing of the same by crushing, shaping, screening; washing when
required; and the transport to the construction place.(13)
Figure 04 – Quarried aggregates production (13)
The main environmental impacts in this process are still the degradation
of the blasted areas for the extraction of raw material, the exhaustion of
non-renewable resources, and the contamination of watercourses. But
most of the equipment used for extraction and crushing run on diesel,
which is responsible for not only carbon dioxide emissions, but some
nitrogen and sulphur oxides as well.

10
3.1.5. Steel
Steel is a common material in the C&D industry. Every construction will
have its presence, usually in the shape of bars or wires, used to provide
tensile resistance in concrete structures. It is obtained by steelmaking
processes, with the addition of carbon to iron ore in a blast furnace (Figure
05), followed by passage in other furnaces for the purification of the steel,
and then shaping of the final product (Figure 06). (3)
The extraction of the iron is basically a fusion of magnetite (Fe3O4) and
hematite (Fe2O3), contained in the iron ore, in the blast furnaces. The
carbon from the coke, together with the carbon dioxide emitted from the
heating of the limestone and the burning from the own coke, react,
resulting in carbon monoxide (CO). This carbon monoxide becomes a
reduction agent to the iron oxides present in the furnace, generating
molten iron, as seen by the mechanism shown in Figure 05. The process
generates high amounts of carbon dioxide and carbon monoxide.
Figure 05 – Mechanism of the steelmaking in a blast oven

11
Figure 06 – Steelmaking processes
3.2. Building Information Modelling (BIM)
Building Information Modelling (BIM) is an approach to describe and
display the information required to a construction process, including the
design, the construction itself and the operation of the constructed facility.
In a single operating environment, it can join the many threads of different
information used in the building process. BIM is a methodology which uses
intelligent graphic and data modeling software, with integrated information
in computer aided design (CAD) form from all areas of a project, to create
optimized and integrated building design solutions, to produce,
communicate and analyse building models. This tool includes the use of
three-dimensional, real-time, intelligent and dynamic modeling, facilitating
successful coordination and collaboration in the construction process, as
seen in Figure 07. This results in a 3D digital representation in real time
of the physical and functional characteristics of the asset, as contractors
are no longer reliant only in 2D paper models and worried if all of their staff
is working in the same data after a change has been made. (5,6,16)

12
Efficiency in this methodology depends on the quality of communication
between different participants in the construction process. The information
required has to be available when it is needed, and its quality needs to be
satisfactory. To build a BIM 3D model, all of the technical teams (e.g.
electrical, structural, hydraulic, fire prevention, and architects) have to be
working in the same model, so they necessarily have to be putting the
same type of information in this model, having the same standards in order
to do so. This means a common understanding about the building
processes, the information that is needed to each of them, and the results
from their execution. (16)
Figure 07 – Building Information Modelling (BIM)
Using BIM in the form of an integrated information, communication, and
collaboration (IICC) platform, staff and every component of project
concerned will have opportunity to contribute in managing a sustainable
construction as a whole. Figure 07 shows the IICC BIM platform for
managing sustainable construction, with each component contributing in
the net’s flow of information. (17)

13
Figure 08 – The ICC BIM platform for managing sustainable construction
BIM applications are used to make contributions in (17):
• lower net information costs and risks;
• quick first response in early stage of design to make building safer;
• efficient monitoring, lower operation cost;
• better views of facilities for better decision making;
• reduced project cost and risks;
• better building environmental performance.
The Industry Foundation Classes (IFC) are the open and neutral data
format for BIM. It provides a good reference to all the information within
the lifecycle of a building, created as an integrated whole in response to
business needs identified by the international building construction
community. Still, it does not incorporate a comprehensive reference to the
individual processes within building construction. That’s why it is seen the
need to formulate Information Delivery Manuals (IDM).

14
3.3. Information Delivery Manuals (IDM)
The C&D industry is known by joining many different companies and
authorities together in a specific project. To have a good level of efficiency
in this kind of work, it is necessary for all integrants in the organisation to
know which and when different kind of information has to be
communicated. The IDM standard was developed by buildingSMART, with
the aim in having a methodology to capture and specify processes and
information flow during the lifecycle of a facility. It is a methodology that
captures and integrates, progressively, business process while at the
same time provides detailed user defined specifications of the information
that needs to be exchanged at particular points within a project. (16,18)
The Information Delivery Manual (IDM) aims to provide the integrated
reference for process and data required by BIM by identifying the
discrete processes undertaken within building construction, the
information required for their execution and the results of that activity.
(16)
IDM is a proposal focused on improving the communication for BIM users
through better information quality. It not only tries to make standards for
the information flows, but to identify the relevance of the processes
involved, the relevant staff in creation, consuming and benefitting from it,
and how it should be supported by software solutions. In order to make it
operational, it has to be supported by software, as its main purpose is to
be sure that the important data is communicated in such ways that it can
be read by the software that receives this data. (16,18)
The IDM benefits BIM users with a plain language description of building
construction processes, requirements of information to be provided to
enable them to be fulfilled successfully, and their expected outputs, at the
same time that it benefits software developers, with the identification and
description of the processes and the IFC capabilities needing to be
supported for each functional part in terms. (16)

15
Usually, information is exchanged about a particular topic and the level of
detail provided is driven by the project stage. The need is to support one
business requirement over one or more project stages, what means
deciding which IFC components need to be used to meet requirements. It
is not just a case of selecting one of the development schemas since these
are formed to help the task of distributing development between the model
authors (Figure 09). (16)
Figure 09 – IDM support for business processes (16)
IDM can unite the description of business processes with the specification
of information within the C&D project lifecycle, to enable realization of the
full benefits of process improvement and information sharing. This is
achieved by providing comprehensive reference to information
requirements for the C&D industry, by identifying the processes that
require the exchange or sharing of information between project
participants, the information required for and resulting from the execution

16
of these processes, a basis for the consistent development of project
specific process models, and a common basis for agreement between
project participants about the information that can reasonably be expected
to support a project specific process. A proposal for development of IDM
is presented in section 5. (16)
4. Thoughts and Ideas for Problem Solving Methodology The methodology to this research project is based on finding relevant articles
containing value data about:
a) Carbon dioxide emissions in the lifecycle of construction
materials.
Many researches have already been done in the study of carbon
dioxide emissions related to the lifecycle of building materials. These
research papers make available average values of mass of CO2
emitted per mass of building material. The next table is an example of
information generated by this area of research:
Table 1 - Non-energetic CO2 generated in fabrication processes of some building materials (7)
Building Material t CO2/t
Aluminium 1,600
Lime 0,760
Cement 0,375
Concrete 0,045
Many other building information like this is at hand, like the Inventory of
Carbon & Energy (ICE), made available by the University of Bath. This
database is based on more than 1700 records of embodied energy in
construction materials, and has been structured into 34 main building
material groups, containing over 200 materials. (8)
This material information can be used to estimate the carbon cost to build
some projects, having in hand the volume or mass quantities of the
materials used in the building. This means that BIM designs, as they make
available all these volume and mass information, would be ideal to be used
with these data. Some researchers have already used this information to

17
give even more complete estimations of carbon dioxide emitted by
constructions, as seen in Table 2.
Table 2 – Comparative results of Energy and CO2 embodied in the model (7)
Results New Zealand
Japan Denmark Brazil
t CO2/m2 0,35 0,40 0,40 0,37
GJ/m2 5,60 4,50 4,50 4,46
Results like the one shown above, despite the fact of being really averages
of individual kinds of buildings, can be a better and more accessible source
of information, if you are studying the same type of construction as the
ones worked with in these calculations.
b) Waste generation in construction processes of residential
buildings.
In scientific literature, is possible to find researches focused on
quantifying material waste in construction processes. The results of
these works give us some data as the ones shown in Table 3.
Table 3 – Waste generation rates and material loss rates according to different materials (9)
Materials Waste generation rate (kg/m2)
Mid-value of WGR (kg/m2)
Material loss rate (percentage of purchased)
Concrete 0,357 – 2,387 1,372 1,33
Timber (from formwork and falsework)
1,678 – 1,905 1,796 5
Metal (including reinforcement bar and fixing wire)
0,014 – 0,073 0,044 2,88
Bricks and blocks
0,037 – 0,821 0,429 7
Mortar 0,368 0,368 3,95
PVC pipes 0,035 0,035 1,05
Miscellaneous waste
0,786-3,202 1,994 -
Total 3,275-8,791 -

18
c) Waste reduction in buildings that apply BIM methodology in their construction process. BIM has already been studied not only as a tool to reduce costs or get higher efficiency in the construction process. It has been studied as a methodology to minimize waste in construction due to design errors and consequent rework. Table 4 shows some results of an example of research done in this area. Table 4 – Volume of construction waste prevented by BIM-based design validation by materials (case 1) (5)
Case 1
Material Material type
Volume of prevented
waste (without likelihood)
Vow
Volume of prevented
waste (with likelihood)
Vow
Increased volume factor
Fvol
Demolished volume of prevented
waste
Vdw
Density values
ρ
Demolished weight of
prevented waste
Wdw
Concrete Concrete – cast-in-place
2071,1 94,81 1002,2 94,37 1,10 1102,4 94,36 2,4 2645,8 94,33
Concrete - plain
84,0 3,85 42,0 3,95 1,10 46,2 3,95 2,4 110,9 3,95
Total 2155,1 98,65 1044,2 98,32 1148,6 98,31 2756,7 98,29
Metal Metal - Aluminum
0,1 0,00 0,0 0,00 1,02 0,0 0,00 2,7 0,1 0,00
Metal – Copper
0,0 0,00 0,0 0,00 1,02 0,0 0,00 9,0 0,1 0,00
Metal – Stainless
0,1 0,01 0,1 0,01 1,02 0,1 0,01 7,9 0,9 0,03
Metal - Steel
0,1 0,01 0,1 0,01 1,02 0,1 0,01 7,2 0,5 0,02
Metal - Tin
0,1 0,00 0,0 0,00 1,02 0,0 0,00 7,1 0,3 0,01
Total 0,4 0,02 0,3 0,03 0,3 0,03 1,9 0,07
Finishes Plaster board
8,0 0,37 2,0 0,19 1,10 2,2 0,19 1,1 2,4 0,09
Total 8,0 0,37 2,0 0,19 2,2 0,19 1,1 2,4 0,09
Plastic Plastic – CPVC
0,1 0,00 0,0 0,00 2,00 0,1 0,01 1,5 0,1 0,00
Plastic – PVC
0,2 0,01 0,1 0,01 2,00 0,3 0,03 1,7 0,5 0,02
Total 0,3 0,01 0,2 0,02 0,4 0,03 0,6 0,02
Stone Stone – Granite
1,1 0,05 0,6 0,05 1,10 0,6 0,05 2,6 1,6 0,06
Stone - Marble
18,8 0,86 14,1 1,33 1,10 15,5 1,33 2,6 40,3 1,44
Stone – Mock marble
0,9 0,04 0,7 0,06 1,10 0,7 0,06 1,8 1,3 0,05
Total 20,8 0,95 15,3 1,44 16,8 1,44 43,2 1,54
Grand Total
2184,6 100,00 1062,0 100,00 - 1168,3 100,00 - 2804,8 100,00

19
Quality Control
As this project is based on publications of other scientists, the quality control will be based on the relevance of these publications, consequently showing the confidence in the values and data used in this work.
5. Research Development
Construction waste origins are usually related to design changes, leftover
material scraps, non-recyclable/re-useable packaging waste, design/detailing
errors, and poor weather. A study indicated that construction waste is related to
design, site operation, procurement routes, material handling and sub-
contractor’s practices, and went further to compile and group the main sources
of waste factors in terms of construction lifecycle stages, comprising contractual,
design, procurement, transportation, on-site management and planning, material
storage, material handling, site operation, residual, and other. (17)
There is a consensus in literature that a significant portion of waste is caused by
problems which occur in stages that precede production, and design stage is
one of the major construction waste sources. (17)
All construction stages directly or indirectly contribute to on-site waste generation.
However, the level and severity of waste production varied from stage to stages
depending on a number of variables that include type of procurement, project
brief, stakeholders’ engagement and commitment, etc. It is widely argued that
waste reduction intervention should focus on pre-construction stages, particularly
design, where simulated waste generation during design stages, as opposed to
physical on-site waste, could be effectively identified, evaluated and reduced. It
would be an interesting idea to design out waste, since 33% of construction waste
might be directly influenced by inappropriate design decision making and design
changes, which contribute to more than 50% of the total on-site waste production
in construction projects. (17)
In a waste management context, BIM is a real-time interactive and collaborative
communication system that can help project stakeholders to collaboratively attain
construction waste minimisation throughout the lifecycle stages of a building,
20
improving building construction performance. BIM enhanced communication and
collaboration are important facets of managing successful sustainable
construction. It has been argued that BIM could enhance communication and
collaboration; increase efficiency; and reduces errors, which in turn would reduce
resources, energy, materials and waste. Furthermore, BIM provides the
opportunity of testing, revising, rejecting and accepting design ideas in real-time,
such as the case for collaborative design methods. (5)
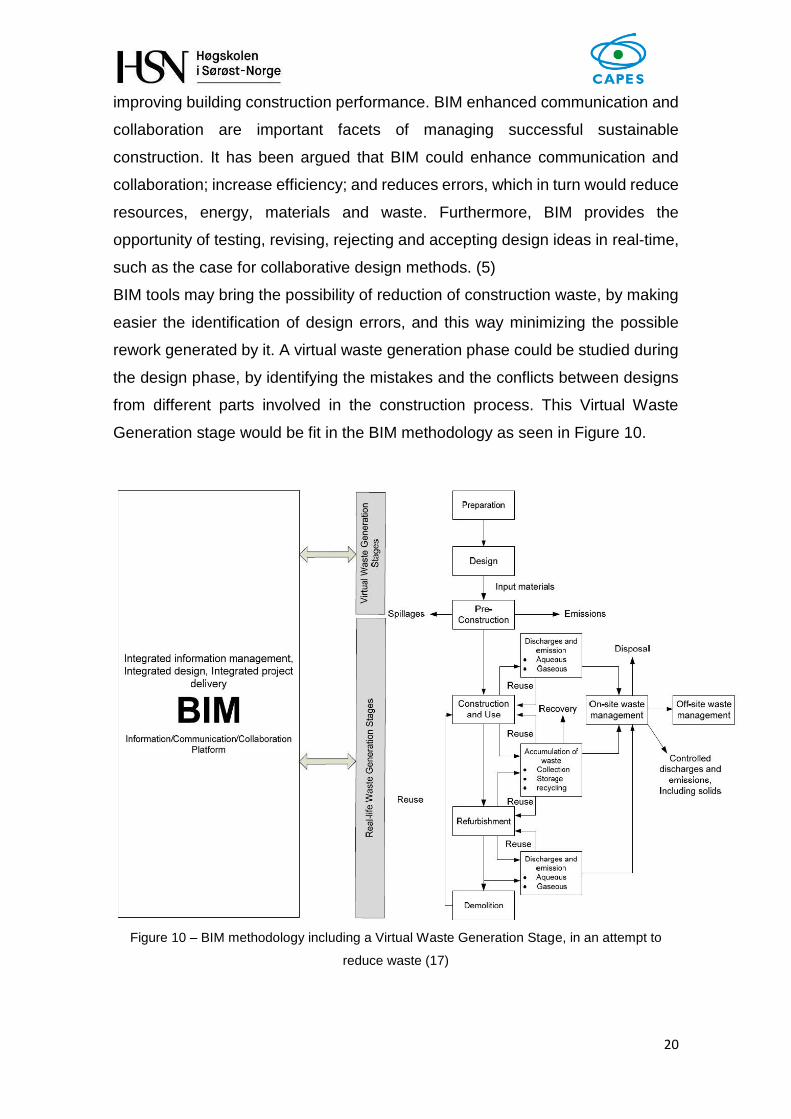
BIM tools may bring the possibility of reduction of construction waste, by making
easier the identification of design errors, and this way minimizing the possible
rework generated by it. A virtual waste generation phase could be studied during
the design phase, by identifying the mistakes and the conflicts between designs
from different parts involved in the construction process. This Virtual Waste
Generation stage would be fit in the BIM methodology as seen in Figure 10.
Figure 10 – BIM methodology including a Virtual Waste Generation Stage, in an attempt to
reduce waste (17)
21
Various BIM uses like design validation, quantity take off, and prefabrication were
proposed for minimization of construction waste. Especially, they have claimed
that clash detection and design review have high potential to reduce construction
waste generated on-site by virtually identifying during design phase those
constructability issues that can be resolved ahead of time. (5)
Detecting building-element clashes and other causes of rework were chosen as
the most beneficial way of using BIM by owners, now becoming a common BIM
practice called the BIM-based design validation process. BIM-based design
validation can improve design quality by reducing the number of design errors,
change orders, and rework in the planning, design, preconstruction, and
construction phases. (5)
To the present work, the data was obtained from a research in two case studies
carried out in South Korea, based on qualitative and quantitative information from
construction waste generated on-site and prevented by BIM-based design
validation. A lot of practitioners say that most design errors can be found by
skilled and experienced building engineers without using BIM. A proposal was a
BIM Return of Investment analysis method in design error detection that
considers the likelihood of identifying an error without the aid of BIM.
The first case consists of two residential buildings (reinforced concrete structures),
with a total floor area of 120,000 m2 and the contractor decided to adopt BIM to
effectively manage such a complex project. 381 design errors were found by
practitioners by conducting a BIM-based design validation.
The second case is a sports complex composed of a baseball training facility and
a clubhouse, with a total floor area of 9995 m2. The contractor adopted BIM in
this case for error reduction as well as improved execution flow. This time,
practitioners found 136 design errors through BIM-based design validation. The
likelihood based BIM return of investment analysis method was the base to
categorizing these design errors (Figure 11). (5)

22
Figure 11 - BIM based clash detection chart for preconstruction and construction phases (5)
The data about the construction waste in the two cases were estimated based on
the amount of rework caused by each error detected. They were classified and
analysed in accordance to level of impact. These levels of impact were
subcategorized into the cause and the likelihood of identifying an error before
construction using the traditional drawing based approach. Six project
participants in case 1 and three in case 2 classified the errors following the
author’s guidance, and estimated the likelihood of identifying each design error
without using BIM before construction based on their experiences and BIM issue
reports with screen shots and short descriptions of each error. In case 1 all the
participants had more than 15-year work experience in general contractors and
in case 2 the average was 10-year work experience.
The errors were categorized in three types: illogical design (eg. Clashes between
different building elements and drafting errors), discrepancies between drawings
(eg. A wall represented as a solid wall in an architectural drawing while it is
represented as steel beams in a structural drawing), and omission (eg. Missing
identifier numbers, lines or symbols for stepped floors, schedules, dimensions).
The likelihood considered here is the probability to identify each design error,
which was identified through BIM based design validation, without using BIM
(using drawing-based design review). For the likelihood applied to each error, for
example, 100% likelihood does not mean a chance to identify all errors but a
100% chance to find a specific error. The method used categorized the
likelihoods into three groups: 25% (unlikely), 50% and 75% (likely to be identified
without using BIM). The values of actual construction waste in both cases were

23
also collected for a final comparison. Since obvious mistakes can also be missed,
0% or 100% likelihood were not considered.
Table 5 - Errors categorized by cause and likelihood of identification without BIM
Not every design error causes rework or additional work, so the ones that do
cause it should be identified to measure the prevented total amount of waste
using this methodology. 6 project participants identified that 108 (28%) out of 381
total errors had a potential impact on rework in the first case and in the second
case 21 (15%), based on their experience to resolve each of these errors. The
estimations were made with only the errors that generate waste. This can be seen

24
in Table 6. The amount of construction waste prevented by
BIM-based design validation was analysed in two ways
according to building elements and material types: without
considering the likelihood of detecting each error, and
applying the likelihood (25, 50 and 75%). Quantity
information extracted from BIM models and separate
spreadsheets were used to calculate the volume of
prevented construction waste. Building elements were
categorized in 14 types (beam, cable tray, catwalk, ceiling,
column, duct, foundation, frame, pipe, ramp, slab, stairs,
truss and wall).
The total volume of construction waste prevented by BIM-
based design validation in cases 1 and 2 considering the
likelihood of detecting design errors without BIM were 1062
m3 and 79.5 m3, respectively. Without considering the
likelihood, the volumes of waste prevented were 2184.6 m3
and 270.2 m3. The reduction rate considering the likelihood
of identifying those design errors were 51.4% and 70.6%,
respectively.
In the second case, the amount of design errors that can be
easily detected without BIM design validation is greater
because the project is smaller and simpler than the first one.
The formula adopted to calculate waste prevention in these
cases was:
Vdw = Vow x P x Fvol
Where Vdw is the volume of construction waste prevented by
BIM-based design validation; Vow is the volume of prevented
waste without considering the likelihood (m3); P is the
likelihood of not being able to identify the error in the
traditional drawing based approach; and Fvol is the
increased volume factor, that could transform the amount of
construction waste into apparent volume.
Tab
le 6

25
But since many waste management planning processes calculations are based
on weight, not volume, density information is needed (Tables 7 and 8). Then, the
following equation for unit conversion factor was formulated:
Wdw = Vdw x ρ
Where Wdw is the weight of prevented construction waste (ton); and ρ is the
default density of the waste material (ton/m3).
These cases compared the volume of construction waste reduction and
construction materials (Figure 12). Both volumes of construction materials used
were extracted from the BIM models used. The avoided construction waste was
Table 7
Table 8

26
estimated based on the volume of construction waste by considering the
likelihood of identifying errors without using BIM. The volume of waste avoided
by BIM-based design validation in the first case was 0.9% of the total value of
construction materials.
Concrete was the main material used in both cases (67% and 80%, respectively)
and was also the main material that was saved by BIM-based design validation
(98.3% and 95.7% of the materials that would become waste).
These case studies used the demolished volumes of avoided construction waste
(1168.3 m3 and 87.3 m3) by considering the likelihood of detecting errors without
using BIM to compare the disposed and avoided construction waste because the
waste disposed on construction sites are usually demolished before being
delivered.
In the end, the volume of construction waste avoided by using BIM-based design
validation were 15.2% in case 1 and 4.3% in case 2 of the sum of the volumes of
construction waste disposed. The discrepancy in these two values is given mainly
because of the difference in the nature and complexity of the projects, which
Figure 12

27
affect directly the likelihood of detecting errors in them, either by BIM or drawings
based design validation. (Table 9)
With the data obtained from Tables 7 and 8, and relating it to factors obtained in
the ICE database, it is possible to obtain CO2 mass values related to the life cycle
of the materials that had their waste volume reduced, as made in Table 10. This
was made following the equation:
WCO2 = Wdw x EC
Where Wdw is the weight of the waste of the material, prevented by BIM-based
design validation; EC is the embodied carbon in the material per mass unit; and
WCO2 is the weight of carbon prevented to be emitted to the atmosphere.
Table 10 – CO2 emission prevented with BIM-based design validation
Material Specification Case 1
Wdw Case 2
Wdw EC –
KgCO2/Ton WCO2 Case
1 WCO2 Case
2
Concrete Cast-in-place 2645.8 200.6 130 343954 26078
Plain 110.9 0 130 14417 0
Metal
Aluminum 0.1 0.4 8240 824 3296
Copper 0.1 0 3830 383 0
Carbon steel 0 1.0 2700 0 2700
Stainless 0.9 4.1 6150 5535 25215
Steel 0.5 14.1 2750 1375 38775
Tin 0.3 4.5 13700 4110 61650
Plastic PVC 0.5 0.7 2410 1205 1687
CPVC 0.1 0 2410 241 0
Finishes Plaster Board 2.4 0 380 912 0
Stone
Granite 1.6 0 781 1249,6 0
Marble 40.3 0 112 4513,6 0
Mock Marble 1.3 0 460 598 0
Total (Kg) 379317.2 159401
Total sum (Kg) 538718.2
Table 8
28
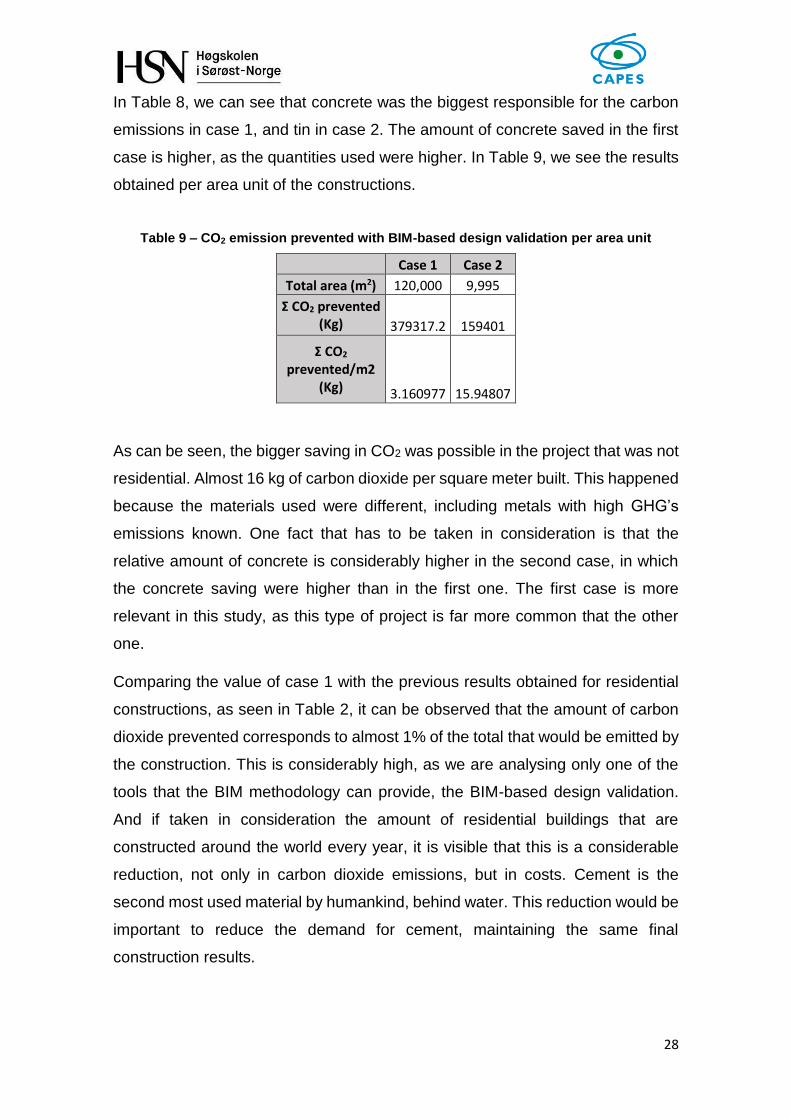
In Table 8, we can see that concrete was the biggest responsible for the carbon
emissions in case 1, and tin in case 2. The amount of concrete saved in the first
case is higher, as the quantities used were higher. In Table 9, we see the results
obtained per area unit of the constructions.
Table 9 – CO2 emission prevented with BIM-based design validation per area unit
Case 1 Case 2
Total area (m2) 120,000 9,995
Σ CO2 prevented (Kg) 379317.2 159401
Σ CO2 prevented/m2
(Kg) 3.160977 15.94807
As can be seen, the bigger saving in CO2 was possible in the project that was not
residential. Almost 16 kg of carbon dioxide per square meter built. This happened
because the materials used were different, including metals with high GHG’s
emissions known. One fact that has to be taken in consideration is that the
relative amount of concrete is considerably higher in the second case, in which
the concrete saving were higher than in the first one. The first case is more
relevant in this study, as this type of project is far more common that the other
one.
Comparing the value of case 1 with the previous results obtained for residential
constructions, as seen in Table 2, it can be observed that the amount of carbon
dioxide prevented corresponds to almost 1% of the total that would be emitted by
the construction. This is considerably high, as we are analysing only one of the
tools that the BIM methodology can provide, the BIM-based design validation.
And if taken in consideration the amount of residential buildings that are
constructed around the world every year, it is visible that this is a considerable
reduction, not only in carbon dioxide emissions, but in costs. Cement is the
second most used material by humankind, behind water. This reduction would be
important to reduce the demand for cement, maintaining the same final
construction results.
29
The information needed to prevent this carbon emissions were the required ones
in the design and preconstruction phases. The creation of a Virtual Waste Stage
in the BIM methodology was essential to reduce rework and real waste
generation.
This research project was based on a construction where BIM was applied only
after the designs were done, in preconstruction phase. In an ideal model, where
the designs would be made aided by IDM standardized information, the BIM tools
would be applied even before the preconstruction. The waste could be almost
totally virtual waste, before this stage.
As we can see in the research done, the information necessary for this were the
2D drawings, so they could be put together in a BIM model, analysed by
specialists and have their conflicts checked. This step generates information that
would go to the Virtual Waste Generation Stage, which is one of the sources of
necessary data to change the BIM model. The process to detect and resolve
design errors involves more than one sector in the building process. It can be
organized into an IDM flow chart, showing the flow of information needed to get
the expected results.
The designs used for the studied example came from many companies, and put
together in a BIM model. In this IDM flow, the responsibility for this is shown as
the Design Sector. The professionals who make the BIM-based design review
are put together in the Clash Detection Sector, detecting Illogical design,
discrepancies and omissions. This information is sent back to the Design sector,
as the Virtual Waste, so the BIM model can be modified if necessary, solving the
collisions. This cycle is done until no more collisions are found and the BIM model
can finally be sent to the Building Process sector, which generates the real waste.
The real waste can be quantified for further analysis by the Design and Clash
Detection sectors for the next building processes, as this information could
complement the Virtual Waste data, knowing that some methods inside the
building process will always need to generate waste to be completed. This Virtual
Waste generation can be finally combined with the information provided by the
ICE Database, to estimate the carbon dioxide generation embodied in the
lifecycle of its waste (Figure 13).

30
Figure 12 – Flow Chart for the information flow necessary for the estimation of the embodied
carbon in the waste generated in a building process

31
If a BIM model had been applied since the beginning, the time and costs would
be lower than the ones spent in the researched process, and the same probably
for the generated waste and, consequently, the carbon dioxide emissions. The
efficiency of the process shown in Figure 12 could be even higher by the
application of IDM and IFC standards in the transmitted information. This flow
chart is named process map in the IDM standard. (18,25) As IDM is to be applied
to software applications, an information output format could be configured for
each of these steps.
The first essential information is, of course, the standardized BIM model of the
construction. The blocks that make the building need to be in IFC standards. One
example of information format for the BIM model is in Table 10, a proposal for
Exchange Requirements and Functional Parts. It shows the flow of information
and displays the information that underlies assessment, IFC standards 2x4 (ISO
16739:2013). This methodology for specification is based on the ISO 29481-
1:2016 standard. (18, 25)
Table 10 - Proposed structure of the IDM for use in calculation process used by QVILLER (20)
Exchange requirements
Functional Parts
Information IFC 2x4 standard XML Revit ArchiCAD
Beams ifcBeam xmlBeam - -
Columns ifcColumn xmlColumn - -
Slabs ifcSlab xmlSlab - -
Wall, equal sizes
ifcsWallStandardCase xmlWallStandardCase - -
A proposal for further use of this methodology would be to develop an “IDM for
Virtual Waste specification”. buildingSMART International (bSI) have a long list
of developed IDMs and the “IDM for Virtual Waste specification” could by this be
distributed through bSI. These specification of relevant information can be
extended with rules for calculation of waste related to type of building process,
and other constraints. This development, eg. as plug-in to Revit or other software,
can enable automatic calculation of waste based as part of the design process.
(18, 25)
32
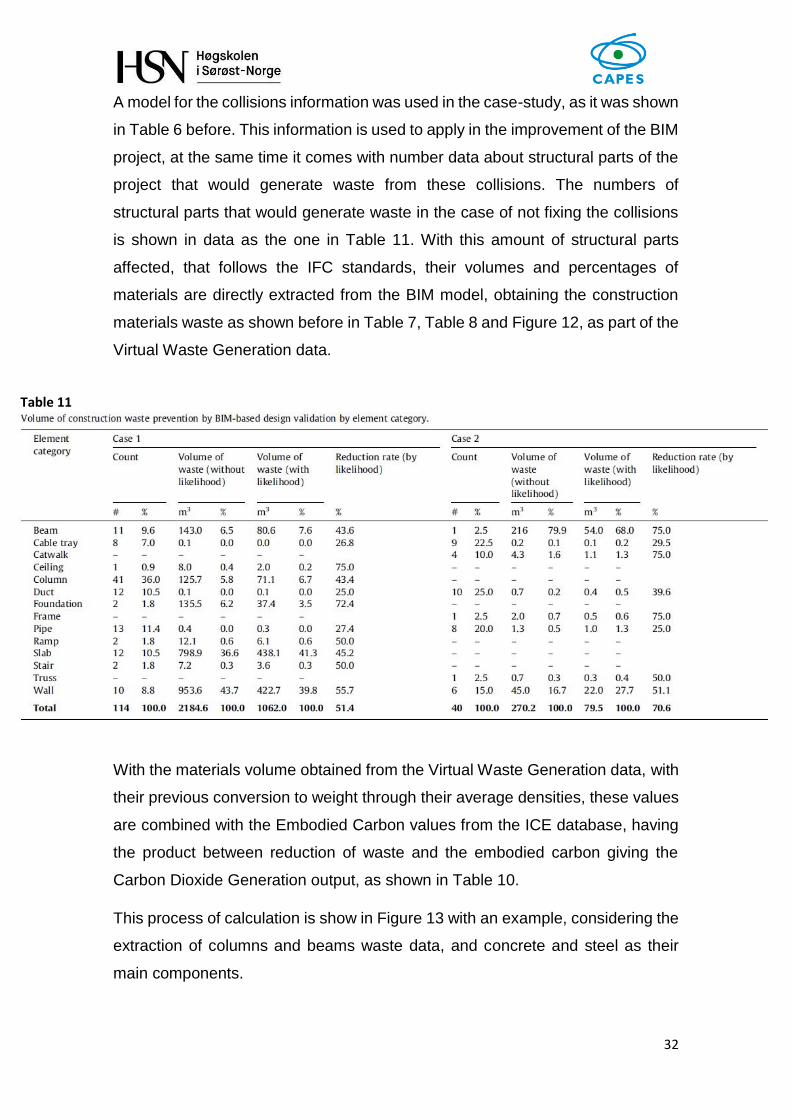
A model for the collisions information was used in the case-study, as it was shown
in Table 6 before. This information is used to apply in the improvement of the BIM
project, at the same time it comes with number data about structural parts of the
project that would generate waste from these collisions. The numbers of
structural parts that would generate waste in the case of not fixing the collisions
is shown in data as the one in Table 11. With this amount of structural parts
affected, that follows the IFC standards, their volumes and percentages of
materials are directly extracted from the BIM model, obtaining the construction
materials waste as shown before in Table 7, Table 8 and Figure 12, as part of the
Virtual Waste Generation data.
With the materials volume obtained from the Virtual Waste Generation data, with
their previous conversion to weight through their average densities, these values
are combined with the Embodied Carbon values from the ICE database, having
the product between reduction of waste and the embodied carbon giving the
Carbon Dioxide Generation output, as shown in Table 10.
This process of calculation is show in Figure 13 with an example, considering the
extraction of columns and beams waste data, and concrete and steel as their
main components.
Table 11

33
Figure 13 – Carbon dioxide prevented by BIM-based design validation example
When thinking about saving money in a determined process in a company
nowadays, the first thought and option is usually to fire staff, to cut a process
short. Stakeholders are often more concerned on spending less money than
spending it smartly. Firing personnel is not only bad for an economy, it also makes
the company look bad, nobody wants to work where bosses fire staff before
looking at other options. When it comes to waste management, firms are worried
about options about what to do with the waste, it is often brought up the “5 R’s”
(Reduce, reuse, recycle, repair, reject) and others simply buy more eco-friendly
materials so the waste is less hazardous to the environment, but only a few think
about actually reducing the waste levels. With the methodology proposed in this
paper, the waste levels are reduced noticeably, while production stays the same.
With BIM-based design validation, project managers work harder in the planning
phase so they have a more controlled and error minimized execution, which
generates less rework and physical waste.

34
6. Conclusion
The present research work gathered information about carbon dioxide emissions
directly and indirectly related to building materials production, waste generation
on-site, BIM methodology and IDM standards to accomplish the objective of
calculating the reduction of carbon dioxide emissions to the atmosphere brought
by BIM-based design validation in building processes. The required data for the
calculation was extracted from two case-studies developed in South Korea, plus
the ICE database which provided values for carbon emissions in the lifecycle of
building materials.
The results obtained were savings of 379 tons of carbon dioxide for 120,000 m2
of two residential buildings, and 159 tons for 9.995 m2 of a baseball training facility.
This means savings of 3.2 kg CO2 / m2 in the first case and 15.9 kg CO2 / m2 for
the second one. In the two study cases from South Korea used in this paper, the
one which had a waste reduction rate of 15.2% is an extremely common project
(residential buildings with reinforced concrete structure), these 15.2% represent
around 1,200 m3 of waste, of which 98.3% is entirely concrete and represents
379 tons of CO2 as well. This waste prevented is 0.9% of the sum of the materials
used in the entire construction process, from beginning to the end, in only one
construction site. In 2011, South Korea emitted 610 million metric tons of CO2,
which 40% came only from the construction industry. If they had all saved 0.9%,
there would be 2.2 million metric tons less of carbon dioxide in the atmosphere in
that year, and South Korea is only the 8th country with most emissions. According
to the Environmental Protection Agency (EPA), this spared value is equivalent to
the annual GHG emissions of 406,761 passenger vehicles and it takes 15,490
acres of preserved forest to annually absorb these emissions. (21, 22, 23, 24)
The application of IFC and IDM standards were embedded in the BIM study, as
a way to enable high efficiency in the process of waste minimization,
quantification and carbon dioxide emission calculations. A model of information
necessary to get these results was proposed and it is open to be improved in
future studies.

35
7. Bibliography
1. Yan, Hui; Shen, Qiping; Fan, Linda C.H.; Wang, Yaowu; Zhang, Lei.
Greenhouse gas emissions in building construction: A case study of One
Peking in Hong Kong. Building and Environment 45 (2010) 949–955.
2. Buchanan, Andrew H.; Honey, Brian G.. Energy and carbon dioxide
implications of building construction. Energy and Buildings, 20 (1994) 205-
217.
3. Stachera Jr, Theodozio. Avaliação de emissões de CO2 na construção
civil: um estudo de caso da habitação de interesse social no Paraná.
XXVIII ENCONTRO NACIONAL DE ENGENHARIA DE PRODUÇÃO;
2008.
4. Sanquetta, Carlos Roberto; Flizikowski, Lis Camila; Corte, Ana Paula
Dalla; Mognon, Francelo; Maas; Greyce Charllyne Benedet. Estimativa
das emissões de gases de efeito estufa em uma obra de construção civil
com a metodologia GHG protocol. ENCICLOPÉDIA BIOSFERA, Centro
Científico Conhecer - Goiânia, v.9, N.16; p. 1088; 2013.
5. Won, Jongsung; Cheng, Jack C.P.; Lee, Ghang. Quantification of
construction waste prevented by BIM-based design validation: Case
studies in South Korea. Waste Management; 2016.
6. IMS Consulting. Green BIM Innovation at Skanska.
7. Sergio F. Tavares, Roberto Lamberts. CO2 EMBUTIDO EM
EDIFICAÇÕES RESIDENCIAIS BRASILEIRAS. XII Encontro Nacional de
Tecnologia do Ambiente Construído; 2008.

36
8. Hammond, Geoff; Jones, Craig. Inventory of Carbon & Energy (ICE).
University of Bath; 2008.
9. Weisheng Lu, Hongping Yuan, Jingru Li , Jane J.L. Hao, Xuming Mi,
Zhikun Ding. An empirical investigation of construction and demolition
waste generation rates in Shenzhen city, South China. Waste
Management 31 (2011) 680–687.
10. Rubenstein, Madeleine. Emissions from the Cement Industry. State of the
Planet. Columbia University; 2012. Available from:
http://blogs.ei.columbia.edu/2012/05/09/emissions-from-the-cement-
industry/
11. Hökfors, Bodil. Phase chemistry in process models for cement clinker and
lime production. Thermal Energy Conversion Laboratory. Department of
Applied Physics and Electronics. Umeå University; 2014.
12. 4 Primary Steps in Brick Manufacturing Process. CivilBlog; 2014. Available
from:
http://civilblog.org/2014/02/25/4-primary-steps-involves-in-brick-
manufacturing/
13. Our aggregates Solutions. Lafarge Holcim; 2016. Available from:
http://www.lafargeholcim.com/aggregates-solutions
14. Chemistry Book. Philschatz; 2015. Available from:
http://philschatz.com/chemistry-book/contents/m51186.html
15. Speciality Steel Bar. Usha Martin; 2016. Available from:
http://www.ushamartin.com/product/speciality-steel-bar/
16. Information Delivery Manual - Guide to Components and Development
Methods. Version 1.2. IUG/IDMC; 2010.

37
17. Liu, Zhen; Osmany, Mohamed; Demian, Peter; Baldwin, Andrew N. The
potential use of BIM to aid construction waste minimalisation. IN:
Proceedings of the CIB W78-W102 2011: International Conference. 26th-
28th October 2011, Sophia Antipolis, France, paper 53.
18. Karlshøj, Jan. Information Delivery Manuals. BuildingSMART; 2011.
Available from: http://iug.buildingsmart.org/idms/
19. Building Information Modeling (BIM): A revolução nos projectos. Diário
Imobiliário; 2015. Available from:
http://www.diarioimobiliario.pt/Arquitectura/Building-Information-
Modeling-BIM-A-revolucao-nos-projectos
20. Qviller, Anders. Implementation of BIM for contractor with focus on
quantity takeoff in the calculation process. Institutt for Matematiske
Realfag og Teknologi. Universitetet for Miljø; 2010.
21. Each Country’s Share of CO2 Emissions. Union of Concerned Scientists;
2011. Available from:
http://www.ucsusa.org/global_warming/science_and_impacts/science/ea
ch-countrys-share-of-co2.html#.Vysv6vl96Ul
22. How much carbon dioxide is produced by burning gasoline and diesel fuel?
U.S. Energy Information Administration; 2016. Available from:
http://www.eia.gov/tools/faqs/faq.cfm?id=307&t=100
23. Kim, Tae Hyoung; Chae, Chang U; Kim, Gil Hwan; Jang, Hyoung Jae.
Analysis of CO2 Emission Characteristics of Concrete Used at
Construction Sites. Sustainability 2016, 8, 348; doi:10.3390/su8040348
24. Mullikin, Justin. What does one ton of CO2 really mean? The Association
for the Advancement of Sustainability in Higher Education; 2009. Available
from: http://www.aashe.org/blog/what-does-one-ton-co2-really-mean

38
25. ISO 29481-1:2016. Building information models -- Information delivery
manual -- Part 1: Methodology and format.
26. ISO 16739:2013 Industry Foundation Classes (IFC) for data sharing in
the construction and facility management industries.