the carbon dioxide emission factor for combustion of
TRANSCRIPT

The carbon dioxide emissionfactor for combustion of Swedish
peat
Kristina Nilsson B1595
June 2004

RAPPORTSAMMANFATTNINGReport Summary
Organisation/Organization
IVL Svenska Miljöinstitutet ABIVL Swedish Environmental Research Institute Ltd.
Projekttitel/Project title
Climate Impact of Peat UtilisationAdress/address
Box 21060100 31 Stockholm Anslagsgivare för projektet/
Project sponsorTelefonnr/Telephone
08 598 563 00
Swedish Peat Research FoundationSwedish Environmental ProtectionAgencySwedish Energy Agency
Rapportförfattare/author
Kristina Nilsson
Rapportens titel och undertitel/Title and subtitle of the report
The carbon dioxide emission factor for combustion of Swedish peat.Sammanfattning/Summary
The Swedish carbon dioxide emission factor for combustion of energy peat has beenreviewed. Three-year-old peat analyses from two Swedish peat producers indicated anotably lower emission factor than 107.3 g CO2/MJ which is the value used in Sweden’sNational Emission Inventory Report 2003 submitted under the United Nations Conventionon Climate Change. New calculations based on both the old analyses and complementingdata were performed in order to calculate an emission factor representative to the entireSwedish production of energy peat. Assuming a water content of 45-50 % (good estimatefor moisture content of Swedish energy peat) the calculated emission factor wasapproximately 105 -108 g CO2/MJ (standard deviation: 4.8 g CO2/MJ). Hence it could notbe concluded that the emission factor is notably lower than the value used in Sweden’sNational Emission Inventory Report 2003. However, since the emission factor is dependenton the moisture content, peat with a significantly lower moisture content should also beassociated with a lower emission factor.
Nyckelord samt ev. anknytning till geografiskt område eller näringsgren /Keywords
energitorv, koldioxid emissionsfaktor, / energy peat, carbon dioxide emission factorBibliografiska uppgifter/Bibliographic data
IVL Rapport/report B1595Rapporten beställs via /The report can be ordered viaHemsida: www.ivl.se, e-mail: [email protected], fax: 08-598 563 90 eller IVL,Box 210 60, 100 31 Stockholm

The carbon dioxide emission factor for combustion of Swedish peat IVL rapport B1595
1
AbstractIn Sweden’s National Emission Inventory Report 2003 submitted under the UnitedNations Convention on Climate Change the carbon dioxide emission factor used forpeat consumption in electricity-, gas- and heating plants is 107.3 g CO2 /MJ. Recentanalyses of peat from HMAB and Råsjö Torv Ltd indicated that the carbon and energycontent of the peat might correspond to a lower emission factor. The objective of thisstudy was to review the already available peat analyses and the calculation methodsused when calculating the lower emissions factor. If necessary the data should becomplemented so that the total data set would be representative to the entire Swedishproduction of energy peat.The CO2 emission factor was determined by the carbon content and the net calorificvalue of the peat. The net calorific value was calculated according to the Swedishstandard method, ISO 1928:1995.The HMAB peat analyses had been made on peat bricks with a wood content of 30%.These values were replaced by analyses of pure peat from producers all over Sweden.The results show that the emission factor on dry basis is approximately 95.0 g CO2/MJ(standard deviation 3.9 g CO2/MJ). With a water content of 45-50 % the emission factorwill be approximately 105-108 g CO2/MJ (standard deviation 4.8 g CO2/MJ). Nocomplete compilation of moisture content on combusted peat was made, but many peatproducers approximated their mean water content to somewhere between 40-50%.Therefore it can be concluded that the emission factor is not notably lower than thevalue used in the Swedish National Emission Inventory. Since the emission factor isdependent on the moisture content, it would be appropriate to use a lower emissionfactor for combustion of peat with significantly lower moisture content.The reviewed calculations indicating a lower emission factor had not been doneaccording to the IPCC methodology used in this study.

The carbon dioxide emission factor for combustion of Swedish peat IVL rapport B1595
2
AcknowledgementsThe investigation of the carbon dioxide emission factor for combustion of peat forenergy and heating purposes was part of a project that studies the climate impact of peatproduction for energy use in Sweden. The project was performed by IVL, the SwedishEnvironmental Research Institute Ltd on behalf of the Swedish Peat ResearchFoundation, the Swedish Environmental Protection Agency and the Swedish EnergyAgency.

The carbon dioxide emission factor for combustion of Swedish peat IVL rapport B1595
3
Contents
Abstract............................................................................................................................. 1
Acknowledgements .......................................................................................................... 2
Sammanfattning................................................................................................................ 4
1 Introduction ............................................................................................................... 6
2 Objective of the study ............................................................................................... 6
3 Methodology ............................................................................................................. 63.1 CO2 emission factor............................................................................................... 73.2 Calorific value ....................................................................................................... 8
3.2.1 Definitions .................................................................................................... 83.2.2 Calculation of net calorific values ................................................................ 83.2.3 Normalisation of data ................................................................................... 9
3.3 Selection of production sites.................................................................................. 9
4 Assumptions, Limitations and Uncertainties .......................................................... 11
5 Data ......................................................................................................................... 12
6 Results ..................................................................................................................... 136.1 Accuracy of old calculations and analyses .......................................................... 136.2 CO2 emission factor according to new calculations ............................................ 13
7 Discussion ............................................................................................................... 14
8 Conclusions ............................................................................................................. 14
9 Recommendations ................................................................................................... 15
10 References ............................................................................................................... 1610.1 Literature.......................................................................................................... 1610.2 Personal communications ................................................................................ 17
Appendix ........................................................................................................................ 18

The carbon dioxide emission factor for combustion of Swedish peat IVL rapport B1595
4
SammanfattningI Sveriges rapportering av emissioner av växthusgaser till FN:s Klimatkonvention (Finkm. fl. 2003) används emissionsfaktorn 107,3 g CO2/MJ för förbränning av energitorv iel-, gas och värmeverk. Beräkningar gjorda på analyser av torv från HMAB och RåsjöTorv AB indikerade att energi- och kolinnehållet i torven motsvarade en betydligt lägreemissionsfaktor på 90-97 g CO2/MJ. Syftet med denna studie var att granskarepresentativiteten av torvproverna från HMAB och Råsjö Torv AB för svensktorvproduktion samt korrektheten i de beräkningsmetoder som använts för att beräknaden lägre emissionsfaktorn. I syftet ingick också att vid behov komplettera med datafrån ytterligare producenter för att få ett urval som är representativt för hela dagenssvenska produktion av energitorv. Detta för att kunna beräkna en emissionsfaktor förförbränning av torv som kan sägas vara representativ för svensk energitorv.
Analyserna av torv från HMAB och Råsjö Torv AB var ungefär tre år gamla och vargjorda för f.d. Uppsala Energi (numera Vattenfall Uppsala Värme). Efterforskningvisade att torven från HMAB vid denna tid utgjordes av torvbriketter med en fukthalt påca 8-10% och med en inblandning av träflis på ca 30%. Eftersom torven från HMABvisade sig vara ett blandbränsle exkluderades dessa mätvärden i de nya beräkningarnaav emissionsfaktorn. De analyser från Råsjö Torv som kom från täkter som idagfortfarande är aktiva fick utgöra en grund för de nya beräkningarna. Urvalet utökadesmed analyser från andra täkter och producenter så att det totala urvalet av torv kom frånett 20-tal aktiva torvtäkter.
För att vara säker på att beräkningarna av emissionsfaktorn skall kunna betraktas somrepresentativ för dagens svenska torvproduktion kontrollerades att urvalet av torvtäkterrepresenterade samtliga torvproducerande regioner. Emissionsfaktorn beräknades förvarje enskild täkt och vägdes sedan samman till ett medelvärde genom att vikta motproduktionen år 2002. Beräkningarna av emissionsfaktorn grundades på den generellaekvation som anges för bestämning av en specifik CO2 emissionsfaktor för förbränningoch industriella processer i EEA (2003). Enligt denna ekvation bestämsemissionsfaktorn i huvudsak av kolhalten och det effektiva värmevärde hos bränslet.Ekvationen är också i överensstämmelse med IPCCs (Houghton m. fl. 1996, Penman m.fl. 2000) metoder som i mycket stämmer helt överens med metoderna i EEA (2003). Deteffektiva värmevärdet beräknades enligt svensk standard ISO (1996). De tidigaregenomförda beräkningarna på emissionsfaktorn var inte gjorda enligt de ovan beskrivnastandardmetoderna.
Beräkningarna av emissionsfaktorn resulterade i värdet 105,2 g CO2/MJ, medstandardavvikelsen 4,6 g CO2/MJ, vid en fukthalt på 45% samt värdet 107,8 g CO2/MJ,

The carbon dioxide emission factor for combustion of Swedish peat IVL rapport B1595
5
med en standard avvikelse på 4,8g CO2/MJ, vid en fukthalt på 50%. Det betyder attemissionsfaktorn vid dessa fukthalter inte skiljer sig signifikant (inte mer än 2%) frånvarken den i Houghton m. fl. (1996) rekommenderade på 105,9 g CO2/MJ, eller densom idag används vid den svenska rapporteringen i Fink m.fl. (2003) på 107,3 gCO2/MJ. Fukthalten har dock stor betydelse för emissionsfaktorn och även om enfukthalt på 45-50% stämmer väl överens med vad de flesta producenter uppgav så finnsdet undantag. Ett undantag är industriellt torkade torvbriketter som kan ha en fukthalt på6-10%. Idag används både svensktillverkade och importerade torvbriketter vidförbränning i en inte oväsentlig omfattning.
Slutsatserna av denna studie är att emissionsfaktorn för förbränning av svenskenergitorv ligger mycket nära den rekommenderade av IPCC samt den som idaganvänds vi den svenska rapporteringen. Detta förutsatt att torvens fukthalt ligger runt45-50%. För t. ex. torvbriketter med en väsentligt lägre vattenhalt kan det vara lämpligtatt använda en lägre emissionsfaktor.

The carbon dioxide emission factor for combustion of Swedish peat IVL rapport B1595
6
1 IntroductionIn Sweden’s National Emission Inventory Report 2003, submitted under the UnitedNations Convention on Climate Change (UNFCCC) the emissions from stationarycombustion in connection to energy production and heating are determined as theproduct of fuel consumption, fuel thermal value and emission factors (Fink et al. 2003).The carbon dioxide emission factor used for peat consumption in electricity-, gas- andheating plants is 107.3 g CO2/MJ. The default value for this emission factorrecommended by in Houghton et al. (1996) is 105.9 g CO2/MJ. However, three-year-oldanalyses of carbon and energy content of energy peat from HMAB and Råsjö Torv Ltdindicated that the emission factor might be significantly lower than both of these values.Based on the data from the HMAB and Råsjö Torv Ltd peat analyses, the emissionfactor had been (prior to this study) calculated to 91-96 g CO2/MJ depending onmoisture content (6-50%) (Uppenberg et al., 2001, pers. comm. Lars Åstrand, 2003).
2 Objective of the studyThe objective of this study was to review the representativity of the HMAB and RåsjöTorv Ltd peat samples and the accuracy of the calculation methodologies indicating thelower emission factor. An emission factor for combustion of energy peat that would berepresentative to the current production of Swedish energy peat should be calculated.
3 MethodologyIn order to calculate an emission factor valid for the total Swedish production of energypeat, analytical data from peat samples representative for the whole country should beused. Further, the calculations of the emission factor should follow acknowledgedstandard methodologies.
To ensure that the data used in the calculations of the emission factor was representativefor the whole country the origin of the data was investigated. All peat producing regionsin Sweden had to be represented, preferably in a way that reflected the relativecontribution to the total production. The already available data from HMAB and RåsjöTorv Ltd was therefor supplemented with measurements from other peat producers andother regions.
The emission factor for each production site was calculated and a national mean valuewas obtained by using the annual production (in 2002) at each of the selected sites asweight factor.

The carbon dioxide emission factor for combustion of Swedish peat IVL rapport B1595
7
3.1 CO2 emission factor
The CO2 emission factor is determined by the carbon content and the calorific value ofthe fuel. According to the Revised 1996 IPCC Guidelines for National Greenhouse GasInventories (Houghton et al. 1996) there is currently two approaches to draw up andpresent national emission inventories in comparable form:
• The Revised 1996 IPCC Guidelines for National Greenhouse Gas Inventories(Houghton et al. 1996).
• The joint EMEP/CORINAIR Atmospheric Emission Inventory Guidebook (EEA,2003).
The methods which both follow the same basic principles are currently beingharmonised. According to the EMEP/CORINAIR (EEA, 2003) emission factors for theenergy sector (energy and transformation industries) are calculated according toEquation 3.1
Equation 3.1: The CO2 emission factor.
61012
2⋅⋅⋅⋅=
NCVC
MM
EFFUELCO C
C
COR ε
Where EFRCO2 = specified emission factor [g/GJ]CCFUEL = carbon content of fuel (in mass C/mass fuel [kg/kg])ε = fraction of carbon oxidisedNCV = lower heating value / net calorific value of fuel [MJ/kg]MCO2 = Molar mass of carbon dioxide [g/mol]MC = Molar mass of carbon [g/mol]
In the IPCC methodology the fraction of unoxidised carbon is accounted for separately,i.e. it is not included in the emission factor. Since the Swedish EnvironmentalProtection Agency follow the IPCC methodology when reporting to the UNFCCC, thecalculations of the emission factor in this report have been based on Equation 3.2.
Equation 3.2: The emission factor according to IPCC methodology.
61012
2⋅⋅⋅=
NCVC
MM
EFFUELCO C
C
COR
The denotations are the same as in Equation 3.1.

The carbon dioxide emission factor for combustion of Swedish peat IVL rapport B1595
8
3.2 Calorific value
3.2.1 Definitions
The concept of calorific value is rather complicated and often causesmisunderstandings. It is very important to distinguish between net and gross calorificvalues:
Net calorific values (NCVs) measure the specific heat of combustion for the completecombustion of a unit volume or mass of a fuel, assuming the water resulting fromcombustion remains as vapour and the heat of the vapour is not recovered.
Gross calorific values (GCVs) are estimated assuming that the water vapour iscompletely condensed.
3.2.2 Calculation of net calorific values
According to the Swedish standard, ISO (1996) Equation 3.3 should be used to calculatethe net calorific value from the gross calorific value.
Equation 3.3: Net calorific value according to standard method
[ ]{ } ( ) FFNOHGCVNCV DF ⋅−⋅−⋅+−⋅−= 4.2401.018.0212
Where: NCVF = the net calorific value at constant pressure, in joules per gram, of thefuel with moisture content F;1
GCVD = the gross calorific value at constant volume, in joules per gram, ofthe dry fuel.
H = the hydrogen content, in percentage by mass, of the moisture free (dry)fuel (including the hydrogen from the water of hydration of the mineralmatter as well as the hydrogen in the coal substance.
O = the oxygen content, in percentage by mass, of the dry fuel.
N = the nitrogen content, in percentage by mass, of the dry fuel.
F = the total moisture content, in percentage by mass, for which thecalculation is required.
1 For a strict definition of NCV and GCV see the Swedish Standard SS ISO 1928:1995 (E), 1996.
The carbon dioxide emission factor for combustion of Swedish peat IVL rapport B1595
9
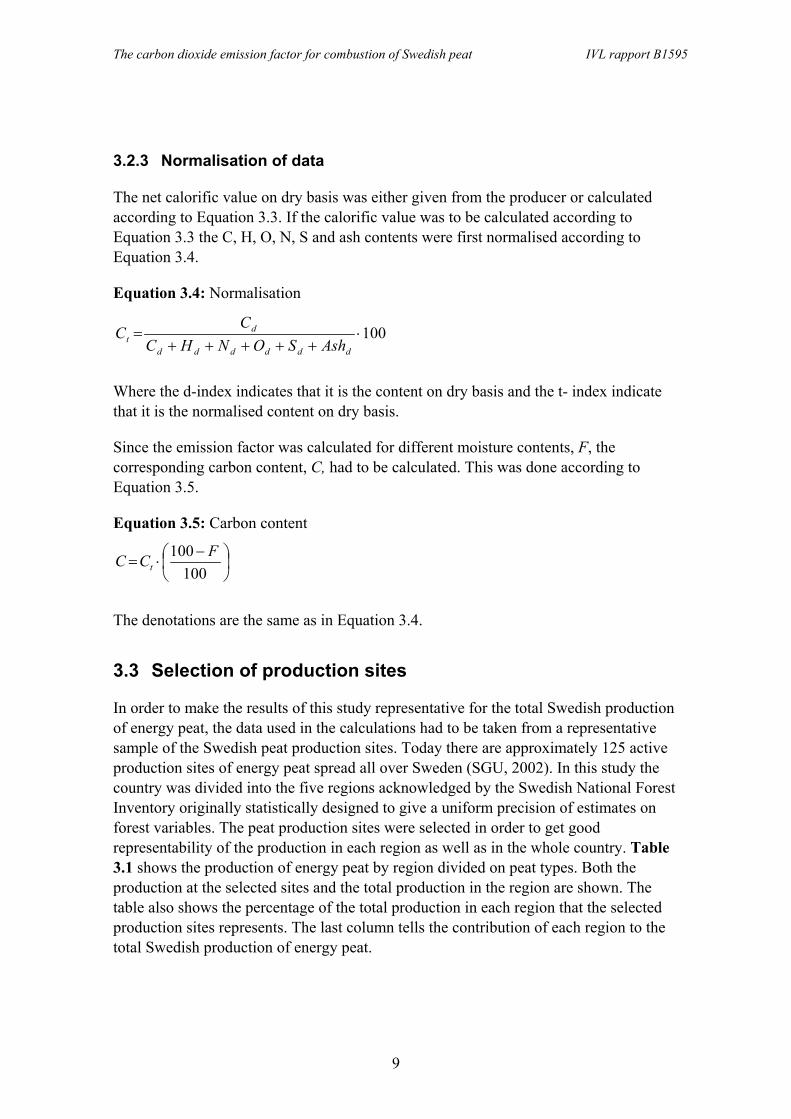
3.2.3 Normalisation of data
The net calorific value on dry basis was either given from the producer or calculatedaccording to Equation 3.3. If the calorific value was to be calculated according toEquation 3.3 the C, H, O, N, S and ash contents were first normalised according toEquation 3.4.
Equation 3.4: Normalisation
100⋅+++++
=dddddd
dt AshSONHC
CC
Where the d-index indicates that it is the content on dry basis and the t- index indicatethat it is the normalised content on dry basis.
Since the emission factor was calculated for different moisture contents, F, thecorresponding carbon content, C, had to be calculated. This was done according toEquation 3.5.
Equation 3.5: Carbon content
−⋅=
100100 FCC t
The denotations are the same as in Equation 3.4.
3.3 Selection of production sites
In order to make the results of this study representative for the total Swedish productionof energy peat, the data used in the calculations had to be taken from a representativesample of the Swedish peat production sites. Today there are approximately 125 activeproduction sites of energy peat spread all over Sweden (SGU, 2002). In this study thecountry was divided into the five regions acknowledged by the Swedish National ForestInventory originally statistically designed to give a uniform precision of estimates onforest variables. The peat production sites were selected in order to get goodrepresentability of the production in each region as well as in the whole country. Table3.1 shows the production of energy peat by region divided on peat types. Both theproduction at the selected sites and the total production in the region are shown. Thetable also shows the percentage of the total production in each region that the selectedproduction sites represents. The last column tells the contribution of each region to thetotal Swedish production of energy peat.

The carbon dioxide emission factor for combustion of Swedish peat IVL rapport B1595
10
Table 3.1: Production of Energy peat by region 2002
Total production inC-peat region compared to total
(kind of sod peat) Sod peat Milled peat Total Swedish production [%]
Region 1Total production [m3] 0 65 736 239 846 305 582 10,6Our samples represents [m3] 0 0 153 659 153 659Our samples represents [%] - 0 64,1 50,3
Region 2 Total production [m3] 202 007 183 830 770 218 1 156 055 40,3Our samples represents [m3] 19 626 45 580 237 297 302 503Our samples represents [%] 9,7 24,8 30,8 26,2
Region 3Total production [m3] 4785 172 723 98 157 275 665 9,6Our samples represents [m3] 0 103 163 47 782 150 945Our samples represents [%] 0 59,7 48,7 54,8
Region 4Total production [m3] 0 652 883 463 525 1 116 408 38,9Our samples represents [m3] 0 152 243 103 395 255 638Our samples represents [%] - 23,3 22,3 22,9
Region 5Total production [m3] 0 0 15 800 15 800 0,6Our samples represents [m3] 0 0 0 0Our samples represents [%] - - 0 0
SwedenTotal production [m3] 206 792 1 751 172 1 587 546 2 869 510 100Our samples represents [m3] 19 626 300 986 542 133 862 745Our samples represents [%] 9,5 28,0 34,2 30,1
Region 1 = The inland of northern NorrlandRegion 2 = The middle part of the inland of Norrland and the northern Norrland coast.Region 3 = The counties of Värmland, Gävleborg and most parts of Dalarna (not Älvdalen)Region 4 = The rest of Svealand and most parts of Götaland.Region 5 = The counties of Skåne, Halland and the coastal regions of Västra Götaland.The source of production quantities is SGU, 2002.
In region 5 there was only one active production area for energy peat, Smörmyren. Theproducer was contacted but did unfortunately not have any of the requiredmeasurements (pers comm. Mats Nilsson, 2003).
The carbon dioxide emission factor for combustion of Swedish peat IVL rapport B1595
11
4 Assumptions, Limitations and UncertaintiesSince mires are very heterogeneous there might be variation in peat characteristicswithin a single production site. In this study many of the peat analyses from thedifferent mires consisted of one or two composite samples, where peat samples fromdifferent depths in the mire are mixed. The reason for depth variation of peatcharacteristics in a mire is mainly due to the different stages of decomposition and age.Therefore the analyses on composite samples (i.e. analyses on a mixture of peat samplesfrom different depths) might reflect the entire production from a site better than asample taken from harvested peat (which only reflects one level in the mire). Ifmeasurements reflecting one level only are used, possible losses through oxidationduring the drainage stage and harvest handling will not be included. However, whencomparing analyses on composite samples with those of harvested peat from the sameproduction site, the differences in carbon and energy content have shown to be small.
The water content of the peat is of great importance to the net calorific value and hencethe emission factor. No complete compilation of moisture content of combusted peatwas made. Data on water content from the producers fell, with one exception, in theinterval 40-50 %. The exception is peat produced by HMAB, which consists of peatbricks with a very low water content and are sometimes mixed with wood. No analysesof these peat bricks were included in this study, still analyses of pure peat from some ofthe HMAB production sites were available and was used. Instead of makingdistinguished assumptions on the water contents of the peat from each specificproduction site, the emission factor was calculated for a number of different watercontents.
The weight factor used when calculating the national average emission factor from theindividual emission factors of each of the selected production sites was the annualproduction in year 2002. The weather determines the harvesting possibilities and thevariation between years could be significant. The early part of the harvesting season2002 was quite wet (pers. comm. Larsson, 2003) and this could alter the relationbetween amount of harvested sod peat and harvested milled peat. However the impacton the national average emission factor should not be significant. The arithmetic meanof the emission factors from each production site only differs slightly (< 1%) from theweighted mean.
It is not uncommon to calculate the net calorific value of peat (and other fuels) on anash free basis. This has not been done in this study. The reason is that according to theIPCC methodology on calculating emissions, a separate oxidation factor should be used.In the new guidelines on monitoring and reporting of greenhouse gas emissions givenby the EU Commission for the reporting of emissions in the EU ETS (emission tradingscheme) it is possible to use specific oxidation factors that are based on the coal content

The carbon dioxide emission factor for combustion of Swedish peat IVL rapport B1595
12
of the ashes and other by-products (Commission Decision 29/01/2004). According toJirjis (pers. comm. 2003) and Burvall ( pers. comm. 2003) to use a separate oxidationfactor (separate form the emissions factor) is the most appropriate procedure since theashes will always be included in the combustion, i.e. there is no way to separate itbefore the combustion. However, calculations of the emission factor performed on netcalorific values on ash free basis show that the differences to the ones resulting fromthis study are small.
5 DataIn Table 5.1 the data used in the calculations of the emission factor is presented. For amore complete information of each of the chosen production sites, see Appendix.
Table 5.1 Data from producers used in calculations
Mire C H O N Ash S GCV NCVwt %2 wt %2 wt %2 wt2 % wt2 % wt2 % [MJ/kg ts3] [MJ/kg ts3]
Kaartivuoma 51,1 19,43Skråttmyran 51,7 6,0 34 1.7 6.6 0.2 21.96Stomyran i Sidskogen 50.9 6.2 35 2.0 6.4 0.2 22.7Saltmyran A+C 53.6 20.87Sjulsmur 55 19.76Röjnoret 1B 56.7 20.90Norrbomuren 54 20.87Orrslätten 54.1 5.6 32.4 1.9 5.7 0.36 21.39Porlamossen 54.2 5.7 33.4 1.8 4.7 0.24 21.7Västkärr 53.2 5.4 31.1 2.4 7.5 0.40 21.14Espenäsmossen 56.1 5.3 34.2 1.2 2.9 0.28 22.65 21.49Hällarydsmossen 54.6 5.9 38.0 1.0 1.0 0.13 21.57Rastamossen 54.1 20.77Stänges-Forellmossen 54.2 6.0 1.5 22.25Sickelmyren 53.9 21.06Slåttkölen 54.4 21.96Översjökölen 53.4 21.52Rössjeflyet 53.07 21.45Stackflon 53.71 21.00
2 wt % is the percentage by weight on dry basis3 MJ/kg ts is the calorific value based on dry substance.

The carbon dioxide emission factor for combustion of Swedish peat IVL rapport B1595
13
6 Results
6.1 Accuracy of old calculations and analyses
The old peat analyses that indicated a lower emission factor were performed on behalfof Vattenfall Värme Uppsala Ltd (former Uppsala Energi) on peat delivered fromHMAB and Råsjö Torv Ltd. These measurements were done about three years ago andthe peat from HMAB was actually peat bricks with a wood content of about 30% (pers.comm. Roland Forsberg, 2003). The analyses gave the gross calorific values, hence thenet calorific values had to be calculated. The calculations of the emission factors hadnot been done according to the IPCC (Houghton et al. 1996) and EMEP/CORINAIR(EEA 2003) methodologies. One very important part of the calculations that differedfrom the IPCC (Houghton et al. 1996) and EMEP/CORINAIR (EEA 2003)methodologies was the consideration of the water content.
6.2 CO2 emission factor according to new calculations
In Table 6.1 the results of the new calculations of the emission factor is presented. Themean values have been calculated by using annual production at each site as a weightfactor. The results show that higher water content results in a higher emission factor(due to the lower net calorific value). The table also contains a compilation of thedifference between the emission factors calculated in this study and the emission factorrecommended by the IPCC, 105.9 g CO2/MJ, and the one used by the SwedishEnvironmental Protection Agency in Sweden’s National Emission Inventory Report,107.3 g CO2/MJ. A negative value mean that the calculated value is lower than therecommended value and a positive value mean that the calculated value is higher thanthe recommended.
Table 6.1: The CO2 emission factor
Difference between mean value andEmission factor [g CO2/MJ] emission factor recommended/used by:
Moisture Content Mean (min – max) Standard deviation IPCC [%] NIR [%]
0 % (dry) 95.0 (86.4-102.0) 3.9 -10.3 -11.46 % 95.8 (87.0-102.8) 3.9 -9.6 -10.840 % 103.2 (93.5-111.1) 4.4 -2.6 -3.945 % 105.2 (95.2-113.4) 4.6 -0.7 -2.050% 107.8 (97.5-116.4) 4.8 1.8 0.4
A negative sign of the difference mean that the value calculated in this study is lower than therecommended value and a positive value mean that the calculated value is higher than the recommended.

The carbon dioxide emission factor for combustion of Swedish peat IVL rapport B1595
14
7 DiscussionAccording to Penman et al. (2000), national emission factors for fuels should bedetermined by selecting data from fuel suppliers/ fuel suppliers’ organisations or plantoperators. Then the calculated values should be compared to the default values given byHoughton et al. (1996). Only if the difference is significant, approximately more than2%, one should bother to investigate the emission factor further. In the case of asignificant difference one should ask fuel research laboratories to provide referencesand then try to find an explanation to the difference. If a good explanation is found onecould use the new emission factor. In the case of this study the difference between theobtained value of the emission factor and the default value given by Houghton et al.(1996), was not significant for a moisture content of 45-50%. Neither was thedifference, for a moisture content of 45-50%, between obtained value and the valueused in Sweden’s National Emission Inventory Report 2003 significant. If the actualmoisture content is higher or lower, the difference between obtained value and defaultvalues will be significant. Therefore it is very important to know what the actualmoisture content, i.e. the net calorific value, of the combusted peat is.
In Sweden’s National Emission Inventory Report 2003 the thermal value (net calorificvalue) of the Swedish peat used for energy and heat production is reported to be 9.91MJ/kg. With the characteristics of the peat obtained in this study that corresponds to amoisture content of ~ 45%. According to Fink et al. (2003), Statistics Swedendetermines the thermal value. This is done by collecting data from peat consumers i.e.combustion plants (pers. comm. Olsson, 2003).
It is also important to be aware of the fact that peat may have water contents that differsignificantly from 45-50%. HMAB produces peat bricks with a very low moisturecontent (6-10%). The peat is dried industrially and then mixed with wood. Today thesepeat bricks constitutes a significant amount of the combusted peat in Sweden (pers.comm. Larsson, 2003). There might be reasons to treat this mixed fuel separately butthe question should be investigated further.
8 ConclusionsAssuming a moisture content of approximately 45 - 50%, the calculated CO2 emissionfactor for peat combustion does not differ significantly from the emission factor used inSweden’s National Emission Inventory Report. Neither does the emission factor at thatwater content differ significantly from the value recommended by the IPCC. A moisturecontent of 45-50% is likely to be a good estimate for most peat producers. Thereforeeither the already used value of 107.3 g CO2/MJ or the default value given by Houghtonet al. (1996) could be used in Sweden’s National Emission Inventory Report. However,

The carbon dioxide emission factor for combustion of Swedish peat IVL rapport B1595
15
the documentation about the currently used national emission factor is poor. Theremight be a reason to use the default value recommended by Houghton et al. (1996). Thereason for this is also that a moisture content of 45% seem to be a good estimate of theactual average, both according to the data obtained in this study and the StatisticsSweden (see Section 7 ), which, according to this study corresponds to an emissionfactor of 105.2 g CO2/MJ which is very close to the IPCC value of 105.9 g CO2/MJ.There are reasons to treat the combustion of peat bricks with a significant wood contentand significantly lower moisture content differently. The wood content should not beconsidered as a fossil fuel and the lower moisture content results in a lower emissionfactor.
9 RecommendationsThe water content and the net calorific value of peat are of great importance to theemission factor. Peat bricks with very low moisture content (and sometimes also asignificant wood content) which today represent a considerable amount of the total useof energy peat in Sweden could be ascribed a lower emission factor than the one used inthe Swedish national emission inventory and the one recommended by the IPCC. Onecould argue that dried peat will cause extra use of energy and should therefore not havea lower emission factor. But if other energy sources are used to dry the peat, thoseshould be associated with emission factors if they result in CO2 emissions. Thus werecommend that when performing emission inventories, the possibility to classify peataccording to moisture content and apply the most appropriate combustion emissionfactor to each class should be considered.

The carbon dioxide emission factor for combustion of Swedish peat IVL rapport B1595
16
10 References
10.1 Literature
Burvall, J., Öhman, M., 2002: Systemstudie över askegenskaper i förbränningsanlägg-ningar vid samförbränning av torv och biobränslen. Report to the Swedish EnergyAgency (STEM).
Commission Decision of 29/01/2004 establishing guidelines for the monitoring andreporting of greenhouse gas emissions pursuant to Directive 2003/87/EC of theEuropean Parliament and of the Council. Brussels 2004.[http://europa.eu.int/comm/environment/climat/pdf/c2004_130_en.pdf].
EEA, 2003. Joint EMEP/CORINAIR Atmospheric Emission Inventory Guidebook, ThirdEdition (October 2002 UPDATE). Copenhagen: European Environment Agency, 2003.
Fink, S., Hammarsköld, G., Pettersson, S., Staaf, H., Österberg, K., Adolfsson, R.,Ivarsson, A-K., Lidén, M., Kindbom K., Skårman, T., Boström, C-Å, Peterson, H. 2003.Sweden’s National Inventory Report 2003- submitted under the United NationsConvention on Climate Change. Swedish Environmental Protection Agency.Stockholm, Sweden. [www.naturvårdsverket.se].
Penman, J., Kruger, D., Galbally, I., Hiraishi, T., Nyenzi, B., Emmanul, S., Buendia,L., Hoppaus, R., Martinsen, T., Meijer, J., Miwa, K., Tanabe, K. (eds.) 2000. IPCCGood practice Guidance and Uncertainty Management in National Greenhouse GasInventories. [http://www.ipcc-nggip.iges.or.jp/public/gp/gpgaum.htm]
Houghton, J.T., Meira Filho, L.G., Lim, B., Treanton, K., Mamaty, I., Bonduki, Y.,Griggs, D.J., Callender, B.A. (eds.) 1996. Revised 1996 IPCC Guidelines for NationalGreenhouse Gas Inventories: Reference Manual. [http://www.ipcc-nggip.iges.or.jp/public/gl/invs1.htm]
ISO 1928:1995, 1996. Solid mineral fuels – Determination of gross calorific value bythe bomb calorimetric method, and calculation of net calorific value. SS ISO 1928:1995(E).
SGU, Swedish Geological Survey, 2002 (not published)
Uppenberg, S., Zetterberg, L., Åhman, M., 2001, Climate impact from Peat Utilisationin Sweden. IVL B-rapport NR. 1423, Stockholm 2001.

The carbon dioxide emission factor for combustion of Swedish peat IVL rapport B1595
17
10.2 Personal communications
Forsberg Roland, 2003, Vattenfall Värme Uppsala AB.
Nilsson Mats, 2003, Södra Skogsenergi AB
Åstrand Lars, 2003, Swedish Peat Research Foundation.
Olsson Barbro, 2003, Statistics Sweden.
Lars-Erik Larsson, 2003, Swedish Peat Research Foundation.
Jirjis Raida, 2003, Department of Bioenergy, SLU, Uppsala
Burvall Jan, 2003, Department of Biomass Technology and Chemistry, SLU, Umeå.

The carbon dioxide emission factor for combustion of Swedish peat IVL rapport B1595
18
AppendixThe bold values given in the column with data collected from producers are the ones that have been usedto calculate the emission factor.
Mire/Productionarea
Fraction of sodpeat (sp) &milled peat (mp)
Data collected Method Emission factor[g CO2/MJ]at given MC
Kaartivuoma sp = 61%mp = 39 %
Ash = 7.56C = 51.1H = 5.69O = 32.8N = 2.28S = 0.33GCV = -NCV = 19.43MC = 35 (sp), 45 (mp)
The NCV is an average of measurements onthe 2002 production. The NCV from theconcession application is 20,31 MJ/kg. Theproducer expects that the ash content willdecrease and the NCV will increase in thefuture. C, H, O, N, S are averages for the 2002production. The MC values are the onesaimed for.
dry = 96.66% = 97.440% = 105.545% =107.750% = 110.5
Skråttmyran sp = 45%mp = 55 %
Ash = 6.6C = 51.7H = 5.96O = 34N = 1.7S = 0.2GCV = 21.96NCV = calculatedMC = 40 (sp), 50 (mp)
The values are the results of measurements onpeat performed at the combustion plant inUppsala (Vattenfall Värme Uppsala). TheNCV has been calculated from thesemeasurements. The MC’s are estimated valuesfrom the producer and is general for their totalproduction.
dry = 91.56% = 92.240% = 99.345% =101.350% =103.8
Stormyran iSidskogen
sp = 100 %mp = 0 %
Ash = 6.4C = 50.9H = 6.2O = 35N = 2.0S = 0.2GCV = 22.78NCV = calculatedMC = 40 (sp), 50 (mp)
The values are the results of measurements onpeat performed at the combustion plant inUppsala (Vattenfall Värme Uppsala). TheNCV has been calculated from thesemeasurements. The MC’s are estimated valuesfrom the producer and is general for their totalproduction.
dry = 86.46% = 87.040% = 93.545% =95.250% =97.5
Saltmyran A+C sp = 0 %mp = 100
Ash = -C = 53.6H = -O = -N = -S = -GCV = -NCV = 20.87MC = -
dry = 94.16% = 94.840% = 102.145% = 104.150% =106.6
Sjulsmur sp = 86 %mp = 14 %
Ash = 10.1C = 55H = 5.5O = -N = -S = -GCV = 21.79NCV = 19.76MC = -
The carbon content is an estimate done by theproducer. The produced peat at Sjulsmur isstarrtorv and the mean value for carboncontent is 55. The NCV is the mean valuefrom measurements on 2002 production (24measurements).
dry = 102.06% = 102.840% = 111.145% =113.550% =116.4
Röjnoret 1B sp = 6 %mp = 94 %
Ash = 4.3C = 56.7H = 5.89O =N = -S = 0.4GCV = 22.90NCV = -MC = -
dry = 101.86% = 102.640% = 110.645% =112.850% =115.6

The carbon dioxide emission factor for combustion of Swedish peat IVL rapport B1595
19
Mire/Productionarea
Fraction ofsod peat (sp)& milled peat(mp)
Data collected Method Emission factor[g CO2/MJ]at given MC
Norrbomuren sp = 100 %mp = 0 %
Ash = 2.4C = 54H =O = -N = -S = -GCV =NCV = 20.87MC = -NCV =
The carbon content is an estimate done by theproducer. The produced peat at Sjulsmur isvitmossetorv and the mean value for carboncontent is 54%. The NCV is the mean valuefrom measurements on 2001 and 2002production (7 measurements).The mean NCV from the concessionapplication (1982) is 20,0.The ash content is an average from theconcession application.
dry = 94.86% = 95.540% = 102.845% =104.850% =107.4
Orrslätten sp = 0 %mp = 100 %
Ash = 5.7C = 54.1H = 5.6O = 32.4N = 1.9S = 0.36GCV = 21.39NCV = calculatedMC = -
The values are the results of measurements onpeat performed at the combustion plant inUppsala (Vattenfall Värme Uppsala). TheNCV has been calculated from thesemeasurements.
dry = 98.26% = 99.040% = 106.845% =109.050% =111.7
Porlamossen sp = 0 %mp = 100 %
Ash = 4.7C = 54.2H = 5.7O = 33.4N = 1.8S = 0.24GCV = 21.76NCV = calculatedMC = -
The values are the results of measurements onpeat performed at the combustion plant inUppsala (Vattenfall Värme Uppsala). TheNCV has been calculated from thesemeasurements.
dry = 96.76% = 97.540% = 105.145% =107.250% =109.8
Västkärr sp = 25 %mp = 75 %
Ash = 7.5C = 53.2H = 5.4O = 31.1N = 2.0S = 0.40GCV = 21.14NCV = calculatedMC = -
The values are the results of measurements onpeat performed at the combustion plant inUppsala (Vattenfall Värme Uppsala). TheNCV has been calculated from thesemeasurements.
dry = 98.06% = 98.840% = 106.745% =108.950% =111.7
Espenäsmossensp = 50 %mp = 50 %
Ash = 2.88C = 56.06H = 5.34O = 34.24N = 1.18S = 0.28GCV = 22.65NCV = 21.49MC = -
The measurements are performed on peatharvested during 1998. The NCV wascalculated according to the SS-ISO 1928standard. Measurements were made at fivedifferent locations on the mire. The moisturecontent of the peat generally is about 40% butat times it can be over 50%.
dry = 95.66% = 96.340% = 103.445% =105.450% =107.8
Hällarydsmossen sp = 75%mp = 25 %
Ash = 1.0C = 54.6H = 5.9O = 38.0N = 1.0S = 0.13GCV = 21.57NCV = calculatedMC = -
The values are the results of measurements onpeat performed at the combustion plant inUppsala (Vattenfall Värme Uppsala). TheNCV has been calculated from thesemeasurements.
dry = 98.06% = 98.740% = 106.545% =108.650% =111.3

The carbon dioxide emission factor for combustion of Swedish peat IVL rapport B1595
20
Mire/Productionarea
Fraction of sodpeat (sp) &milled peat (mp)
Data collected Method Emission factor[g CO2/MJ]at given MC
Ryds mosse /Rasta mossen
sp = 100 %mp = 0 %
Ash = 1.47C = 54.1H = -O = -N = 1.23S = 0.21GCV = -NCV = 20.77MC = -
The ash, S and NCV values are averages from15 measurements. The N-value is an averageof 3 measurements. The carbon content ismeasured on harvested peat.
dry = 95.46% = 96.240% = 103.545% =105.650% =108.1
Stänges-Forellmossen
sp = 100 %mp = 0 %
Ash =C = 54.2H =O =N =S =GCV =NCV = 22.25MC = -
The NCV value is an average from compositesample and the carbon content is measured onharvested peat.
dry = 94.86% = 95.540% = 102.845% =104.850% =107.3
Sickelmyren sp = 0 %mp = 100 %
Ash = 3.53C = 53.85H = -O = -N = -S = -GCV =NCV = 21.06MC = -
dry = 93.76% = 94.440% = 101.545% = 103.550% = 106.0
Slåttkölen sp = 0 %mp = 100 %
Ash = 2.46C = 54.39H = -O = -N = -S = -GCV =NCV = 21.96MC = -
dry = 90.86% = 91.440% = 98.045% = 99.850% =102.1
Översjökölen sp = 0 %mp =100 %
Ash = 2.56C = 53.4H = -O = -N = -S = -GCV =NCV = 21.52MC = -
dry = 90.96% = 91.640% = 98.445% = 100.250% =102.5
Rössjeflyet sp = 0 %mp = 100 %
Ash = 4.39C = 53.07H = -O = -N = -S = -GCV =NCV = 21.45MC = -
dry = 90.76% = 91.340% = 98.145% = 100.050% =102.3

The carbon dioxide emission factor for combustion of Swedish peat IVL rapport B1595
21
Mire/Productionarea
Fraction of sodpeat (sp) &milled peat (mp)
Data collected Method Emission factor[g CO2/MJ]at given MC
Stackflon sp = 0 %mp = 100 %
Ash = 4.6C = 53.71H = -O = -N = -S = -GCV =NCV = 21.00MC = -
dry = 93.76% = 94.440% = 101.645% = 103.650% =106.0
Used abbreviations:
Ash = ash content [% weight]C = carbon content [% weight]H = hydrogen content [% weight]O = oxygen content [% weight]N = nitrogen content [% weight]S = sulphur content [% weight]GCV = gross calorific value [MJ/kg dry substance]NCV = net calorific value [MJ/kg dry substance]MC = moisture content

IVL Svenska Miljöinstitutet AB IVL Swedish Environmental Research Institute Ltd
P.O. Box 210 60, SE-100 31 Stockholm P.O. Box 5302, SE-400 14 Göteborg Aneboda, SE-360 30 LammhultVisit: Hälsingegatan 43, Stockholm Visit: Aschebergssgatan 44 Aneboda, LammhultPhone: +46 8 598 563 00 Phone: +46 31 725 62 00 Phone: +46 0472 26 77 80Fax: +46 8 598 563 90 Fax: +46 31 725 62 90 Fax: +46 472 26 77 90
www.ivl.se