analysis of energy consumption and carbon dioxide ... › recopilatorio › ponencias › ... ·...
TRANSCRIPT

CASTELLÓN (SPAIN)
1
ANALYSIS OF ENERGY CONSUMPTION AND
CARBON DIOXIDE EMISSIONS IN CERAMIC
TILE MANUFACTURE(1) E. Monfort, (1) A. Mezquita, (1) R. Granel, (1) E. Vaquer, (1) A. Escrig
(2) A. Miralles, (2) V. Zaera
(1) Instituto de Tecnología Cerámica (ITC)
Asociación de Investigación de las Industrias Cerámicas (AICE)
Universitat Jaume I. Castellón. Spain(2) Asociación Española de Fabricantes de Azulejos y Pavimentos Cerámicos
(ASCER). Castellón. Spain

2
CASTELLÓN (SPAIN)
1. INTRODUCTION
The ceramic tile manufacturing process uses a lot of energy, mainly thermal energy, and to a lesser extent electric energy.
All the stages in the manufacturing process use electric energy. Thermal energy consumption occurs mainly in three stages: spray drying of the ceramic suspensions, drying of the bodies, and tile firing. The thermal energy used in the process is primarily obtained by natural gas combustion.
Total energy costs (electric and thermal) account for between 17 and 20% of average direct manufacturing costs. This percentage varies according to the type of product manufactured by each company, but in some cases it can be more than 25%. These costs are directly related to the price of natural gas, which has risen significantly in recent years.
Fossil fuel combustion, such as natural gas combustion, produces carbon dioxide emissions, CO2 being one of the greenhouse gases responsible for climate change and global warming.
Carbon dioxide emissions from ceramic tile production are divided into two groups [1]:
- Combustion emissions: these are emissions produced during the exothermic combustion reaction between the fuel and the oxidiser.
- Process emissions: these are emissions produced by the decomposition of carbonates present in the raw materials during the firing stage.
Greenhouse gas emissions are internationally monitored and controlled. The Spanish law is based on the European Directive on emissions trading [2], and the assignment of emission rights in the sectors involved, one of which is the ceramic tile manufacturing industry, which has been carried out to date based on historical values.
Currently, most Spanish ceramic companies are still below the thresholds to be affected by the emissions trading system. Of a total of more than 200 installations, only 36 are part of the system, eight because they surpass the limits demanded in the ceramic product firing process, and the others because their combustion power facilities exceed 20 MW.
The recent review of the legislation by the European Commission has led to the publication of a new Directive, which will come into force between 2013 and 2020. The New Directive (2009/29/EC) introduces important changes with respect to the current situation, which directly affect the ceramic tile manufacturing industry [3].

3
CASTELLÓN (SPAIN)
2. PURPOSE
The purpose of this study is to analyse energy consumption and carbon dioxide emissions in the ceramic tile and spray-dried granule manufacturing process, both overall and broken down by production stages and by products manufactured.
3. METHODOLOGY USED
The information necessary to carry out the proposed study was gathered by conducting an industry study that covered Spanish ceramic tile and spray-dried granule manufacturing companies.
The analysis was carried out to several levels of detail. Each of these levels is detailed below, from greater to lesser levels of detail:
- LEVEL 1: This was at industry level. Global consumption of energy and total carbon dioxide emissions in the ceramic tile manufacturing and spray-dried granule manufacturing industry in 2007.
- LEVEL 2: This was at company level. Thermal and electric energy consumption of spray-dried granule and ceramic tile manufacturers were studied during long periods of operation.
- LEVEL 3: This corresponds to the process stage level. Thermal energy consumption and CO2 emissions were determined for the main manufacturing stages that consumed thermal energy, during short periods of time under a steady-state operating regime. When possible, these values were determined for the main ceramic compositions manufactured in the sector.
The methodology used in the study involved the following activities:
- Bibliographic search and compilation of information from studies, statistical analyses, databases and publications on electric consumption in the manufacture of ceramic tile and spray-dried granule manufacturing in Spain and in other manufacturing countries [4].
- Distribution of a questionnaire to 183 companies, covering 82% of companies in the sector.
- Personal visits to more than 50 companies to gather information on annual energy consumption and to determine experimentally the consumption in spray-dryers, dryers and kilns. In total, more than 240 measurements were taken in industrial installations.
Table 1 shows the total number of companies participating in the study and the production share of these companies over total national production in 2008.

4
CASTELLÓN (SPAIN)
Number of participating companies 55
Number of participating production plants 65
Production shareSpray dried granules 48 %
Tiles 34 %
Table 1. Sample of companies studied.
The percentage of production covered was considered adequate for obtaining representative data of the situation in the Castellón ceramic sector on energy consumption and carbon dioxide emissions.
4. RESULTS OBTAINED
4.1. LEVEL 1: Energy consumption and CO2 emissions in the sector.
The fuel most commonly used in the Spanish ceramic tile and spray-dried granule sector is natural gas. It is used in cogeneration systems for simultaneous production of electric and thermal energy, and in burners for generating thermal energy, mainly in the spraying, drying and firing stages.
In 2008, natural gas consumption as the demand for final energy in the sector reached 14131 GWh (in relation to the fuel HHV).
The electric energy consumed by the sector comes partly from the electricity grid and from cogeneration systems. Total energy consumption was 1187 GWh in 2008.
Therefore, natural gas accounts for 92% of the sector’s total energy demand, and the remaining 8% corresponds to electric energy consumption. These results are shown in figure 1.
Figure 1. Distribution of energy consumption in the ceramic tile and spray-dried granule manufacturing sector in 2007.
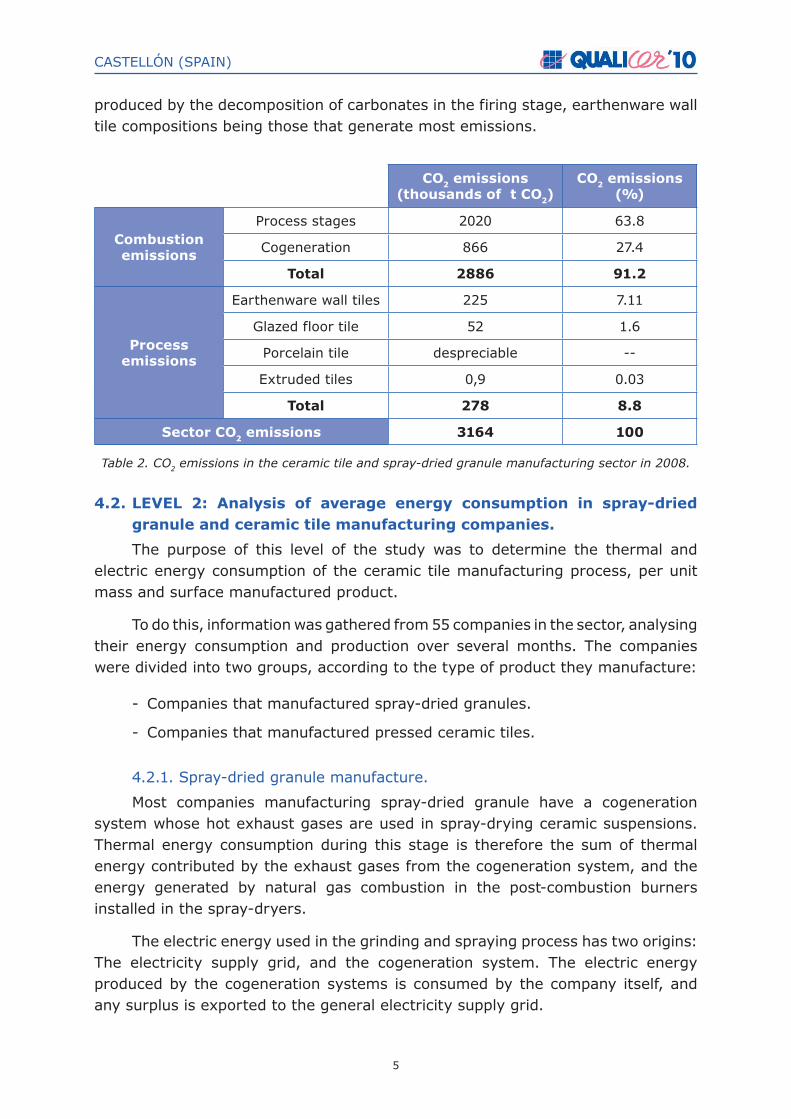
Based on energy consumption in the sector in 2008, sector carbon dioxide emissions were calculated. The calculations took into account both combustion emissions and processes. The results obtained are shown in table 2.
Ninety-one per cent of carbon dioxide emissions in the ceramic sector come from natural gas combustion. The remaining 9% corresponds to emissions
5
CASTELLÓN (SPAIN)
produced by the decomposition of carbonates in the firing stage, earthenware wall tile compositions being those that generate most emissions.
CO2 emissions(thousands of t CO2)
CO2 emissions (%)
Combustionemissions
Process stages 2020 63.8
Cogeneration 866 27.4
Total 2886 91.2
Processemissions
Earthenware wall tiles 225 7.11
Glazed floor tile 52 1.6
Porcelain tile despreciable --
Extruded tiles 0,9 0.03
Total 278 8.8
Sector CO2 emissions 3164 100
Table 2. CO2 emissions in the ceramic tile and spray-dried granule manufacturing sector in 2008.
4.2. LEVEL 2: Analysis of average energy consumption in spray-dried granule and ceramic tile manufacturing companies.
The purpose of this level of the study was to determine the thermal and electric energy consumption of the ceramic tile manufacturing process, per unit mass and surface manufactured product.
To do this, information was gathered from 55 companies in the sector, analysing their energy consumption and production over several months. The companies were divided into two groups, according to the type of product they manufacture:
- Companies that manufactured spray-dried granules.
- Companies that manufactured pressed ceramic tiles.
4.2.1. Spray-dried granule manufacture.
Most companies manufacturing spray-dried granule have a cogeneration system whose hot exhaust gases are used in spray-drying ceramic suspensions. Thermal energy consumption during this stage is therefore the sum of thermal energy contributed by the exhaust gases from the cogeneration system, and the energy generated by natural gas combustion in the post-combustion burners installed in the spray-dryers.
The electric energy used in the grinding and spraying process has two origins: The electricity supply grid, and the cogeneration system. The electric energy produced by the cogeneration systems is consumed by the company itself, and any surplus is exported to the general electricity supply grid.

6
CASTELLÓN (SPAIN)
Table 3 shows, in ranges, the distribution percentages of the origin of the thermal energy, of the electric energy, and of the destination of the electric energy generated in spray-dried granule manufacturing companies.
Origin of the thermal energyCogeneration 47 – 100%
Post-combustion 0 – 53%
Origin of the electric energyPurchased 0.4 – 19%
Self-consumption 81 – 99,6%
Destination of the electric ener-gy produced by cogeneration
Sale 28 – 91%
Self-consumption 9 – 72%
Table 3. Energy distribution in spray-dried granule manufacturing companies.
The results obtained show great variations among the situations of companies, because this distribution depends on several variables, such as the power of the cogeneration systems, how they are managed, each company’s electricity consumption and time distribution, the economic regimen applicable to the sale of electric energy, etc.
The energy consumption and production data supplied by the companies were used to calculate the thermal and electric energy consumption per unit mass of the manufactured product. The results obtained are summarised in table 4.
Spray-dried granule manufacture
Number of companies 11
Energy consumption(kWh/ ton dry solid)
Thermal(in relation to the HHV) 452 ± 94
Electric 52 ± 15
(*) HHV: Higher heating value of the fuel.Table 4. Specific energy consumption in the spray-dried granule manufacturing process.
4.2.2. Pressed ceramic tile manufacture.
The average energy consumption in companies manufacturing pressed ceramic tiles (without raw materials preparation) is shown in table 5. The specific thermal energy consumption was calculated, relative to fired product mass and tile surface area.

7
CASTELLÓN (SPAIN)
Pressed tile manufacture (drying and firing)
Number of companies 46
Thermal energy consumption(in relation to HHV)
kWh/t firedproduct 960 ± 62
kWh/m2 firedproduct 19 ± 2
Electric energy consumption
kWh/t firedproduct 109 ±11
kWh/m2 firedproduct 2.1 ± 0.2
Table 5. Specific energy consumption in pressed ceramic tile manufacturing(drying and firing stages).
4.3. LEVEL 3: Analysis by stages of thermal energy consumption and CO2 emissions.
An analysis was made of energy consumption in the main natural gas consuming facilities in the ceramic tile manufacturing process, which includes the wet preparation of raw materials and forming by pressing. spray dryers, tile dryers, and kilns.
This analysis was carried out by taking experimental measurements in industrial installations under steady-state operation, in other words, during the measurement period no changes occurred in the operating variables.
Specific thermal energy consumption in an installation during a long period of time, which covers situations of steady-state and non-steady-state operation, and even some stoppages, is higher than the consumption measured during short periods of time under steady-state operation. Because of this, the consumption shown in this section differs from that shown in part 4.2.
In effect, it has been estimated that the degree of energy efficiency in companies manufacturing pressed tiles falls in the range between 83% and 91%, depending on each company’s product management. This value is influenced by production stoppages at weekends, when the kiln is undergoing maintenance or is in stand-by mode.
The number of experimental measurements made in kilns was much higher than the number of measurements taken in spray-dryers or dryers, because kilns normally have an individual natural gas flow meter that determines energy consumption, which does not usually occur for the rest of the facilities analysed.
Therefore, the analysis of energy consumption and emissions in spray dryers and dryers is not as comprehensive as that carried out in roller furnaces, in which it has been possible to break down consumption by type of manufactured product.

8
CASTELLÓN (SPAIN)
4.3.1. Energy consumption.
4.3.1.1. Spray-drying stage.
In the wet preparation process, the raw materials are suspended in water and the resulting suspension needs to be dried. This process takes place in spray dryers.
The average specific energy consumption of the spray-drying stage is set out in table 6. The value obtained is 476 kWh/t dry solid. This value can also be calculated with reference to the mass of fired product by measuring the mass loss of the compositions during firing.
The results are presented together with the error obtained in the calculation of the average value.
Number of spray dryers 12
Number of experimental measurements 24
Specific consumptionkWh/t dry solid 476 ± 19
kWh/t fired product 510 ± 23
Table 6. Thermal energy consumption in the spray-drying stage (in relation to the HHV).
The average values obtained in the main operating variables of the analysed spray dryers are set out in table 7.
Spray - dried granuel production(t dry solid/h) 23 ± 4
Slurry solids content (%) 65.0 ± 0.7
Spray-dried granuel moisture content % 6.2 ± 0.3
Table 7. Average operating conditions in the spray drying stage.
4.3.1.2. Drying stage.
Recently formed tile bodies are dried in continuous roller dryers, which may be either horizontal or vertical. Table 8 shows the average specific consumption in the drying stage, for both types of studied dryers.
Dryer type Vertical Horizontal
Number of facilities in the study 4 1
Number of experimental measurements 8 5
Specificconsumption
kWh/t dry solid 115 ± 19 117 ± 18
kWh/t fired product 125 ± 20 124 ± 21
Table 8. Thermal energy consumption in the drying stage (in relation to the HHV).

9
CASTELLÓN (SPAIN)
Table 9 shows the average values of the main operating variables in the drying stage, in the facilities analysed.
Production (t ss/h) 2.1 ± 0.2
Tile body moisture content on entry (%) 6.0 ± 0.2
Tile body moisture content on exit (%) 0.5 ± 0.3
Table 9. Average operating conditions in the drying stage.
4.3.1.3. Firing stage.
The kilns used for firing ceramic tiles are single-deck roller kilns. A total of 52 kilns were included in the study.
The annual specific consumption of the firing kilns, broken down by manufactured product, is shown in table 10. The results obtained for porcelain tile and glazed stoneware tile with a white body have been grouped together, because in the cases analysed their composition barely differed.
ProductRed
earthenware tile
Whiteearthenware
tile
Red-bodystoneware
White-body
stoneware
Total; Average
value
Number ofexperimental
measurements42 28 60 77 207
Specificconsumption
kWh/t fired
product816 ± 27 885 ± 51 724 ± 18 802 ± 20
793 ± 14
kWh/m2 fired
product13.4 ± 0,5 16.0 ± 1.4 14.3 ± 0.4 17.4 ± 0.6
15.5 ± 0.4
Table 10. Thermal energy consumption in the firing stage (in relation to the HHV).
Figure 2 and figure 3 are graphs showing energy consumption during the firing stage, expressed per unit fired mass and unit fired surface area, respectively, for the compositions studied in this work.

10
CASTELLÓN (SPAIN)
Figure 2. Specific consumption during the firing stage (kWh/t fired product), in steady-state
operation.
Figure 3. Specific consumption during the firing stage (kWh/m2 fired product), in steady-
state operation.
Figure 2 shows that the average consumption per unit mass is greater in earthenware tile than in stoneware tile compositions. Glazed red-body stoneware is the product that consumes the least energy. However, when expressing the results per unit surface area, porcelain tile and white-body stoneware tile are the products with the highest specific consumption. This is because the specific weight of the earthenware tiles is lower than that of the porcelain tiles.
Table 11 summarises the average values of the main operating parameters of single-deck roller kilns for firing ceramic tiles.
CompositionRed-body
earthenwaretile
White-bodyearthenware
tile
Red-bodystoneware
White-bodystoneware
andporcelain
tile
MA
TE
RIA
L
Fired thickness (mm) 9.4 ± 0,3 10.5 ±0,6 9.3 ± 0,2 9.7 ± 0,3
Specific weight (kg/m2) 16.4 ± 0,5 18.0 ± 1,0 19.7 ± 0,4 21.7 ± 0,6
Moisture content to entry (%) 1.3 ± 0,1 0.9 ± 0,2 1.0 ± 0,1 0.6 ± 0,1
Carbonate content (%) 13,1 ± 0,2 12.5 ± 0,6 3.3 ± 0,1 <0,5
Loss on ignitiion (%) 9.9 ± 0,1 10.1 ± 0,3 5.5 ± 0,1 4.0 ± 0,1
OP
ER
AT
ION
Production
kg fired product/s
1,05 ± 0,09 0.93 ± 0,12 1.29 ± 0,10 1.10 ± 0,07
m2/day 5550 ± 420 4590 ± 700 5620 ± 420 4390 ± 280
Duration of cycle (minutes) 47 ± 2 59 ± 5 46 ± 1 57 ± 2
Maximum temperature (ºC) 1126 ± 6 1144 ± 6 1147 ± 2 1192 ± 2
Use of the deck of tiles (%) 82 ± 2 82 ± 3 83 ± 2 84 ± 1
Table 11. Average operating parameters during the firing stage of pressedceramic tiles in roller kilns.
11
CASTELLÓN (SPAIN)
4.3.1.4. Distribution of energy consumption.
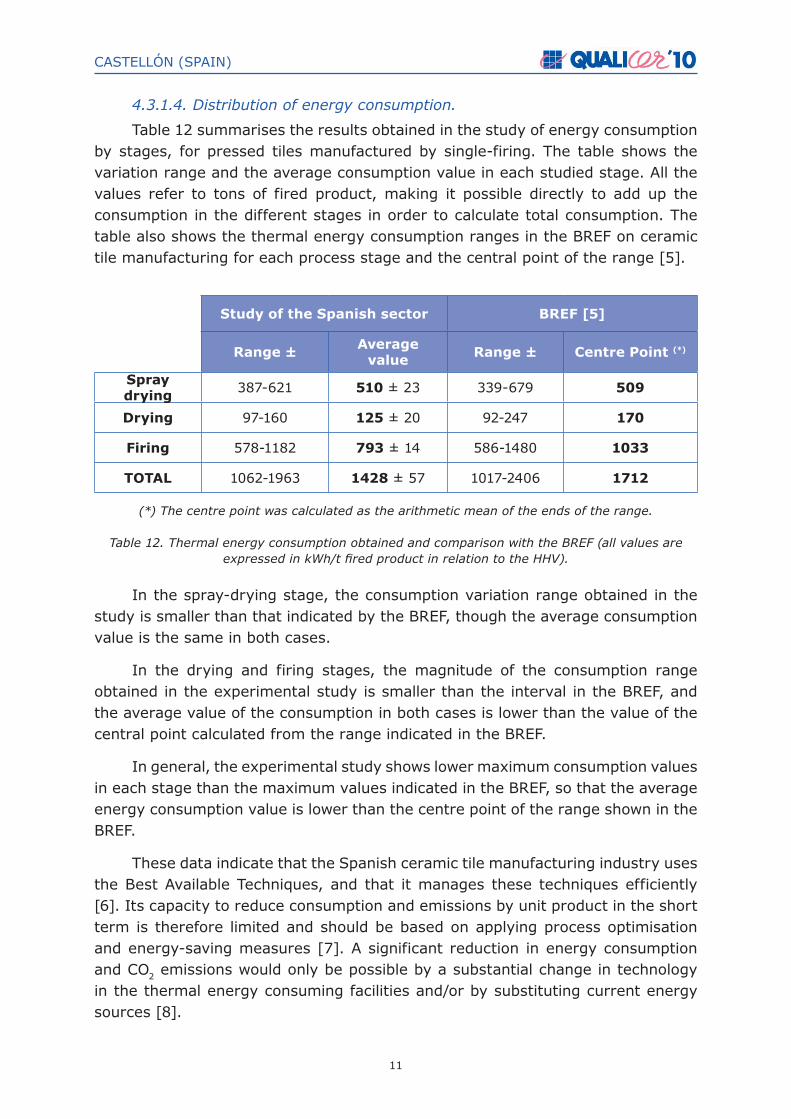
Table 12 summarises the results obtained in the study of energy consumption by stages, for pressed tiles manufactured by single-firing. The table shows the variation range and the average consumption value in each studied stage. All the values refer to tons of fired product, making it possible directly to add up the consumption in the different stages in order to calculate total consumption. The table also shows the thermal energy consumption ranges in the BREF on ceramic tile manufacturing for each process stage and the central point of the range [5].
Study of the Spanish sector BREF [5]
Range ± Average value Range ± Centre Point (*)
Spray drying 387-621 510 ± 23 339-679 509
Drying 97-160 125 ± 20 92-247 170
Firing 578-1182 793 ± 14 586-1480 1033
TOTAL 1062-1963 1428 ± 57 1017-2406 1712
(*) The centre point was calculated as the arithmetic mean of the ends of the range.
Table 12. Thermal energy consumption obtained and comparison with the BREF (all values are expressed in kWh/t fired product in relation to the HHV).
In the spray-drying stage, the consumption variation range obtained in the study is smaller than that indicated by the BREF, though the average consumption value is the same in both cases.
In the drying and firing stages, the magnitude of the consumption range obtained in the experimental study is smaller than the interval in the BREF, and the average value of the consumption in both cases is lower than the value of the central point calculated from the range indicated in the BREF.
In general, the experimental study shows lower maximum consumption values in each stage than the maximum values indicated in the BREF, so that the average energy consumption value is lower than the centre point of the range shown in the BREF.
These data indicate that the Spanish ceramic tile manufacturing industry uses the Best Available Techniques, and that it manages these techniques efficiently [6]. Its capacity to reduce consumption and emissions by unit product in the short term is therefore limited and should be based on applying process optimisation and energy-saving measures [7]. A significant reduction in energy consumption and CO2 emissions would only be possible by a substantial change in technology in the thermal energy consuming facilities and/or by substituting current energy sources [8].

12
CASTELLÓN (SPAIN)
4.3.2. Carbon dioxide emissions.
The average carbon dioxide emissions produced in ceramic tile manufacture are shown in table 13. The data correspond to the emissions produced by natural gas combustion in each stage of the process, during steady-state operation. The process emissions generated in the firing stage are broken down by type of composition.
Stage of the process Combustionemissions
Processemissions TOTAL
Spray drying 93 ± 4 - 93 ± 4
Drying 23 ± 2 - 23 ± 2
Firing
Red-body earthenware tile 149 ± 5 64 ±1 213 ± 5
White-body earthenware tile
161 ± 9 61 ± 3 222 ± 10
Red-body stoneware tile 132 ± 3 15 ± 1 147 ± 3
White-body porcelain and stoneware tile
147 ± 4 <1 147 ± 4
TOTAL
Red-body earthenware tile 265 ±11 64 ± 1 329 ± 11
White-body stoneware tile 277 ± 15 61 ± 3 338 ± 18
Red-body stoneware tile 248 ± 9 15 ± 1 263 ± 9
White-body porcelain and stoneware tile
263 ± 10 <1 263 ± 10
Table 13. Specific CO2 emissions in the ceramic tile manufacturing process (kg CO2/t fired product) in steady-state operation.
The results set out in table 13 are displayed in graphs in figure 4 and in figure 5.
0
50
100
150
200
250
300
350
Spray drying Drying Firing Total
CO
2(k
g C
O2/
t fir
ed p
rod
uct
)
Process emissions Combustion emissions
Figure 4. Average CO2 emissions (steady-state operation).

13
CASTELLÓN (SPAIN)
0
50
100
150
200
250
Red-bodyearthenware
tile
White-bodyearthenware
tile
Red-bodysatoneware tile
White-bodystoneware andporcelain tile
CO
2em
issi
on
s in
fir
ing
(k
g C
O2/
t fir
ed p
rod
uct
)
Process emissionsa Combustion emissions
Total emissions
Figure 5. CO2 emissions in the firing stage (steady-state operation).
5. CONCLUSIONS
The main conclusions of this study are as follows:
- Of the final energy demand in the ceramic tile and spray-dried granule manufacturing industry, 91.3% corresponds to thermal energy, while electricity consumption accounts for 8.7% of total energy consumption.
- In 2008, the ceramic tile manufacturing sector emitted 2.9 million tons of carbon dioxide into the atmosphere. Of these emissions, 91% were generated by natural gas combustion in the cogeneration systems and process facilities and the remaining 9% by the decomposition of the carbonates present in the raw materials during the firing stage.
- In the two types of studied companies (spray-dried granule manufacturers and pressed ceramic tile manufacturers), specific thermal energy and electricity consumption correspond, respectively, to 90% and 10% of total consumption in the respective processes.
- The stages with thermal energy consumption in the process are spray drying of the ceramic suspensions, and drying of the tile bodies. The firing stage uses the largest amount of energy (55% of total consumption), followed by spray drying of the suspensions (36%) and tile drying (9%).
- The difference in energy consumption, measured among kilns manufacturing different products, was approximately 20%. Given the large number of variables in this stage (tile thickness, carbonate content, cycle, etc) and that some are not independent, it was difficult clearly to establish the main factors behind these differences. This stage should be studied in greater detail in order to establish the influence of the various variables on energy consumption.

14
CASTELLÓN (SPAIN)
- Process emissions (due to carbonate decomposition) accounts for around 19% of total CO2 emissions during the firing stage for earthenware wall tile compositions. Red-body stoneware tile compositions are responsible for about 6% of total process emissions. White-body stoneware and porcelain tile emissions are negligible compared with combustion emissions, because there are only very small amounts of carbonates in the compositions.
- The average energy consumption values by stages obtained are within the range indicated in the European Commission’s BREF document. It can thus be concluded that the Spanish ceramics industry is generally using the Best Available Techniques. On the other hand, the variations in consumptions and emissions among companies are relatively small, which suggests that though significant consumption reduction can be achieved individually by applying measures to optimise the process and save energy, the margin for reduction at industry level seems relatively narrow. A significant reduction in industry emissions would only appear to be possible by significant technological changes in the facilities that consume thermal energy and/or substitution of current energy sources.
ACKNOWLEDGEMENTS
This study has been funded by the Valencia Energy Agency (AVEN), under the Collaboration Agreement made between ASCER and AVEN, to promote collaboration in energy consultancy.
The authors of this work would also like to thank the 55 companies that participated in the project for their invaluable collaboration carrying out this study.
REFERENCES
[1] Commission Decision 2007/589/CE, of 29 January 2004, establishing the guidelines
for monitoring and notifying greenhouse gas emissions in accordance with Directive
2003/87/CE of the European Parliament and Council.
[2] Directive 2003/87/CE of the European Parliament and Council, of 13 October 2003,
establishing a scheme for greenhouse gas emissions trading in the Community,
amending Directive 96/61/CE of the Council.
[3] Directive 2009/29/CE of the European Parliament and Council, of 23 April 2009,
amending Directive 2003/87/CE, for perfecting and extending the Community scheme
for greenhouse gas emissions trading.
[4] Nassetti, G. et al. Piastrelle ceramiche & energia: banca dati dei consumi energetici
nell industria della piastrelle di ceramica. Bologna: Assopiastrelle, 1998.

15
CASTELLÓN (SPAIN)
[5] Reference Document on Best Available Techniques in the ceramic manufacturing
industry. Seville: European Commission. European IPPC Bureau, 2007 http://ftp.jrc.
es/eippcb/doc/cer_bref_0807.pdf [Retrieved: 2009-06-25].
[6] Escardino, A. El esfuerzo en innovación de la industria cerámica de la Comunidad
Valenciana para reducir las emisiones de dióxido de carbono. IN: Simposio
internacional sobre el cambio climático, desde la ciencia a la sociedad. Valencia:
Generalitat Valenciana, 2005. pp. 121-133.
[7] Criado, E. Reflexiones sobre el futuro de la Industria Europea de Cerámica. Bol. Soc.
Esp. Ceram. Vidr., 46(1), 39-43, 2007.
[8] Cañadas, I. et al. Characterization results of a new volumetric receiver for high-
temperature industrial process heat in a solar furnace. 1st International Congress on
Heating, Cooling and Buildings. Lisbon (Portugal), 7-10 October 2008.