estimating mass properties of dinosaurs using … kt 2009 estimating mass...estimating mass...
TRANSCRIPT

Estimating Mass Properties of Dinosaurs Using LaserImaging and 3D Computer ModellingKarl T. Bates1*, Phillip L. Manning2,3, David Hodgetts3, William I. Sellers1
1 Adaptive Organismal Biology Research Group, Faculty of Life Sciences, University of Manchester, Jackson’s Mill, Manchester, United Kingdom, 2 The Manchester
Museum, University of Manchester, Manchester, United Kingdom, 3 School of Earth, Atmospheric and Environmental Science, University of Manchester, Manchester,
United Kingdom
Abstract
Body mass reconstructions of extinct vertebrates are most robust when complete to near-complete skeletons allow thereconstruction of either physical or digital models. Digital models are most efficient in terms of time and cost, and providethe facility to infinitely modify model properties non-destructively, such that sensitivity analyses can be conducted toquantify the effect of the many unknown parameters involved in reconstructions of extinct animals. In this study we uselaser scanning (LiDAR) and computer modelling methods to create a range of 3D mass models of five specimens of non-avian dinosaur; two near-complete specimens of Tyrannosaurus rex, the most complete specimens of Acrocanthosaurusatokensis and Strutiomimum sedens, and a near-complete skeleton of a sub-adult Edmontosaurus annectens. LiDAR scanningallows a full mounted skeleton to be imaged resulting in a detailed 3D model in which each bone retains its spatial positionand articulation. This provides a high resolution skeletal framework around which the body cavity and internal organs suchas lungs and air sacs can be reconstructed. This has allowed calculation of body segment masses, centres of mass andmoments or inertia for each animal. However, any soft tissue reconstruction of an extinct taxon inevitably represents a bestestimate model with an unknown level of accuracy. We have therefore conducted an extensive sensitivity analysis in whichthe volumes of body segments and respiratory organs were varied in an attempt to constrain the likely maximum plausiblerange of mass parameters for each animal. Our results provide wide ranges in actual mass and inertial values, emphasizingthe high level of uncertainty inevitable in such reconstructions. However, our sensitivity analysis consistently places thecentre of mass well below and in front of hip joint in each animal, regardless of the chosen combination of body andrespiratory structure volumes. These results emphasize that future biomechanical assessments of extinct taxa should bepreceded by a detailed investigation of the plausible range of mass properties, in which sensitivity analyses are used toidentify a suite of possible values to be tested as inputs in analytical models.
Citation: Bates KT, Manning PL, Hodgetts D, Sellers WI (2009) Estimating Mass Properties of Dinosaurs Using Laser Imaging and 3D Computer Modelling. PLoSONE 4(2): e4532. doi:10.1371/journal.pone.0004532
Editor: Ronald Beckett, Quinnipiac University, United States of America
Received July 28, 2008; Accepted January 13, 2009; Published February 19, 2009
Copyright: � 2009 Bates et al. This is an open-access article distributed under the terms of the Creative Commons Attribution License, which permitsunrestricted use, distribution, and reproduction in any medium, provided the original author and source are credited.
Funding: This work was supported by a National Environmental Research Council doctoral grant to KTB (NER/S/A/2006/14101). However, the funders had no rolein study design, data collection and analysis, decision to publish, or preparation of the manuscript.
Competing Interests: The authors have declared that no competing interests exist.
* E-mail: [email protected]
Introduction
The mass properties of dinosaurs have been the subject of on-
going scientific investigation for over a century [1–7], reflecting
not only their unique range of body forms but also the
fundamental importance of mass properties as morphological,
physiological and ecological traits in biological organisms. Extant
vertebrate body size shows complex but discernable relationships
with species geographic range size [8–10], abundance [11–12],
population size [13] and latitude [14–15]. The pervasive inter-
relationship with these and many other biotic and abiotic variables
is clearly crucial to our understanding of macroevolutionary
dynamics and palaeobiogeographic trends through deep time [16–
17]. Indeed, body size has featured prominently in attempts to
explain temporal and spatial trends in fossil species duration [18–
20], directional changes within lineages [21–26] and survivorship
patterns during mass extinction events [27; but see 28]. Body mass
is also considered the single most important factor affecting
locomotor mechanics and performance in terrestrial vertebrates
[29–35]. Assessment of biomechanical function and performance
requires full quantitative description of mass properties; in addition
to body mass, the location of the centre of mass (CM) and the
inertial resistance of each body segment are needed to analyze
accelerations and translational movements through space [36].
Accurate quantitative predictions of mass properties are therefore
fundamental to biomechanical analyses of extinct organisms and
to understanding patterns of diversification and extinction in the
fossil record.
Body mass reconstructions of extinct dinosaurs are most robust
when complete to near-complete skeletons allow realistic physical
or digital models to be produced [3–7]. Unique body dimensions
means that indirect assessments using regression analyses to
extrapolate from living forms should be cautiously applied to non-
avian dinosaurs [7,37–41]. However, constructing life-size physical
models is clearly impractical in the case of the largest dinosaurs,
while scaled modelling requires a high-level of artistic skill. It is
therefore more logical to construct digital models, which are
typically more efficient in terms of time and cost. The digital
medium also allows the full spectrum of mass properties to be
investigated with relative ease; whilst it is relatively simple to
PLoS ONE | www.plosone.org 1 February 2009 | Volume 4 | Issue 2 | e4532
extract total body mass and CM from physical models [4] it
remains extremely challenging to calculate both the mass and
inertial properties of each respective body segment [see for
example 42–43 for work on extant animals]. Furthermore, the
digital environment allows incorporation of inhomogeneous
density within and between body segments of a model. The
importance of this feature has been demonstrated in the effects of
low-density internal organs (e.g. lungs, air sacs) on mass
predictions for dinosaurs [4–7,44]. The ability to infinitely modify
model properties non-destructively also means that sensitivity
analyses can be conducted to investigate the effect of the numerous
assumptions necessary in reconstructions of extinct animals. This
facility is crucial given the level of subjectivity involved in
constructing body and respiratory structure volumes and the
choice of values for other unknown parameters such as bulk tissue
density [7]. Finally, high quality visualization inherent in
computational methods provides useful illustration of results and
accurate comparison of mass properties between taxa.
A variety of methods have been used to digitize fossil skeletons
for the purpose of mass property calculations. Henderson [6] first
produced 3D body volumes from reconstructed sagittal and frontal
drawings, with mass computations made by summing the mass
properties of independent transverse slices through body volume.
In a recent study, Hutchinson et al. [7] measured a selection of 3D
landmark coordinates on the skeleton of Tyrannosaurus rex MOR
555 by manually gridding the museum floor beneath the mount.
Skeletal landmarks were entered into a custom written Computer-
Aided Design (CAD) package and combined with CT-scans of
hind limb and pelvic bones to create a low resolution framework
around which Hutchinson et al. [7] constructed a range of body
cavities for Tyrannosaurus. Recently laser scanning and computer
modelling technology has also been applied to create more
detailed digital models of skeletons [45–47]. Scanning whole
mounted skeletons to produce a data set in which the digitized
bone retains its spatial position and articulation would be a highly
effective approach to achieving fast and reliable estimates of mass
and inertial properties. The scanned skeleton could be imported
into a CAD package and a body outline constructed, allowing
mass properties to be calculated using estimates of density for the
body volume as in previous studies [6–7,45,47].
Light Detection And Range (LiDAR) imaging is a highly
accurate non-invasive method of collecting 3D geometrical data
that shows great promise for a variety of applications in
paleobiology [48–50]. The facility to rapidly capture sub-
centimetre surface geometry of objects from distances of up to
800 m [49–50] suggests the method represents an ideal tool to
digitize mounted skeletons of even the largest vertebrates. In this
paper we describe the digitization of five skeletal mounts of four
different species of non-avian dinosaur using LiDAR imaging. The
resulting digital skeletal models have been used to construct
complete 3D volumetric models, which allow the mass, centres of
mass and moments of inertia to be calculated for each body
segment. The flexible modelling framework has also allowed us to
conduct a detailed sensitivity analysis to test the effect of critical
assumptions in the model reconstructions. This provides critical
evaluation of the total plausible range of mass properties for these
dinosaurian taxa and represents the first step towards assessing
their functional anatomy using numerical biomechanical methods.
Materials and Methods
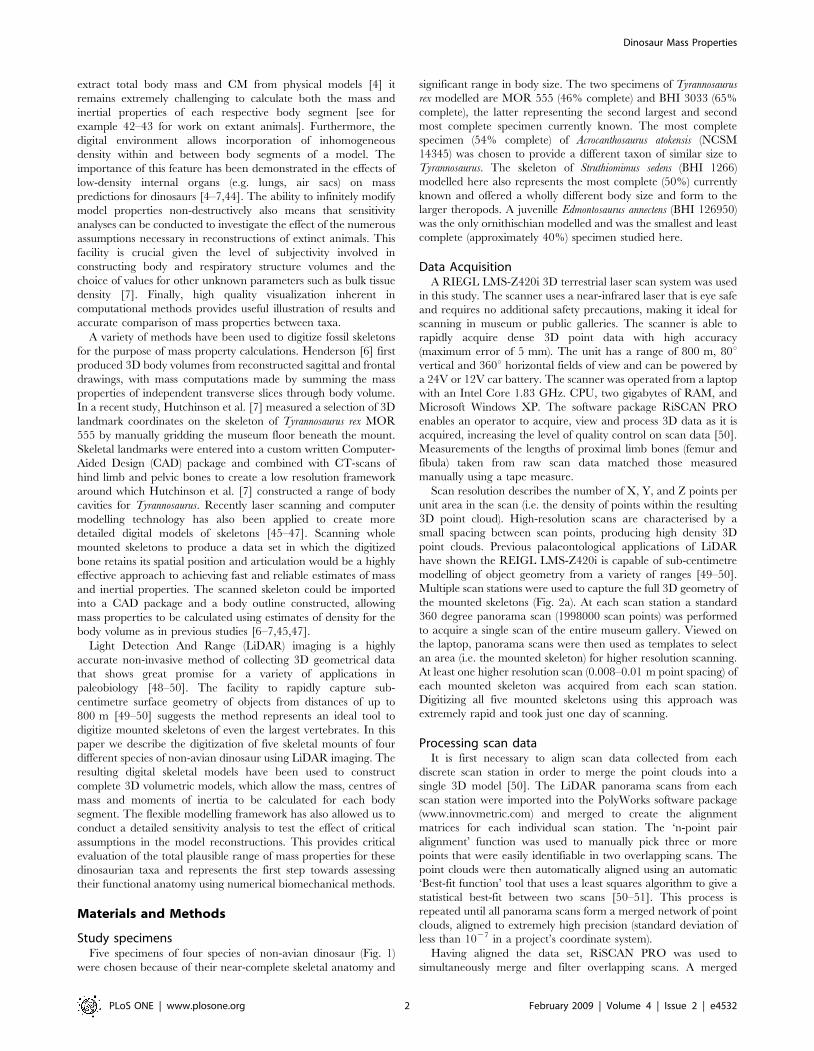
Study specimensFive specimens of four species of non-avian dinosaur (Fig. 1)
were chosen because of their near-complete skeletal anatomy and
significant range in body size. The two specimens of Tyrannosaurus
rex modelled are MOR 555 (46% complete) and BHI 3033 (65%
complete), the latter representing the second largest and second
most complete specimen currently known. The most complete
specimen (54% complete) of Acrocanthosaurus atokensis (NCSM
14345) was chosen to provide a different taxon of similar size to
Tyrannosaurus. The skeleton of Struthiomimus sedens (BHI 1266)
modelled here also represents the most complete (50%) currently
known and offered a wholly different body size and form to the
larger theropods. A juvenille Edmontosaurus annectens (BHI 126950)
was the only ornithischian modelled and was the smallest and least
complete (approximately 40%) specimen studied here.
Data AcquisitionA RIEGL LMS-Z420i 3D terrestrial laser scan system was used
in this study. The scanner uses a near-infrared laser that is eye safe
and requires no additional safety precautions, making it ideal for
scanning in museum or public galleries. The scanner is able to
rapidly acquire dense 3D point data with high accuracy
(maximum error of 5 mm). The unit has a range of 800 m, 80uvertical and 360u horizontal fields of view and can be powered by
a 24V or 12V car battery. The scanner was operated from a laptop
with an Intel Core 1.83 GHz. CPU, two gigabytes of RAM, and
Microsoft Windows XP. The software package RiSCAN PRO
enables an operator to acquire, view and process 3D data as it is
acquired, increasing the level of quality control on scan data [50].
Measurements of the lengths of proximal limb bones (femur and
fibula) taken from raw scan data matched those measured
manually using a tape measure.
Scan resolution describes the number of X, Y, and Z points per
unit area in the scan (i.e. the density of points within the resulting
3D point cloud). High-resolution scans are characterised by a
small spacing between scan points, producing high density 3D
point clouds. Previous palaeontological applications of LiDAR
have shown the REIGL LMS-Z420i is capable of sub-centimetre
modelling of object geometry from a variety of ranges [49–50].
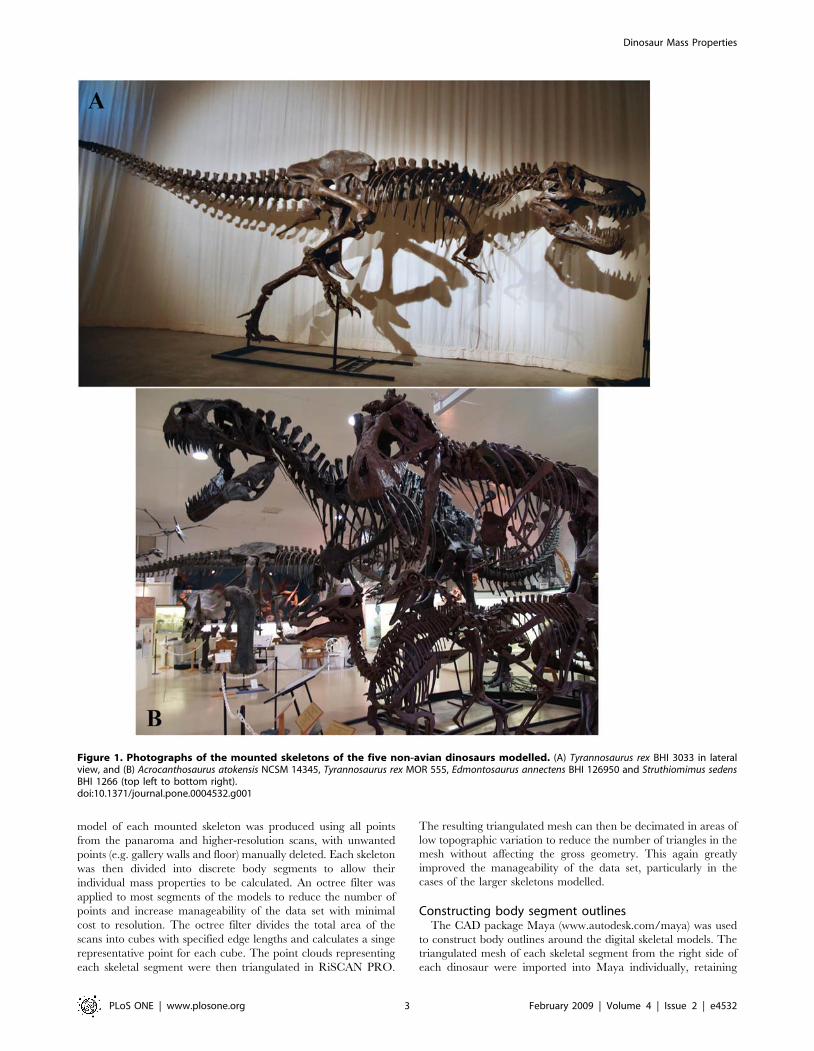
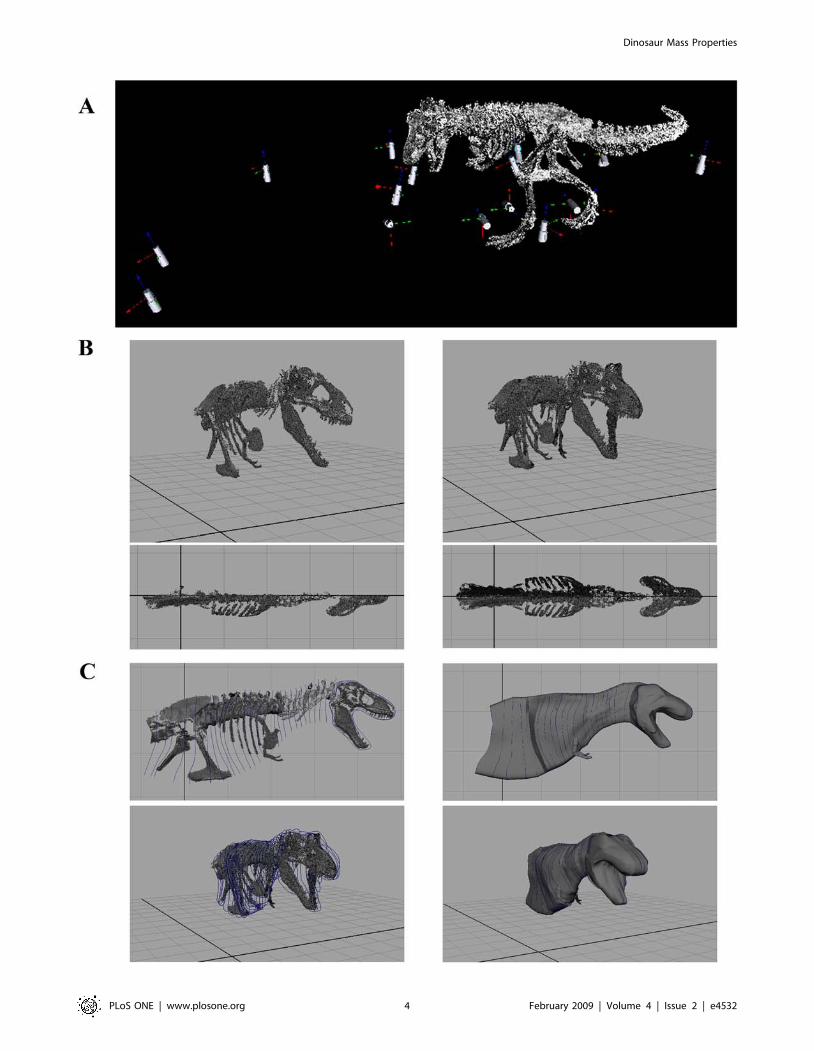
Multiple scan stations were used to capture the full 3D geometry of
the mounted skeletons (Fig. 2a). At each scan station a standard
360 degree panorama scan (1998000 scan points) was performed
to acquire a single scan of the entire museum gallery. Viewed on
the laptop, panorama scans were then used as templates to select
an area (i.e. the mounted skeleton) for higher resolution scanning.
At least one higher resolution scan (0.008–0.01 m point spacing) of
each mounted skeleton was acquired from each scan station.
Digitizing all five mounted skeletons using this approach was
extremely rapid and took just one day of scanning.
Processing scan dataIt is first necessary to align scan data collected from each
discrete scan station in order to merge the point clouds into a
single 3D model [50]. The LiDAR panorama scans from each
scan station were imported into the PolyWorks software package
(www.innovmetric.com) and merged to create the alignment
matrices for each individual scan station. The ‘n-point pair
alignment’ function was used to manually pick three or more
points that were easily identifiable in two overlapping scans. The
point clouds were then automatically aligned using an automatic
‘Best-fit function’ tool that uses a least squares algorithm to give a
statistical best-fit between two scans [50–51]. This process is
repeated until all panorama scans form a merged network of point
clouds, aligned to extremely high precision (standard deviation of
less than 1027 in a project’s coordinate system).
Having aligned the data set, RiSCAN PRO was used to
simultaneously merge and filter overlapping scans. A merged
Dinosaur Mass Properties
PLoS ONE | www.plosone.org 2 February 2009 | Volume 4 | Issue 2 | e4532
model of each mounted skeleton was produced using all points
from the panaroma and higher-resolution scans, with unwanted
points (e.g. gallery walls and floor) manually deleted. Each skeleton
was then divided into discrete body segments to allow their
individual mass properties to be calculated. An octree filter was
applied to most segments of the models to reduce the number of
points and increase manageability of the data set with minimal
cost to resolution. The octree filter divides the total area of the
scans into cubes with specified edge lengths and calculates a singe
representative point for each cube. The point clouds representing
each skeletal segment were then triangulated in RiSCAN PRO.
The resulting triangulated mesh can then be decimated in areas of
low topographic variation to reduce the number of triangles in the
mesh without affecting the gross geometry. This again greatly
improved the manageability of the data set, particularly in the
cases of the larger skeletons modelled.
Constructing body segment outlinesThe CAD package Maya (www.autodesk.com/maya) was used
to construct body outlines around the digital skeletal models. The
triangulated mesh of each skeletal segment from the right side of
each dinosaur were imported into Maya individually, retaining
Figure 1. Photographs of the mounted skeletons of the five non-avian dinosaurs modelled. (A) Tyrannosaurus rex BHI 3033 in lateralview, and (B) Acrocanthosaurus atokensis NCSM 14345, Tyrannosaurus rex MOR 555, Edmontosaurus annectens BHI 126950 and Struthiomimus sedensBHI 1266 (top left to bottom right).doi:10.1371/journal.pone.0004532.g001
Dinosaur Mass Properties
PLoS ONE | www.plosone.org 3 February 2009 | Volume 4 | Issue 2 | e4532
Dinosaur Mass Properties
PLoS ONE | www.plosone.org 4 February 2009 | Volume 4 | Issue 2 | e4532

their original spatial coordinates. This allowed the long axis or
mid-line of each skeleton to be aligned with the x axis in Maya
without disarticulation and the need to digitally remount each
segment. Each right-hand segment was then copied and mirrored
to produce the left sides of the skeletons and complete bilaterally
symmetrical skeletal models (Fig 2b). An effort was made to
minimize re-articulation of skeletons in order to retain compara-
bility with the physical mounts; only the limb segments of
Acrocanthosaurus, Struthiomimus and Edmontosaurus were re-articulated
to improve the ease of the volumetric reconstructions.
Body outlines were constructed using Non-Uniform Rational B-
Spline (NURBs) circles, whose geometry was defined by 30
landmark points (Fig. 2c). NURBs represent a highly flexible shape
modelling format and can be used to generate standard geometries
(such as parabolic curves, circles, and ellipses) in addition to
complex free-form curves. Body outlines could therefore be
constructed without geometrical restriction and the choice of
thirty landmarks points to define NURBs circles was more than
sufficient for the complexity desired. For the body segments (neck,
thorax, sacrum and tail) a single NURBs was used to define the
body outline around each vertebrae (Fig. 2d). For limb and skull
segments the number of NURBs circles varied according to the
complexity required to model the segment outline in its respective
articulation. Closed body cavities surfaces were then generated by
‘lofting’ a continuous surface through consecutive NURBS circles
to produce discrete body volumes for each segment (Fig. 2d).
Modelling lungs and air sacsThe CAD environment allows easy incorporation of objects
within reconstructed body volumes. This enabled us to reconstruct
the size and shape of embedded respiratory structures on the basis
of osteological and phylogenetic inferences of anatomy [52–54],
without being restricted to simplified geometric shapes.
Respiratory structures were originally created as simple NURBs
cylinders and subsequently re-modelled or ‘deformed’ into the
required shapes (Fig. 3). The thoraxic segments of the theropod
models included a single dorsal cavity to represent lungs and their
associated air sacs (Fig. 3). These bodies were shaped so that they
filled the cavity between the centra of the dorsal vertebrae and the
ribs, following reconstructions based on the pneumaticity of the
axial skeletons of non-avian theropods [52–54]. The thoracic air
sac volume extended from the junction between the neck and
thoracic segments (where it joined the pharyngeal air sac, see
below) to just in front of the pelvis, at the border between the
thoracic and sacral body volumes. The facility to zoom in to high
magnifications and rotate the skeletons to any orientation allowed
the desired 3D shape of the lung to be modelled with high
precision. In accordance with the avian-like pulmonary anatomy
favoured for non-avian theropods [53] we incorporated a
pharyngeal cavity in the neck segment to mimic the trachea and
oesophagus (Fig. 3). Again this cavity was shaped around the
centra of the (cervical) vertebrae and ribs where present. Head
segments also included small air sacs filling the antorbital and
cranial sinuses, as in previous reconstructions [7].
Our initial theropod models did not include abdominal air sacs,
which are currently poorly supported by phylogenetic and
osteological evidence [52–54]. However, the effect of these
structures on mass set results have been tested in the sensitivity
analysis (see below). The respiratory anatomy of Ornithischian
dinosaurs has received comparatively little attention and any
reconstruction is likely to suffer from weaker phylogenetic support.
We therefore follow the approach of previous workers in
constructing a single lung cavity within the thoracic segment [6],
and an additional air sac in the skull.
Calculating mass and inertial propertiesCompleted models were imported into the engineering CAD
pack Formz (www.formz.com) which is able to automatically
calculate the volume, mass, CM and moments of inertia of any
arbitrary closed shape about its principle axes based on a bulk
density value input by the user. Each segment was given a density
of 1000 kg m23, in accordance with previous studies [3–4,7].
Once the mass properties of each body segment and respiratory
structures are defined in the model’s coordinate system it is
relatively straightforward to calculate the mass properties of the
whole model. Total body mass was calculated by summing the
mass of all body segments minus the mass of the air sac volume at
a density of 1000 kg m23 (Equation 1), such that
Total body mass~X
Ms{Mas ð1Þ
where Ms is the mass of the segments and Mas is the mass of the air
sac at a density of 1000 kg m23. The centres of mass for the trunk
or ‘HAT’ (Head-Arms-Torso), legs and whole body were
calculated by multiplying the segment masses by the Cartesian
coordinates of their centres of mass and dividing the sum of these
by the total body mass (Equation 2), so that
Total Body CM~
Xc~X
Xs Ms{Masð Þ� �.
Mt
Yc~X
Ys Ms{Masð Þ� �.
Mt
Zc~X
Zs Ms{Masð Þ� �.
Mt
ð2Þ
where Xs, Ys and Zs are the Cartesian coordinates of the segments
CMs and Mt is the total body mass. Calculating the moments of
inertia for each segment and subsequently aggregated segments is
significantly more complicated, since Formz outputs the moments
of inertia for each segment about its own principle axes, and its
own CM. Parallel axis theorem is required to transfer these
moments to the coordinate system of the aggregate body, which is
located at its CM. This means calculating the distance from the
CM of the aggregate body to each segment’s CM and the
necessary orientation change. The total moment of inertia is then
given by summing the moments of inertia of each segment about
the CM of the aggregate body. All calculations were performed in
a custom written Mathematica script (http://www.wolfram.com),
using the MechanicalSystems add-on package which contains an
automated parallel axis theorem function that greatly simplifies the
Figure 2. LiDAR data collection and processing. (A) The mounted skeletons were scanned from a variety of perspectives to provide full 3Dcoverage and eliminate ‘shadows’ in the data set. (B) The segmented right-hand side of the skeleton was aligned with Maya’s x axis and mirrored toproduce complete symmetrical models (T. rex MOR 555 in oblique right craniolateral and dorsal views). (C) Body outlines were constructed using Non-Uniform Rational B-Spline (NURBs) circles, with a single NURBs used to define the body outline around each vertebrae in the body segments (neck,thorax, sacrum and tail). Closed body cavities surfaces were then generated by ‘lofting’ a continuous surface through consecutive NURBS circles toproduce discrete body volumes for each segment (T. rex MOR 555 in right lateral and oblique right craniolateral views).doi:10.1371/journal.pone.0004532.g002
Dinosaur Mass Properties
PLoS ONE | www.plosone.org 5 February 2009 | Volume 4 | Issue 2 | e4532

calculations. We calculated the moments of inertia of the head,
forelimbs, thorax, sacrum and tail about their combined CM (i.e.
the HAT segment CM) which then allows them to be simply
summed. The moments of inertia of the hind limb segments were
individually calculated about their own neutral axis, in accordance
with our previous studies [35].
Sensitivity AnalysisAlthough guided by skeletal morphology and phylogenetic
information our initial models nevertheless constitute best estimate
reconstructions with an unknown level of certainty surrounding
many parameters. Soft tissue reconstructions of extinct animals
inevitably contain a high-degree of subjective estimation [55], in this
case in the geometry and structure of body segment volumes and
airs sacs, in addition to the choice of tissue density values. To
investigate the effect of our assumptions and attempt to produce a
realistic range of mass set results we conducted a sensitivity analysis
on each of our models. For each dinosaur we calculated the mass
properties of a single slimmer and two larger models. In the slimmer
models we reduced the diameter of the NURBs circles in the neck,
thoraxic, sacral, tail and hind limb (thigh, shank and metatarsal)
segments by 7.5%, while in the two larger models these segments
were increased by 7.5% and 15% with respect to the best estimate
models. This allowed us to modify our models relatively quickly and
easily so that a large number of different models could be produced.
However, because the NURBs circles were rarely aligned perfectly
with Maya’s Cartesian axes (x,y,z) it was necessary to modify their
diameter in the x, y and z directions by 7.5%. This resulted in non-
uniform changes in diameter (i.e. slightly less or greater than 7.5%),
with the absolute value varying according to the degree of
misalignment with the Cartesian axes. Whilst this is not ideal,
manually altering the geometry of the NURBs circles would have
been extremely time-consuming and would have likely resulted in
even less standardized changes to segment volumes.
Hutchinson et al. [7] conducted a more detailed sensitivity analysis
of their Tyrannosaurus rex mass model, in which multiple combinations
of body segment volumes and air sacs were created to produce a
broad range of mass set results. Whilst this approach is time
consuming and may produce a suite of improbable mass set
combinations it does provide important information about the
possible range in combinations of segment mass properties, which
may have important implications for subsequent higher-level
evolutionary or biomechanical analyses [7]. For example, contention
surrounding the locomotor capabilities of the largest non-avian
theropods largely reflects uncertainty about the ratio of hind limb
muscle mass to body mass in these animals [7,35,56–57]. To examine
the effects on the overall mass set results we conducted a more
detailed sensitivity analysis in the style of Hutchinson et al. [7] for
each taxon, in which we experimented with a combination of trunk
and leg segments from the initial sensitivity analysis. In addition to
segment volumes, we also test the effects of having larger and smaller
zero density respiratory structures in our thoracic and neck segments.
Methodological validation: Extant Ostrich modelIn soft tissue, functional and biomechanical studies of extinct
taxa it is important that methodologies are validated using
experimental data from extant species. In this case it must be
emphasized that accurate volumetric modelling of a modern
animal with known morphology does not increase nor decrease the
‘accuracy’ of any single prediction about the mass properties of an
extinct animal with unknown soft tissue morphology. However,
recent physical and digital reconstructions of extinct non-avian
dinosaurs have typically been accompanied by similarly construct-
ed models of extant taxa for the purpose of methodological
validation [4,6–7]. In addition to sensitivity analysis of the
dinosaur models, we have constructed a volumetric model of an
extant ostrich (Struthio camelus) using exactly the same digitization
and CAD modelling procedures used for our dinosaur recon-
structions. Previous workers have typically employed one of two
approaches in using modern animals to validate mass predictions
methods in non-avian dinosaurs. In the first approach a ‘generic’
model of an extant species is made and compared to an accepted
suite of average mass properties for that particular species [4,6].
The second, more thorough approach, involves experimentally
measuring the mass properties of a dead carcass of a particular
individual animal, and then comparing the predictions from a
subsequent physical or digital volumetric model of that individual
to the experimental values obtained directly from the specimen
[7]. Our validation follows the former approach, as no mass data
was available for the mounted Ostrich skeleton digitized in this
study. The Ostrich skeleton used (BB.3462) is currently on display
at the Manchester Museum (University of Manchester, UK). Data
from the volumetric reconstruction is compared to published mass
data on extant Ostriches from the literature [7,58]
Results
The volumetric reconstruction of the extant ostrich is shown in
Figure 4 and the best estimate mass models for each dinosaur are
Figure 3. Best estimate reconstructions of thoracic and pharyngeal air sacs in Tyrannosaurus rex MOR 555, shown in oblique rightcraniolateral views.doi:10.1371/journal.pone.0004532.g003
Dinosaur Mass Properties
PLoS ONE | www.plosone.org 6 February 2009 | Volume 4 | Issue 2 | e4532

shown in Figures 5, 6, 7, 8, 9 and the calculated mass set
parameters are tabulated in Tables 1, 2, 3, 4, 5, 6. The total body
mass estimate for the ostrich was 72.172 kg, and the position of the
torso CM was found to be 0.176 m in front and 0.114 m below
the acetabulum. Total body mass estimates of the four non-avian
theropods range from 423 kg for Struthiomimus to 7655 kg for
Tyrannosaurus rex BHI 3033. Table 7 summarizes the mass set data
for each of the initial slimmer and larger models produced in the
sensitivity analysis. The largest models represented an increase of
21–29.8% in total body mass over best estimate predictions, while
the smallest models were 8.2–9.9% lighter than initial predictions.
The results from all subsequent sensitivity analyses, in which we
experimented with different mass set combinations, are summa-
rized in Tables 8–9. Best estimate CM positions were most
significantly affected by altering the combinations of body segment
volumes; the combination of large thoracic and neck segments
with reduced tail segments resulted in the most craniad CM
positions (4.47–8.61% body length in front of the hip joint), while
enlarged tails and reduced anterior body segments brought the
CM closest to the acetabulum (0.78–6.2% body length anterior to
the hip joint). However, the CM remained in front and below the
hip joint in all models produced. As expected, body mass and
inertial values showed a positive correlation with the heaviest
models consistently having the largest principal moments of
inertia. The implications of these results are discussed below. The
full mass set results for every model created can be found in the
electronic supplementary files on-line (Supporting Information
Tables S1: 1–49).
Discussion
Modelling approachOur method of skeletal digitization and reconstructive model-
ling is fast, accurate and repeatable. All processing operations
required to build the skeletal models from raw LiDAR data can be
performed automatically by software programs (e.g. PolyWorks,
RiSCAN PRO), allowing mathematically complex and time
consuming processes to be carried out rapidly and efficiently.
This makes the technique accessible to a wide audience of users
and non-specialists, and minimises the impact of human error in
the resulting models. This feature represents a major benefit and
will be crucial to the wider application of the technique.
LiDAR’s near infra-red laser is completely eye safe permitting
its use in public galleries in museums without restricting access to
the visiting public. To minimise interference between the scanner
and the targeted skeletons, it is suggested that galleries be closed to
the public. However, the facility to repeat and filter scans (so-called
‘scan sequence approach’; [see 50]) allows unwanted objects (such
as passing people) to be systematically removed from the image
data allowing scanning to be undertaken in busy periods when
Figure 4. Volumetric model of an extant ostrich (Struthio camelus) based on a specimen (BB.3462) mounted at the ManchesterMuseum (UK), shown in (A) right lateral, (B) oblique right craniolateral, (C) cranial and (D–E) dorsal views (E with hind limbsegments removed).doi:10.1371/journal.pone.0004532.g004
Dinosaur Mass Properties
PLoS ONE | www.plosone.org 7 February 2009 | Volume 4 | Issue 2 | e4532
necessary. Filtering operations are also important to maintaining
the manageability of the data sets. A multi-gigabyte data set can be
generated in just a few hours scanning [49–51] and the automated
filtering and decimation tools allow data size to be reduced with
minimal cost to resolution. This allowed data collection, post-
processing and modelling to be performed on a standard laptop
computer.
The resolution offered by LiDAR point clouds was sufficient to
capture the gross 3D geometry of the mounted skeletons and
subsequently to guide reconstructions of body outlines and the
geometry and placement of internal organs in the body and head
(Figs 4, 5, 6, 7, 8, 9, 10, 11, 12, 13, 14). Bone surfaces are
represented by millions of data points sampled directly from the
specimen, which is clearly preferable to indirect digitization from
literature-sourced photographs or drawings. Only the in case of
Tyrannosaurus rex BHI 3033 was model resolution affected by
constraints on data collection. The inability to scan from sufficient
distances (i.e. plus 5 metres) from the specimen in lateral profile
meant that the geometry of cervical and thoracic neural spines
were captured at lower resolution than in other models. Although
scan resolution in general is not sufficient to intricately model bone
surface geometry, 3D data from CT or short range laser scanners
can easily be incorporated into LiDAR models using either the
alignment procedures described above or CAD tools.
The suite of modelling tools available within Maya meant that
body volumes could be constructed in any shape and were not
limited to strict ellipsoids or simple geometric shapes. The
potential errors in estimations of mass parameters resulting from
over-simplification of body outlines through the use of standard or
uniform geometric shapes has been quantitatively demonstrated
by Montani [60]. The automatic calculation of mass properties in
Formz minimised the need for human calculation, which would
have been extremely restrictive in terms of time and crucially
would have limited the complexity of geometric shapes chosen to
represent body and respiratory structure volumes. Our modelling
approach therefore represents a highly accessible technique, one
that may potentially be applied by a wide variety of researchers
including those working on extant taxa. For those working on
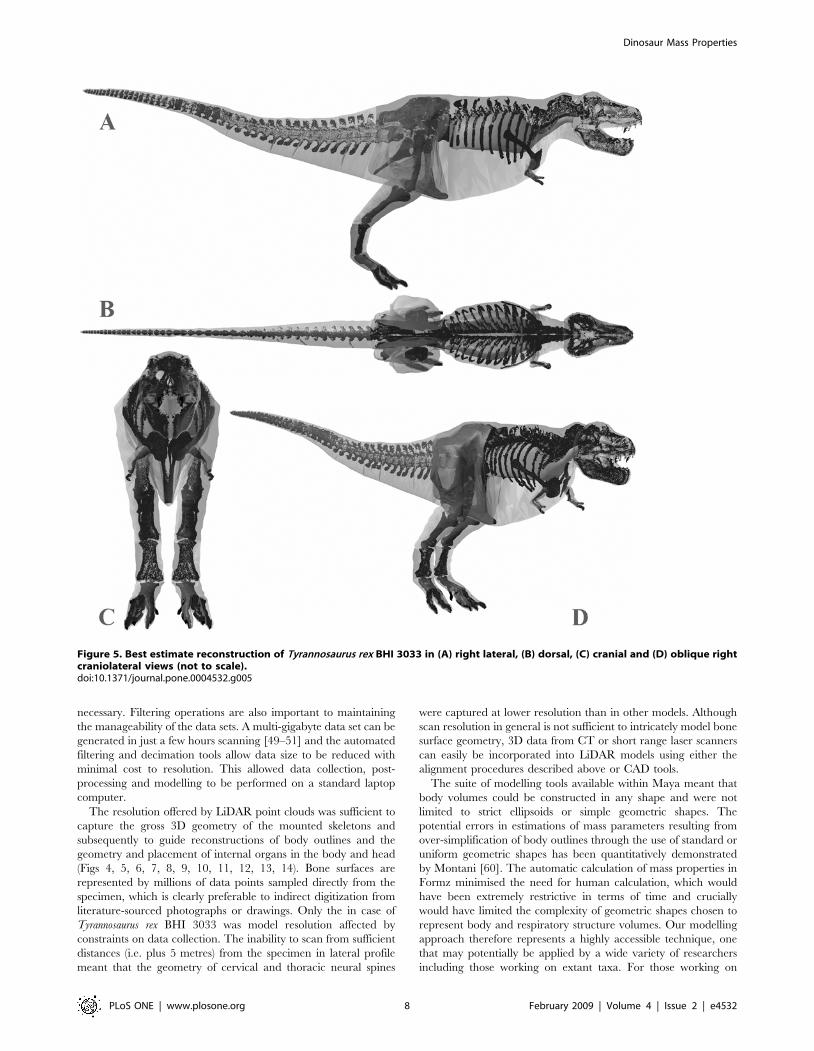
Figure 5. Best estimate reconstruction of Tyrannosaurus rex BHI 3033 in (A) right lateral, (B) dorsal, (C) cranial and (D) oblique rightcraniolateral views (not to scale).doi:10.1371/journal.pone.0004532.g005
Dinosaur Mass Properties
PLoS ONE | www.plosone.org 8 February 2009 | Volume 4 | Issue 2 | e4532

extinct animals it crucially allows the reconstructed body outline
and internal organs to be displayed around the fossil skeleton,
thereby offering explicit communication of the reconstruction and
more meaningful comparisons with other models.
Ostrich ValidationThe volumetric reconstruction of an extant ostrich, based solely
on a digitized mounted skeleton (BB. 3462), produced mass set
predictions that closely match those published for this species [7,58].
Smith et al. [58] measured a body mass of 70 kg for an adult ostrich
(Struthio camelus), in which the lengths of the femora, tibiotarsus and
tarsometatarsus were 0.28 m, 0.5 m and 0.45 m (Smith personal
communication 2007). These are very close to lengths of the same
segments in the ostrich digitized in this study (femora 0.26 m,
tibiotarsus 0.471 and tarsometatarsus 0.426 m), which suggests that
their overall mass properties should be comparable. It is therefore
encouraging that the predicted body mass of our volumetric
reconstruction (72.172 kg) essentially matches that measured by
Smith et al. [58] for their specimen, although some caution is
warranted as were unable to quantitatively validate estimated air sac
volumes in our model. Similarly our reconstruction has 20.973%
total body mass in a single limb, which closely matches the average
value of 16.85% for total hind limb muscle mass in the ostrich [58].
Indeed, it is possible that removing bone volume from our
reconstructed limb segments will bring this value closer to the
measured hind limb muscle mass values of Smith et al. [58], which
was obtained by summing the masses of dissected hind limb muscles
rather than weighing whole limb segments. However, the predicted
HAT CM does not closely correspond to published values for extant
ostriches, being located 0.095 m craniad and 0.053 m ventral to the
position calculated experimentally by Hutchinson et al. [7]. This
discrepancy results from the manner in which mass has been
apportioned between the thigh and posterior HAT segments in our
model (Fig. 4D–E). Specifically, the sacral and post-sacral regions of
the HAT segment are tightly constrained around the skeleton and
the soft-tissue volume (corresponding to pelvic musculature) has
been modelled as the proximal part of thigh segment (Fig.4D–E). If
50% thigh mass is included in the HAT segment then the latter CM
shifts caudally to 0.089 m in front of the hip joint, matching the
published calculation [7].
Whilst this demonstrates that our methodology is capable of
producing broadly accurate predictions of mass properties in
Figure 6. Best estimate reconstruction of Tyrannosaurus rex BHI MOR 555 in (A) right lateral, (B) dorsal, (C) cranial and (D) obliqueright craniolateral views (not to scale).doi:10.1371/journal.pone.0004532.g006
Dinosaur Mass Properties
PLoS ONE | www.plosone.org 9 February 2009 | Volume 4 | Issue 2 | e4532

extant taxa with known morphology, it is again important to
emphasize that this fact alone does not alter (i.e. enhance) the
reliability of any single volumetric model of an extinct animal with
unknown soft tissue morphology. Indeed, with numerous validation
studies demonstrating accurate mass predictions of extant taxa from
physical and digital volumetric models [4,6–7; see above] we would
argue that conducting sensitivity analyses on models of extinct taxa
represents a far more significant measure of the extent to which
meaningful mass predictions can be obtained for these animals.
Dinosaur body dimensionsA century of research has proliferated body mass inferences for
non-avian dinosaurs. Not surprisingly the majority of these studies
have focused on Tyrannosaurus rex, and both MOR 555 [5,7] and
BHI 3033 [47] have been modelled in previous studies. Our
reconstruction of Edmontosaurus (albeit a sub-adult) is the first of
which we are aware for this genus. Henderson and Snively [59]
provide the only body mass estimate for Acrocanthosaurus using
digital modelling, and Christiansen and Farina [41] the only
estimate for Struthiomimus using a physical model. Few studies have
quantified the CM of these animals [4,6–7] and only Hutchinson
et al. [7] calculated inertial properties for the respective body
segments of Tyrannosaurus rex MOR 555.
Body mass. Body mass results for Tyrannosaurus rex MOR 555
overlap those of previous workers. Our best estimate model (Fig. 6)
of 6072 kg falls close to the 6583 kg obtained by Hutchinson et al.
[7] and within the range of the upper estimates of Farlow et al. [5].
Our skinniest MOR 555 (Fig. 11c) has a total mass of 5580 kg
(5543 kg with enlarged air sacs) but is highly emaciated, particularly
in the torso, which when subjected to the full volume reduction
actually invaded the rib cage. The largest MOR 555 (Fig. 11a)
produced a mass estimate of 7700 kg (7997 kg with reduced air
sacs), but is also highly unrealistic in many areas and contains an
excessive amount of flesh around the torso, sacrum and proximal
tail. However, all segments in the plus 7.5% model (Fig. 11b) still
appear fairly reasonable, and we consider the total mass of 6956 kg
perfectly valid for this animal. We therefore suggest the total body
mass of MOR 555 is well constrained within 5750–7250 kg, as was
similarly suggested by Hutchinson et al. [7]. However, it is
noteworthy that the mass values obtained here for many of the
individual body segments of MOR 555 differ significantly from
those of Hutchinson et al. [7]. This largely emphasises degree of
Figure 7. Best estimate reconstruction of Acrocanthosaurus atokensis NCSM 14345 in (A) right lateral, (B) dorsal, (C) cranial and (D)oblique right craniolateral views (not to scale).doi:10.1371/journal.pone.0004532.g007
Dinosaur Mass Properties
PLoS ONE | www.plosone.org 10 February 2009 | Volume 4 | Issue 2 | e4532

subjectivity and artistic freedom available when constructing these
models. The larger neck cavity in our study may be partly explained
by the smooth continuous transition between the thoracic and neck
segments. In our models we reconstructed the ventral outline of the
body passed smoothly under the scapula-coracoids, while
Hutchinson et al. [7] chose a sharp inflexion in both the dorsal
and ventral profile at the junction between the thoracic and neck
segments thereby deceasing volume relative to our model. In our
models we also chose to extend the neck to the ventral and dorsal
surfaces of the head, rather than inserting solely into the posterior
face of the head segment. By contrast the thoracic segment of
Hutchinson et al. [7] is significantly larger than the equivalent
segments (sacral and thoracic) in our model. The sacral and thoracic
segments from the best estimate obtained in this study have a
combined volume of 2.38 m3 compared to 4.19 m3 of Hutchinson
et al. [2007]. Without skeletal landmarks figures it is difficult to
judge the extent of the body outline relative to the skeleton in the
model of Hutchinson et al. [7] and hence to make a fair comparison
to our model. With the hind limb fully straightened beneath the hip
joint the ventral outline of the body passes below the knee joint in
the model of Hutchinson et al. [7]. By contrast, our outline passes
close to the pelvis (ischium and pubis) even with the knee slightly
flexed, based on consideration of pelvic musculature and the
impressions of the pubic boot in trace fossils [61]. Around the
pectoral girdle the lateral profile has to pass under scapula-coracoids
and is unlikely to extend below the level of the arms, which would
Figure 8. Best estimate reconstruction of Struthiomimus sedens BHI 1266 in (A) right lateral, (B) dorsal, (C) cranial and (D) obliqueright craniolateral views (not to scale).doi:10.1371/journal.pone.0004532.g008
Dinosaur Mass Properties
PLoS ONE | www.plosone.org 11 February 2009 | Volume 4 | Issue 2 | e4532

Figure 9. Best estimate reconstruction of Edmontosaurus annectens BHI 126950 in (A) right lateral, (B) dorsal, (C) cranial and (D)oblique right craniolateral views (not to scale).doi:10.1371/journal.pone.0004532.g009
Table 1. Results of the volumetric model of the ostrich (BB.3462).
Segment Net Density (kg m23) Volume (m3) Mass (kg) CM (x,y,z) (m) Ixx Iyy Izz (kg m2)
Head-Arms-Torso (HAT) 807.423 0.052 41.986 0.103, 1.064, 0 1.508, 3.35, 4.586
Pharyngeal cavity 0 0.0004 0 - -
Thoracic air sacs 0 0.009 0 - -
Thigh 1000 0.006 5.965 20.008, 1.077, 20.166
Shank 1000 0.007 7.368 20.004, 0.834
Metatarsus 1000 0.002 1.723 20.118, 0.407, 20.168
Digit III 1000 0.0003 0.303 20.061, 0.12, 20.184
Digit IV 1000 0.00008 0.094 20.103, 0.13, 20.242
Pes 1000
Hind limb 1000 0.015 15.137 20.02, 0.853, 0.174 -
Whole Body 857.03 0.167 72.172 0.051, 0.975, 0 -
doi:10.1371/journal.pone.0004532.t001
Dinosaur Mass Properties
PLoS ONE | www.plosone.org 12 February 2009 | Volume 4 | Issue 2 | e4532

severely restrict their range of movement. The gastralia form a
shallow convexity linking the pubis and sternum in non-avian
theropods and we constructed the belly outline with a modest
amount of flesh beneath this plane, based on the relationship
between the gastralia and the abdominal wall in extant crocodilians
[62–64]. We suspect that the greatest difference between the
respective reconstructions is likely to lie in the mediolateral plane,
which is generally considered to be the most uncertain dimension in
trunk reconstructions of non-avian dinosaurs [6,59]. Our best
estimate reconstruction of MOR 555 had around 60 mm of soft
tissue between the proximal end of the ribs and the wall of the
thoracic cavity, which represents 17.8% of the mediolateral width of
one side of the body. A similar ratio was obtained in all our best
estimate models, but it is again difficult to compare this to previous
reconstructions as we are the first to quantify the mediolateral extent
of our volumetric reconstructions relative to the fossil skeletons. All
five axial skeletons modelled here remained articulated in poses of
the physical mounts, and the ‘accuracy’ of these reconstructions will
inevitably influence the size and shape of body outlines in any
physical or digital volumetric model. Particular uncertainty exists in
the placement and orientation of the scapulocoracoids, forelimbs
and ribs in non-avian dinosaurs, while correct spacing between
vertebrae (representing the volume occupied by the intervertebral
discs) is similarly unknown. Although well beyond the scope of this
study, the ability to segment and re-articulate the digital skeleton
means it would be perfectly possible to extend the sensitivity analysis
to quantify the effects of the choice of skeletal articulation on mass
set results.
The volume and hence mass assigned to hind limb segments is
also an equally controversial aspect of non-avian dinosaur biology
(see below). Only the shank segment of our best estimate model of
MOR 555 (0.212 m3) is similar to the 0.208 m3 estimated by
Hutchinson et al. [7]. Our larger thigh segment is probably
explained by the manner in which we have chosen to model its
attachment to the sacral segment. In all our models the thigh
segments are expanded proximally (at the expense of the sacral
segment) to encompass the volume for hypothesized tail and pelvic
musculature inserting on the hind limb [65]. This proximal
expansion appears larger than that in Hutchinson et al. [7], as do
the hamstrings of our model, but again this is difficult to assess as
their best estimate model is figured without the CT scans of the
hind limb skeleton. Perhaps the most unexpected disparity occurs
in head segment, where the final best estimate volume of
Hutchinson et al. [7] is just 62.2% of our estimate of 0.661 m3,
with the disparity in the final mass value increased by our smaller
zero-density air cavities. We constructed a head volume that
wrapped tightly around the skull without invading its surfaces. It is
possible that all our theropod head volumes are slightly too low, as
we did not greatly expand the cavity outline around the
paraoccipital crest. The possession of crescent-shaped, expanded
paraoccipital process in these theropods indicates a large muscle
attachment at the back of the skull [66], and it is possible that the
neck muscles attaching to the occiput achieved a thicker cross
section than we account for in our best estimate reconstructions.
The skeleton of Tyrannosaurus rex BHI 3033 is considerably larger
than MOR 555, for example body length is approximately 11.9 m
versus 11.1 m (estimated from models). It is therefore no surprise
that our best estimate model (Fig. 5) has a significantly higher total
body mass of 7655 kg. Our best estimate reconstruction of BHI
3033 contrasts starkly with that of Stevens et al. [46], despite using
Table 2. Results for the best estimate model of Tyrannosaurus rex BHI 3033.
Segment Net Density (kg m23) Volume (m3) Mass (kg) CM (x,y,z) (m) Ixx Iyy Izz (kg m2)
Head 990.6 0.685 678.561 2.553, 3.346, 0 147.908, 5947.62, 6042.42
Air sacs 0 0.01 0 - -
Neck 905.3 0.369 334.056 1.690, 3.376, 0 71.135, 1471.68, 1519.58
Pharynegeal cavity 0 0.035 0 - -
Thorax 746.46 3.01 2246.83 0.383, 2.958, 0 831.162, 2220.43, 2646.88
Lungs 0 0.764 0 - -
Sacrum 1000 1.062 1062.439 21.319, 3.004, 0 271.522, 1159.56, 1398.81
Tail 1000 1.106 1106.037 23.530, 3.092, 0 295.412, 12329.8, 12595.7
Arm 1000 0.011 10.931 1.138, 2.398, 0.483 7.643, 28.202, 30.566
Digit I 1000 0.001 0.644 1.315, 2.115, 0.62 0.832, 2.122, 2.458
Digit II 1000 0.001 0.548 1.33, 2.197, 0.591 0.606, 1.815, 2.037
Fore limb 1000 0.013 12.123 1.156,2.374,0.495 9.081, 32.139, 35.062
Thigh 1000 0.744 743.937 21.323, 2.853, 0.408 183.542, 78.453, 226.284
Shank 1000 0.215 214.664 21.887, 1.687, 0.357 13.856, 21.791, 30.382
Metatarsus 1000 0.074 73.812 22.431, 0.914, 0.298 3.380, 1.501, 3.258
Digit II 1000 0.023 22.332 21.897,0.11,0.29 0.257, 0.259, 0.499
Digit III 1000 0.027 26.564 21.811,0.134,0.457 0.308, 0.540, 0.781
Digit IV 1000 0.021 20.966 21.998,0.09,0.571 0.241, 0.242, 0.452
Pes 1000 0.07 69.863 22.112,0.681,0.72 -
Hind limb 1000 1.102 1102.276 21.37335, 2.19418,0.410458 -
HAT 871.1 6.257 5450.16 20.390195, 3.06656, 0 1635.301, 23193.44, 24273.56
Whole Body 904.6 8.462 7654.71 20.673342 2.81531 0 -
doi:10.1371/journal.pone.0004532.t002
Dinosaur Mass Properties
PLoS ONE | www.plosone.org 13 February 2009 | Volume 4 | Issue 2 | e4532
an identical modelling approach. Stevens et al. [46] estimate of
approximately 4400 kg falls well below our skinniest reconstruc-
tion (Fig. 10c) of 6905 kg (6777 kg with enlarged air sacs), in which
the torso cavity was tightly oppressed to the rib cage. Indeed, we
feel that our skinniest model is also too slender in the tail, neck and
hind limb (Fig. 10c) thereby casting extreme doubt on estimates
below 7000 kg for this animal. However, it should be noted that
Stevens et al. [46] were principally concerned with calculating the
CM of BHI 3033 rather than a robust total body mass value. As
with our other models, the segment volumes of our plus 7.5%
model (Fig. 10b) appear perfectly plausible given the inherent
uncertainties, and so total body mass estimates of around 8899 kg
appear to be reasonable. However, our plus 15% model (Fig. 10a)
appears to have an excessive amount of flesh around all its HAT
segments, suggesting the value of 9940 kg (10134 kg with reduced
air sacs) far exceeds the maximum for this animal. We suggest the
likely mass value lies in the range 7250–9000 kg. Overall, our
reconstructions add to the growing convergence of estimates above
5750 kg total body mass for Tyrannosaurus, depending on size of
individual studied [5–7].
The lack of attention received by non-Tyrannosaurid dinosaurs
means there is little comparative mass data on Acrocanthosaurus,
Stuthiominmus and Edmontosaurus. Our best estimate model of
Acrocanthosaurus (Fig. 7) is heavier than that of Henderson and
Snively [58] who estimated 5672 kg for NCSM 14345. Hender-
son and Snively [59] set the density of the post-cervical region to
1000 kg m3, and the cranio-cervical region to 900 kg m3 to
account for pneumatization of the skeleton and associated air
sacs. They also included a single zero density lung in the thoracic
region, which measured approximately 10% body volume. This
model of Acrocanthosaurus NCSM 14345 has subsequently been
modified following recent work [53–54] on the skeletal pneuma-
tization and pulmonary anatomy of non-avian theropods
(Henderson personal communication 2008). In this new model,
the volume surrounding the large neural spines in the sacral to
cervical region (‘sagittal crest’) have been modelled with a density
of 1000 kg m3, while the remainder of the pre-sacral volume has
been set at 900 kg m3, thereby lowering the original mass
estimate to 5072 kg (Henderson personal communication 2008).
Approximate segmentation of this revised model suggests our best
estimate model has a significantly larger tail volume (1.149 m3
versus ,0.679 m3). Such a large disparity is perhaps not
surprising given that the high-level of uncertainty surrounding
the mediolateral extent of post-sacral body cavities (see above)
applies equally to the tail segment. However, we feel that the
mediolateral extent of our best estimate tail volumes are in fact
quite conservative, particularly in the regions proximal to the
transition point housing the large caudofemoralis musculature
[67–68]. Certainly we feel the mediolateral extents of the tail
volumes in our plus 7.5% models remains within the realistic
range for each of the theropods, including Acrocanthosaurus. Our
fore- and hind limbs also differ significantly; whilst our best
estimate hind limbs (0.847 m3) are much larger than the 0.582 m3
reconstructed by Henderson and Snively [59], our fore limbs are a
mere one-third the volume (0.012 m3 versus 0.036 m3). Hender-
son and Snively’s [59] revised pre-sacral volume measures
approximately 3.742 m3 and is therefore only moderately smaller
than our value of 4.053 m3 for Acrocanthosaurus (i.e. 92.3% our
volume). However, subtracting the lung volume gives a net
density of 776.14 m3 and a mass of 2904 kg for Henderson and
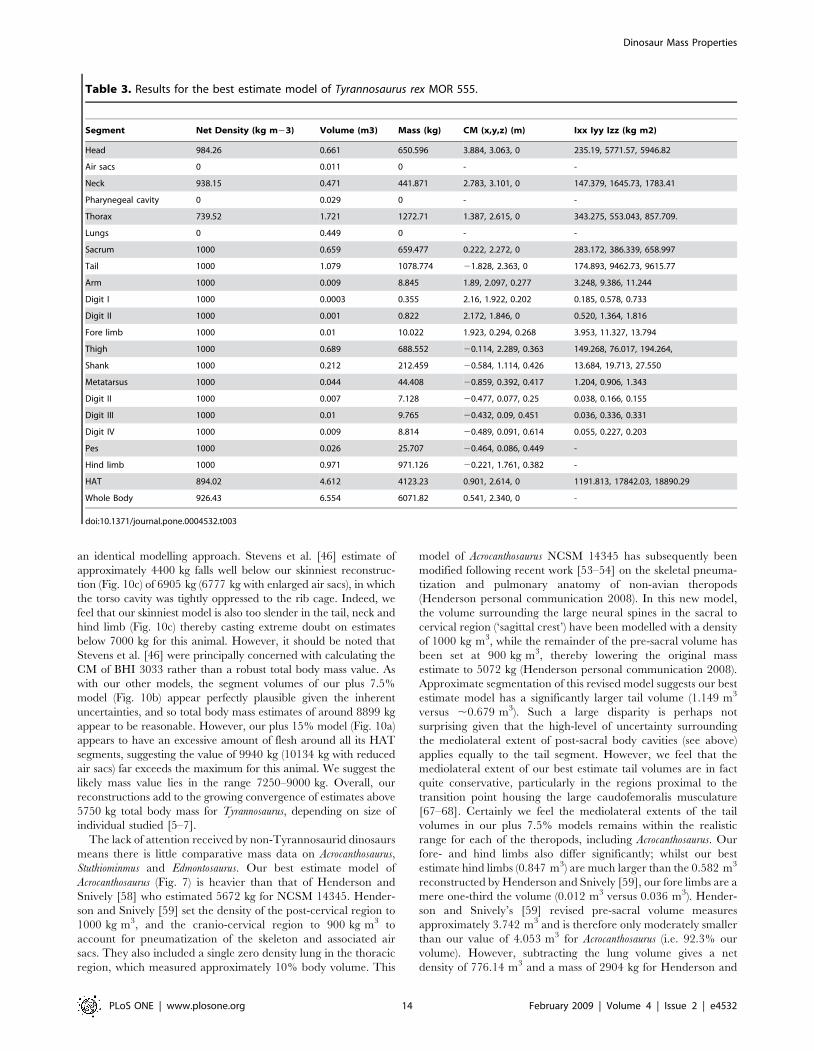
Table 3. Results for the best estimate model of Tyrannosaurus rex MOR 555.
Segment Net Density (kg m23) Volume (m3) Mass (kg) CM (x,y,z) (m) Ixx Iyy Izz (kg m2)
Head 984.26 0.661 650.596 3.884, 3.063, 0 235.19, 5771.57, 5946.82
Air sacs 0 0.011 0 - -
Neck 938.15 0.471 441.871 2.783, 3.101, 0 147.379, 1645.73, 1783.41
Pharynegeal cavity 0 0.029 0 - -
Thorax 739.52 1.721 1272.71 1.387, 2.615, 0 343.275, 553.043, 857.709.
Lungs 0 0.449 0 - -
Sacrum 1000 0.659 659.477 0.222, 2.272, 0 283.172, 386.339, 658.997
Tail 1000 1.079 1078.774 21.828, 2.363, 0 174.893, 9462.73, 9615.77
Arm 1000 0.009 8.845 1.89, 2.097, 0.277 3.248, 9.386, 11.244
Digit I 1000 0.0003 0.355 2.16, 1.922, 0.202 0.185, 0.578, 0.733
Digit II 1000 0.001 0.822 2.172, 1.846, 0 0.520, 1.364, 1.816
Fore limb 1000 0.01 10.022 1.923, 0.294, 0.268 3.953, 11.327, 13.794
Thigh 1000 0.689 688.552 20.114, 2.289, 0.363 149.268, 76.017, 194.264,
Shank 1000 0.212 212.459 20.584, 1.114, 0.426 13.684, 19.713, 27.550
Metatarsus 1000 0.044 44.408 20.859, 0.392, 0.417 1.204, 0.906, 1.343
Digit II 1000 0.007 7.128 20.477, 0.077, 0.25 0.038, 0.166, 0.155
Digit III 1000 0.01 9.765 20.432, 0.09, 0.451 0.036, 0.336, 0.331
Digit IV 1000 0.009 8.814 20.489, 0.091, 0.614 0.055, 0.227, 0.203
Pes 1000 0.026 25.707 20.464, 0.086, 0.449 -
Hind limb 1000 0.971 971.126 20.221, 1.761, 0.382 -
HAT 894.02 4.612 4123.23 0.901, 2.614, 0 1191.813, 17842.03, 18890.29
Whole Body 926.43 6.554 6071.82 0.541, 2.340, 0 -
doi:10.1371/journal.pone.0004532.t003
Dinosaur Mass Properties
PLoS ONE | www.plosone.org 14 February 2009 | Volume 4 | Issue 2 | e4532

Snively’s [59] modified post-sacral reconstruction (Henderson
personal communication 2008). Rather than reduce tissue density
to 900 kg m3 we included the full suite of hypothesised air sacs
[52–53] in our models (Fig. 3), which reduced the net density of
the post-sacral region to 847.52 kg m3 and the mass to 3435 kg.
Thus it is largely this density contrast that is responsible for
significant disparity in predicted body mass between the two
models, such that Henderson and Snively’s [59] post-sacral
reconstruction has a mass of 84.6% of our best estimate model.
The resulting total body value of 5072 kg is in fact considerably
lower than our most gracile Acrocanthosaurus (5570 kg, or
5473.96 kg with enlarged air sacs), which we consider to be
unreasonably emaciated in all HAT and proximal hind limb
segments (Fig. 12c). As with the two Tyrannosaurus models, our plus
7.5% model (Fig. 12b) remains within the likely maximum range
for body volumes, suggesting 7000 kg is not impossible for this
animal. However, the largest model created appears highly
implausible, having an unrealistic amount of external flesh
around all its HAT segments (Fig. 12a). We therefore suggest
5750–7250 kg represents a plausible maximum body mass range
for this specimen of Acrocanthosaurus.
Although no comparative data exists on Struthiomimus sedens,
Christiansen and Farina [41] estimated 175 kg for Strutiomimus altus
AHNM 5339 using a physical model, but the smaller skeleton of
this individual (e.g. femoral length 486 mm versus 662 mm in
Struthiomimus sedens 1266) makes meaningful comparisons difficult.
Sensitivity analysis of body segment volumes produced a suite of
models that in fact remained fairly reasonable in appearance
throughout the full range tested (Figs 8 & 13), although the
thoracic segment of the smallest model does appear unrealistically
skinny (Fig. 13c). Whilst we feel our best estimate model (423 kg)
represents the most realistic created (Fig. 8), we are less confident
in assigning a realistic range for body mass than with the other
theropods. Our largest model (Fig. 13a) has a mass of 524 kg
(529 kg with reduced air sacs) and does not appear to have an
unrealistic amount of flesh around the skeleton, despite the 22.6%
increase in volume over the best estimate model. Although we
consider the skinniest model (Fig. 13c) estimate of 381 kg (376 kg
with enlarged air sacs) still to be valid based on uncertainties, it
must be close to the minimum value as parts of the proximal tail
and thorax are tightly pressed to the skeleton.
The volumetric proportions of body segments in our recon-
structions of Struthiomimus differ significantly from those of the
larger theropods studied. The reduction of tail and associated
caudofemoralis musculature in derived non-avian theropods [67–
68] is reflected in tail of our best estimate model which is 12.3% of
the HAT volume, significantly less than the range of 17.7–23.4%
estimated for the three larger theropods modelled. The relative
contribution of the fore limbs was considerably greater in the best
estimate model of Struthiomimus, measuring a combined 5.56% of
the total HAT volume, versus 0.42% BHI 3033, 0.44% in MOR
555 and 0.47% in NCSM 14345. The relative volumes of the
proximal hind limb segments of our best estimate Struthiomimus also
differ significantly from the other theropods. In Struthiomimus the
thigh segment is only 2.5 times larger than the shank, while the
best estimate reconstructions of the more primitive theropods all
have thigh segments more than three times larger than their shank
segments (4.7 times larger in Acrocanthosaurus).
Table 4. Results for the best estimate model of Acrocanthosaurus atokensis NCSM 14345.
Segment Net Density (kg m23) Volume (m3) Mass (kg) CM (x,y,z) (m) Ixx Iyy Izz (kg m2)
Head 981.63 0.405 397.566 3.437, 2.137, 0 45.047, 4380.4, 4411.46
Air sacs 0 0.007 0 - -
Neck 911.07 0.336 306.118 2.325, 2.181, 0 42.1869, 1502.13, 1533.1
Pharynegeal cavity 0 0.03 0 - -
Thorax 760.07 2.42 1839.37 1.054, 2.169, 0 546.468, 2473.5, 2674.72
Lungs 0 0.58 0 - -
Sacrum 1000 0.768 768.158 20.54, 2.41, 0 194.869, 474.139, 654.687
Tail 1000 1.149 1148.734 22.77, 2.465, 0 130.905, 10988, 11088.9
Arm 1000 0.01 10.024 1.694, 1.252, 20.414 12.594, 27.204, 36.223
Digit I 1000 0.0005 0.491 1.721, 0.919, 20.585 1.076, 1.454, 2.194
Digit II 1000 0.001 1.207 1.814, 0.852, 20.531 2.804, 3.875, 5.997
Digit IV 1000 0.0006 0.639 1.815, 0.898, 20.422 1.333, 1.988, 3.092
Forelimb 1000 0.012 12.361 1.713, 1.181, 0.433 17.807, 34.521, 47.505
Thigh 1000 0.664 663.709 20.495, 2.067, 0.35 91.336, 97.478, 159.109
Shank 1000 0.142 142.12 20.255,0.936,0.308 11.385, 5.102, 13.239
Metatarsus 1000 0.033 32.925 20.277,0.236,0.32 0.670, 0.633, 0.762
Digit II 1000 0.002 2.257 0.023, 0.067, 0.185 0.003, 0.004, 0.004
Digit III 1000 0.003 3.647 0.105,0.026,0.341 0.006, 0.008, 0.008
Digit IV 1000 0.002 1.767 0.019, 0.071, 0.491 0.002, 0.002, 0.003
Pes 1000 0.007 7.677 0.062, 0.049, 0.33 -
Hind limb 1000 0.847 846.524 20.441, 1.788, 0.342 -
HAT 881.83 5.227 4484.67 0.103, 2.279, 0. 940.818, 19907.42, 20480.81
Whole Body 911.63 6.912 6177.04 20.046, 2.144, 0 -
doi:10.1371/journal.pone.0004532.t004
Dinosaur Mass Properties
PLoS ONE | www.plosone.org 15 February 2009 | Volume 4 | Issue 2 | e4532

Table 5. Results for the best estimate model of Struthiomimus sedens BHI 1266.
Segment Net Density (kg m23) Volume (m3) Mass (kg) CM (x,y,z) (m) Ixx Iyy Izz (kg m2)
Head 974.01 0.0016 1.649 1.894, 2.302, 0 0.649, 4.15, 4.799
Air sacs 0 0.004 0 - -
Neck 901.81 0.02 18.029 1.340, 1.919, 0 1.877, 19.779, 21.771
Pharynegeal cavity 0 0.002 0 - -
Thorax 809.72 0.142 114.988 0.650, 1.659, 0 5.344, 19.320, 22.561
Lungs 0 0.027 0 - -
Sacrum 1000 0.082 81.723 20.019, 1.639, 0 2.839, 12.688, 14.979
Tail 1000 0.037 37.067 20.854, 1.827, 0 3.749, 57.530, 61.112
Arm 1000 0.008 8.042 0.887, 1.384, 0.227 1.353, 3.164, 3.637
Digit I 1000 0.0001 0.157 0.887, 1.384, 0.227 0.100, 0.104, 0.169
Digit II 1000 0.0001 0.141 1.053, 0.953, 0.335 0.104, 0.087, 0.158
Digit III 1000 0.0001 0.132 0.981, 0.904, 0.326 0.049, 0.041, 0.074
Fore limb 1000 0.008 8.472 0.894, 1.36, 0.232 1.607, 3.396, 4.039
Thigh 1000 0.049 49.349 0.057, 1.604, 0.175 1.975, 1.273, 2.979
Shank 1000 0.02 19.988 0.188, 0.966, 0.15 0.864, 0.165, 0.953
Metatarsus 1000 0.004 4.446 0.221, 0.393, 0.114 0.082, 0.089, 0.066
Digit II 1000 0.001 0.656 0.444, 0.159, 0.051 0.001, 0.003, 0.004
Digit III 1000 0.001 0.807 0.51, 0.157, 0.106 0.003, 0.006, 0.009
Digit IV 1000 0.001 0.799 0.441, 0.157, 0.142 0.002, 0.004, 0.005
Pes 1000 0.003 2.262 0.466,0.158,0.103 -
Hind limb 1000 0.076 76.045 0.088, 1.196, 0.163 -
HAT 902.84 0.299 270.557 0.310, 1.677, 0 17.673, 120.261, 133.300
Whole Body 935.76 0.452 422.647 0.230, 1.504, 0 -
doi:10.1371/journal.pone.0004532.t005
Table 6. Results for the best estimate model of Edmontosaurus annectens 126950.
Segment Net Density (kg m23) Volume (m3) Mass (kg) CM (x,y,z) (m) Ixx Iyy Izz (kg m2)
Head 962.4 0.028 27.17 1.082, 1.623, 0 5.288, 44.997, 50.065
Air sacs 0 0.006 0 - -
Neck 1000 0.025 25.36 0.837, 1.202, 0 0.937, 27.506, 28.161
Thorax 764.97 0.264 201.952 0.240, 1.073, 0 18.363, 50.790, 61.312
Lungs 0 0.062 0 - -
Sacrum 1000 0.177 176.939 20.589, 1.275, 0 9.363, 42.509, 49.708
Tail 1000 0.071 71.281 21.556, 1.36, 0 3.369, 140.812, 143.865
Fore limb 1000 0.011 11.031 0.618, 0.578, 0.129 4.734, 7.663, 11.986
Thigh 1000 0.112 112..431 20.588, 1.184, 0.197 3.984, 6.623, 9.137
Shank 1000 0.023 22.757 20.346, 0.575, 0.237 0.655, 0.261, 0.788
Metatarsus 1000 0.005 4.582 20.396, 0.2, 0.203 0.023, 0.023, 0.020
Digit II 1000 0.001 1.158 20.299, 0.084, 0.051 0.003, 0.004, 0.003
Digit III 1000 0.001 1.457 20.296, 0.095, 0.184 0.003, 0.007, 0.007
Digit IV 1000 0.001 0.925 20.296, 0.061, 0.281 0.002, 0.003, 0.003
Pes 1000 0.004 4.473 20.27,0.077,0.171 -
Hind limb 1000 0.144 144.243 20.507, 0.976, 0.203 -
HAT 893.98 0.587 524.764 20.195, 1.194, 0 46.78793, 321.9393, 357.0826
Whole Body 929.43 0.875 813.25 20.306, 1.116, 0 -
doi:10.1371/journal.pone.0004532.t006
Dinosaur Mass Properties
PLoS ONE | www.plosone.org 16 February 2009 | Volume 4 | Issue 2 | e4532

Table 7. Results of the alternative mass models of each the five modelled specimens.
Model Net Density (kg m23) Volume (kg m2) Mass (kg) CM (x,y,z) (m) HAT Ixx Iyy Izz
Tyrannosaurus BHI 3033 Plus 15% 903.18 11.006 9940.43 20.659, 2.806, 0 2376.198, 29342.41, 30733.88
Tyrannosaurus BHI Plus 7.5% 893.07 9.965 8899.45 20.704, 2.83,1 0 1869.518, 26018.87, 27149.74
Tyrannosaurus BHI 3033 Minus 7.5% 866.32 7.97 6904.67 20.636, 2.830, 0 1250.244, 21001.73, 21781.5
Tyrannosaurus MOR 555 Plus 15% 918.3 8.384 7699.53 0.492, 2.622, 0 1759.118, 21907.18, 23358.74
Tyrannosaurus MOR 555 Plus 7.5% 910.36 7.641 6956.06 0.499, 2.349, 0 1448.034, 19784.4, 21020.42
Tyrannosaurus MOR 555 Minus 7.5% 890.76 6.264 5579.7 1.121, 2.649, 0 1071.807, 16237.88, 17195.49
Acrocanthosaurus NCSM 14345 Plus 15% 917.1 8.45120698 7750.61 20.091, 2.134, 0 1647.604, 25178.05, 26119.1
Acrocanthosaurus NCSM 14345 Plus 7.5% 921.94 7.462207 7026.64 0.746,1 2.278, 0 1224.917, 9567.658, 10306.4
Acrocanthosaurus NCSM 14345 Minus 7.5% 914.21 6.092207 5569.56 20.015, 2.146, 0 975.996, 20120.7, 20677.1
Struthiomimus BHI 1266 Plus 15% 946.55 0.554 524.139 0.241, 1.492, 0 24.287, 154.96, 172.847
Struthiomimus BHI 1266 Plus 7.5% 939.29 0.496 465.829 0.234, 1.499, 0 20.525, 136.412, 151.557
Struthiomimus BHI 1266 Minus 7.5% 925.83 0.412 381.444 0.239, 1.511, 0 16.615, 106.906, 118.318
Edmontosaurus BHI 126950 Plus 15% 941.52 1.045 983.889 20.174, 1.088, 0 63.989, 198.191, 244.798
Edmontosaurus BHI 126950 Plus 7.5% 935.83 0.959 897.458 20.178, 1.101, 0 54.936, 183.743, 224.065
Edmontosaurus BHI 126950 Minus 7.5% 924.95 0.803 742.736 20.314, 1.132, 0 40.286, 287.616, 318.421
doi:10.1371/journal.pone.0004532.t007
Table 8. Results of mixed HAT segments sensitivity analysis.
Model Thorax/neck Tail HAT CM Whole body CM
Coordinates(x,y,z) (m)
Relative to hipjoint (x,y) (m)
%body lengthcraneal tohip joint
Coordinates(x,y,z) (m)
Relative tohip joint(x,y) (m)
Tyrannosaurus rex BHI 3033 Bestestimate
Bestestimate
20.390, 3.07, 0 0.855, 20.046 7.33 20.673, 2.815, 0 0.572,20.297
4.9
Tyrannosaurus rex BHI 3033 Plus 15% Minus 7.5% 20.148, 3.05, 0 1.098, 20.062 9.41 20.462, 2.830, 0 0.784,20.282
6.71
Tyrannosaurus rex BHI 3033 Minus 7.5% Plus 7.5% 20.654, 3.08, 0 0.591, 20.035 5.06 20.860, 2.824, 0 0.385,20.288
3.3
Tyrannosaurus rex MOR 555 Bestestimate
Bestestimate
0.901, 2.614, 0 0.828, 20.052 7.47 0.541, 2.340, 0 0.468,20.326
4.22
Tyrannosaurus rex MOR 555 Plus 15% Minus 7.5% 1.119, 2.657, 0 1.045, 20.009 9.44 0.726, 2.394, 0 0.652,20.272
5.89
Tyrannosaurus rex MOR 555 Minus 7.5% Plus 7.5% 0.636, 2.593, 0 0.562, 20.074 5.08 0.368, 2.333, 0 0.295,20.334
2.66
Acrocanthosaurus atokensisNCSM 14545
Bestestimate
Bestestimate
0.103, 2.279, 0. 0.472, 20.081 4.21 20.046, 2.144, 0 0.322,20.216
2.87
Acrocanthosaurus atokensisNCSM 14545
Plus 15% Minus 7.5% 0.364, 2.234, 0. 0.732, 20.126 6.53 0.163, 2.122, 0 0.531,20.237
4.74
Acrocanthosaurus atokensisNCSM 14545
Minus 7.5% Plus 7.5% 20.223, 2.309, 0 0.146, 20.051 1.3 20.281, 2.170, 0 0.087,20.190
0.78
Struthiomimus sedens 1266 Bestestimate
Bestestimate
0.310, 1.677, 0 0.324, 20.076 6.917 0.230, 1.504, 0 0.244,20.249
5.21
Struthiomimus sedens 1266 Plus 15% Minus 7.5% 0.397, 1.674, 0 0.411, 20.079 8.78 0.296, 1.518, 0 0.310,20.235
6.63
Struthiomimus sedens 1266 Minus 7.5% Plus 7.5% 0.235, 1.681, 0 0.249, 20.072 5.33 0.182, 1.506, 0 0.197,20.247
4.2
Edmontosaurus annectens126950
Bestestimate
Bestestimate
20.195, 1.194, 0 0.409, 20.174 9.69 20.304, 1.116, 0 0.299,20.252
7.07
Edmontosaurus annectens126950
Plus 15% Minus 7.5% 20.112, 1.154, 0 0.493, 20.215 11.66 20.241, 1.010, 0 0.363,20.273
8.61
Edmontosaurus annectens126950
Minus 7.5% Plus 7.5% 20.261, 1.216, 0 0.344, 20.152 8.14 20.343, 1.129, 0 0.262,20.239
6.2
doi:10.1371/journal.pone.0004532.t008
Dinosaur Mass Properties
PLoS ONE | www.plosone.org 17 February 2009 | Volume 4 | Issue 2 | e4532

Although a similar body length to Struthiomimus, our best
estimate reconstruction of Edmontosaurus (Fig. 9) is approximately
twice the mass at 813 kg, owing largely to the significantly greater
dorsoventral depth of the body segments. As with our theropod
models, we reconstructed the ventral outline of the body close to
the skeleton around the pelvic and pectoral girdles (Fig. 9a&c),
based on previous myological reconstructions [69–70]. Whilst this
helped constrain the likely ventral profile in the thoracic segment
between the pubes and sternum, the dorsoventral depth given to
the tail remained particularly subjective. Despite this level of
uncertainty we feel our largest model (984 kg, or 994 kg with a
reduced lung) considerably overestimates HAT volume, having a
ventral profile that extends too far below the axial skeleton
(Fig. 14a). In contrast to the theropods modelled, our smallest
Edmontosaurus (743 kg, or 732 kg with an enlarged lung) retains a
realistic ventral profile, albeit with extremely little flesh around the
distal ischium (Fig. 14c). However, the HAT segments, particularly
the thoracic volume, are tightly pressed mediolaterally against the
skeleton, casting extreme doubt on the mass estimation. Given
these reconstructions we suggest 775–925 kg represents a
reasonable range for total body mass of this individual.
The results of our sensitivity analysis of air sac volumes largely
concurs with previous analyses and assertions that suggest errors in
lung volumes will have relatively little effect on body mass
predictions in dinosaurs [7,44]. Our initial air sacs ranged from
6.8–9.6% of total best estimate body volumes (or 10.2–12.9%
HAT volume) in non-avian theropods and 7.8% (11.6% HAT
volume) in Edmontosaurus. Larger body air sacs increased this
volume to 7.9–11.1% in non-avian theropods and 9% in
Edmontosaurus, while smaller air sacs ranged from 5.4–7.3% and
6.6% best estimate body volumes. Changing air sac volumes in the
largest and smallest models to exaggerate mass effects had less than
+/22% effect on total body mass in these models. The caudal
extent of the thoracic airs sacs lies just in front of the pelvis in each
of the non-avian theropods modelled, which may be conservative
for Tyrannosaurs and Struthiomimus based on evidence from skeletal
pneumatisation [71]. Addition of an abdominal air sac to our best
estimate models (Supporting Information Tables S1: 1–49) had a
modest affect on mass predictions, reducing total body by between
1.3–2.98% in the non-avian theropods.
Centres Of Mass (CM). As with body mass estimates, the
majority of published CM predictions are for Tyrannosaurus, and
Table 9. Predicted hind limb mass proportions expressed as percentage of total body mass for models of each specimen.
Model HAT Legs % hind limb mass
Tyrannosaurus rex BHI 3033 Best estimate Best estimate 14.4
Tyrannosaurus rex BHI 3033 Plus 15% Plus 15% 14.7
Tyrannosaurus rex BHI 3033 Plus 7.5% Plus 7.5% 15.3
Tyrannosaurus rex BHI 3033 Minus 7.5% Minus 7.5% 14.1
Tyrannosaurus rex BHI 3033 Plus 15% Minus 7.5% 9.8
Tyrannosaurus rex BHI 3033 Minus 7.5% Plus 15% 21.1
Tyrannosaurus rex MOR 555 Best estimate Best estimate 16
Tyrannosaurus rex MOR 555 Plus 15% Plus 15% 16.3
Tyrannosaurus rex MOR 555 Plus 7.5% Plus 7.5% 16.7
Tyrannosaurus rex MOR 555 Minus 7.5% Minus 7.5% 15.7
Tyrannosaurus rex MOR 555 Plus 15% Minus 7.5% 11.4
Tyrannosaurus rex MOR 555 Minus 7.5% Plus 15% 22.4
Acrocanthosaurus atokensis NCSM 14345 Best estimate Best estimate 13.7
Acrocanthosaurus atokensis NCSM 14345 Plus 15% Plus 15% 13
Acrocanthosaurus atokensis NCSM 14345 Plus 7.5% Plus 7.5% 13
Acrocanthosaurus atokensis NCSM 14345 Minus 7.5% Minus 7.5% 13.8
Acrocanthosaurus atokensis NCSM 14345 Plus 15% Minus 7.5% 9.9
Acrocanthosaurus atokensis NCSM 14345 Minus 7.5% Plus 15% 18
Struthiomimus sedens BHI 1266 Best estimate Best estimate 18
Struthiomimus sedens BHI 1266 Plus 15% Plus 15% 17.9
Struthiomimus sedens BHI 1266 Plus 7.5% Plus 7.5% 17.8
Struthiomimus sedens BHI 1266 Minus 7.5% Minus 7.5% 17.1
Struthiomimus sedens BHI 1266 Plus 15% Minus 7.5% 12.4
Struthiomimus sedens BHI 1266 Minus 7.5% Plus 15% 24.6
Edmontosaurus annectens BHI 126950 Best estimate Best estimate 17.7
Edmontosaurus annectens BHI 126950 Plus 15% Plus 15% 17.2
Edmontosaurus annectens BHI 126950 Plus 7.5% Plus 7.5% 17.45
Edmontosaurus annectens BHI 126950 Minus 7.5% Minus 7.5% 18.2
Edmontosaurus annectens BHI 126950 Plus 15% Minus 7.5% 13.7
Edmontosaurus annectens BHI 126950 Minus 7.5% Plus 15% 22.8
doi:10.1371/journal.pone.0004532.t009
Dinosaur Mass Properties
PLoS ONE | www.plosone.org 18 February 2009 | Volume 4 | Issue 2 | e4532

Figure 10. The three alternative models of Tyrannosaurus rex BHI 3033 in lateral, oblique right craniolateral and dorsal views. Neck,thoracic, sacral, tail and proximal hind limb segments have been increased by (A) 15% and (B) 7.5% in the two larger models, and (c) decreased by7.5% in the smaller model.doi:10.1371/journal.pone.0004532.g010
Dinosaur Mass Properties
PLoS ONE | www.plosone.org 19 February 2009 | Volume 4 | Issue 2 | e4532

our data set provides important new information on taxa from
other dinosaurian groups. Our sensitivity analysis demonstrates
that the whole body CM must lie well in front and below the hip
joint in all five taxa studied (Table 8, Fig. 15), and therefore
probably in all dinosaurian groups. Even in models with
significantly enlarged tails and reduced thoracic and neck
Figure 11. The three alternative models of Tyrannosaurus rex MOR 555 in lateral, oblique right craniolateral and dorsal views. Neck,thoracic, sacral, tail and proximal hind limb segments have been increased by (A) 15% and (B) 7.5% in the two larger models, and (c) decreased by7.5% in the smaller model.doi:10.1371/journal.pone.0004532.g011
Dinosaur Mass Properties
PLoS ONE | www.plosone.org 20 February 2009 | Volume 4 | Issue 2 | e4532

Figure 12. The three alternative models of Acrocanthosaurus atokensis NCSM 14345 in lateral, oblique right craniolateral and dorsalviews. Neck, thoracic, sacral, tail and proximal hind limb segments have been increased by (A) 15% and (B) 7.5% in the two larger models, and (c)decreased by 7.5% in the smaller model.doi:10.1371/journal.pone.0004532.g012
Dinosaur Mass Properties
PLoS ONE | www.plosone.org 21 February 2009 | Volume 4 | Issue 2 | e4532

segments the CM still remained comfortably in front of the hip
joint. Whilst this general conclusion has been reached before about
CM positions, only Hutchinson et al. [7] have demonstrated that it
is upheld within the bounds of uncertainties regarding body and
air sac volumes as we do here. The best estimate MOR 555 of
Hutchinson et al. [7] has a CM 0.51 m cranial of the hip joint,
very close to the position (0.468 m) in our reconstruction. Our
range of CM values for MOR 555 partially overlap that of
Hutchinson et al. [7], with our more caudally distributed range
(0.295–0.652 m cranial of the hip joint) explained by our smaller
thoracic volume (see above).
Varying the volume of thoracic and pharyngeal air sacs had a
relatively modest effect on CM positions in all five animals models
(Supporting Information Tables S1: 26–49). For example, smaller
and larger air sacs generally shifted the CM by just +/20.01 m
along x and y axes in Edmontosaurus and Struthiomimus, and on
average by around +/20.03 m in Acrocanthosaurus and the two
Tyrannosaurs. This largely reflected the fact that air sac volumes
were modified by simply raising or lowering ventral base of the
cavities, rather expanding or contracting the volume in three
dimensions as in previous studies [e.g. 7].
Moments Of Inertia. Hutchinson et al. [7] present the only
comparable data set on inertial properties for a non-avian
dinosaur. However, comparing the two data sets is difficult as
we only calculate the moments of inertia for our combined HAT
segments of MOR 555 versus the whole body calculation in
Hutchinson et al. [7]. These authors do state the principal
moments of the HAT segment of their skinniest model, which are
understandably lower than our best estimates given the lower mass
estimate, particularly for Iyy and Izz.
As stated previously, inertial values showed a positive correla-
tion with body mass such that the heaviest models consistently had
the largest principal moments of inertia. Differences in the relative
values of principal moments across the studied animals appear to
be size based rather than taxonomic. The ratios of the principal
moments of best estimate models of BHI 3033 (0.07: 0.96: 1),
MOR 555 (0.06: 0.94: 1) and Acrocanthosaurus (0.05: 0.97: 1) are
almost identical, and contrast with the relatively higher values for
Ixx attained for the smaller Struthiomimus (0.13: 0.90: 1) and
Edmontosaurus (0.13: 0.90: 1). This may add support to the idea that
larger theropods possessed body shape that minimized rotational
inertia relative to smaller taxa [59], but clearly a more detailed
analysis is required to evaluate this thoroughly.
Mass predictions and biomechanical modellingInformation on the 3D distribution of mass is fundamental to
biomechanical assessments in both extant and extinct taxa [36],
and in recent times this data has been used in a variety of
functional appraisals of non-avian dinosaurs. Using static models
Hutchinson [56] and colleagues [7,33] have demonstrated that
values chosen for the CM and particularly the ratio of hind limb
muscle mass to total body mass have a significant effect on the
level of locomotor ability of bipedal non-avian dinosaurs. Sellers
and Manning [35] performed a dynamic analysis of locomotion in
the same taxa and used sensitivity analysis to demonstrate a
positive correlation between hind limb muscle mass and locomotor
ability in Tyrannosaurus. This sensitivity analysis was extended by
Bates [57] who similarly demonstrated that the ratio of hind limb
muscle mass to total mass has the single greatest effect on
predictions of maximum running speed in bipedal dinosaurs.
Comparable published data on hind limb muscle mass in extant
vertebrates is scarce, and many studies omit the total body mass of
the specimens making it impossible for the ratio to be determined.
The majority of studies weigh whole limb segments (i.e. including
bones), which although not measures of muscle mass, are directly
comparable to our models in which limb segments have been
given uniform density. Our best estimate model of MOR 555 has
a single hind limb mass equivalent to 16% total body mass
(Table 9), close to the 14.2% estimated by Hutchinson et al. [7] for
this animal. The revised Acrocanthosaurus model of Henderson and
Snively [59] has 11.5% total body mass in a single hind limb,
slightly lower than the 13.7% we estimate here. The best estimate
Figure 13. The three alternative models of Struthiomimus sedensBHI 1266 in lateral, oblique right craniolateral and dorsalviews. Neck, thoracic, sacral, tail and proximal hind limb segmentshave been increased by (A) 15% and (B) 7.5% in the two larger models,and (c) decreased by 7.5% in the smaller model.doi:10.1371/journal.pone.0004532.g013
Dinosaur Mass Properties
PLoS ONE | www.plosone.org 22 February 2009 | Volume 4 | Issue 2 | e4532

Figure 14. The three alternative models of Edmontosaurus annectens BHI 126950 in lateral, oblique right craniolateral and dorsalviews. Neck, thoracic, sacral, tail and proximal hind limb segments have been increased by (A) 15% and (B) 7.5% in the two larger models, and (c)decreased by 7.5% in the smaller model.doi:10.1371/journal.pone.0004532.g014
Dinosaur Mass Properties
PLoS ONE | www.plosone.org 23 February 2009 | Volume 4 | Issue 2 | e4532

models of the three large theropods therefore have a range of
13.7–16%, while Struthiomimus (18%) and Edmontosaurus (17.7%)
have slightly higher values (Table 9), as might be predicted by their
smaller size [56]. These values are substantially lower than the best
estimate values used for non-avian theropods in analyses of
Hutchinson [56] and Sellers and Manning [35]. These models had
approximately 23.85% muscle mass in each hind limb, which
exceeds the highest estimates possible for larger theropods using
the body segment combinations created here. However these
values are not strictly comparable since some of this muscle mass is
contained in the HAT segment rather than in the legs. Only the
model of Struthiomimus composed of the largest limb and smallest
HAT volumes produces a ratio above 0.24. This casts significant
doubt on maximum running speeds above 12 m/s for the largest
Figure 15. HAT (left) and whole body (right) centres of mass for each model of (A) Tyrannosaurus rex BHI 3033, (B) Tyrannosaurus rexMOR 555, (C) Acrocanthosaurus atokensis NCSM 14345, (D) Struthiomimus sedens BHI 1266 and (E) Edmontosaurus annectens BHI126950 (not to scale).doi:10.1371/journal.pone.0004532.g015
Dinosaur Mass Properties
PLoS ONE | www.plosone.org 24 February 2009 | Volume 4 | Issue 2 | e4532

non-avian theropods like Tyrannosaurus, based on current simula-
tions. However, it should be noted that although our hind limb
masses are inclusive of bone volume, they do not include the
sizable contribution of major tail-based hip extensors such as the
caudofemoralis longus. Clearly more precise values for dinosaur
locomotor muscle mass should be sought by separating out bone
volume and including tail-based musculature and this should be
possible in the CAD environment. That said, we feel it unlikely
that significantly higher values (i.e. plus 20% total body mass per
limb) are realistic for medium to large non-avian theropods.
The relatively conservative range of CM values attained in this
study is of some reassurance to those studying dinosaur locomotor
biomechanics. In our previous work, varying the longitudinal
position of the trunk or HAT CM had little effect on the predicted
maximum running speed of Allosaurus [57], despite testing a
relative range that extended significantly closer and farther cranial
to the hip joint than predicted for taxa in this study (Table 8,
Fig. 15). However, trunk orientation was not constrained in the
relatively simple anatomical model of Allosaurus used in this
investigation and subsequently the model responded to CM
changes by progressively increasing the angle of the trunk with
respect to the ground thereby maintaining the proximity of CM to
the hip joint on the longitudinal axis. The development of
anatomically realistic articulated digital models, such as those in
this study, will allow the internal range of motion within the trunk
to be constrained within realistic bounds in future locomotor
simulations. When combined with sensitivity analyses like the one
conducted here, a more detailed examination of the effects of CM
positions in non-avian dinosaurs on locomotor mechanics will be
possible.
ConclusionsOur modelling approach represents a highly flexible non-
invasive technique for estimating the mass properties of extinct
animals, which can be equally well applied to extant forms. The
high level of automated processing and data extraction greatly
simplifies mathematically complex and time-consuming processes
and simultaneously minimises the potential for human error. The
rapidity with which models can be manipulated and modified has
allowed a comprehensive evaluation of the full suite of mass set
properties for five specimens of four species of non-avian dinosaurs
using a detailed sensitivity analysis. This analysis allowed
maximum likely plausible ranges of mass set values to be identified
for each taxa, accounting for the effects of inevitable unknowns in
these reconstructions. The importance of sensitivity analyses is
emphasized further when mass set values are applied to
biomechanical assessments of non-avian dinosaurs. Clearly, future
biomechanical assessments of extinct taxa should be preceded by a
detailed investigation of the plausible range of mass properties, in
which sensitivity analyses are used to identify a suite of possible
values to be tested as inputs in the biomechanical model [7,57].
This emphasises that higher level biomechanical and evolutionary
analyses of extinct taxa should be conducted in an iterative
fashion, with on-going critical evaluation of mass and soft tissue
properties used in analytical models.
Supporting Information
Tables S1 Supplementary data tables to published in on-line
appendix
Found at: doi:10.1371/journal.pone.0004532.s001 (2.07 MB
DOC)
Acknowledgments
We thank P. Larson, N. Larson, S. Farrar and the Black Hills Institute of
Geological Research for their generous assistance and access to the
mounted skeletons. Jon Codd is thanked for helpful discussions of theropod
respiratory anatomy, Don Henderson for kindly providing a full
breakdown of data for his Acrocanthosaurus model and Nicola Smith for
provision of her ostrich data. Peter Falkingham provided generous advice
and help preparing figures.
Author Contributions
Conceived and designed the experiments: KTB WS. Performed the
experiments: KTB. Analyzed the data: KTB. Contributed reagents/
materials/analysis tools: KTB MLP HD WS. Wrote the paper: KTB.
References
1. Gregory WK (1905) The weight of the Brontosaurus. Science, new series 22:
572.2. Colbert EH (1962) The weights of dinosaurs. American Mus Novit 2181: 1–24.
3. Alexander RM (1985) Mechanics of gait and posture of some large dinosaurs.Zoological Journal of the Linnean Society 83: 1–25.
4. Alexander RM (1989) Dynamics of Dinosaurs and Other Extinct Giants. New
York: Columbia University Press. 167 p.5. Farlow JO, Smith MB, Robinson JM (1995) Body mass, bone ‘strength
indicator’ and cursorial potential of Tyrannosaurus rex. Journal of VertebratePaleontology 15: 713–725.
6. Henderson DM (1999) Estimating the Masses and Centers of Masses of ExtinctAnimals by 3-D Mathematical Slicing. Paleobiology 25: 88–106.
7. Hutchinson JR, Thow-Hing VN, Anderson FC (2007) A 3D interactive method
for estimating body segmental parameters in animals: Application to the turningand running performance of Tyrannosaurus rex. Journal of Theoretical Biology
246: 660–680.8. Arita HT, Robinson JG, Redford KH (1990) Rarity in Neotropical Forest
Mammals and Its Ecological Correlates. Conservation Biology 4: 181–192.
9. Gaston KJ, Blackburn TM (1996) Conservation Implications of GeographicRange Size – Body Size Relationships. Conservation Biology 10: 638–646.
10. Pyron M (1999) Relationships between geographic range size, body size, localabundance and habitat breadth in North America suckers and sunfishes. Journal
of Biogeography 26: 549–558.11. Damuth J (1981) Population density and body size in mammals. Nature 290:
699–700.
12. Nee S, Read AF, Greenwood JJD, Harvey PH (1991) The relationship betweenabundance and body size in British Birds. Nature 351: 312–313.
13. Swihart RK, Slade NA, Bergstrom BJ (1988) Relating body size to the rate ofhome range use in Mammals. Ecology 69: 393–399.
14. Bergmann C (1847) Uber die Verhaltnisse der Warmeokonomie der Thiere zu
ihrer Grosse. Goettinger Studien. Part 1.
15. Graves GR (1991) Bergmann’s Rule Near the Equator: Latitudinal Clines in
Body Size of an Andean Passerine Bird. Proceedings of the National Academy ofSciences of the United States of America 88: 2322–2325.
16. Brown JH, Maurer BA (1986) Body size, ecological dominance and Cope’s rule.Nature 324: 248–250.
17. Damuth J, MacFadden BJ, eds (1990) Body size in mammalian paleobiology:
estimation and biological implications. Cambridge: Cambridge University Press.412 p.
18. Stanley SM (1986a) Extinction. New York: Scientific American Books. 242 p.19. Stanley SM (1986b) Population size, extinction, and speciation: the fission effect
in Neogene Bivalvia. Paleobiology 12: 89–110.20. Stanley SM (1990) Delayed recovery and the spacing of major extinctions.
Paleobiology. pp 410–414.
21. Cope ED (1896) The Primary Factors of Organic Evolution. New York: OpenCourt Publishing Co. 213 p.
22. Hallam A (1975) Evolutionary size increase and longevity in Jurassic bivalvesand ammonites. Nature 258: 493–496.
23. Hallam A (1990) Biotic and abiotic factors in the evolution of early Mesozoic
marine molluscs. In: Ross RM, Allmon WD, eds. Causes of evolution. Chicago:University of Chicago Press. pp 249–269.
24. Benton MJ (1989) Evolution of large size. In: Briggs DEG, Crowther PR, eds.Palaeobiology: A synthesis. Oxford: Blackwells. pp 147–152.
25. Kingsolver JG, Pfennig DW (2004) Individual-level selection as a cause of Cope’sRule of phyletic size increase. Evolution 58: 1608–1612.
26. Carrano MT (2006) Body-size evolution in the Dinosauria. In: Carrano MT,
Blob RW, Gaudin TJ, Wible JR, eds. Amniote Paleobiology: Perspectives on theEvolution of Mammals, Birds, and Reptiles. Chicago: University of Chicago
Press. pp 225–268.27. LaBarbara M (1986) The evolution and ecology of body size. In: Raup DM,
Jablonski D, eds. Patterns and processes in the history of life. Berlin: Springer-
Verlag. pp 69–98.
Dinosaur Mass Properties
PLoS ONE | www.plosone.org 25 February 2009 | Volume 4 | Issue 2 | e4532

28. Jablonski DM (1996) Body size and Macroevolution. In: Jablonski DM, Erwin H,
Lipps JH, eds. Evolutionary Palaeobiology: In honor of James W. Valentine.Chicago: University of Chicago Press. pp 211–256.
29. Biewener AA (1983) Allometry of quadrupedal locomotion: the scaling of duty
factor, bone curvature and limb orientation to body size. Journal ofExperimental Biology 105: 147–171.
30. Biewener AA (1989) Scaling body support in mammals: limb posture and musclemechanics. Science 245: 45–48.
31. Coombs WP (1978) Theoretical aspects of cursorial adaptations in dinosaurs.
Quarterly Review of Biology 53: 393–418.32. Christiansen P (2002) Locomotion in terrestrial mammals: the influence of body
mass, limb length and bone proportions on speed. Zoological Journal of theLinnean Society 136: 685–714.
33. Hutchinson JR, Garcia M (2002) Tyrannosaurus was not a fast runner. Nature415: 1018–1021.
34. Iriate-Diaz J (2002) Differential scaling of locomotor performance in small and
large terrestrial mammals. The Journal of Experimental Biology 205:2897–2908.
35. Sellers WI, Manning PL (2007) Estimating dinosaur maximum running speedsusing evolutionary robotics. The Proceedings of the Royal Society B 274:
2711–2716.
36. Winter DA (1990) Biomechanics and Motor Control of Human Movement.New York: Wiley.
37. Gatesy SM (1991) Hind limb scaling in birds and other theropods: implicationsfor terrestrial locomotion. Journal of Morphology 209: 83–96.
38. Gatesy SM, Biewener AA (1991) Bipedal locomotion: effects of size, speed andlimb posture in birds and humans. J Zool (Lond) 224: 127–147.
39. Christiansen P (1999) Long-bone scaling and limb posture in non-avian
theropods: evidence for differential allometry. Journal of Vertebrate Paleontol-ogy 19: 666–680.
40. Carrano MT (2001) Implications of limb bone scaling, curvature andeccentricity in mammals and non-avian dinosaurs. Journal of Zoology, London
254: 41–55.
41. Christiansen P, Farina RA (2004) Mass Prediction in Theropod Dinosaurs.Historical Biology 16: 85–92.
42. Crompton RH, Li Y, Gunther MM, Alexander RM (1996) Segment InertialProperties of Primates: New Techniques for Laboratory and Field Studies of
Locomotion. American Journal of Physical Anthropology 99: 547–570.43. Isler K, Payne RC, Gunther MM, Thorpe SKS, Savage R, Crompton RH
(2006) Inertial properties of hominoid limb segments. Journal of Anatomy 209:
201–218.44. Alexander RM (2006) Dinosaur biomechanics. Proceedings of the Royal Society
of London B 273: 1849–1855.45. Gunga HC, Suthau T, Bellmann A, Fredrich A, Schwanebeck T, Stoinski S,
Trippel T, Kirsch K, Hellwich O (2007) Body mass estimations for Plateosaurus
engelhardti using laser scanning and 3D reconstruction methods. Naturwis-senschaften 94: 623–630.
46. Stevens KA (2002) DinoMorph: Parametric Modeling of Skeletal Structures.Senckenbergiana Lethaea 82: 23–34.
47. Stevens KA, Larson PL, Wills ED, Anderson A (2008) Rex, sit: ModelingTyrannosaurid postures. In: Carpenter K, Larson PL, eds. Tyrannosaurus rex:
the Tyrant King. Bloomington: Indiana University Press. pp 435.
48. Breithaupt BH, Matthews NA, Noble TA (2004) An Integrated Approach toThree-Dimensional Data Collection at Dinosaur Tracksites in the Rocky
Mountain West. Ichnos 11: 11–26.49. Bates KT, Manning PL, Vila B, Hodgetts D (2008) Three dimensional
modelling and analysis of dinosaur trackways. Palaeontology 51: 999–1010.
50. Bates KT, Rarity F, Manning PL, Hodgetts D, Vila B, Oms O, Galobart A,Gawthorpe RL (2008) High-resolution LiDAR and photogrammetric survey of
the Fumanya dinosaur tracksites (Catalonia): Implications for the conservation
and interpretation of geological heritage sites. Journal of the Geological Society,London 165: 115–127.
51. Bellian JA, Kerans C, Jennette DC (2005) Digital Outcrop Models: Applications
of Terrestrial Scanning LIDAR Technology in stratigraphic modelling. Journalof Sedimentary Research 75: 166–176.
52. Perry SF (2001) Functional morphology of the reptilian and avian respiratorysystems and its implications for theropod dinosaurs. In: Gauthier J, Gall LF, eds.
New Perspectives on the Origin and Early Evolution of Birds: Proceedings of the
International Symposium in Honor of John Ostrom. New Haven: PeabodyMuseum of Natural History. 613 p.
53. O’Connor PM, Claessens LPAM (2005) Basic avian pulmonary design and flow-ventilation in non-avian theropod dinosaurs. Nature 436: 253–256.
54. O’Connor PM (2006) Postcranial pneumaticity: an evaluation of soft-tissueinferences on the postcranial skeleton and the reconstruction of pulmonary
anatomy in archosaurs. Journal of Morphology 267: 1199–1226.
55. Witmer L (1995) The Extant Phylogenetic Bracket and the importance ofreconstructing soft tissues in fossils. In: Thomason JJ, ed. Functional Morphology
in Vertebrate Paleontology. Cambridge: Cambridge University Press. pp 19–33.56. Hutchinson JR (2004) Biomechanical modeling and sensitivity analysis of
bipedal running. II. Extinct taxa. Journal of Morphology 262: 441–461.
57. Bates KT (2007) Sensitivity analysis in evolutionary robotic simulations oftheropod dinosaur locomotion. Journal of Vertebrate Paleontology 27
Supplement: 45.58. Smith NC, Wilson AM, Jespers KJ, Payne RC (2006) Muscle architecture and
functional anatomy of the pelvic limb of the ostrich (Struthio camelus). Journal ofAnatomy 209: 765–779.
59. Henderson DM, Snively E (2004) Tyrannosaurus en pointe: allometry
minimized rotational inertia of large carnivorous dinosaurs. Proceedings of theRoyal Society London (Supplement) 271: 57–60.
60. Motani R (2001) Estimating body mass from silhouettes: testing the assumptionof elliptical body cross-sections. Paleobiology 27: 735–750.
61. Gierlinski G, Lockley M, Milner ARC (2005) Traces of early Jurassic crouching
dinosaurs, in Proceedings of Tracking Dinosaur Origins, Dixie State College, St.George, UT.
62. Romer AS (1956) Osteology of the Reptiles. Chicago: Univeristy of ChicagoPress. 772 p.
63. Perry SF (1983) Reptilian lungs: functional anatomy and evolution. Advances inAnatomy, Embryology, and Cell Biology 79: 1–81.
64. Claessens LPAM (2004) Dinosaur gastralia: Origin, morphology, and function.
Journal of Vertebrate Paleontology 24: 90–106.65. Carrano MT, Hutchinson JR (2002) The pelvic and hind limb musculature of
Tyrannosaurus rex. Journal of Morphology 253: 207–228.66. Snively E, Russell AP (2007) Functional Variation of Neck Muscles and Their
Relation to Feeding Style in Tyrannosauridae and Other Large Theropod
Dinosaurs. The Anatomical Record 290: 934–957.67. Gatesy SM (1990) Caudofemoral musculature and the evolution of Theropod
Locomotion. Paleobiology 16: 170–186.68. Gatesy SM (1995) Functional evolution of the hindlimb and tail from basal
theropods to birds. In: Thomason JJ, ed. Functional morphology in vertebratepaleontology. Cambridge: Cambridge University Press. pp 219–234.
69. Galton PM (1969) The pelvic musculature of the dinosaur Hypsilophodon
(Reptilia: Ornithischia). Postilla, 131 Peabody Museum, Yale University. 64 p.70. Dilkes DW (2000) Appendicular myology of the hadrosaurian dinosaur
Maiasaura peeblesorum from the Late Cretaceous (Campanian) of Montana.Trans R Soc Edinb, Earth Sci 90: 87–125.
71. Brochu CA (2003) Osteology of Tyrannosaurus rex: Insights from a Nearly
Complete Skeleton and High-Resolution Computed Tomographic Analysis ofthe Skull. Memoir of Society of Vertebrate Paleontology 7: 1–138.
Dinosaur Mass Properties
PLoS ONE | www.plosone.org 26 February 2009 | Volume 4 | Issue 2 | e4532