estimating temperature rise due to flashlamp heating … · estimating temperature rise due to...
TRANSCRIPT
Estimating Temperature Rise Due To Flashlamp Heating Using Irreversible TemperatureIndicators
Estimating Temperature Rise Due To Flashlamp Heating Using Irreversible TemperatureIndicators
Abstract
One of the nondestructive thermography inspection techniques uses photographic"'flashlamps. The flashlamps provide a short duration (about 0.005 see) heat pulse. The short burst
of energy results in a momentary rise in the surface temperature of the part. The temperature rise
may be detrimental to the top layer of the part being exposed. Therefore, it is necessary to ensure
the nondestructive nature of the technique. Amount of the temperature rise determines whether
the flashlamp heating would be detrimental to the part. A direct method for the temperature
measurement is to use of an infrared pyrometer that has much shorter response time than the
, flash duration. In this paper, an alternative technique is given using the irreversible temperature
"indicators. This is an indirect technique and it measures the temperature rise on the irreversible
temperature indicators and computes the incident heat flux. Once the heat flux is known, the
temperature rise on the part can be computed. A wedge shaped irreversible temperature indicator
for measuring the heat flux is proposed. A procedure is given to use the wedge indicator.
Keywords: Temperature, flashlamps, thermography, nondestructive evaluation
Introduction
Heat is imparted to the part under inspection in the active thermography nondestructive
inspection techniques. The heat is applied in many different ways. One of the methods uses a
short heat pulse from the flashlamps. This paper provides an indirect technique to estimate the
temperature rise due to the flash. Carslaw and Jaeger provide solutions to a variety of the heat
conduction problems including that of a pulse heating. Parker et al. used the flashlamps to
determine thermal properties such as diffisivity, heat capacity and conductivity. They measure
the maximum front and back surface temperatures and use these measurements to calculate the
thermal properties. Parker et al. derive their equations from Carslaw and Jaeger. Spicer gives
equations for the surface temperature due to various external heat sources.
The flash duration is about 0.005 sec. Because of the short flash duration, relatively little
amount of heat is imparted. The part temperature on the surface rises until end of the flash
duration and then drops quickly due to the heat radiation and convection from the surface and the
heat conduction into the part. The temperature rise on the part surface can be high enough to
damage the top layer of the part. When the part is touched after the flash, it does not feel as hot.
This is because of the rapid decay in the temperature after the flash and also because the hand
acting as a heat sink in absorbing the heat and thereby reducing the temperature actually felt by
the hand. This is also the problem with any contact type sensor. The temperature rise measured
by the sensor will depend upon the mass (or the thermal contact resistance) of the sensor
material, the heat travels through before reaching the active element. Thus, it is impossible to
measure the temperature rise due to flash using a contact type probe, which is suitable for a
steady state (or a slowly changing) temperature measurement. A radiation type sensor is suitable
only if the response time is much shorter than the pulse duration. This paper provides an
Ajay Koshti, Boeing North American, temprisel, 01/19/99
https://ntrs.nasa.gov/search.jsp?R=20000093938 2018-05-31T01:20:28+00:00Z
EstimatingTemperatureRiseDueToFlashlampHeatingUsingIrreversibleTemperatureIndicators
inexpensivetechniquethat uses the irreversible temperatureindicators to estimatethetemperaturerise.
The irreversibletemperatureindicator (labels) are used to indicate the maximumt,emperaturereachedonthepartatthe locationof the label.In thispaper,abrandof labelscalled•TempilabelTemperatureMonitor wasused.Theindicatorcomesin theform of a labelthathasan adhesivebacking.It hasmany¼" diameterdotsarrangedin a row.Eachdot is ratedat auniquetemperature.Eachdot wouldchangethe colorfrom white to blackuponexposedto atemperatureat or abovetheits ratedtemperatureprintednextto it. In a givenlabel,theratedtemperaturesof the dotsareequallyspacedto providean operatingtemperaturerange.Theconstructionof the labelis illustratedin Figure1. Thetop layerhastransparentwindowsthatcoincidewith thedots.Thebottomlayerhasadhesiveonbothsides.Thedotsaremadefrom ablack color paper.The front surfaceof the dots is coatedwith a thin layer of white-colortemperature-sensitivecompound.When the flash heat is incidenton the label, the incident'surfaceof the labelheatsup shortly.Dependinguponthemaximumtemperaturereachedat thetemperaturesensitivecompound,somedotswill changetheircolorto black.Whenadotchangesthe color,thetemperaturesensitivecompoundbumsawayexposingtheblackcolorsubstrate.Thelabelcanbeattachedto thehardware.Whenthelampsareflashedoverthe label,the labelwill indicatethemaximumtemperaturereachedbythelabelandnotby thehardwarebehindit.Thus,the label cannot beuseddirectlyto measurethetemperaturerise.Instead,it is usedtoestimatetheheatflux incidentonthelabel.Theflux is thenusedto calculatethetemperatureriseon thedesiredhardwarereceivingthesameheatflux.
Theor 7
The temperature dots are stuck to the adhesive of the bottom layer. The dot can be
separated from the bottom layer by peeling. The isolated dots can be exposed to the flash heat intwo ways. In the first technique, called the dot front-side temperature measurement technique,
the dot front (white) side faces the flash. In the second technique, called the dot unexposed-side
temperature measurement technique, the black underside of the dot faces the flash and the
temperature rise is measured on the (white) unexposed side. In the both techniques, the goal is toestimate the absorbed heat flux from the indicated temperature on the dots.
Let us first consider a situation where the temperature is estimated or measured on the front
surface of the dot or the part. Since the temperature compound is on the front surface,
temperature indicated by the dots is for the front surface only. The flash duration is typically0.005 sec. Therefore; it is considered a short heat pulse. The change in the surface temperature is
given by the following equation, which is derived from the short pulse equation given by $pieer,
where,
Ajay Koshti, Boeing North American, temprise. 1,01/19/99 2

EstimatingTcmperature Rise Due To Flashlamp Heating Using Irreversible Temperature Indicators
7
n2d _(2) r.=_
0
(3) a =
<4) P=4k
(s) HAt
A_= temperature change on the front surface (°C or °F),
t = time (see or hr) measured from the end of the flash,
H = average heat flux incident on the surface, (¢aI-cm'2see "l or BTU-tY2hrq),
At = flash time (see or hr),
b = a dimensionless constant,
k = thermal conductivity, (cal- cm "l -°C'1 s"1or BTU- ft.1 .OF-I hr-1),
p = density (g- cm "3 or Ibm- fl-3),
c = specific heat (cal- gm "1-"C "l or BTU- Ibm "1_OF-I),
a = thermaldiffusivity,(era -see"lor
,B = thermal effusivity, (cal-cm "2-°C'l-sec'ir2 or BTU-ft -u -°F'Lhr'la),
el = emissivity of the flashed surface (the dot front surface in this case),
d = layer thickness (cm or It)
Q = total hea inel ida tm the part per unit surface area (eal-em "2or BTU-f(2).
The above equation is identical to the equation provided by Spieer, except for the factor b.
Equation (1) provides the maximum temperature at t = 0 for a thermally thick part. For a
thermally thin part, the predicted temperature converges to a steady state value after a time
approximately equal to about two flash durations. The right hand side of the above equation has
two terms in the outer square bracket. The first term in the parenthesis is called the thick part
response and the second term containing the summation sign is called the thin part response.,i
The temperature rise is defined as the maximum change in the temperature of the part. The
above equation is valid for all part thickness. The equation can be broken down into two simple
Ajay Koshfi, Boeing North American, temprisel, 0 I/19/99
Estimating Temperature Risc Due To Flashlamp Hcating Using Irreversible Temperature Indicators
equations depending upon the part thickness. Let us define the threshold thickness dc such that if
d _<d, then the part is thermally thin. Otherwise, it is thermally thick.
A thermally thick part is such that the change in the surface temperature for a thermally
thick part is given by the thick part response term in equation (1).
2besH [.t/_ ,,_'] for d de(6) AT:- _ Lqt+At- >--
The temperature rise on the thick part is given by evaluating equation (6) at t =0,
(7a)
part.
ATI, 2beIHd = figS ford>_,a,
Parker et al. give the following equation for the temperature rise on the thermally thick
8b,¢lH_l--_
(7b) ATI_,_ =. _ for d > d c
They introduce a correction factor bl to correct for the difference between the assumed
shape of the heat pulse verses its actual shape. The two formulas are very close to each other if
the correction factors are neglected.
A thermally thin part is such that the change in the surface temperature for a thermally thin
part is given by the thin part response term in equation (1). The first term of equation (1) is
neglected and the second (summation) term of the equation simplifies the equation to,
2b¢;H [1.477At_f_(8a) AT 1 (t) - ,flqt-_ L d | for d < d,
This equation simplifies to,
(8b) A T*(t) = 1.6666bt/HAt for d < d,dcp
There is no time dependent term in the above equation. Equation (8) assumes that the part
is so thin that it heats up uniformly throughout its thickness. Assuming no losses, this
temperature rise shall be given by equating the absorbed heat to increase in the heat content of
the part as,
(9a) _; HAt = dcpAT_ for d < d,
From the above equation the temperature rise is given by,
Ajay Koshti, Boeing North American, temprise I, 01119/99 4

EstimatingTemperatureRiseDueToFlashlampHeatingUsingIrreversibleTemperatureIndicators
(9b) ATI_, = _¢lHdt for d < d cdcp
Since, the above equation is independent of time; it shall also provide the steady state
temperature rise. Thus,
(10) AT,,,,,,o _j tIAt= - for all ddcp
Equations (8) and (9) must provide same estimate for the temperature rise. Therefore,
equating equations (8) and (9), we get the value of the constant b to be 0.6. The constant bl then
can be evaluated to be 0.636. The threshold thickness can be determined by equating equations(7) and (9).
(11) a, =_2bcp
I_can be shown that,
-dAT for d > d c02) ar_ - d, _'
and
03) AT_ = a T,,,,_ for a < a_
If we measure the temperature rise on the dots then the heat flux incident on the dots is
given by,
and
(15) H = ATf_,=dcp for d _<d,6/At
In order to chart the temperature response, the temperature on the front surface is
normalized by the steady state temperature rise _d--_'=_J" This quantity is called the
temperature ratio. Similarly, the thickness is normalized by the threshold thickness . This
Ajay Koshti, Boeing North American, temprisel, 01/19/99
Estimating Tcmpcrature Rise Due To Flashlamp Heating Using Irreversible Temperature Indicators
quantity is called the thickness ratio. Figures 2, 3, 4 and 5 plot the temperature ratio response for
thickness ratios of 1.0, 0.5, 0.1 and 5.0. These charts provide comparison of the temperature
response by equations (1), (12) and (13). Equation (1) is termed 'Thick & Thin', equation (12) is'termed 'Thick' and equation (13) is termed 'Thin' in these charts. The computation uses thermal
_loperties of the temperature indicator label• The absorbed heat flux is 18.15 cal-cm'2sec "l in thecharts.
When using the dot unexposed-side temperature measurement, the temperature change on
the unexposed-side of the label is given by Parker et al. as follows for the long times,
(16) /ITb('t,j - =b/-/zStII.-i-2_"_ (--l_e I_l
"where, _rb = emissivity of the dot backside (black color side) of the dot. The maximum
temperature reached by the unexposed surface is given by the first term in the above equation.
Thus,
(17) AT_,_,. = 6bHzltdcp
If the temperature is measured on the unexposed side of the dot, then the incident heat flux
is given by,
(I8) H = AT_'_dcpe_At
Estimate Heat Flux
Dot Fr0nt-side Temperature Measurement
Select a Tempilabel with a suitable temperature range. Peel off the top transparent layer
that covers the temperature indicating dots. If the dot thickness is more than the threshold
thickness, then there is no need to peel the dot off its backing. Otherwise, peel the dots off the
backing and stick them on an edge of a double back adhesive tape with less than a third area ofeach dot sticking to the tape. Measure the dot thickness'. Locate the dots at the center of the hood
opening. Set the equipment to the correct setup for the technique. The label temperature will bethe ambient temperature at this time. Flash the lamps. Read the highest temperature indicated bythe dots. If all dots have been blackened, then use a label with a higher temperature limit and
expose the dots to the flash. If none of the dots have been blackened, then use a label with alower temperature limit and expose the dots to the flash. Ideally, the selected label should
provide blackening of half of its dots when exposed to the flash. This may take a bit of trial anderror. Subtract the ambient temperature from the highest indicated temperature to obtain the
temperature rise. Compute the threshold thickness using equation I1. If the dot is thermally
thick, use equation (14); otherwise use equation (15) and compute the incident heat flux.
Ajay Koshti, Boeing'lqorth American, tcmprise I, 01/! 9/99
EstimatingTemperatureRiseDueToFlashlampHeatingUsingIrreversibleTemperatureIndicators
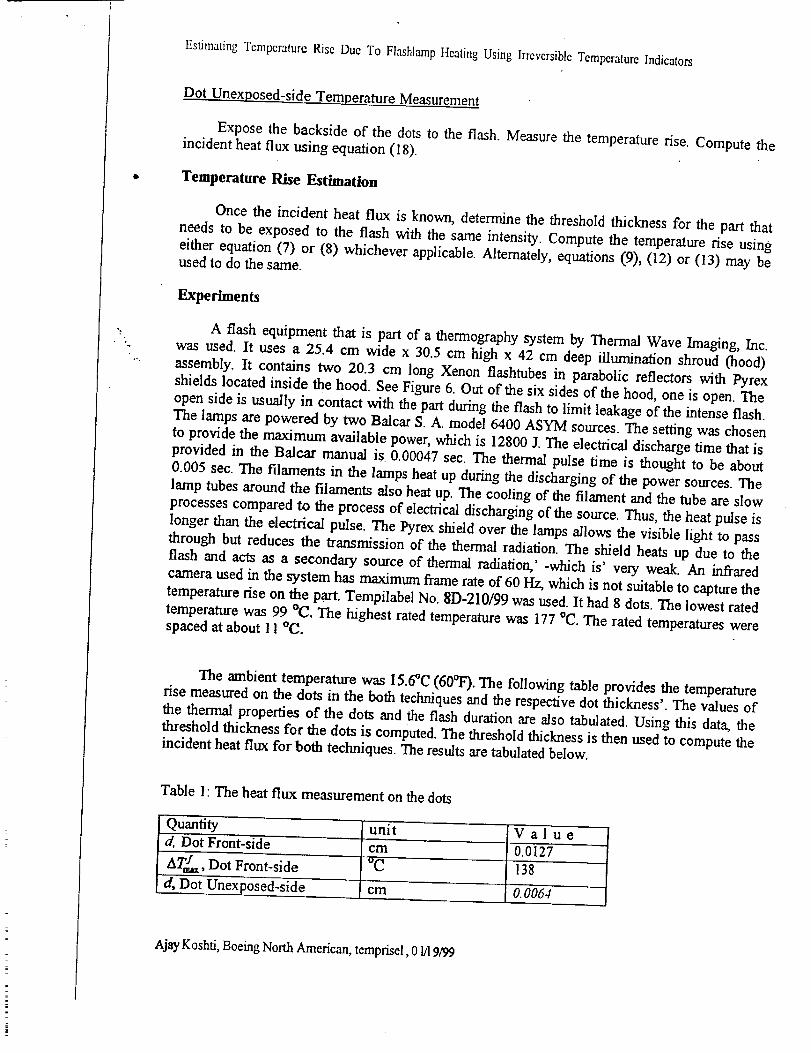
Dot Unexposed-side Temperature Measurement
Expose the backside of the dots to the flash. Measure the temperature rise. Compute theincident heat flux using equation (18).
Temperature Rise Estimation
Once the incident heat flux is known, determine the threshold thickness for the part that
needs to be exposed to the flash with the same intensity. Compute the temperature rise using
either equation (7) or (8) whichever applicable. Alternately, equations (9), (12) or (13) may beused to do the same.
Experiments
A flash equipment that is part of a thermography system by Thermal Wave Imaging, Inc.
was used. It uses a 25.4 cm wide x 30.5 cm high x 42 cm deep illumination shroud (hood)
assembly. It contains two 20.3 cm long Xenon flashtubes in parabolic reflectors with Pyrex
shields located inside the hood. See Figure 6. Out of the six sides of the hood, one is open. The
open side is usually in contact with the part during the flash to limit leakage of the intense flash.
The lamps are powered by two Balcar S. A. model 6400 ASYM sources. The setting was chosen
to provide the maximum available power, which is 12800 J. The electrical discharge time that is
provided in the Balcar manual is 0.00047 sec. The thermal pulse time is thought to be about
0.005 sec. The filaments in the lamps heat up during the discharging of the power sources. The
lamp tubes around the filaments also heat up. The cooling of the filament and the tube are slow
processes compared to the process of electrical discharging of the source. Thus, the heat pulse is
longer than the electrical pulse. The Pyrex shield over the lamps allows the visible light to pass
through but reduces the transmission of the thermal radiation. The shield heats up due to the
flash and acts as a secondary source of thermal radiation,' -which is' very weak. An infrared
camera used in the system has maximum frame rate of 60 Hz, which is not suitable to capture the
temperature rise on the part. Tempilabel No. 8I)-210/99 was used. It had 8 dots. The lowest rated
temperature was 99 °C. The highest rated temperature was 177 °C, The rated temperatures were
spaced at about 11 °C.
The ambient temperature was 15.6°C (60_F). The following table provides the temperature
rise measured on the dots in the both techniques and the respective dot thickness'. The values of
the thermal properties of the dots and the flash duration are also tabulated. Using this data, the
threshold thickness for the dots is computed. The threshold thickness is then used to compute the
incident heat flux for both techniques. The results are tabulated below.
Table 1: The heat flux measurement on the dots
Quantity unitd, Dot Front-side "
ATI,_x, Dot Front-side
d, Do'i Unexposed-side
Value
0.0127cm
°C 138
cm O.0064
Ajay Koshti, Boeing North American, tcmpfisel, 0 I/19/99
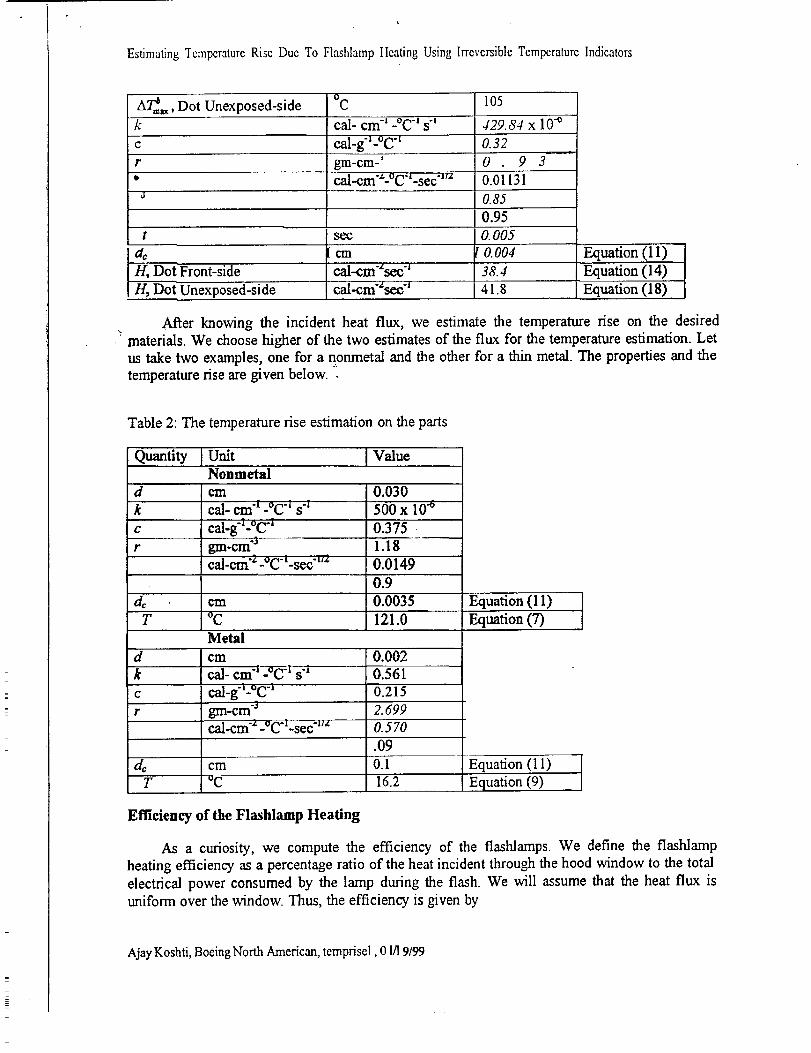
EstimatingTemperatureRiseDueToFlashlampHeatingUsingIrreversibleTemperatureIndicators
A_, Dot Unexposed-sidek
°C 105
429. 84 x 10-°
0.32C
r gm-cm-' 0 . 9 3* cal-cm'_-°Cq-se_rz 0.01131
J 0.85
0.95
see O.005
¢m
cal.cm" zsec "_
cal-cm'%ec"_
a_
H, Dot Front-side
H, Dot Unexposed-side
O.004
38.4
41.8
Equation (11)
Equation (14)
Equation (18)
After knowing the incident heat flux, we estimate the temperature rise on the desired
materials. We choose higher of the two estimates of the flux for the temperature estimation. Let
us take two examples, one for a nonmetal and the other for a thin metal. The properties and the
temperature rise are given below.
Table 2: The temperature rise estimation on the parts
Quantity Unit ValueNonmetal
d
k
C
r
d_T
'd
kC
r
d_T
cna
cal- em "t -°Cq s "I
cal.g -1.°Ca
gin-era"3cal_ctri "2 .oC-i=sec-b2
°C
Metal
cm
ca]- cm'i'-°C "1s "I
cal_g-Loc -r
gm.cm -3cal.cm -__oc-l.sec --z
cm
"C
0.030
500 x 10 "_
0.375 -
1.18
0.0149
0.9
0.0035121.0
0.002
0.561
0.215
2. 699
0.570
.090.1
16.2
Equafion(ll)
Equation(7)
Equation (11) ]
_uation (9) ]
Efficiency of the Flashlamp Heating
As a curiosity, we compute the efficiency of the flashlamps. We define the flashlamp
heating efficiency as a percentage ratio of the heat incident through the hood window to the total
electrical power consumed by the lamp during the flash. We will assume that the heat flux is
uniform over the window. Thus, the efficiency is given by
Ajay Koshti, Boeing North American, temprisel, 01/! 9/99
Estimating Temperature Rise Due To Flashlamp Hcating Using Irreversible Temperature Indicators
(19) n =IOOHA.At
IV
where Aw = the area of the hood opening (window) in cm 2.
The hood window is 25.4 cm X 30.48 cm. Aw = 774.2 cm 2, W = 12800 J, t = 0.005 sec, H= 4l .8 J--cm'2sec "x.Note, 1 J = 0.2388 cal,
Substituting we get an efficiency of 5.3%. Thus, this is a very inefficient way of applying
the flash heat. This seems too low and make one wonder where the remaining 94.7% of the
energy is dissipated. When the lamps are flashed the Pyrex shield and the lamp wall absorb most
of the heat flux and provide a slow cooling. Moreover the emission from Pyrex is based on the
surface temperature which not high enough to provide significant secondary radiation flux. ThePyrex shield and the tube thickness serve as a filter for the thermal radiation and let the visible
radiation through. The temperature of the Pyrex shield surface is significantly higher on the lamp
side but low on the part side. In all, secondary emission from Pyrex glass is very small. The
Pyrex shield transmits the light wavelengths with high efficiency. Typically, 94% (emissivity =
0.94) of the incident thermal radiation on the Pyrex is absorbed. The remaining 6% is transmittedand reflected.
Discussion
Accuracy of this method is dependent on the accuracy of the values of the parameters used
in the above calculations in addition to the accuracy of the Tempilabel temperature measurement.
In the dot front-side technique, the temperature starts decaying as soon it reaches its peak The
decay is due to the conduction, radiation and the convection losses. This may or may not provide
enough time to bum off the entire temperature sensitive compound that is rated at the maximum
temperature reached by the surface. This will result in an underestimation of the temperature rise.
In the dot unexposed-side technique, the maximum temperature is the steady state temperature
and the decay in the temperature is not due to the conduction but due to the radiation and
convection. Thus, the decay in the temperature is relatively slow and the measurement is morereliable.
The front-side technique does not use the dot thickness measurement, if the thickness is
more than the threshold thickness. In the unexposed-side technique, the measurement of dotthickness is necessary. The heat flux estimated is proportional to the dot thickness. Thus, it is
important to measure the thickness very accurately.
In, the front-side technique, the white color of the surface changes to black. If we assume
that the significant component of radiation is in the visible range, then change of color from
white to black implies change of the emissivity, which will introduce errors in the heat flux
calculations. Therefore, the dot unexposed-side temperature measurement is more reliable.
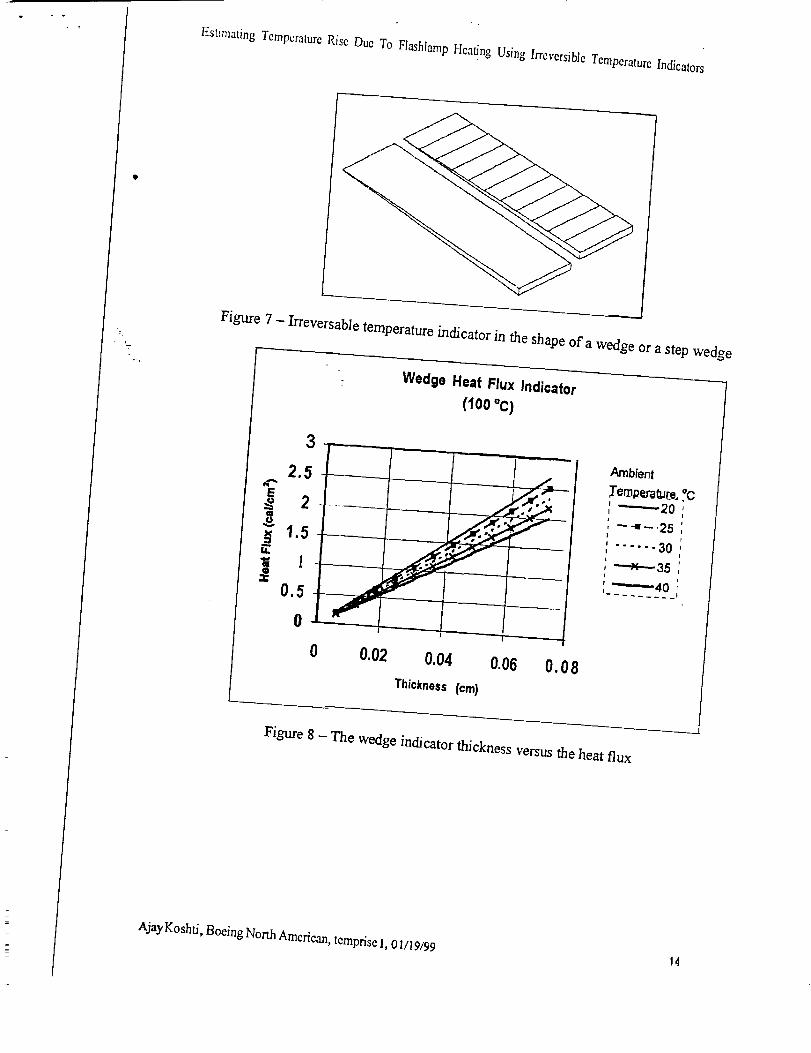
The Wedge Indicator
In the unexposed-side technique, instead of exposing dots rated at different temperatures, a
single irreversible indicator in the shape of a wedge or a step wedge (Figure 7) rated at a single
A jay Koshti, Boeing North American, temprisel, 01I!9/99 9

Estimating Temperature Rise Due To Flashlamp }/eating Using Irreversiblc Tempcrature Indicators
temperature can be used. The maximum thickness of the wedge at which the temperaturecompound is burned off shall be noted• This is called the maximum burned thickness. Equation
(18) is rewritten to provide an expression for computing the heat flux as below.
(20)keb Y
The quantifies in the first parenthesis are constant. The rated temperature for a given wedge
indicator is also a constant. The only variables are the ambient temperature and the maximum
burned thickness d. A plot of equation (20) with 100 °C rated temperature is given for five
different ambient temperatures in Figure 8. The plot uses the values for the thermal properties of
the dot indicators previously used. Once the bumed thickness and the ambient temperature are
known, the heat flux can be either read from Figure 8 or calculated from equation (20).
Conclusions
The paper provides an inexpensive method to measure the heat flux from the flash lamps. It
also provides formulas to estimate temperature rise on the hardware receiving the flashlamp heat.This estimation can be used to determine ffhether the flash would have a detrimental effect on
the exposed hardware.
REFERENCES
1. Carslaw, H. S, and J. C Yeager, Conduction of Heat in Solids, 2 nd. Ed. Oxford Univ. Press
(1959).
2. Parker W. J., 1L J. Jenkins, C. P. Butler, and G. L. Abbott, "Flash Method of DeterminingThermal Diffusivity, Heat Capacity, and Thermal Conductivity," Joumal of Applied Physics,
Vol. 32 #9, September 196I, pp. 1679-1684.
3. Spicer J. W. M., Active Thermography for Manufacturing and Process Control, Short
Course Notes, SPIE, Thermosense 1995, pp 4-7.
Ajay Koshti, Boeing North American, temprisel, 0 I/I 9/99 10

, -'
Estimating Ten_rature Rise Due To Flashlamp Heating Using Irreversible Temperature Indicators
-_ 99 110 121 132 143 154 166 177O O 0 0 0 0 0 0
DEGREEC
DOTS
TOP LAYER
BO'rroM LAYER -J
Figure 1 - The irreversible temperature indicator
1.5.
Ti_ick %,_"
Thln jeee.,=,p.....-
IRatio I ', • .........
L-- illt,g ISled9 State Terr_ratureRise,,de_i'ee_ _
0,5- _.if
_'_"_""_'_'.v .t,+ ÷ .1.,,,.÷._ + + ++ + + "I'--H-,++_.H. ÷ ,,4 ÷+ "+"l--t--N.
0.0-'_0
I I I I I
5 1 0ili --I_ I I i I I f
15 20 25 3(] 35 40 45 50
Figure 2 - Surface temperature response for thickness ratio of I
Ajay Koshti, Boeing North American, temprise 1, 01/19199 I 1

EstimatingTemperatureRiseDueToFlashlampHeatingUsingIrreversibleTemperatureIndicators
1.5-
1.0
ntJIperatung
O
0.5[-
-k 4kTihick ,
Thin t°_ G
•" :_ ISte,,_ StateTemperatureRise,de_'ce CI
ITNckne. Ral_c_
\%
O.Cl-_r i t t i i i i i ,0 5 10 ""15 20 25 30 35 40 45
1.5"-
1.0-
0.5-
ITirne{._
Figure 3 - Surf_e temperature response for thickness ratio of 0.5
0.0
Thick t=Thin ¢x_¢_.,,k .,IkTihick - 4
Thin _e_e,
[CrfticalThickness,cn;_.0_
_ica_ StateTemperatureR_e,d_e C
['1"hickmss RatJc_ _]
"_÷++4..4-. _ • '. :-_.+.4-4-44-÷÷.+4,_ m :: _' t-4-÷÷÷.f-_,, ; ;_-_-_-÷÷÷ _.÷._4Jf--4-+I I I I I I I I I
O 5 10 15 20 25 30 35 40 45 50
ITimlms_el
Figure 4 - Surface temperature response for thickness ratio of 0.1
Ajay Koshti, Boeing North American, tcmprisel, 01/19/9912

I
i!
"7
Estimating Temperature Rise Due To Flashlamp Heating Using Irreversible Temperature Indicators
5.5-- ....... Thick_Thi_
5,0- "l'_k ,_.r "k
4.5-1 Thin i_ee
4.04
} I I I I I I I I
5 10 15 20 25 30 35 40 45 .
ITim_(rn_ll
Figure 5 - Surface temperature response for thickness ratio of 50
_-3
-CAMERA k__REFLECTOR
PYREX SHIELD
- HOOD
/- PART
Figure 6 - Cross Sectional Schematic of the experimental set-up
Ajay Koshti, Boeing North American, temprisel, 01/19/'99 13
• +o"7
Estimating TcmpcratureRise Due To Flashlamp Heating Using Irreversible Tcmpcraturc Indicators
Figure 7 - Irreversable temperature indicator in the shape of a wedge or a step wedge
Wedge Heat Flux Indicator
(100*C)
3
2.5
2 ....
1.5 ,
, ,,
1
0,5 "_f
.,,
/t.
0 0.02 0.04 0,06 O.0 8
Thickness (cm}
Ambient
ram_e_te.,*c_20',
- -=- 25 ;1
...... 3O ',_35 ;
I
40 ,
Figure 8 - The wedge indicator thickness versus the heat flux
Ajay Koshti, Boeing North American, temprise 1, 01/I 9/99 14