estimating the cumulative effects of development on ...millerlab.nres.illinois.edu/pdfs/estimating...
TRANSCRIPT

LANDSCAPE AND
URBAN PLANNING
ELSEVIER Landscape and Urban Planning 39 (1997) 25-36
Estimating the cumulative effects of development on wildlife habitat
David M. Theobald a, * , James R. Miller b, N. Thompson Hobbs a,c ’ Natural Resource Ecology Laboratory, Colorado State Unkersity, Fort Collins, CO 80523, USA
b Graduate Degree Program in Ecology/ Department of Biology, Colorado State University, Fort Collins, CO 80523, USA
’ Habitat Research Section, Colorado Division of Wildlife, 317 W Prospect Rd., Fort Collins, CO 80526, USA
Received 18 November 1996; accepted 12 June 1997
Abstract
The cumulative effects problem in natural resource management and land use planning stems from the difficulty of demonstrating that while each single land use change results in a negligible impact, the accumulation of these individual changes over time and within a landscape or region may constitute a major impact. This paper details a general approach to estimate the cumulative effects of land use change on wildlife habitat using Summit County, CO, USA as a case study. Our approach is based on a functional relationship between effect on habitat and distance from development. Within this building-effect distance, habitat is assumed to be degraded, producing a disturbance zone. We sum the total area within the disturbance zone and track how it changes over time and in response to different land use planning actions. This method is sensitive to both housing density and spatial pattern, so that the relative effects of clustered development can be evaluated. Two factors are important in understanding how development potentially degrades habitat: alteration of habitat near buildings and roads and landscape fragmentation. Our results show clustered development reduces the negative impacts on wildlife habitat. For large building-effect distances, spatial pattern was found to be a stronger indicator of disturbance than density. Efforts to decrease habitat disturbance by lowering development density should include the regulation of subdivision pattern in addition to decreasing density. 0 1997 Elsevier Science B.V.
Keywords; Urbanization; Cumulative effects; Wildlife habitat
1. Introduction use policy in an attempt to ensure meeting general
Land use planning decisions are generally made, especially at the local or county governmental level, within a framework which recognizes two ap- proaches to planning: comprehensive or master plan- ning (long-term); and development review (short- term). Comprehensive plans provide a consistent land
* Corresponding author.
public goals such as ‘maintenance of quality of life.’ These plans then guide day-to-day development re- view and decision making. Making good decisions singly, however, does not necessarily guarantee that overall land use goals will be met. This is commonly known as the cumulative effects problem, or the ‘tyranny of small decisions made singly’ (Kahn, 19661, which results from the difficulty of demon- strating that while each single land use change re-
0169.2046/97/$17.00 0 1997 Elsevier Science B.V. All rights reserved.
PII SO169-2046(97)00041-S

26 D.M. Theobald et al. / Lmdscupe and Urban Planning 39 (1997) 25-36
sults in a negligible impact, the accumulation of these individual changes over time and within a landscape or region may constitute a major impact. While a formal cumulative impact analysis requires evaluating indirect and synergistic effects (Stakhiv, 19881, simply accumulating many individual deci- sions over space and time can provide substantial insight into the likely cumulative results of these decisions.
Understanding and evaluating the cumulative ef- fects of land use decisions on wildlife habitat is thus an important and challenging problem. This paper details a general approach to estimating the cumula- tive effects of land use change on wildlife habitat. Our approach is rooted in the SCoP (A System for Conservation Planning) project (Hobbs et al., 19971, which provides planning tools to aid county officials, citizens, and developers in making informed deci- sions regarding the potential effects of residential development on wildlife habitat. SCoP was devel- oped in response to the rapid population growth rates that are causing substantial agricultural to residential land use changes in rural Rocky Mountain counties, where population increased three times faster than the rest of the United States from 1990 to 1995 (an annual rate slightly greater than 3%) (Theobald and Riebsame, 1995). Even though the proportion of private land in these counties may be as little as 5%, private lands contain a disproportionate amount of high quality wildlife habitat (Knight, 1994). The resulting residential development causes extensive changes in land use and cover that constitute the foremost threat to intact, high quality wildlife habi- tat. The loss, degradation, and fragmentation of wildlife habitat resulting from rapid residential de- velopment and associated infrastructure (roads, utili- ties, etc.) at the urban/rural, and even rural/wild- land, interface is a prime example of the cumulative effects problem.
In this paper, we first identify factors associated with residential development that contribute to habi- tat degradation. Next, we examine common develop- ment patterns and compare clustered and dispersed subdivisions to illustrate the importance of pattern in determining impacts. We then introduce the concept of a disturbance zone, which is a function of both development density and spatial pattern, and develop a functional relationship between density, with pat-
tern variations, and area of habitat disturbed. This hypothetical model is further evaluated and modified in light of empirical data on building locations and patterns. Finally, we suggest some implications of the cumulative impacts of development and the ag- gregation of development patterns at landscape and regional scales.
2. Effects of development on wildlife and wildlife habitat
Development affects wildlife habitat directly and wildlife indirectly. Native vegetation is often re- moved during construction of buildings and roads and as a result of landscaping activities. The struc- ture of native vegetation is also frequently altered. For example, trees within 50 meters of a house are thinned to create a ‘defensible space’ against wildfire (Colorado State Forest Service, no date). Alteration of native vegetation may determine what wildlife species are found in an area. For example, the diver- sity of native bird species in urban areas has been found to be largely dependent on the amount of native vegetation present (e.g., Mills et al., 1989; Sears and Anderson, 199 1). The amount of fencing generally increases with development, which tends to inhibit species movement. While fences that enclose pets are beneficial, other fences, especially those around the property perimeter and of chain-link con- struction, inhibit the movement of many mammal species.
Development may affect wildlife indirectly through human activities. Seemingly benign recre- ational activities such as hiking may cause some species to alter their activity and feeding patterns, which may have nontrivial consequences. Animals typically take flight, or ‘flush,’ in response to a human presence, incurring energetic costs associated with heightened metabolic rates (stress) and evasive movement (Gabrielson and Smith, 1995). For many species of birds, flushing may result in nest evacua- tion or abandonment (White and Thurow, 1985; Hockin et al., 1992) or nest predation. Some wildlife may exhibit a learned ‘avoidance behavior’ (Whit- comb et al., 1981) and maintain some distance from development. Flushing distances can range from 15 to 300 m for elk (Schultz and Bailer, 1978; Cassirer

D.M. Theobald et al. /Landscape and Urban Planning 39 fI997125-36 2-l
et al., 1992) 100 to 300 m for mule deer (Ward et al., 1980; Freddy et al., 1986), 15 to 45 m for some waterbirds (Rodgers and Smith, 1995), and 40 to 300 m for grassland raptor species (Holmes et al., 1993). The distance from disturbance at which an animal flees depends on the nature of the disturbance, indi- vidual animal, habitat type, and season. Flushing distances can be used to establish ‘buffer’ or set-back distances, a minimum distance at which a species is unlikely to take flight. One method to calculate the set-back distances for colonial waterbirds uses the mean flushing distance, plus one-half the mean, plus 40 m (Rodgers and Smith, 1995).
Small to mid-sized predators (e.g., cats, dogs) often exist at high densities in human-dominated environments because of the variety of structures that serve as shelter and the abundance of feeding opportunities (Hoffman and Gottschang, i 977; Haspel and Calhoon, 1989). These ‘subsidized preda- tors’ feed on small mammals, amphibians, reptiles, and songbirds, and can have a substantial impact on
native species (e.g., Churcher and Lawton, 1987; Coleman and Temple, 1993). These animals may continue to take wildlife long after the prey base can no longer sustain a predator that relies on wildlife alone for food (Soul6 et al., 1988).
Development does not affect all species equally. Not surprisingly, species with a long history of coexistence with humans (e.g., house sparrow, Passer domesticus, and house mouse, Mus muscu- lus) and those able to take advantage of unique feeding or nesting opportunities (e.g., raccoon, Pro- cyan lotor, and house finch, Carpodacus mexicanus) tend to thrive in developed areas. Other species tend to be displaced by development, either because their habitat requirements are not met (Beissinger and Osborne, 1982) or as a result of increased human presence and attendant habitat modification (Engels and Sexton, 1994).
Although species that thrive in human-dominated environments have been termed ‘generalists,’ the situation is not so simple. The gray fox (Urcoyon
cinereoargenteus), usually considered to be oppor- tunistic-generalist species, avoid using suitable habi- tat in areas with housing densities as low as 1 unit per 13 ha (1 per 33 acres) (Harrison, 1997). Further- more, even though a species may occupy a particular developed area frequently, it does not necessarily
follow that the species thrives there. For example, elk (Ceruus elaphus) are commonly found in rural residential areas adjacent to wildlife refuges (e.g., Estes Park, CO) because of prohibition of hunting and the high-nutrient forage available. It is not clear, however, that these apparent gains counter increased incidence of disease and increased stress levels. Until proven otherwise, we presume that habitat similar to that in which a species evolved best supports the overall health and vigor of a species.
The impacts of development on wildlife are poorly documented, and much of the research that has been done focuses on game species. Thus, we are forced to extrapolate from relatively short-term (2-3 yrs) studies on game species in nondeveloped areas. Our strategy for developing a reasonable approach that captures the main effects associated with develop- ment (and associated human activities) is based on well established ecological principles, has few data requirements, can be parameterized for individual species, and can be refined in light of future re- search.
3. Development density and pattern
Our approach is based on a functional relationship between the effect of development on habitat and distance from the source of disturbance. For exam- ple, Vogel (1989) found that deer avoided developed areas, and this avoidance zone extended as far as 1 km. Based on the premise that the magnitude of human-related effects decreases with distance from the source of disturbance, we assume that within some distance of a housing unit (e.g., 50-500 m) the habitat value is degraded. This building effect is the distance within which wildlife habitat is adversely affected. It is similar to the edge effect concept, where changes in the environmental conditions at the patch edge reduce the effective area for patch-inter- ior species (Paton, 1994). This results in a distur-
bance zone with a radius equal to the assumed building-effect distance. A disturbance zone is also associated with roads as they also cause fragmenta- tion and degrade habitat (e.g., Lyon, 1983). The disturbance zones associated with housing and roads are correlated, i.e., clustered subdivisions have

28 D.M. Theobald et al. /Landscape and Urban Planning 39 (1997) 25-36
shorter roads and overall lower disturbance zone area, and low-density dispersed subdivisions have much longer road length, but also maximum overall disturbance zone area. This road effect is, however, more difficult to measure than the building effect because each individual driveway and access road would need to be mapped and measured. Therefore, using the building effect alone is a conservative measure.
Clearly, the impacts on habitat near a house or road (e.g., at a distance of 10 m) are greater than those further away. Rather than specifying a particu- lar building-effect distance, we examine the relation- ship of development patterns and disturbance zones using a range of building effect values. Furthermore, we use this approach to produce a relative measure
by comparing one development pattern to another assuming the same building-effect distance.
Two components of development are critical in understanding the potential impacts on habitat: den- sity and pattern. The idea that a clustered develop- ment pattern minimizes impacts is hardly new, for instance, clustered development was heralded in the 1960s as a way to reduce sprawl and to minimize loss of productive agricultural land (Whyte, 1964). However, it is still very important to illustrate the ‘folly of large lots’ (Arendt, 1994), as people may not understand how density and pattern interact. For instance, a building-effect distance of 100 m creates a disturbance zone that is only 22% of a 14.1 ha (35 acres) parcel, but at 200 m, the disturbance zone occupies 88% of the parcel!
a. Dispersed - regular b. Dispersed -irregular
-e. CiGtered - 4 f. Clustered - 16
Fig. 1. Typical spatial patterns of residential subdivisions. Each subdivision is 258 ha (640 acres) and includes 16 parcels unless noted otherwise. The white mark is the building location, surrounded by 100 m (dark shade) to 500 m (light shade) zones of disturbance.
D.M. Theobald et al. /Landscape and Urban Planning 39 (1997) 25-36 29
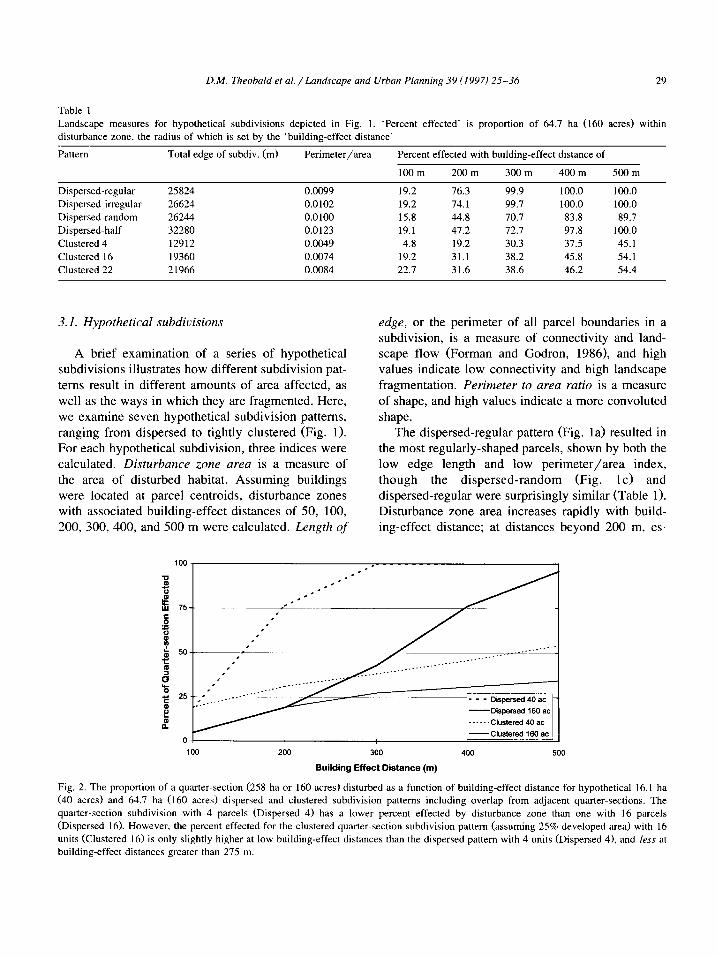
Table 1
Landscape measures for hypothetical subdivisions depicted in Fig. 1. ‘Percent effected’ is proportion of 64.7 ha (160 acres) within disturbance zone, the radius of which is set by the ‘building-effect distance’
Pattern Total edge of subdiv. (m) Perimeter/area Percent effected with building-effect distance of
1OOm 200m 300 m 400m 500m
Dispersed-regular 25824 0.0099 19.2 16.3 99.9 100.0 100.0
Dispersed-irregular 26624 0.0102 19.2 74.1 99.7 100.0 100.0
Dispersed-random 26244 0.0100 15.8 44.8 70.7 83.8 89.7
Dispersed-half 32280 0.0123 19.1 41.2 72.7 97.8 100.0
Clustered 4 12912 0.0049 4.8 19.2 30.3 37.5 45.1
Clustered 16 19360 0.0074 19.2 31.1 38.2 45.8 54.1
Clustered 22 21966 0.0084 22.7 31.6 38.6 46.2 54.4
3.1. Hypothetical subdivisions
A brief examination of a series of hypothetical subdivisions illustrates how different subdivision pat- terns result in different amounts of area affected, as well as the ways in which they are fragmented. Here, we examine seven hypothetical subdivision patterns, ranging from dispersed to tightly clustered (Fig. 1). For each hypothetical subdivision, three indices were calculated. Disturbance zone area is a measure of the area of disturbed habitat. Assuming buildings were located at parcel centroids, disturbance zones with associated building-effect distances of 50, 100, 200, 300, 400, and 500 m were calculated. Length of
edge, or the perimeter of all parcel boundaries in a subdivision, is a measure of connectivity and land- scape flow (Forman and Godron, 1986), and high values indicate low connectivity and high landscape fragmentation. Perimeter to area ratio is a measure of shape, and high values indicate a more convoluted shape.
The dispersed-regular pattern (Fig. la> resulted in the most regularly-shaped parcels, shown by both the low edge length and low perimeter/area index, though the dispersed-random (Fig. lc) and dispersed-regular were surprisingly similar (Table 1). Disturbance zone area increases rapidly with build- ing-effect distance; at distances beyond 200 m, es-
7 _ _ _ Diaperred 40 ac -
i?
8
-Dispaned 160 ac
n. -Clustered 40 ac
-Clustered 160 ac 0,
300
Building Effect Distance (m)
400 500
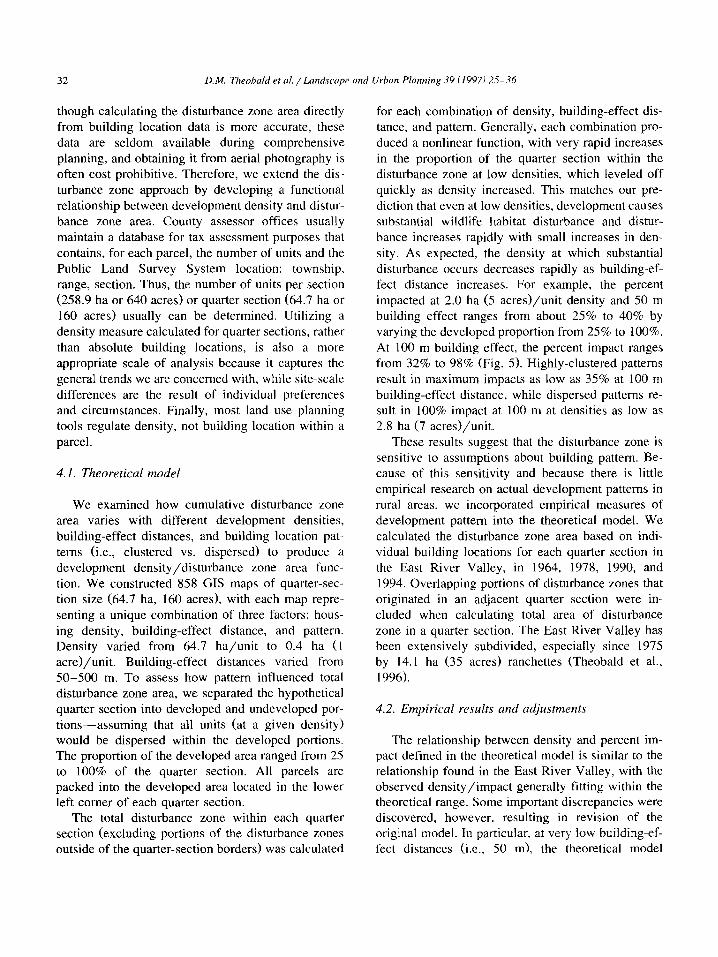
Fig. 2. The proportion of a quarter-section (258 ha or 160 acres) disturbed as a function of building-effect distance for hypothetical 16.1 ha (40 acres) and 64.7 ha (160 acres) dispersed and clustered subdivision patterns including overlap from adjacent quarter-sections. The
quarter-section subdivision with 4 parcels (Dispersed 4) has a lower percent effected by disturbance zone than one with 16 parcels (Dispersed 16). However, the percent effected for the clustered quarter-section subdivision pattern (assuming 25% developed area) with 16
units (Clustered 16) is only slightly higher at low building-effect distances than the dispersed pattern with 4 units (Dispersed 4). and less at building-effect distances greater than 275 m.

30 D.M. Theobald et al. /Landscape and Urban Planning 39 (1997) 25-36
a. Parcels and building disturbance z&es
ment the landscape. The overall fragmentation of the dispersed-regular and dispersed-irregular patterns is small at low building-effect distances, but increases rapidly with increased building-effect distance. The dispersed-random is slightly fragmented at low and medium distances while the dispersed-half pattern is highly fragmented. An unexpected result is that the dispersed-random pattern provides both more com- pact-shaped parcels and lower overall disturbance zone than the dispersed-regular pattern.
a. Parcels and building disturbance zones
_ b. Road disturbance zones
- 0.5 km
Fig. 3. Disturbance zones produced by the building and road
effects on the dispersed subdivision pattern from the East River
Valley, Gunnison County, CO, USA. Zones of disturbance at 100
m (dark), 300 m (medium), and 500 m (light) and parcel bound-
aries are shown.
sentially no effective habitat exists for the dispersed-regular, dispersed-irregular (Fig. 1 b), and dispersed-half-linear (Fig. Id). The dispersed-ran- dom has a compact shape and low edge, and at least some of the habitat remains outside the disturbance zones. The clustered patterns have a much lower edge length and a much more compact shape that is independent of building density, and have substan- tially less disturbance zone area.
, b. Road disturbance zones
In addition to disturbance zone area, the spatial configuration of building sites is important in deter- mining how the disturbance zones coalesce to frag- aries are shown.
Fig. 4. Disturbance zones produced by the building and road effects on the clustered subdivision pattern from the East River
Valley, Gunnison County, CO, USA. Zones of disturbance at 100
m (dark), 300 m (medium), and 500 m (light) and parcel bound-

D.M. Theobnld et al. / L.md.scape and Urban Planning 39 (1997125-36 31
Table 2
Measures for the dispersed and clustered subdivisions located in the East River Valley, CO, USA, and depicted in Fig. 3 and Fig. 4. ‘Total
area’ is the total subdivision area, while ‘parcel area’ is the total area in building parcels, less open space. ‘Total edge length’ is the total
length of all subdivided parcels within the subdivisions. ‘Perimeter/area’ is a measure of parcel shape complexity
Subdivision Number Total area Total edge length Parcel area Parcel edge Perimeter House density
type of parcels (ha) (km) (ha) (km) /area (ha/unit)
Dispersed 19 310 60.0 290 42.36 0.0145 16.3
Clustered 15 1027 60.9 227 26.36 0.0115 68.4
Since building sites are usually located near a parcel boundary to minimize the access distance rather than being in center of a parcel as assumed, these results likely underestimate landscape frag- mentation and overestimate disturbance zone area. Data on individual building locations and the clus- tered pattern formed by different building-effect dis- tances are needed to establish the degree of cluster- ing/dispersion that occurs with different types of development. Furthermore, vegetation types and to- pography also substantially influence the layout of subdivision parcels-especially building location.
These hypothetical subdivisions illustrate the in- terplay between different development patterns and building-effect distances. Generally, disturbance zone area increases rapidly with building-effect distance, and subdivision pattern is generally a stronger indi- cator of total disturbance zone area than density. For example, the total disturbance zone area is clearly the largest for the dispersed-regular subdivision with 16.1 ha (40 acres) parcels, while it is generally lower for the dispersed-regular subdivision with 64.7 ha (160 acres) parcels, though the difference narrows rapidly as the 500 m building distance approaches (Fig. 2). However, both the clustered subdivision with 4 and 16 units (and a 25% developed area) have substantially less impact, staying near or below 50%
Table 3
Proportion of subdivision in the disturbance zone for the dispersed
and clustered subdivisions from the East River Valley, CO, USA.
This shows the percent of the subdivision within the disturbance
zone, the radius of which equals the ‘building effect’
Pattern Percent effected by building effect distance of 100 m 200m 300m 400 m 500 m
Dispersed 19.5% 55.8% 84.6% 97.1% 99.5% Clustered 5.1% 19.1% 35.2% 50.7% 61.6%
effected area even at a distance of 500 m. Thus, a clustered subdivision (25% developed area), even with 4 times the number of total units, results in a substantially lower total disturbance zone area than a dispersed-regular patterned subdivision.
3.2. Comparison of a clustered and dispersed subdi- vision
Disturbance zones for a dispersed (Fig. 3) and clustered (Fig. 4) subdivision from the East River Valley, Gunnison County, CO, USA illustrate the effect of pattern on habitat impact (Table 2). The disturbance zone area for the dispersed subdivision constitutes over 50% of the subdivision at 200 m and 97% at 400 m (Table 3). At 100 m, the disturbance zones are islands in the habitat matrix, but by 200 m the habitat matrix is highly fragmented, and at 300 m and greater, little habitat remains (Fig. 3). Fragmen- tation may be more pronounced if there is a physical manifestation of the parcel boundaries, such as a fence or manipulation of vegetation (e.g., grazing, mowing, or chemical application).
The disturbance zone area for the clustered subdi- vision pattern is smaller than in the dispersed subdi- vision, constituting only 5% and 19% of the total area at 100 and 200 m (Table 3). Even at 500 m, only 61% is covered by the disturbance zone. How- ever, areas of high building concentrations impede species movement at relatively low building-effect distances (Fig. 4).
4. Density/disturbance functional relationship
Estimating the disturbance zone areas for actual subdivisions using the approach illustrated above requires spatially-explicit building location data. Al-
32 D.M. Theohald et al. /L.mdscape and Urban Planning 39 f 1997) 25-36
though calculating the disturbance zone area directly from building location data is more accurate, these data are seldom available during comprehensive planning, and obtaining it from aerial photography is often cost prohibitive. Therefore, we extend the dis- turbance zone approach by developing a functional relationship between development density and distur- bance zone area. County assessor offices usually maintain a database for tax assessment purposes that contains, for each parcel, the number of units and the Public Land Survey System location: township, range, section. Thus, the number of units per section (258.9 ha or 640 acres) or quarter section (64.7 ha or 160 acres) usually can be determined. Utilizing a density measure calculated for quarter sections, rather than absolute building locations, is also a more appropriate scale of analysis because it captures the general trends we are concerned with, while site-scale differences are the result of individual preferences and circumstances. Finally, most land use planning tools regulate density, not building location within a parcel.
4.1. Theoretical model
We examined how cumulative disturbance zone area varies with different development densities, building-effect distances, and building location pat- terns (i.e., clustered vs. dispersed) to produce a development density/disturbance zone area func- tion. We constructed 8.58 GIS maps of quarter-sec- tion size (64.7 ha, 160 acres), with each map repre- senting a unique combination of three factors: hous- ing density, building-effect distance, and pattern. Density varied from 64.7 ha/unit to 0.4 ha (I acre)/unit. Building-effect distances varied from 50-500 m. To assess how pattern influenced total disturbance zone area, we separated the hypothetical quarter section into developed and undeveloped por- tions-assuming that all units (at a given density) would be dispersed within the developed portions. The proportion of the developed area ranged from 25 to 100% of the quarter section. All parcels are packed into the developed area located in the lower left comer of each quarter section.
The total disturbance zone within each quarter section (excluding portions of the disturbance zones outside of the quarter-section borders) was calculated
for each combination of density, building-effect dis- tance, and pattern. Generally, each combination pro- duced a nonlinear function, with very rapid increases in the proportion of the quarter section within the disturbance zone at low densities, which leveled off quickly as density increased. This matches our pre- diction that even at low densities, development causes substantial wildlife habitat disturbance and distur- bance increases rapidly with small increases in den- sity. As expected, the density at which substantial disturbance occurs decreases rapidly as building-ef- fect distance increases. For example, the percent impacted at 2.0 ha (5 acres)/unit density and 50 m building effect ranges from about 25% to 40% by varying the developed proportion from 25% to 100%. At 100 m building effect, the percent impact ranges from 32% to 98% (Fig. 5). Highly-clustered patterns result in maximum impacts as low as 35% at 100 m building-effect distance, while dispersed patterns re- sult in 100% impact at 100 m at densities as low as 2.8 ha (7 acres)/unit.
These results suggest that the disturbance zone is sensitive to assumptions about building pattern. Be- cause of this sensitivity and because there is little empirical research on actual development patterns in rural areas, we incorporated empirical measures of development pattern into the theoretical model. We calculated the disturbance zone area based on indi- vidual building locations for each quarter section in the East River Valley, in 1964, 1978, 1990, and 1994. Overlapping portions of disturbance zones that originated in an adjacent quarter section were in- cluded when calculating total area of disturbance zone in a quarter section. The East River Valley has been extensively subdivided, especially since 1975 by 14.1 ha (35 acres) ranchettes (Theobald et al., 1996).
4.2. Empirical results and adjustments
The relationship between density and percent im- pact defined in the theoretical model is similar to the relationship found in the East River Valley, with the observed density/impact generally fitting within the theoretical range. Some important discrepancies were discovered, however, resulting in revision of the original model. In particular, at very low building-ef- fect distances (i.e., 50 m), the theoretical model

D.M. The&aid et al. /Landscup and Urban Planning 39 (1997125-36 33
64 10 5 3 2
Density (ha per unit)
Fig, 5. Proportion of quarter-section within the disturbance zone (i.e., percent effected) as a function of building density for 50 m and 100 m
building-effect distances and 25% and 100% development areas.
overestimated the disturbance zone area. Overestima- tion occurred because the empirical pattern was found to be much more clustered than anticipated in the theoretical model. Also, the amount of area disturbed is especially sensitive to pattern at low building-ef- fect distances because very little aggregation of dis- turbance zones occurs. This makes intuitive sense, especially in mountain valleys where private land is a thin ribbon along the valley bottom and buildings, especially older farms and ranches, are located adja- cent to the road, creating a ‘linear clustered’ pattern. At 200 m building-effect distance, the observed data fit fairly well within the ranges identified by the theoretical model, though the range of disturbance zone percentages (about 30%) is much greater than the narrow range (about 5%) identified by the theo- retical model (Fig. 6). At larger building-effect dis- tances, the theoretical models underestimate the per- cent impact, even compared to the 100% developed theoretical models. This apparent discrepancy occurs because at relatively large building-effect distances, the effects of neighboring development spill over into adjacent quarter sections. Thus, it appears that neighboring quarter-section densities have a fairly strong impact on the estimated disturbance zone area, especially at large building-effect distances.
In light of the empirical results, we adjusted our model in the following ways. First, estimating the
percent developed area (in the theoretical model) as a surrogate measure of clustered/dispersed pattern was problematic, especially in determining the pat- tern of existing development. Therefore, we fitted a power curve through the empirical data so that the estimated percent impact is an average value for a quarter section of a particular density. Second, to reflect the decreased impacts associated with a clus- tered development pattern, we simply decreased the disturbance zone proportion to the lowest observed value from the empirical data set. This revised ap- proach more realistically models existing develop- ment patterns, incorporates portions of disturbance zones that originate in neighboring quarter sections, and is straightforward and computationally efficient to implement. Finally, this method resulted in lower estimates of disturbance zone area.
4.3. Fragmentation
In addition to reducing habitat area, development fragments habitat by dividing it into smaller, spa- tially disjoint landscape units. A highly fragmented landscape is less likely to have large, intact habitat units. Furthermore, fragmentation isolates species and inhibits movement and reduces the probability of recolonization in the event that a species disappears from a given patch of habitat. Furthermore, mountain

34 D.M. Theohald et al./L.and.scape and Urban Planning 39 (1997) 25-36
64 10 5 3 2
Density (ha per unit)
Fig. 6. Empirical and theoretical disturbance zone data for 200 m building effect. The heavy line is fitted to the empirical density-dis-
turbance data marked by diamonds, while the thin lines are 25% and 100% bounds based on theoretical subdivision patterns.
landscapes are predisposed to fragmentation because of the dendritic public/private land ownership pat- tern common throughout the mountainous western US (Theobald and Riebsame, 1995; Riebsame et al., 1996). The development pattern of the East River Valley demonstrates the fragmenting effects of de- velopment. At a relatively early stage of develop- ment (1964) and at low building-effect distances, habitat is perforated by small islands of develop- ment. Later, disturbance zones begin to coalesce, and in 1994, only a few small areas remain open to provide cross-valley connectivity for wildlife.
Fragmentation and overall area of disturbance are not necessarily correlated. For example, a dispersed, low-density development pattern causes maximum area1 disturbance, because disturbance zones do not coalesce until a relatively large building-effect dis- tance is reached. At a relatively low building-effect distance, development perforates the landscape, but connectivity is relatively high, until a threshold is reached when disturbance zones begin to coalesce and connectivity is rapidly compromised. A clus- tered, low-density development pattern causes mini- mal area1 disturbance, but at even short building-ef- fect distances connectivity is compromised within the developed area. A large number of clustered development patterns scattered throughout a valley would create holes in the habitat matrix, but overall
connectivity would remain high. Perhaps most trou- bling, in terms of maintaining intact habitat, is that linear clustered development patterns result in both large overall disturbance zone areas and fragmenta- tion, even at short building-effect distances.
4.4. Application of disturbance zone
We evaluate the effect of development on wildlife habitat by calculating the proportion of each quarter section effected by development. This expected im- pact layer is then applied to a map of habitat value depicting wildlife habitat patterns. The relative ef- fects of different development alternatives are evalu- ated by summing the development-weighted habitat quality values over the study site.
While the methodology described here was devel- oped to support comprehensive planning, it also can be used at the site scale. More refined estimates of impact can be made since locations of buildings, roads, and utility infrastructure and wildlife habitat patches and other environmental constraints are known. The building-effect distance could reflect slope and cover characteristics important to wildlife species, so that the building-effect distance would be greater in adjacent areas without cover and be shorter in areas with cover. A further extension would be to adjust effects to reflect the location of disturbance
D.M. Theobald et al. /Landscape and Urban Planning 39 (1997) 25-36 3.5
zone in relation to patch boundaries, so that a zone within a patch interior might have a stronger impact than a zone at the patch edge.
5. Conclusion
We have presented an approach for estimating the area of habitat disturbance generated by develop- ment, given different development densities and pat- terns, as well as different assumptions about wildlife sensitivities. Our approach does not address thorny issues such as differential sensitivities of wildlife species to human disturbance, shifting species com- position, or the potential for development to improve habitat in some ways, nor does it attempt to differen- tiate types of disturbance with different types of development (e.g., condo units with full-time resi- dents vs. seasonally occupied large homes). How- ever, it does provide a tractable, understandable, and, ultimately, useful method that improves our ability to evaluate development impacts on wildlife habitat. We also assumed that housing density is a surrogate for disturbance associated with roads. Further re- search is needed to identify similarities and differ- ences between effects associated with housing den- sity and road density and the extent of spatial corre- lation. It must be emphasized that the value of this approach is in comparing relative impacts of various development patterns, given different assumptions about density, pattern, and disturbance intensity.
Clustering development reduces disturbance of development on wildlife habitat. In fact, subdivision pattern was found to be a strong indicator of total disturbance zone area and, for long building-effect distances, a stronger indicator than subdivision den- sity. This finding suggests that efforts to minimize habitat impacts by decreasing development density (e.g., Powers, 1994) should also require clustering of parcels. However, development can be clustered in a way that reduces overall disturbance area, but that still fragments the landscape to a considerable de- gree. Many clustered development designs place buildings around ‘pods’ or cul-du-sacs, reducing the overall disturbance zone area, but landscape frag- mentation is high if islands of habitat contained inside the development, are too small to support a viable population and inaccessible to the surrounding habitat. Landscape connectivity is also compromised
when linear clustering (e.g., development along a linear feature such as a riparian area or road) occurs perpendicular to the direction of landscape move- ment. Thus, two factors are important in understand- ing how development potentially disturbs habitat: total area of habitat disturbed near buildings and roads; and landscape fragmentation and inhibition of wildlife movement across the landscape.
As development proceeds in a valley or land- scape, negative impacts will likely occur at an in- creasing rate. At low levels of overall development in a valley, development impacts appear to be slight because of species immigration from large expanses of habitat adjacent to the developed areas. As devel- opment proceeds and subdivisions form increasingly large clumps of development, immigration from ad- jacent habitat will be reduced, and the likelihood that a development obstructs a wildlife corridor will in- crease. While clustered subdivisions reduce total dis- turbance zone area, the positioning of adjacent clus- tered subdivision should be considered to limit frag- mentation effects at a coarser scale. That is, the same issues important in determining negative impacts associated with different subdivision patterns apply at a broader scale as well. In particular, rules which result in the clustering of clustered subdivisions that minimize overall habitat fragmentation are needed.
Acknowledgements
This research was initiated under research sup- ported by the USDA Forest Service through contract 2%C3-750 with the University of Colorado, Boulder; and partially funded by the Edna Bailey Sussman Fund and through The System for Conservation Planning project funded by the Colorado Division of Wildlife and Great Outdoors Colorado Trust Fund. We thank Susan Lohr and the Rocky Mountain Biological Laboratory for sponsoring part of this research and W.E. Riebsame, R.L. Knight, and the anonymous reviewers for helpful comments on a previous draft.
References
Arendt, R., 1994. Rural by Design: Maintaining Small Town
Character. Planners Press, Chicago, IL.

36 D.M. Theobald et al./Lundscape and Urban Planning 39 (1997125-36
Beissinger, S., Osborne, D., 1982. Effects of urbanization on
avian community organization. Condor 84, 75-83.
Cassirer, E.F., Freddy, D.J., Ables, E.D., 1992. Elk responses to disturbance by cross-country skiers in Yellowstone National
Park. Wild]. Sot. Bull. 20, 375-381.
Churcher, P.B., Lawton, J.H., 1987. Predation by domestic cats in
an English village. J. Zool. 212, 439-455.
Coleman, J.S., Temple, S.A., 1993. Rural residents’ free-ranging
domestic cats: a survey. Wild]. Sot. Bull. 21, 381-390.
Colorado State Forest Service. no date. Wildfire Protection in the
Wildland Urban Interface. CSFS # 143-691. Wildfire Protec-
tion in the Wildland Urban Interface. CSFS #143-691.
Engels, T., Sexton, C., 1994. Negative correlation of blue jays and
golden-cheeked warblers near an urbanizing area. Conserva-
tion Biol. 8, 286-290.
Freddy, D.J., Bronaugh, W.M., Fowler, M.C., 1986. Responses of
mule deer to disturbance by persons afoot and in snowmobiles.
Wild]. Sot. Bull, 14, 63-68.
Forman, R.T.T., Godron, M., 1986. Landscape Ecology. Wiley.
Gabrielson, G.W., Smith, E.N., 1995. Physiological responses of
wildlife to disturbance. In: Knight, R.L., Gutzwiller, K.J.
(Eds.), Wildlife and Recreationists. Island Press, Washington,
DC, pp. 95-107.
Harrison, R.L., 1997. A comparison of Gray Fox ecology between
residential and undeveloped rural landscapes. J. Wild]. Man-
age. 61 (l), 112-122.
Haspel, C., Calhoon, R.E., 1989. Home ranges of free-ranging
cats (Fe/is catus) in Brooklyn, New York. Can. J. Zoo]. 67, 178-181.
Hobbs, N.T., Theobald, D.M., Zack, J.A., Bearly, T.L., Riebsame, W.E., Shenk, T., 1997. Forecasting Impacts of Land Use
Change on Wildlife Habitat: Collaborative Development of an
Interactive GIS for Conservation Planning. Natural Resource
Ecology Laboratory, Colorado State University. URL:
http://www.nrel.colostate.edu/scop.
Hockin, D., Ounsted, M., German, M., Hill, D., Keller, V.,
Barker, M.A., 1992. Examination of the effects of disturbance
on birds with reference to its importance in ecological assess-
ments. .I. Environ. Manage. 36, 253-286.
Hoffman, C.O., Gottschang, J.L., 1977. Numbers, distribution,
and movements of a raccoon population in a suburban residen-
tial community. J. Mammal 58, 623-636.
Holmes, T.L., Knight, R.L., Stegall, L., Craig, G.R., 1993. Re-
sponses of wintering grassland raptors to human disturbance.
Wild]. Sot. Bull. 21, 461-468.
Kahn, A.E., 1966. The tyranny of small decisions: market failures,
imperfections, and the limits of economics. KYKLOS 19,
23-45. Knight, R.L., 1994. What happens when ranches die? Colorado
Rancher and Farmer, October, 8- 10. Lyon, J., 1983. Road density models describing habitat effective-
ness for elk. J. For. 592-595, 613.
Mills, G.S., Dunning, J.B. Jr., Bates, J.M., 1989. Effects of
urbanization of breeding bird community structure in south-
western desert habitats. Condor 91, 416-428.
Paton, P.C., 1994. The effect of edge on avian nest success: how
strong is the evidence?. Conservation Biol. 8, 17-26.
Powers, L., 1994. What happened to the 35-acre subdivision
reform bill? The Chronicle & Pilot, Crested Butte, CO, March
4, p. 20.
Riebsame, W.E., Gosnell, H., Theobald, D.M., 1996. Land use
and cover change in the US Rocky Mountains: I. Theory,
scale, and pattern. Mt. Res. Dev. 16 (41, 3955405.
Rodgers, J.A. Jr., Smith, H.T., 1995. Set-back distances to protect
nesting bird colonies from human disturbance in Florida.
Conservation Biol. 9, 89-99.
Schultz, T.D., Bailer, J.A., 1978. Responses of National Park elk
to human activity. J. Wild]. Manage. 42, 91-100.
Sears, A.R., Anderson, S.H., 1991. Correlations between birds and
vegetation in Cheyenne, Wyoming. In: Adams, L.W., Leedy,
D.L. (Eds.1, Widlife Conservation in Metropolitan Environ-
ments National Institute for Urban Wildlife, Columbia, MD,
pp. 75-80.
SoulC, M.E., Bolger, D.T., Alberts, A.C., Sauvajot, R., Wright, J.,
Sorice, M., Hill, S., 1988. Reconstructed dynamics of rapid
extinctions of chaparral-requiring birds in urban habitat is-
lands. Conservation Biol. 2, 75-92.
Stakhiv, E.Z., 1988. An evaluation paradigm for cumulative im-
pact analysis. Environ. Manage. 12, 725-748.
Theobald, D.M., Riebsame, W.E., 1995. Land use change on the Rocky Mountain forest fringe. Proceedings of the Western
Conference of the Western Association of Fish and Wildlife
Agencies. Big Sky, MT.
Theobald, D.M., Gosnell, H., Riebsame, W.E., 1996. Land use
and cover change in the US Rocky Mountains: II. A case
study of the East River Valley, Colorado. Mt. Res. Dev. 16
(41, 407-418.
Vogel, W.O., 1989. Response of deer to density and distribution
of housing in Montana. Wild]. Sot. Bull. 17, 406-413.
Ward, A.L., Fornwalt, N.E., Henry, S.E., Hodorff, R.A., 1980.
Effects of highway operation practices and facilities on elk,
mule deer, and pronghorn antelope. Federal Highway Office
Research and Development. Report FHWA-RD-79-143.
Whitcomb, R., Robbins, C., Lynch, J., Whitcomb, B.,
Klimkiewicz, M., and Bystrak, D., 1981. Effects of forest
fragmentation of avifauna of the eastern deciduous forest. In:
Burgess, R.L., Sharpe, D.M. (Eds.1, Forest Island Dynamics in
Man-Dominated Landscapes. Springer, New York.
White, C.M., Thurow, T.L., 1985. Reproduction of Ferruginous
Hawks exposed to controlled substance. Condor 87, 14-22. Whyte, W.H., 1964. Cluster development. American Conservation
Association, New York.