estimating the early evolution of ... -...
TRANSCRIPT

Examensarbete vid Institutionen för geovetenskaper Degree Project at the Department of Earth Sciences
ISSN 1650-6553 Nr 471
Estimating the Early Evolution of
Brachiopods Using an Integrated
Approach Combining Genomics
and Fossils
En uppskattning av armfotingarnas tidiga evolution
– med hjälp av genomik och fossil
Chloé Robert
INSTITUTIONEN FÖR
GEOVETENSKAPER
D E P A R T M E N T O F E A R T H S C I E N C E S


Examensarbete vid Institutionen för geovetenskaper Degree Project at the Department of Earth Sciences
ISSN 1650-6553 Nr 471
Estimating the Early Evolution of
Brachiopods Using an Integrated
Approach Combining Genomics
and Fossils
En uppskattning av armfotingarnas tidiga evolution
– med hjälp av genomik och fossil
Chloé Robert

ISSN 1650-6553
Copyright © Chloé Robert
Published at Department of Earth Sciences, Uppsala University (www.geo.uu.se), Uppsala, 2019
Abstract
Estimating the Early Evolution of Brachiopods Using an Integrated Approach Combining
Genomics and Fossils
Chloé Robert
The Brachiopoda, a major group of the Lophotrochozoa, experienced a rapid early evolutionary
diversification during the well-known Cambrian explosion and subsequently dominated the Palaeozoic
benthos with its diversity and abundance. Even though the phylogeny of the Lophotrochozoa is still
hotly debated, it is now known that the Brachiopoda are a monophyletic grouping. However, the early
evolutionary rates for the Brachiopoda have never been studied in the framework of a study combining
molecular data and fossil time calibration points. In order to investigate the expected higher evolutionary
rates of the Phylum at its origin, we conducted phylogenetic studies combining different methodologies
and datasets. This work has at its foundation Maximum Likelihood and Bayesian analyses of 18S and
28S rRNA datasets followed by analyses of phylogenomic sequences. All material was obtained from
previously available sequences and from sequencing of genetic material from specimens from a
concerted worldwide collection effort.
While the analyses of the phylogenomic dataset produced a robust phylogeny of the Brachiopoda
with good support, both the results of the novel rRNA and phylogenomic dating analyses provided
limited insights into the early rates of evolution of the Brachiopoda from a newly assembled dataset,
demonstrating some limitations in calibration dating using the software package BEAST2. Future
studies implementing fossil calibration, possibly incorporating morphological data, should be attempted
to elucidate the early rates of evolution of Brachiopoda and the effect of the Push of the Past in this
clade.
Keywords: Brachiopoda, evolutionary history, phylogeny, Maximum likelihood, Bayesian inference,
fossil calibrations Degree Project E1 in Earth Science, 1GV025, 30 credits Supervisors: Aodhán Butler and Graham Budd Department of Earth Sciences, Uppsala University, Villavägen 16, SE-752 36 Uppsala (www.geo.uu.se) ISSN 1650-6553, Examensarbete vid Institutionen för geovetenskaper, No. 471, 2019 The whole document will be available at www.diva-portal.org

Populärvetenskaplig sammanfattning
En uppskattning av armfotingarnas tidiga evolution – med hjälp av genomik och fossil
Chloé Robert
Det är ofta antaget att evolution (förändringar i arvsmassan hos en grupp organismer) sker i en konstant
hastighet men i slutändan ändå osäkert om så är fallet. Stora grupper av organismer har ofta associerats
med en högre evolutionär hastighet, speciellt nära deras uppkomst, vilket ökar sannolikheten för
överlevnad.
Armfotingar (Brachiopoda) är marina ryggradslösa djur med skal som tidigare var allmänt
spridd, idag är istället musslor (Bivalvia) betydligt mer spridda. Armfotingar har funnits och utvecklats
under flera miljoner år med ursprung under tidigt kambrium. Genom år av forskning och många fossil
har vi fått mer information om utseendet hos utdöda organismer vilket har bidragit till att antalet fossila
arter som vi känner till har ökat tusenfalt. Under den senaste tiden har det också skett innovationer inom
molekylära tekniker som gjort det möjligt att applicera dessa kunskaper även på utdöda arter. Dessa
molekylära tekniker har nyligen hjälpt till att bestämma några av släktskapsförhållandena inom
armfotingar som tidigare ansetts vara väldigt svåra att lösa.
Det finns fortfarande vissa släktskapsförhållanden inom armfotingar som inte är kända och man
vet ännu inte hur fort de utvecklades. Genom att undersöka just evolutionens hastighet kan man börja
förstå gruppens tidiga framgång under Kambrium och Ordovicium samt minskningen som följde. Syftet
med den här studien var att beräkna evolutionshastigheten hos armfotingar med särskild fokus på den
tidiga diversifieringen av gruppen. För att undersöka detta använde vi oss av molekylära data för att
analysera släktskapsförhållandena inom armfotingar. Dessutom använde vi fossil för att datera stora
händelser i armfotingarnas evolutionära historia. Med hjälp av statistiska analyser kunde vi beräkna
evolutionshastighet och släktskapsförhållandena inom gruppen. Vi kom fram till att armfotingar
härstammar från en gemensam förfader. Dateringen kring när detta skedde blev inte fastställd då det
beräknades ske miljoner år före det äldsta djurfossilet. Det kommer behövas mer forskning för att ta
reda på om armfotingar hade en högre evolutionär hastighet i tidigt skede.
Keywords Brachiopoda, evolutionhistoria, fylogeni, Maximum likelihood-metoden, Bayesiansk
statistik, fossilkalibering
Examensarbete E1 i geovetenskaper, 1GV025, 30 hp
Handledare: Aodhán Butler och Graham Budd
Institutionen för geovetenskaper, Uppsala universitet, Villavägen 16, 752 36 Uppsala
(www.geo.uu.se)
ISSN 1650-6553, Examensarbete vid Institutionen för geovetenskaper, Nr 471, 2019
Hela publikationen finns tillgänglig på www.diva-portal.org
Table of Contents
1 Introduction ............................................................................................................................. 1
2 Aims ........................................................................................................................................ 2
3 Background ............................................................................................................................. 3
3.1 Brachiopods .................................................................................................................................. 3 3.1.1 Classification ......................................................................................................................... 3 3.1.2. Description ............................................................................................................................ 3 3.1.3 Lophophorata ......................................................................................................................... 4
3.2 Phylogenetic analyses ................................................................................................................... 5 3.2.1 Maximum Likelihood ............................................................................................................ 6 3.2.2 Bayesian inference ................................................................................................................. 6 3.2.3 Model selection ...................................................................................................................... 6
3.3 Molecular clock............................................................................................................................. 7
3.4 Push of the past ............................................................................................................................. 7
4 Material and methods .............................................................................................................. 8
4.1 rRNA pilot study ........................................................................................................................... 9 4.1.1 Alignment and model choice ................................................................................................. 9 4.1.2 Bayesian analyses ................................................................................................................ 13 4.1.3 RAxML analysis .................................................................................................................. 15
4.2 Phylogenomic analyses ............................................................................................................... 15 4.2.1 Dataset and model choice .................................................................................................... 15 4.2.2 RAxML analysis .................................................................................................................. 17 4.2.3 Bayesian inference for phylogenetic reconstruction ............................................................ 17 4.2.4 Bayesian inference for molecular dating ............................................................................. 17
5 Results ................................................................................................................................... 18
5.1 rRNA datasets ............................................................................................................................. 18 5.1.1 Topology .............................................................................................................................. 18 5.1.2 rRNA molecular dating ........................................................................................................ 22
5.2 Phylogenomic datasets ................................................................................................................ 25 5.2.1 PhyloBayes topology ........................................................................................................... 25 5.2.2 RAxML LG and Dayhoff .................................................................................................... 26 5.2.3 Molecular dating .................................................................................................................. 27
6 Discussion ............................................................................................................................. 29
6.1 Limitations of rRNA datasets in Brachiopod phylogenetics ....................................................... 29
6.2 BEAST2: a problematic dating methodology ............................................................................. 30
6.3 Future studies .............................................................................................................................. 31
7 Conclusion ............................................................................................................................. 32
8 Acknowledgments ................................................................................................................. 32
8 References ............................................................................................................................. 33
APPENDIX .............................................................................................................................. 39


1
1 Introduction
The first appearance of metazoans and the subsequent diversification of all animal phyla during
the Cambrian is one of the key events in the history of life on Earth. The multitude of processes
and drivers for this diversification (e.g. Budd & Jensen, 2000) as well as other effects (e.g. Push
of the Past (Nee et al., 1994; Budd & Mann, 2018) that may skew our view of these events are
a central research topic in Evolutionary Biology and Palaeontology.
The Cambrian explosion was this unprecedented event that witnessed the appearance
and diversification of the animal Phyla (Conway Morris, 1989). Outside the very specific
conditions and faunas found in Cambrian Lagerstätten (Chengjiang, Sirius Passet, Burgess
Shale) a widespread fauna of chiefly biomneralizing organisms with the capacity to produce
protective structures such as shells, dominate the fossil record. These biomineralizers came to
be overrepresented in the fossil diversity up to the present, something likely caused by the high
fossilization potential of biomineralized structures (calcitic or apatitic). While biomineralizers
remain dominant to this day, their clade abundances and diversification patterns varied greatly
from the Cambrian to the Present evidenced by, for example, the relative marginalization of
brachiopods today by bivalves (Gould and Calloway, 1980).
Patterns of diversification through time have been of considerable interest to
evolutionary theory. Changes in diversification patterns can be easily identified in major
radiation events (Budd & Jensen 2000) or after mass extinctions (Erwin 1993, Hull et al., 2011).
These events are responsible for faunal/floral turnovers, major drops in the diversity of several
groups with a concurrent increase in others and a striking shift in fossil morphologies.
Predominant among these events, the Cambrian Explosion and the Great Ordovician
Biodiversification Event have attracted researchers interested in the origin of life and its
subsequent rapid diversification and occupation of most major environmental niches.
Rates of evolution in ancestral lineages can be inferred using molecular and phenotypic
data, for instance, these were analysed in previous analyses focusing on arthropods (Lee et al.,
2013), shedding light on the surprisingly faster rates of evolution of this clade during the
Cambrian. Although a great wealth of information has accumulated over the past decades for
the Brachiopoda, similar analyses for this phylum are lacking. Dominant during the Palaeozoic,
around 15000 extinct species described, Brachiopoda has a diverse fossil record (Foote 1999),
with very few extant representatives but with a broad geographic distribution. Metazoan groups
with a wealth of fossil occurrences, diversity and stratigraphic congruence are prime candidates
2
for the study of the early diversification of animal groups as well as the effect of the Push of
the Past in Evolutionary patterns (Budd & Mann, 2018).
In this project, I investigated whether an early higher rate of diversification of the
Brachiopoda close to the putative Cambrian emergence is responsible for the apparent success
of this phylum in accordance to the hypothesis put forward by the Push of the Past, a concept
which will be explained in a following section. Instead, exceptional features of the Brachiopod
body plan, such as valves enclosing their body, are singularly responsible for their rather
successful course through time. This question was approached by using genetic data and fossil
calibrations, an attempt to explore the early rates of evolution of the brachiopods.
2 Aims
This project was designed to study the rate of evolution for the Phylum Brachiopoda since its
first appearance and through time. I aim to identify patterns in the rate of evolution and to
clarify, if present, the effects of the Push of the Past in the observed diversification/evolutionary
patterns. To ascertain the accuracy of the results, this work has as its foundation analyses of
sequences of genetic material obtained through wide, global collection of specimens and
consequent laboratory work to extract genetic material that is then sequenced and analysed. To
supplement our analyses, readily available sequences published online at GenBank were also
used (Benson et al., 2008). The most widely utilised statistical methodologies to approach such
questions as mentioned above are, Maximum Likelihood and Bayesian analyses. These
methodologies were used to produce a well-supported phylogeny of brachiopods and produce
an accompanying, robust, phylogenetic tree. Molecular clocks being notoriously difficult to
calibrate (e.g. Wilke et al., 2009) and to give accurate results about the timing of the divergence
of clades pose a significant problem for this analysis. In order to fine-tune and calibrate our
results, I made extensive use of the most up to date fossil occurrence data for the Brachiopoda
to calibrate key events in their evolutionary history such as their first unequivocal appearance.
3
3 Background
3.1 Brachiopods
3.1.1 Classification
There are nearly 5,000 brachiopod genera described and classified morphologically into 26
orders and eight classes (Carlson 2016 citing (Kaesler & Selden 1997–2007)). This Phylum has
a very rich fossil record: 400 extant species are described, contrasting with the 15000 extinct
species known (Brusca et al., 2016). Brachiopods are divided into three distinct subphyla:
Linguliformea, Craniformea and Rhynchonelliformea (Kaesler & Selden 1997–2007). These
are comprised of superfamilies, of which some contain only extinct taxa. The 25 extant species
belonging to Linguliformea are divided in two superfamilies: Linguloidea and Discinoidea.
Almost as many extant species are classified within the subphylum Craniformea but all belong
to the same superfamily: Cranioidea. Rhynchonelliformea, the last subphylum, contains the
greatest diversity of all, with more than 350 species. The extant species of this superfamily are
divided in three orders: Rhynchonellida, Terebratulida and Thecideida (Kaesler & Selden
1997–2007).
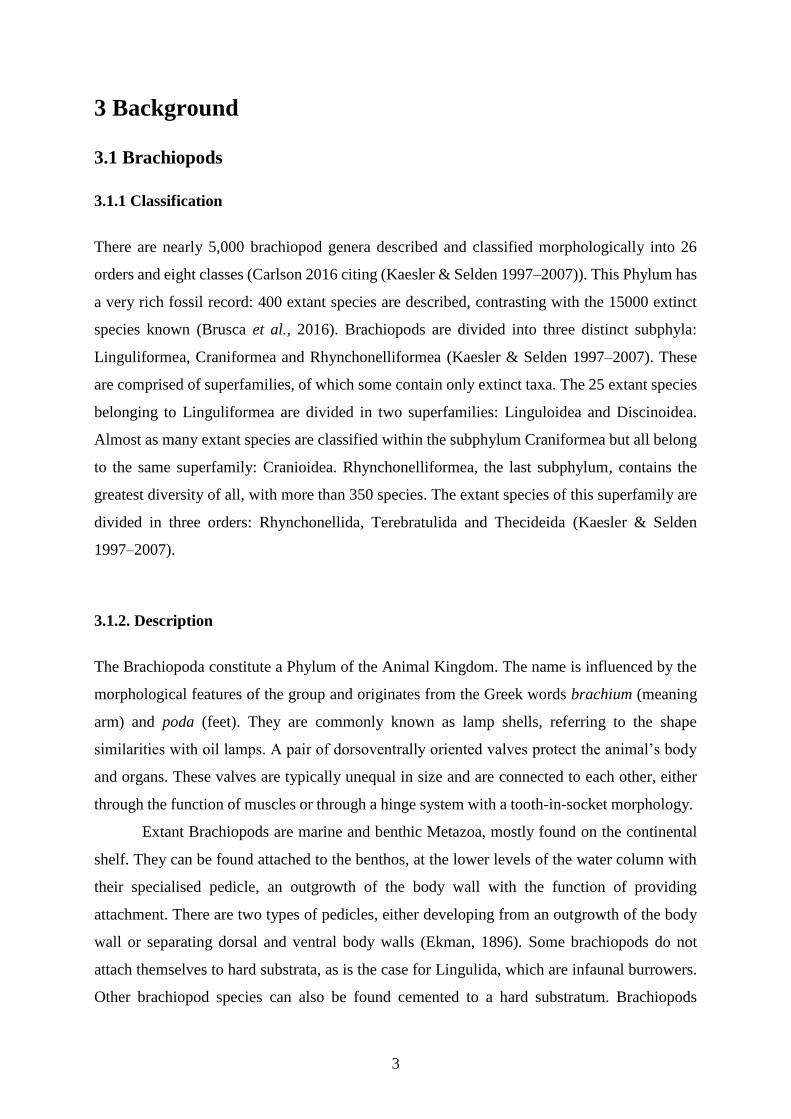
3.1.2. Description
The Brachiopoda constitute a Phylum of the Animal Kingdom. The name is influenced by the
morphological features of the group and originates from the Greek words brachium (meaning
arm) and poda (feet). They are commonly known as lamp shells, referring to the shape
similarities with oil lamps. A pair of dorsoventrally oriented valves protect the animal’s body
and organs. These valves are typically unequal in size and are connected to each other, either
through the function of muscles or through a hinge system with a tooth-in-socket morphology.
Extant Brachiopods are marine and benthic Metazoa, mostly found on the continental
shelf. They can be found attached to the benthos, at the lower levels of the water column with
their specialised pedicle, an outgrowth of the body wall with the function of providing
attachment. There are two types of pedicles, either developing from an outgrowth of the body
wall or separating dorsal and ventral body walls (Ekman, 1896). Some brachiopods do not
attach themselves to hard substrata, as is the case for Lingulida, which are infaunal burrowers.
Other brachiopod species can also be found cemented to a hard substratum. Brachiopods
4
possess a lophophore, a ciliated and tentacular structure surrounding the mouth (Carlson, 2016).
This, combined with the epistome, a muscular structure bringing food to the mouth, enables
efficient suspension feeding. The lophophore tentacles’ cilia draw water in the mantle cavity
by generating a unidirectional current, making suspension feeding possible.
Most brachiopods are gonochoristic animals, reproducing by external fertilization. They
have a free-swimming juvenile stage, also called planktotrophic stage, but there are quite
different ontogenetic stages for each subphyla (Brusca et al., 2016). It is thought that
brachiopods originated at least 530Ma years ago (e.g. Aldanotreta sunnaginensis Pelman,
1977). Brachiopods were among the most abundant Metazoa and suspension feeding organisms
during the Palaeozoic, their diversity increased in the Ordovician through the Carboniferous
(Valentine & Jablonski, 1983). They experienced an extinction event at Permian-Triassic at the
end of which they never recovered their previous diversity and steadily declined. This decline
is probably exacerbated by competition with mussels (Thayer, 1985).
3.1.3 Lophophorata
Brachiopods are protostomes, more precisely belonging to the Lophophorata. For several
centuries from their discovery in the 16th century, brachiopods were grouped with molluscs
and were only in the late 19th century recognized as lophophorates and grouped with other
Lophophorata, under the name Tentaculata (Hatschek, 1988). Traditionally, the lophophorates
have been seen as a monophyletic grouping consisting of the Bryozoa (6000 extant species),
Phoronida (11 species) and Brachiopoda (Brusca et al., 2016).
These phyla are all sessile, organisms generally have a U-shaped gut and a relatively
simple reproductive system (Brusca et al., 2016). But these organisms were first grouped
together because of their unique feeding structure: the lophophore.
Traditionally the Lophophorata were first considered as deuterostomes (Hennig, 1979
and Schram, 1991), because they share various ontogenetic similarity with this group, such as
a secondary development of the mouth. Molecular data showed that they were actually
genetically closer to Protostomia, and specifically belonging to the Spiralia (Halanych et al.,
1995). The internal phylogenetic relationships of the Spiralia remain a subject of heated debate
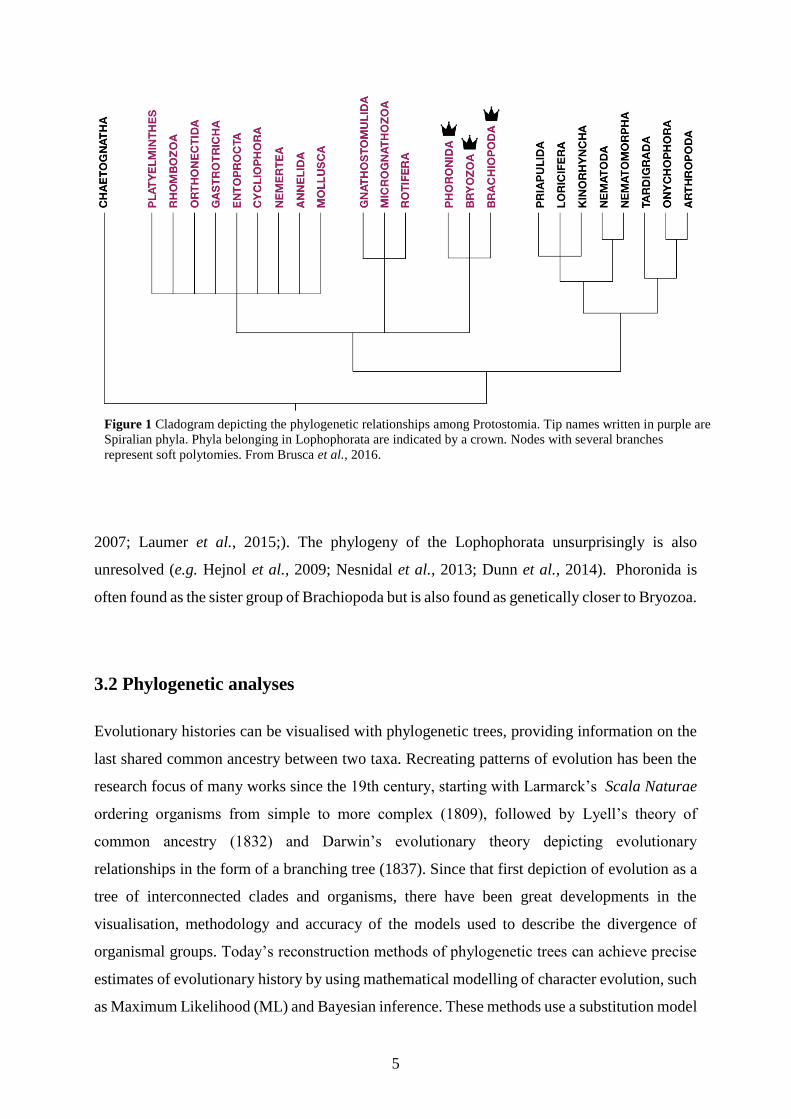
and a great amount of uncertainty remains (Fig. 1) (e.g. Eernisse et al., 1992; Hausdorf et al.,
5
2007; Laumer et al., 2015;). The phylogeny of the Lophophorata unsurprisingly is also
unresolved (e.g. Hejnol et al., 2009; Nesnidal et al., 2013; Dunn et al., 2014). Phoronida is
often found as the sister group of Brachiopoda but is also found as genetically closer to Bryozoa.
3.2 Phylogenetic analyses
Evolutionary histories can be visualised with phylogenetic trees, providing information on the
last shared common ancestry between two taxa. Recreating patterns of evolution has been the
research focus of many works since the 19th century, starting with Larmarck’s Scala Naturae
ordering organisms from simple to more complex (1809), followed by Lyell’s theory of
common ancestry (1832) and Darwin’s evolutionary theory depicting evolutionary
relationships in the form of a branching tree (1837). Since that first depiction of evolution as a
tree of interconnected clades and organisms, there have been great developments in the
visualisation, methodology and accuracy of the models used to describe the divergence of
organismal groups. Today’s reconstruction methods of phylogenetic trees can achieve precise
estimates of evolutionary history by using mathematical modelling of character evolution, such
as Maximum Likelihood (ML) and Bayesian inference. These methods use a substitution model
Figure 1 Cladogram depicting the phylogenetic relationships among Protostomia. Tip names written in purple are
Spiralian phyla. Phyla belonging in Lophophorata are indicated by a crown. Nodes with several branches
represent soft polytomies. From Brusca et al., 2016.

6
that specifies which characters can evolve between states based on the data of interest, for
example give information for each transversion and transition when DNA data is used and
inform about the rates of these evolutionary changes.
3.2.1 Maximum Likelihood
Maximum Likelihood (ML) analyses aim at finding the tree that has the highest probability of
giving rise to the observed data. The process of finding this tree starts with computing a single
tree, calculating the likelihood for each site, for example calculation the likelihood for each
nucleotide when DNA is the material of the study and then calculating the overall likelihood of
the tree. Then, by modifying the parameters of this tree, its likelihood is maximized, and the
same steps are repeated for each possible tree. The highest likelihood tree is found by comparing
the likelihood of each tree (Baum & Smith, 2013).
3.2.2 Bayesian inference
Contrary to Maximum Likelihood analysis, Bayesian inference assesses the posterior
probability of the tree, which is the probability that the tree is true given the data, our models
of evolution and our prior beliefs:
With Pr(H|D), the probability of the hypothesis (H) given the data (D), also known as posterior
probability, Pr(D|H) the probability of the data given the hypothesis (also known as the
likelihood). Pr(H) and Pr(D) both refer to priors probability. With this mathematical model, the
starting information (Prior) is determinant, hence the importance to choose these with caution
(Baum & Smith, 2013).
3.2.3 Model selection
Before starting a phylogenetic analysis, the substitution model fitting the data best has to be
identified. This will specify the way the characters can evolve between their different states
(Baum & Smith, 2013). Several substitution models exist, firstly with a model with the least
parameters, such as the Jukes-Cantor model (1969), which assumes equal frequencies, rates and
substitution for all DNA bases, to more complex models such as the general time-reversible
model (GTR) (Travaré, 1986). The GTR model assigns different substitution rates for each

7
transition and transversion as well as variable base frequencies to the characters. The best fitting
model is chosen with the help of statistical tests, such as the corrected Akaike Information
Criterion (AICc, Akaike 1974) or the Bayesian Information Criterion (BIC, Schwarz, 1978).
The model obtaining the smallest value in these tests are set to fit the data better.
3.3 Molecular clock
Obtaining accurate evolutionary timescales and correctly dating past events is fundamental to
the reconstruction of evolutionary histories. Pauling and Zuckerkandl (1963) observed from
studies on mammals, constant rates of base changes of amino-acids through time, the sole
principle of molecular clock. Based on the assumption that the number of changes in the
genome of two organisms is proportional to the time elapsed since they last shared a common
ancestor, the concept of molecular clock encompasses methods and models that assess
variations of rates of genetic evolution across the tree of life (Lee and Ho, 2016). Thanks to
different molecular clock models, one can accommodate for diversifications of rate of evolution
among genes and lineages in order to replicate the real evolutionary rate, which will be useful
to calculate evolutionary time. In Maximum Likelihood and Bayesian inference, a molecular
clock can be used to compute phylograms in which branch lengths are proportional to past
evolutionary changes, shedding light on information that might complement the information
gathered from the fossil record. However, prior knowledge is fundamental to compute such
trees, for example in the form of calibration points, that enable dating evolutionary events such
as the emergence of a particular clade. Hence the existing fossil record is useful and fossil data
are essential to calibrate and date the phylogenetic tree. Calibrating trees consists of using the
age the older fossil known for a monophyletic group as the minimum age for that clade, or even
assigning minimum and maximum age constraints for a specific event. The principles outlined
above were used in the present study.
3.4 Push of the past
Phylogenetic models aim at reconstructing relationships among selected organisms,
highlighting heterogeneous performance of different clades in a macroevolutionary context.
These variations can partially be explained by differences in their early evolutionary rates. The

8
effect of the push of the past (POTPa) is a concept introduced in the 1990s, which suggests an
“apparently higher rate of cladogenesis at the beginning of the growth of the actual phylogeny”
(Nee et al., 1994). This effect would be one of the causes of the great diversification and
survivability of today’s extant clades (Budd & Mann, 2018). These clades would have benefited
from a high diversification rate at their origin that consequently increased their probability of
survival. Clades that do not benefit from such greater early diversification rates are thus much
more prone to extinction. This implies that the monophyletic groups that had the “good fortune”
to have a distinctly greater early diversity also had much more time to diversify and survive to
the present. Hence, when the effects of the POTPa are not recognized in phylogenetic analyses,
if one considers a rather homogeneous rate of evolution throughout the tree, the age of the root
will be set excessively early, affecting the accuracy of the evolutionary history depicted in the
phylogenetic tree, resulting in erroneous observations. Rates of evolution in ancestral lineages
can be reconstructed using molecular and phenotypic data, for instance these were used in a
previous analysis focusing on arthropods (Lee et al., 2013), where higher rates of evolution
were observed at the origin of the Arthropoda. However, no similar study has taken place to
address the diversification and survival of the Brachiopoda to date.
4 Material and methods
The methodology for this study can be divided into three sections. The primary step is the
acquisition of the material for the study. This section includes everything from the collection
of animals to the extraction of genetic material. The second part of the data collection focuses
on retrieving the genes of interest to our study and grouping them in corresponding alignment
files. The third and final step is the actual analysis of the data and using fossil data to calibrate
the molecular clock. The first and second sections were carried out before the time frame of the
present thesis and thanks to the collaboration of other scientists, hence will only be described
in the Appendix.
Two analyses were conducted using two distinct datasets. First, the method was tested
in a pilot study (proof of principle study) using ribosomal RNA (rRNA) sequences and the
second analyses took advantage of a phylogenomic dataset assembled prior this study.

9
4.1 rRNA pilot study
In order to familiarize with the methodology and the software, ribosomal RNA (rRNA)
sequences were used for a pilot study. For the pilot study 18S rRNA and 28S rRNA sequences
were used. The genetic material used in this first study consisted of newly sequenced material
and GenBank material. Accession numbers of these sequences are available in Table 1. Separate
analyses were launched for 18S, 28S and a concatenated dataset grouping both 18S and 28S.
4.1.1 Alignment and model choice
Sequences were realigned using the Q-INS-i algorithm in MAFFT (Katoh & Standley, 2013),
that considers the secondary structure of RNA. With 152 taxa, belonging to height different
phyla (Table 2), the final 18S rRNA alignment contained 1952 sites, while the 28S rRNA
dataset that had 140 taxa and 1450 sites. In order to concatenate two datasets, they must contain
the same taxa, therefore, the final concatenated dataset included 76 taxa and 3234 sites (1884
from the 18S partition and 1350 from the 28S partition). Before setting the parameters for the
Bayesian analysis, PAUP* (Swofford, 2003) was used to find the model fitting the data the
best, based on a distance matrix and a neighbour joining tree created from the alignment:
#open the alignment in nexus format
exe [filename].nexus
#create a distance matrix and save it in a text file
savedist format=tabText triangle=both diagonal file=[filename]
#create a neighbour joining tree
nj bionj=yes showtree=yes
#find the best model
automodel ShowParamEst=yes
Results are presented in Table 2.

10
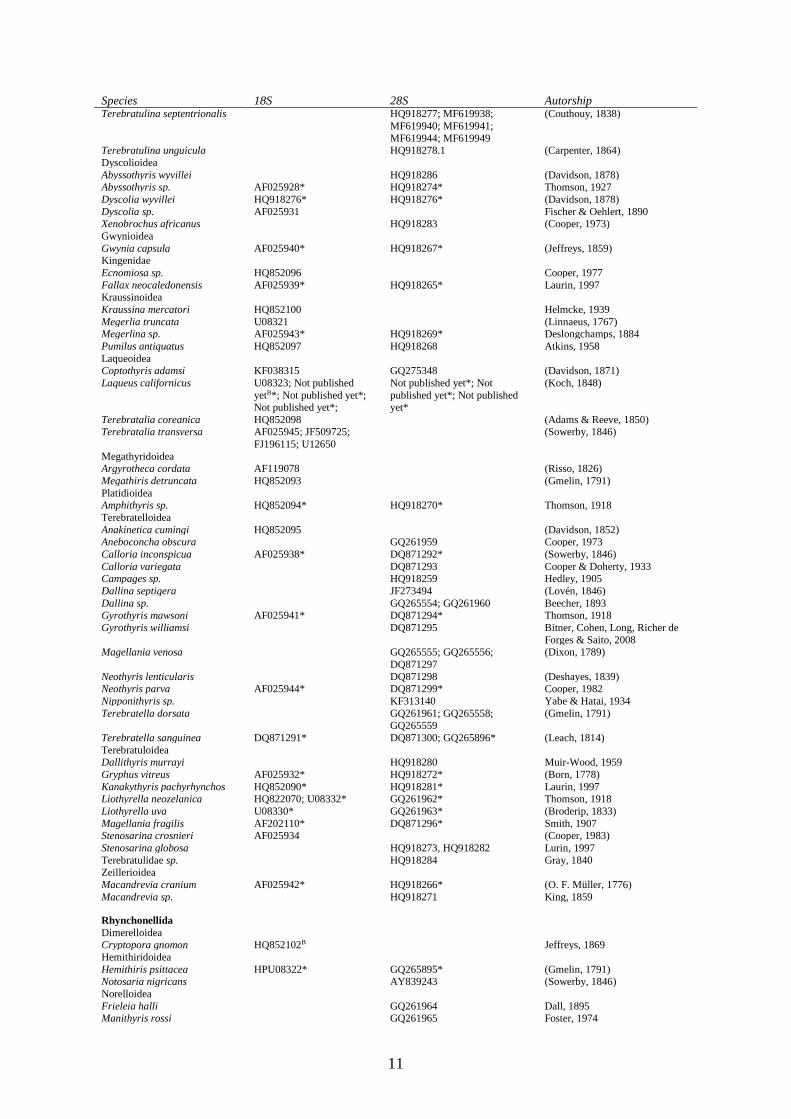
Table 1 Species names, authorship and GenBank accession numbers of taxa included in this rRNA study. If an
asterisk (*) follows a GenBank numbers it indicates that this sequence was used in the concatenated dataset. If
the GenBank accession numbers are followed by a superscripted B (B) or a superscripted R (R), it denotes that
the sequence was only used respectively in the BEAST2 or RAxML analysis.
Species 18S 28S Autorship LINGULIFORMEA
Discinoidea
Discinisca stella
JN415657* Dall, 1871
Discinisca tenuis AY842020*; AF202444
Dall, 1871 Discina striata U08333* JQ414037* (Schumacher, 1817)
Discinisca tenuis U08327
(Sowerby, 1847)
Pelagodiscus atlanticus
JQ414034; JQ414035; JQ414036
(King, 1868)
Linguloidea
Glottidia palmeri AF201744* JN618994* Dall, 1871 Glottidia pyramidata U12647
(Stimpson, 1860)
Lingula adamsi U08329
Dall, 1873
Lingula anatina AB747095; U08331; X81631*
Lamarck, 1801
Lingula reevii AB747096B; AH001678;
LC334155
Davidson, 1880
Lingula rostrum AB855774
(Shaw, 1797)
Lingula sp. Not published yet* Not published yet*, AY839250* Brugière, 1791
CRANIFORMEA
Cranioidea
Neoancistrocrania sp. HQ852066* HQ852082*; HQ852083* Laurin, 1992 Neoancistrocrania norfolki AY842019; HQ852055*;
HQ852057*; HQ852058*
HQ852075*; JX575602* Laurin, 1992
Neocrania anomala DQ279934; U08328
(O. F. Müller, 1776) Neocrania huttoni U08334
(Thomson, 1916)
Novocrania anomala HQ837667* HQ852076* (O. F. Müller, 1776)
Novocrania anomala
HQ852068 (O. F. Müller, 1776) Novocrania huttoni
U08334 (Thomson, 1916)
Novocrania lecointei
JX645243*; JX645254* Lee & Brunton, 2001
Novocrania pourtalesi HQ837658*
Dall, 1871 Novocrania sp. HQ852060*; HQ852065*;
HQ837653*; HQ852061*;
HQ852064; Not published
yet*
HQ852070*; HQ852072*;
HQ852073; HQ852077;
HQ852079; HQ852080;
HQ852084*; HQ852086;
HQ852087; HQ852088;
HQ852089: HQ918260*; JN673266*; JN673267*;
JN985738*; Not published yet*
Lee & Brunton, 2001
RHYNCHONELLIFORMEA
Thecideida
Thecideoidea
Lacazella caribbeanensis KC577459; KC577460;
KC577461; KC577462
Cooper, 1977
Minutella sp. KC577466B
Hoffmann & Lüter, 2010 Ospreyella palauensis KC577456
Logan, 2008
Ospreyella depressa KC577455
Lüter, 2003
Ospreyella sp. KC577451; KC577452; KC577453; KC577454
Lüter & Wörheide, 2003
Pajaudina atlantica KC577457; KC577458
Logan, 1988
Thecidellina japonica KC577465B
(Hayasaka, 1838) Thecidellina williamsi KC577464B
Lüter & Logan, 2008
Thecidellina sp. KC577463B
Thomson, 1915
Terebratulida
Cancellothyroidea
Cancellothyris hedleyi AF025929* HQ918285* (Finlay, 1927) Cancellothyris sp. HQ918285
Thomson, 1926
Chlidonophora sp. HQ822064
Dall, 1903
Chlidonophora sp. AF025930* HQ918275* Dall, 1903 Eucalathis murrayi
JN632510 (Davidson, 1878)
Terebratulina retusa GU125759*; U08324* MF619926; MF619927;
MF619928; MF619930; MF619932; MF619933;
MF619934; MF619935;
MF619936*; MF619937*
(Linnaeus, 1758)
11
Species 18S 28S Autorship Terebratulina septentrionalis
HQ918277; MF619938;
MF619940; MF619941;
MF619944; MF619949
(Couthouy, 1838)
Terebratulina unguicula
HQ918278.1 (Carpenter, 1864)
Dyscolioidea
Abyssothyris wyvillei
HQ918286 (Davidson, 1878) Abyssothyris sp. AF025928* HQ918274* Thomson, 1927
Dyscolia wyvillei HQ918276* HQ918276* (Davidson, 1878)
Dyscolia sp. AF025931
Fischer & Oehlert, 1890 Xenobrochus africanus
HQ918283 (Cooper, 1973)
Gwynioidea
Gwynia capsula AF025940* HQ918267* (Jeffreys, 1859) Kingenidae
Ecnomiosa sp. HQ852096
Cooper, 1977
Fallax neocaledonensis AF025939* HQ918265* Laurin, 1997 Kraussinoidea
Kraussina mercatori HQ852100
Helmcke, 1939
Megerlia truncata U08321
(Linnaeus, 1767) Megerlina sp. AF025943* HQ918269* Deslongchamps, 1884
Pumilus antiquatus HQ852097 HQ918268 Atkins, 1958
Laqueoidea
Coptothyris adamsi KF038315 GQ275348 (Davidson, 1871)
Laqueus californicus U08323; Not published
yetB*; Not published yet*; Not published yet*;
Not published yet*; Not
published yet*; Not published yet*
(Koch, 1848)
Terebratalia coreanica HQ852098
(Adams & Reeve, 1850) Terebratalia transversa AF025945; JF509725;
FJ196115; U12650
(Sowerby, 1846)
Megathyridoidea
Argyrotheca cordata AF119078
(Risso, 1826)
Megathiris detruncata HQ852093
(Gmelin, 1791)
Platidioidea
Amphithyris sp. HQ852094* HQ918270* Thomson, 1918
Terebratelloidea
Anakinetica cumingi HQ852095
(Davidson, 1852) Aneboconcha obscura
GQ261959 Cooper, 1973
Calloria inconspicua AF025938* DQ871292* (Sowerby, 1846)
Calloria variegata
DQ871293 Cooper & Doherty, 1933 Campages sp.
HQ918259 Hedley, 1905
Dallina septigera
JF273494 (Lovén, 1846)
Dallina sp.
GQ265554; GQ261960 Beecher, 1893 Gyrothyris mawsoni AF025941* DQ871294* Thomson, 1918
Gyrothyris williamsi
DQ871295 Bitner, Cohen, Long, Richer de
Forges & Saito, 2008 Magellania venosa
GQ265555; GQ265556;
DQ871297
(Dixon, 1789)
Neothyris lenticularis
DQ871298 (Deshayes, 1839) Neothyris parva AF025944* DQ871299* Cooper, 1982
Nipponithyris sp.
KF313140 Yabe & Hatai, 1934
Terebratella dorsata
GQ261961; GQ265558; GQ265559
(Gmelin, 1791)
Terebratella sanguinea DQ871291* DQ871300; GQ265896* (Leach, 1814)
Terebratuloidea
Dallithyris murrayi
HQ918280 Muir-Wood, 1959
Gryphus vitreus AF025932* HQ918272* (Born, 1778)
Kanakythyris pachyrhynchos HQ852090* HQ918281* Laurin, 1997 Liothyrella neozelanica HQ822070; U08332* GQ261962* Thomson, 1918
Liothyrella uva U08330* GQ261963* (Broderip, 1833)
Magellania fragilis AF202110* DQ871296* Smith, 1907 Stenosarina crosnieri AF025934
(Cooper, 1983)
Stenosarina globosa
HQ918273, HQ918282 Lurin, 1997
Terebratulidae sp.
HQ918284 Gray, 1840 Zeillerioidea
Macandrevia cranium AF025942* HQ918266* (O. F. Müller, 1776)
Macandrevia sp.
HQ918271 King, 1859
Rhynchonellida
Dimerelloidea
Cryptopora gnomon HQ852102B
Jeffreys, 1869
Hemithiridoidea
Hemithiris psittacea HPU08322* GQ265895* (Gmelin, 1791) Notosaria nigricans
AY839243 (Sowerby, 1846)
Norelloidea
Frieleia halli
GQ261964 Dall, 1895 Manithyris rossi
GQ261965 Foster, 1974

12
Species 18S 28S Autorship Neorhynchia sp. AF025937
Thomson, 1915
Parasphenarina cavernicola HQ852101* JQ663539* Motchuro-Dekova, Saito & Endo,
2002 Tethyrhynchia mediterranea HQ852105B* HQ918264* Logan in Logan & Zibrowius,
1994
Pugnacoidea
Acanthobasiliola doederleini HQ852099
(Davidson, 1886)
Basiliola beecheri HQ852103B* HQ918262* (Dall, 1895)
Basiliola lucida HQ852104B* HQ918263* (Gould, 1862) Eohemithiris grayi AF025936* AY839242* (Woodward, 1855)
Brachiopod sp. AF025935
PHORONIDA
Actinotrocha harmeri KC161253; KC161254
Zimmer, 1964
Actinotrocha sp. KC161255
Müller, 1846 Phoronis architecta AF025946* EU334109*
Phoronis australis AF119079; AF202111;
EU334122*; EU334123*; KT030908; KT030909;
KT030910
EU334110; EU334111*;
EU334112*
Haswell, 1883
Phoronis embryolabi
KY643695* Temereva et Chichvarkhin, 2016 Phoronis emigi AB621913
Hirose, Fukiage, Katoh &
Kajihara, 2014
Phoronis hippocrepia AF202112; JF509726; KT030907; U08325
Wright, 1856
Phoronis ijimai AB752304* KY643697*; KY643698* Oka, 1897
Phoronis muelleri EU334125*; KJ193748 EU334114* Selys-Longchamps, 1903 Phoronis ovalis EU334126*; GU125758B EU334115* Wright, 1856
Phoronis pallida EU334127* EU334116* (Schneider, 1862)
Phoronis psammophila U36271
Cori, 1889 Phoronis sp. AB106269*; KT030901*;
KT030903*; KT030904*;
KT030906*
Wright, 1856
Phoronis vancouverensis AY210450; FJ196118
Pixell, 1912
Phoronopsis californica EU334129* EU334118* Hilton, 1930
Phoronopsis harmeri AF123308*; EU334130* EU334119*; EU334120 Pixell, 1912
ANNELIDA
Urechis caupo AF119076R AF342804 Fisher & MacGinitie, 1928 Phascolosoma granulatum X79874R AF519279R Wesenberg-Lund, 1959
Drawida sp.
HQ728964B Michaelsen, 1900
MOLLUSCA
Abra alba AM774533* KC429505* (W. Wood, 1802)
Astarte undata KPD68176* KP068126* Gould, 1841
Chaetoderma sp. MG595728B* AY145397B* Lovén, 1844 Dentalium octangulatum AY145372B* AY145403B* Donovan, 1804
Koreamya arcuata AB907557B; AB907558B;
AB907560B
(A. Adams, 1856)
Koreamya sp. AB907561B
Lützen, Hong & Yamashita,
2009
NEMERTEA
Antarctonemertes riesgoae KF935322R KF935378 Taboada et al., 2013
Micrura fasciolata
HQ856846B Ehrenberg, 1828 Ovicides paralithodis
AB704416 Kajihara & Kuris, 2013
Tubulanus tamias LCO42092R AB854622B Kajihara, Kakui, Yamasaki &
Hiruta, 2015
PLATHYELMINTES
Discocelis tigrina U70078B* MF398475B* (Blanchard, 1847)
Geocentrophora wagini AJ012509B* AY157156B* Timoshkin, 1984
Neoheterocotyle rhinobatidis
AF348361B (Young, 1967)
Stenostomum leucops FJ384804B* AY157151B* (Duges, 1828)
BRYOZOA
Favosipora rosea FJ409605B* FJ409581B* Gordon & Taylor, 2001
Fredericella sultana JN680926B* JN681029B* Blumenbach, 1779 Pectinatella magnifica
FJ409576B (Leidy, 1851)
Plumatella emarginata KC461939B* KC462025B* Allmann, 1844
ROTIFERA
Lecane bulla DQ297698B* AY829083B* (Gosse, 1851)
Notommata sp. DQ297710B* DQ297748B* Ehrenberg, 1830 Sinantherina socialis AY210451B* AY210471B* (Linnaeus, 1758)
13
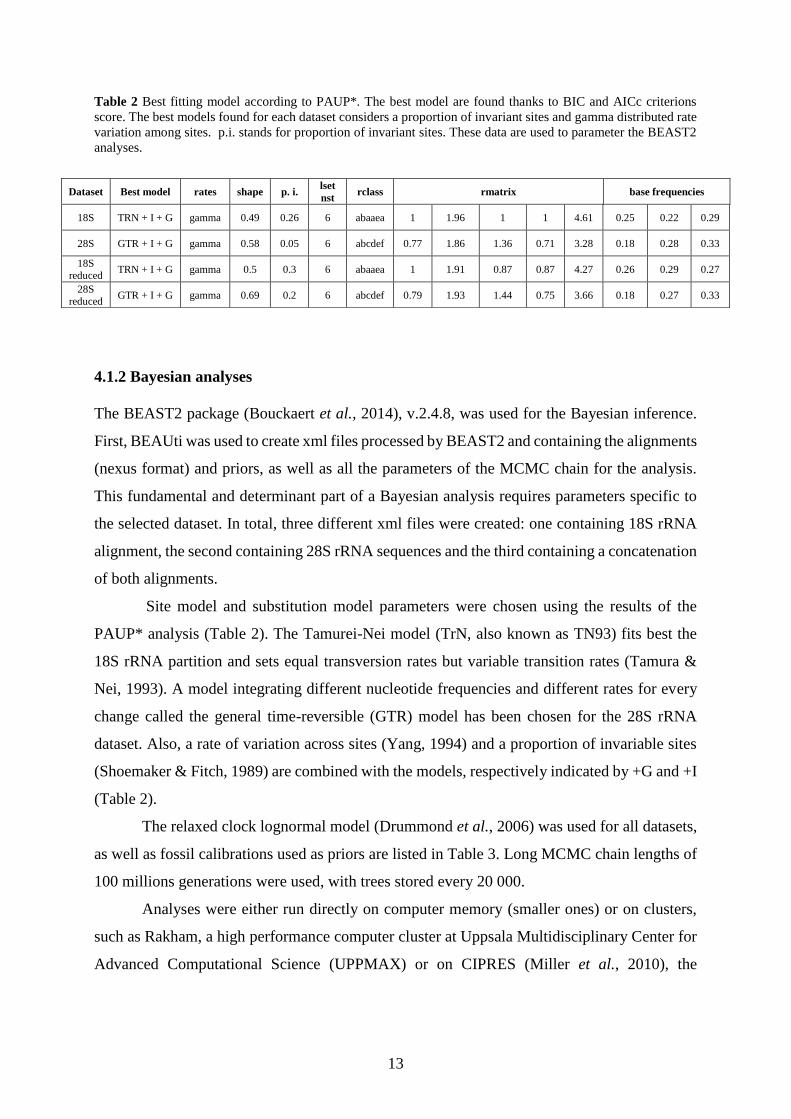
Table 2 Best fitting model according to PAUP*. The best model are found thanks to BIC and AICc criterions
score. The best models found for each dataset considers a proportion of invariant sites and gamma distributed rate
variation among sites. p.i. stands for proportion of invariant sites. These data are used to parameter the BEAST2
analyses.
4.1.2 Bayesian analyses
The BEAST2 package (Bouckaert et al., 2014), v.2.4.8, was used for the Bayesian inference.
First, BEAUti was used to create xml files processed by BEAST2 and containing the alignments
(nexus format) and priors, as well as all the parameters of the MCMC chain for the analysis.
This fundamental and determinant part of a Bayesian analysis requires parameters specific to
the selected dataset. In total, three different xml files were created: one containing 18S rRNA
alignment, the second containing 28S rRNA sequences and the third containing a concatenation
of both alignments.
Site model and substitution model parameters were chosen using the results of the
PAUP* analysis (Table 2). The Tamurei-Nei model (TrN, also known as TN93) fits best the
18S rRNA partition and sets equal transversion rates but variable transition rates (Tamura &
Nei, 1993). A model integrating different nucleotide frequencies and different rates for every
change called the general time-reversible (GTR) model has been chosen for the 28S rRNA
dataset. Also, a rate of variation across sites (Yang, 1994) and a proportion of invariable sites
(Shoemaker & Fitch, 1989) are combined with the models, respectively indicated by +G and +I
(Table 2).
The relaxed clock lognormal model (Drummond et al., 2006) was used for all datasets,
as well as fossil calibrations used as priors are listed in Table 3. Long MCMC chain lengths of
100 millions generations were used, with trees stored every 20 000.
Analyses were either run directly on computer memory (smaller ones) or on clusters,
such as Rakham, a high performance computer cluster at Uppsala Multidisciplinary Center for
Advanced Computational Science (UPPMAX) or on CIPRES (Miller et al., 2010), the
Dataset Best model rates shape p. i. lset
nst rclass rmatrix base frequencies
18S TRN + I + G gamma 0.49 0.26 6 abaaea 1 1.96 1 1 4.61 0.25 0.22 0.29
28S GTR + I + G gamma 0.58 0.05 6 abcdef 0.77 1.86 1.36 0.71 3.28 0.18 0.28 0.33
18S reduced
TRN + I + G gamma 0.5 0.3 6 abaaea 1 1.91 0.87 0.87 4.27 0.26 0.29 0.27
28S reduced
GTR + I + G gamma 0.69 0.2 6 abcdef 0.79 1.93 1.44 0.75 3.66 0.18 0.27 0.33
14
Cyberinfrastructure for Phylogenetic Research. To launch analyses on UPPMAX, bash scripts
are created following this structure:
#!/bin/bash #SBATCH -A [project-name] #SBATCH -p [partition-used] -n [number-of-nodes] #SBATCH -t D-HH:MM:SS #SBATCH --mail-user=[email] #SBATCH --mail-type=ALL #SBATCH -J [job name] #SBATCH -o [output file name] #SBATCH -e [error file name]
module load [ necessary modules for the analysis] java -jar [jar file of the program and its directory] -
overwrite [input file and its directory]
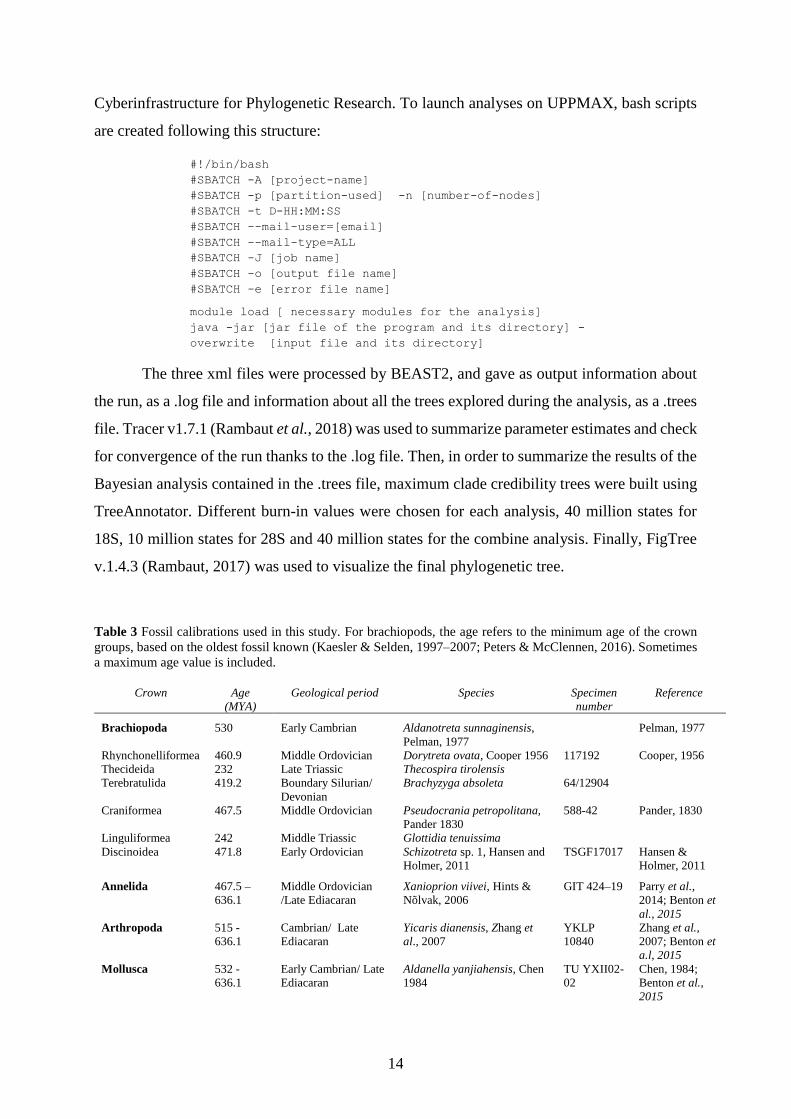
The three xml files were processed by BEAST2, and gave as output information about
the run, as a .log file and information about all the trees explored during the analysis, as a .trees
file. Tracer v1.7.1 (Rambaut et al., 2018) was used to summarize parameter estimates and check
for convergence of the run thanks to the .log file. Then, in order to summarize the results of the
Bayesian analysis contained in the .trees file, maximum clade credibility trees were built using
TreeAnnotator. Different burn-in values were chosen for each analysis, 40 million states for
18S, 10 million states for 28S and 40 million states for the combine analysis. Finally, FigTree
v.1.4.3 (Rambaut, 2017) was used to visualize the final phylogenetic tree.
Table 3 Fossil calibrations used in this study. For brachiopods, the age refers to the minimum age of the crown
groups, based on the oldest fossil known (Kaesler & Selden, 1997–2007; Peters & McClennen, 2016). Sometimes
a maximum age value is included.
Crown Age
(MYA)
Geological period Species Specimen
number
Reference
Brachiopoda 530 Early Cambrian Aldanotreta sunnaginensis,
Pelman, 1977
Pelman, 1977
Rhynchonelliformea 460.9 Middle Ordovician Dorytreta ovata, Cooper 1956 117192 Cooper, 1956
Thecideida 232 Late Triassic Thecospira tirolensis
Terebratulida 419.2 Boundary Silurian/
Devonian
Brachyzyga absoleta 64/12904
Craniformea 467.5 Middle Ordovician Pseudocrania petropolitana,
Pander 1830
588-42 Pander, 1830
Linguliformea 242 Middle Triassic Glottidia tenuissima
Discinoidea 471.8 Early Ordovician Schizotreta sp. 1, Hansen and
Holmer, 2011
TSGF17017 Hansen &
Holmer, 2011
Annelida 467.5 –
636.1
Middle Ordovician
/Late Ediacaran
Xanioprion viivei, Hints &
Nõlvak, 2006
GIT 424–19 Parry et al.,
2014; Benton et
al., 2015
Arthropoda 515 -
636.1
Cambrian/ Late
Ediacaran
Yicaris dianensis, Zhang et
al., 2007
YKLP
10840
Zhang et al.,
2007; Benton et
a.l, 2015
Mollusca 532 -
636.1
Early Cambrian/ Late
Ediacaran
Aldanella yanjiahensis, Chen
1984
TU YXII02-
02
Chen, 1984;
Benton et al.,
2015

15
4.1.3 RAxML analysis
Similarly to the Bayesian inference, three Maximum Likelihood analyses were launched, and
support values for the phylogenetic trees were calculated using bootstrap, a method that asseses
the confidence in a statistical analysis by producing random, pseudoreplicate datasets and
analysing each of them to see how often a specific result is obtained (Baum & Smith, 2013). A
RAxML (Stamatakis, 2014) command combining a message passing interface (MPI) and
threads for parallelization was used in CIPRES:
raxmlHPC-HYBRID -T 4 -n [result file] -s [input file] -m [GTRCAT] -p 12345 -f a -N
1000 -x 12345 --asc-corr lewis
This command set 1000 rapid bootstrap replicates, with 12345 informing on the random seed
value guaranteeing compatibility between runs. The standard ascertainment bias correction
Lewis is chosen. The final best ML tree was drawn in FigTree with bootstrap values plotted.
4.2 Phylogenomic analyses
For these analyses, our own new transcriptome data (n=13) were clustered with published (n=5)
and ortholog genes from Kocot et al. (2016) across Lophotrochozoa, known as the LB106 gene
subset (n=106). The latter are protein coding metabolic genes, which were corrected for
heterogeneous evolutionary rates and were analysed as individual partitions. The full
phylogenomic matrix consisted of 103 taxa with 75% matrix occupancy, and 22 000 amino acid
sites.
4.2.1 Dataset and model choice
The final dataset used for the study was reduced, which considerably decreased the computation
time of the analysis. Preferably, taxa with a poor fossil record were removed from the analysis.
Sequences used for the phylogenomic analyses are summarized in the Table 4. The best fitting
evolutionary model for this dataset, LG, was determined using PartitionFinder (Lanfear et al.,
2017). This empirical model for amino acid substitution and gamma model of rate heterogeneity
accounts for variability of evolutionary rates across sites.
16
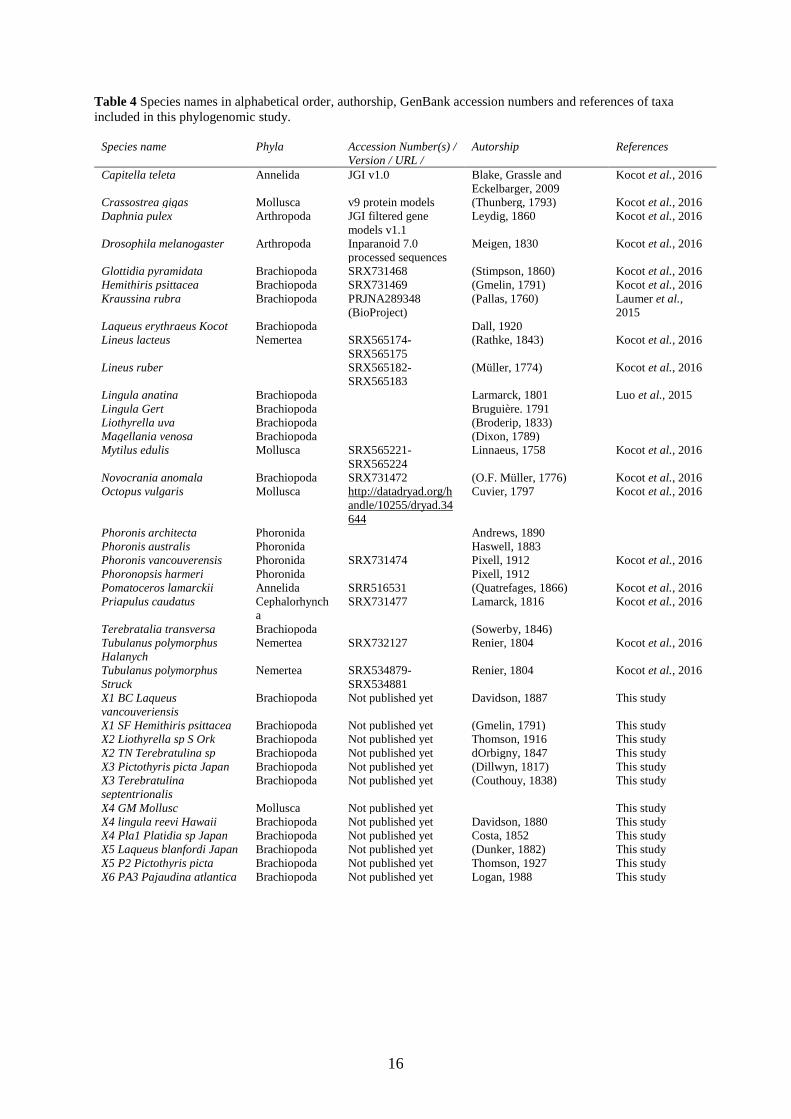
Table 4 Species names in alphabetical order, authorship, GenBank accession numbers and references of taxa
included in this phylogenomic study.
Species name Phyla Accession Number(s) /
Version / URL /
Autorship References
Capitella teleta Annelida JGI v1.0 Blake, Grassle and
Eckelbarger, 2009
Kocot et al., 2016
Crassostrea gigas Mollusca v9 protein models (Thunberg, 1793) Kocot et al., 2016
Daphnia pulex Arthropoda JGI filtered gene
models v1.1
Leydig, 1860 Kocot et al., 2016
Drosophila melanogaster Arthropoda Inparanoid 7.0
processed sequences
Meigen, 1830 Kocot et al., 2016
Glottidia pyramidata Brachiopoda SRX731468 (Stimpson, 1860) Kocot et al., 2016
Hemithiris psittacea Brachiopoda SRX731469 (Gmelin, 1791) Kocot et al., 2016
Kraussina rubra Brachiopoda PRJNA289348
(BioProject)
(Pallas, 1760) Laumer et al.,
2015
Laqueus erythraeus Kocot Brachiopoda Dall, 1920
Lineus lacteus Nemertea SRX565174-
SRX565175
(Rathke, 1843) Kocot et al., 2016
Lineus ruber SRX565182-
SRX565183
(Müller, 1774) Kocot et al., 2016
Lingula anatina Brachiopoda Larmarck, 1801 Luo et al., 2015
Lingula Gert Brachiopoda Bruguière. 1791
Liothyrella uva Brachiopoda (Broderip, 1833)
Magellania venosa Brachiopoda (Dixon, 1789)
Mytilus edulis Mollusca SRX565221-
SRX565224
Linnaeus, 1758 Kocot et al., 2016
Novocrania anomala Brachiopoda SRX731472 (O.F. Müller, 1776) Kocot et al., 2016
Octopus vulgaris Mollusca http://datadryad.org/h
andle/10255/dryad.34
644
Cuvier, 1797 Kocot et al., 2016
Phoronis architecta Phoronida Andrews, 1890
Phoronis australis Phoronida Haswell, 1883
Phoronis vancouverensis Phoronida SRX731474 Pixell, 1912 Kocot et al., 2016
Phoronopsis harmeri Phoronida Pixell, 1912
Pomatoceros lamarckii Annelida SRR516531 (Quatrefages, 1866) Kocot et al., 2016
Priapulus caudatus Cephalorhynch
a
SRX731477 Lamarck, 1816 Kocot et al., 2016
Terebratalia transversa Brachiopoda (Sowerby, 1846)
Tubulanus polymorphus
Halanych
Nemertea SRX732127 Renier, 1804 Kocot et al., 2016
Tubulanus polymorphus
Struck
Nemertea SRX534879-
SRX534881
Renier, 1804 Kocot et al., 2016
X1 BC Laqueus
vancouveriensis
Brachiopoda Not published yet Davidson, 1887 This study
X1 SF Hemithiris psittacea Brachiopoda Not published yet (Gmelin, 1791) This study
X2 Liothyrella sp S Ork Brachiopoda Not published yet Thomson, 1916 This study
X2 TN Terebratulina sp Brachiopoda Not published yet dOrbigny, 1847 This study
X3 Pictothyris picta Japan Brachiopoda Not published yet (Dillwyn, 1817) This study
X3 Terebratulina
septentrionalis
Brachiopoda Not published yet (Couthouy, 1838) This study
X4 GM Mollusc Mollusca Not published yet This study
X4 lingula reevi Hawaii Brachiopoda Not published yet Davidson, 1880 This study
X4 Pla1 Platidia sp Japan Brachiopoda Not published yet Costa, 1852 This study
X5 Laqueus blanfordi Japan Brachiopoda Not published yet (Dunker, 1882) This study
X5 P2 Pictothyris picta Brachiopoda Not published yet Thomson, 1927 This study
X6 PA3 Pajaudina atlantica Brachiopoda Not published yet Logan, 1988 This study
17
4.2.2 RAxML analysis
Maximum Likelihood analysis of complete and reduced taxon sets were undertaken, using the
-CAT-LG ProtGamma model and substitution amino matrix. To find a single best tree, 350
rapid bootstrap replicates and subsequent thorough ML were done. Similarly to the rRNA
datasets, a RAxML version combining a message passing interface and threads for
parallelization was used:
raxmlHPC-HYBRID_8.2.12_comet -s infile -n result -q partition -k -f a -N 350 -p
12345 -x 12345 -m PROTCATLG
Alternatively to the LG empirical model, another ML analysis was carried out using
Dayhoff recoding (Dayhoff, 1978), which consists of separating the amino acids in six groups
with distinct biochemical properties. This recoding process is used to reduce the effects of
substitution saturation and compositional heterogeneity (Hrdy et al., 2004). The highest
likelihood trees and their corresponding bootstrap values were drawn in FigTree.
4.2.3 Bayesian inference for phylogenetic reconstruction
The Bayesian analysis was performed using the CAT-GTR model (Lartillot & Philippe, 2004)
implemented in PhyloBayes (Lartillot & Philippe, 2004 and 2006; Lartillot et al., 2007). This
model is particularly adapted for amino acid alignments as it accounts for site-specific features
of protein evolution. The PhyloBayes analysis were run on Stanford’s cluster Sherlock, using
a bash script:
mpirun -n [number of processes running in parallel] pb_mpi -d [alignment in PHYLIP
format] -cat -gtr [chain name]
Convergence of the chain was controlled using bpcomp and tracecomp programs
implemented in PhyloBayes. The readpb program produced output summarizing files, such
as a majority-rule posterior consensus tree.
4.2.4 Bayesian inference for molecular dating
Molecular dating in PhyloBayes requires a fixed tree topology. From this tree topology and by
specifying the outgroups to root the tree, information related to calibration can be added to a
new analysis to obtain the divergence time. The computation time for these two analyses

18
(topology and molecular dating) in PhyloBayes was longer than the time frame of this thesis.
For this reason, the molecular dating analysis was run using the BEAST2 package, utilizing the
majority-rule posterior consensus tree from PhyloBayes as starting tree. This calibration
analysis was run with the reduced dataset containing the transcriptomes of 38 taxa, the same
sequences used for the Bayesian inference for phylogenetic reconstruction.
The gamma site model was used, with substitution rate, shape and proportion of
invariant estimated. The Dayhoff substitution model was used as it was the most similar model
option implemented in BEAST2 to the CAT-GTR model. The relaxed clock lognormal model
was set and the clock rate was estimated. The birth-death model was used, and fossil
calibrations were added as originate, hence, giving information on the divergence time of this
clade from his sister clade. An MCMC chain of 100 million generation was set, with trees saved
every 15000 generations.
5 Results
5.1 rRNA datasets
5.1.1 Topology
The three maximum clade credibility trees have been rooted using the phyla most genetically
distant from brachiopods in our dataset, Rotifera. The rotifer Sinantherina socialis was set as
the outgroup. Analysing the 18S rRNA and the concatenated dataset, all the phyla are resolved
as monophyletic. However, within the Brachiopoda, Linguliformea is only monophyletic in the
tree resulting from the Bayesian analysis of the 18S rRNA dataset (Fig. 2). The RAxML tree
has a very low support at its basal nodes, such as a bootstrap support (BS) of only 23 for the
node splitting Brachiopoda from Urechis caupo, a Polychaeta. The 28S rRNA tree depicts a
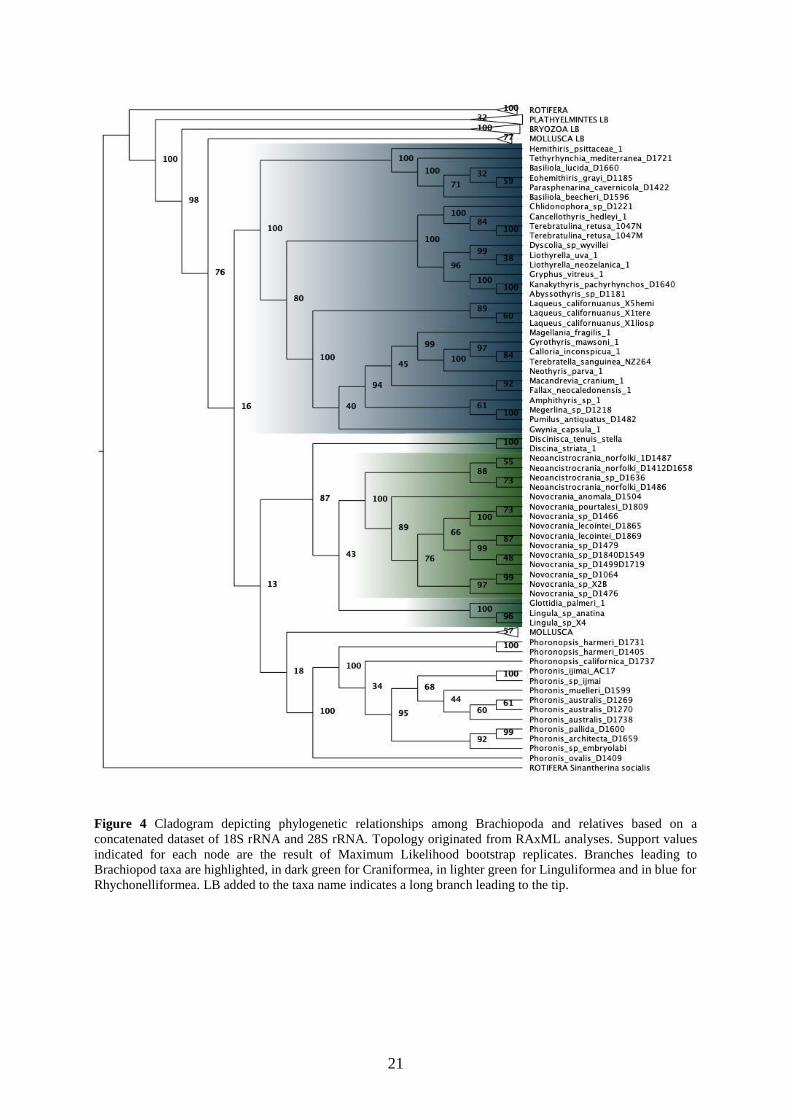
different topology, resolving Brachiopoda as polyphyletic (Fig. 3). Contrary to the rRNA
dataset, the support value are high all over the tree. The polyphyletic of Brachiopoda is fully
supported by the bootstrap replicates. The concatenated dataset depicts the same evolutionary
history as 28S (Fig. 4). However, the polyphyly of Brachiopoda is poorly supported by the
bootstrap replicates. Interestingly, in all the RAxML analyses, Linguliformea are depicted as
polyphyletic.

19
Figure 2 Cladogram depicting phylogenetic relationships among Brachiopoda and relatives based on 18S rRNA.
Originated from RAxML analyses. Support values indicated for each node are the result of Maximum Likelihood
bootstrap replicates. Branches leading to Brachiopod taxa are highlighted, in dark green for Craniformea, in lighter
green for Linguliformea and in blue for Rhychonelliformea. LB added to the taxa name indicates a long branch
leading to the tip

20
Figure 3 Cladogram depicting phylogenetic relationships among Brachiopoda and relatives based on 28S rRNA.
Topology originated from RAxML analyses. Support values indicated for each node are the result of Maximum
Likelihood bootstrap replicates. Branches leading to Brachiopod taxa are highlighted, in dark green for
Craniformea, in lighter green for Linguliformea and in blue for Rhychonelliformea.
21
Figure 4 Cladogram depicting phylogenetic relationships among Brachiopoda and relatives based on a
concatenated dataset of 18S rRNA and 28S rRNA. Topology originated from RAxML analyses. Support values
indicated for each node are the result of Maximum Likelihood bootstrap replicates. Branches leading to
Brachiopod taxa are highlighted, in dark green for Craniformea, in lighter green for Linguliformea and in blue for
Rhychonelliformea. LB added to the taxa name indicates a long branch leading to the tip.
22
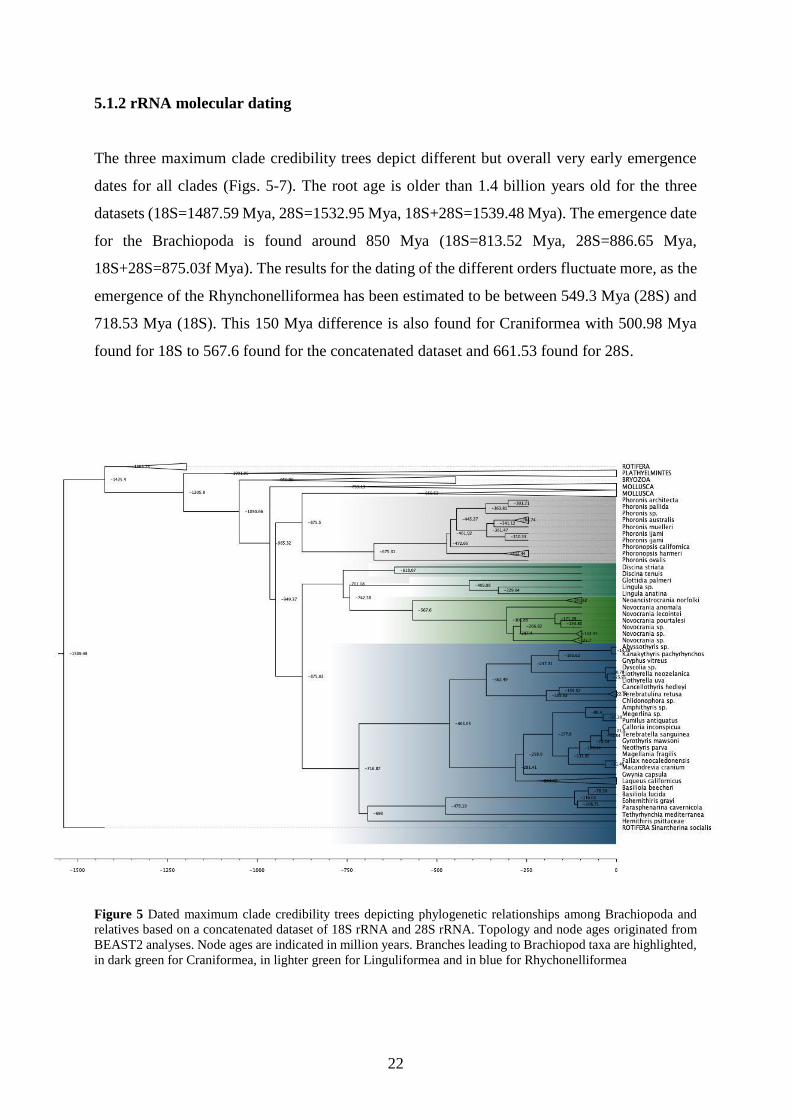
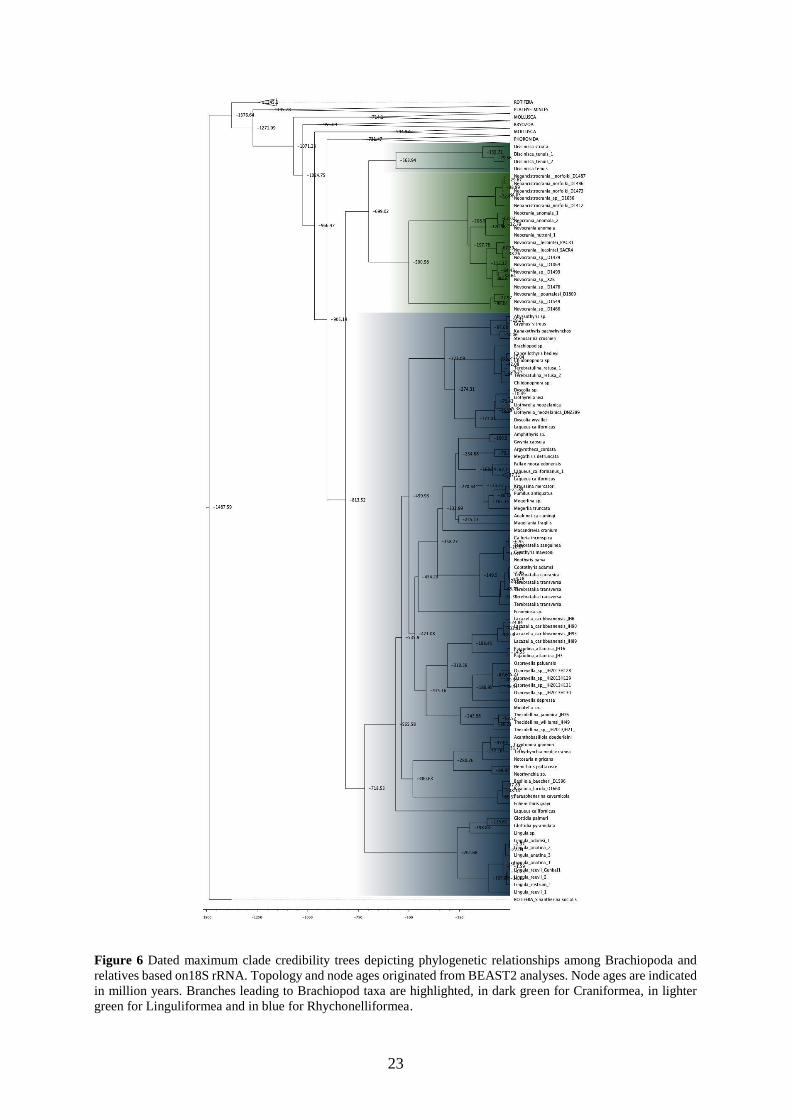
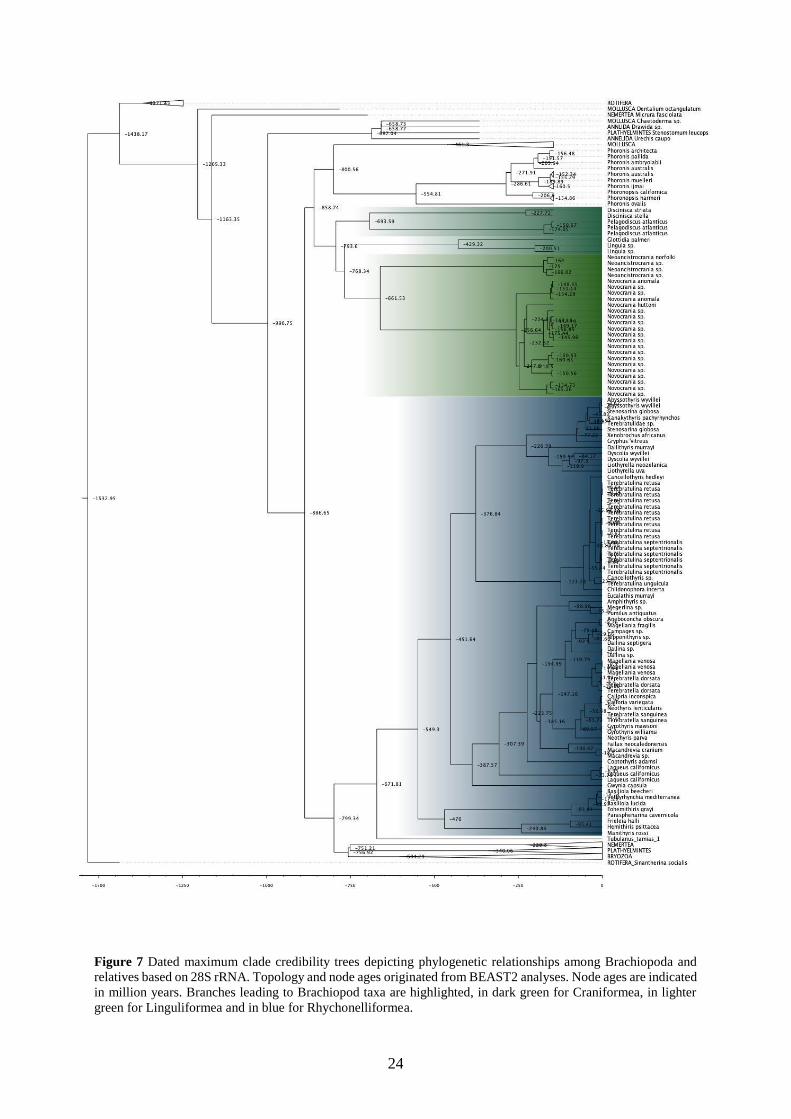
5.1.2 rRNA molecular dating
The three maximum clade credibility trees depict different but overall very early emergence
dates for all clades (Figs. 5-7). The root age is older than 1.4 billion years old for the three
datasets (18S=1487.59 Mya, 28S=1532.95 Mya, 18S+28S=1539.48 Mya). The emergence date
for the Brachiopoda is found around 850 Mya (18S=813.52 Mya, 28S=886.65 Mya,
18S+28S=875.03f Mya). The results for the dating of the different orders fluctuate more, as the
emergence of the Rhynchonelliformea has been estimated to be between 549.3 Mya (28S) and
718.53 Mya (18S). This 150 Mya difference is also found for Craniformea with 500.98 Mya
found for 18S to 567.6 found for the concatenated dataset and 661.53 found for 28S.
Figure 5 Dated maximum clade credibility trees depicting phylogenetic relationships among Brachiopoda and
relatives based on a concatenated dataset of 18S rRNA and 28S rRNA. Topology and node ages originated from
BEAST2 analyses. Node ages are indicated in million years. Branches leading to Brachiopod taxa are highlighted,
in dark green for Craniformea, in lighter green for Linguliformea and in blue for Rhychonelliformea
23
Figure 6 Dated maximum clade credibility trees depicting phylogenetic relationships among Brachiopoda and
relatives based on18S rRNA. Topology and node ages originated from BEAST2 analyses. Node ages are indicated
in million years. Branches leading to Brachiopod taxa are highlighted, in dark green for Craniformea, in lighter
green for Linguliformea and in blue for Rhychonelliformea.
24
Figure 7 Dated maximum clade credibility trees depicting phylogenetic relationships among Brachiopoda and
relatives based on 28S rRNA. Topology and node ages originated from BEAST2 analyses. Node ages are indicated
in million years. Branches leading to Brachiopod taxa are highlighted, in dark green for Craniformea, in lighter
green for Linguliformea and in blue for Rhychonelliformea.
25
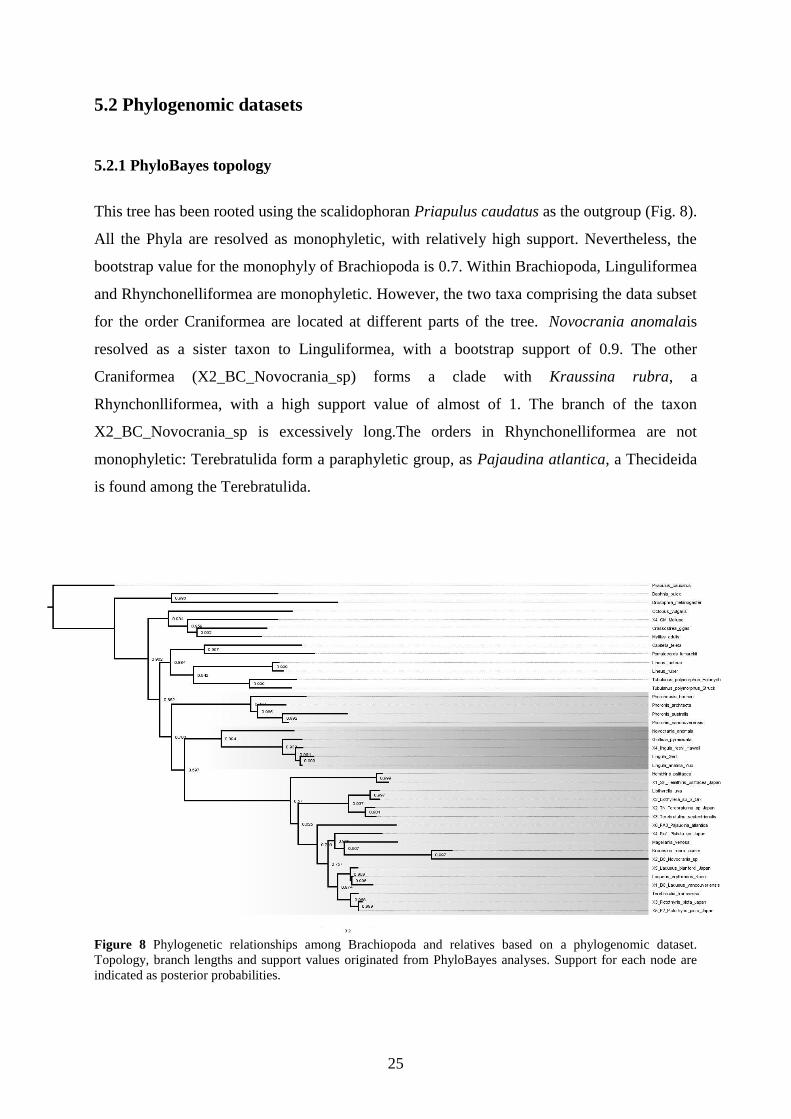
5.2 Phylogenomic datasets
5.2.1 PhyloBayes topology
This tree has been rooted using the scalidophoran Priapulus caudatus as the outgroup (Fig. 8).
All the Phyla are resolved as monophyletic, with relatively high support. Nevertheless, the
bootstrap value for the monophyly of Brachiopoda is 0.7. Within Brachiopoda, Linguliformea
and Rhynchonelliformea are monophyletic. However, the two taxa comprising the data subset
for the order Craniformea are located at different parts of the tree. Novocrania anomalais
resolved as a sister taxon to Linguliformea, with a bootstrap support of 0.9. The other
Craniformea (X2_BC_Novocrania_sp) forms a clade with Kraussina rubra, a
Rhynchonlliformea, with a high support value of almost of 1. The branch of the taxon
X2_BC_Novocrania_sp is excessively long.The orders in Rhynchonelliformea are not
monophyletic: Terebratulida form a paraphyletic group, as Pajaudina atlantica, a Thecideida
is found among the Terebratulida.
Figure 8 Phylogenetic relationships among Brachiopoda and relatives based on a phylogenomic dataset.
Topology, branch lengths and support values originated from PhyloBayes analyses. Support for each node are
indicated as posterior probabilities.
26
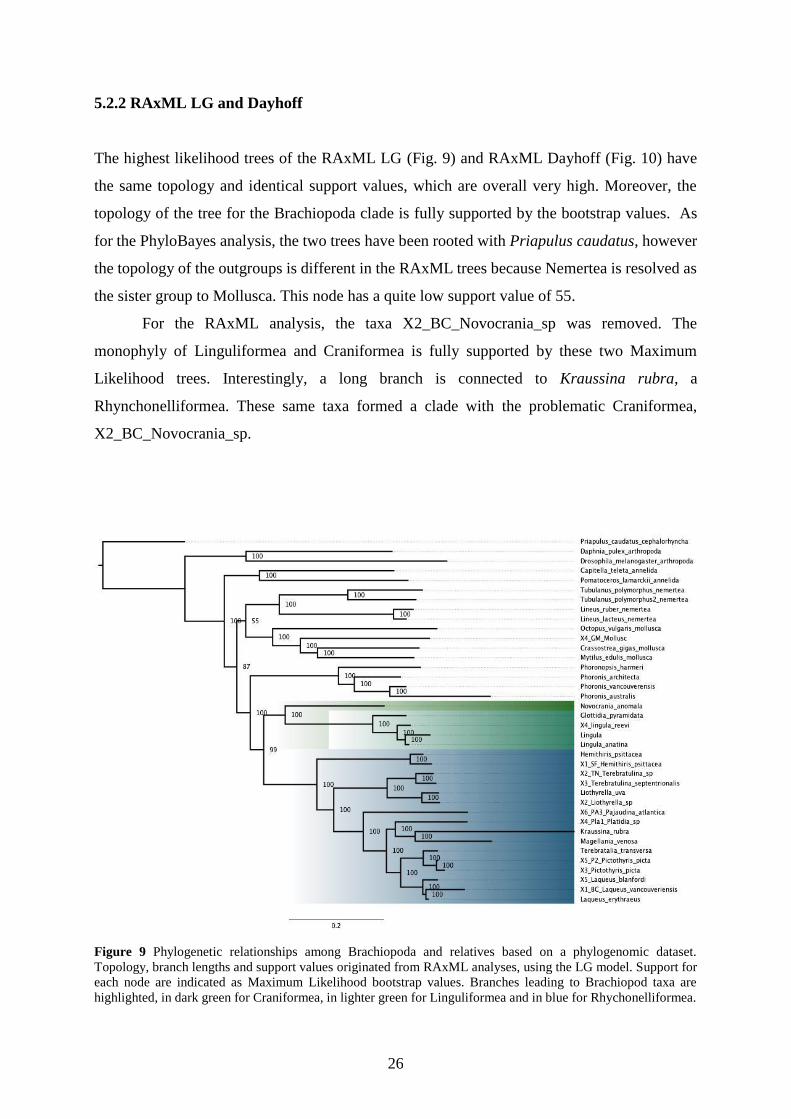
5.2.2 RAxML LG and Dayhoff
The highest likelihood trees of the RAxML LG (Fig. 9) and RAxML Dayhoff (Fig. 10) have
the same topology and identical support values, which are overall very high. Moreover, the
topology of the tree for the Brachiopoda clade is fully supported by the bootstrap values. As
for the PhyloBayes analysis, the two trees have been rooted with Priapulus caudatus, however
the topology of the outgroups is different in the RAxML trees because Nemertea is resolved as
the sister group to Mollusca. This node has a quite low support value of 55.
For the RAxML analysis, the taxa X2_BC_Novocrania_sp was removed. The
monophyly of Linguliformea and Craniformea is fully supported by these two Maximum
Likelihood trees. Interestingly, a long branch is connected to Kraussina rubra, a
Rhynchonelliformea. These same taxa formed a clade with the problematic Craniformea,
X2_BC_Novocrania_sp.
Figure 9 Phylogenetic relationships among Brachiopoda and relatives based on a phylogenomic dataset.
Topology, branch lengths and support values originated from RAxML analyses, using the LG model. Support for
each node are indicated as Maximum Likelihood bootstrap values. Branches leading to Brachiopod taxa are
highlighted, in dark green for Craniformea, in lighter green for Linguliformea and in blue for Rhychonelliformea.
27
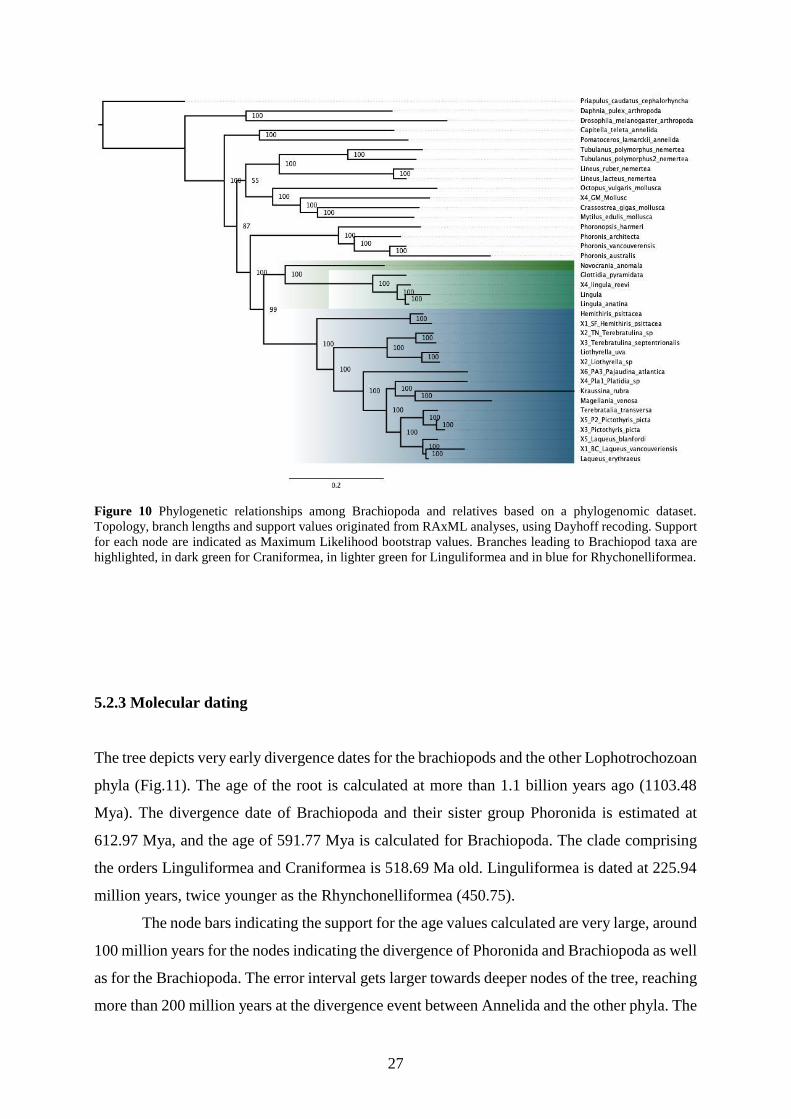
Figure 10 Phylogenetic relationships among Brachiopoda and relatives based on a phylogenomic dataset.
Topology, branch lengths and support values originated from RAxML analyses, using Dayhoff recoding. Support
for each node are indicated as Maximum Likelihood bootstrap values. Branches leading to Brachiopod taxa are
highlighted, in dark green for Craniformea, in lighter green for Linguliformea and in blue for Rhychonelliformea.
5.2.3 Molecular dating
The tree depicts very early divergence dates for the brachiopods and the other Lophotrochozoan
phyla (Fig.11). The age of the root is calculated at more than 1.1 billion years ago (1103.48
Mya). The divergence date of Brachiopoda and their sister group Phoronida is estimated at
612.97 Mya, and the age of 591.77 Mya is calculated for Brachiopoda. The clade comprising
the orders Linguliformea and Craniformea is 518.69 Ma old. Linguliformea is dated at 225.94
million years, twice younger as the Rhynchonelliformea (450.75).
The node bars indicating the support for the age values calculated are very large, around
100 million years for the nodes indicating the divergence of Phoronida and Brachiopoda as well
as for the Brachiopoda. The error interval gets larger towards deeper nodes of the tree, reaching
more than 200 million years at the divergence event between Annelida and the other phyla. The

28
younger nodes do not have however, greater support. For example, the Liothyrella uva and
Liothyrella sp. speciation event is set at 70.86 Mya but the error bars indicate 95% confidence
interval of 150 Ma.
Figure 11 Dated maximum clade credibility trees depicting phylogenetic relationships among Brachiopoda and
relatives based on a phylogenomic dataset. Topology, branch lengths and node ages originated from BEAST2
analyses. Node ages are indicated in million years, and 95% confidence intervals are drawn for each nodes as blue
bars.Branches leading to Brachiopod taxa are highlighted, in dark green for Craniformea, in lighter green for
Linguliformea and in blue for Rhychonelliformea.
.

29
6 Discussion
6.1 Limitations of rRNA datasets in Brachiopod phylogenetics
In phylogenetic studies, rRNA datasets are a powerful tool for analysing the evolutionary
relationships of the Metazoa, such as identifying the phylogenetic position of particular clades
(e.g. Halanych et al.,1995). In our study, using rRNA datasets, various topologies (monophyly
or polyphyly) for the Brachiopoda have been obtained through Maximum Likelihood and
Bayesian analyses. The analyses of the 18S dataset (Fig. 2 and Fig. 6) resolved the Brachiopoda
as monophyletic. Within the Brachiopoda the suborder Linguliformea is polyphyletic, while the
other two suborders Craniformea and Rhynchonelliformea are monophyletic. However, due to
the low support values calculated for the majority of the internal nodes of this tree (Fig. 2), this
topology should not be considered valid.
When using 28S rRNA and the concatenated dataset (18S rRNA and 28S rRNA),
depicting Brachiopoda as polyphyletic, with a low bootstrap value for the concatenated dataset
but fully supported topology in the 28S analysis (Fig. 3 and Fig. 4). In previous studies, 18S
and 28S rRNA have also been used to investigate Brachiopoda and Lophotrochozoan
relationships (e.g. Cohen, 2000; Cohen and Weydmann, 2005; Passamaneck et al., 2006),
where similar topologies were found and deemed inaccurate. The combined dataset (18S and
28S) resolved brachiopods as polyphyletic. A first work resolved Brachiopoda and Phoronida
as a monophyletic group (Cohen and Weydmann, 2005), while another found this Phylum
nested between Phoronida, Mollusca and Annelida (Passamaneck et al., 2006). Nevertheless,
these results were due to a lack of phylogenetic signal and later disputed (e.g. Sperling et
al.,2011; Kocot et al., 2017). However, the Brachiopoda were resolved as monophyletic when
systematic error is considered, and a sufficient phylogenetic signal is ensured. Systematic errors
due to, for example, the heterogeneity of nucleotide composition and rate variation across
lineages (Som, 2014), can be corrected by using appropriate models, increasing or changing the
taxa sampling and removing fast evolving genes. Moreover, several indices have been
developed to test and quantify the phylogenetic signal (Münkemüller et al., 2012).
Thus, the results obtained in this study are consistent with previous observations from
rRNA analyses. Our results corroborate the lack of phylogenetic signal in ribosomal gene data,
making them inappropriate for phylogenetic analyses. In addition, unusually long branch
lengths have been recovered in our phylogenetic trees for some taxa (especially for the
outgroups Platyhelmintes, Annelida, Bryozoa and Mollusca (Fig. 2 and Fig. 4)). This introduces

30
the problem of the phylogenetic tree building artefacts known as long-branch attraction (LBA,
Hendy and Penny, 1989). This pattern occurs when higher evolutionary rates occur in few
branches, grouping the descendants of these branches in a clade, even if these are unrelated
(Baum & Smith, 2013). Such LBA artefacts impact the topology of the tree and have
consequence on the depicted evolutionary history. Nevertheless, solutions exist to suppress
LBA, such as removing problematic taxa or even adding closely related taxa to break long
branches. Also make sure to use fitting evolutionary models before analysis and carefully
selecting genetic markers prior to the sequencing ensure minimization of the LBA effects.
6.2 BEAST2: a problematic dating methodology
Using the phylogenomic dataset, a well-supported topology (Figs. 8, 9 and 10) and a dated
phylogenetic tree have been generated (Fig. 11). However, unrealistic dating values were
obtained for the basal nodes of the tree, if we consider the extensive fossil record of the
Brachiopoda. Dating the molecular phylogeny of the Brachiopoda using the software package
BEAST2 has shown its limitations in this work.
At the current state of the study, a dated tree has been produced, but we still cannot
accurately study the early rate of evolution of the Brachiopoda using rRNA and phylogenomic
data with the methodologies developed for BEAST2. The results obtained for all datasets,
including single rRNA datasets, concatenated S18 and S28 rRNA and phylogenomic material,
are in disagreement with the extensive fossil record of the Brachiopoda and the early Metazoa
and cannot be trusted. Values obtained reach dates of over 1 billion years for the divergence
node between the Priapulida and the other Protostome taxa included in the phylogenomic study.
The fossil record can provide useful insight for the validity of the results obtained by studies
focused on molecular data (phylogenomics, rRNA). For instance, the controversial oldest
protostome Kimberella (Fedonkin et al., 1997) has been dated between 550.25 and 636.1 Ma
but has been used as a calibration point for previous studies (e.g. Benton et al., 2015).
When setting calibration points for the Brachiopoda through their fossil record at 530
Ma, the posterior dating result estimates the age of the clade at 591 Ma. As for all the fossil
calibrations, the posterior ages were always estimated as relatively older to the parameters set
prior to the analysis. It seems here that BEAST2 always overestimated the ages, indicating large
error bars but a discrepancy of 50 Ma is indication that the methodology can potentially be
useful with further analysis and appropriate parameters.

31
I attempted to replicate the study from Lee et al. (2013), without success, as this analysis
was launched in a previous version of BEAST that is no longer available today (Drummond et
al., 2012). Being able to replicate this previous work would have been useful to fully
comprehend the process of molecular dating in BEAST2.
It is very likely that our results are impacted by incorrectly set priors, and more
specifically time priors. The software used for molecular dating is quite complex to adjust and
get accurate results from. The validity of the results also depends on very specific priors for
each dataset. Even though parameters set for the study were chosen because of their
consistency, the analyses might have been wrongly calibrated. It is surprising that posterior
dating values vary that much to the fossil calibration priors set for the study (Table 3). The
likelihood that issues with the prior parameters are what is producing perturbations in our
models is further reinforced by the fact that significant time and computational power was
required to obtain a convergence of the run i.e. for the posterior parameters of the analysis to
reach stable values. A considerably high amount of MCMC (Markov chain Monte Carlo) runs
were chosen (100 millions) as well as high burn-in values (up to 40%, i.e.40 millions) were set
to compute the maximum clade credibility tree. Several studies put emphasis on the impact of
uncertainties of prior calibrations to the validity of the posterior probabilities obtained (e.g.
Warnock et al., 2014; Guindon, 2018). Fossil calibration is a delicate task that requires full
control of the parameters and extra care for the calibration of the priors.
6.3 Future studies
The phylogenomic dataset analysis resulted in well supported trees, especially after removing
one problematic Craniformea causing LBA artifacts (e.g. X2_BC_Novocrania_sp, containing
a great proportion of missing data). Using a reduced LB106 dataset added resolution to the final
phylogenetic tree. The full dataset was composed with several low occupancy taxa, adding
uncertainties to the final study result. However, future studies should include several
Discinoidea taxa, to finally include specimen samples from every brachiopod order. We will be
able to study more in detail the relationships among this phylum and will be able to add fossil
calibrations in shallower nodes.
With the current methodology, it was not possible without further investigation to
discard or corroborate the hypothesis of fast evolutionary rates in early Brachiopod evolution.
Nevertheless, this hypothesis will be later tested using other software. For example, MCMCtree

32
(dos Reis and Yang, 2019), also using molecular clock models combined with soft fossil
constraints to obtain species divergence time could be used to compare results with BEAST2.
It would also be very interesting to investigate the result of a PhyloBayes molecular dating
analysis, as this software uses other substitution models and requires setting fewer parameters
and constraints.
Additionally, morphological data should be taken into consideration and further utilised
in dating and calibrating phylogenomic studies (e.g. tip dating). These could be used to infer
the validity of phylogenetic trees. And lastly, morphological evolution can later be mapped on
the molecular tree, as a total evidence type study (Eernisse et al., 2013).
7 Conclusion
For the time being, this study has encountered some limitations of BEAST2 to investigate
brachiopod evolutionary history. As correct estimations of early rates of evolution are only
possible by means of correctly dated trees, further study will be required to clarify, as has been
shown for the Arthropoda (Lee et al., 2013), the effect of the Push of the Past in the evolution
of the Brachiopod phylum. While accurate dating methodologies still need to be determined,
promising, well-supported results for a Brachiopod phylogeny have been obtained in this work.
The results obtained reinforce the value of using phylogenomic data in phylogenetic analyses.
8 Acknowledgments
I would like to thank Aodhàn Butler and Graham Budd for this opportunity. You have always
been available when I needed help and advice and I really appreciated that you always were so
positive. Thanks for trusting me with this project.
I also would especially like to thank Anneli, Bobby, Diem, Gianni, Jenni, Katerina and Raquel
for everything they did for me during this thesis. Your presence, advice and friendship have
helped me to chill and feel more confident.
I would also like to thank many people from systbio. Thank you Iker and Martin for your help
with bioinformatics, thank you Mikael and Petra for the fun and thank you Nahid for caring so
much.
I am also grateful to my opponents Eliott Capel and Michael Streng, who came up with
interesting comments on my work. Moerover, fewer results would have been presented without
the Stanford University and the Stanford Research Computing Center which provided
computational resources and support that contributed to these research results.
Enfin, merci à ma famille pour leur soutien indéfectible.

33
8 References
Akaike, H. (1974). A new look at the statistical model identification. In: Selected Papers of
Hirotugu Akaike. Springer, New York, NY, pp. 215-222.
Baum, D. A., & Smith, S. D. (2013). Tree thinking: an introduction to phylogenetic biology.
Greenwood Village (CO): Roberts.
Benson, D. A., Karsch-Mizrachi, I., Lipman, D. J., Ostell, J. & Sayers, E. W. (2008). GenBank.
Nucleic acids research, vol. 37, pp. D26-D31. DOI: 10.1093/nar/gkn723.
Benton, M. J., Donoghue, P. C. J., Asher, R. A., Friedman, M., Near, T. J. & Vinther, J. (2015).
Constraints on the timescale of animal evolutionary history. Palaeontologia Electronica,
18.1.1FC. DOI : 10.26879/424.
Bouckaert, R., Heled, J., Kühnert, D., Vaughan, T., Wu, C-H., Xie, D., Suchard, M. A.,
Rambaut, A., & Drummond, A. J. (2014). BEAST 2: A Software Platform for Bayesian
Evolutionary Analysis. PLoS Computational Biology, vol. 10.
DOI:10.1371/journal.pcbi.1003537.
Brusca., R. C., Moore, W., & Shuster, S. M. (2016). Invertebrates. 3rd ed. Sunderland.
Budd, G. E., & Jensen, S. (2000). A critical reappraisal of the fossil record of the bilaterian
phyla. Biological Reviews, vol. 75, pp. 253-295. DOI: 10.1017/S000632310000548X.
Budd, G. E., & Mann, R. P. (2018). History is written by the victors: The effect of the push of
the past on the fossil record. Evolution, vol. 72, pp. 2276-2291. DOI:10.1111/evo.13593.
Carlson, S. J. (2016). The evolution of Brachiopoda. Annual Review of Earth and Planetary
Sciences, vol. 44, pp. 409-438. DOI: 10.1146/annurev-earth-060115-012348.
Chen, P. (1984). Discovery of lower Cambrian small shelly fossils from Jijiapo, Yichang, West
Hubei and its significance (in Chinese). Professional Papers of Stratigraphy and
Palaeontology, vol. 13, pp. 49-64.
Cohen, B. L. (2000). Monophyly of brachiopods and phoronids: reconciliation of molecular
evidence with Linnaean classification (the subphylum Phoroniformea nov.). Proceedings of the
Royal Society B: Biological Sciences, vol. 267, pp. 225–231. DOI: 10.1098/rspb.2000.0991.
Cohen, B. L. & Weydmann A. (2005). Molecular evidence that phoronids are a subtaxon of
brachiopods (Brachiopoda: Phoronata) and that genetic divergence of metazoan phyla began
long before the early Cambrian. Organisms Diversity & Evolutio., vol. 5, pp. 253–273. DOI:
10.1016/j.ode.2004.12.002.
Cooper, G. A. (1956). Chazyan and related brachiopods. Smithsonian Miscellaneous
Collections, vol. 127, pp. 1-1024.
Darwin, C. (1987). Charles Darwin's notebooks, 1836-1844: geology, transmutation of species,
metaphysical enquiries. Ed. Paul H. Barrett et al. Ithaca, NY, Cornell University Press.
34
Dayhoff, N. O. (1978) in Dayhoff, N.O. (ed.) Atlas of protein sequences and structure, In Vol
5, suppl. 3. National Biomedical Research Foundation, Washington DC, pp. 345-352.
dos Reis, M. & Yang, Z. (2019). Bayesian molecular clock dating using genome- scale datasets.
In: Anisimova M (ed.) Evolutionary Genomics: Statistical and Computational Methods,
Springer (in press).
Drummond, A. J., Ho, S. Y., Phillips, M. J. & Rambaut, A. (2006). Relaxed phylogenetics and
dating with confidence. PLoS Biology, vol. 4 (5). DOI:10.1371/journal.pbio.0040088.
Drummond, A. J., Suchard, M. A., Xie, D., and Rambaut, A. (2012). Bayesian phylogenetics
with BEAUti and the BEAST 1.7. Molecular Biology and Evolution, vol. 29, 1969–1973.
Dunn, C. W., Giribet, G., Edgecombe, G. D. & Hejnol, A. (2014). Animal phylogeny and its
evolutionary implications. Annual review of ecology, evolution, and systematics, vol. 45, pp.
371-395. DOI: 10.1146/annurev-ecolsys-120213-091627.
Eddy, S. R. & the HMMER development team. (2018). HMMer Software. Version 3.2.1.
Available: http://hmmer.org.
Eernisse, D. J., & Kluge, A. G. (1993). Taxonomic congruence versus total evidence, and
amniote phylogeny inferred from fossils, molecules, and morphology. Molecular Biology and
Evolution, vol. 10, pp. 1170-1195. DOI: 10.1093/oxfordjournals.molbev.a040071.
Ekman, T. (1896). Beiträge zur kenntnis des stieles der Brachiopoden. Zeitschrift für
wissenschaftliche Zoologie, vol. 6, pp. 169-249.
Erwin, D. H. (1993). The great Paleozoic crisis: life and death in the Permian. Columbia
University Press.
Fan, L., Raychowdhury, R., Zeng, Q., Chen, Z., Mauceli, E., Hacohen, N., Gnirke, A., Rhind,
N., di Palma, F., Birren, B. W., Nusbaum, C., Lindblad-Toh, K., Friedman, N. & Regev, A.
(2011). Full-length transcriptome assembly from RNA-seq data without a reference genome.
Nature Biotechnology, vol. 29, pp. 644-652. DOI: 10.1038/nbt.1883.
Fedonkin, M. A. & Waggoner, B. M. (1997). The Late Precambrian fossil Kimberella is a
mollusk-like bilaterian organism. Nature, vol. 338, pp. 868-871.
Foote, M. & Sepkoski, J. J. (1999). Absolute measures of the completeness of the fossil record.
Nature, vol. 398, pp. 415-417.
Grabherr, M. G., Haas, B .J., Yassour, M., Levin, J. Z., Thompson, D. A., Amit, I., Adiconis,
X., Eernisse, D. J., Albert, J. S. & Anderson, F. E. (1992). Annelida and Arthropoda are not
sister taxa: a phylogenetic analysis of Spiralian metazoan morphology. Systematic Biology, vol.
41, pp. 305-330. DOI: 10.2307/2992569
Giribet, G. (2008). Assembling the lophotrochozoan (= spiralian) tree of life. Philosophical
Transactions of the Royal Society B: Biological Sciences, vol. 363, pp. 1513-1522. DOI:
10.1098/rstb.2007.2241.

35
Gould, S., & Calloway, C. (1980). Clams and Brachiopods-Ships that Pass in the
Night. Paleobiology, vol. 6, pp. 383-396. DOI: 10.1017/S0094837300003572.
Guindon, S. (2018). Accounting for calibration uncertainty: Bayesian molecular dating as a
“doubly intractable” problem. Systematic Biology, pp. 651-661. DOI: 10.1093/sysbio/syy003
Halanych, K. M., Bacheller, J. D., Aguinaldo, A. M., Liva, S. M., Hillis, D. M. & Lake, J. A.
(1995). Evidence from 18S ribosomal DNA that the Lophophorates are protostome animals.
Science, vol. 267, pp. 1641-1643. DOI: 10.1126/science.7886451.
Hansen, H. and Holmer, L. E. (2011). Taxonomy and biostratigraphy of Ordovician
brachiopods from northeastern Ny Friesland, Spitsbergen. Zootaxa, vol. 3076, pp. 1-122.
Hausdorf, B., Helmkampf, M., Meyer, A., Witek, A., Herlyn, H., Bruchhaus, I., Hankeln, T.,
Struck, T. H. & Lieb, B. (2007). Spiralian phylogenomics supports the resurrection of Bryozoa
comprising Ectoprocta and Entoprocta. Molecular Biology and Evolution, vol. 24 , pp. 2723-
2729. DOI: 10.1093/molbev/msm214.
Hejnol, A., Obst, M., Stamatakis, A., Ott, M., Rouse, G. W., Edgecombe, G. D., Martinez, P.,
Baguñà, J., Bailly, X., Jondelius, U., Wiens, M., Müller, W. E., Seaver, E., Wheeler, W. C.,
Martindale, M. Q., Giribet, G. & Dunn, C. W. (2009). Assessing the root of bilaterian animals
with scalable phylogenomic methods. Proceedings of the Royal Society B: Biological
Sciences, vol. 276, pp. 4261-4270. DOI: 10.1098/rspb.2009.0896.
Hendy, M. D. & Penny, D. (1989). A framework for the quantitative study of evolutionary trees.
Systematic Zoology, vol. 38, pp. 297-309. DOI: 10.2307/2992396.
Hrdy, I., Hirt, R. P., Dolezal, P., Bardonová, L., Foster, P. G., Tachezy, J. & Embley, T. M.
(2004). Trichomonas hydrogenosomes contain the NADH dehydrogenase module of
mitochondrial complex I. Nature, vol. 432, pp. 618-621.
Hull, P. M., Norris, R. D., Bralower, T. J., & Schueth, J. D. (2011). A role for chance in marine
recovery from the end-Cretaceous extinction. Nature Geoscience, vol. 4, pp. 856–860.
Jukes, T. H. & Cantor, C. R. (1969). Evolution of Protein Molecules. New York: Academic
Press. pp. 21–132.
Kaesler, R. L., Selden, P. A., eds 1997-2007. Treatise on Invertebrate Paleontology, Part H
(Revised): Brachiopoda, Vols 1-6. Boulder, CO/Lawrence, KS: Geol. Soc. Am./Univ. Kansas.
Katoh, K. & Standley, D. M. (2013). MAFFT Multiple Sequence Alignment Software Version
7: Improvements in Performance and Usability. Molecular Biology and Evolution, vol. 30, pp.
772-780. DOI: 10.1093/molbev/mst010.
Kocot, K. M., Struck, T. H., Merkel, J., Waits, D. S., Todt, C., Brannock, P. M., Weese, D. A.,
Cannon J. T., Moroz, L. L., Lieb, B. & Halanych, K. M. (2017). Phylogenomics of
Lophotrochozoa with consideration of systematic error. Systematic Biology, vol. 66, pp. 256-
282. DOI: 10.1093/sysbio/syw079.
36
Lamarck, J. B. P. A. (1809). Philosophical zoology: An exposition with regard to the natural
history of animals. Chicago, Chicago, EEUU.
Lanfear, R., Frandsen, P. B., Wright, A. M., Senfeld, T. & Calcott B. (2017). PartitionFinder 2:
New Methods for Selecting Partitioned Models of Evolution for Molecular and Morphological
Phylogenetic Analyses. Molecular Biology and Evolution, vol. 34, pp. 772-773. DOI:
10.1093/molbev/msw260.
Lartillot, N. & Philippe, H. (2004). A bayesian mixture model for across-site heterogeneities in
the amino-acid replacement process. Molecular Biology and Evolution. vol. 21, pp. 1095-1109.
DOI:10.1093/molbev/msh112.
Lartillot, N. & Philippe, H. (2006). Computing Bayes factors using thermodynamic integration.
Systematic Biology, vol. 55, pp. 195-307. DOI: 10.1080/10635150500433722.
Lartillot, N., Brinkmann, H. & Philippe, H. (2007). Suppression of long-branch attraction
artefacts in the animal phylogeny using a site-heterogeneous model. BMC Evolutionary
Biology, vol. 7. DOI: 10.1186/1471-2148-7-S1-S4.
Laumer, C. E., Bekkouche, N., Kerbl, A., Goetz, F., Neves, R. C., Sørensen, M. V., Kristensen,
R.M., Hejnol, A., Dunn, C.W., Giribet, G. & Worsaae, K. (2015). Spiralian phylogeny informs
the evolution of microscopic lineages. Current Biology, vol. 25, pp. 2000-2006. DOI:
10.1016/j.cub.2017.11.026
Lee, M. S. Y., Soubrier J. & Edgecombe, G. D. (2013). Rates of Phenotypic and Genomic
Evolution during the Cambrian Explosion. Current Biology, vol. 23, pp. 1889-1895. DOI:
10.1016/j.cub.2013.07.055.
Lee, M. S. & Ho, S. Y. (2016). Molecular clocks. Current Biology, vol. 26, pp. 399-402.
Lyell, C. (1832). The Principles of Geology (Vol. 3). London: Murray.
Miller, M. A., Pfeiffer, W., & Schwartz, T. (2010). Creating the CIPRES Science Gateway for
inference of large phylogenetic trees. In 2010 Gateway Computing Environments workshop
(GCE), pp. 1-8. DOI: 10.1109/GCE.2010.5676129.
Morris, S. C. (1989). Burgess Shale faunas and the Cambrian explosion. Science, vol. 24, pp.
339-346. DOI: 10.1126/science.246.4928.339.
Münkemüller, T., Lavergne, S., Bzeznik, B., Dray, S., Jombart, T., Schiffers, K., & Thuiller,
W. (2012). How to measure and test phylogenetic signal. Methods in Ecology and Evolution,
vol. 3, pp. 743-756. DOI: 10.1111/j.2041-210X.2012.00196.
Nee, S., May, R. M., & Harvey, P. H. (1994). The reconstructed evolutionary
process. Philosophical Transactions of the Royal Society of London. Series B: Biological
Sciences, vol. 344, pp. 305-311.
Nesnidal, M. P., Helmkampf, M., Meyer, A., Witek, A., Bruchhaus, I., Ebersberger, I., Hankeln,
T., Lieb, B., Struck, T. H. & Hausdorf, B. (2013). New phylogenomic data support the
37
monophyly of Lophophorata and an Ectoproct-Phoronid clade and indicate that Polyzoa and
Kryptrochozoa are caused by systematic bias. BMC evolutionary biology, vol. 13 (253).
Pander, C. H. (1830). Beitrage zur Geognosie des Russischen Reiches. St. Petersburg.
Pauling, L., Zuckerkandl, E., & Henriksen, T. (1963). Chemical paleogenetics. Acta Chemica
Scandinavica, vol. 17, pp. 9-16.
Parry, L., Tanner, A. & Vinther, J. (2014). The origin of annelids. Palaeontology, vol. 57, pp.
1091-1103. DOI: 10.1111/pala.12129.
Passamaneck, Y. J. & Halanych, K. M. 2006. Lophotrochozoan phylogeny assessed with LSU
and SSU data: evidence of lophophorate polyphyly. Molecular Phylogenetics and Evolution,
vol. 40, pp. 20–28. DOI: 10.1016/j.ympev.2006.02.001.
Pelman, Y. L. (1977). Early and Middle Cambrian inarticulate brachiopods of the Siberian
Platform. Trudy Instituta Geologii i Geofiziki, Sibirskoe Otdelenie, vol. 316, pp. 1-168.
Peters, S. E. & McClennen, M. (2016). The Paleobiology Database application programming
interface. Paleobiology, vol. 42, pp. 1-7. DOI: 10.1017/pab.2015.39.
Rambaut, A. (2017). FigTree-version 1.4. 3, a graphical viewer of phylogenetic trees.
Rambaut, A., Drummond, A. J., Xie, D., Baele, G., & Suchard, M. A. (2018). Posterior
summarization in Bayesian phylogenetics using Tracer 1.7. Systematic biology, vol. 67, pp.
901-904. DOI: 10.1093/sysbio/syy032.
Schram, F. (1991). Cladistic analysis of metazoan phyla and athe placement of fossil
problematica. In: Simonetta, A. M. & Conway-Morris, S. (ed.) The Early Evolution of Metazoa
and the Significance of Problematic Taxa. UK: Cambridge University Press, pp. 35-46
Schwarz, G. (1978). Estimating the dimension of a model. The Annals of Statistics, vol. 6, pp.
461-464.
Shoemaker, J. S. & Fitch, W. M. (1989). Evidence from nuclear sequences that invariable sites
should be considered when sequence divergence is calculated. Molecular Biology and
Evolution, vol. 6, pp. 270–289. DOI: 10.1093/oxfordjournals.molbev.a040550.
Som, A. (2014). Causes, consequences and solutions of phylogenetic incongruence. Briefings
in Bioinformatics, vol. 16, pp. 536-548. DOI: 10.1093/bib/bbu015.
Sperling, E. A., Pisani, D., & Peterson, K. J. (2011). Molecular paleobiological insights into
the origin of the Brachiopoda. Evolution & development, vol. 13, pp. 290-303. DOI:
10.1111/j.1525-142X.2011.00480.
Stamatakis, A. (2014). RAxML Version 8: A tool for Phylogenetic Analysis and Post-Analysis
of Large Phylogenies. Bioinformatics, vol. 30, pp. 1312-1313. DOI:
10.1093/bioinformatics/btu033.
38
Swofford, D. L. (2003). PAUP*. Phylogenetic Analysis Using Parsimony (*and Other
Methods). Version 4. Sinauer Associates, Sunderland, Massachusetts.
Tamura, K. & Nei, M. (1993). Estimation of the number of nucleotide substitutions in the
control region of mitochondrial DNA in humans and chimpanzees. Molecular Biology and
Evolution, vol. 10, pp. 512-526. DOI: 10.1093/oxfordjournals.molbev.a040023.
Tavaré, S. (1986). Some probabilistic and statistical problems in the analysis of DNA. Lectures
on Mathematics in the Life Sciences, vol. 17, pp. 57–86.
Thayer, C. W. (1985). Brachiopods versus mussels: competition, predation, and
palatability. Science, vol. 228, pp. 1527-1528. DOI: 10.1126/science.228.4707.1527.
Valentine, J. W., & Jablonski, D. (1983). Larval adaptations and patterns of brachiopod
diversity in space and time. Evolution, vol. 37, pp. 1052-1061. DOI: 10.1111/j.1558-
5646.1983.tb05632.x.
Warnock, R. C., Parham, J. F., Joyce, W. G., Lyson, T. R., & Donoghue, P. C. (2015).
Calibration uncertainty in molecular dating analyses: there is no substitute for the prior
evaluation of time priors. Proceedings of the Royal Society B: Biological Sciences, vol. 282,
pp. DOI: 10.1098/rspb.2014.1013.
Waterhouse, R. M., Seppey, M., Simão, F.A., Manni, M., Ioannidis, P., Guennadi, K.,
Kriventseva, E. V. & Evgeny M. Zdobnov, E. M. (2017). BUSCO applications from quality
assessments to gene prediction and phylogenomics. Molecular Biology and Evolution, vol. 35,
pp. 543-548. DOI: 10.1093/molbev/msx319.
Wilke, T., Schultheiß, R., & Albrecht, C. (2009). As time goes by: a simple fool's guide to
molecular clock approaches in invertebrates. American Malacological Bulletin, vol. 27, pp. 25-
46. DOI: 10.4003/006.027.0203
Yang, Z. (1994). Maximum likelihood phylogenetic estimation from DNA sequences with
variable rates over sites: approximate methods. Journal of Molecular Evolution, vol. 39, pp.
306-314.
Zhang, X.G., Siveter, D.J., Waloszek, D. & Maas, A. (2007). An epipodite-bearing crown-
group crustacean from the Lower Cambrian. Nature, vol. 449, pp. 595-598. DOI:
10.1038/nature06138

39
APPENDIX: Methodological background
Collection, RNA extraction and sequencing.
After world-wide collection of specimens, whole brachiopods and tissues were preserved and
protected in RNAlater at -20°C or -80°C, before being processed with an Invitrogen RNAqueous
Micro Total RNA isolation kit. RNA was isolated and separated using silica centrifuge spin
columns and purified using LiCl precipitation with a DNAse digestion step. The quality of the
resulting RNA extract (quantification of RNA extraction amount and purity) was controlled
using a NanoDrop spectrophotometer. Finally, cDNA libraries were created from raw mRNA
by polyA selection and sequencing of 5-6 taxa was done using Illumina HiSeq 2500 lane with
50-60 million read depth coverage each.
Assembly of transcriptomes and phylogenomic matrix
As few reference genomes are available for Lingulida, transcriptomes were created using de-
novo transcriptome assembly protocols. Illumina Hiseq 2500 paired short reads were assembled
using Trinity assembly software (Grabherr et al., 2011) at Stanford’s Sherlock cluster and at
Ludwig-Maximilians-Universität München (LMU). Data quality checks and standard
sequences statistics, conversion of sequenced nucleic acids to amino acid were carried out using
BUSCO gene set (Waterhouse et al., 2017). An ortholog gene set from a pre-existing multi-
gene alignment (Kocot et al. 2016) was used to search for orthologs in new brachiopods
sequences. Using a custom python script (https://github.com/wrf/supermatrix), Hidden
Markov Model searches (HMMs) were generated using HMMer software (Eddy et al., 2018)
for each gene partition in the phylogenomic matrix. Using a sequence similarity threshold,
transcriptomes were successively analysed for matches. Then, trimmed matching sequences
were aligned using MAFFT (Katoh & Standley, 2013), and overhanging aligned sections were
trimmed to preserve the alignment length. The resulting single matrix and partition file output
were saved in FASTA format and were then ready for phylogenetic analysis.


Examensarbete vid Institutionen för geovetenskaper ISSN 1650-6553