estimating the need for fp/rh service providers in malawi
TRANSCRIPT

Estimating the Need for Family Planning/ Reproductive Health Service Providers in Malawi JHP-23
P r e p a r e d b y
John A. McGrath, MACatherine Schenck-Yglesias, MHS
Maryjane Lacoste, MA
March 2004
United States Agency for International Development
t e c h n i c a l r e p o r t

CREDITS Editor: Roxana C. Del Barco Production Assistance: Deborah Raynor Copyright 2004 by JHPIEGO Corporation. All rights reserved.
JHPIEGO, an affiliate of Johns Hopkins University, builds global and local partnerships to enhance the quality of health care services for women and families around the world. JHPIEGO is a global leader in the creation of innovative and effective approaches to developing human resources for health.
ACKNOWLEDGMENTS
This report was produced through the efforts of the Malawi Ministry of Health and Population (MOHP) Reproductive Health Unit (RHU), and JHPIEGO, relying on expert opinion and data from a variety of sources: ♦ MOHP Planning Unit
♦ The Nurses and Midwives Council of Malawi
♦ Christian Health Association of Malawi (CHAM) Training Institutions
♦ Kamuzu College of Nursing (KCON)
♦ Malawi College of Health Sciences (MCHS)
Special thanks go to Jane Namasasu for guidance in determining the focus of the research. James Gondwe provided valuable assistance in data collection in support of this report. We are grateful to the RHU and other key participants in the Family Planning/Reproductive Health (FP/RH) Projections Update Workshop (March, 2003), who, with the assistance of Shawn Aldridge (Research Triangle Institute [RTI]) developed the demographic and family planning (FP) projections that formed the background for the current human resources study. Shawn Aldridge (RTI) and Deborah Estep (JHPIEGO) provided additional support in adapting the 33-year demographic/FP projection (1982–2015) to the shortened period (2001–2007) used in the present study. We also thank John Stover (The Futures Group International [TFGI]) for his continued support of the ProTrain modeling software. Robert McKinnon and Shayne Capers (both of TFGI) provided software-programming support to complete the current study. We would also like to express our gratitude to the United States Agency for International Development (USAID)/Malawi for their support of this work.
TRADEMARKS: All brand and product names are trademarks or registered trademarks of their respective companies. Norplant® is the registered trademark of the Population Council for subdermal levonorgestrel implants. This publication was made possible through support provided by the Service Delivery Improvement Division, Office of Population and Reproductive Health, Bureau for Global Health, U.S. Agency for International Development, under the terms of Award No. HRN-A-00-98-00041-00. The opinions expressed herein are those of JHPIEGO and do not necessarily reflect the views of the U.S. Agency for International Development. Printed March 2004


JHPIEGO Technical Report i
TABLE OF CONTENTS
LIST OF TABLES AND FIGURES ............................................................................................... ii
ABBREVIATIONS AND ACRONYMS ........................................................................................ iii
EXECUTIVE SUMMARY ..............................................................................................................v
BACKGROUND............................................................................................................................1
METHODS ....................................................................................................................................1 Demography (DemProj) and Family Planning (FamPlan) Models ....................................1 ProTrain Model..................................................................................................................4
DATA AND ASSUMPTIONS........................................................................................................5 Family Planning Personnel 2001 ......................................................................................5 Retention Rate ..................................................................................................................6 Preservice and Inservice Training in FP Method Provision in Malawi...............................7 Competency at Completion of Training.............................................................................9 Percentage of Graduates Entering Family Planning .........................................................9 Minutes Per Procedure/Service ......................................................................................10 Percentage of Time Spent in Family Planning Services .................................................10
FINDINGS...................................................................................................................................12 Projections ......................................................................................................................12
DISCUSSION..............................................................................................................................19
CONCLUSION............................................................................................................................20
RECOMMENDATIONS ..............................................................................................................21
REFERENCES ...........................................................................................................................22
APPENDIX FP/RH Projections Update Workshop Inputs and Assumptions Data (March 11–12, 2003)

ii JHPIEGO Technical Report
LIST OF TABLES AND FIGURES Table 1. Projected Changes in Total Fertility Rate, Malawi 2
Table 2. Projected Changes in Malawi Population: 2001–2007 2
Figure 1. Contraceptive Prevalence for Selected Methods: Malawi 2001–2007 3
Table 3. Source Distribution for FP Methods in Malawi (2001): Percentage Provided by Sector 4
Figure 2. Theoretical Illustration: Factors Affecting Provider “Supply” 5
Table 4. Number of FP Personnel in Malawi (2001), by Sector, Cadre, and FP Method 6
Table 5. Estimated Annual Loss/Retention of FP Personnel 7
Table 6. Projected Preservice Training: Malawi (2002–2007) 8
Table 7. Projected Inservice Training: Malawi (2002–2007) 9
Table 8. Estimated Percentage of Time Spent Providing FP, by Method, Cadre, and Sector 11
Table 9. Hypothetical Inservice Implant Training to Reduce Expected Deficit in Providers 14
Table A-1. Method Protection Attributes A-1
Table A-2. Method Effectiveness (Malawi RH Service Delivery Guidelines, October 2001) A-1
Table A-3. Method Effectiveness Details for Pills and Traditional Methods A-1
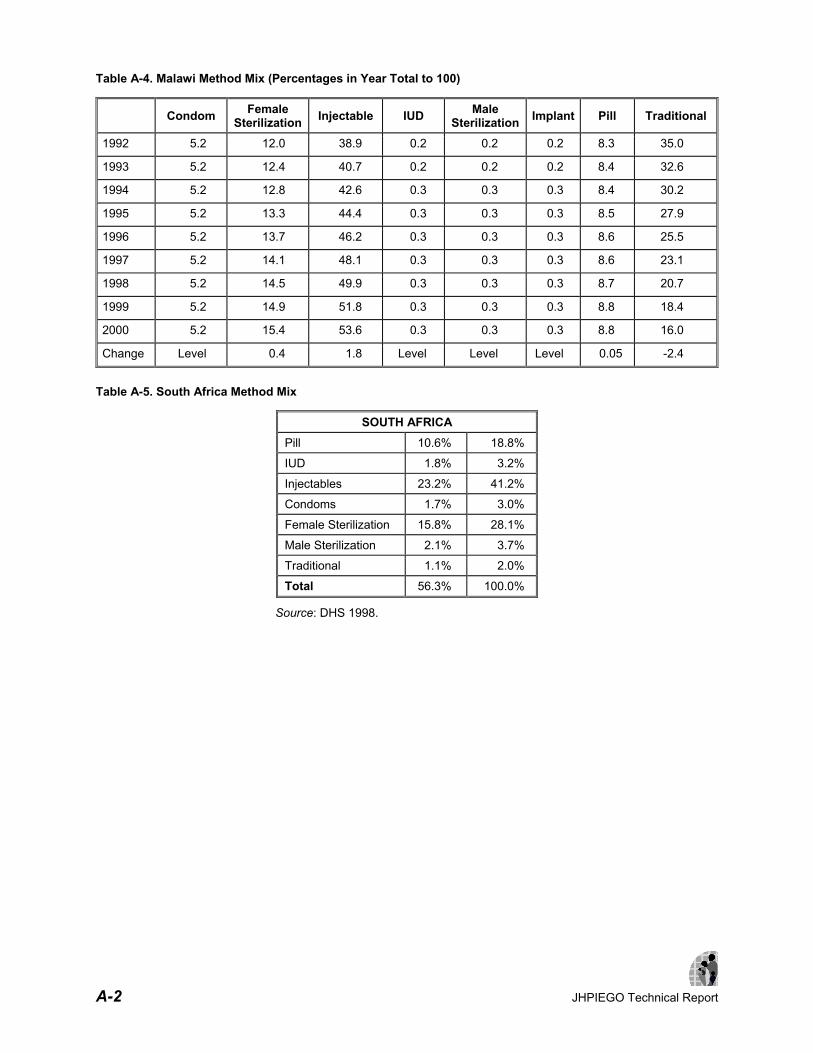
Table A-4. Malawi Method Mix (Percentages in Year Total to 100) A-2
Table A-5. South Africa Method Mix A-2
Table A-6. Zimbabwe Method Mix A-3
Table A-7. March 2003 Workshop, 2015 Malawi Method Mixes A-3
Table A-8. Malawi Method Mix, by Source A-4
Table A-9. Proximate Fertility Determinants for Malawi A-5
Table A-10. Alternate Total Fertility Rate (TFR) Projection for Malawi: 5.64 in 2015 A-5

JHPIEGO Technical Report iii
ABBREVIATIONS AND ACRONYMS AIDS Acquired immunodeficiency syndrome
BLM Banja La Mtsogolo
CBDA Community-based distribution agent
CHAM Christian Health Association of Malawi
CO Clinical officer
DHS Demographic and Health Surveys
FP Family planning
FP/RH Family planning/Reproductive health
FPAK Family Planning Association of Kenya
HR Human resources
HRMD Human Resources Management and Development
IUD Intrauterine Device
KCON Kamuzu College of Nursing
MA Medical assistant
MCHS Malawi College of Health Sciences
MOHP Ministry of Health and Population
NMT Nurse-midwife technician
NT Nurse technician
RHU Reproductive Health Unit
RN Registered Nurse
RNM Registered Nurse Midwife
RTI Research Triangle Institute
SDP Service delivery point
TFGI The Futures Group International
TFR Total fertility rate

iv JHPIEGO Technical Report

JHPIEGO Technical Report v
EXECUTIVE SUMMARY
Using the training needs projection methods in the Spectrum Policy Modeling System software module ProTrain™, JHPIEGO collaborated with the Malawi Ministry of Health and Population (MOHP) Reproductive Health Unit (RHU) to estimate numbers of Family Planning/Reproductive Health (FP/RH) service providers who are needed to reach total fertility rate (TFR) and contraceptive prevalence goals for Malawi from 2001–2007. ProTrain™ allows the user to project the available versus required number of trained and competent family planning (FP) service providers of several FP methods, in various sectors of a national health system, given expected client demand and expected training outputs. In creating these FP human resource projections, JHPIEGO was building upon work done at the FP/RH Projections Update Workshop in Malawi in March 2003 by the Malawi MOHP Reproductive Health Unit. Those demographic and FP projections form the foundation for the current human resources (HR) study. A conservative demography/family planning model was used, which assumed that the decline in TFR between 2001 and 2015 would be at the same rate as the decline measured between the two Malawi Demographic and Health Surveys (DHSs) in 1992 and 2000. This is a slower rate of decline, reaching 5.64 by the year 2015 instead of the population policy goal of 4.5 by 2015. The demography/family planning model was based on constrained rather than adequate resources to meet the TFR goal. The FP projection contains estimates of current and anticipated future percentages of eligible women receiving their contraceptive services from different sources within Malawi: public and private sector, Christian Health Association of Malawi (CHAM), Banja La Mtsogolo (a local nongovernmental organization), and community-based distribution agents (CBDAs). In order to construct the training projection model, JHPIEGO gathered data on several aspects of the preservice and inservice training that produces FP providers, and on FP service delivery in Malawi, from various data sources. The data sources included national human resource and training plans, and interviews with personnel at the Malawi MOHP Human Resources Management and Development (HRMD) and Planning Unit offices, the MOHP Reproductive Health Unit, the Nurses and Midwives Council of Malawi, and at several of the preservice institutions. Results showed that current FP/RH training outputs would result in adequate to surplus numbers of injectables providers. However, there would not be sufficient providers of Norplant® implants and female sterilization in Malawi over the period 2001–2007. Introducing additional preservice training alone would bring the numbers of female sterilization providers up to meet the projected needs, but additional preservice education and inservice training would be needed to produce sufficient Norplant providers. The demand for condoms and pills will also surpass the number of providers of these methods in the projection period from 2001 to 2007, although introducing more training was not modeled in the current set of projections. Important to note in any projection model is that changes to the inputs will mean changes in projection outputs. Making changes in the human resource aspects of the ProTrain™ model could include training more FP providers in inservice or preservice, improving training to increase competency rates, and changing the conditions of service to increase retention rates. These are qualitative issues in human resources for health that are important for every capacity building program in the health sector.

vi JHPIEGO Technical Report
JHPIEGO Technical Report 1
ESTIMATING THE NEED FOR FAMILY PLANNING/ REPRODUCTIVE HEALTH SERVICE PROVIDERS IN MALAWI
BACKGROUND JHPIEGO has collaborated with the Malawi Ministry of Health and Population (MOHP) Reproductive Health Unit (RHU) to estimate the numbers of family planning/reproductive health (FP/RH) service providers who are needed to reach total fertility rate (TFR) and contraceptive prevalence goals for Malawi from 2001–2007. We are using the training needs projection methods (ProTrain v. 1.65) jointly developed by The Futures Group International and JHPIEGO in the mid-1990s. This software allows the user to project the available versus the required number of trained and competent FP service providers of various FP methods, in various sectors of a national health system, given expected client demand and expected training outputs. All of this modeling is accomplished in the Spectrum Policy Modeling System family of modeling tools developed by The Futures Group. Spectrum includes modeling tools for demographic projections (DemProj module) that include the impact of AIDS (AIM module), as well as family planning usage projections (FamPlan module). In order to construct the training projection model, JHPIEGO gathered data on several aspects of preservice and inservice training in Malawi, which produces FP providers. Below we have documented the assumptions and data sources. METHODS Demography (DemProj) and Family Planning (FamPlan) Models This exercise used the demographic and FP projections developed by the RHU and other key stakeholders in the FP/RH Projections Update Workshop (March 11–12 2003), with the assistance of Shawn Aldridge of Research Triangle Institute (RTI) in North Carolina. Several models had been developed at the workshop to estimate changes in the population of Malawi for the years 1982–2015 given a variety of factors including the impact of the AIDS epidemic and different expectations regarding change in the TFR. For the present training needs projections, a conservative demography/family planning model was used, which assumed that the decline in TFR between 2001 and 2015 would be at the same rate as the decline measured between the two DHSs (1992 and 2000). This is a slower rate of decline, reaching 5.64 by the year 2015 instead of the population policy goal of 4.5 by 2015. Another conservative element of the demography/family planning model is that it was based on constrained rather than adequate resources to meet the TFR goal. In order to cover a more manageable period for training projections, the demography/family planning model was truncated to the years 2001–2007, with TFR goals as shown in Table 1.

2 JHPIEGO Technical Report
Table 1. Projected Changes in Total Fertility Rate, Malawi
YEAR TFR 2001 6.30
2002 6.26
2003 6.21
2004 6.16
2005 6.11
2006 6.07
2007 6.02
Source: DemProj estimates, RTI. General changes in population from 2001–2007 are incorporated into the model (Table 2). Table 2. Projected Changes in Malawi Population: 2001–2007
YEAR TOTAL POPULATION
MALE POPULATION
FEMALE POPULATION
% FEMALES AGES 15–49
2001 11,390,012 5,632,701 5,757,312 44.87
2002 11,700,994 5,790,057 5,910,938 45.36
2003 12,050,715 5,966,968 6,083,745 45.72
2004 12,427,847 6,158,309 6,269,540 45.94
2005 12,822,560 6,359,579 6,462,980 46.07
2006 13,226,682 6,567,007 6,659,675 46.12
2007 13,636,112 6,777,862 6,858,249 46.12
Source: DemProj estimates, RTI. The family planning projection embodies the above expected decrease in TFR concomitant with the increase in population. The expected TFR decrease is modeled as a function of: ♦ FP method protection attributes (e.g., Couple years of protection, average duration of use
for long-term methods, average age of users for permanent methods, and method effectiveness). See Appendix.
♦ Proximate determinants of fertility. See Appendix.
♦ Method mix: current and anticipated future patterns of contraceptive method usage. The method mix shown in Figure 1 was used:

JHPIEGO Technical Report 3
♦ Prevalence expectations for IUD and male sterilization are omitted from consideration in this
exercise, which focuses on methods more broadly used and provided primarily by healthcare professionals other than physicians/clinical officers.
♦ Source distribution: The family planning projection contains estimates of current and anticipated future percentages of eligible women receiving their contraceptive services from different sources within Malawi: • Public Sector—Not including community-based distribution agents (CBDAs) • Private Sector—Not including CBDAs • Mission (CHAM) • Banja La Mtsogolo (BLM) • CBDAs (all) • Other Sources
Table 3 provides the source distribution assumed in 2001.
Figure 1. Contraceptive Prevalence for Selected Methods:
Malawi 2001-2007 (Source: FamPlan projection, RTI)
2.0 1.91.81.71.61.5 1.4
4.5 4.44.34.34.24.1 4.0
15.5 15.315.114.814.514.3 14.0
0.1 0.10.10.10.10.1 0.1 2.8 2.82.72.62.52.4 2.4
3.8 3.93.94.04.04.1 4.1
0
5
10
15
20
25
30
35
2001 2002 2003 2004 2005 2006 2007 Year
Prev
alen
ce
Traditional
Pill
Implant
Injectable
Female Sterilization
Condom

4 JHPIEGO Technical Report
Table 3. Source Distribution for FP Methods in Malawi (2001): Percentage Provided by Sector
PUBLIC SECTOR
LESS CBDAS
PRIVATE SECTOR
LESS CBDAS MISSION
(INCL. CHAM) BLM CBDAS (ALL)
OTHER SOURCES
Condom 38.9 2.1 2.8 7.3 4.7 44.2
Female sterilization 42.8 0.8 16.0 40.1 0.0 0.3
Injectable 78.7 5.9 9.5 5.0 0.9 0.0
IUD 42.8 2.1 15.9 39.3 0.0 0.0
Male sterilization 4.1 2.8 2.8 89.7 0.0 0.0
Implant 50.3 0.0 10.3 39.3 0.0 0.0
Pill 58.4 7.8 8.9 12.7 11.2 1.0
Traditional 1.0 0.0 25.0 1.0 1.0 72.0
ProTrain Model The training needs projection (ProTrain) model starts with the above estimates of FP clients (new acceptors of long-term methods, and users of shorter-term methods) presenting for FP healthcare in the various sectors (Public, Mission, etc.) each year. In order to estimate whether and how the need for FP services can be met, the following information is added to the projection model: ♦ Initial FP Providers: The numbers and types of FP providers who are active in the base
year of the projection period (2001). Based on discussions at RHU we combined FP professionals into several groups based largely on the services they commonly provide: • Registered nurses and registered nurse-midwives (RN/RNMs) • Nurse technicians and nurse-midwife technicians (NT/NMTs) • Clinical Officers (COs) • Medical Assistants (MAs) • CBDAs
♦ Future Providers: Expected training outputs over the time period (i.e., the annual numbers
and types of FP providers trained by): • RHU inservice training (RHU) • CHAM-affiliated Nursing Schools (CHAM) • Kamuzu College of Nursing (KCON) • Malawi College of Health Sciences (MCHS)
College of Medicine training of Medical Officers was not included in the model because projections for Medical Officer provision of FP were not made.
♦ Procedure Time: The training projection requires data on the number of minutes needed
per client to provide a given method with adequate counseling and followup. Multiplying minutes per client by the number of clients per year gives the amount of time needed for the service. The model also takes into account other factors which limit the time that providers have available, including: • Hours worked per week, and weeks per year

JHPIEGO Technical Report 5
• Amount of provider time actually spent in FP service (versus other health services) • Amount of provider downtime (e.g., waiting for clients)
♦ Provider Dynamics: The utility of ProTrain is in the simultaneous modeling of a number of
other factors that affect the pool of available providers over time. They include: • Expected annual retention rates for providers • Competency rates for newly-trained providers • Percentage of new providers actually posted to (or returning to) FP service delivery
points.
The simultaneous modeling of some of these factors is illustrated in Figure 2.
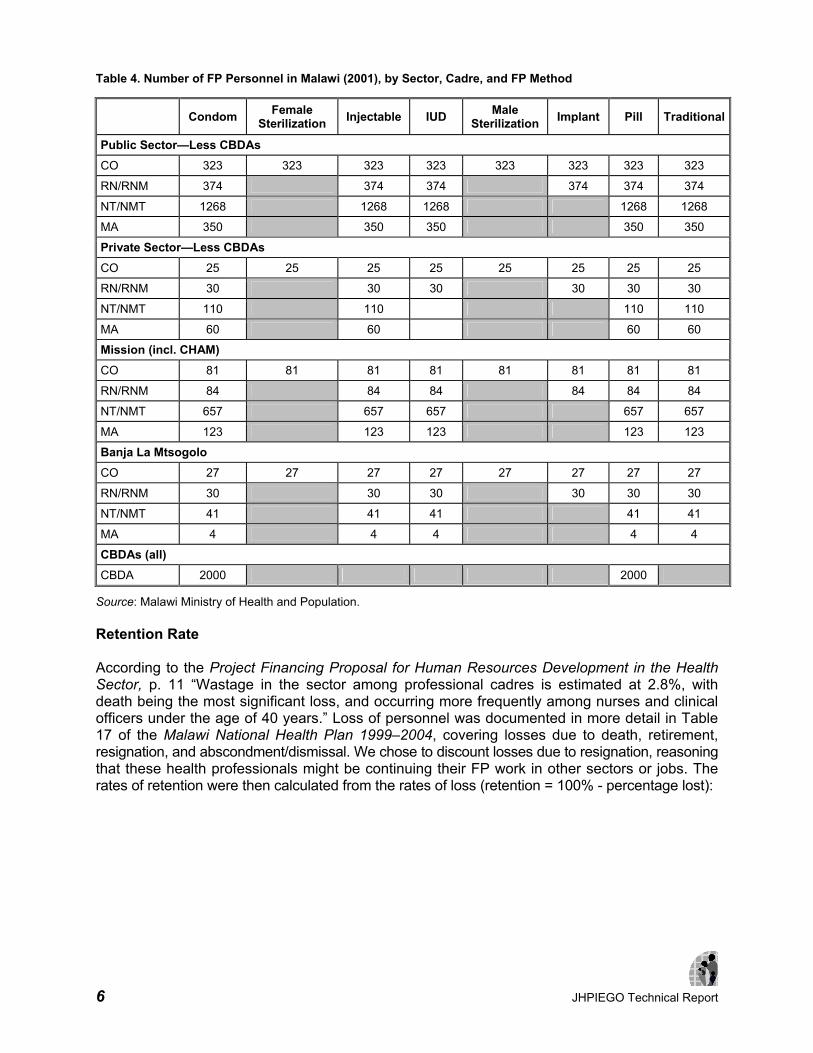
DATA AND ASSUMPTIONS Family Planning Personnel 2001 Table 4 provides the estimated number of FP professionals working in Malawi in 2001. Note that for a given cadre in a particular sector (e.g., Clinical Officers in the Public sector) the same number (e.g., 323) is repeated across all of the methods that the cadre provides. Calculations within the model adjust for these multiple representations of multi-method providers. Data for this table come from several sources, including the Malawi National Health Plan 1999–2004: Volume 3—Health Sector Human Resources Plan, as well as the MOHP Human Resources Management and Development (HRMD) and Planning Unit offices, and the MOHP Reproductive Health Unit.
0
1000
2000
3000
4000
5000
6000
e.g.
, Num
ber o
f Inj
ecta
ble
Prov
ider
s
1992 1996 2000 2004 Year
Cumulative Number Trained
Assume 80% Competent
Assume 50% enter FP Work
Assume 81% Annual Retention
Assume 40% Time Spent in FP
Assume 10% Time Waiting for Clients
Figure 2. Theoretical Illustration:Factors Affecting Provider "Supply"
6 JHPIEGO Technical Report
Table 4. Number of FP Personnel in Malawi (2001), by Sector, Cadre, and FP Method
Condom Female Sterilization Injectable IUD Male
Sterilization Implant Pill Traditional
Public Sector—Less CBDAs CO 323 323 323 323 323 323 323 323
RN/RNM 374 374 374 374 374 374
NT/NMT 1268 1268 1268 1268 1268
MA 350 350 350 350 350
Private Sector—Less CBDAs CO 25 25 25 25 25 25 25 25
RN/RNM 30 30 30 30 30 30
NT/NMT 110 110 110 110
MA 60 60 60 60
Mission (incl. CHAM) CO 81 81 81 81 81 81 81 81
RN/RNM 84 84 84 84 84 84
NT/NMT 657 657 657 657 657
MA 123 123 123 123 123
Banja La Mtsogolo CO 27 27 27 27 27 27 27 27
RN/RNM 30 30 30 30 30 30
NT/NMT 41 41 41 41 41
MA 4 4 4 4 4
CBDAs (all) CBDA 2000 2000
Source: Malawi Ministry of Health and Population. Retention Rate According to the Project Financing Proposal for Human Resources Development in the Health Sector, p. 11 “Wastage in the sector among professional cadres is estimated at 2.8%, with death being the most significant loss, and occurring more frequently among nurses and clinical officers under the age of 40 years.” Loss of personnel was documented in more detail in Table 17 of the Malawi National Health Plan 1999–2004, covering losses due to death, retirement, resignation, and abscondment/dismissal. We chose to discount losses due to resignation, reasoning that these health professionals might be continuing their FP work in other sectors or jobs. The rates of retention were then calculated from the rates of loss (retention = 100% - percentage lost):

JHPIEGO Technical Report 7
Table 5. Estimated Annual Loss/Retention of FP Personnel
CADRE PERCENTAGE LOST PERCENTAGE RETAINED CO 3.5 96
RN/RNM 5.9 94
NT/NMT 3.5 96
MA 2.6 97
CBDA* 3.875 96
* CBDA rates estimated from the other cadres. Source: Malawi Ministry of Health and Population.
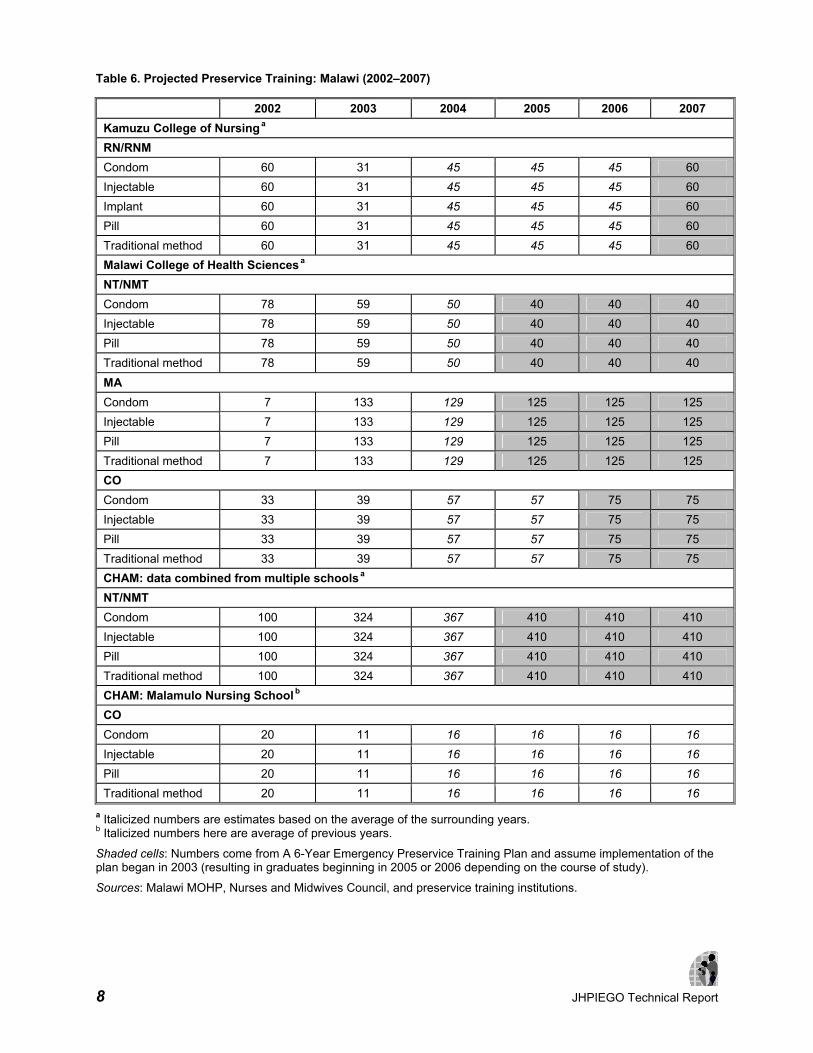
Preservice and Inservice Training in FP Method Provision in Malawi Clinical officers and both registered (RNs/RNMs) and enrolled nurses (NT/NMTs) are considered competent to provide the following methods upon graduation from preservice institutions: condom, injectable, pill, and traditional method. At present, no cadre of healthcare provider is able to provide implants, IUDs or minilaparotomy directly after preservice. Selected cadres can become providers of these methods after attending competency-based inservice training. In Malawi, the RHU trains approximately 20 RNs/RNMs and 20 COs per year in Norplant, and approximately 10 COs attend minilaparotomy training per year. There have not been significant efforts to provide IUD training to date (when it was offered, there were not enough clients for providers to become and remain competent with IUD insertion), and none are currently planned. Data on training outputs for the current and past years (2001–2003) were obtained from the RHU, the Nurses and Midwives Council of Malawi, and the various training institutions covered in the model. Table 6 provides current and anticipated preservice training, while Table 7 contains the inservice training estimates. For years 2004–2007 some projections were available from A 6-Year Emergency Preservice Training Plan, produced by the MOHP Planning Unit. In certain cases, the projected training in the emergency plan would not produce graduates until the later years of the projection period (e.g., 2006 or 2007) owing to the length of time to graduation. In these cases, missing data for the interim years (e.g., 2004, 2005) were filled in by averaging the two numbers for the years bounding the interim (e.g., if 300 people were trained in 2003, and 500 were projected to be trained in 2006, 400 was entered in years 2004 and 2005).
8 JHPIEGO Technical Report
Table 6. Projected Preservice Training: Malawi (2002–2007)
2002 2003 2004 2005 2006 2007 Kamuzu College of Nursing
a RN/RNM Condom 60 31 45 45 45 60 Injectable 60 31 45 45 45 60 Implant 60 31 45 45 45 60 Pill 60 31 45 45 45 60 Traditional method 60 31 45 45 45 60 Malawi College of Health Sciences
a NT/NMT Condom 78 59 50 40 40 40 Injectable 78 59 50 40 40 40 Pill 78 59 50 40 40 40 Traditional method 78 59 50 40 40 40 MA Condom 7 133 129 125 125 125 Injectable 7 133 129 125 125 125 Pill 7 133 129 125 125 125 Traditional method 7 133 129 125 125 125 CO Condom 33 39 57 57 75 75 Injectable 33 39 57 57 75 75 Pill 33 39 57 57 75 75 Traditional method 33 39 57 57 75 75 CHAM: data combined from multiple schools
a NT/NMT Condom 100 324 367 410 410 410 Injectable 100 324 367 410 410 410 Pill 100 324 367 410 410 410 Traditional method 100 324 367 410 410 410 CHAM: Malamulo Nursing School
b CO Condom 20 11 16 16 16 16 Injectable 20 11 16 16 16 16 Pill 20 11 16 16 16 16 Traditional method 20 11 16 16 16 16
a Italicized numbers are estimates based on the average of the surrounding years. b Italicized numbers here are average of previous years.
Shaded cells: Numbers come from A 6-Year Emergency Preservice Training Plan and assume implementation of the plan began in 2003 (resulting in graduates beginning in 2005 or 2006 depending on the course of study).
Sources: Malawi MOHP, Nurses and Midwives Council, and preservice training institutions.

JHPIEGO Technical Report 9
Competency at Completion of Training Competency can be a limiting factor in the supply of FP providers. For the current projections we did not model IUD provision because, according to the MOHP Reproductive Health Unit, a low availability of clients for this method prevents potential trainees from being able to gain enough experience/practice during training and attain competency. Estimates of provider competency for other methods came from discussions with personnel at RHU, the Nurses and Midwives Council, and at several of the preservice institutions. Generally, competency was estimated to be higher for the short-term methods, with a lower percentage of trainees being able to provide the longer-term methods after training: ♦ Condom: 95%
♦ Female sterilization: 85%
♦ Injectable: 90%
♦ Pill: 95%
♦ Implant: 85%
♦ Traditional: 90%
Competency rates were not thought to vary by cadre. Table 7. Projected Inservice Training: Malawi (2002–2007)
2002 2003 2004 2005 2006 2007 RHU CO Female sterilization 10 10 10 10 10 10
Implant 20 20 20 20 20 20
RN/RNM Implant 20 20 20 20 20 20
CBDA Condom 236 152 191 191 191 191
Pill 236 152 191 191 191 191
Sources: Malawi MOHP, NMCM, and preservice institutions. Percentage of Graduates Entering Family Planning One must take into account the postings of new providers just entering the workforce from preservice institutions (i.e., what percentage of the graduates find work that involves FP service delivery?). Likewise, inservice trainees undergoing FP method training may be re-assigned to non-FP work after training, or may lack the infrastructure or client base needed to put their training to good use. Through discussions at RHU an estimate was made that 75% of inservice trainees remain in positions or locations that enable them to provide the services for which they were trained, except for CBDAs, of whom 100% are expected to remain in FP work after training. We did not

10 JHPIEGO Technical Report
have data to estimate these rates for CHAM-affiliated school graduates or other preservice institution graduates, so we adopted a preliminary estimate of 85% for these, based on similar estimates that had been made for a training needs projection model in Kenya. The figure of 85% may be high, and so an alternative estimate will be considered in the results below. Minutes Per Procedure/Service Estimates for the time taken to provide quality FP services should include the time providers spend in counseling, method provision, and followup visits in a given year. The following estimates were arrived at through discussions with service providers at several service delivery points, and discussions at the RHU: ♦ Condom: 10 minutes
♦ Female sterilization: 45 minutes
♦ Injectable: 20 minutes
♦ Implant: 30 minutes
♦ Pill: 10 minutes
♦ Traditional: 10 minutes
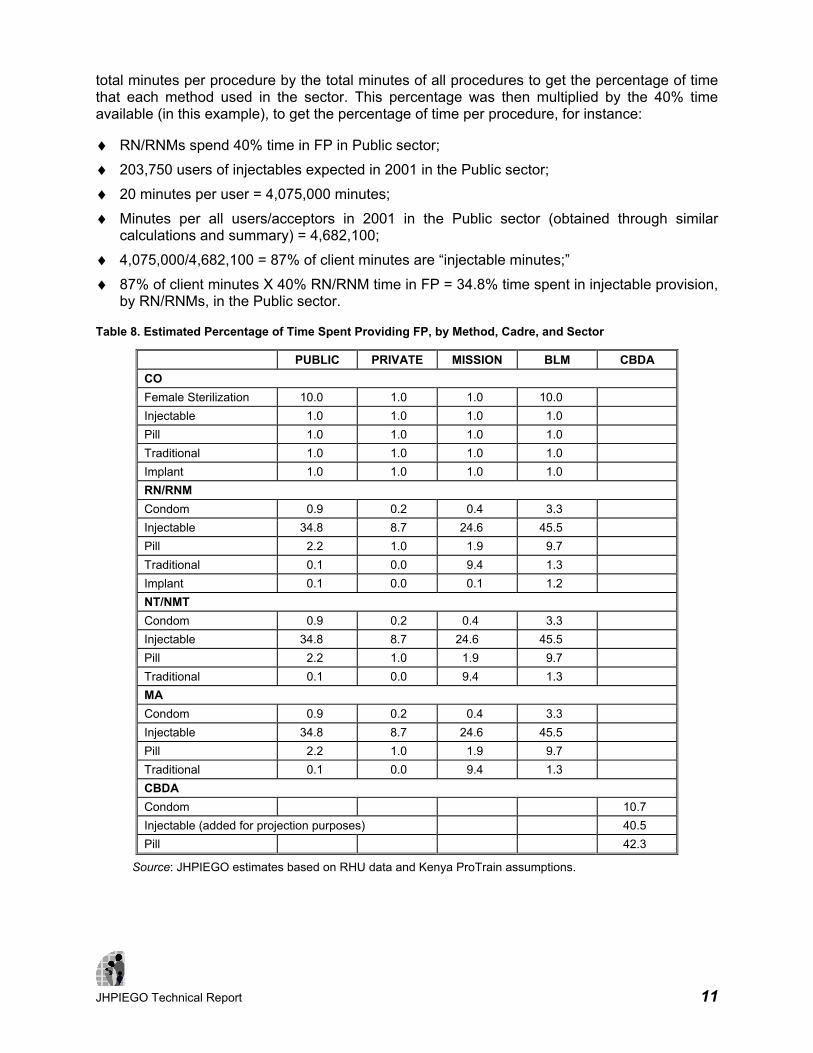
Percentage of Time Spent in Family Planning Services This information is probably best obtained through an averaging of data gained in surveys of members of each cadre at each type of service delivery point (SDP). The training projection model stores this information by sector (e.g., Public, Mission, etc.), and within sector, by cadre (e.g., RN/RNM, MA, etc.), and by method. Since the percentage of time spent in FP work is likely to vary greatly within a sector depending on whether a provider is posted at a hospital or clinic, it is useful to have set up the preliminary FamPlan model to focus on the different types of SDPs within a sector. However, the FamPlan model upon which the current training projections are based is organized by sector, but not by SDP type within sector, so the current estimates must reflect average percentage of time across the different facility types within a sector. For the current training model these data were largely unavailable, with the exception of estimates provided by the RHU for clinical officers providing female sterilization: 10% of their time was estimated for this service in the Public and Banja La Mtsogolo (BLM) sectors, and 1% in the Private and Mission sectors. For other cadres and methods we therefore adapted general percentage of time estimates from an earlier Kenya model. In that model, all cadres in the Public and Mission sectors had been estimated to spend 40% of their time in FP work, and those in the Private sector were estimated to spend 10% of their time on it. Providers in FPAK facilities (Family Planning Association of Kenya) were estimated to spend 100% time in FP work, and this percentage was used for the BLM sector in Malawi. We then broke these percentages down by method. For instance, if RN/RNMs in the Public sector spend 40% time in FP, this percentage must be divided among the methods they provide. In order to get this breakdown we took the number of users (or acceptors, for long-term methods) by method for a given sector in the base year, and multiplied these by minutes per procedure, to get the total minutes expected per method in a given sector. We then divided the
JHPIEGO Technical Report 11
total minutes per procedure by the total minutes of all procedures to get the percentage of time that each method used in the sector. This percentage was then multiplied by the 40% time available (in this example), to get the percentage of time per procedure, for instance:
♦ RN/RNMs spend 40% time in FP in Public sector;
♦ 203,750 users of injectables expected in 2001 in the Public sector;
♦ 20 minutes per user = 4,075,000 minutes;
♦ Minutes per all users/acceptors in 2001 in the Public sector (obtained through similar calculations and summary) = 4,682,100;
♦ 4,075,000/4,682,100 = 87% of client minutes are “injectable minutes;”
♦ 87% of client minutes X 40% RN/RNM time in FP = 34.8% time spent in injectable provision, by RN/RNMs, in the Public sector.
Table 8. Estimated Percentage of Time Spent Providing FP, by Method, Cadre, and Sector
PUBLIC PRIVATE MISSION BLM CBDA CO Female Sterilization 10.0 1.0 1.0 10.0 Injectable 1.0 1.0 1.0 1.0 Pill 1.0 1.0 1.0 1.0 Traditional 1.0 1.0 1.0 1.0 Implant 1.0 1.0 1.0 1.0 RN/RNM Condom 0.9 0.2 0.4 3.3 Injectable 34.8 8.7 24.6 45.5 Pill 2.2 1.0 1.9 9.7 Traditional 0.1 0.0 9.4 1.3 Implant 0.1 0.0 0.1 1.2 NT/NMT Condom 0.9 0.2 0.4 3.3 Injectable 34.8 8.7 24.6 45.5 Pill 2.2 1.0 1.9 9.7 Traditional 0.1 0.0 9.4 1.3 MA Condom 0.9 0.2 0.4 3.3 Injectable 34.8 8.7 24.6 45.5 Pill 2.2 1.0 1.9 9.7 Traditional 0.1 0.0 9.4 1.3 CBDA Condom 10.7 Injectable (added for projection purposes) 40.5 Pill 42.3
Source: JHPIEGO estimates based on RHU data and Kenya ProTrain assumptions.

12 JHPIEGO Technical Report
FINDINGS Projections The RHU was interested in exploring several projections based on the priorities for Malawi: 1. Injectable provision by all cadres in Public, Mission, BLM, and CBDA sectors, with new
providers (except CBDAs) trained by preservice institutions and RHU:
According to this projection the supply of injectable providers (red line) will grow from approximately 3,300 to 5,200 to exceed the number required (green line) by the end of this training projection period.
2. Injectable provision as above (1) but adding RHU training of CBDAs in injectables:
JHPIEGO Technical Report 13
Projection 1 already shows a surplus of injectable providers with the current training outputs through 2007, and the addition of RHU training of CBDAs in this method accelerates the growth of this surplus. For the above Projection 2, it was assumed that a nominal number of CBDAs (100) were already providing injectables in 2001 (the assumption of a non-zero cadre is needed in the base year in order to model training inputs for the same cadre in future years). It was then assumed that the RHU would provide injectable training of 191 CBDAs in each year from 2004 through 2007 (the same number projected to be trained in pill and condom provision).
It should be noted that possible training of CBDAs in injectables is not necessarily a waste of resources, if the client load on other cadres such as NT/NMTs and RN/RNMs can be lightened. The above Projection 2 does not show this possibility, but one could return to the FamPlan model and alter the assumptions about where clients will be going to receive injectables. If one constructed an alternative model in which more injectable clients were served by CBDAs in the future years, the number of RN/RNMs, NT/NMTs, etc. needed to serve the injectable clients could be decreased, and one could model alternative client flow patterns (e.g., increasing the number of implant clients served by RN/RNMs). Use of the FamPlan and ProTrain modules within the Spectrum package of tools can permit this type of planning.
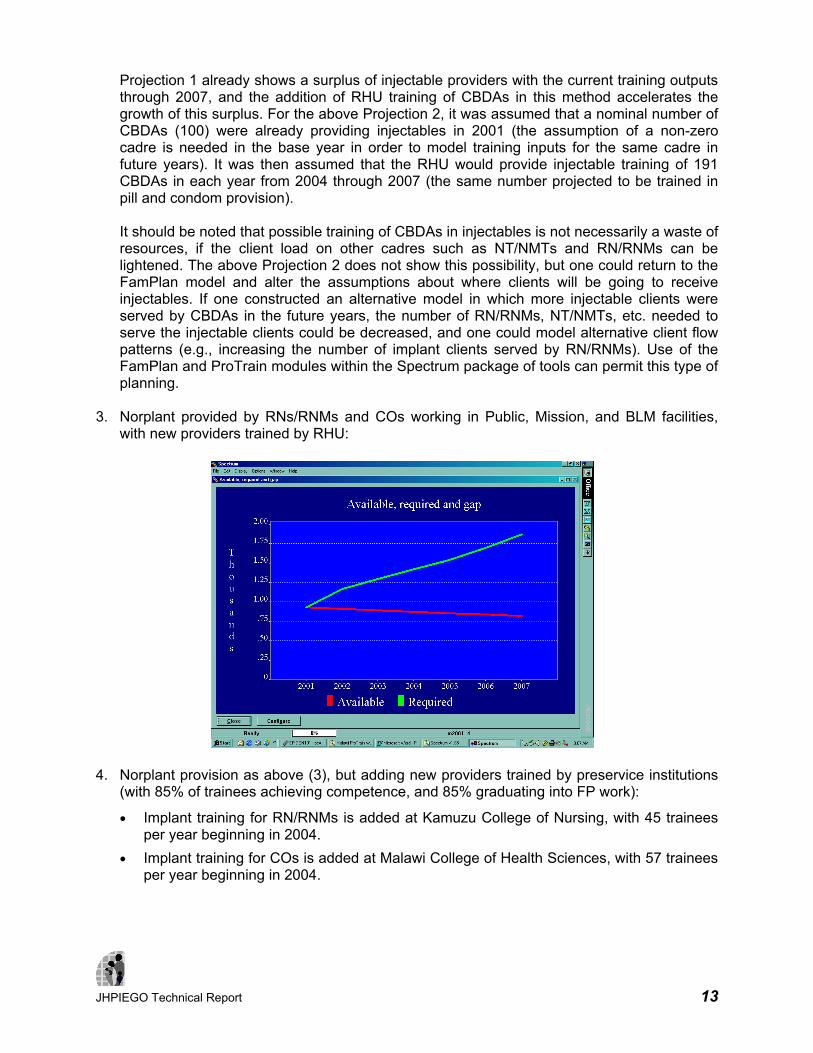
3. Norplant provided by RNs/RNMs and COs working in Public, Mission, and BLM facilities,
with new providers trained by RHU:
4. Norplant provision as above (3), but adding new providers trained by preservice institutions
(with 85% of trainees achieving competence, and 85% graduating into FP work):
• Implant training for RN/RNMs is added at Kamuzu College of Nursing, with 45 trainees per year beginning in 2004.
• Implant training for COs is added at Malawi College of Health Sciences, with 57 trainees per year beginning in 2004.

14 JHPIEGO Technical Report
• Implant training for COs is added at CHAM/Malamulo, with 16 trainees per year beginning in 2004.
As seen in Projection 4 below, these additional training inputs do not result in enough providers to meet the expected demand, but at least the gap is lessening.
An additional program of inservice training by RHU could begin to close the gap; the following projection adds an intensive training effort by RHU as follows, from 2004–2007:
Table 9. Hypothetical Inservice Implant Training to Reduce Expected Deficit in Providers
YEAR CO RN/RNMS TOTAL 2004 40 40 80
2005 80 80 160
2006 120 120 240
2007 160 160 320
With the addition of the above 800 implant providers over 4 years, we again assume the rate of 75% returning to locations/jobs where they can provide the method, and we assume 85% competency. This hypothetical program would increasingly close the gap between required and available implant providers in Public, Mission, and BLM sectors, as shown in the following projection:

JHPIEGO Technical Report 15
5. Female sterilization provided by COs in public, mission, and BLM sectors, with new
providers trained by RHU:
Projection 5 shows that while the demand for providers of female sterilization will generally increase through 2007, the supply of COs able to provide this service will be decreasing. This model includes projected RHU training of 10 COs per year in this method, and does not include potential service by medical officers. According to the FamPlan model, the vast majority of clients for this service are expected in either the Public sector or at BLM facilities (see Table 3). Because of the need for more providers of this method, the RHU suggested examination of scenario 6 (below).
16 JHPIEGO Technical Report
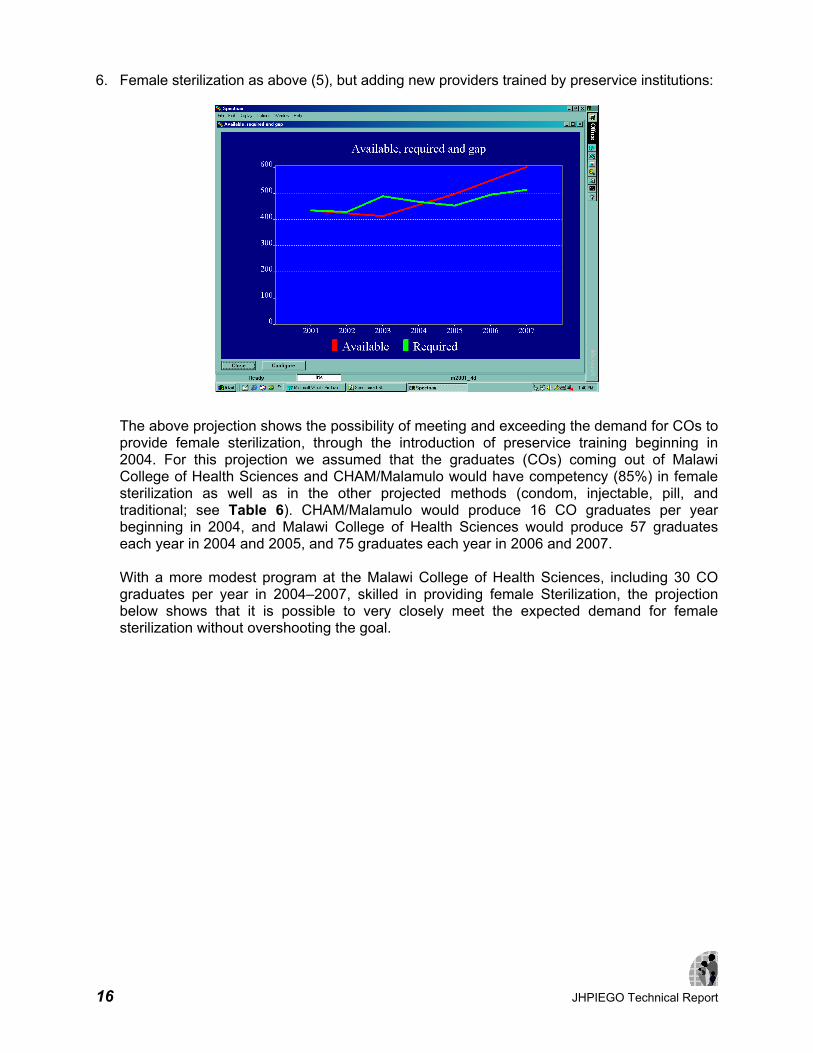
6. Female sterilization as above (5), but adding new providers trained by preservice institutions:
The above projection shows the possibility of meeting and exceeding the demand for COs to provide female sterilization, through the introduction of preservice training beginning in 2004. For this projection we assumed that the graduates (COs) coming out of Malawi College of Health Sciences and CHAM/Malamulo would have competency (85%) in female sterilization as well as in the other projected methods (condom, injectable, pill, and traditional; see Table 6). CHAM/Malamulo would produce 16 CO graduates per year beginning in 2004, and Malawi College of Health Sciences would produce 57 graduates each year in 2004 and 2005, and 75 graduates each year in 2006 and 2007.
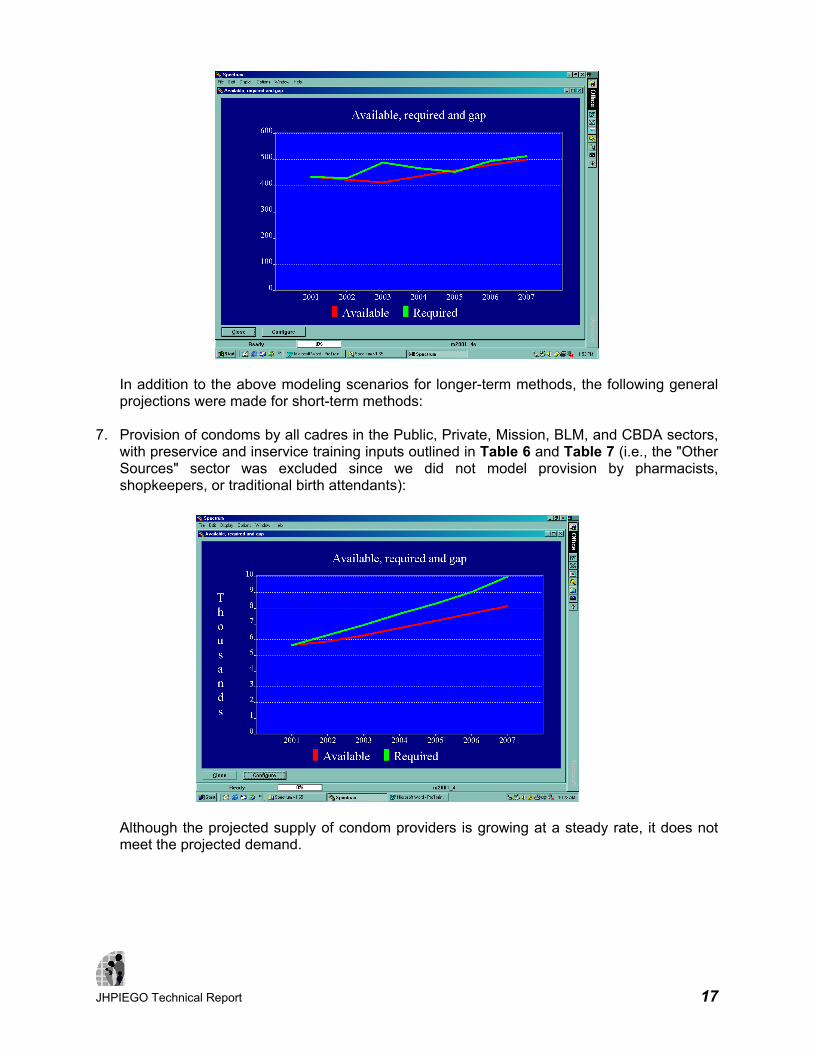
With a more modest program at the Malawi College of Health Sciences, including 30 CO graduates per year in 2004–2007, skilled in providing female Sterilization, the projection below shows that it is possible to very closely meet the expected demand for female sterilization without overshooting the goal.
JHPIEGO Technical Report 17
In addition to the above modeling scenarios for longer-term methods, the following general projections were made for short-term methods:
7. Provision of condoms by all cadres in the Public, Private, Mission, BLM, and CBDA sectors,
with preservice and inservice training inputs outlined in Table 6 and Table 7 (i.e., the "Other Sources" sector was excluded since we did not model provision by pharmacists, shopkeepers, or traditional birth attendants):
Although the projected supply of condom providers is growing at a steady rate, it does not meet the projected demand.
18 JHPIEGO Technical Report
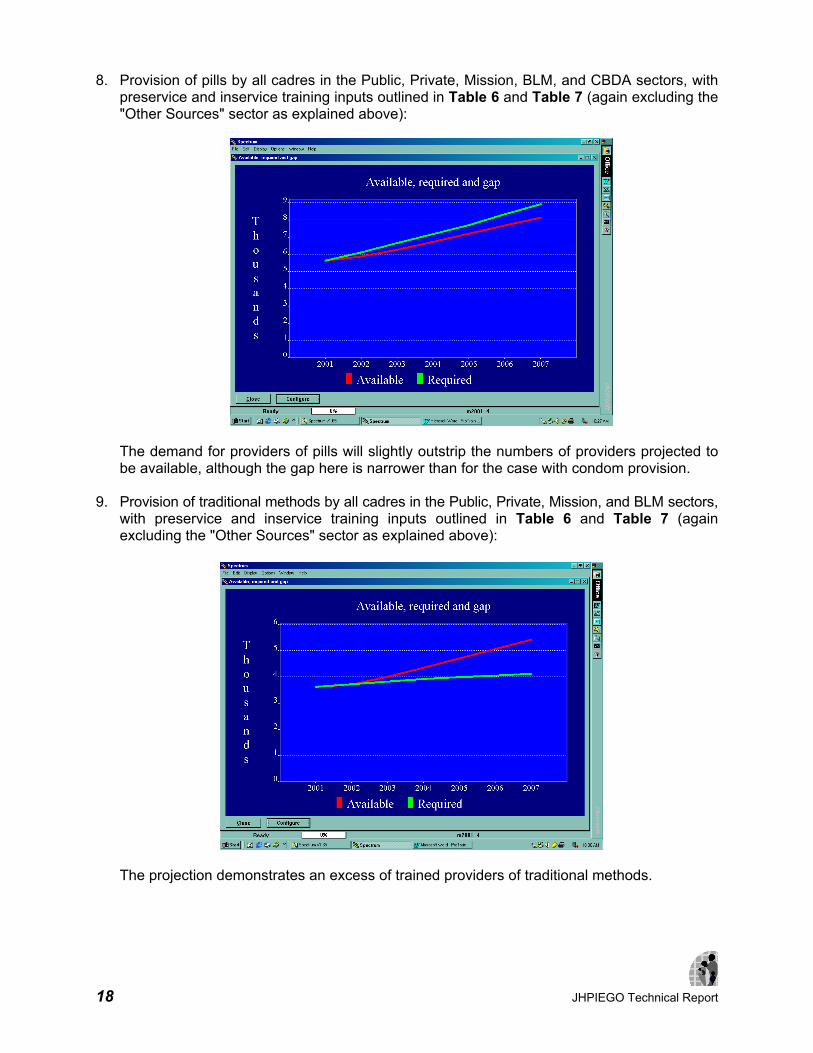
8. Provision of pills by all cadres in the Public, Private, Mission, BLM, and CBDA sectors, with preservice and inservice training inputs outlined in Table 6 and Table 7 (again excluding the "Other Sources" sector as explained above):
The demand for providers of pills will slightly outstrip the numbers of providers projected to be available, although the gap here is narrower than for the case with condom provision.
9. Provision of traditional methods by all cadres in the Public, Private, Mission, and BLM sectors, with preservice and inservice training inputs outlined in Table 6 and Table 7 (again excluding the "Other Sources" sector as explained above):
The projection demonstrates an excess of trained providers of traditional methods.

JHPIEGO Technical Report 19
DISCUSSION Caution must be used in interpreting any projection. The accuracy of the projection is only as good as the information that has been used to create it. The training needs projections provide a relativistic view of available versus required personnel to meet FP service demand, rather than yielding absolute numbers. The case of CO provision of female sterilization can be used to illustrate this point. In the earlier projections for female sterilization, demand is shown for 3 sectors together: Public, Mission, and BLM. If we focus only on the Public sector, the expected number of clients in 2001 is 5,050, rising to 6,780 by the year 2007, and the projection for the Public sector alone shows that the training plan outlined above will help close the gap in the Public sector, but not completely:
If we make all of the assumptions outlined previously about female sterilization services in the Public sector, we know the following: ♦ Each procedure takes 45 minutes.
♦ Therefore, 5,050 acceptors in 2001 require 227,259 minutes.
♦ COs work a 43 hour week, 48 weeks per year, and spend approximately 10% of their time providing female sterilization, so a typical CO has 12,384 minutes available in a year for this service.
♦ Therefore, the 5,050 acceptors can be served by 18.35 COs (227,259 minutes divided by 12,384 minutes per CO = 18.35 COs).
However, we have recorded 323 COs in the Public sector in 2001 providing female sterilization, as seen in Table 4 and in the above graph. This is 17.6 times as many COs as one would calculate to be needed: 323 actual providers divided by 18.35 needed to serve 5,050 acceptors equals 17.6. The model, therefore, accepts our assertion that all 323 COs are providing female Sterilization, and adjusts each year's projection by this adjustment factor of 17.6. For example, by the year 2007, with an expected 6,780 clients (305,100 minutes), 24.6 COs (full-time

20 JHPIEGO Technical Report
equivalents) would be needed, if this is a 45-minute procedure and the COs spend 10% of the time providing it. The model multiplies 24.6 by 17.6 to yield approximately 434 COs required in 2007 (see above graph). In this sense, the model is relativistic: all calculations are adjusted to the base year, which is accepted as a reality by the model. This is why in all projections, the number of required providers is always equal to the number of available providers in the base year (notice that the two lines always start off from the same point in the base year). The adjustment factor has a huge impact on training projections. In the above example, if in reality only 18.35 COs were needed for female sterilization services in 2001, and only 24.6 were needed by 2007, the training needs are quite a bit smaller than if 323 COs were needed in 2001 and 434 will be needed in 2007. Given this relativism, it is useful to examine assumptions or data when the adjustment factor strays away from 1.0, and especially when it strays to a high degree. Suppose, in the current example, that even though there are 323 COs in the Public sector in 2001, we gather additional research to indicate that only about half of them were actually providing female sterilization services (e.g., 161 COs). The projection (below) now shows that our training effort will greatly exceed the demand for female sterilization after 2004. The adjustment factor for this model is now 8.8, which is considerably better than the above example. Apart from the estimates of client demand, which come from the FamPlan model, the data most in need of accuracy for training modeling purposes are the number of personnel in the base year who are actually providing the various FP services in the different sectors, and the percentage of time they spend providing each method.
CONCLUSION The above ProTrain results emphasize the need for further inputs in inservice training for long-term methods, Norplant and minilaparotomy. The projections, however, are dependant on

JHPIEGO Technical Report 21
base year data inputs that may not be sufficiently reliable. While the total number of service providers in each cadre is known with confidence, based on recent human resources (HR) studies of the MOHP and routine HR data systems, the total number providing family planning services—and providing specific methods—is not as well established. While the use of the DemProj, FamPlan, and ProTrain modeling tools could assist in the modeling of family planning training needs, the input of more reliable base year data is needed before firm investments are made based on these results. RECOMMENDATIONS Base year personnel providing FP methods in each sector is perhaps the most important data for training needs projections. For validation of the current model this would be the place to start. One method might be a broad survey of healthcare personnel in different sectors and facilities, to determine: ♦ What percentages of each cadre are currently providing which FP services?
♦ Approximately what percentage of time (e.g., in a typical week or month) do they spend providing each method?
If these data could be reliably obtained for a representative sample of cadres, sectors, and facilities, it could help to validate the current assumptions used in the model. Although such a survey would be conducted, for example, in 2004 rather than going back retrospectively to the base year of 2001, it would likely provide adequate data to more accurately estimate the situation in 2001.

22 JHPIEGO Technical Report
REFERENCES Ministry of Health and Population, Government of Malawi. November 1999. Malawi National Health Plan 1999–2004: Volume 3 – Health Sector Human Resources Plan: Malawi. Planning Unit, Ministry of Health and Population, Government of Malawi. November 2001 and July 2002. A 6-Year Emergency Pre-Service Training Plan: Malawi. Stover J and L Heaton (The Futures Group International). December 1999. FamPlan Version 4: A Computer Program for Projecting Family Planning Requirements. Spectrum System of Policy Models. Stover J (The Futures Group International) and S Kirmeyer (Research Triangle Institute). December 1999. DemProj Version 4: A Computer Program for Making Population Projections. Spectrum System of Policy Models.

JHPIEGO Technical Report A-1
APPENDIX
FP/RH PROJECTIONS UPDATE WORKSHOP INPUTS AND ASSUMPTIONS DATA (MARCH 11–12, 2003)
Table A-1. Method Protection Attributes
METHOD COUPLE YEARS OF PROTECTION (CYP)/ AVERAGE AGE
Condom 120 per year = 1 CYP
Female Sterilization Average age 35 = 10 CYPs
Injectable 4 per year = 1 CYP
IUD 1 = 3.5 CYPs
Male Sterilization Average age 35 = 10 CYPs
Implant 1 = 3.5 CYPs
Pill 15 cycles per year = 1 CYP
Traditional N/A
Table A-2. Method Effectiveness (Malawi RH Service Delivery Guidelines, October 2001)
METHOD PERCENTAGE Condom 88
Female Sterilization 99.5
Injectable 99.7
IUD 98
Male Sterilization 99.85
Implant 99
Pill 92.48
Traditional 55
Table A-3. Method Effectiveness Details for Pills and Traditional Methods
PROPORTION OF TOTAL PILLS EFFECTIVENESS 16% Progestin-only Pills (POPs) 95–99.5%
84% Combined Oral Contraceptives (COCs) 92–99.9%
Weighted average of low end of intervals 92.48
Traditional Votes Average
50 4
55 2 55
60 3
A-2 JHPIEGO Technical Report
Table A-4. Malawi Method Mix (Percentages in Year Total to 100)
Condom Female Sterilization Injectable IUD Male
Sterilization Implant Pill Traditional
1992 5.2 12.0 38.9 0.2 0.2 0.2 8.3 35.0
1993 5.2 12.4 40.7 0.2 0.2 0.2 8.4 32.6
1994 5.2 12.8 42.6 0.3 0.3 0.3 8.4 30.2
1995 5.2 13.3 44.4 0.3 0.3 0.3 8.5 27.9
1996 5.2 13.7 46.2 0.3 0.3 0.3 8.6 25.5
1997 5.2 14.1 48.1 0.3 0.3 0.3 8.6 23.1
1998 5.2 14.5 49.9 0.3 0.3 0.3 8.7 20.7
1999 5.2 14.9 51.8 0.3 0.3 0.3 8.8 18.4
2000 5.2 15.4 53.6 0.3 0.3 0.3 8.8 16.0
Change Level 0.4 1.8 Level Level Level 0.05 -2.4
Table A-5. South Africa Method Mix
SOUTH AFRICA Pill 10.6% 18.8%
IUD 1.8% 3.2%
Injectables 23.2% 41.2%
Condoms 1.7% 3.0%
Female Sterilization 15.8% 28.1%
Male Sterilization 2.1% 3.7%
Traditional 1.1% 2.0%
Total 56.3% 100.0%
Source: DHS 1998.

JHPIEGO Technical Report A-3
Table A-6. Zimbabwe Method Mix
ZIMBABWE Pill 35.5% 66.2%
IUD 0.9% 1.7%
Injectables 8.1% 15.1%
Implant 0.5% 0.9%
Condoms 1.8% 3.4%
Female Sterilization 2.6% 4.9%
Male Sterilization 0.1% 0.2%
LAM 0.9% 1.7%
Traditional 3.2% 6.0%
Total 53.6% 100.0%
Source: DHS 1999. Table A-7. March 2003 Workshop, 2015 Malawi Method Mixes
ADEQUATE RESOURCES
CONSTRAINED RESOURCES
MDHS 2000 2015 2015 Condom 5.2% 7.50% 8.50%
Female Sterilization 15.4% 18.50% 15.70%
Injectable 53.6% 57.25% 53.90%
IUD 0.3% 0.25% 0.25%
Male Sterilization 0.3% 0.35% 0.25%
Implant 0.3% 1.50% 0.45%
Pill 8.8% 9.75% 11.00%
Traditional 16% 4.90% 9.95%
Total 100% 100% 100%

A-4 JHPIEGO Technical Report
Table A-8. Malawi Method Mix, by Source
SOURCE MIX (PERCENTAGES) 2000 2015 2000 2015
CONDOMS MALE STERILIZATION
Public Sector (less CBDAs) 38.9 33 4 5
Private Sector (less CBDAs) 2 3 3 3
Mission (including CHAM) 2.8 3 3 4
BLM 7 10 90 88
CBDAs (all) 4.5 7 0 0
Other Sources 43.8 44 0 0
Total 99 100 100 100
FEMALE STERILIZATION IMPLANT Public Sector (less CBDAs) 42.5 47 50 55
Private Sector (less CBDAs) 0.8 0.8 0 2
Mission (including CHAM) 16.4 11.2 10 12
BLM 40.1 41 40 31
CBDAs (all) 0 0 0 0
Other Sources 0.3 0 0 0
Total 100.1 100 100 100
INJECTABLE PILLS
Public Sector (less CBDAs) 79.1 73 59.3 46
Private Sector (less CBDAs) 5.8 7 7.7 8
Mission (including CHAM) 9.5 10 8.8 10
BLM 4.6 10 12.5 15
CBDAs (all) 1 0 10.6 20
Other Sources 0 0 1 1
Total 100 100 99.9 100
IUD TRADITIONAL
Public Sector (less CBDAs) 43 43 1 1
Private Sector (less CBDAs) 2 2 0 0
Mission (including CHAM) 15.6 15.6 25 25
BLM 39.4 39.4 1 1
CBDAs (all) 0 0 1 1
Other Sources 0 0 72 72
Total 100 100
100 100

JHPIEGO Technical Report A-5
Table A-9. Proximate Fertility Determinants for Malawi
2000 2015
Women in Union 71.50% 70.60%
Note: Same rate of decline used as indicated by 1992 and 2000 MDHS. The remaining determinants taken from 2000 MDHS and kept constant.
Table A-10. Alternate Total Fertility Rate (TFR) Projection for Malawi: 5.64 in 2015
YEAR TFR CHANGE 1992 6.73
1993 6.68 0.05
1994 6.63 0.05
1995 6.59 0.04
1996 6.54 0.05
1997 6.49 0.05
1998 6.44 0.05
1999 6.40 0.04
2000 6.35 0.05
2001 6.30 0.05
2002 6.26 0.04
2003 6.21 0.05
2004 6.16 0.05
2005 6.11 0.05
2006 6.07 0.04
2007 6.02 0.05
2008 5.97 0.05
2009 5.93 0.04
2010 5.88 0.05
2011 5.83 0.05
2012 5.78 0.05
2013 5.74 0.04
2014 5.69 0.05
2015 5.64 0.05
Note: Applying same rate of decline as in 1992–2000 period, as indicated by 1992 and 2000 MDHS.

A-6 JHPIEGO Technical Report