estimating urban rail infrastructure …final report 6 2.4 cities with the prospect of mrt...
TRANSCRIPT

A Study on Asia’s Infrastructure Needs Estimating Urban Rail Infrastructure Needs
Final Report
A STUDY ON ASIA’S
INFRASTRUCTURE NEEDS
ESTIMATING URBAN RAIL INFRASTRUCTURE
NEEDS
Final Report
April 2018
Japan International Cooperation Agency Research Institute
Yachiyo Engineering Co., Ltd.

A Study on Asia’s Infrastructure Needs Estimating Urban Rail Infrastructure Needs
Final Report
CONTENTS
INTRODUCTION ......................................................................................................................... 1
1.1 Background ......................................................................................................................................... 1
1.2 Objectives of the Study ....................................................................................................................... 1
1.3 Flow of the Study ................................................................................................................................ 1
1.4 Target Countries .................................................................................................................................. 1
ASSESSMENT OF MRT NEEDS ................................................................................................ 3
2.1 Introduction ......................................................................................................................................... 3
2.2 Review of Literatures and MRT Development ................................................................................... 3
2.3 MRT Operation Timing....................................................................................................................... 4
2.4 Cities with the Prospect of MRT Development .................................................................................. 6
2.5 MRT Length Estimation .................................................................................................................... 17
MRT Length Estimation Model ................................................................................................. 17
Estimates of Future MRT Length .............................................................................................. 19
2.6 MRT Development Investment Needs .............................................................................................. 19
Cost Estimation .......................................................................................................................... 19
Investment Needs between 2016 and 2030 ................................................................................ 22
Appendix 1 ........................................................................................................................................................i
Appendix 2 ......................................................................................................................................................iv
Appendix 3 ................................................................................................................................................... viii
Appendix 4 ....................................................................................................................................................... x
Appendix 5 ......................................................................................................................................................xi

A Study on Asia’s Infrastructure Needs Estimating Urban Rail Infrastructure Needs
Final Report
1
INTRODUCTION
1.1 Background
There have been a few published demand forecasts of infrastructures in Asia. Among them, Infrastructure
for a Seamless Asia (2009) published by ADB and ADB Institute is the most frequently referred study up
to now. This study estimated the infrastructure demand (from year 2010 to 2020) in Asia is estimated would
be around 8 trillion USD. Asian Development Bank (hereinafter referred to as “ADB”) reviewed the study
and published another report titled “Meeting Asia’s Infrastructure Needs”, in February 2017. In this report,
the demand for four economic sectors (power, communication, transportation, and water sanitation sectors)
from 2016 to 2030 is estimated. This report also estimated that the developing countries/areas in Asia need
to invest a total amount of 26.2 trillion USD (in 2015 prices) from 2016 to 2030, 1.7 trillion USD annually
(including costs for climate change measures) to keep up the current economic growth. Without costs for
climate change, 22.6 trillion USD in total and 1.5 trillion USD annually are required. JICA and ADB have
had a discussion on the studies and they agreed to conduct a joint research to review the above demand
forecast of infrastructures until 2030 in Asia.
Other than the four economic sectors that ADB has already estimated for, there are many other social
sectors such as education, health and disaster prevention sectors. In order to estimate accurately the total
amount that Asian counties need to invest, it is desirable to forecast the demands for these social sectors
too.
Based on the above discussions, JICA has launched the research project titled “The Research on the
Infrastructure Demand Forecast in Asia,” for macro level estimation and micro level data collection
targeting the social and disaster prevention sector as well as urban railways.
1.2 Objectives of the Study
The objective of the study is to collect basic information and data on mass rapid transit (MRT) analyze
them and forecast the future needs of MRT as a part of “The Research on the Infrastructure Demand
Forecast in Asia.”
1.3 Flow of the Study
The study forecasts the total MRT length needed by 2030 and the investments in MRT development
expected between 2016 and 2030.
1.4 Target Countries
Table 1-1 below shows the countries targeted by this study which are twenty four in total. It has to be noted
that this study does not include China.

A Study on Asia’s Infrastructure Needs Estimating Urban Rail Infrastructure Needs
Final Report
2
Table 1-1 List of Target Countries
Area Country No.
West & Central
Asia
Afghanistan, Armenia, Azerbaijan, Georgia, Kazakhstan, Kyrgyzstan,
Pakistan, Tajikistan, Turkmenistan, Uzbekistan 10
East Asia Mongolia 1
South Asia Bangladesh, Bhutan, India, Nepal, Sri Lanka 5
Southeast Asia Cambodia, Indonesia, Laos, Malaysia, Myanmar, Philippine, Thailand,
Vietnam 8
Total 24

A Study on Asia’s Infrastructure Needs Estimating Urban Rail Infrastructure Needs
Final Report
3
ASSESSMENT OF MRT NEEDS
2.1 Introduction
Figure 2-1 summarizes the flow of the study for determining the MRT needs and estimating the cost. The
first section reviews the literatures on MRT development, and it is followed by analysis on identifying the
MRT operation timing. Then the socioeconomic data of the target countries are analyzed and cities with
the prospect of MRT development are identified. The last two sections estimate the MRT length and cost
needed, respectively.
Figure 2-1 Study Flow for Estimating MRT Infrastructure Needs
2.2 Review of Literatures and MRT Development
Different studies have been conducted to estimate the infrastructure demand. Fay and Yapes (2003)
estimated infrastructure demand based on socioeconomic variables. They estimated the global demand
based on data across countries and for different sectors including road and rail sectors. Bhattacharyay
(2010) used similar approach, but to estimate infrastructure demand in Asia and the Pacific between 2010
and 2020.
Asian Development Bank (ADB) and Asian Development Bank Institute (ADBI) jointly projected
(2.2) Review of Literatures and
MRT Development
(2.3) MRT Operation
Timing
(2.5) MRT Length
Estimation
(2.4) Cities with the Prospect of MRT
Development
(2.6) MRT Development
Investment Needs
(2.6.1) Cost Estimation
(2.6.2) Investment Needs between
2016 and 2030
A Study on Asia’s Infrastructure Needs Estimating Urban Rail Infrastructure Needs
Final Report
4
infrastructure needs for developing Asia in 2009, and the projection was updated in 2017 by the ADB. In
2009, ADB and ADBI estimated the infrastructure needs from 2010 to 2020 of 32 developing member
countries in its report titled “Infrastructure for a Seamless Asia”. The study which covered four
infrastructure sectors, including the transport sector, projected that the investment needs would be slightly
above 8.22 trillion USD (in 2008 prices). In 2017, the ADB updated the above investment needs in its
report titled “Meeting Asia’s Infrastructure Needs”. Unlike the 2009 study, this one covered all 45
developing countries, and the fifteen years between 2016 and 2030, and it estimated that developing Asia
would need to invest 26 trillion USD (in 2008 prices).
Unlike the above studies which covers various sectors, the Japan International Cooperation Agency (JICA)
conducted studies focusing on the transport sector. In 2011, JICA published a report on a research on urban
transport planning titled “The Research on Practical Approach for Urban Transport Planning”. This
research, which is very much related to this study, reviews the existing urban transport system
developments. It relates the urban transport system developments with the urban socio-economic
conditions for the formulation of medium- and long-term development strategies according to urban socio-
economic development. The study mainly divides the urban transport into two: mass rapid transit (MRT)
and bus rapid transit (BRT) system. Light rail transit (LRT) and monorails are covered under the MRT, and
the study assesses the prospect of MRT as well as BRT system development and timing.
This study fundamentally updates the above JICA study, but only limited to the MRT part. Unlike the 2011
JICA study, the MRT here does not cover monorails or LRT as they have different transport characteristics
and their unit costs may significantly vary. Moreover, this study revises the future MRT needs and establish
more reliable relationships between the urban socio-economic changes and the length of the MRT needed.
2.3 MRT Operation Timing
The JICA (2011) study identified the city GDP level at which a city is likely to operate by analyzing
historical socioeconomic status of the cities with MRT. The study found that most of the cities started their
first MRT operation when their GDP was between 3 billion USD and 30 billion USD (in 2000 prices). It
should be noted that the city GDP here is estimated as the product of the national GDP per capita published
by the World Bank and the urban population the United Nation (World Urbanization Prospect).
The MRT operation timing is analyzed based on similar data, but updated based on the GDP of 2010 prices.
Moreover, the urban population from Demographia is used in combination with the urban growth rates
provided by the UN for more consistency with the urban area data provided by Demographia used in this
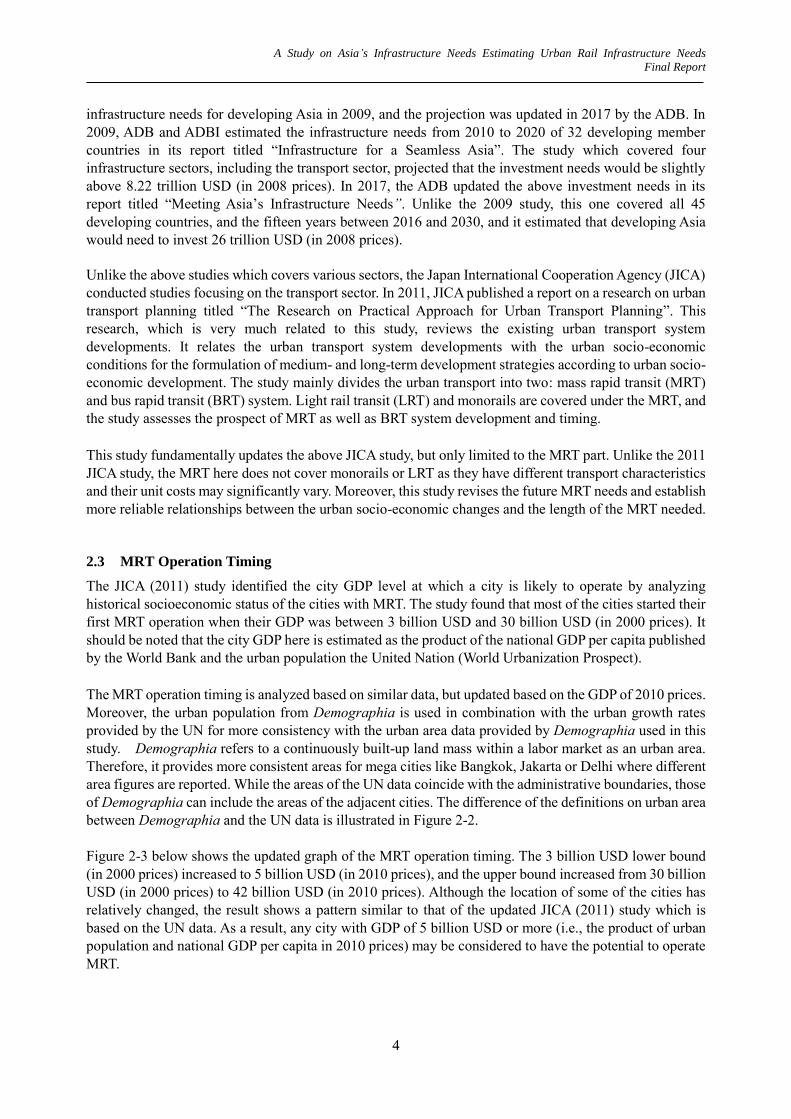
study. Demographia refers to a continuously built-up land mass within a labor market as an urban area.
Therefore, it provides more consistent areas for mega cities like Bangkok, Jakarta or Delhi where different
area figures are reported. While the areas of the UN data coincide with the administrative boundaries, those
of Demographia can include the areas of the adjacent cities. The difference of the definitions on urban area
between Demographia and the UN data is illustrated in Figure 2-2.
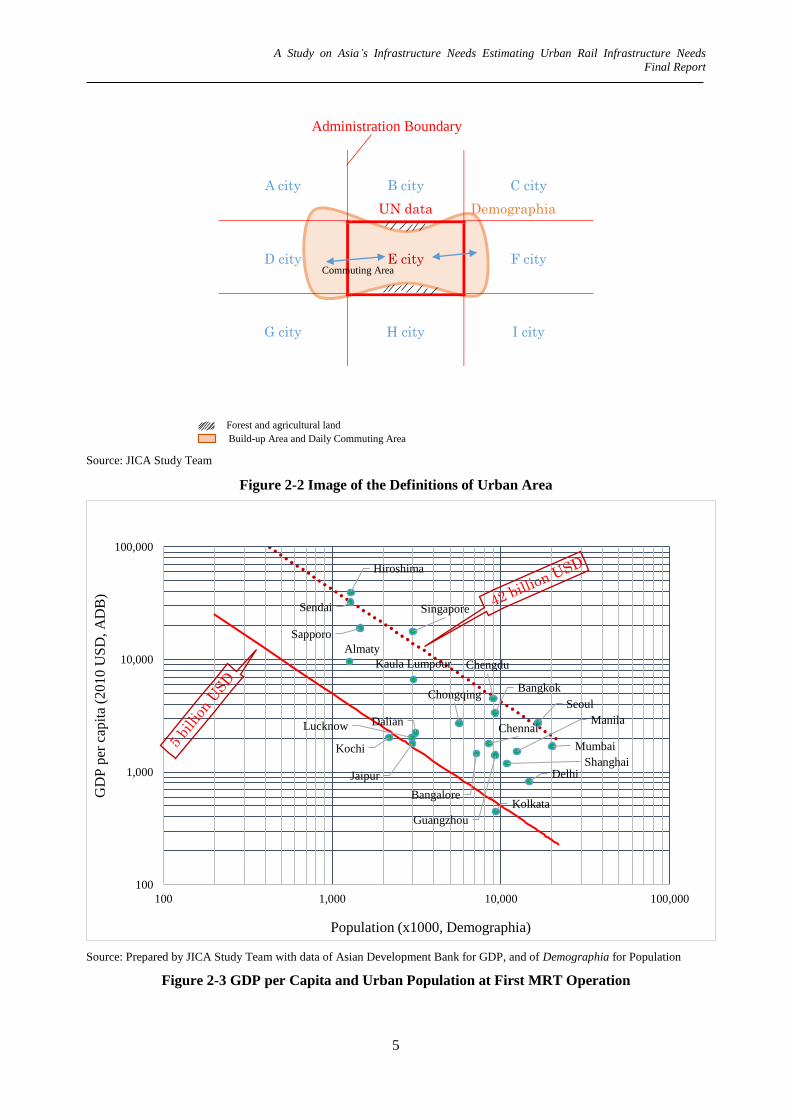
Figure 2-3 below shows the updated graph of the MRT operation timing. The 3 billion USD lower bound
(in 2000 prices) increased to 5 billion USD (in 2010 prices), and the upper bound increased from 30 billion
USD (in 2000 prices) to 42 billion USD (in 2010 prices). Although the location of some of the cities has
relatively changed, the result shows a pattern similar to that of the updated JICA (2011) study which is
based on the UN data. As a result, any city with GDP of 5 billion USD or more (i.e., the product of urban
population and national GDP per capita in 2010 prices) may be considered to have the potential to operate
MRT.
A Study on Asia’s Infrastructure Needs Estimating Urban Rail Infrastructure Needs
Final Report
5
Source: JICA Study Team
Figure 2-2 Image of the Definitions of Urban Area
Source: Prepared by JICA Study Team with data of Asian Development Bank for GDP, and of Demographia for Population
Figure 2-3 GDP per Capita and Urban Population at First MRT Operation
A city
B city
UN data
C city
Demographia
D city
E city
F city
G city
H city
I city
Commuting Area
Forest and agricultural land Build-up Area and Daily Commuting Area
Seoul
Singapore
BangkokChongqing
Guangzhou
Chengdu
Dalian
Shanghai
Kaula Lumpour
Manila
Delhi
Kolkata
Mumbai
Bangalore
Chennai
Jaipur
Kochi
Almaty
Lucknow
Sapporo
Sendai
Hiroshima
100
1,000
10,000
100,000
100 1,000 10,000 100,000
Population (x1000, Demographia)
GD
P p
er c
apit
a (2
010
US
D,
AD
B)
Administration Boundary
A Study on Asia’s Infrastructure Needs Estimating Urban Rail Infrastructure Needs
Final Report
6
2.4 Cities with the Prospect of MRT Development
Considering the time needed for appraisal and development, cities which need MRT by 2030 are targeted
in this study. Section 2.3 has identified that any city with GDP of 5 billion USD (in 2010 prices) or above
has the potential to develop MRT. Therefore all cities with GDP of 5 billion USD or more (i.e., the product
of urban population and national GDP per capita in 2010 prices) are considered to have the potential to
operate MRT.
Based on the above requirement (i.e., 5 billion USD city GDP threshold), all the cities with the potential to
operate MRT by 2030 are identified (refer to Appendix 2 for the list of the cities). The cities are further
classified into those, which as of now, operating MRTs, those with MRT development plans, and those
without plans. The classification is based on the readily available information, and reconfirmation is
advised on the latest plans and status of each candidate city.
Figure 2-4 shows all the cities of the target countries with the potential of operating MRT by 2030 (i.e.,
those with at least 5 billion USD GDP). It includes cities with less than one million population but
satisfying the GDP criteria.

A Study on Asia’s Infrastructure Needs Estimating Urban Rail Infrastructure Needs
Final Report
7
Source: JICA Study Team
Figure 2-4 Cities with the Potential of Operating MRT by 2030

A Study on Asia’s Infrastructure Needs Estimating Urban Rail Infrastructure Needs
Final Report
8
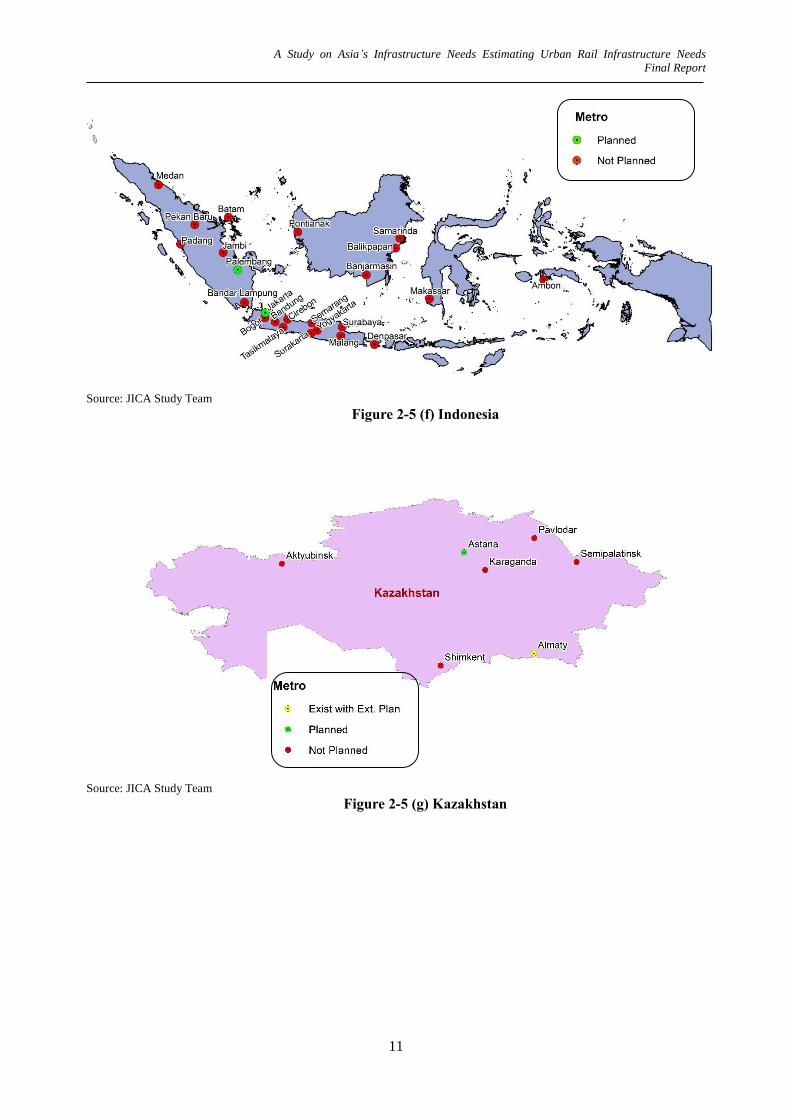
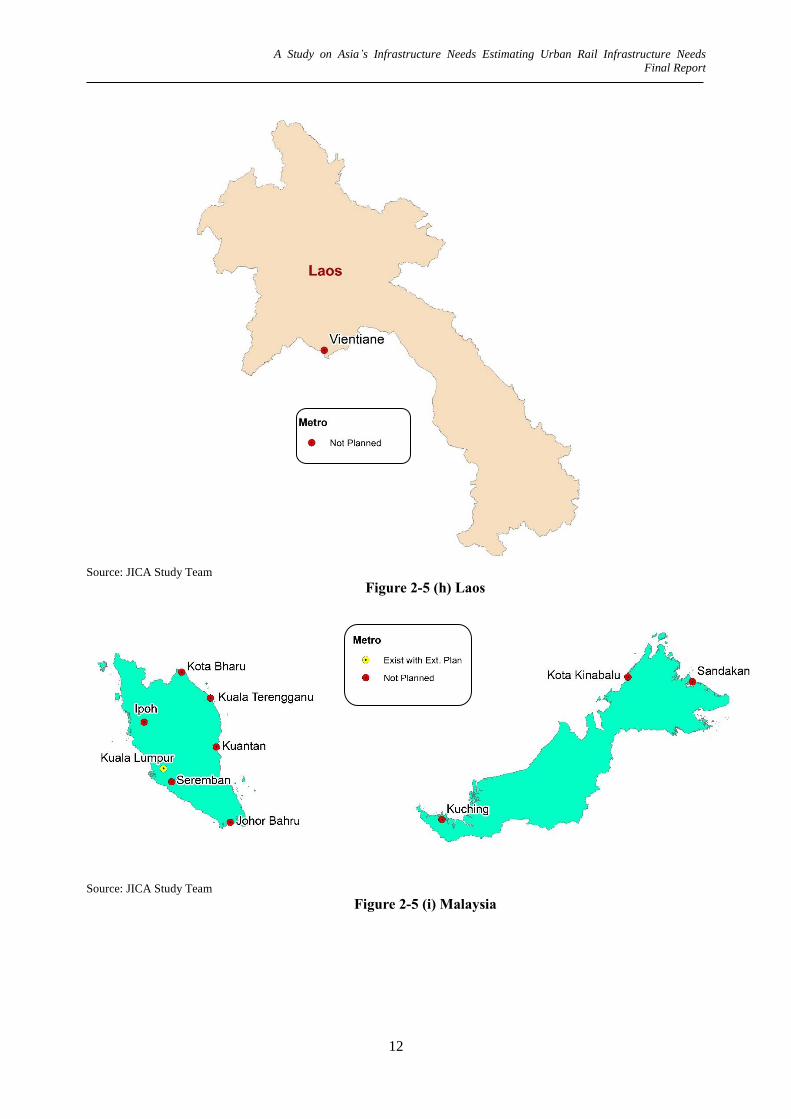
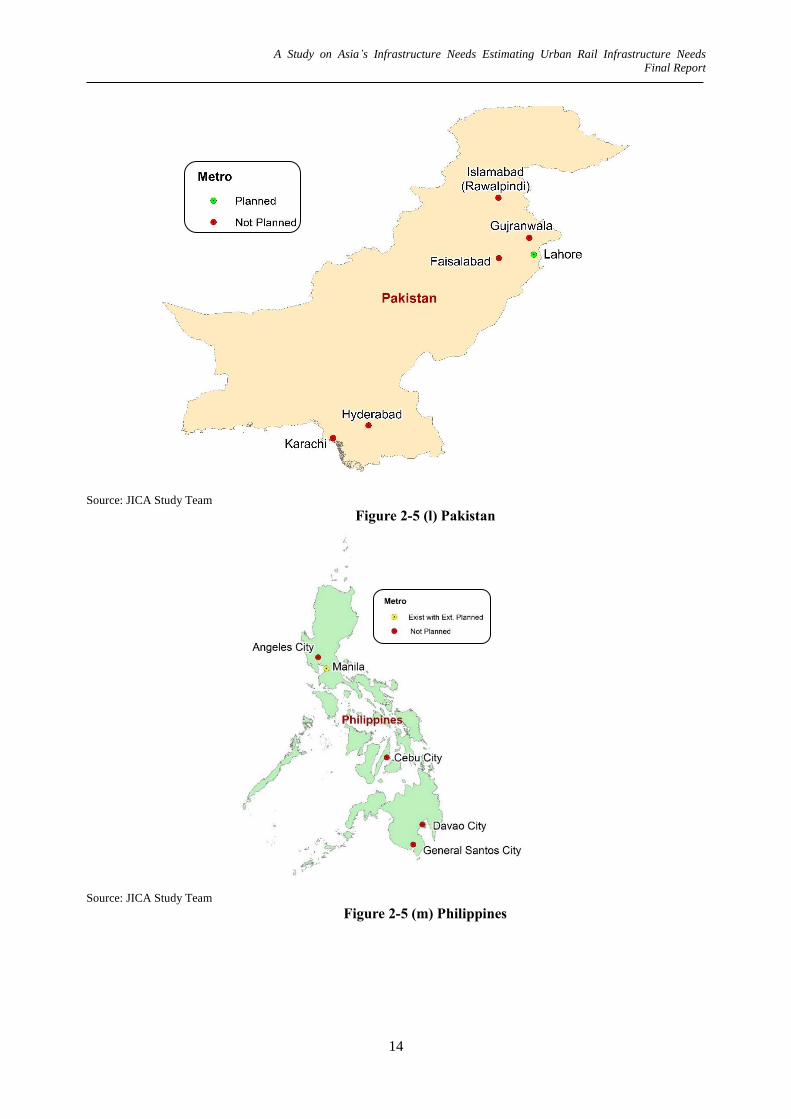
Figure 2-5 (a) to (r) show the MRT needs and plans of each country in detail. It shows cities which are
operating MRT, those who have planned and those which have yet to plan.
Source: JICA Study Team
Figure 2-5 (a) Armenia
Source: JICA Study Team
Figure 2-5 (b) Azerbaijan

A Study on Asia’s Infrastructure Needs Estimating Urban Rail Infrastructure Needs
Final Report
9
Source: JICA Study Team
Figure 2-5 (c) Bangladesh
Source: JICA Study Team
Figure 2-5 (d) Georgia

A Study on Asia’s Infrastructure Needs Estimating Urban Rail Infrastructure Needs
Final Report
10
Source: JICA Study Team
Figure 2-5 (e) India
Varanasi
A Study on Asia’s Infrastructure Needs Estimating Urban Rail Infrastructure Needs
Final Report
11
Source: JICA Study Team
Figure 2-5 (f) Indonesia
Source: JICA Study Team Figure 2-5 (g) Kazakhstan
A Study on Asia’s Infrastructure Needs Estimating Urban Rail Infrastructure Needs
Final Report
12
Source: JICA Study Team
Figure 2-5 (h) Laos
Source: JICA Study Team Figure 2-5 (i) Malaysia

A Study on Asia’s Infrastructure Needs Estimating Urban Rail Infrastructure Needs
Final Report
13
Source: JICA Study Team Figure 2-5 (j) Mongolia
Source: JICA Study Team
Figure 2-5 (k) Myanmar
A Study on Asia’s Infrastructure Needs Estimating Urban Rail Infrastructure Needs
Final Report
14
Source: JICA Study Team
Figure 2-5 (l) Pakistan
Source: JICA Study Team
Figure 2-5 (m) Philippines

A Study on Asia’s Infrastructure Needs Estimating Urban Rail Infrastructure Needs
Final Report
15
Source: JICA Study Team Figure 2-5 (n) Sri Lanka
Source: JICA Study Team
Figure 2-5 (o) Thailand

A Study on Asia’s Infrastructure Needs Estimating Urban Rail Infrastructure Needs
Final Report
16
Source: JICA Study Team
Figure 2-5 (p) Turkmenistan
Source: JICA Study Team
Figure 2-5 (q) Uzbekistan

A Study on Asia’s Infrastructure Needs Estimating Urban Rail Infrastructure Needs
Final Report
17
Source: JICA Study Team
Figure 2-5 (r) Viet Nam
Figure 2-5 Cities with MRT or with the Potential of MRT Development by Country
2.5 MRT Length Estimation
MRT Length Estimation Model
This study used a regression model to establish the relationship between the MRT length and
socioeconomic status of the cities, based on the MRT development and socioeconomic data collected. The
MRT development data include existing and planned MRT length of cities from candidate countries. The
planned MRT development is included under the assumption that the development will be realized as
planned.
The MRT length and MRT density (MRT length per 1,000 inhabitants) are considered as the dependent
variables of the regression model, and their correlations with different explanatory variables (including
GDP, urban population, urban density and urban area) were analyzed (refer to Appendix 3).
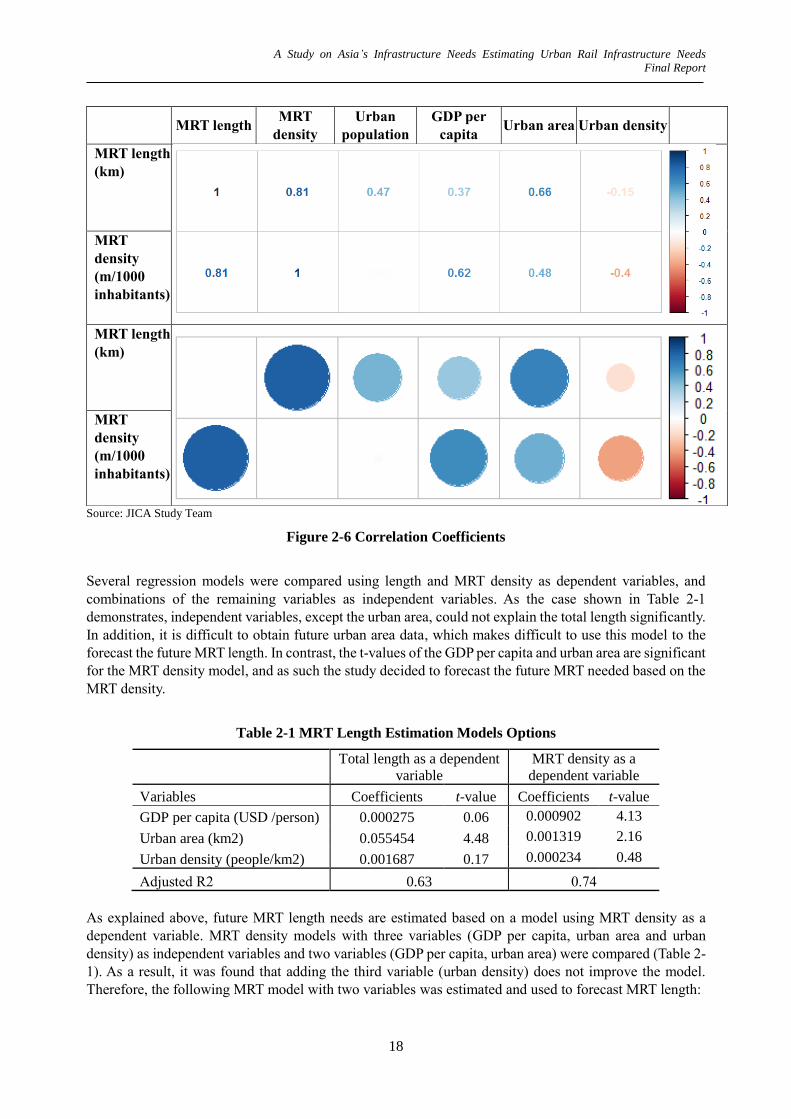
Figure2-6 shows a typical correlation pattern observed by the study. As the figure confirms regression
models with different combinations and numbers of explanatory variables are possible, and study analyzed
and compared different such regression models. Different analyses were also conducted by grouping
different countries (such India, other countries) and compared the regression model results.
A Study on Asia’s Infrastructure Needs Estimating Urban Rail Infrastructure Needs
Final Report
18
Source: JICA Study Team
Figure 2-6 Correlation Coefficients
Several regression models were compared using length and MRT density as dependent variables, and
combinations of the remaining variables as independent variables. As the case shown in Table 2-1
demonstrates, independent variables, except the urban area, could not explain the total length significantly.
In addition, it is difficult to obtain future urban area data, which makes difficult to use this model to the
forecast the future MRT length. In contrast, the t-values of the GDP per capita and urban area are significant
for the MRT density model, and as such the study decided to forecast the future MRT needed based on the
MRT density.
Table 2-1 MRT Length Estimation Models Options
Total length as a dependent
variable
MRT density as a
dependent variable
Variables Coefficients t-value Coefficients t-value
GDP per capita (USD /person) 0.000275 0.06 0.000902 4.13
Urban area (km2) 0.055454 4.48 0.001319 2.16
Urban density (people/km2) 0.001687 0.17 0.000234 0.48
Adjusted R2 0.63 0.74
As explained above, future MRT length needs are estimated based on a model using MRT density as a
dependent variable. MRT density models with three variables (GDP per capita, urban area and urban
density) as independent variables and two variables (GDP per capita, urban area) were compared (Table 2-
1). As a result, it was found that adding the third variable (urban density) does not improve the model.
Therefore, the following MRT model with two variables was estimated and used to forecast MRT length:
MRT length
MRT
density
Urban
population
GDP per
capita Urban area Urban density
MRT length
(km)
MRT
density
(m/1000
inhabitants)
MRT length
(km)
MRT
density
(m/1000
inhabitants)

A Study on Asia’s Infrastructure Needs Estimating Urban Rail Infrastructure Needs
Final Report
19
Length/1,000 inhabitants = *GDP per capita + *Urban area
Where Length is MRT length in meter, GDP per capita in 2010 USD prices, and Urban area in kilometer
square of urban agglomeration. Table 2-2 below shows the summary of the estimation result of the model
with two and three explanatory variables.
Table 2-2 MRT Length Estimation Model Results
Two variables Three variables
Variables Coefficients t-value Coefficients t-value
GDP per capita (USD /person) 0.000912 4.24 0.000902 4.13
Urban area (km2) 0.001392 2.37 0.001319 2.16
Urban density (people/km2) Not applicable 0.000234 0.48
Adjusted R2 0.75 0.74
It should be noted that the sample cities of the above regression model include cities like Jakarta which
planned mostly light rail transit (rather than MRT). As a result, the exclusion of Jakarta alone significantly
improve the above model, which may be more appropriate for MRT oriented cities. But the cities like this
still have the potential to develop MRT and reorient their current transport system development policies.
Estimates of Future MRT Length
The MRT length needed by a city at different socioeconomic level is estimated based on the regression
model explained in Section 2.5.1 above. The lengths needed are estimated for each city at first, then tallied
all for the overall MRT length need in the target cities by 2030. Input values for variables and estimation
results are listed in Appendix 2 and 5 respectively. According to the result, the cities in the target countries
that meet the socioeconomic requirement need 3,199 km MRT length by 2030.
2.6 MRT Development Investment Needs
Cost Estimation
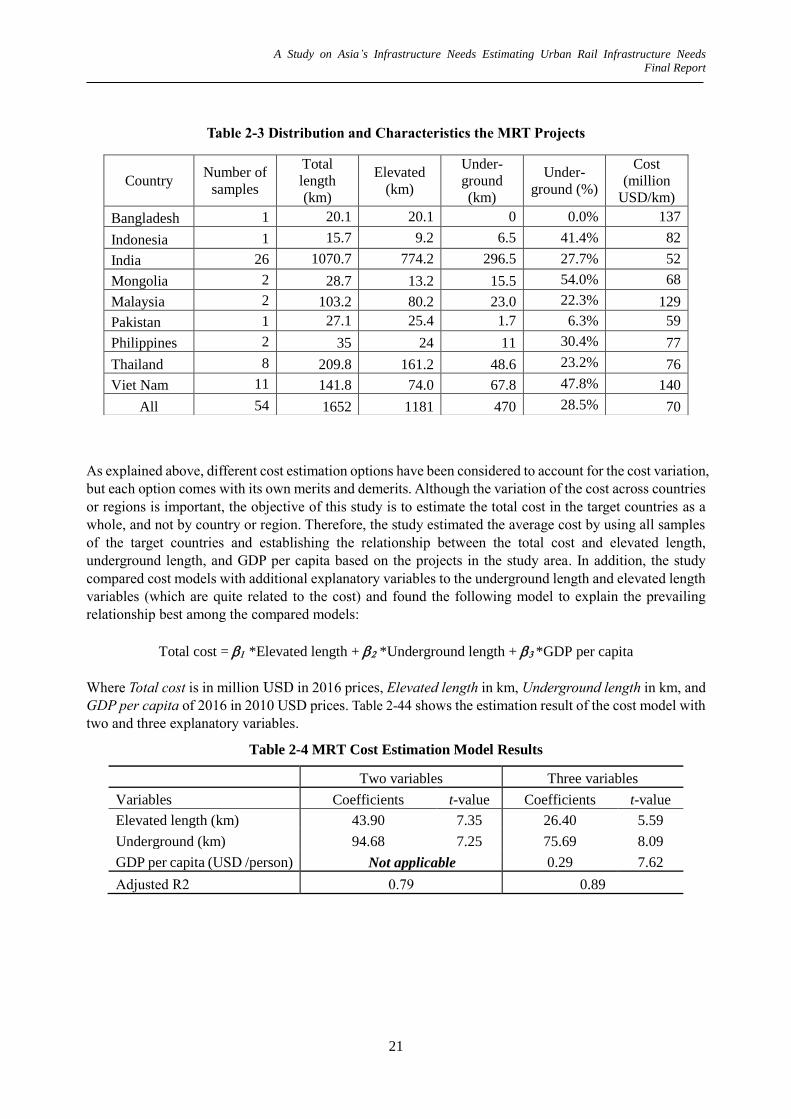
Preliminary analysis of the cost data obtained show significant variation not only across countries but even
within a country. Therefore, the samples used in the cost estimation are not country-wise but project-wise.
The average cost of the MRT is affected by various factors, including the proportion that runs underground
(Figure 2-7). Generally the MRT cost per km increases with the increase of the GDP per capita of a country,
but the data analyses showed more complex situation as indicated in Table 2-3, in which you can see the
cost per km is higher in countries like Bangladesh and Viet Nam than Malaysia. Countries like Bangladesh
and Viet Nam which are introducing MRT for the first time outsource the work, and local involvement is
limited. That could be one of reason behind the relatively higher cost of MRT in lower GDP countries
introducing the MRT for the first time. But this trend is expected to change as the future when the capacity
of the local firms develops (like India’s current situation) and the firms start to undertake significant portion
of the work.
India shows the lowest MRT cost on average (52 million USD/km), although significant variation of costs
is observed even for the same underground proportion (Figure 2-7). But the average cost of the yen-loan
projects in India is higher than the total average and it is about 76 million USD/km. The involvement of
local companies in the MRT development may be the main reason behind the relatively lower average cost
than other countries, but the sources of the differences between yen-loan and non-yen-loan projects are not

A Study on Asia’s Infrastructure Needs Estimating Urban Rail Infrastructure Needs
Final Report
20
clear at this point.
The study considered different options of accounting the variation of the costs explained above. For
example the cost is estimated separately for India and the rest of the target countries, and other options
considered includes dividing the target countries by region (as dry and wet region countries). However, the
representativeness of the results have become the main concern, as the samples are not only limited by
unevenly distributed. The division of the samples into India and the rest of the countries, has
understandably led to statically better results for Indian samples but poorer for samples from the rest of the
countries.
Figure 2-7 MRT Cost by Underground Proportion
0
20
40
60
80
100
120
140
160
180
200
0.0% 20.0% 40.0% 60.0% 80.0% 100.0%
MYS THL IDN MNG PHL IND VTN PAK BGL
Underground (%)
MR
T c
ost
(mil
lion
US
D/k
m)
A Study on Asia’s Infrastructure Needs Estimating Urban Rail Infrastructure Needs
Final Report
21
Table 2-3 Distribution and Characteristics the MRT Projects
As explained above, different cost estimation options have been considered to account for the cost variation,
but each option comes with its own merits and demerits. Although the variation of the cost across countries
or regions is important, the objective of this study is to estimate the total cost in the target countries as a
whole, and not by country or region. Therefore, the study estimated the average cost by using all samples
of the target countries and establishing the relationship between the total cost and elevated length,
underground length, and GDP per capita based on the projects in the study area. In addition, the study
compared cost models with additional explanatory variables to the underground length and elevated length
variables (which are quite related to the cost) and found the following model to explain the prevailing
relationship best among the compared models:
Total cost = *Elevated length + *Underground length + *GDP per capita
Where Total cost is in million USD in 2016 prices, Elevated length in km, Underground length in km, and
GDP per capita of 2016 in 2010 USD prices. Table 2-44 shows the estimation result of the cost model with
two and three explanatory variables.
Table 2-4 MRT Cost Estimation Model Results
Two variables Three variables
Variables Coefficients t-value Coefficients t-value
Elevated length (km) 43.90 7.35 26.40 5.59
Underground (km) 94.68 7.25 75.69 8.09
GDP per capita (USD /person) Not applicable 0.29 7.62
Adjusted R2 0.79 0.89
Country Number of
samples
Total
length
(km)
Elevated
(km)
Under-
ground
(km)
Under-
ground (%)
Cost
(million
USD/km)
Bangladesh 1 20.1 20.1 0 0.0% 137
Indonesia 1 15.7 9.2 6.5 41.4% 82
India 26 1070.7 774.2 296.5 27.7% 52
Mongolia 2 28.7 13.2 15.5 54.0% 68
Malaysia 2 103.2 80.2 23.0 22.3% 129
Pakistan 1 27.1 25.4 1.7 6.3% 59
Philippines 2 35 24 11 30.4% 77
Thailand 8 209.8 161.2 48.6 23.2% 76
Viet Nam 11 141.8 74.0 67.8 47.8% 140
All 54 1652 1181 470 28.5% 70

A Study on Asia’s Infrastructure Needs Estimating Urban Rail Infrastructure Needs
Final Report
22
Investment Needs between 2016 and 2030
Total MRT length needed between 2016 and 2030 is estimated to be 3,199 km, as explained in Section
2.5.2. But only 789 km was built by the end of 2015. Therefore, the MRT length needed between 2016 and
2030 is 2,410 km (i.e., subtracting 789 km from 3,199). The investments needed are estimated using cost
estimation model in Section 2.6.1. The percentage of underground length is assumed to be 28.5%, which
is the average of all the sample projects from target countries shown in Table 2-53, in all target cities. The
estimation results for each city are listed in Appendix 5.
The total investment needed by 2030 and investment made by 2015 are estimated at 275 billion USD and
48 billion USD in 2016 prices, respectively (using cost estimation model in Section 2.6.1). The estimate of
the investment made by 2015 is based on the cost estimation model, and not on the actual investment data.
As a result, the investment in MRT needed between 2016 and 2030 is 227 billion USD in 2016 prices (i.e.,
by subtracting investment made by 2015 from that needed by 2030). The summary of the estimation result
is shown in Table 2-55. The investment needed in MRT between 2016 and 2030 is about 5 times of that
made until 2015, and indicates how important it is for the economic growth of Asia.
Table 2-5 The Estimation Result of Investment Needs
by 2015 2016–2030 Total
Estimated Length (km) 789 2,410 3,199
Estimated Investment
Cost 48 billion USD 227 billion USD 275 billion USD
Trial Calculation of Gap between Need and Actual Investment
Although the total investment need between 2016 and 2030 is estimated to reach 227 billion USD, the
actual investment is not expected to meet the need. The model itself is estimated based on only cities
operating or planning to operate MRT, and the length estimated by applying this model does not reflect the
actual MRT development of all similar cities. In another words, there are cities with socioeconomic level
similar to that of the cities operating or planned to operate MRT, but have not developed MRT.
To estimate the proportion of the MRT that would be actually realized, the study estimated the MRT need
in terms of length in 2015 and compared it with the actual development just for reference. The result of
this analysis shows that the total MRT length built by 2015 was only 58.01% of the need. Assuming that
this trend would continue in the future, it is estimated that actual investment in MRT development would
reach 159 billion USD in 2016 prices by 2030 (i.e., 58.01% of the investment needed). And the actual
investment in MRT between 2016 and 2030 would be 111 billion USD, which is estimated by subtracting
48 billion USD from 159 billion USD. This amount is only 48 % of the original needs (i.e.,227 billion
USD). To fill the gap between the needs and the actual investment, the governments should build
investment plans earlier and also secure sufficient funds for investments.

A Study on Asia’s Infrastructure Needs Estimating Urban Rail Infrastructure Needs
Final Report
23
REFERENCES
Achariya S. R (2009), Modeling Dynamics of Car Ownership and Urban Density for Developing
Cities. Proceedings of the Eastern Asia Society for Transportation Studies, Vol. 7.
Asian Development Bank (2017), Meeting Asia’s Infrastructure Needs,
https://www.adb.org/sites/default/files/publication/227496/special-report-infrastructure.pdf (Last
accessed in April 2018)
Asian Development Bank, Asian Development Bank Institute (2009), Infrastructure for a
Seamless Asia https://www.adb.org/sites/default/files/publication/159348/adbi-infrastructure-
seamless-asia.pdf (Last accessed in April 2018)
Fay, Marianne; and Tito Yepes (2003), Investing in Infrastructure: What is Needed from 2000 to
2010. World Bank Policy Research Working Paper 3102.
Bhattacharyay, B. N. (2010), Estimating Demand for Infrastructure in Energy, Transport,
Telecommunications, Water and Sanitation in Asia and the Pacific: 2010-2020. ADBI Working
Paper Series. No. 248. Tokyo: Asian Development Bank Institute.
Morichi, S., Achariya S. R (2011), Strategic Perspectives on Intercity Transport Development in
Asian Countries. Proceedings of the Eastern Asia Society for Transportation Studies, Vol. 8.
Yai T., Fujisaki K., Itoh R., Kariyazaki K., Kume H., Pan H., Rothengatter W., Suzuki A.,
Tomari N. (2014), Intercity Transport Policy and Planning System: International Comparison
Between the EU, USA, China and Japan. Intercity Transport and Climate Change: Strategies for
Reducing the Carbon Footprint, PP 31-88.

A Study on Asia’s Infrastructure Needs Estimating Urban Rail Infrastructure Needs
Final Report
i
Appendix 1
Comparison of Population Data used in the Study (Data from City Population, Demographia and the UN)

A Study on Asia’s Infrastructure Needs Estimating Urban Rail Infrastructure Needs
Final Report
ii

A Study on Asia’s Infrastructure Needs Estimating Urban Rail Infrastructure Needs
Final Report
iii

A Study on Asia’s Infrastructure Needs Estimating Urban Rail Infrastructure Needs
Final Report
iv
Appendix 2
List of the Urban Agglomerations with Potential of MRT Development
(i.e., with GDP of 5 billion USD or more by 2030)
Country or
area
Urban
Agglomeration
Population
(thousand)
GDP per cap
(USD)
City GDP
(billion USD) Area (km2)
2030 2030 2030
Armenia Yerevan 1372 5861 8.0 376
Azerbaijan Baku 2821 7395 20.9 1127
Bangladesh Chittagong 4187 2074 8.7 181
Bangladesh Dhaka 20440 2074 42.4 368
Georgia Tbilisi 1074 6011 6.5 246
India Agra 2421 4127 10.0 168
India Ahmadabad 8857 4127 36.6 350
India Aligarh 1284 4127 5.3 93
India Allahabad 1623 4127 6.7 124
India Amritsar 1586 4127 6.5 153
India Asansol 1648 4127 6.8 65
India Aurangabad 1661 4127 6.9 93
India Bangalore 12053 4127 49.7 1166
India Bareilly 1375 4127 5.7 83
India Bhopal 2591 4127 10.7 181
India Bhubaneswar 1238 4127 5.1 140
India Chandigarh 1412 4127 5.8 259
India Chennai (Madras) 11935 4127 49.3 1036
India Coimbatore 3093 4127 12.8 285
India Delhi 30410 4127 125.5 2202
India Dhanbad 1578 4127 6.5 101
India Durg-Bhilainagar 1552 4127 6.4 130
India Guwahati (Gauhati) 1306 4127 5.4 194
India Gwalior 1517 4127 6.3 101
India Hyderabad 3683 4127 15.2 117
India Indore 2998 4127 12.4 272
India Jabalpur 1678 4127 6.9 119
India Jaipur 4217 4127 17.4 505
India Jamshedpur 1808 4127 7.5 153
India Jodhpur 1588 4127 6.6 233
India Kannur 2561 4127 10.6 570
India Kanpur 3774 4127 15.6 207
India Kochi (Cochin) 2960 4127 12.2 440
India Kolkata (Calcutta) 17927 4127 74.0 1347
India Kollam 1696 4127 7.0 181
India Kota 1286 4127 5.3 130

A Study on Asia’s Infrastructure Needs Estimating Urban Rail Infrastructure Needs
Final Report
v
Country or
area
Urban
Agglomeration
Population
(thousand)
GDP per cap
(USD)
City GDP
(billion USD) Area (km2)
2030 2030 2030
India Kozhikode (Calicut) 2987 4127 12.3 518
India Lucknow 3958 4127 16.3 363
India Ludhiana 2143 4127 8.8 207
India Madurai 1981 4127 8.2 150
India Malappuram 2636 4127 10.9 324
India Meerut 1929 4127 8.0 161
India Moradabad 1263 4127 5.2 52
India Mumbai (Bombay) 26970 4127 111.3 881
India Mysore 1354 4127 5.6 148
India Nagpur 3321 4127 13.7 272
India Nashik 2188 4127 9.0 135
India Patna 2744 4127 11.3 142
India Pune (Poona) 6958 4127 28.7 583
India Raipur 1668 4127 6.9 142
India Rajkot 1963 4127 8.1 101
India Ranchi 1564 4127 6.5 140
India Salem 1253 4127 5.2 106
India Solapur 1246 4127 5.1 65
India Srinagar 1766 4127 7.3 174
India Surat 6738 4127 27.8 233
India Thiruvananthapura
m 2401 4127 9.9 311
India Thrissur 2793 4127 11.5 363
India Tiruchirappalli 1383 4127 5.7 85
India Tiruppur 1481 4127 6.1 104
India Vadodara 2451 4127 10.1 186
India Varanasi (Benares) 1924 4127 7.9 168
India Vijayawada 2147 4127 8.9 80
India Visakhapatnam 2207 4127 9.1 313
Indonesia Ambon 679 7441 5.1 299
Indonesia Balikpapan 720 7441 5.4 57
Indonesia Bandar Lampung 1130 7441 8.4 106
Indonesia Bandung 7034 7441 52.3 466
Indonesia Banjarmasin 823 7441 6.1 65
Indonesia Batam 1348 7441 10.0 233
Indonesia Bogor 1541 7441 11.5 119
Indonesia Cirebon 1449 7441 10.8 106
Indonesia Denpasar 1406 7441 10.5 179
Indonesia Jakarta 39791 7441 296.1 3302
Indonesia Jambi 705 7441 5.2 78
Indonesia Makassar (Ujung
Pandang) 1830 7441 13.6 179

A Study on Asia’s Infrastructure Needs Estimating Urban Rail Infrastructure Needs
Final Report
vi
Country or
area
Urban
Agglomeration
Population
(thousand)
GDP per cap
(USD)
City GDP
(billion USD) Area (km2)
2030 2030 2030
Indonesia Malang 1396 7441 10.4 246
Indonesia Medan 4885 7441 36.3 479
Indonesia Padang 1089 7441 8.1 101
Indonesia Palembang 1799 7441 13.4 220
Indonesia Pekan Baru 1637 7441 12.2 238
Indonesia Pontianak 823 7441 6.1 62
Indonesia Samarinda 940 7441 7.0 52
Indonesia Semarang 2155 7441 16.0 272
Indonesia Surabaya 6048 7441 45.0 738
Indonesia Surakarta 1670 7441 12.4 207
Indonesia Tasikmalaya 949 7441 7.1 62
Indonesia Yogyakarta 2336 7441 17.4 233
Kazakhstan Aktyubinsk 508 13213 6.7 400
Kazakhstan Almaty 1533 13213 20.3 531
Kazakhstan Astana 735 13213 9.7 181
Kazakhstan Karaganda 564 13213 7.5 293
Kazakhstan Pavlodar 416 13213 5.5 400
Kazakhstan Semipalatinsk 396 13213 5.2 210
Kazakhstan Shimkent 873 13213 11.5 135
Lao People's
Democratic
Republic
Vientiane 1664 3183 5.3 130
Malaysia Ipoh 969 18752 18.2 259
Malaysia Johor Bahru 2009 18752 37.7 816
Malaysia Kota Bharu 433 18752 8.1 116
Malaysia Kota Kinabalu 673 18752 12.6 351
Malaysia Kuala Lumpur 8249 18752 154.7 2124
Malaysia Kuala Terengganu 476 18752 8.9 605
Malaysia Kuantan 617 18752 11.6 324
Malaysia Kuching 859 18752 16.1 181
Malaysia Sandakan 467 18752 8.8 2266
Malaysia Seremban 677 18752 12.7 155
Mongolia Ulaanbaatar 1372 7561 10.4 311
Myanmar Yangon 6837 2404 16.4 596
Pakistan Faisalabad 5252 1621 8.5 311
Pakistan Gujranwala 3170 1621 5.1 148
Pakistan Hyderabad 3683 1621 6.0 117
Pakistan Karachi 28368 1621 46.0 1010
Pakistan Lahore 12585 1621 20.4 842
Pakistan Rawalpindi-
Islamabad 3707 1621 6.0 427
Philippines Angeles City 1080 5151 5.6 186
A Study on Asia’s Infrastructure Needs Estimating Urban Rail Infrastructure Needs
Final Report
vii
Country or
area
Urban
Agglomeration
Population
(thousand)
GDP per cap
(USD)
City GDP
(billion USD) Area (km2)
2030 2030 2030
Philippines Cebu City 3075 5151 15.8 207
Philippines Davao City 2935 5151 15.1 130
Philippines General Santos City 1912 5151 9.8 75
Philippines Manila 29909 5151 154.1 1787
Sri Lanka Colombo 4812 8381 40.3 777
Thailand Chon Buri 734 10558 7.8 166
Thailand Krung Thep
(Bangkok) 16493 10558 174.1 3043
Thailand Lampang 576 10558 6.1 22
Thailand Nakhon Ratchasima 505 10558 5.3 40
Thailand Rayong 527 10558 5.6 17
Thailand Udon Thani 734 10558 7.8 73
Turkmenistan Ashgabat 921 13065 12.0 122
Turkmenistan Tashauz 420 13065 5.5 60
Uzbekistan Tashkent 2810 3187 9.0 1075
Viet Nam Hà Noi 7954 3516 28.0 868
Viet Nam Hai Phòng 1522 3516 5.4 570
Viet Nam Thành Pho Ho Chí
Minh (Ho Chi Minh City)
11172 3516 39.3 1580
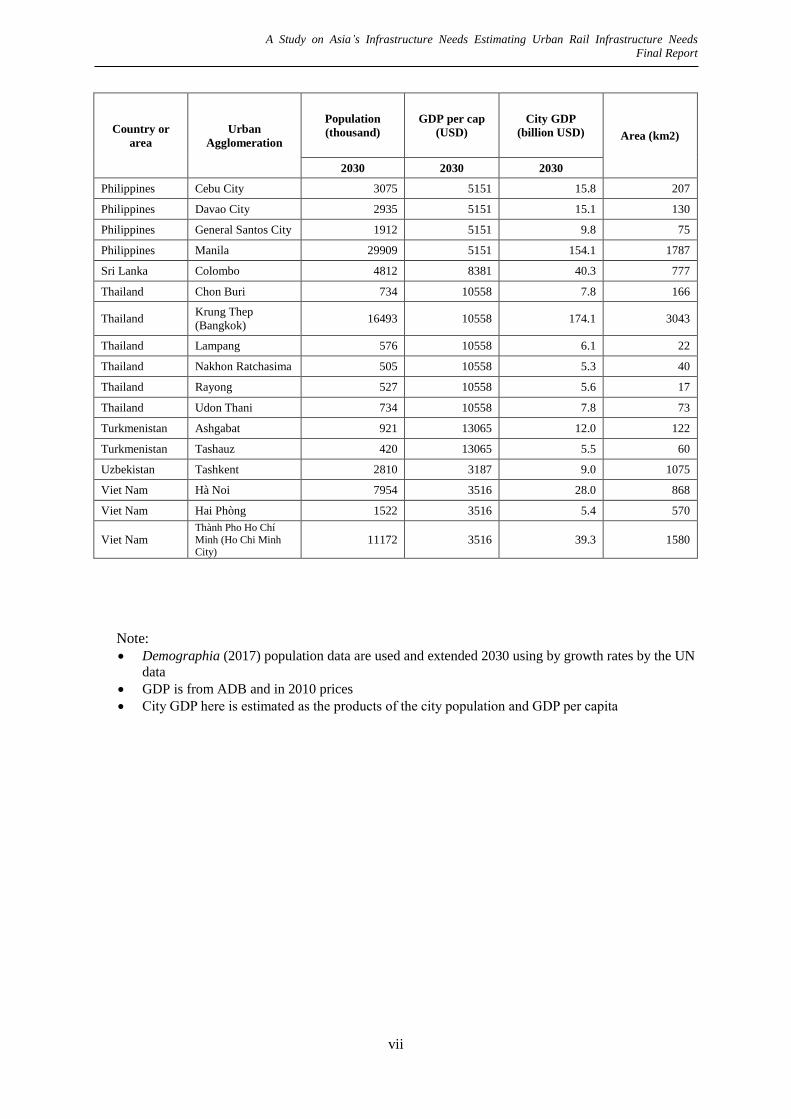
Note:
Demographia (2017) population data are used and extended 2030 using by growth rates by the UN
data
GDP is from ADB and in 2010 prices
City GDP here is estimated as the products of the city population and GDP per capita

A Study on Asia’s Infrastructure Needs Estimating Urban Rail Infrastructure Needs
Final Report
viii
Appendix 3
Data for MRT Length Estimation Model
Country City
MRT
Operati
on Year
Model
Length
(km)
MRT
Density
(m/1000
people)
GDP
per
Capita
(USD,
2010
price)
Urban
Area
(km2,
Demogr
aphia
2017)
City
Density
(people/
km2)
GDP
(USD,
2010
price)
Populati
on
(Operati
on year)
Indonesi
a Jakarta 2018 15.7 0.5 4342 3302 990 4342 32688
Indonesi
a Jakarta 2020 23.8 0.7 4735 3302 1020 4735 33665
Philippin
es Manila 2020 39.7 1.5 3278 1787 1458 3278 26055
Azerbaij
an Baku 2016 36.6 13.1 5922 1127 248 5922 2797
Banglad
esh Dhaka 2019 20.1 1.1 1213 368 5146 1213 18937
Kazakhs
tan Almaty 2015 10.3 7.0 10597 531 278 10597 1475
Malaysia Kuala
Lumpur 2017 59.6 7.6 11522 2124 370 11522 7863
Malaysia Kuala
Lumpur 2020 111.8 12.7 12839 2124 413 12839 8780
Pakistan Lahore 2019 27.1 2.3 1247 842 1402 1247 11807
Thailand Bangkok 2017 122.7 7.6 6140 3043 528 6140 16052
Thailand Bangkok 2018 149.5 9.1 6362 3043 541 6362 16471
Thailand Bangkok 2019 191.0 11.3 6611 3043 556 6611 16912
Thailand Bangkok 2020 225.5 13.0 6884 3043 571 6884 17378
Thailand Bangkok 2021 247.3 13.8 7181 3043 587 7181 17870
Thailand Bangkok 2022 310.5 16.9 7498 3043 604 7498 18391
Thailand Bangkok 2023 311.4 16.4 7832 3043 623 7832 18943
Vietnam Ho Chi
Minh 2017 11.3 1.1 1840 1580 681 1840 10758
Vietnam Ho Chi
Minh 2020 31.0 2.6 2124 1580 761 2124 12031
Vietnam Hanoi 2018 21.0 2.4 1930 868 1008 1930 8748
Vietnam Hanoi 2019 32.5 3.5 2024 868 1073 2024 9310
India Agra 2022 14.0 5.7 2711 168 1463 2711 2457
India Ahmada
bad 2022 18.5 1.9 2711 350 2761 2711 9665
India Bangalor
e 2017 42.4 3.9 2037 1166 944 2037 11005
India Bangalor
e 2024 114.5 7.3 3023 1166 1350 3023 15746
India Bhopal 2021 15.0 6.0 2565 181 1385 2565 2508
India Chennai 2017 47.4 4.5 2037 1036 1023 2037 10599
India Delhi 2011 190.0 8.3 1460 2202 1035 1460 22791
India Delhi 2018 365.6 12.9 2161 2202 1289 2161 28380
India Jaipur 2015 9.6 2.8 1802 505 689 1802 3479
India Jaipur 2018 11.9 3.2 2161 505 751 2161 3792

A Study on Asia’s Infrastructure Needs Estimating Urban Rail Infrastructure Needs
Final Report
ix
Country City
MRT
Operati
on Year
Model
Length
(km)
MRT
Density
(m/1000
people)
GDP
per
Capita
(USD,
2010
price)
Urban
Area
(km2,
Demogr
aphia
2017)
City
Density
(people/
km2)
GDP
(USD,
2010
price)
Populati
on
(Operati
on year)
India Kochi 2017 18.0 6.9 2037 440 591 2037 2599
India Kolkata 1984 27.2 2.3 448 1347 883 448 11889
India Kolkata 2018 41.9 2.8 2161 1347 1128 2161 15196
India Kozhiko
de 2021 13.3 3.9 2565 518 662 2565 3430
India Luckno
w 2017 8.5 2.5 2037 363 943 2037 3422
India Mumbai 2020 56.1 2.3 2425 881 2779 2425 24486
India Mumbai 2023 128.1 5.0 2864 881 2933 2864 25837
India Pune 2018 31.3 4.9 2161 583 1086 2161 6330
India
Thiruvan
anthapur
am
2022 21.8 8.3 2711 311 845 2711 2627

A Study on Asia’s Infrastructure Needs Estimating Urban Rail Infrastructure Needs
Final Report
x
Appendix 4
Data for MRT Cost Estimation Model
Country City
Total cost
(million
USD)
Elevated+
At Grade
Under-
ground
GDP per
Capita
in 2016
(USD,
2010
price)
Total
(km)
Under-
ground
(%)
Unit Cost
(million
USD/km)
Density
(people/
km2)
MNG Ulaanbaat
ar 970 8.1 7.3 3,883 15.4 47.4% 63 4200
MNG Ulaanbaat
ar 985 5.1 8.2 3,883 13.3 61.7% 74 4200
PAK Lahore 1600 25.4 1.7 1,165 27.1 6.3% 59 12700
BGL Dhaka 2748 20.1 0.0 1026 20.1 0.0% 137 45700
IDN Jakarta 1290 9.2 6.5 3988 15.7 41.4% 82 9600
MYS Kuala
Lumpur 5194 41.5 9.5 11179 51 18.6% 102 3600
MYS Kuala
Lumpur 8130 38.7 13.5 11179 52.2 25.9% 156 3600
PHL Manila 1293 1.2 10.5 2,751 11.7 89.7% 111 13600
PHL Manila 1380 22.8 0.0 2,751 22.8 0.0% 61 13600
THL Bangkok 2371 21.5 5.4 5,946 26.9 20.1% 88 5100
THL Bangkok 1727 23.0 0 5,946 23 0.0% 75 5100
THL Bangkok 2996 11.0 12.6 5,946 23.6 53.4% 127 5100
THL Bangkok 3175 9.0 30.6 5,946 39.6 77.3% 80 5100
THL Bangkok 707 12.8 0 5,946 12.8 0.0% 55 5100
THL Bangkok 1694 19.0 0 5,946 19 0.0% 89 5100
THL Bangkok 1633 34.5 0 5,946 34.5 0.0% 47 5100
THL Bangkok 1576 30.4 0 5,946 30.4 0.0% 52 5100
VTN HCMC 2490 17.1 2.6 1,746 19.7 13.2% 126 6,600
VTN HCMC 2075 1.6 9.6 1,746 11.2 85.7% 185 6,600
VTN HCMC 1482 4.9 4.2 1,746 9.1 46.2% 163 6,600
VTN HCMC 2714 28 0 1,746 28 0.0% 97 6,600
VTN HCMC 1563 1.43 7.46 1,746 8.89 83.9% 176 6,600
VTN HCMC 2183 5.6 8.9 1,746 14.5 61.4% 151 6,600
VTN HCMC 1820 0 10 1,746 10 100.0% 182 6,600
VTN HCMC 1200 9.3 0.6 1,746 9.9 6.1% 121 6,600
VTN HCMC 1870 3.1 9.1 1,746 12.2 74.6% 153 6,600
VTN HCMC 1330 0 6.8 1,746 6.8 100.0% 196 6,600
VTN Hanoi 1177 3.0 8.5 1,746 11.5 73.9% 102 9000

A Study on Asia’s Infrastructure Needs Estimating Urban Rail Infrastructure Needs
Final Report
xi
Appendix 5
Estimated Results of MRT Length and Cost
Country or area Urban Agglomeration Estimated Length
Needed (km)
Estimated Cost
(million USD)
Armenia Yerevan 8.05 1450
Azerbaijan Baku 23.44 2674
Bangladesh Chittagong 8.97 662
Bangladesh Dhaka 49.12 2286
Georgia Tbilisi 6.25 1359
India Agra 9.67 948
India Ahmadabad 37.64 2079
India Aligarh 4.99 759
India Allahabad 6.39 815
India Amritsar 6.30 812
India Asansol 6.35 814
India Aurangabad 6.46 818
India Bangalore 64.90 3182
India Bareilly 5.33 773
India Bhopal 10.40 978
India Bhubaneswar 4.90 755
India Chandigarh 5.82 792
India Chennai (Madras) 62.11 3069
India Coimbatore 12.86 1077
India Delhi 207.60 8954
India Dhanbad 6.16 806
India Durg-Bhilainagar 6.12 805
India Guwahati (Gauhati) 5.27 770
India Gwalior 5.92 797
India Hyderabad 14.45 1142
India Indore 12.41 1059
India Jabalpur 6.59 824
India Jaipur 18.83 1319
India Jamshedpur 7.19 848
India Jodhpur 6.49 820
India Kannur 11.66 1029
India Kanpur 15.29 1175
India Kochi (Cochin) 12.95 1081
India Kolkata (Calcutta) 101.05 4644
India Kollam 6.81 832
India Kota 5.07 762
India Kozhikode (Calicut) 13.39 1099
India Lucknow 16.89 1240
India Ludhiana 8.68 908
India Madurai 7.87 875
India Malappuram 11.11 1006
India Meerut 7.69 868
India Moradabad 4.84 753

A Study on Asia’s Infrastructure Needs Estimating Urban Rail Infrastructure Needs
Final Report
xii
Country or area Urban Agglomeration Estimated Length
Needed (km)
Estimated Cost
(million USD)
India Mumbai (Bombay) 134.53 5999
India Mysore 5.37 774
India Nagpur 13.75 1113
India Nashik 8.64 907
India Patna 10.87 997
India Pune (Poona) 31.82 1844
India Raipur 6.60 824
India Rajkot 7.66 867
India Ranchi 6.19 807
India Salem 4.90 755
India Solapur 4.80 751
India Srinagar 7.07 843
India Surat 27.53 1671
India Thiruvananthapuram 10.07 964
India Thrissur 11.92 1039
India Tiruchirappalli 5.37 774
India Tiruppur 5.78 791
India Vadodara 9.86 956
India Varanasi (Benares) 7.69 868
India Vijayawada 8.31 893
India Visakhapatnam 9.27 932
Indonesia Ambon 4.89 1360
Indonesia Balikpapan 4.94 1362
Indonesia Bandar Lampung 7.83 1479
Indonesia Bandung 52.27 3276
Indonesia Banjarmasin 5.66 1391
Indonesia Batam 9.58 1549
Indonesia Bogor 10.71 1595
Indonesia Cirebon 10.04 1568
Indonesia Denpasar 9.89 1562
Indonesia Jakarta 452.76 19476
Indonesia Jambi 4.86 1358
Indonesia Makassar (Ujung Pandang) 12.87 1682
Indonesia Malang 9.95 1564
Indonesia Medan 36.39 2634
Indonesia Padang 7.54 1467
Indonesia Palembang 12.75 1678
Indonesia Pekan Baru 11.65 1633
Indonesia Pontianak 5.65 1391
Indonesia Samarinda 6.45 1423
Indonesia Semarang 15.44 1786
Indonesia Surabaya 47.23 3072
Indonesia Surakarta 11.81 1640
Indonesia Tasikmalaya 6.52 1426
Indonesia Yogyakarta 16.60 1833
Kazakhstan Aktyubinsk 6.40 3328

A Study on Asia’s Infrastructure Needs Estimating Urban Rail Infrastructure Needs
Final Report
xiii
Country or area Urban Agglomeration Estimated Length
Needed (km)
Estimated Cost
(million USD)
Kazakhstan Almaty 19.60 3862
Kazakhstan Astana 9.03 3435
Kazakhstan Karaganda 7.02 3353
Kazakhstan Pavlodar 5.24 3281
Kazakhstan Semipalatinsk 4.89 3267
Kazakhstan Shimkent 10.68 3501
Laos Vientiane 5.13 677
Malaysia Ipoh 16.91 3941
Malaysia Johor Bahru 36.62 4739
Malaysia Kota Bharu 7.47 3560
Malaysia Kota Kinabalu 11.83 3736
Malaysia Kuala Lumpur 165.39 9947
Malaysia Kuala Terengganu 8.55 3603
Malaysia Kuantan 10.83 3695
Malaysia Kuching 14.91 3860
Malaysia Sandakan 9.46 3640
Malaysia Seremban 11.72 3731
Mongolia Ulaanbaatar 10.05 1538
Myanmar Yangon 20.65 1171
Pakistan Faisalabad 10.03 745
Pakistan Gujranwala 5.34 555
Pakistan Hyderabad 6.04 584
Pakistan Karachi 81.79 3648
Pakistan Lahore 33.34 1688
Pakistan Rawalpindi-Islamabad 7.68 650
Philippines Angeles City 5.35 1018
Philippines Cebu City 15.32 1421
Philippines Davao City 14.31 1380
Philippines General Santos City 9.18 1173
Philippines Manila 214.80 9490
Sri Lanka Colombo 41.96 2817
Thailand Chon Buri 7.24 2025
Thailand Krung Thep (Bangkok) 228.57 10978
Thailand Lampang 5.56 1957
Thailand Nakhon Ratchasima 4.89 1930
Thailand Rayong 5.08 1938
Thailand Udon Thani 7.14 2021
Turkmenistan Ashgabat 11.12 2535
Turkmenistan Tashauz 5.03 2288
Uzbekistan Tashkent 12.37 1098
Viet Nam Hà Noi 35.10 1928
Viet Nam Hai Phòng 6.09 755
Viet Nam Ho Chi Minh City 60.37 2950
Total 3,199 274,535