estimation of the “c” value considered in the aashto-93 ... · estimation of the “c” value...
TRANSCRIPT

Estimation of the “C” Value Considered In the AASHTO-93 Guide for Back Analysis of the Elastic Modulus of the Subgrade
Sydney, September 2011
Urbáez & Giovanon: Estimation of the “C” Value Considered In the AASHTO-93 Guide for Back Analysis of the Elastic
Modulus of the Subgrade.
i
Estimation of the “C” Value Considered In the AASHTO-93 Guide for Back Analysis of the Elastic Modulus of the Subgrade
Authors:
Ernesto Urbáez1; Oscar Giovanon2
(1) Fugro-PMS, Senior Engineer, Sydney, Australia [email protected] (2) IMAE, Associate Investigator, Rosario, Argentina [email protected]
Summary
This investigation focuses on the estimation of the “C” value included in the methodology for back analysis of the subgrade elastic modulus of the AASHTO-93 Guide for Pavement Design.
Within the main investigation to evaluate the behaviour of the pavement during its period of design, it emphasises The AASHTO Road Experiment, held in the United States of America in the decade of 1950s. This experiment produced his first results at the beginning of 1960s, publishing several temporary guides, until 1993 when it published the latest guide, called “AASHTO Guide for Design of Pavement Structures”.
The AASHTO-93 Guide has been used and it is still using by many road agencies within the USA and around the world. This guide includes a methodology for back analysis of the superficial deflections using the Falling Weight Deflectometer in order to estimate the elastic modulus of the subgrade.
In comparison with other back analysis methodologies; the AASHTO-93 Guide brings simple and less computational proceedings to estimate the elastic modulus of the subgrade materials. However, according to the recommendations included in the guide, the back analysed resilient modulus of the subgrade, must be affected by an adjustment factor “C” of 0.33, considering that this modulus -in general- is higher than those obtained in the laboratory. The guide alerts about the use of this adjustment factor “C” of 0.33, considering that it responds to the pavement materials of the AASHTO Road Experiment. Hence, they recommend estimating it for each individual project, based on historical data, characteristic of the materials or laboratory test results.
On this basis, this investigation compared the subgrade resilient modulus obtained from the laboratory on samples extracted from an existing road, and the modulus obtained applying the AASHTO-93 back analysis methodology. The route used for the development of the present work corresponds to 22 kilometres of the Provincial Route No 6, located in the Province of Buenos Aires, Argentina.
This paper showed, based on the pavement materials that have been surveyed, that an average “C” value of 0.72 should instead be used; this is more than double of the recommended value of 0.33. This finding impacts the final result of the elastic modulus of the subgrade incrementing its value, and finally the expected structural behavior of the pavement.
ACNOWLEDGEMENT: This work was made with the collaboration of the Institute of Applied Mechanics and Structures of the Faculty of Exact Sciences, Engineering and Agrimensure (IMAE) of the National University of Rosario (Argentina), the Laboratory of Pavements and Road Engineering (LAPIV) of the National University of La Plata, (Argentina) and the Consultants: Consulbaires, S.A. and Projects and Special Studies, S.A. (PEESA), as well as the Builder Company Jose Cartellone Civil Constructions, S.A.

Estimation of the “C” Value Considered In the AASHTO-93 Guide for Back Analysis of the Elastic Modulus of the Subgrade
Sydney, September 2011
Urbáez & Giovanon: Estimation of the “C” Value Considered In the AASHTO-93 Guide for Back Analysis of the Elastic
Modulus of the Subgrade.
ii
Table of Content Summary… ................................................................................................................................. i
Table of Content..........................................................................................................................ii
List of Tables.............................................................................................................................. iii
List of Figures............................................................................................................................. iii
1. Introduction............................................................................................................................ 1
1.1. Proposed Methodology ................................................................................................... 2
2. Field Evaluation ..................................................................................................................... 3
3. Elastic Modulus of the Materials ............................................................................................ 7
3.1. Dynamic Modulus of the Asphalt Materials (MDin-ma) .................................................... 7
3.2. Resilient Modulus for Unbound Materials...................................................................... 11
4. Site Resilient Modulus (MRsite-sr) ....................................................................................... 19
4.1. KENLAYER Software.................................................................................................... 19
5. AASHTO-93 Methodology for Back Analysis of the Subgrade Resilient Modulus................. 23
5.1. AASHTO-1993 Methodology......................................................................................... 23
6. “C” Adjustment Factor Analysis Results............................................................................... 27
6.1. “C” Adjustment Factor ................................................................................................... 27
6.2. Analysis Results............................................................................................................ 28
7. Conclusions and Recommendations.................................................................................... 30
8. References .......................................................................................................................... 31

Estimation of the “C” Value Considered In the AASHTO-93 Guide for Back Analysis of the Elastic Modulus of the Subgrade
Sydney, September 2011
Urbáez & Giovanon: Estimation of the “C” Value Considered In the AASHTO-93 Guide for Back Analysis of the Elastic
Modulus of the Subgrade.
iii
List of Tables
Table 2-1 Summary of Laboratory Tests and Typical Pavement Structures Material Found ....... 5
Table 3-1 Dynamic Modulus of the Asphalt Concrete ................................................................. 8
Table 3-2 Dynamic Modulus of the Hot Sand “Tosca” Asphalt Mix. .......................................... 10
Table 3-3 Summary of the Resilient Modulus Constitutive Equations of the Tested Materials .. 14
Table 3-4 Summary of Constitutive Constants.......................................................................... 18
Table 3-5 Resilient Modulus of the Subgrade Based on a Deviator Stress of 0.0414 MPa (6.0 psi) ......................................................................................................................... 17
Table 4-1 Principal Stresses. KENLAYER Program –HUANG, 1993-....................................... 21
Table 4-2 MRsite-sr. KENLAYER Program–HUANG, 1993-..................................................... 21
Table 5-1 Back Analysed Resilient Modulus of the Subgrade (MRrs-sr). AASHTO-93 Model... 26
Table 6-1 “C” Adjustment Factor Results. AASHTO-93 Model.................................................. 27
List of Figures Figure 2-1 Homogeneous Sections Analysis of Provincial Route No. 6 ...................................... 4
Figure 3-1 Master Curve for 10 Hz. Samples from Test Pit No. 4 ............................................... 9
Figure 3-2 Typical Scheme of the Cycle of Load and Unloading. Three-dimensional Test Chamber ................................................................................................................ 11
Figure 3-3 Typical Resilient Modulus Relationship for Frictional and Cohesive Materials ......... 12
Figure 3-4 Relationship of the Resilient Modulus and the Deviator Stress (σd). Test Pit No. 4, Sample C4M21 ...................................................................................................... 15
Figure 3-5 Schematic Illustration of the Constants for the Subgrade Material (Test Pit No. 1) .. 16
Figure 5-1 Schematic of FWD Test - Deflection Basin and Zone of Stress ............................... 24
Estimation of the “C” Value Considered In the AASHTO-93 Guide for Back Analysis of the Elastic Modulus of the Subgrade
Sydney, September 2011
Urbáez & Giovanon: Estimation of the “C” Value Considered In the AASHTO-93 Guide for Back Analysis of the Elastic
Modulus of the Subgrade.
Estimation of the “C” Value Considered In the AASHTO-93 Guide for Back Analysis of the Elastic Modulus of the Subgrade
1. Introduction
The present investigation considered the methodology to estimate the back analysis of the elastic modulus of the subgrade included in the AASHTO-93 Guide for Pavement Design1, based on the measurement of the superficial deflections with the equipment Falling Weight Deflectometer (FWD).
The Guide AASHTO-1993 arises from the AASHTO Road Experiment Test, which was carried out in the United States of America in 1950s. This experiment comprised of a real scale track, that actually takes part of the Route Interstate 80 in the proximities of Ottawa, Illinois in the USA. It was a controlled track with a homogeneous subgrade along the whole section.
The subgrade comprised of 90cm of a selected ground, with ASSHTO classification soil of A-6 type, and a soak laboratory California Bearing Ratio (CBR) between 2% and 4%. For this type of subgrade, the laboratory resilient modulus considered was 20.7 MPa (3,000 psi), product of the application of a deviator stress of 0.0414MPa (6.0 psi).
It is important to consider, that for cohesive soils similar to those of the AASHTO Road Experiment, the subgrade elastic modulus increases rapidly for a deviator stress below 0.0414 MPa (6.0 psi) and vice versa, considering the stress dependant behaviour of the unbound materials.
In consequence, –in general- the modulus obtained by the back analysis of the deflection bowl using the AASHTO-93 methodology, is higher than the expected, considering that this methodology seeks to estimate the resilient modulus of the subgrade to a distance sufficiently away from the applied load, for which the deflection is the result of the single deformation of the subgrade and in this area the state of stresses are lower in comparison to the applied area of the load. Hence, the AASHTO-93 Guide incorporates a ”C” adjustment factor that allows to fit the back analysed subgrade resilient modulus. On the other hand, the guide alerts about the use of this adjustment factor, considering that it corresponds to the results obtained of the subgrade of the AASHTO experiment, reason why they recommend to consider an own “C” factor or characteristic one, taking into consideration each project in particular.
On this basis, the objective of this investigation is to estimate the “C” value used in the AASHTO-93 Guide, comparing the subgrade resilient modulus obtained in the laboratory on samples extracted from an existing road, and the modulus obtained using the back analysis model included in the AASHTO-93 Guide for Pavement Design using the FWD equipment for deflections measurement.
To reach this objective, the constitutive equations of the granular materials, obtained from laboratory tests, as well as the results of the Indirect Tensile Test of the asphalt layers, were considered. The route of study for the execution of this work corresponds to a section of 22 km. of the Provincial Route No 6, located in the Province of Buenos Aires, Argentina.
1 “AASHTO GUIDE FOR DESIGN OF PAVEMENT STRUCTURES-1993”. Publicada por la American Association of State Highway
and Transportation Officials de los Estados Unidos de América. Añ6 1993.

Estimation of the “C” Value Considered In the AASHTO-93 Guide for Back Analysis of the Elastic Modulus of the Subgrade
Sydney, September 2011
Urbáez & Giovanon: Estimation of the “C” Value Considered In the AASHTO-93 Guide for Back Analysis of the Elastic
Modulus of the Subgrade.
2
1.1. Proposed Methodology
To achieve the objective of this research, the factor of adjustment “C” was determined by the relationship between the site resilient modulus of the subgrade (MRsite-sr), considered the “pilot” or reference, and the back analysed modulus obtained using the AASHTO-93 Method (MRrc-sr). In order to be comparable, the MRsite-sr should be calculated under the same pavement condition and state of stresses when the deflections were measured.
On this basis, the following general methodology was conducted in order to determine the MRsite-sr, and the MRrc-sr.
a) Measuring surface deflections using the FWD equipment and the surface pavement temperature. The FWD deflections were used for back analysis of the subgrade modulus applying the AASHTO-93 Model (MRrc-sr).
b) Perform a test pit on the same section that the FWD survey was conducted, and recording pavement profile, natural moisture and density.
c) Taking samples of all existing pavement materials (asphalt mixes and unbound granular materials).
d) Perform a dynamic modulus laboratory test on the asphalt mix, in order to obtain the master curves that model the temperature and load frequency dependency of these materials. The pavement surface temperature measured during the FWD survey and a load frequency of 10Hz was used to calculate the dynamic modulus of the asphalt materials.
e) Perform a resilient modulus laboratory test on the unbound granular materials (base, subbase and subgrade), in order to obtain the constitutive equations for the non linear behaviour of the granular materials. The natural moisture and density were considered to perform the resilient modulus laboratory test, to be comparable with the condition of the pavement when the deflections were measured.
f) The Site Resilient Modulus of the different materials (MRsite-sr) was calculated using the constitutive equations of the unbound materials, as well as the master curves of the asphalt materials, considering the site particular conditions in terms of natural moisture, density, surface temperature and frequency of the load. Considering the stress dependency of the granular materials, a non linear analysis of multilayer pavement was conducted -using the KENLAYER computer program-, in order to calculate the principal stresses within the soil mass.
g) The “C” factor was computed as the relationship between MRsite-sr and the MRrc-sr.
It is important to consider, that not all materials were tested for the resilient modulus and the dynamic modulus laboratory tests, so some materials have assigned constitutive equations and master curves, considering the soil classification, density, moisture, thickness and types of the different materials. This aspect is very important, since the real condition of the existing pavement should be reproduced when performing the laboratory tests, in order to be comparable with the back analysis of the deflection bowl.

Estimation of the “C” Value Considered In the AASHTO-93 Guide for Back Analysis of the Elastic Modulus of the Subgrade
Sydney, September 2011
Urbáez & Giovanon: Estimation of the “C” Value Considered In the AASHTO-93 Guide for Back Analysis of the Elastic
Modulus of the Subgrade.
3
2. Field Evaluation
The pavement survey was performed by Ernesto Urbáez P., and Maylin Corros B., within a plan of pavement evaluation of a section of 22 km of the Provincial Route No. 6, between the city of Pavón (Intersection National Route Nº 8) and the city of Campana (Intersection National Route Nº 9), located in the Province of Buenos Aires, Argentina, in November of 2003, and were designed specifically to conform a data base to support several investigations.
The data stored in this Data Base comprised of the following information:
• Thicknesses of all layers that comprise the pavement structure.
• Binder content and gradation of the core taken drills from the existing asphalt concrete mix.
• AASHTO M145 Soil Classification of the granular materials.
• Field density and natural moisture of the base, subbase and subgrade.
• Dynamic Cone of Penetration Test (DCP) performed on non cemented materials.
• California Bearing Ratio Test (CBR) on non cemented materials (base, subbase and subgrade).
• Indirect Tensile Test using dynamic load on asphalt mix samples.
• Resilient Modulus Laboratory Test on unbound materials.
• Measurement of superficial deflections using the Falling Weight Deflectometer (FWD) equipment.
• Measurement of superficial deflections using the Benkelman Beam equipment.
As was mentioned in the methodology, no all laboratory tests were performed on all samples and some results have been assigned specially the constitutive equations and master curves, from the resilient modulus and dynamic modulus, respectively, considering the soil classification, density, moisture, thickness and types of the different materials.
With regard to the samples, the road was analysed using a statistical method called “Analysis Unit Delineation by Cumulative Differences”, included in the AASHTO-93 Guide. The statistical analysis was based on the maximum deflection measured every 300m throughout the survey section.
The following Figure 2-1 shows the cumulative differences graph of the surface deflections and the six (6) sections that have been identified. In addition, the Figure 2-1 shows the location of the test pits that were performed.

Estimation of the “C” Value Considered In the AASHTO-93 Guide for Back Analysis of the Elastic Modulus of the Subgrade
Sydney, September 2011
Urbáez & Giovanon: Estimation of the “C” Value Considered In the AASHTO-93 Guide for Back Analysis of the Elastic
Modulus of the Subgrade.
4
Provincial Route No. 6 - Homogeneous Sections Base on Maximun FWD Deflections. Test Pits (C)
-30,000.0
-25,000.0
-20,000.0
-15,000.0
-10,000.0
-5,000.0
0.0
0.21
0.81
1.41
2.01
2.61
3.21
3.81
4.41
5.31
5.91
6.51
7.11
7.72
8.31
8.91
9.51
10.1
1
10.7
1
11.3
1
11.9
1
12.5
1
13.1
1
13.7
1
14.3
1
14.9
1
15.5
1
16.1
1
16.7
1
17.3
1
17.9
1
18.5
1
19.1
1
19.7
1
20.3
1
20.9
1
21.5
1
22.1
1
22.7
3
Chainage (km)
Cu
mu
lati
ve
Dif
fere
nces
T1 T2 T3 T4 T5 T60+0 7+2 8+4 13+0 14+4 17+5 22+6
C1= 1+250
C2= 4+2C3= 7+5
C4= 9+0
C5= 12+200 C6= 13+8 C7= 17+0 C9= 21+6
C8= 18+7
Figure 2-1 Homogeneous Sections Analysis of Provincial Route No. 6
Following Table 2-1 summarised the main characteristics of the materials found in the test pits, and the laboratory tests that were performed.

Estimation of the “C” Value Considered In the AASHTO-93 Guide for Back Analysis of the Elastic Modulus of the Subgrade
Sydney, September 2011
Urbáez & Giovanon: Estimation of the “C” Value Considered In the AASHTO-93 Guide for Back Analysis of the Elastic
Modulus of the Subgrade.
5
Table 2-1 Summary of Laboratory Tests and Typical Pavement Structures Material Found
Clasification DCP CBR (%) D.S.(Field) W(Nat) D.H.(Field) M. Resil. M. Din. LL LP
AASHTO-M145 Log %Bit Gran. D.(gr/cm3) (mm/blows) (LAB.) (gr/cm3) (%) (gr/cm3) Soil Asphalt (%) (%)
ASF.CON. 21.0TOSCA A.A. 30.0 YesM2 (Base) 31.0 A-4(2) 8.5 1.450 26.5 1.835 35.61 27.34 8.27
SUBGRADE A-6(11) 15.2 1.595 17.2 1.870 37.49 19.43 18.06
ASF.CON. 20.5 YesTOSCA A.A. 24.0 Yes
M2 20.0 A-5(4) 2.6 70.0 1.263 28.0 1.617 Yes 43.52 37.25 6.27
M3 (Subbase) 20.0 A-6(9) 15.5 1.491 23.2 1.837 34.53 22.04 12.49
SUBGRADE A-7-6(19) 26.4 1.502 20.1 1.803 52.72 21.12 31.61
ASF.CON. 21.5 YesTOSCA A.A. 11.0 YesM2 (Base) 33.0 A-4(1) 7.6 1.429 27.0 1.815 36.61 28.87 7.74
SUBGRADE A-7-6(16) 14.5 1.462 24.0 1.813 47.06 21.75 25.31
ASF.CON. 25.7 Yes Yes Yes 2.435 2.435 YesTOSCA A.A. 10.0 YesM2 (Base) 13.0 A-4(0) 4.6 37.1 1.282 22.0 1.564 Yes NL NP -
M3 (Subbase) 44.0 A-6(9) 16.6 21.4 1.572 23.3 1.938 Yes 34.37 21.26 13.10
SUBGRADE A-7-6(16) 23.1 10.0 1.327 23.0 1.633 Yes 51.35 22.39 28.96
ASF.CON. 21.0 Yes Yes Yes 2.439 2.439 YesTOSCA A.A. 13.0 YesM2 (Base) 10.0 A-4(0) 5.2 54.3 1.300 29.5 1.683 Yes NL NL -
M3 (Subbase) 30.0 A-6(10) 13.1 20.0 1.457 20.9 1.762 Yes 37.95 23.40 14.55
SUBGRADE A-7-6(18) 26.1 10.0 1.283 23.0 1.579 Yes 51.97 21.76 30.21
ASF.CON. 17.8 Yes Yes Yes 2.433 2.433 YesTOSCA A.A. 11.0 YesM2 (Base) 12.0 A-4(1) 5.3 24.9 1.231 29.5 1.594 Yes NL NP -
M3 (Subbase) 25.0 A-6(10) 38.3 7.2 1.561 26.0 1.967 Yes 37.82 23.13 14.69
SUBGRADE A-7-6(19) 25.6 11.2 1.441 30.0 1.873 53.25 22.60 30.65
ASF.CON. 19.5 YesTOSCA A.A. 22.0 YesM2 (Base) 20.0 A-4(5) 24.2 1.362 21.2 1.651 32.80 24.06 8.73
M3 (SR) 16.0 A-7-6(12) 1.327 28.0 1.699 47.41 26.82 20.58
SUBGRADE A-7-6(20) 33.4 1.447 26.6 1.832 72.70 23.91 48.79
ASF.CON. 17.6 YesTOSCA A.A. 12.0 YesM2 (Base) 16.0 A-4(2) 20.1 42.9 1.551 28.5 1.993 Yes 37.00 28.83 8.17
M3 (SR) 25.0 A-6(6) 1.465 20.5 1.766 40.33 26.05 14.28
SUBGRADE A-6(10) 20.4 10.8 1.515 21.0 1.833 Yes 35.70 19.40 16.30
ASF.CON. 16.4 YesTOSCA A.A. 12.0 Yes
M2 (SR) 16.0 A-6(8) 1.355 27.4 1.727 27.84 17.54 10.30
M3 (SR) 25.0 A-6(9) 23.3 1.264 29.3 1.634 33.94 22.81 11.13
SUBGRADE A-6(9) 12.8 11.2 1.607 20.5 1.936 Yes 30.08 18.52 11.56
(cm) IPTest Pit Material Profile
GENERAL SUMMARY
1
Asphalt Core Drills
3
5
4
2
9
8
6
7
Where: ASF.CON.: Asphalt Concrete. M. Resil: Resielint Modulus. TOSCA.A.A.: Hot Sand “Tosca” Asphalt Mix. M. Dim.: Dynamic Modulus. Mx: Material, pavement layer. D.: Density. DCP: Dynamic Cone Penetration D.S/D.H: Dry/Soak Density. Tick.: Thickness. LL/LP/IP: Atterberg Limits. %Bit.: Percentage of asphalt. NL/NP: No Liquit /No Plastic. Gran: Gradation. Yes: Test performed.

Estimation of the “C” Value Considered In the AASHTO-93 Guide for Back Analysis of the Elastic Modulus of the Subgrade
Sydney, September 2011
Urbáez & Giovanon: Estimation of the “C” Value Considered In the AASHTO-93 Guide for Back Analysis of the Elastic
Modulus of the Subgrade.
6
As can be seen in the preceding table, the subgrade comprises of an A-6 and A-7-6 soil type based on the AASHTO classification, with high group index value. On the other hand, the base and subbase materials are A-4, A-5 and A-6 types. These materials are highly cohesive, with high dependency of the resilient modulus with the state of stresses which they are imposed.
With the respect of cemented materials, the surface comprise of an asphalt concrete wearing course and a base of hot sand “Tosca” asphalt mix, which is a material constituted by a calcaria conglomerate and asphalt cement, which quality is lower than the asphalt concrete, but higher than the granular selected materials (base or subbase), as well as of the soil that comprise the natural subgrade. In addition, the hot sand “Tosca” asphalt mix is considered a good base material, suitable for placement prior to the asphalt wearing course.
The following Chapter describes the characteristics of the Resilient Modulus Test, not only for the unbound materials, but also for the asphalt concrete mixes and the laboratory test results.

Estimation of the “C” Value Considered In the AASHTO-93 Guide for Back Analysis of the Elastic Modulus of the Subgrade
Sydney, September 2011
Urbáez & Giovanon: Estimation of the “C” Value Considered In the AASHTO-93 Guide for Back Analysis of the Elastic
Modulus of the Subgrade.
7
3. Elastic Modulus of the Materials
3.1. Dynamic Modulus of the Asphalt Materials (MDin-ma)
With respect to the asphalt layers, the Indirect Tensile Test was carried out in order to estimate the dynamic modulus of the asphalt materials. This modulus will allow considering the visco-elastic behaviour of the asphalt mixes, taking into account the frequency of the load and temperature.
The Indirect Tensile Test was performed on cylindrical samples and a master curve was developed. It represents the variation of the dynamic modulus of the asphalt mix based on the temperature and frequency of the application loads. On this basis, it is possible to consider the behaviour of the asphalt materials at very low speed (static load) or dynamic loads (vehicles circulating at high speeds), as well as a wide range of temperatures.
The test procedure that has been performed corresponds to the proposed by the European Community for Standardisation named: 227 CEN/TC N 1009. Road Materials Bituminous Mixtures. Test Methods For Hot Mix Asphalt. Part 26: Stiffness. Appendix C. Indirect Tensile Test on Cylindrical Specimens (IT-CY). (May 2003).
The dynamic modulus of the asphalt mix establishes a functional relationship between the applied tensions and the resulting deformations for each particular temperature and time or frequency of the applied load. The mathematical expression that governs these variables is the following:
( )ε
σ=TtEdin , , (Eq. 1)
Where:
Edin (t,T): Dynamic modulus of the mix, at temperature “T” and frequency of the applied load “t”. σ: State of stresses imposed. ε: Specific deformation induced to the material. It is important to consider, that the dynamic modulus of an asphalt mix increases at low temperatures and constant frequency of the applied load. On the other hand, when the temperature remains constant and the frequency of the load is increased, the dynamic modulus will increase. Therefore, the temperature and frequency of the applied load are the main and complementary parameters to be considered in the behaviour of an asphalt mix.
This behaviour plays an important role on the estimation of the resilient modulus of the subgrade based on the back analysis procedure and non destructive testing for measuring deflections. In particular, the asphalt materials absorb a high proportion of the stresses imposed by the traffic and knowing their behaviour in terms of dynamic modulus is important when undertaking the back analysis of the deflection bowl.
The Indirect Tensile laboratory test was performed on core drill samples from test pits No. 4, 5 and 6, and the results were assigned to the other test pit asphalt mix materials. The

Estimation of the “C” Value Considered In the AASHTO-93 Guide for Back Analysis of the Elastic Modulus of the Subgrade
Sydney, September 2011
Urbáez & Giovanon: Estimation of the “C” Value Considered In the AASHTO-93 Guide for Back Analysis of the Elastic
Modulus of the Subgrade.
8
temperatures and frequencies of the applied load considered during the test are the following:
• Temperatures: 10ºC; 25ºC and 40ºC.
• Frequency of the applied load: 0.5 sec; 1.0 sec; 2.0 sec; and 2.5 sec.
As mentioned on Chapter 2 and showed in Table 2-1, the asphalt materials are comprised of asphalt wearing course and hot sand “Tosca” asphalt mix.
The asphalt concrete and hot sand “Tosca” asphalt mix were separated. In addition, the asphalt concrete comprised of an asphalt wearing course and several layers of asphalt mix base. Hence, the core drills were separated (“sliced”) along each one of these layer boundaries and the Indirect Tensile Test was performed separately.
The Figure 3-1 shows an example of the master curve for different core drill samples of the asphalt concrete materials extracted from the test pit No. 4. Similar master curves were developed for samples from test pits 5 and 6.
Based on the results of the Indirect Tensile Test for the core drills extracted of the test pits No. 4, 5 and 6, and its master curves, the dynamic modulus of all asphalt materials that comprises the pavement profile on the nine (9) test pits, were assigned.
Following Table 3-1 includes all the values of the dynamic modulus of all asphalt materials that comprises the pavement structure on the nine (9) test pits.
Table 3-1 Dynamic Modulus of the Asphalt Concrete
C.A.: Asphalt Concrete
Dynamic Modulus (MPa)
Test Pit Material Temp. ( °°°°C) 0.05 Hz 0.5 Hz 1.0 Hz 10.0 Hz
1 C.A 33.2 358 797 1,016 2,290
2 C.A 30.1 444 970 1,229 2,714
3 C.A 32.2 256 604 784 1,878
4 C.A 32.4 317 721 925 2,134
5 C.A 33.8 317 736 951 2,242
6 C.A 34. 8 392 998 1,323 3,374
7 C.A 34.3 325 804 1,057 2,637
8 C.A 34.3 330 814 1,070 2,661
9 C.A 34.3 298 739 972 2,432

Estimation of the “C” Value Considered In the AASHTO-93 Guide for Back Analysis of the Elastic Modulus of the Subgrade
Sydney, September 2011
Urbáez & Giovanon: Estimation of the “C” Value Considered In the AASHTO-93 Guide for Back Analysis of the Elastic
Modulus of the Subgrade.
9
Core Drill-Profile C4 Date: 04-15-2004
Tick.(cm) Wearing Course BASE 2 BASE 3
W. Course 4.25 C4-T1-1 C4-T1-2 C4-T1-3 C4-T1-4 C4-T1-5
Density (gr/cm3) 2.461 2.418 2.456 2.449 2.390
BASE 1 9.15 Hight (mm) 46.50 42.50 40.50 48.25 46.00
BASE 2 5.55
BASE 3 6.2
TEMP.(˚C) FREQUENCY (Hz) C4-T1-1 C4-T1-2 C4-T1-3 C4-T1-4 C4-T1-5
10 2.50 6295 5696 7472 7199 7379
10 2.00 5471 5001 6743 6432 6947
10 1.00 4532 3908 5118 4793 5851
10 0.50 3392 2840 - 3394 4685
10 0.25 2454 2009 2711 2364 3727
25 2.50 2099 1181 1084 1109 2913
25 2.00 1796 1003 970 1040 2710
25 1.00 1328 670 778 873 2180
25 0.50 948 544 572 658 1676
25 0.25 663 359 390 490 1363
40 2.50 618 322 497 428 1883
40 2.00 540 294 437 414 1768
40 1.00 400 284 321 329 1339
40 0.50 319 220 250 255 1147
40 0.25 283 172 184 195 871
C4-T1-1 C4-T1-2 C4-T1-3 C4-T1-4 C4-T1-5
2970.49 3433.87 3460.77 3431.91 1823.26
0.41 0.40 0.44 0.39 0.32
-6.86 -8.59 -8.61 -8.50 -2.726.0E-05 5.1E-05 5.5E-05 5.0E-05 7.6E-05
0.9979668 0.9907779 0.9806264 0.9900732 0.9847322
0.9959377 0.9816409 0.9616281 0.9802449 0.9696974
0.9952607 0.9785811 0.9546514 0.9769523 0.9646470
0.0312815 0.0760995 0.1141747 0.0788429 0.0551173
15 15 14 15 15
c =K =
Observations =
Multiple Correlation Coeficient =
Coeficient R^2 =
R^2 adjusted =Typical Error =
BASE 1
b =
TABLE 1
Modulus (Mpa)
TABLE 2
a =
T(frec. Cte.) = (1/((1/Te)-k*Ln(10/(Frequency-Hz-)))-273
10
100
1000
10000
0 10 20 30 40 50 60 70
TEMPERATURE (ºC)
Ed
in (
MP
a)
S1-50 S2-50 C4-T1-1 C4-T1-2 C4-T1-3
C4-T1-4 C4-T1-5
E(regres.) = 10^(c+b*LOG(Frequency-Hz-)+a*1/Temp.(˚K))
Figure 3-1 Master Curve for 10 Hz. Samples from Test Pit No. 4

Estimation of the “C” Value Considered In the AASHTO-93 Guide for Back Analysis of the Elastic Modulus of the Subgrade
Sydney, September 2011
Urbáez & Giovanon: Estimation of the “C” Value Considered In the AASHTO-93 Guide for Back Analysis of the Elastic
Modulus of the Subgrade.
10
It is important to consider, that the dynamic modulus of the asphalt concrete shown in the preceding Table 3-1 and the temperature, were obtained as a weighed average using the master curve of each section of the core drills, and considering the thickness of the asphalt layers. The depth which was evaluated corresponds to the midpoint of each layer showed in Table 2-1.
The variation of the temperature with the depth, to consider the dynamic modulus on the master curve, was based on the procedure of the Institute of American Asphalt, included in the series of manuals No. 17, using the surface temperature of the pavement measured in the field when the deflections measurement were performed on each test pit.
To model the response of the pavement to the actual condition of the materials; the modulus of the asphalt layers were considered constant and the same as indicated in Table 3-1 for a frequency of 10 Hz. This is a simplification of the problem. However, as was mentioned before, the modulus of the asphalt layers has considered the temperature at the time of the field evaluation (measured deflection) and the frequency of the applied load of 10 Hz, which is normally used for pavement design, taking into account that this represents the passage of a heavy vehicle circulating to a speed between 70 km/h and 75km/h.
In the case of the hot sand “Tosca” asphalt mix; this material was not tested in the laboratory to consider the dynamic modulus. Nevertheless, on the basis of the experience in Argentina on these types of materials, its modulus was correlated. A work published by S. Angelone and F. Martinez (1985)2, have reported different master curves based on laboratory tests for different asphalt mix materials, among them a hot sand “Tosca” asphalt mix. This asphalt mix was similar to the material found in the road under study. Based on the master curves developed on this report for the hot sand “Tosca” asphalt mix, the dynamic modulus of this material was derived considering the same temperatures and frequency of the applied load. Table 3-2 following shows the values of the dynamic modulus for this asphalt material.
Table 3-2 Dynamic Modulus of the Hot Sand “Tosca” Asphalt Mix.
T.A.A.: Hot Sand “Tosca” asphalt mix
2 F. Martínez, S. Angelone. “Determination of the Dynamic Modulus (Stiffness) of the Asphalt Concrete Mix being used in the Litoral
Region of the Argentina. IMAE, University of Rosario. 23º Asphalt Meeting, Argentina (1985).
Dynamic Modulus (MPa)
Test Pits Material Temp. ( °°°°C) 0.05 Hz 0.5 Hz 1.0 Hz 10.0 Hz
1 T.A.A 33.2 179 399 508 1,145
2 T.A.A 30.1 222 485 615 1,357
3 T.A.A 32.2 128 302 392 939
4 T.A.A 32.4 159 361 463 1,067
5 T.A.A 33.8 159 368 476 1,121
6 T.A.A 34.8 196 499 662 1,667
7 T.A.A 34.3 163 402 529 1,319
8 T.A.A 34.3 165 407 535 1,331
9 T.A.A 34.3 149 370 487 1,216

Estimation of the “C” Value Considered In the AASHTO-93 Guide for Back Analysis of the Elastic Modulus of the Subgrade
Sydney, September 2011
Urbáez & Giovanon: Estimation of the “C” Value Considered In the AASHTO-93 Guide for Back Analysis of the Elastic
Modulus of the Subgrade.
11
3.2. Resilient Modulus for Unbound Materials
The resilient modulus is a measurement of the structural capacity of the unbound materials to support dynamic loads, considering its nonlinear behaviour or the stress dependency. In general, the resilient modulus considers the recoverable deformation of the unbound materials after the application of the stress. The general relationship is shown following3:
a
dMR
ε
σ= (Eq.2)
Where: MR: Resilient modulus. σd : Axial deviator stress. εa : Recoverable unit axial deformation. The Resilient Modulus Test consists basically of imposing a soil sample to a state of stresses consisting of a confining pressure and a dynamic deviator stress, in such as way as to reproduce the conditions of the pavement materials at the time of a moving loaded vehicle is circulating at a certain speed. The following Figure 3-2 shows a typical pavement response during the execution of the test, as well as a photo of the three-dimensional chamber used during the test.
Figure 3-2 Typical Scheme of the Cycle of Load and Unloading. Three-dimensional Test Chamber
3 Seed, H., Chan C., and Lee C., 1962. “Resilience Characteristics of Subgrade Soils and there Relation to Fatigue Failures in
Asphalt Pavement” . Proc, 2nd
International Conference on the Structural Design of Asphalt Pavements. Ann Arbor, Michigan. USA.
Source: F. Limaymanta, et al. “Resilient Modulus Test”. XIV National Conference of Civil Engineering. Perú, 2003.
Deformation under a Repetitive Load
Source: Australian Standard. AS 1289.6.8.1-1995. “Methods of Testing Soils for Engineering Purposes”. Australia, 1995.
Resilient Modulus equipment for unbound materials. IMAE. University of Rosario, Argentina.
Estimation of the “C” Value Considered In the AASHTO-93 Guide for Back Analysis of the Elastic Modulus of the Subgrade
Sydney, September 2011
Urbáez & Giovanon: Estimation of the “C” Value Considered In the AASHTO-93 Guide for Back Analysis of the Elastic
Modulus of the Subgrade.
12
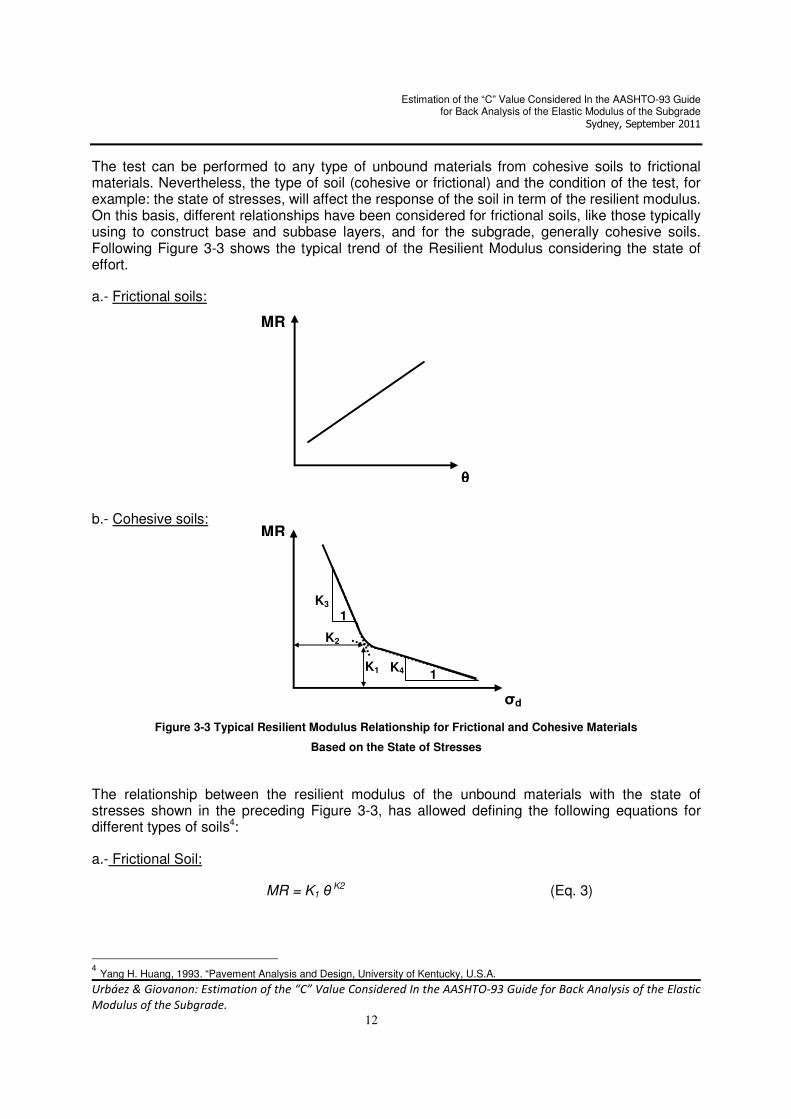
The test can be performed to any type of unbound materials from cohesive soils to frictional materials. Nevertheless, the type of soil (cohesive or frictional) and the condition of the test, for example: the state of stresses, will affect the response of the soil in term of the resilient modulus. On this basis, different relationships have been considered for frictional soils, like those typically using to construct base and subbase layers, and for the subgrade, generally cohesive soils. Following Figure 3-3 shows the typical trend of the Resilient Modulus considering the state of effort.
a.- Frictional soils:
b.- Cohesive soils:
Figure 3-3 Typical Resilient Modulus Relationship for Frictional and Cohesive Materials
Based on the State of Stresses
The relationship between the resilient modulus of the unbound materials with the state of stresses shown in the preceding Figure 3-3, has allowed defining the following equations for different types of soils4:
a.- Frictional Soil:
MR = K1 θ K2 (Eq. 3)
4 Yang H. Huang, 1993. “Pavement Analysis and Design, University of Kentucky, U.S.A.
MR
θ
MR
σd
K3
K4 K1
K2
1
1

Estimation of the “C” Value Considered In the AASHTO-93 Guide for Back Analysis of the Elastic Modulus of the Subgrade
Sydney, September 2011
Urbáez & Giovanon: Estimation of the “C” Value Considered In the AASHTO-93 Guide for Back Analysis of the Elastic
Modulus of the Subgrade.
13
b.- Cohesive Soil:
( )dKKKMR σ−+= 231 for σd < K2 (Eq. 4.1)
( )241 KKKMR d −= − σ for σd > K2 (Eq. 4.2)
Where: MR: Resilient modulus. σd: Axial deviator stress. θ: Sum of the principal stresses or the first invariant of stresses. K1; K2; K3 and K4: Experimental constants that depend on the characteristics of the soil, density
and moisture.
Other correlations between the resilient modulus and the state of efforts in the mass of the soil have been published. The team of the investigators of the IMAE from the National University of Rosario (Argentina), published a relationship of the resilient modulus, not only with the deviator stress but also with the summary of the main stresses (θ) considering unique constants for the materials5. The following relationships model this behaviour:
a) )()( d
CB
AMR σθ= (Eq. 5)
b) ( ) ( )3σσF
d
E
DMR = (Eq. 6)
C) ( )d
H
GMR σ= (Eq. 7)
Where: MR: Resilient modulus. σd: Axial deviator stress. θ: Summary of main stresses or first invariant of stresses. σ3: Lateral stress of confinement. A; B; C; D; E; F; G and H: Experimental constants that depend on the characteristics of the soil,
density of the materials and moisture. The Resilient Modulus Test procedure follows the AASHTO, DESIGNATION: T 294-92. (1992). “Resilient Modulus of Granular Unbound Base/Subbase Materials and Subgrade Soils-SHRP Protocol P46. U.S.A.
This test consists of applying a determined number of repetitions of a dynamic deviator stress (σd) on a test sample, previously loaded to a confinement pressure (σ3) in a three-dimensional pressure chamber. The load sequences depend on the type of material to be tested. The
5 Angelone S., Martinez F. “Analysis of Non-linear Models Describing the Resilient Behaviour for Soils and Unbound Materials”. IMAE, Universidad del Rosario, Argentina.

Estimation of the “C” Value Considered In the AASHTO-93 Guide for Back Analysis of the Elastic Modulus of the Subgrade
Sydney, September 2011
Urbáez & Giovanon: Estimation of the “C” Value Considered In the AASHTO-93 Guide for Back Analysis of the Elastic
Modulus of the Subgrade.
14
deviator stress corresponds to a dynamic pulse from a load cell. The soil sample could classify as a Type 1 (frictional) or Type 2 (cohesive) according to the criterion defined in the same AASHTO T294-92I specification.
During the test, the deviator stress that has been applied (σd) and the recover deformation of the last 5 cycles of every sequence are registered. Based on this data, an averaged MR, σd and σ3 are determined, and it allows to model the resilient behaviour of the material, and the constitutive equations being obtained.
It is important to consider, that in the particular case of the materials that have been found in the section under study, frictional soils were not found. Hence the Resilient Modulus Test Type 2 was only performed for cohesive materials.
Table 3-3 summarises the constitutive equations of the different materials being tested.
Table 3-3 Summary of the Resilient Modulus Constitutive Equations of the Tested Materials
Field Range
Dry Natural Sample Mr Measure
Material Soil Type Density Moisture Diameter Weight Hight Moisture =f(σσσσd; σσσσ3;θθθθ)
(AASHTO) (gr/cm3) (%) (mm.) (gr.) (mm.) (%) (MPa)
A B C r2
D E F r2
G H r2
C2M21 70.17 942.70 153.43 27.89 105-60 63.61 -0.29 0.36 0.9498 103.29 -0.17 0.23 0.9454 42.39 -0.17 0.2958
C2M22 70.03 951.50 153.90 28.23 91-46 56.75 -0.35 0.50 0.9413 110.28 -0.18 0.31 0.9306 32.56 -0.18 0.1764
C2M23 70.30 953.20 153.17 28.11 93-51 44.66 -0.35 0.35 0.9165 71.90 -0.23 0.22 0.9199 30.57 -0.23 0.4343
AVERAGE 70.17 949.13 153.50 28.08 60.18 -0.32 0.43 106.78 -0.17 0.27 37.47 -0.18
C4M21 70.13 906.50 152.50 22.27 115-61 63.10 -0.36 0.43 0.9584 114.14 -0.21 0.27 0.9658 40.05 -0.21 0.2952
C4M22 70.00 906.50 153.63 22.18 113-65 73.33 -0.29 0.38 0.9604 122.14 -0.16 0.24 0.9588 47.90 -0.16 0.2288
AVERAGE 70.07 906.50 153.07 22.23 68.21 -0.33 0.41 118.14 -0.18 0.26 43.97 -0.18
C4M31 70.00 1,123.70 152.43 23.05 109-61 46.01 -0.34 0.27 0.9245 67.06 -0.25 0.17 0.9320 34.53 -0.24 0.5840
C4M32 70.03 1,122.70 153.03 23.02 135-64 45.73 -0.43 0.34 0.9704 72.68 -0.31 0.21 0.9700 31.71 -0.31 0.6174
AVERAGE 70.02 1123.20 152.73 23.04 45.87 -0.39 0.31 69.87 -0.28 0.19 33.12 -0.28
C4SR1 69.80 958.50 152.73 24.51 599-58 4.27 -1.29 0.43 0.9593 6.72 -1.14 0.24 0.9442 2.73 -1.14 0.9044
C4SR2 69.83 952.20 151.67 24.61 90-43 22.77 -0.45 0.23 0.9592 31.82 -0.37 0.15 0.9736 17.76 -0.37 0.8186
C4SR3 69.53 925.20 151.33 25.22 79-35 19.08 -0.47 0.26 0.9491 28.02 -0.38 0.17 0.9708 14.32 -0.38 0.7941
AVERAGE 69.72 945.30 151.91 24.78 20.92 -0.46 0.24 29.92 -0.38 0.16 16.04 -0.37
C5M21 70.13 982.20 153.63 27.29 115-59 54.54 -0.38 0.40 0.9436 94.44 -0.24 0.26 0.9462 35.44 -0.24 0.3832
C5M23 69.95 982.00 153.51 27.12 117-61 69.75 -0.34 0.44 0.9539 126.47 -0.18 0.28 0.9575 43.29 -0.18 0.2259
AVERAGE 70.04 982.10 153.57 27.21 62.15 -0.36 0.42 110.46 -0.21 0.27 39.37 -0.21
C5M31 69.80 1,030.10 151.10 21.35 151-70 37.99 -0.48 0.30 0.9590 57.01 -0.38 0.19 0.9597 28.08 -0.37 0.7457
C5M32 69.87 1,030.90 150.97 20.97 120-71 51.29 -0.33 0.24 0.9196 72.14 -0.25 0.15 0.9426 39.54 -0.25 0.6617
AVERAGE 69.84 1030.50 151.04 21.16 44.64 -0.41 0.27 64.58 -0.32 0.17 33.81 -0.31
C5SR1 69.80 921.50 151.30 22.63 119-27 11.53 -0.81 0.57 0.9958 23.91 -0.60 0.35 0.9747 6.28 -0.60 0.6996
C5SR2 69.60 921.50 151.40 21.95 117-37 16.05 -0.62 0.34 0.9674 25.24 -0.50 0.21 0.9637 11.01 -0.50 0.7966
AVERAGE 69.70 921.50 151.35 22.29 13.79 -0.71 0.46 24.58 -0.55 0.28 8.65 -0.55
C6M21 69.80 930.90 150.80 27.20 166-50 40.29 -0.68 0.72 0.9237 99.11 -0.43 0.43 0.8783 18.41 -0.43 0.3981
C6M22 69.63 930.60 151.60 27.08 118-54 56.08 -0.43 0.51 0.9668 111.16 -0.25 0.32 0.9610 31.97 -0.25 0.3234
AVERAGE 69.72 930.75 151.20 27.14 48.18 -0.56 0.62 105.14 -0.34 0.38 25.19 -0.34
C6M31 70.17 1,141.10 153.53 25.64 55-25 21.37 -0.47 0.52 0.9436 40.53 -0.29 0.31 0.8862 11.95 -0.29 0.3738
C6M32 69.97 1,145.60 153.37 24.97 88-28 16.33 -0.65 0.56 0.9209 32.34 -0.46 0.34 0.8755 8.64 -0.46 0.5420
AVERAGE 70.07 1143.35 153.45 25.31 18.85 -0.56 0.54 36.44 -0.37 0.32 10.30 -0.38
C8M21 70.27 1,127.20 155.17 26.07 72-30 31.72 -0.45 0.52 0.9552 65.06 -0.27 0.34 0.9783 17.34 -0.28 0.3549
C8M22 70.43 1,128.00 155.57 25.60 83-38 41.51 -0.41 0.50 0.9582 82.26 -0.24 0.32 0.9756 23.85 -0.24 0.3116
AVERAGE 70.35 1127.60 155.37 25.84 36.62 -0.43 0.51 73.66 -0.26 0.33 20.60 -0.26
C8SR1 69.70 1,060.10 151.53 20.55 85-32 22.24 -0.56 0.49 0.9703 43.11 -0.39 0.31 0.9692 12.99 -0.39 0.5502
C8SR2 69.77 1,077.00 151.33 20.47 83-34 25.78 -0.49 0.44 0.9740 46.91 -0.34 0.28 0.9745 16.11 -0.33 0.5478
AVERAGE 69.74 1068.55 151.43 20.51 24.01 -0.52 0.47 45.01 -0.36 0.29 14.55 -0.36
C9SR1 69.53 1,138.30 151.33 20.91 179-59 32.02 -0.54 0.34 0.9539 46.51 -0.41 0.18 0.8994 21.68 -0.42 0.7643
C9SR2 70.03 1,140.80 152.17 21.21 101-54 43.08 -0.31 0.22 0.8037 57.90 -0.23 0.13 0.8095 34.57 -0.23 0.6302
AVERAGE 69.78 1139.55 151.75 21.06 37.55 -0.42 0.28 52.21 -0.32 0.16 28.12 -0.33
29.5
26
5
M2(Base)
M3 (Sub-base)
M2 (Base)
SUB-RASANTE
M3 (Sub-base)
M2 (Base)
6
A-4(1) 1.231
A-6(10) 1.561
EQUATION No.03:
Mr = A .(σσσσd) B. (θθθθ)C (MPa) Mr = D .(σσσσd)E. (σσσσ3)F (MPa) Mr = G .(σσσσd)H (MPa)
EQUATION No.02:EQUATION No.01:
2 A-5(4) 1.263 28.00
Tes
t P
its
Sample No. Laboratory Test Sample-Characteristics
4
A-7-6(16) 1.327 23.00
A-6(9)
SUB-RASANTE
M3 (Sub-base)
M2 (Base)
1.572 23.30
A-4(0) 1.282 22.00
9 A-6(9) 1.607 20.5SUB-RASANTE
8
A-6(10) 1.515 21.0
A-4(2) 1.551 28.5
SUB-RASANTE
M2 (Base)
A-7-6(18) 1.283 23.00
A-4(0) 1.300 29.5
A-6(10) 20,901.457

Estimation of the “C” Value Considered In the AASHTO-93 Guide for Back Analysis of the Elastic Modulus of the Subgrade
Sydney, September 2011
Urbáez & Giovanon: Estimation of the “C” Value Considered In the AASHTO-93 Guide for Back Analysis of the Elastic
Modulus of the Subgrade.
15
Based on the constitutive equation No. 3, shown in the previous Table 3-3, the values of the constants K1, K2, K3 and K4, were estimated for all tested materials. Figure 3-4 illustrates -as an example-, the relationship between the resilient modulus and the deviator stress for one material from the test pit No. 4.
TYPE SOIL (AASHTO) A-4(0)
DIAMETER (mm.) 70.13 A 63.10 D 114.14 G 40.05
152.5 B -0.36 E -0.21 H -0.21
1.282 C 0.43 F 0.27 - -
22.00 Coef.Correl.Multip. 0.9820 Coef.Correl.Multip. 0.9852 Coef.Correl.Multip. 0.5878
22.27 Coef. Determin.R2
0.9644 Coef. Determin.R2
0.9707 Coef. Determin.R2
0.3455
r2
0.958 r2
0.966 r2
0.295
Typical Error 0.0186 Typical Error 0.0168 Typical Error 0.0764ENSAYO AASHTO: T 294-92 / Material Tipo 2 No. Data 15 No. Data 15 No. Data 15
Mr Measure σσσσd σσσσ3333 θθθθ
2 115 0.014 0.042 0.140
3 107 0.027 0.042 0.153
4 97 0.042 0.042 0.168
5 90 0.056 0.042 0.182
6 83 0.070 0.042 0.196
7 100 0.014 0.021 0.077
8 80 0.028 0.021 0.091
9 74 0.042 0.021 0.105
10 71 0.055 0.021 0.118
11 70 0.070 0.021 0.133
12 84 0.013 0.010 0.043
13 68 0.027 0.010 0.057
14 61 0.042 0.010 0.072
15 61 0.056 0.010 0.086
16 61 0.070 0.010 0.100
Mr Correlated σσσσd Mr Correlated σσσσd
168 0.001 24343 0.145
120 0.005 17426 0.724
104 0.010 15090 1.448
96 0.015 13871 2.172
90 0.020 13067 2.896
86 0.025 12475 3.620
83 0.030 12011 4.344
80 0.035 11633 5.068
78 0.040 11315 5.792
76 0.045 11041 6.516
75 0.050 10802 7.240
73 0.055 10591 7.964
72 0.060 10401 8.688
71 0.065 10230 9.412
70 0.070 10073 10.136
69 0.075 9930 10.860
68 0.080 9798 11.584
67 0.085 9675 12.308
66 0.090 9561 13.032
65 0.095 9454 13.756
65 0.100 9354 14.480
NATURAL MOISTURE(%)
SAMPLE MOISTURE (%)
Test Data (Pressure Atmosfér. (MPa) = 0,1)
EQUATION No. 3 (MPa) EQUATION No. 3 (psi)
104 103 84
77
EQUATION No.03:
Mr Correlated
Mr = A .(σσσσd) B. (θθθθ)
C (MPa) Mr = D .(σσσσd)
E. (σσσσ3)
F (MPa) Mr = G .(σσσσd)
H (MPa)
EQUATION No.01: EQUATION No.02:
EQUATION No.02: EQUATION No.03:
118 st
(MPa)
EQUATION No.01:
126
73
92 94
86 88
70
98 98
82 84
72 73
97
82 85 84
75 78 77
73
69 70 69
78 81 98
68 69 85
64 63 77
62 60 73
61 57 70
Te
st
Pit
No
. 4
HIGHT (mm.)
FIELD DENSITY (gr/cm3)
(MPa)Step
Sample No. C4M21
MR vs. DEVIATOR STRESS
0
20
40
60
80
100
120
140
160
180
0.0
01
0.0
10
0.0
20
0.0
30
0.0
40
0.0
50
0.0
60
0.0
70
0.0
80
0.0
90
0.1
00
DEVIATOR STRESS (psi)
MR
(p
si)
K1
K2
K3
K4
Figure 3-4 Relationship of the Resilient Modulus and the Deviator Stress (σd). Test Pit No. 4, Sample C4M21
As mentioned above, not all materials have been tested for the resilient modulus test. The values of the constants (K1 to K4) for some materials were assigned considering the classification of the soil, density, moisture and thickness of the different materials found from the test. At this stage, to reproduce the natural moisture and density at the laboratory test play an important role, since these variables affect the resilient modulus behaviour of the unbound materials.

Estimation of the “C” Value Considered In the AASHTO-93 Guide for Back Analysis of the Elastic Modulus of the Subgrade
Sydney, September 2011
Urbáez & Giovanon: Estimation of the “C” Value Considered In the AASHTO-93 Guide for Back Analysis of the Elastic
Modulus of the Subgrade.
16
Following Table 3-5 summarises the value of the constants for all unbound pavement materials being considered within the test pits and the general criterion to assign some of the constants values.
According to Yang Huang (footnote No. 4), the value of the Resilient Modulus in the break point of the bilinear curve (for cohesive soils), considered as the K1 constant, is a good indicator of the resilient behaviour of the soil, whereas the other constants (K2, K3 and K4), show less variability and low influence in the response of the pavement.
On this basis, the K1 constant of the test pits materials is between 45 MPa and 53 MPa (6,558 psi and 7,704 psi) for the subgrade, and between 45 MPa and 89 MPa (6,558 psi and 12,920 psi) for the base, which is considered typical, for the types of materials and moisture conditions. Nevertheless, this “break point” is a simplification of the exponential curve that models the behaviour of the resilient modulus vs. the deviator stress. When the deviator stress is near (by excess or defect) to the K2 constant, the resultant of the Resilient Modulus can have a significant variation due to the exponential character of the curve. Figure 3-5 presents a schematic illustration for the subgrade on the test pit No. 1.
Figure 3-5 Schematic Illustration of the Constants for the Subgrade Material (Test Pit No. 1)
It is important to consider that the subgrade materials are -in general- stress dependant (non linear behaviour). Hence, the resilient modulus varies considering the state of stresses within the soil.
Based on this stress dependant behaviour of the soil, the resilient modulus does not have a unique value. It is required to know the stress within the mass of the soil to establish the elastic modulus of the material.
According to the methodology described in the AASHTO-1993 Guide, the subgrade resilient modulus should be estimated for a deviator stress of 0.0414 MPa (6.0 psi), for subgrade similar to the Road Experiment. The AASHTO-93 Guide explains that there is not a clear indication of
MR (MPa)
σd (MPa)
K3 = 19275
K4 = 138
K1 = 46
K2 = 0.0077
Estimation of the “C” Value Considered In the AASHTO-93 Guide for Back Analysis of the Elastic Modulus of the Subgrade
Sydney, September 2011
Urbáez & Giovanon: Estimation of the “C” Value Considered In the AASHTO-93 Guide for Back Analysis of the Elastic
Modulus of the Subgrade.
17
how this value of resilient modulus was estimated. However, the laboratory test report of the resilient modulus of the subgrade of the Road Experiment, published by Thompson, M. and Robnett, Q. of the University of Illinois At Urbana (1979), showed a resilient modulus of 20.7 MPa (3,000 psi) considering a deviator stress of 0.0414 MPa (6.0 psi).
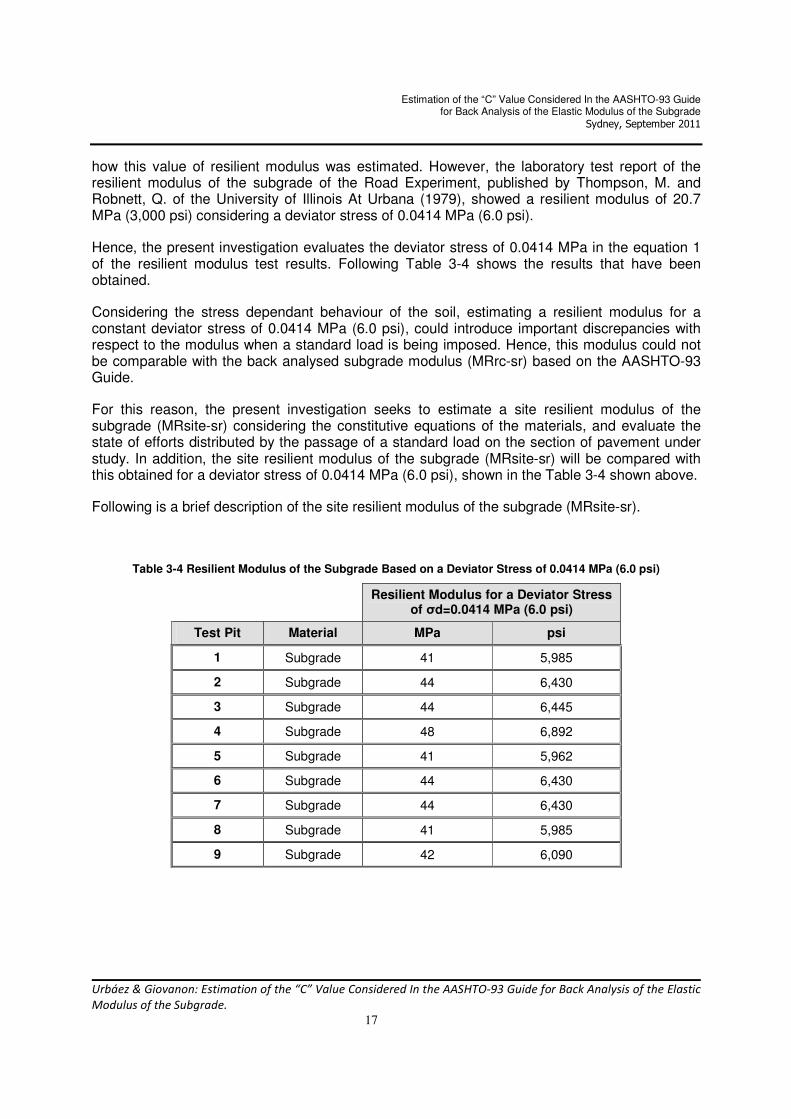
Hence, the present investigation evaluates the deviator stress of 0.0414 MPa in the equation 1 of the resilient modulus test results. Following Table 3-4 shows the results that have been obtained.
Considering the stress dependant behaviour of the soil, estimating a resilient modulus for a constant deviator stress of 0.0414 MPa (6.0 psi), could introduce important discrepancies with respect to the modulus when a standard load is being imposed. Hence, this modulus could not be comparable with the back analysed subgrade modulus (MRrc-sr) based on the AASHTO-93 Guide.
For this reason, the present investigation seeks to estimate a site resilient modulus of the subgrade (MRsite-sr) considering the constitutive equations of the materials, and evaluate the state of efforts distributed by the passage of a standard load on the section of pavement under study. In addition, the site resilient modulus of the subgrade (MRsite-sr) will be compared with this obtained for a deviator stress of 0.0414 MPa (6.0 psi), shown in the Table 3-4 shown above.
Following is a brief description of the site resilient modulus of the subgrade (MRsite-sr).
Table 3-4 Resilient Modulus of the Subgrade Based on a Deviator Stress of 0.0414 MPa (6.0 psi)
Resilient Modulus for a Deviator Stress of σd=0.0414 MPa (6.0 psi)
Test Pit Material MPa psi
1 Subgrade 41 5,985
2 Subgrade 44 6,430
3 Subgrade 44 6,445
4 Subgrade 48 6,892
5 Subgrade 41 5,962
6 Subgrade 44 6,430
7 Subgrade 44 6,430
8 Subgrade 41 5,985
9 Subgrade 42 6,090

Estimation of the “C” Value Considered In the AASHTO-93 Guide for Back Analysis of the Elastic Modulus of the Subgrade
Sydney, September 2011
Urbáez & Giovanon: Estimation of the “C” Value Considered In the AASHTO-93 Guide for Back Analysis of the Elastic
Modulus of the Subgrade.
18
Table 3-5 Summary of Constitutive Constants
Constitutive Constants
K1 K2 K3 K4
Pit Material (MPa) (psi) (MPa) (psi) (Adim) (Adim) General Criterion
M2 (Base) 76 11,084 0.0083 1.21 17,428 165 Average for A-4 soils. With
same natural moisture. 1
Subgrade 46 6,658 0.0077 1.12 19,275 138 Values from test pit No. 8 materials have been used.
M2 (Base) 74 10,677 0.0086 1.26 8,200 121 Resilient Modulus Test Results.
M3 (Subbase)
76 11,028 0.0083 1.20 15,180 170 Values from test pit No. 4 materials have been used. 2
Subgrade 50 7,314 0.0073 1.06 39,470 179 Average for A-7-6 soils. With
same natural moisture.
M2 76 11,084 0.0083 1.21 17,428 165 Average for A-4 soils. With
same natural moisture. 3
Subgrade 50 7,314 0.0073 1.06 39,470 179 Average for A-7-6 soils. With
same natural moisture.
M2 (Base) 81 11,775 0.0088 1.27 8,030 124 Resilient Modulus Test Results.
M3 (Subbase)
76 11,028 0.0083 1.20 15,180 170 Resilient Modulus Test Results. 4
Subgrade 53 7,704 0.0077 1.11 24,060 166 Resilient Modulus Test Results.
M2 (Base) 78 11,300 0.0086 1.25 9,560 135 Resilient Modulus Test Results.
M3 (Subbase)
89 12,920 0.0082 1.19 18,700 200 Resilient Modulus Test Results. 5
Subgrade 48 6,925 0.0070 1.01 54,880 193 Resilient Modulus Test Results.
M2 (Base) 73 10,598 0.0074 1.07 45,740 250 Resilient Modulus Test Results.
M3 (Subbase)
45 6,568 0.0068 0.99 27,489 109 Resilient Modulus Test Results. 6
Subgrade 50 7,314 0.0073 1.06 39,470 179 Average for A-7-6 soils. With no
same natural moisture.
M2 (Base) 76 11,084 0.0083 1.21 17,428 165 Average for A-4 soils. With
same natural moisture. 7
Subgrade 50 7,314 0.0073 1.06 39,470 179 Average for A-7-6 soils. With no
same natural moisture.
M2 (Base) 48 7,021 0.0060 0..87 10,173 157 Resilient Modulus Test Results. 8
Subgrade 46 6,658 0.0077 1.12 19,265 138 Resilient Modulus Test Results.
9 Subgrade 45 6,568 0.0068 0.99 27,489 109 Values from test pit No. 4 materials have been used.
M: Material, paviment layer / Adim: Adimensional

Estimation of the “C” Value Considered In the AASHTO-93 Guide for Back Analysis of the Elastic Modulus of the Subgrade
Sydney, September 2011
Urbáez & Giovanon: Estimation of the “C” Value Considered In the AASHTO-93 Guide for Back Analysis of the Elastic
Modulus of the Subgrade.
19
4. Site Resilient Modulus (MRsite-sr)
As was mentioned above, the present investigation seekes to estimate a Site Resilient Modulus of the subgrade (MRsite-sr). This MRsite-sr will be “the pilot” or reference subgrade modulus and will be the “target” of the back analysed subgrade modulus (MRrc-sr). The ratio between the MRsite-sr and the MRrc-sr is the “C” adjustment factor included the AASHTO-93 Guide.
There were two additional components for the estimation of the MRsite-sr that have been considered to contribute to the efforts into the mass of soil. Firstly, the geostatic pressure (Po) and secondly, the contribution of the dynamic load considering the elastic theory. Following is a brief description of these stresses.
• Contribution due to the at-rest earth pressure (geostatic pressure -Po-). This pressure is due to the stress imposed for the weight of the soil and the layers that comprise of the pavement structure above the subgrade. In the case of the pavement structure, it is considered the thicknesses of the pavement layers and the density of each one. On the other hand, the subgrade was considered to a depth of 50 cm, value normally used to evaluate the subgrade elastic modulus as proposed by the AASHTO-93 Guide. The
geostatic pressure (Po) has different components to the confining stress: σ3; σd y θ and are based on the at-rest earth pressure coefficient (Ko), which was considered for
cohesive soils based on the Poisson ratio (ν).
• Contribution due to the dynamic load, considered by the Elastic Theory. In this case, the stresses imposed by the standard axle load of 40 kN were taken into account, due to the fact it is the standard axle load considered for most of the pavement design methods.
Different procedures and softwares have been developed that consider both components of the described stresses, in the particular case of the present investigation the KENLAYER software, developed by Yang H. Huang of the University of Kentucky, U.S.A. in 1993, was used.
The KENLAYER software allows modelling the state of stresses under a standard load considering the constitutive equations of the different layers including the asphalt concrete and the specific condition of the soil in terms of moisture and density.
Following there are some characteristics of the software to be considered.
4.1. KENLAYER Software
KENLAYER allows modelling the non linear elastic behaviour of a multi layer pavement system and focuses its analysis on the estimation of the state of stresses within the soil mass considering the standard load of 40 kN, as well as the weight of the pavement structure. All
materials have been modelled considering its elastic modulus (Ei) and the Poisson ratio (ν).
The main characteristics of KENLAYER, related to the state of stresses, are the following:
• Elastic analysis of multi layer pavement system, which allows modelling different pavement systems comprising several layers, with different thickness, modulus of elasticity and Poisson's ratio.

Estimation of the “C” Value Considered In the AASHTO-93 Guide for Back Analysis of the Elastic Modulus of the Subgrade
Sydney, September 2011
Urbáez & Giovanon: Estimation of the “C” Value Considered In the AASHTO-93 Guide for Back Analysis of the Elastic
Modulus of the Subgrade.
20
• Allows the analysis of stresses due to the superposition of pressure bulbs on multiple loads distributed by vehicles with single, double and triple axles.
• Analysis of the behaviour of the soil considering the variation of the modulus of elasticity with the state of stresses. This is a very important characteristic of the program. On this basis, the KENLAYER models the non linear behaviour of frictional and cohesive soil using the equations 3 and 4, shown and discussed in section 3.2. In general, the frictional soils show an increment of the resilient modulus when the first invariant of stress (Θ) is increased. The first invariant of stress (Θ) is comprised of the confinement pressure and the weight of each layer of the pavement structure:
)21( 0321 Kz ++++= γσσσθ (Eq. 8)
It is important to consider, that (γ) is the weighted average of the unit weight of each layer, (z) is the depth below the surface at which the modulus is to be determined, and (Ko) is the at-rest earth pressure coefficient of the soil.
With regard to the cohesive soils, the resilient modulus decreases when the deviator stress (σd) increase. In the dynamic three dimensional test of resilient modulus performed on cylindrical samples, the axial main stress (σ1) is equal to the confinement stress (σ3) plus the dynamic deviator stress (σd), hence the deviator stress is defined as:
σd = σ1 - σ3 (Eq. 9)
Huang (1993) included in KENLAYER, for the calculation of σ3, the average between σ2 and σ3, since σ2 and σ3 –in general- could have some differences. Finally, KENLAYER also considered the weight of the different layers into the calculation of the deviator stress (σd). The final expression is being shown following:
σd = σ1 – 0.5(σ2 + σ3) + γz(1-Ko) (Eq. 10)
• The point for the determination of the stresses can be indicated in radial coordinates or Cartesian coordinates.
KENLAYER operates with an iterative process, in which the initial modulus of each material are introduced as a seed value and they are evaluated in the first iteration, if there is a difference between the seed modulus and the calculated one, the procedure is repeated, until the resilient modulus converges with the previous value. The converged modulus of the subgrade becomes the site resilient modulus (MRsite-sr) for this material.
The program was used to estimate the site resilient modulus of each material that comprises the pavement structure, including the subgrade. In addition, the principal stresses (σ1, σ2 and σ3) and the deviator stress (σd) were determined.
The following Table 4-1 summarises the results of the principal stresses obtained by KENLAYER and Table 4-2 shows the site resilient modulus of the subgrade.

Estimation of the “C” Value Considered In the AASHTO-93 Guide for Back Analysis of the Elastic Modulus of the Subgrade
Sydney, September 2011
Urbáez & Giovanon: Estimation of the “C” Value Considered In the AASHTO-93 Guide for Back Analysis of the Elastic
Modulus of the Subgrade.
21
Table 4-1 Principal Stresses. KENLAYER Program –HUANG, 1993-
σ1,2,3: Principal Stresses / θ: Summary of Principal Stresses / σd: Deviator Stress.
Table 4-2 MRsite-sr. KENLAYER Program–HUANG, 1993-
Geostatic and Dynamic Stress –KENLAYER, HUANG, 1983-
σ1 σ2 σ3 Θ σd
Test Pit Material MPa psi MPa psi MPa psi MPa psi MPa psi
1 Subgrade 0.0304 4.414 0.0219 3.181 0.0219 3.184 0.0746 10.831 0.0085 1.232
2 Subgrade 0.0297 4.316 0.0212 3.073 0.0212 3.076 0.0722 10.465 0.0086 1.242
3 Subgrade 0.0295 4.286 0.0188 2.723 0.0188 2.731 0.0674 9.788 0.0107 1.559
4 Subgrade 0.0315 4.576 0.0220 3.193 0.0220 3.197 0.0759 11.020 0.0095 1.381
5 Subgrade 0.0283 4.110 0.0187 2.719 0.0188 2.725 0.0662 9.601 0.0096 1.388
6 Subgrade 0.0293 4.247 0.0191 2.768 0.0191 2.775 0.0675 9.790 0.0101 1.476
7 Subgrade 0.0272 3.944 0.0182 2.636 0.0182 2.641 0.0638 9.266 0.0090 1.306
8 Subgrade 0.0282 4.101 0.0167 2.415 0.0167 2.428 0.0617 8.944 0.0116 1.680
9 Subgrade 0.0271 3.924 0.0141 2.040 0.0142 2.062 0.0553 8.026 0.0129 1.873
Site Subgrade Resilient Modulus.
KENLAYER, HUANG, 1983
Test Pit Material MPa psi
1 Subgrade 46 6,643
2 Subgrade 50 7,282
3 Subgrade 50 7,225
4 Subgrade 53 7,659
5 Subgrade 47 6,852
6 Subgrade 50 7,239
7 Subgrade 50 7,270
8 Subgrade 45 6,583
9 Subgrade 45 6,525

Estimation of the “C” Value Considered In the AASHTO-93 Guide for Back Analysis of the Elastic Modulus of the Subgrade
Sydney, September 2011
Urbáez & Giovanon: Estimation of the “C” Value Considered In the AASHTO-93 Guide for Back Analysis of the Elastic
Modulus of the Subgrade.
22
As can be seen in the preceding Table 4-2, the site resilient modulus of the subgrade (MRsite-sr), varies between 46 and 53 MPa. These values are within the expected range and according to the obtained constitutive equations for this type of material.
It is important to point out, that the values of the deviator stress (σd) obtained by KENLAYER are lower than 0.0414 MPa (6.0 psi), suggested by AASHTO-93 Guide, and ranges between 0.0085 MPa (1.232 psi) and 0.0189 MPa (1.873 psi).
Following there is a description of the AASHTO-93 procedure for back analysis of the subgrade resilient modulus and the results being obtained.

Estimation of the “C” Value Considered In the AASHTO-93 Guide for Back Analysis of the Elastic Modulus of the Subgrade
Sydney, September 2011
Urbáez & Giovanon: Estimation of the “C” Value Considered In the AASHTO-93 Guide for Back Analysis of the Elastic
Modulus of the Subgrade.
23
5. AASHTO-93 Methodology for Back Analysis of the Subgrade Resilient Modulus
The AASHTO-93 Guide includes several procedures to determine the resilient modulus of the subgrade. Even though, the guide emphasises the procedure of back analysis of the subgrade resilient modulus using superficial deflections measured by non destructive equipment like the Falling Weight Deflectometer –FWD-.
The back analysis process is an approach of the state of stresses within a pavement structure based on superficial deflections measured during the application of a load. It has considered the principles of the mechanics of the continuous to the multi layers pavement analysis and through a trial and error routine, it is possible to generate a state of stresses that represents the same displacements of the surface (deflections) measured in the field.
Considering this aspect, different methodologies and equipments were developed to measure superficial deflections within a pavement structure. One of the most popular equipment for the measurement of superficial deflections is the Falling Weight Deflectometer (FWD). The FWD is high performance equipment, based on load impulses transmitted to the pavement by a mass that strikes a plate over the pavement surface from a certain height and weight. The equipment relies on geophones that gather the impulses generated by the load. The geophones are placed under the applied load and a certain distance from the applied load, so it is possible to model the “deflection bowl” generated by the impact of the load on the pavement. The transmission of the load to the structure is similar to that which is produced by an axle of a vehicle travelling at a certain speed on the pavement.
It is important to consider, that due to the costs involved in the acquisition of laboratory equipments, that allows performance of the Resilient Modulus Test, the necessity of taking samples from the soil on site, the execution of a destructive test (in the case of the existing pavements), among others; the back analysis models based on the measurement of superficial deflections with the FWD equipment, played an important role within the pavements analysis, especially for the evaluation of existing ones.
5.1. AASHTO-1993 Methodology
The following equation was developed by the AASHTO-93 Methodology for back analysis of the subgrade resilient modulus:
rd
PMR
r
24.0= (Eq. 11)
Where: MR: Resilient modulus of the Subgrade, in psi. P: Applied load, in pounds. dr: Deflection at “r” distance from the applied load, in inches. r: Distance from the “dr” was measured, in inches.

Estimation of the “C” Value Considered In the AASHTO-93 Guide for Back Analysis of the Elastic Modulus of the Subgrade
Sydney, September 2011
Urbáez & Giovanon: Estimation of the “C” Value Considered In the AASHTO-93 Guide for Back Analysis of the Elastic
Modulus of the Subgrade.
24
This equation considered the fact that deflections in a point sufficiently away from the centre of applied load, is due to the deformation of the subgrade and it is independent of the load radius, which for the FWD corresponds to the radius of the load plate. Nevertheless, it is important to determine the minimum radius for which the deformation is due to the subgrade. Considering that, it is for this radius and deformation that the procedure seeks to back analyse the resilient modulus of the subgrade. The Figure 5-1 shows an illustrative scheme of the zone of stress, distance “r” and deflection “dr”, used by AASHTO-93 Method to back analyse the resilient modulus of the subgrade (MRrc-sr).
Figure 5-1 Schematic of FWD Test - Deflection Basin and Zone of Stress
The AASHTO-93 methodology anticipates a relation to establish this minimum distance “r”, according to the following expression:
r > 0,7 ae Where “ae” is the effective radius defined by the following expression:
+=
3
2
2
MR
EDa
P
ea (Eq. 12)
Where:
ae: Radius of the bulb of pressure in the interface between the subgrade and the pavement structure, in inches.
a: Circular radius of the contact load plate, in inches. D: Total thickness of the pavement layers, in inches. Ep: Effective modulus of the pavement structure considering all layers, in psi. MR: Resilient modulus of the subgrade.
“r”
“dr”
Source: G. Rada, et al. “Falling Weight Deflectometer (FWD). Testing and Analysis Guidelines, Vol 1. FHWA-FLH-07-001, 2007. U.S.A

Estimation of the “C” Value Considered In the AASHTO-93 Guide for Back Analysis of the Elastic Modulus of the Subgrade
Sydney, September 2011
Urbáez & Giovanon: Estimation of the “C” Value Considered In the AASHTO-93 Guide for Back Analysis of the Elastic
Modulus of the Subgrade.
25
In order to know Ep it is required to solve by iteration the following equation:
+
−
+
+
=
P
P
E
MR
Padoa
D
MR
E
a
D
2
2
1
11
31
15.1 (Eq. 13)
Where: do: Maximum deflection on the applied load, in inches. Standardized to a temperature of 20ºC
(60 ºF). p: Load plate pressure, in psi. a: Load plate radius, in inches. D: Total thickness of the pavement layers above the subgrade, in inches. MR: Resilient modulus of the subgrade, in psi. Ep: Effective module of all pavement layers above the subgrade, in psi.
Once the resilient modulus of the subgrade is obtained it should be affected by an adjustment factor “C”. The final expression of the subgrade modulus is the following:
=
rd
PCMR
r
24.0 (Eq. 14)
Where, “C” adjustment factor recommended by AASHTO-93 is equal to 0.33. The AASTO-93 Guide procedure was applied on each of the nine (9) test pits subgrade materials being analysed. Following Table 5-1 shows the results of the back analysed subgrade modulus.

Estimation of the “C” Value Considered In the AASHTO-93 Guide for Back Analysis of the Elastic Modulus of the Subgrade
Sydney, September 2011
Urbáez & Giovanon: Estimation of the “C” Value Considered In the AASHTO-93 Guide for Back Analysis of the Elastic
Modulus of the Subgrade.
26
Table 5-1 Back Analysed Resilient Modulus of the Subgrade (MRrs-sr). AASHTO-93 Model
As can be seen in the preceding Table 5-1, the values of the subgrade modulus varies between 43 MPa (6,225 psi) and 89 MPa (12,956 psi), and –in general- they are higher than the values obtained by KENLAYER –as it was expected-. It should be noticed that these modulus were obtained of a distance “r” from the applied load, between 60cm and 125cm, according to the AASHTO-93 methodology.
This MRrc-sr should be affected by a “C” adjustment factor of 0.33, recommended by the AASHTO-93 Guide.
Resilient Modulus of the Subgrade
–AASHTO-93 Method-
Test Pits Material MPa psi
1 Subgrade 70 10,191
2 Subgrade 62 9,011
3 Subgrade 89 12,956
4 Subgrade 69 10,034
5 Subgrade 63 9,121
6 Subgrade 45 6,456
7 Subgrade 43 6,225
8 Subgrade 58 8,377
9 Subgrade 63 9,060

Estimation of the “C” Value Considered In the AASHTO-93 Guide for Back Analysis of the Elastic Modulus of the Subgrade
Sydney, September 2011
Urbáez & Giovanon: Estimation of the “C” Value Considered In the AASHTO-93 Guide for Back Analysis of the Elastic
Modulus of the Subgrade.
27
6. “C” Adjustment Factor Analysis Results
6.1. “C” Adjustment Factor
The factor of adjustment “C” -in the present investigation- was determined by the relationship between the site resilient modulus of the subgrade (MRsite-sr), estimated by KENLAYER and considered the “pilot” or reference, and the back analysed modulus obtained using the AASHTO-93 Method (MRrc-sr). In addition, the MRrc-sr, was compared with the resilient modulus obtained for a deviator stress of 0.0414 MPa (6.0 psi), suggested by AASHTO-93-Guide. Following Table 6-1 summarises the results.
Table 6-1 “C” Adjustment Factor Results. AASHTO-93 Model
“C” Adjustment Factor
(AASHTO-93 Method)
Test Pits Material MRrc-sr (MPa)
MRsite-sr (MPa)
MR σd=0.0414
(MPa)
Classific. (AASHTO)
Based on: MRsite-sr
Based on: (σd=0.0414MPa)
1 Subgrade 70 46 41 A-6(11) 0.66 0.59
2 Subgrade 62 50 44 A-7-6(19) 0.81 0.71
3 Subgrade 89 50 44 A-7-6(16) 0.56 0.49
4 Subgrade 69 53 48 A-7-6(16) 0.77 0.70
5 Subgrade 63 47 41 A-7-6(18) 0.75 0.65
6 Subgrade 45 50 44 A-7-6(19) 1.11 0.98
7 Subgrade 43 50 44 A-7-6(12) 1.16 1.02
8 Subgrade 58 45 41 A-6(6) 0.78 0.71
9 Subgrade 63 45 42 A-6(8) 0.71 0.67
Average 0.81 0.72
Estandard Dev. 0.20 0.17 General Statistic
Range 0.56 – 1.16 0.49 – 1.02
Average 0.72 0.66
Estandard Dev. 0.06 0.06 Statistic Soil Type A-6
Range 0.66 – 0.78 0.59 – 0.71
Average 0.72 0.64
Estandard Dev. 0.11 0.10 Statistic Soil Type A-7-6 (*)
Range 0.56 – 0.81 0.49 – 0.71
Average 0.77 0.69
Estandard Dev. 0.01 0.03 Statistic Test Pits: 4, 5 Y 8
Range 0.75 – 0.78 0.65 – 0.71
(*): With out Test Pits No.: 6 and 7

Estimation of the “C” Value Considered In the AASHTO-93 Guide for Back Analysis of the Elastic Modulus of the Subgrade
Sydney, September 2011
Urbáez & Giovanon: Estimation of the “C” Value Considered In the AASHTO-93 Guide for Back Analysis of the Elastic
Modulus of the Subgrade.
28
6.2. Analysis Results
As can be seen in the preceding Table 6-1, the “C” factor ranges between 0.56 and 1.16, based on the site resilient modulus and the general statistical results.
The “C” factor of the subgrade materials of the test pits No. 6 and 7, show values of 1.11 and 1.16; respectively, which means that the MRrc-sr is less than the MRsitio-sr. These values contradict the expected results, considering that the MRrc-sr was verified to a distance “r” from the applied load of 85 cm and 95 cm, respectively. Following are some aspects that should be considered:
• Except the test pits No. 6 and 7, all the subgrade materials shown a “C” factor between 0.56 and 0.81, with MRrc-sr higher than MRsitio-sr, which is the expected behaviour for these types of materials.
• All materials of the test pits No. 4; 5 and 8, were tested in the laboratory, considering their own natural moisture and density. These test pits, showed consistent results of the “C” factor, ranging from 0.75 to 0.78. Regarding the remaining test pit materials, except test pits No. 6 and 7, the laboratory test results that were assumed, were performed under the same moisture and density conditions.
Taking into account these aspects, it is possible to conclude that the MRsitio-sr of the test pits No. 6 and 7, were over estimated. Considering that the constitutive constants that were assumed did not represent the natural moisture conditions of the soil when the deflections were measured. In contrast they improve its real condition.
Similar results were obtained by Angelone and Martinez, 19886, whom have reported for cohesive soil, similar to the founded in this investigation, a reduction of the resilient modulus of the laboratory, when the moisture has increased and density decreased. It is important to point out, that the soil A-7-6(19) that comprises the test pits No. 6 with natural moisture of 30% could not be tested in the laboratory.
With respect to the test pit No. 7, the test of resilient modulus was performed to the material of the subgrade with natural moisture of 20%, which did not represent the moisture of all layers that comprised the subgrade. Superficial materials of the subgrade (below 40 cm) have shown natural moisture between 27% and 29%.
Test pits No. 1, 2 and 3, shown “C” adjustment factor of 0.66, 0.81 and 0.56, respectively. However, all materials from these test pits, except the material of the base of the test pit No. 2, had assigned values to the constituent equations. Even though, the moisture and density condition was similar, they have not been tested.
To sum up, among the soils that have been evaluated in this study, three (3) test pits have the same subgrade soil type (A-6) as that of the Road Experiment. Nevertheless, the “C” adjustment factor in average was of 0.72; which is more than the double of the value recommended by the AASHTO-93 Guide, for this type of soil.
6 Angelone S., Martinez F. “Analysis of Non-linear Models Describing the Resilient Behaviour for Soils and Unbound Materials”.
IMAE, Universidad del Rosario, Argentina.

Estimation of the “C” Value Considered In the AASHTO-93 Guide for Back Analysis of the Elastic Modulus of the Subgrade
Sydney, September 2011
Urbáez & Giovanon: Estimation of the “C” Value Considered In the AASHTO-93 Guide for Back Analysis of the Elastic
Modulus of the Subgrade.
29
Analysing the general average of the “C” factor, the value obtained using a deviator stress of 0.0414 MPa (6.0 psi) is 13% below the result obtained with the site resilient modulus. It should be noted that this is the deviator stress proposed by AASHTO-93 to estimate the MRsitio-sr.

Estimation of the “C” Value Considered In the AASHTO-93 Guide for Back Analysis of the Elastic Modulus of the Subgrade
Sydney, September 2011
Urbáez & Giovanon: Estimation of the “C” Value Considered In the AASHTO-93 Guide for Back Analysis of the Elastic
Modulus of the Subgrade.
30
7. Conclusions and Recommendations
Based on the results of the present investigation, the main conclusions and recommendations are:
• The AASHTO-93 back analysed subgrade resilient modulus (MRrs-sr) of soil types A-6 and A-7-6, similar to the Road Experiment, are higher than those obtained modelling the site conditions of the material and considering its constitutive constants obtained from laboratory tests (MRsite-sr). This is consistent with the results published by the same AASHTO-93 Guide.
• The magnitude of the relationship between MRrc-sr and MRsitio-sr, considered in this investigation as the “C“ adjustment factor showed an average value of 0,72, excluding the values from the test pits No. 6 and 7. This value is 2.2 times higher than that recommended by the AASHTO-93-Guide.
• Considering the aspect described above, it is possible to conclude that the AASHTO-93 Guide is conservative with regard to the estimation of the Resilient Modulus of the subgrade based on the back analysis of the deflection bowl. It will produce higher pavement design thickness which will impact the final cost of the rehabilitation treatment.
• Natural moisture and density are considered one of most important variables to estimate the site resilient modulus of the different materials.
• The test pits No. 4, 5 and 8, were modelled using the constitutive equations obtained from the laboratory test. The “C” adjustment factors of these test pits were very consistent, with values between 0.75 and 0.78 with an average value of 0.77.
• Applying a deviator stress of 0.0414 MPa (6.0 psi), suggested by the AASHTO-93 Guide to estimate the site resilient Modulus of the subgrade, is a simplified procedure. It will let to avoid using a non linear elastic analysis of multi layers pavements like KENLAYER. This will lead to a difference of 13% in the “C” factor, which is considered relatively low, if a non elastic multi layers analysis can not be conducted.
• The procedure for back analysing of the subgrade resilient modulus included in the AASHTO-93 Guide is considered a useful, simple and less computational tool. Nevertheless, it should be used considering a “C” adjustment factor adequate for the materials under study.
• Additional investigations are recommended, in order to increase the number and type of soils being analysed and in consequence the “C” adjustment factor to be obtained.
• The behaviour of frictional soils varies considerably with respect to the evaluated cohesive soil. Hence, its study is highly recommended, if these types of materials are being identified within the subgrade.
Finally, the results shown in this investigation are considered reasonable, based on the subgrade materials and the analysed pavement structures.

Estimation of the “C” Value Considered In the AASHTO-93 Guide for Back Analysis of the Elastic Modulus of the Subgrade
Sydney, September 2011
Urbáez & Giovanon: Estimation of the “C” Value Considered In the AASHTO-93 Guide for Back Analysis of the Elastic
Modulus of the Subgrade.
31
8. References
1) AASHTO, DESIGNATION: T 294-92. (1992). “Resilent Modulus of Unbound Granular Base/Subbase Materials and Subgrade Soils-SHRP Protocol P46. U.S.A.
2) “AASHTO GUIDE FOR DESIGN OF PAVEMENT STRUCTURES-1993”. Published by The American Association of State Highway and Transportation Officials, USA, 1993.
3) AMERICAN SOCIETY FOR TESTING AND MATERIALS (ASTM), DESIGNATION: D 4694-96 (1996). “Deflections with a Falling-Weight-Type Impulse Load Device”. U.S.A.
4) “ASPHALT OVERLAYS AND PAVEMENT REHABILITATION”. Published by The Asphalt Institute. Manual Series No. 17 (MS-17). First Edition, USA, November 1969.
5) Australian Standard. AS 1289.6.8.1-1995. “Methods of Testing Soils for Engineering Purposes”. Australia, 1995.
6) Chitrapu, S., Hossain, M. y Romanoschi, S. (October 2002). “Consideration of Stress Sensitivity in Backcalculation of Sub-grade Moduli”. Dept. of Civil Engineering, Kansas State University, Manhattan, U.S.A.
7) D. Shiraz, E. Lukanen, Editors. “Nondestructive Testing of Pavements and Backcalculation of Moduli”. 3ra. Volume. ASTM STP 1375. USA. 2000.
8) European Comite For Standarisation CEN/TC 227 N 1009. Road Materials Bituminous Mixtures. Test Methods For Hot Mix Asphalt. Part 26: Stiffness. Appendix C. Indirect Tension Test on Cylindrical Specimens (IT-CY). (2003).
9) E. Urbaez, O. Giovanon, F. Schvartzer, J. Lockhart. “Estimation of the “C” Factor included into the AASHTO-93 Guide to the Back Analysis of the Subgrade Resilient Modulus. Case of Study. 3rd Asphalt Venezuelan Congress, Venezuela, 2004.
10) F. Martínez. “Viscoelasticity of The Asphalt Mixes Considering The Indirect Tensile Test”. Permanent Asphalt Commission. 32nd Asphalt Meeting. Argentina, November 2002.
11) F. Limaymanta, et al. “Resilient Modulus Laboratory Test”. XIV Nacional Civil Engineering Congress, Perú, 2003
12) Huang, Yang. (1993). “Pavement Analysis and Design”, Universidad de Kentucky, U.S.A. 13) Irwin, L. H., Ph.D., P.E. “Backcalculation: An Overview and Perspectiva”. Cornell
University, Ithaca, NY, U.S.A. 14) Lockhart, J. y Lilli, F. (November, 1962). “The AASHO Road Test”. Asphalt Meeting.
Argentina. 15) Lytton, R., Germann, F., Chou, Y. y Stooffels, S. (June 1990). “Determining Asphaltic
Concrete Pavement Structural Properties by Nondesctructive Testing”. TRB, National Research Councial, Hihgway Research Program Report, number 327, U.S.A.
16) Per Ullidtz. “Modelling Flexible Pavement Response and Performance”, Technical University of Denmark, Denmark, First Edition, 1998.
17) P. Ullidtz. “The Analytical-Empirical Method for Pavement Design & Evaluation”. 1986. 18) P.N. Schmalzer, G.R. Rada, J.S. Miller. “Falling Weignt Deflectometer (FWD). Testing
and Analiysis Guidelines”. Vol.1 and Vol.2 . Publication No. FHWA-FLH-07-001. February 2007, USA.
19) Seed, H., Chan C., and Lee C., 1962. “Resilience Characteristics of Subgrade Soils and there Relation to Fatigue Failures in Asphalt Pavement” . Proc, 2nd International Conference on the Structural Design of Asphalt Pavements. Ann Arbor, Michigan. USA.
20) Scullion y Michalak, C. (1990). “Modulus 4.0: User Manual”, Texas Transportation Institute, Texas, U.S.A.
21) S. Angelote, F. Martínez,. J. Tosticarelli. “Resilient Modulus of the Unbound Soils. Its Application to The Pavement Structural Design”, Argentina.
22) S. Angelone, F. Martínez. “Analysis of Non-linear Models Describing the Resilient

Estimation of the “C” Value Considered In the AASHTO-93 Guide for Back Analysis of the Elastic Modulus of the Subgrade
Sydney, September 2011
Urbáez & Giovanon: Estimation of the “C” Value Considered In the AASHTO-93 Guide for Back Analysis of the Elastic
Modulus of the Subgrade.
32
Behaviour for Soils and Unbound Materials”. IMAE, Nacional University Rosario, Argentina.
23) S. Angelone, F. Martínez, J. Tosticarelli. “Rheological Characterzation of Asphalt Mixes Considering The Indirect Tensile Test with Repetitive Loads”. Permanent Asphalt Commission. 27th Meeting of Asphalt. December, Argentina, 1992.
24) S. Angelote, F. Martínez. “Determination of The Dynamic Modulus (Stiffness) of Asphalt Mixes in the Litoral Region”. IMAE, University of Rosario. 23º Asphalt Meeting, Argentina (1985).
25) The Asphalt Institute. “Soil Manual For The Design Of Asphalt Pavement Structures. Manual Series No. 10 (MS-10). USA. 1978
26) V. Quintus, B. Killingsworth. “Design Pamphlet for the Determination of Design Subgrade in Support of the 1993 AASHTO. Guide for the Design of. Pavement Structures”, (publication No. FHWA-RD-97-083, Septiembre (1997).
27) Yoder, E. And Witczak, M. (1975). “Principles of Pavement Design”, Second Edition, U.S.A.