estonia 2000-2012 another crises country. background and history details of the relevant history,...
TRANSCRIPT

Estonia 2000-2012
Another crises country

Background and History
• Details of the relevant history, pertinent to its economic condition.
• Position of the economy in the world, relative to others.

Background and History
• A Baltic country, with 1.29 million population.• Independence in August 1991.• 2004 incorporated to European Union.• Member of NATO and OECD.• January 1, 2011 adopted Euro, prior local
currency was Kroons, maintained with a currency board.

Economic Outcome
• With the independence moved quickly to a market based economy. It has the highest per capita income in East Europe.
• Considered as High Income Country by WB, Advanced Economy by IMF.
• Has one of the highest freedom indexes (press, economic, education etc..)
• Per capita income = 21 200 US dollars in 2012

Estonia
• Since independence, market based economy, pro-business policies.
• High skilled labor force, low wages contribute to competitiveness.
• Proximity to Nordic countries, • Main trading partners are Sweden, Finland
and Germany.
Recent Policy Changes, Liberalization and Regulations
What type of economy, rules…Recent policy changes such as liberalization of any sector, or market…

Recent Policy Changes, Liberalization and Regulations
• Prior to crisis (2004-2007)• Fast growth until 2007. • Free market principles, open economy and
factor flexibility are the important element for this success.
• EU accession boosted the growth process.

Openness and small country
• Openness contributes to growth through exports, as an increase in absorption.
• However, small open economies are more sensitive to global and sectoral shocks and results in pronounced volatility of the output. This will have long term effects…
• FDI and Trade can mitigate the external and domestic shocks, through a lower Keynesian multiplier, which explains how shocks are propagated throughout the economy.

The performance of the economy prior to the crisis
• Output growth, inflation and unemployment, • Monetary Policy, interest rates,• Fiscal balances, Government budget deficit
and debt, • Current account balances, etc• Labor markets

The performance of the economy prior to the crisis
2004-2007
• Fast growing economy, low unemployment• Low inflation rate• Credit increase, inflated housing prices and
dominance of the construction sector,• Lower government deficit and debt,

How Was The Economy Affected by the Crises?
• Which sector was affected first?, • Financial markets, • Prices, interest rates and exchange rate,• Output and employment effect,• External balance and fiscal balance,

Initial shock of the crises Q4 of 2007
• External shock was through export sector. Decline of export demand were significant.
• Around the same time loan-financed real estate bubble burst, (cause of the bubble).
• A decrease in private demand and public demand.– Consumption expenditure declined, savings
increased.– Fiscal policy was pro-cyclical.

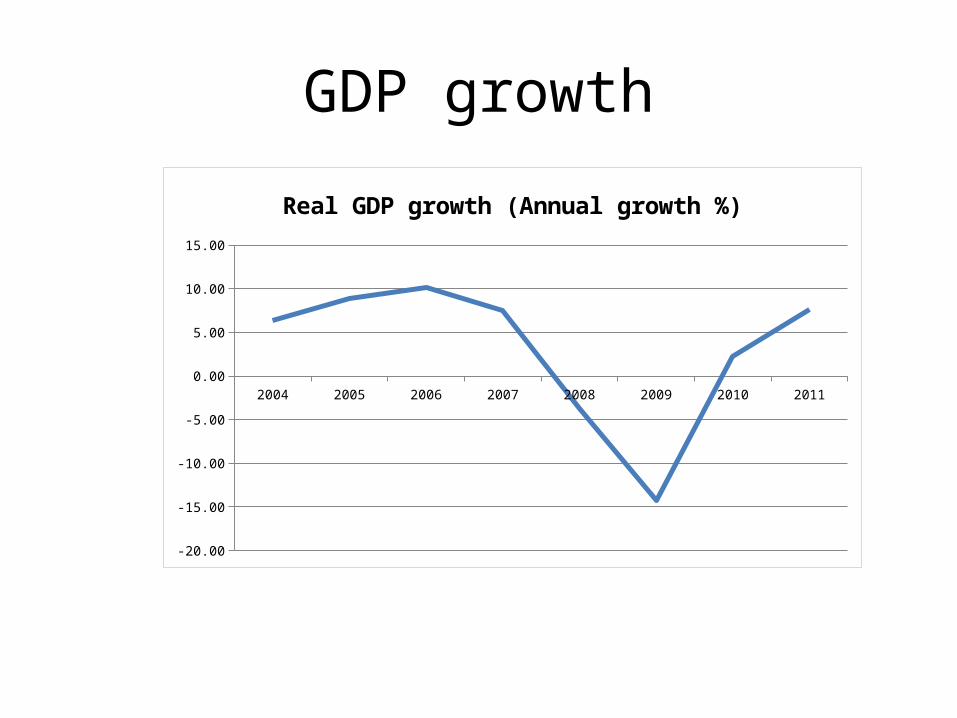
During the crisis • Estonia was one of the countries with the sharpest decline in
output • (2007 7.49%; 2008 -3.67%; 2009 -14.26%; 2010 2.26%; 2011 7.64%)• Brunt of the recession was felt in 2009.
• Domestic demand decline• Private sector
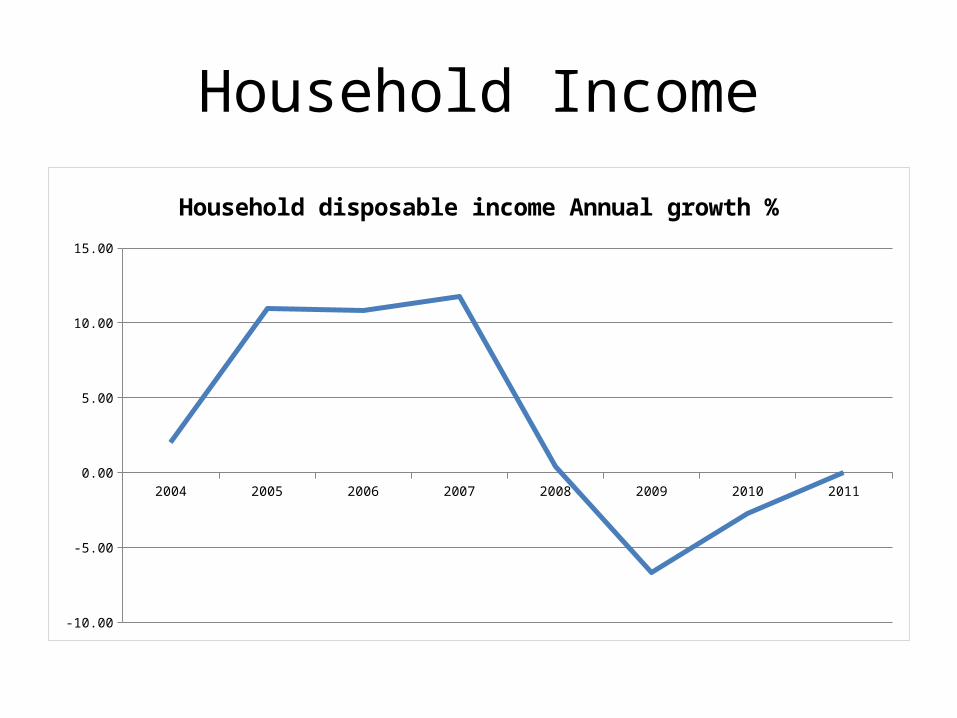
– Private consumption, (by 19% in 2009) , salaries fell as well. (Consumption of durable goods declined (41% in 2009)
– Investment and inventories declined, (-35% in 2009)– Savings increased.
• Household Disposable income showed a great decline- Flexibility of the economy, • Public Sector• Pro-cyclical fiscal policy,
GDP growth
2004 2005 2006 2007 2008 2009 2010 2011
-20.00
-15.00
-10.00
-5.00
0.00
5.00
10.00
15.00
Real GDP growth (Annual growth %)

Savings (S/DI) and investment( I/GDP)
2004 2005 2006 2007 2008 2009 2010 2011
-50.00
-40.00
-30.00
-20.00
-10.00
0.00
10.00
20.00
30.00
40.00
Net saving rate in household disposable income %Gross fixed capital formation % of GDP
Household Income
2004 2005 2006 2007 2008 2009 2010 2011
-10.00
-5.00
0.00
5.00
10.00
15.00
Household disposable income Annual growth %

External sector
• Free trade regime and open economy. More than 60% of the output is sold internationally.
• The 70% of the exports are to EU. • Considerable downturn due to the global crises at the
end of 2008 and 2009. • The annual decline in goods and services export was 11.2
% in 2009. Both the prices and the volumes declined. (Biggest decline in machinery and equipment by 1/3).
• Imports declined drastically due to the recession in domestic demand (in 2009 the decline was 26.8 %).

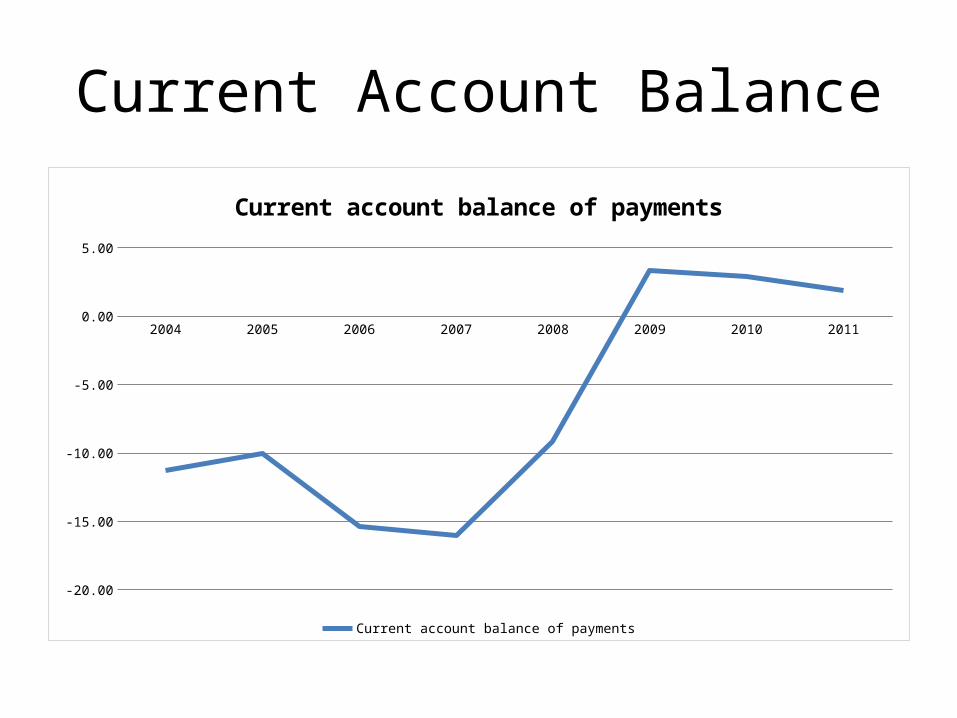
External Balance
• The contraction of the imports were larger than it is in exports, hence at the height of the crises, its external balance improved and the current account was balanced in 2009.

External Balance
2004 2005 2006 2007 2008 2009 2010 20110.00
10.00
20.00
30.00
40.00
50.00
60.00
70.00
80.00
90.00
100.00
Exports and Import to GDP
Imports of goods and services Exports of goods and services
Current Account Balance
2004 2005 2006 2007 2008 2009 2010 2011
-20.00
-15.00
-10.00
-5.00
0.00
5.00
Current account balance of payments
Current account balance of payments

Foreign Direct Investment
2006 2007 2008 2009 2010 2011
-2 000
-1 500
-1 000
- 500
0
500
1 000
1 500
2 000
2 500
3 000
Chart Title
Inflows of foreign direct investment Outflows of foreign direct investment

Fiscal Stance during the crises
• Public sector: Pro-cyclical fiscal policy.• Rapid austerity measures;• Reliable fiscal policy was instrumental in the rapid recovery. • The government froze pensions, lowered state salaries by
10%, raise the VAT by 2%, can not be transferred to consumers due to lower demand.
• The government sector outlays declined, the public sector investment declined by 19 %.
• Government deficit improved.• The policy is later reversed to expansionary stance.

Fiscal Stance
2004 2005 2006 2007 2008 2009 2010 20110.00
5.00
10.00
15.00
20.00
25.00
30.00
35.00
40.00
45.00
50.00
Government revenue and expenditures
General government revenues General government expenditures

Government deficit and debt ratios
2004 2005 2006 2007 2008 2009 2010 2011
-4.00
-2.00
0.00
2.00
4.00
6.00
8.00
10.00
12.00
14.00
Chart Title
Government deficit General government debt

Fiscal stance
• This is a severe cleansing activity. The removal of the nonproductive activities. The decreased spending was the activities of the previous government.
• Government debt to GDP is – 81 % in Germany and– 165 % in Greece.

Credit conditions and banking
• Estonia has a very high ratio of foreign owned banking (share of foreign owned banking assets are above 95%). This has been both positive and negative.
• Prior to the crises, loans were almost twice the size of the domestic deposit base.
• Nordic banks are capitalized and not very connected, and that helped the resilience of the banking sector during the crises.
• Bank loans declined by 17% which is a very quick deleveraging.

Unemployment rate
2004 2005 2006 2007 2008 2009 2010 20110.0
5.0
10.0
15.0
20.0
25.0
Unemployment rate: total labour forceUnemployment rate, men: male labour forceUnemployment rate, women: female labour force

Recovery steps
• The economic fundamental in the recovery.• What are the challenges now and the future?