estonia - oecd
TRANSCRIPT

© OECD 2019
Education at a Glance: OECD Indicators (OECD, 2019[1]) is the authoritative source for information on the state of education around the world. It provides data on the structure, finances and performance of education systems in OECD and partner countries.
Estonia • Only about 34% of students who enter a bachelor’s programme in Estonia graduate within the
programme’s theoretical duration, below the average of 39%. The completion rate after threeadditional years is higher, at 59%, but still below the average for countries with available data of 67%.
• Total spending on tertiary education has increased between 2012 and 2014, but spending per studentremains below the OECD average.
• Women are considerably more likely to attain tertiary education than men, although they still facelower employment rates and earnings regardless of their level of educational attainment.
• Despite considerable increases in recent years, teachers’ salaries remain low and below the averageearnings of tertiary-educated workers in the country.
Figure 1. Completion rate of full-time students who entered a bachelor's or equivalent programme (2017)
Note: For countries with true cohort data, the completion includes students who transferred and graduated from another tertiary level. 1. Year of reference differs from 2017. Refer to the source table for details.2. Completion rate of students who entered a bachelor's programme does not include students who transferred and graduated from short-cycleprogrammes.3. The theoretical duration plus 3 years refers to the theoretical duration plus 2 years.4. Data do not include entrants to 6-year bachelor's programmes, which correspond to about 2% of total entrants at this level.5. Data refer only to the hautes écoles (HE) and the écoles des arts (ESA), representing about 60% of entrants to bachelor's or equivalent programmes.6. Data refer to estimated completion rates based on a modelled relationship between future graduates and students still enrolled.Countries and economies are ranked in descending order of completion rate by theoretical duration (true cohort) or cross cohort.Source: OECD (2019), Table B5.1. See Source section for more information and Annex 3 for notes (https://doi.org/10.1787/f8d7880d-en).

2 |
© OECD 2019
Tertiary attainment is relatively high, although many students who enter this level leave without graduating
• In 2018, 41% of Estonia’s adult population (25-64 year-olds) had attained tertiary education, above the OECD average of 39%. This share has been increasing over the past decade, but several indicators point to a potential reversal of this trend. First, upper secondary attainment, although nearly universal in the country, has been declining among the younger generations. Second, the enrolment of 20-29 year-olds in tertiary education has fallen from 23% in 2010 to 19% in 2017, below the OECD average of 22%. Third, completion rates for tertiary programmes are relatively low. Only about 34% of students who enter a bachelor’s programme in Estonia graduate within the programme’s theoretical duration, compared to an average of 39% among countries with available data (Figure 1). After three additional years, the completion rate increases to 59%, still below the average of 67%, and one-third of the entry cohort have left the system without graduating, compared to 24% on average among countries with available data.
• A relatively large share of tertiary students pursue a master’s level degree in Estonia, either through long first degrees or through a master’s following a bachelor’s. In 2017, about 31% of all tertiary students in the country were enrolled in a master’s level course, nearly double the OECD average of 16%. The share of tertiary students enrolled in doctoral programmes is also well above the OECD average (6% in Estonia compared to 2% on average across OECD countries). Between 2014 and 2018, the share of the population holding a doctorate in Estonia increased from 0.5% to 0.7% (OECD average: 1.1%). Nevertheless, some concerns remain over the relatively small number of researchers in the country (OECD, 2019[2]). More research and development (R&D) funding may be needed to attract candidates to these positions. In 2016, Estonia spent about USD 3 7001 on R&D per tertiary student, below the OECD average of USD 4 500.
• The most popular broad fields of study among tertiary graduates in Estonia are business, administration and law (23%) and engineering, manufacturing and construction (15%), both in line with the respective OECD averages. In recent years, many OECD countries have focused on increasing the alignment between education outcomes and labour-market needs in order to help students transition from one to the other. In Estonia, information and communication technologies (ICT) is the broad field of study associated with the highest employment rates and highest earnings and is also by far the fastest-growing field among tertiary graduates in the past five years. Only 4% of tertiary-educated adults overall in Estonia have a degree in ICT, but this rises to nearly 8% among students who graduated from tertiary education in 2017. This is one of the highest shares of all OECD countries and nearly double the OECD average.
• Estonia has been striving to improve the quality and attractiveness of its higher education system through internationalisation. In 2013, it implemented a new performance-based funding system that takes institutions’ level of internationalisation into account (OECD, 2015[3]). These efforts seem to have paid off: between 2010 and 2017, the share of international students sharply increased from less than 2% to over 8% (OECD total: 6%). A nearly equal share – 8% – of Estonian tertiary students were enrolled abroad in 2017. This is the fourth highest share across OECD countries, and over four times the OECD total of 2%. As in most OECD countries, the most popular broad field of study for international students in Estonia is business, administration and law (39%), although an above-average share of them enrol in ICT (10%, compared to the OECD total of 7%). Speaking Estonian is less often a requirement in ICT-related jobs, so international graduates with this degree may face fewer challenges in joining the labour market than those who studied other fields (European Commission, 2018[4]).
1 Values reported in equivalent US dollars (USD) have been converted using purchasing power parities (PPPs) for GDP.

| 3
© OECD 2019
Tertiary spending is increasing, mostly from public sources, but alternative sources of funding may soon be needed
• Between 2012 and 2016, total expenditure on tertiary institutions increased by 7% in Estonia. This increase was slower than the growth in gross domestic product (GDP) during the same period, leading to a decrease of about 3% in the percentage of GDP devoted to tertiary education. Nevertheless, given that the number of tertiary students has been falling, expenditure per tertiary student increased by 42% during the same period. Even so, spending in Estonia remains below the OECD average, at USD 12 900 per student compared to USD 15 600.
• Unlike in most OECD countries, the increase in tertiary spending in Estonia has come mostly from the public sector: the government accounted for 49% of tertiary spending (before transfers) in 2012, rising to 78% in 2016 (OECD average: 74%). Part of the increase in the share of public spending observed in Estonia, particularly in recent years, can be attributed to the 2013 reform which made public and government-dependent institutions – in which 90% of tertiary students are enrolled – tuition free for programmes taught in Estonian (OECD, 2019[2]).
• The increase in the share of public spending was accompanied by a nearly equivalent fall in the share of funding from international sources. Between 2012 and 2016, the contribution of international sources to tertiary spending (before transfers) dropped from 35% to 10% – still higher than in any other OECD country and well above the OECD average of 3%. As the country’s economy grows, it will be increasingly less likely to qualify for international financial assistance (OECD, 2019[2]).
• In 2016, the private sector accounted for 12% of total spending on tertiary education (OECD average: 32%), half of which comes from households. The relatively low share of private spending comes mainly from the 10% of students enrolled in independent private institutions and from students in public and government-dependent institutions who do not qualify for free tuition (e.g. students enrolled part time or in programmes taught in English).
Tertiary attainment is associated with better labour-market and social outcomes, including a greater participation in lifelong learning
• As in most OECD countries, individuals with a tertiary education in Estonia have higher earnings and higher employment rates than those without this level of education. However, both the earnings and the employment advantages are smaller in Estonia than on average across OECD countries. In 2018, the employment rate of tertiary-educated adults was 5 percentage points higher than that of individuals with upper secondary education (OECD average is 9 percentage points higher). Moreover, tertiary-educated adults earned on average 30% more than those with upper secondary education (OECD average: 57%).
• Higher educational attainment is also associated with improved social outcomes, such as greater social connectedness. In Estonia, 91% of tertiary-educated adults had participated in a cultural or sporting activity in the last 12 months, compared to only 52% of those without upper secondary education. As is the case in most OECD countries with available data, tertiary-educated adults in Estonia are also more likely to participate in formal voluntary activities and to be frequent readers.
• Participation in lifelong learning also rises with the level of educational attainment. In 2016, 44% of adults in Estonia participated in formal and/or non-formal education and training, below the average of 47% across OECD countries participating in the Adult Education Survey (AES) and below the shares in neighbouring Latvia (48%) and Finland (54%). As in all other OECD countries with available data, most of this participation takes place in job-related non-formal education programmes, which helps explain the wide variation by level of educational attainment. In Estonia, participation reaches 61% among tertiary-educated adults (average: 66%), compared to 35% among those with upper secondary education (average: 44%) and only 24% among those without upper secondary education (average: 26%). Over

4 |
© OECD 2019
the past four years, participation in lifelong learning opportunities has been increasing among those with at least upper secondary education and has remained mostly stable among those without this level of education (Eurostat, 2018[6]).
While the gender gap in education increasingly favours women, the situation in the labour market is reversed
• Estonia has one of the largest gender gaps in educational attainment of all OECD and partner countries (Figure 2). While 54% of young women (25-34 year-olds) have attained tertiary education, the same is true for only 34% of young men. The gender gap has been widening over the past decade: in 2008, the tertiary attainment rate of women in Estonia was only 12 percentage points higher than that of men. Female graduates have also become the majority at the doctoral level, where women were under-represented among older generations in Estonia and continue to be under-represented in many OECD countries. In 2017, 58% of the doctoral graduates in Estonia were women, compared to 47% in total across OECD countries.
Figure 2. Share of tertiary-educated women as a percentage of the share of tertiary-educated men, by age group (2018)
25-34 year-olds, 55-64 year-olds and 25-64 year-olds
1. Year of reference differs from 2018. Refer to Table A1.1 for more details. Countries are ranked in descending order of percentage point difference for the age group 25-64. Source: OECD (2019), Education at a Glance Database, http://stats.oecd.org. See Source section for more information and Annex 3 for notes (https://doi.org/10.1787/f8d7880d-en).
• In the labour market, however, women are less likely to be employed and earn less than men regardless of their level of educational attainment – and the gender gap in both areas is wider than the OECD average. In 2018, 94% of tertiary-educated men were employed (OECD average: 89%), compared to only 75% of women (OECD average: 81%). Moreover, tertiary-educated women in Estonia earn, on average, 27% less than tertiary-educated men (OECD average: 25% less).
• The comparatively wider gender gap in labour-market outcomes of tertiary-educated workers in Estonia cannot be explained by gender differences in the choice of fields of study. Women in Estonia make up a larger share of graduates than the OECD average in the fields of study associated with the highest
| 5
© OECD 2019
earnings and employment rates. They account for 29% of ICT graduates (OECD average: 21%), 78% of dental studies graduates (OECD average: 70%) and 68% of medical graduates (OECD average: 60%). Studies have shown, however, that Estonia has a very strong horizontal segregation (gender concentration into different occupations) and vertical segregation (concentration into different occupational levels), which together help explain a significant part of the gender gap in earnings (Anspal and Rõõm, 2011[7]). Nevertheless, the unexplained part of the gap – that is, the gap that remains after taking into account gender differences in age, education, occupation, work experience, working hours, type of contract or type of enterprise – remains considerable (Leythienne and Ronkowski, 2018[8]).
Vocational education is a priority, but it lacks diversity and clear paths to further education
• The expansion and improvement of upper secondary vocational education is a policy priority in Estonia. The government has implemented extensive reforms to the vocational education system, but participation remains relatively weak. The share of 15-19 year-old upper secondary students enrolled in vocational education has been falling since 2013 and was only 31% in 2017, well below the OECD average of 38% and neighbouring Finland (48%) and Latvia (38%).
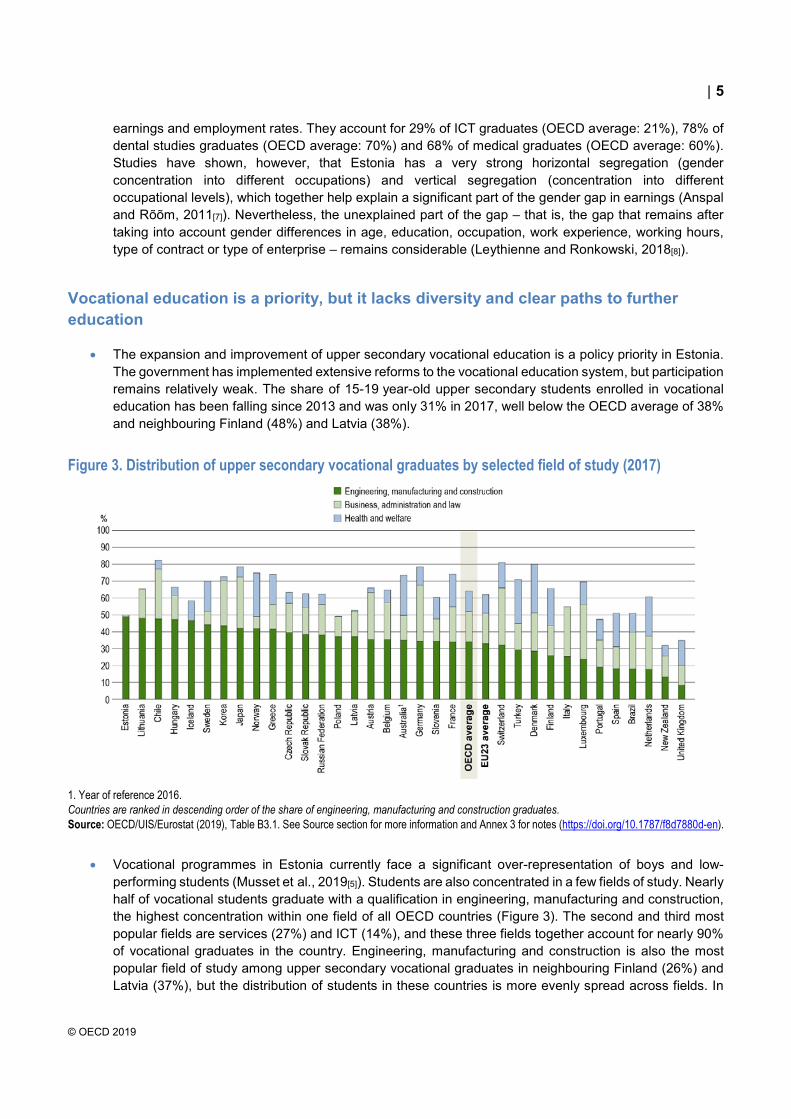
Figure 3. Distribution of upper secondary vocational graduates by selected field of study (2017)
1. Year of reference 2016. Countries are ranked in descending order of the share of engineering, manufacturing and construction graduates. Source: OECD/UIS/Eurostat (2019), Table B3.1. See Source section for more information and Annex 3 for notes (https://doi.org/10.1787/f8d7880d-en).
• Vocational programmes in Estonia currently face a significant over-representation of boys and low-performing students (Musset et al., 2019[5]). Students are also concentrated in a few fields of study. Nearly half of vocational students graduate with a qualification in engineering, manufacturing and construction, the highest concentration within one field of all OECD countries (Figure 3). The second and third most popular fields are services (27%) and ICT (14%), and these three fields together account for nearly 90% of vocational graduates in the country. Engineering, manufacturing and construction is also the most popular field of study among upper secondary vocational graduates in neighbouring Finland (26%) and Latvia (37%), but the distribution of students in these countries is more evenly spread across fields. In
6 |
© OECD 2019
Finland, at least 13% of graduates receive degrees in health and welfare; services; and business, administration and law. In Latvia, the same is true for the fields of arts and humanities; services; and business, administration and law.
• Recent reforms have aimed at improving the attractiveness and quality of vocational programmes by developing a deeper engagement with employers and increasing work-based learning opportunities (Santiago et al., 2016[9]). The share of upper secondary students in work-based vocational programmes in Estonia has increased considerably, from 0.2% in 2013 to 2.0% in 2017 but participation remains well below the OECD average of 18%.
• The attractiveness of vocational programmes may also increase with the development of clearer pathways into higher education. In principle, there are no formal access restrictions, but the admissions procedures used by most higher education institutions, such as national or state examinations in subjects such as mother tongue, mathematics and foreign languages, may discourage applicants from vocational programmes. Only 11% of bachelor’s entrants and 2% of master’s long first degree entrants (the only two tertiary entry programmes in Estonia) come from vocational upper secondary programmes compared with 28% on average for bachelor’s programmes across countries with available data.
• Moreover, as in most OECD countries with available data, students from vocational upper secondary education who enter bachelor’s programmes are considerably less likely to complete them than those from general upper secondary education. While 60% of the students who entered a bachelor’s programme with a general upper secondary qualification in Estonia graduate within six or seven years (the theoretical duration of the programme plus three years), the same is true for only 45% of students with a vocational upper secondary one. This may be due to students joining the labour market sooner, but it may also indicate weaknesses in the preparation of vocational students to succeed in higher education.
To promote teaching as a career for top-performing students, job quality matters at least as much as pay
• Attracting, developing and retaining the best teachers is one of the main education challenges facing OECD countries. In Estonia, only about 1.4% of 15-year-old students want to become teachers, one of the lowest shares among countries participating in the Programme for International Student Assessment (PISA) and well below the OECD average of 4.2% (OECD, 2018[10]). Nevertheless, attracting new teachers will be mainly a question of quality rather than quantity. Although the teaching workforce is ageing and nearly 50% of all primary to upper secondary teachers in Estonia are 50 or over (OECD average: 36%), the shrinking school-age population is likely to limit the recruitment of new teachers in the coming years.
• Higher salaries are one of the main strategies to increase the attractiveness of the teaching profession. In 2013, a change in the way teachers’ salaries were calculated in Estonia (from contractual hours to full-time employment pay) led to considerable increases in teachers’ salaries (OECD, 2015[3]). Between 2013 and 2017, average actual salaries increased by 35% at all levels from pre-primary to general upper secondary education, one of the steepest increases across OECD countries. Despite this, teachers’ actual salaries are still among the lowest of all OECD countries at each level of education (Figure 4).
• Pre-primary teachers in Estonia earn about 37% less than tertiary-educated workers in the country (OECD average: 22% less), and primary to secondary teachers earn about 9% less (OECD averages range from 16% less in primary to 7% less in general upper secondary). Higher salaries are ranked as a highly important spending priority for nearly 80% of lower secondary teachers in Estonia, above the OECD average of 65% (OECD, 2019[11]).
• Higher salaries, however, may not be enough to attract the best candidates. When deciding whether to pursue a career in teaching, high-performing students, in particular, seem to be more sensitive to

| 7
© OECD 2019
teachers’ working conditions, as measured by class size and teaching time (OECD, 2018[10]). Teachers in Estonia enjoy relatively small class sizes, which have been decreasing over the past decade. In 2017, the average class size was 19 students in primary education (OECD average: 21) and 18 students in lower secondary (OECD average: 23).Teaching hours in primary and lower secondary education have also fallen over the past decade. In 2018, primary teachers taught for 585 hours over the year – the second shortest hours among OECD countries and well below the OECD average of 776 hours.
Figure 4. Actual salaries of lower secondary teachers and school heads (2017)
Annual actual salaries of teachers and school heads in public institutions, in equivalent USD converted using PPPs
1. Year of reference differs from 2017. See Table D3.4 for more information. Countries and economies are ranked in descending order of actual salaries of school heads. Source: OECD (2019), Table D3.4. See Source section for more information and Annex 3 for notes (https://doi.org/10.1787/f8d7880d-en).
• The relatively short teaching hours in Estonia also reflect the comparatively short compulsory instruction time required for primary and lower secondary students (6 431 hours for both levels combined compared with the OECD average of 7 590 hours). However, this is at least partially compensated for by a more efficient use of the time spent in class. In Estonia, teachers get along well with students and are able to spend about 86% of class time on teaching and learning (as opposed to management and keeping order in the classroom) compared to an OECD average of 78% – the second highest share across countries participating in the Teaching and Learning International Survey (OECD, 2019[11]).
• In Estonia, schools are responsible for at least 50% of decisions regarding the organisation of instruction, personnel management, planning and resource management in public lower secondary education. Despite this high level of autonomy and responsibility, school heads in Estonia earn less than their counterparts in most other OECD countries and economies (Figure 4). Average actual salaries for school heads in primary to upper secondary (general programmes) in Estonia are about USD 31 300, compared to OECD averages ranging from USD 61 800 at primary level to USD 72 000 at upper secondary. School heads in Estonia have some of the lowest earnings premiums over teachers across OECD countries, earning 24% more on average, compared to at least 50% more on average across OECD countries.

8 |
© OECD 2019
References
Anspal, S. and T. Rõõm (2011), Gender Pay Gap in Estonia: Empirical Analysis, https://www.sm.ee/sites/default/files/content-editors/Ministeerium_kontaktid/Valjaanded/gender_pay_gap_estonia_analysis.pdf (accessed on 13 August 2019).
[7]
European Commission (2018), Education and Training Monitor 2018: Estonia, Publications Office of the European Union, Luxembourg, http://dx.doi.org/10.2766/148242.
[4]
Eurostat (2018), Participation Rate in Education and Training (last 4 weeks) by Sex, Age, and Educational Attainment, Eurostat, https://appsso.eurostat.ec.europa.eu/nui/show.do?dataset=trng_lfs_02&lang=en.
[6]
Leythienne, D. and P. Ronkowski (2018), “A decomposition of the unadjusted gender pay gap using Structure of Earnings Survey data”, Statistical Working Papers, European Union, Luxembourg, http://dx.doi.org/10.2785/796328.
[8]
Musset, P. et al. (2019), Vocational Education and Training in Estonia, OECD Reviews of Vocational Education and Training, OECD Publishing, Paris, https://dx.doi.org/10.1787/g2g9fac9-en.
[5]
OECD (2015), Education Policy Outlook 2015: Making Reforms Happen, OECD Publishing, Paris, https://dx.doi.org/10.1787/9789264225442-en.
[3]
OECD (2018), Effective Teacher Policies: Insights from PISA, PISA, OECD Publishing, Paris, https://dx.doi.org/10.1787/9789264301603-en.
[10]
OECD (2019), TALIS 2018 Results (Volume I): Teachers and School Leaders as Lifelong Learners, TALIS, OECD Publishing, Paris, https://dx.doi.org/10.1787/1d0bc92a-en.
[11]
OECD (2019), Benchmarking Higher Education System Performance, Higher Education, OECD Publishing, Paris, https://dx.doi.org/10.1787/be5514d7-en.
[2]
OECD (2019), Education at a Glance 2019: OECD Indicators, OECD Publishing, Paris, https://dx.doi.org/10.1787/f8d7880d-en.
[1]
Santiago, P. et al. (2016), OECD Reviews of School Resources: Estonia 2016, OECD Reviews of School Resources, OECD Publishing, Paris, https://dx.doi.org/10.1787/9789264251731-en.
[9]
For more information on Education at a Glance 2019 and to access the full set of Indicators, visit www.oecd.org/education/education-at-a-glance-19991487.htm.
Updated data can be found on line at http://dx.doi.org/10.1787/eag-data-en and by following the under the tables and charts in the publication.
Explore, compare and visualise more data and analysis using:
http://gpseducation.oecd.org/CountryProfile?primaryCountry=EST&treshold=10&topic=EO.

| 9
© OECD 2019
Questions can be directed to:
Corinne Heckmann
Directorate for Education and Skills
Country note author:
Camila Lima de Moraes
Directorate for Education and Skills
This work is published under the responsibility of the Secretary-General of the OECD. The opinions expressed and arguments employed herein do not necessarily reflect the official views of OECD member countries.
This document and any map included herein are without prejudice to the status of or sovereignty over any territory, to the delimitation of international frontiers and boundaries and to the name of any territory, city or area.
On 25 May 2018, the OECD Council invited Colombia to become a Member. While Colombia is included in the OECD averages reported in this note, at the time of its preparation, Colombia was in the process of completing its domestic procedures for ratification and the deposit of Colombia’s instrument of accession to the OECD Convention was pending.
Note regarding data from Israel
The statistical data for Israel are supplied by and are under the responsibility of the relevant Israeli authorities. The use of such data by the OECD is without prejudice to the status of the Golan Heights, East Jerusalem and Israeli settlements in the West Bank under the terms of international law.
10 |
© OECD 2019
Source Main topics in Education at a Glance
Educational attainment of 25-64 year-oldsShort-cycle tertiary Bachelor's or equivalentMaster's or equivalentDoctoral or equivalent
Tertiary attainment of 25-34 year-olds, by gender 2008 2018 2008 2018 2008 2018Men 30% 34% 31% 38% 28% 36%Women 42% 54% 40% 51% 38% 50%Total 36% 44% 35% 44% 33% 43%
Distribution of first-time tertiary entrants by education levelShort-cycle tertiary Bachelor's or equivalentMaster's or equivalent
Share of international or foreign students, by education level1
Bachelor's or equivalentMaster's or equivalentDoctoral or equivalentAll tertiary levels of education
Employment rate of 25-64 year-olds, by educational attainmentShort-cycle tertiary Bachelor's or equivalentMaster's or equivalentDoctoral or equivalentAll tertiary levels of education
Employment rate of tertiary-educated 25-64 year-olds, by field of study
Education Business and administration and lawEngineering, manufacturing and constructionHealth and welfare
Relative earnings of full-time full-year 25-64 year-old workers, by educational attainment (upper secondary education = 100)
Short-cycle tertiary Bachelor's or equivalentMaster's, doctoral or equivalentAll tertiary levels of education
Upper secondary or post-secondary non-tertiary attainment rate
Table A1.2 Share of 25-34 year-olds with upper secondary or post-secondary non-tertiary as their highest attainment
Percentage of first-time upper secondary graduates with a vocational qualification
Table B3.1 Vocational programmes
General programmesVocational programmes
General programmesVocational programmes
Employment rate Unemployment rate Inactivity rate
General programmes Vocational programmes
Enrolment rate of 3-5 year-olds in educationTable B2.2 ECEC and primary education
Share of children enrolled in private institutions
Table B2.3 Pre-primary level (ISCED 02)
Ratio of children to teaching staff
Table B2.3 Pre-primary level (ISCED 02)Expenditure on children aged 3-5 enrolled in education
Table B2.4 Annual expenditure per child, in USD2 per child
Table A1.1
1% 1%
20186% 7% 5%
13% 17% 14%21% 13% 15%
1%
Figure B3.2
2017
58%35%
55%46%
56%46%
2016
USD 6 548USD 7 031
USD 9 397USD 10 922
USD 9 671Table C1.1
USD 11 320
USD 7 146 USD 8 141 USD 8 926
Total expenditure on upper secondary educational institutions, in USD2
per full-time equivalent student, by programme orientation
91%
2017
88%
12%80%8%
13% 13%14%
89%
2018
Table B6.1
6%
2018
86%
2017
Figure B3.1** 18 19** 21 21
Upper secondary and vocational education and training (VET)
Table A3.482%86%88%
84%
87%
87%89%
2018
44% 41%
Tertiary education
86%
7%
85%
Share of women among upper secondary graduates, by programme orientation
2017Early childhood education and care (ECEC)
Table B4.1
2017
22% 22%8% 6%
4% 7%
76%****
17%
44%
**
12%
9%
2017
**
141
2017
**
Table A4.1144 138
2017
174130 157
93 120 121
40% 46%
2017
27%
Table A3.3
130
152191
2016**
34%
16
Key Facts for Estonia in Education at a Glance 2019Estonia OECD average EU23 average
Age at graduation from upper secondary education, by programme orientation
Table A1.2
15
87% 90%
Employment, unemployment and inactivity rates of 25-34 year-olds, with upper secondary or post-secondary non-tertiary education 2018
5% 7% 8%14% 16% 14%
81% 78% 79%
Table A3.1
80% 82% 82%84% 84% 84%87% 88% 88%91% 92% 93%85% 85% 86%

| 11
© OECD 2019
Source Main topics in Education at a Glance
Participation in formal and/or non-formal education, by educational attainment3
Below upper secondaryUpper secondary or post-secondary non-tertiaryTertiary
Participation in cultural or sporting activities in the last 12 months, by educational attainment4
Below upper secondaryUpper secondary or post-secondary non-tertiaryTertiary
USD/student % GDP USD/student % GDP USD/student % GDPPrimary USD 6 872 1.4% USD 8 470 1.5% USD 8 548 1.3%Lower secondary USD 7 047 0.7% USD 9 884 0.9% USD 10 302 0.9%Upper secondary USD 6 742 0.7% USD 10 368 1.1% USD 10 308 1.0%Tertiary (including R&D) USD 12 909 1.5% USD 15 556 1.5% USD 15 863 1.2%
Public Private Public Private Public PrivatePrimary, secondary and post-secondary non-tertiary 93% 7% 90% 10% 92% 8%Tertiary (including R&D) 81% 12% 66% 32% 73% 24%
Total public expenditure on primary to tertiary educationTable C4.1 As a percentage of total government expenditure
Teachers School heads Teachers School heads Teachers School heads
Pre-primary 0.63 0.95 0.78 ** 0.78 1.16Primary 0.91 1.12 0.84 1.25 0.85 1.24Lower secondary (general programmes) 0.91 1.12 0.88 1.34 0.89 1.34Upper secondary (general programmes) 0.91 1.12 0.93 1.43 0.95 1.43
Starting salarySalary after 15
years of experience
Starting salarySalary after 15
years of experience
Starting salarySalary after 15
years of experience
Pre-primary ** ** USD 31 276 USD 42 078 USD 30 615 USD 41 354Primary USD 22 178 ** USD 33 058 USD 45 947 USD 32 987 USD 45 748Lower secondary (general programmes) USD 22 178 ** USD 34 230 USD 47 675 USD 34 261 USD 47 772Upper secondary (general programmes) USD 22 178 ** USD 35 859 USD 49 804 USD 35 104 USD 49 875
Net teaching time
Total statutory working time
Net teaching time
Total statutory working time
Net teaching time
Total statutory working time
Pre-primary 1 320 hours 1 610 hours 1 024 hours 1 613 hours 1 062 hours 1 550 hoursPrimary 585 hours 1 540 hours 783 hours 1 612 hours 754 hours 1 539 hoursLower secondary (general programmes) 602 hours 1 540 hours 709 hours 1 634 hours 673 hours 1 572 hoursUpper secondary (general programmes) 568 hours 1 540 hours 667 hours 1 629 hours 643 hours 1 558 hours
Percentage of teachers who are 50 years old or overTable D5.1 Primary to upper secondary
Share of female teachers, in public and private institutions
PrimaryLower secondary
Total number of compulsory instruction time, by level of educationPrimaryLower secondaryUpper secondary
Average class size by level of educationPrimaryLower secondary
1. For some countries, data on foreign students are provided instead of international students.2. Values reported in equivalent US dollars (USD) have been converted using purchasing power parities (PPPs) for GDP3. EU23 average refers to the average of OECD countries that participated in the Adult Education Survey (AES).4. EU23 average refers to the average of OECD countries that participated in the European Union Statistics on Income and Living Conditions 2015.
Cut-off date for the data: 19 July 2019. Any updates on data can be found on line at http://dx.doi.org/10.1787/eag-data-en.** Please refer to the source table for details on these data.
The reference year is the year cited or the latest year for which data are available.
Table D1.1
Organisation of teachers' working time in public institutions over the school year
2018
Annual statutory salaries of teachers in public institutions, based on most prevalent qualifications, at different points in teachers' careers2
2018
Table D3.1a
Teachers, the learning environment and the organisation of schools
2017
Table D3.2a
2016
10.8% 9.6%
Actual salaries of teachers and school heads in public institutions relative to earnings of full-time, full-year workers with tertiary education
Table C3.1
Financial resources invested in education
Table C1.1 and C2.1
2016
EU23 average
Table A7.1
Table A6.152% n.a. 56%
3 002 hours
76% n.a. 77%
Estonia
87%83% 69% 72%
201610.5%
n.a. 66%
OECD average
91% n.a. 92%
Tables D4.1a and D4.1b
2017
Share of expenditure on educational institutions, by final source of funds
Total expenditure on educational institutions, by level of education2
Social outcomes and adult learning
2016
24% n.a. 26%
2015
35% n.a. 44%61%
Table D2.1
2017
21
** ** **
18 23
49% 36% 39%
2017
Table D5.290% 83%
2019
19 21 20
3 964 hours 4 568 hours 4 258 hours2 468 hours 3 022 hours