ethanol production from xylose and glucose by zymomonas ... · ethanol production from xylose and...
TRANSCRIPT
Ethanol production from xylose and glucose by Zymomonas mobilis for the development of a membrane bioreactor
Thapelo Mokomele, Linda H Callanan and Kim G Clarke * DST-NRF Centre of Excellence in Catalysis (c*change), South Africa
Department of Process Engineering, University of Stellenbosch, Private Bag X1, Stellenbosch 7602, South Africa
*Corresponding author: [email protected]
Abstract The co-fermentation of glucose and xylose is a critical step for the economic bioconversion of lignocellulosic materials to ethanol as an alternative energy source. Due to their favourable hexose and pentose sugar fermentation kinetics, wild-type and genetically engineered strains of Zymomonas mobilis have been touted as ethanol-producing biocatalysts with high potential. Cell immobilization within semi-permeable membranes provides for a promising alternative to conventional reactor strategies by providing favourable microenvironmental conditions whilst facilitating high cell densities and high productivities. Fermentations with free cells of the wild-type strain Z. mobilis ZM4 and the recombinant strain Z. mobilis 8b were performed to evaluate the influence of the phosphate buffer, fermentation temperature and initial fermentation pH on the ethanol volumetric productivity, biomass yield and product yield. Fermentations conducted at a buffer concentration of 100mM required less fermentation time and did not inhibit the biocatalysts. A full factorial design on the effect of the fermentation temperature and initial fermentation pH illustrated that the optimal fermentation conditions occur at a temperature of 30°C and initial pH of 6. The presence of glucose in the fermentation medium did not have an effect on the overall product yield based on the amount of xylose consumed. However, the xylose/glucose fermentations illustrated that the glucose/xylose fermentations undergo simultaneous fermentation with preferential fermentation of glucose. Key Words: Lignocellulosic biomass, recombinant Zymomonas mobilis, glucose/xylose fermentation, ethanol yield, productivity, cell immobilization, membrane bioreactor.
1. Introduction Due to the diminishing fossil fuel reserves, the demand for an alternative fuel source has increased significantly in the last three decades. One particular area of interest has been the production of liquid transportation fuels from lignocellulosic biomass with the main focus on alcohols as alternative fuel sources(Feltenstein, 1983). Biofuels such as ethanol produced from renewable energy sources have been widely considered as potential successors a promising solution to the finite supply of energy from fossil fuels; its economical production via an environmentally benign process being the ultimate goal (Chander et al., 2011; Deanda et al., 1996; Dien et al., 2003). Lignocellulose is the most abundant, renewable organic material on the biosphere, consisting of the varying amounts of the carbohydrate polymers cellulose, hemi-cellulose and lignin (Chander et al., 2011; Davison and Scott, 1988; Lin and Tanaka, 2006). Xylose and glucose are major constituents of lignocellulosic biomass obtained through enzymatic or chemical hydrolysis of hemicellulose and cellulose fractions respectively (Grote et al., 1980; Lee et al., 1979; Olsson and Hahn-Hagerdal, 1996; Stanley and Hahn-H€agerdal, 2010; Zhang et al., 1995). As a result, many fermentation studies have been focused on the utilization on both of these substrates in view of developing economically viable ethanol production processes (Karsch et al., 1983; Liu, 2010; Mohagheghi et al., 2006, 2004, 2002) Conventional ethanol production strategies have focused on the fermentation of sugars obtained from lignocellulosic materials with various strains of Sacchromyces cerevisiae used as the biocatalyst (Jeon et al., 2002; Joachimsthal et al., 1999; Kim et al., 2000; Lawford and Rousseau, 2002; Lawford, 1988; Nellaiah et al., 1988)(. Wild-type strains of the facultative bacterium Zymomonas mobilis (such as the strain ZM4) have illustrated favourable fermentation kinetics relative to other GRAS organisms such as S. cerevisiae with
characteristics such as improved ethanol tolerance, specific ethanol productivity and glucose uptake rates. Further, the genetically engineered strain Z. mobilis 8b has illustrated great potential for fermenting both xylose and glucose with near theoretical yields. Hence, in view of its kinetics, Z. mobilis 8b is one of the most promising engineered fermentation biocatalysts for ethanol production to date. Current research approaches have been directed towards the development or the improvement of continuous bioreactor designs due to improvements in the volumetric productivity and the ability to maintain stable environments for maximum microbial rates (Carstensen et al., 2012; Davison and Scott, 1988; Inloes et al., 1985; Inloes, Taylor, Cohen, Michaels, and Robertson, 1983b, 1983a; Krishnan et al., 2000). Documentation of continuous ethanol production systems with constrained cells has included the successful biocatalyst retention via external cross-flow filtration units (Rogers et al 1980). However, cell retention via cell immobilization within a semi-permeable membrane provides a promising alternative to these systems by providing favourable microenvironmental conditions such as nutrient- and product -gradients, whilst facilitating the maintenance of high cell densities and high productivities (Dhariwal, 2007; Du Preez, 2008; Inloes, Taylor, Cohen, Michaels, and Robertson, 1983a; Inui et al., 2010; Shuler and Kargi, 2008). Further, the membrane acts as a cell-product separation unit, thereby facilitating in situ product extraction. Thus, the use of a membrane bioreactor integrates the fermentation and cell-product separation steps into a single unit. In the present study, ethanol production from the fermentation of a glucose substrate by the wild-type strain Z. mobilis ZM4 shall be investigated with the design objective being the development of a membrane bioreactor. Moreover, the application of the developed membrane bioreactor shall be extended to the co-fermentation of glucose/xylose substrate with the genetically engineered strain Z. mobilis 8b. The free-cell kinetics of both Z. mobilis ZM4 and 8b shall be investigated and modelled using unstructured kinetic models in view of defining the optimum fermentation conditions for the operation of the membrane bioreactor. The development of membrane bioreactor shall also be investigated through the evaluation of the membrane critical flux and the effect of the bioreactor orientation on the velocity flow patterns on the reactor shell-side. Lastly, future works relating to the quantification of the performance of the membrane bioreactor to changes in various performance parameters shall be revealed.
2. Materials and experimental design 2.1. Materials and methods
2.1.1. Microorganisms and culture maintenance The xylose fermenting recombinant strain Z. mobilis 8b and the wild-type strain Z. mobilis ZM4 were used in this work. Ethanol fermentations from glucose substrate were performed with Z. mobilis ZM4. This microorganism was obtained from the American Type Culture collection with the item number ATCC 31821 (ZM4). Xylose/glucose fermentations performed with the recombinant strain Z. mobilis 8b. This patented microorganism was obtained from the ATCC with the item number ATCC-PTA-6976. For long term storage, stock cultures of the recombinant strain were stored in cryovials containing 50 gL-1 glucose/20gL-1 xylose (20 gL-1 glucose for ZM4), 5gL-1 yeast extract and 20% (v/v) glycerol and refrigerated at -20 ˚C. For experimental use, both strains were maintained on rich agar slants consisting of 20gL-1 xylose/20gL-1 glucose for 8b (20gL-1 glucose for ZM4), 5gL-1 yeast extract and 20gL-1 agar. Colonies were grown for 5 days on this medium and thereafter refrigerated at 4 ºC for up to two months.
2.1.2. Media composition and preparation Pre-inoculum media consisted of 25gL-1 glucose/25gL-1 xylose for the recombinant strain 8b (50gL-1 glucose for ZM4) and 10gL-1 yeast extract. For Z. mobilis ZM4, the identical complex media was used for the preparation of the second stage inoculum and for fermentation studies with modifications to the media described by Rogers et al (1980). The second stage inoculum and free-cell (shake-flask) fermentation

media consisted of 100gL-1 and 50-150gL-1 glucose respectively in addition to 10gL-1 yeast extract; 1 gL-1 (NH4)2SO4 and 0.5 (MgSO4).7H2O. Rich growth medium consisting of 10gL-1 yeast extract, 1gL-1 (NH4)2SO4 and 1 gL-1 of sorbitol supplemented with sugar concentrations of 20gL-1 xylose and 100gL-1 glucose was used for the second stage inoculum preparation of Z. mobilis 8b. Fermentation media was identical to the second stage inoculum media with the absence of sorbitol being the only adjustment. In both cases, the media was prepared by dissolving the sugars in de-ionised water and were autoclaved separately from the minerals and the yeast extract. The sugars and mineral solutions were mixed aseptically once they had cooled down to room temperature. Excessive changes into the hydrogen ion concentration (pH) in the medium were prevented by the addition of a phosphate buffer. As an illustration, the inoculum or the fermentation media was supplemented with 10.99 gL-1 KH2PO4 and 3.34 gL-1 K2HPO4 for a buffer capacity of 100mM and the maintenance of a fermentation pH at 6.
2.1.3. Preparation of inocula All inocula were prepared at the fermentation temperature to adapt the inocula to the main fermentation conditions. A two-stage inocula protocol was adapted. A single colony of Z. mobilis ZM4 or 8b was transferred from the stock slant into 50mL of pre-inoculum media in a 100mL flask. The pre-inoculum consisted of 50gL-1 glucose/ 20gL-1 xylose for the recombinant strain (50gL-1 for ZM4). This flask was incubated at the fermentation temperature for 14-16 hours. This 20mL culture was thereafter aseptically transferred into a 180mL of inoculum media consisting of 100gL-1 glucose/20 gL-1 xylose for the recombinant strain 8b (100gL-1 for glucose for ZM4) in a 500mL flask. This inoculum flask was incubated for 16-20 hours as indicated by the final OD660 of approximately 1.5- 2.5. The sub-cultured inocula was inoculated into the main fermentation flask at 10% (v/v) to achieve an initial OD of 0.1-0.5 (32.6mgL-1 –163mgL-1).
2.1.4. Shake flask fermentations All free-cell fermentations were performed in 1L Erlenmeyer flasks with a working volume of 300mL. The flasks were sealed with foam plugs to facilitate an anaerobic environment. The inoculum subculture and fermentation flasks were incubated in an orbital shaker (Labcon, SA) at a constant agitation speed of 150 rpm.
2.1.5. Analytical techniques The cell growth was monitored turbidometrically by measuring the optical density (OD) of a culture sample using a spectrophotometer (Varian UV-Vis Superscan 3) at a wavelength of 660nm. The biomass concentration was measured by cell dry weight (CDW) after centrifuging the cells at 14 500 rpm for 10min (Eppendorf MiniSpin Plus) from a known culture sample volume, washing the cells with distilled water and drying the cells overnight in a vacuum oven at 80 ºC. A calibration curve plotting the cell dry weight (CDW) and the OD660 constructed and used to convert the OD obtained from samples from the fermentation flask to CDW equivalents. The concentrations of glucose, xylose, ethanol, and by-products (acetate, glycerol, lactate) were determined from filtered supernatants using high performance liquid chromatography (HPLC) fitted with a Prevail Carbohydrate ES 5l (250mm, 4.6mm) column (Grace Davison Discovery Sciences Deerfield, IL, USA) connected to All-Guard Cartridge System (Grace Davison Discovery Sciences, Deerfield, IL, USA). Isocratic component separation was performed for sugar, ethanol and by-product identification with the mobile phase consisting of 55% acetonitrile, 15% acetone, 30% water. For the quantification of glucose, ethanol, xylitol, glycerol and acetate an evaporative light-scattering detector was used at a detector temperature of 65 ºC and a flow rate of 0.6 mL/min. Standards containing known concentrations of all the mixed components expected in the sample will be run periodically to verify the calibration accuracy.
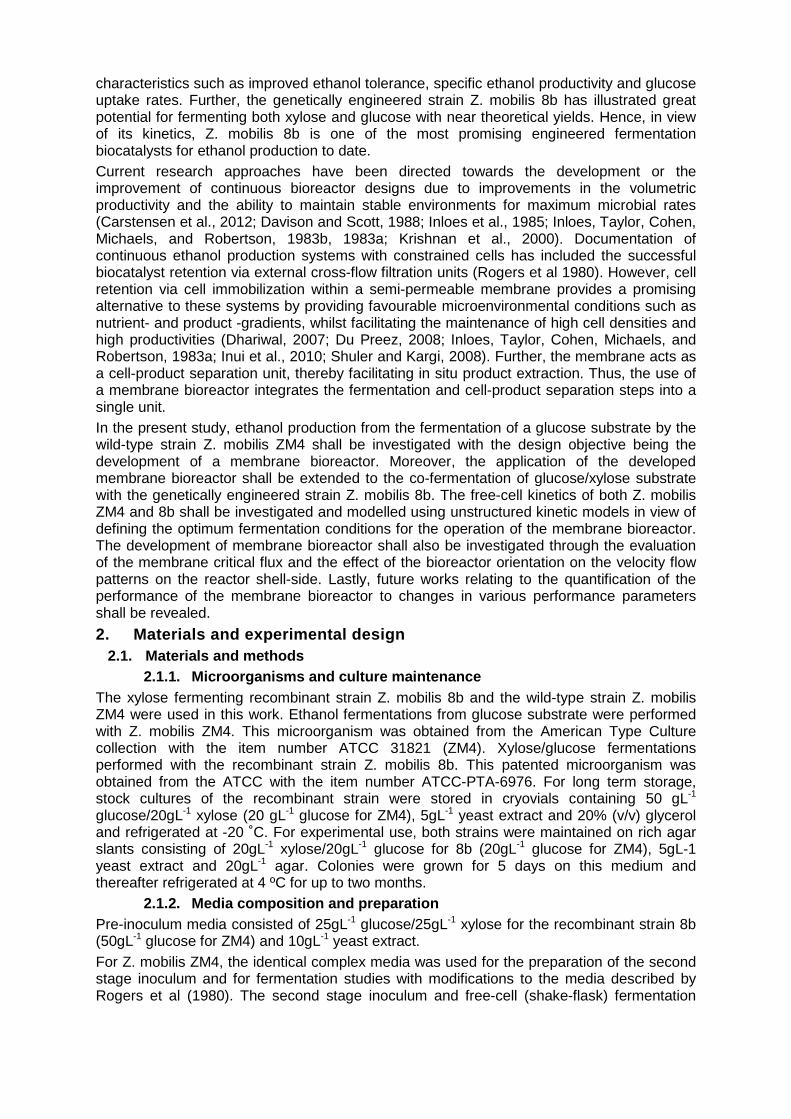
2.1.6. Membrane bioreactor design A schematic diagram of the membrane bioreactor design is shown in Figure 1. The reactor consists of a cylindrical borosilicate glass section (GlassChem, SA) fitted with an α-Al2O3 ceramic membrane (Atech Innovations, GER). The ceramic membrane has an internal diameter of 6x 10⁻³ m and is 250 x 10-3 m in length. It consists of a macroporous support (6-8µm) and an active layer on the lumen side (0.2 µm). The bacteria culture will be inoculated into the reactor shell side and immobilized into the macroporous support by induction of a trans-membrane pressure across the shell and the lumen sides. During experimentation, the sugar-nutrient solution will be fed in the reactor shell-side, flow through the macroporous support layer into the lumen-side and exit through the reactor permeate stream. This configuration allows for the retention of the cells (with a mean width of 2-4µm) inside the macroporous layer whilst facilitating the biocatalytic conversion of the sugars into ethanol and preventing ethanol inhibition on the bacteria fermentation kinetics.
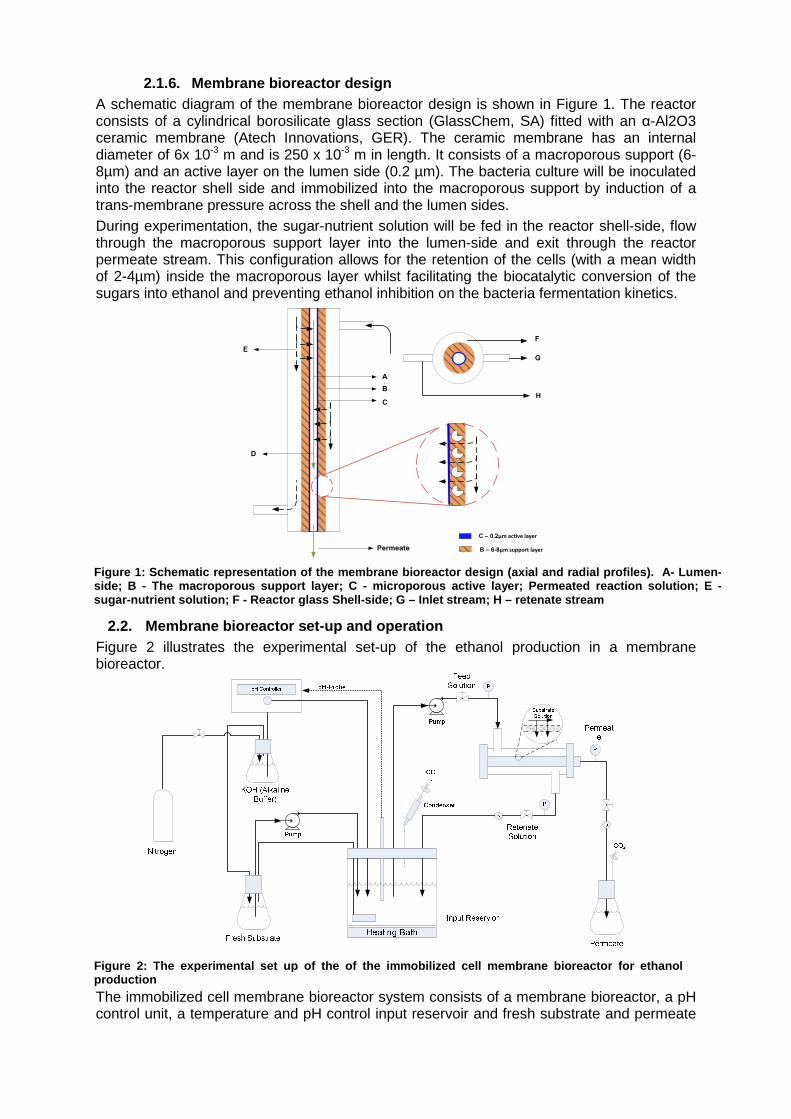
2.2. Membrane bioreactor set-up and operation Figure 2 illustrates the experimental set-up of the ethanol production in a membrane bioreactor. The immobilized cell membrane bioreactor system consists of a membrane bioreactor, a pH control unit, a temperature and pH control input reservoir and fresh substrate and permeate
A
B
C
Permeate
D
E
C – 0.2µm active layer
B – 6-8µm support layer
F
G
H
Figure 1: Schematic representation of the membrane bioreacto r design (axial and radial profiles). A - Lumen -side; B - The macroporous support layer; C - microp orous active layer; Permeated reaction solution; E -sugar-nutrient solution; F - Reactor glass Shell-sid e; G – Inlet stream; H – retenate stream
Figure 2: The experimental set up of the of the immobilized cell membrane bioreactor for ethanol production

collection reservoirs. A seed culture will be sub-cultured in the pre-sterilized input reservoir and transferred to the shell-side membrane bioreactor. The induction of a trans-membrane pressure across the reactor shell-side and the lumen side, the cells will be forced into the macroporous structure pores and prevented from leaking to the lumen side by the microporous active layer. After washing the bioreactor with saline, fresh substrate will be transferred into the bioreactor via the input reservoir. The substrate will flow through the membrane pores and collected into the permeate collection reservoir. Substrate that did not permeate through the membrane is recycled back into the input reservoir. The performance of the bioreactor will be evaluated based on the experimental data obtained from the permeate collection and various sample ports along the system.
2.3. Mathematical model development 2.1.7. Free cell kinetic model development
For modelling purposes, an unstructured biological model was employed to describe the kinetics of the free-cells in the shake flasks since only the cell mass, initial and final sugar and product concentrations are required (Znad et al., 2004). The developed mathematical model can be used for glucose, xylose and glucose/xylose fermentations. In the development of a kinetic model, it was assumed that (i) the fermentation temperature is constant and uniform throughout the fermentation broth and (ii) the fermentation is performed in the carbon limited regime where product and substrate inhibition are negligible. Hence, the material balances or kinetic rate expressions of the substrate, product, and biomass can be expressed as follows:
Biomass: ���� ��� [g cells.h-1] (1)
Glucose: ���� ���� [g.L-1h-1] (2)
Xylose: �� �� ���� [g.L-1h-1] (3)
Ethanol: ���� ��� [gL.-1h.-1] (4)
At the initial conditions, t = 0 � � ��; � � ��; �� � ��,�; �� ���,� (5)
The general relationship between the substrate concentration and the specific biomass growth rate is expressed by a modified Monod model kinetic expression. It is expected that xylose/glucose fermenting strain 8b will exhibit preferential glucose fermentation and thus the specific biomass can be expressed in terms of competition kinetics as described by (Helle and Duff, 2004):
Glucose: �� � ����,� � ���,�����,��, ∗�
[h-1] (6)
Xylose: �� � ����,� � ��2��,2�� ���, ��,∗�
[h-1] (7)
The preferential glucose or xylose consumption for biomass formation is depended on the concentrations of the two sugars and the magnitude of the ratio of the Monod half-saturation constants. Based on the assumption that both xylose and glucose compete for uptake via a common and constant sugar transport mechanism in Z. mobilis, the overall specific growth rate can be obtained from the following formulation (Leksawasdi et al., 2001): � � " � ∗ �� #" � ∗ �� [h-1] (8)
The rate of substrate consumption by Z. mobilis in anaerobic glucose fermentation has been previously studied and documented by Rogers et al (1983). The rate of substrate consumption rate is described as a function of the rate of product formation and the maintenance energy since under anaerobic conditions, the specific maintenance energy used non-growth processes such as protein and RNA turnover, and maintaining pH, ion,
and osmotic gradients across the cell membrane, results in product formation as well. This relationship is extended for xylose consumption was presented as follows:
Glucose: ��� � $%&�,�' �#(�) ∗ *
� $ �' +
∗ ��,� [g.L-1.h-1] (9)
Xylose: ��� � $,&�, ' � #(�- ∗ *
� $ �' +
∗ �.,2 [g.L-1.h-1] (10)
Similarly, the kinetic rate expression for the rate of ethanol production can be expressed by the combining the true product and cell yields with the rate of cell formation. Hence by combining equations (1), (6), (7), (8), (9), and (10) the following three equations below are derived for the rate of ethanol production based on the rate of biomass growth on glucose and xylose:
Glucose: ��,� � '+' �∗ /$���0 [g.L-1.h-1] (11)
Xylose: ��,� � '+ ' � ∗ /$���0 [g.L-1.h-1] (12)
Overall: �. � 1�.,� #�.,�2 [g.L-1.h-1] (13)
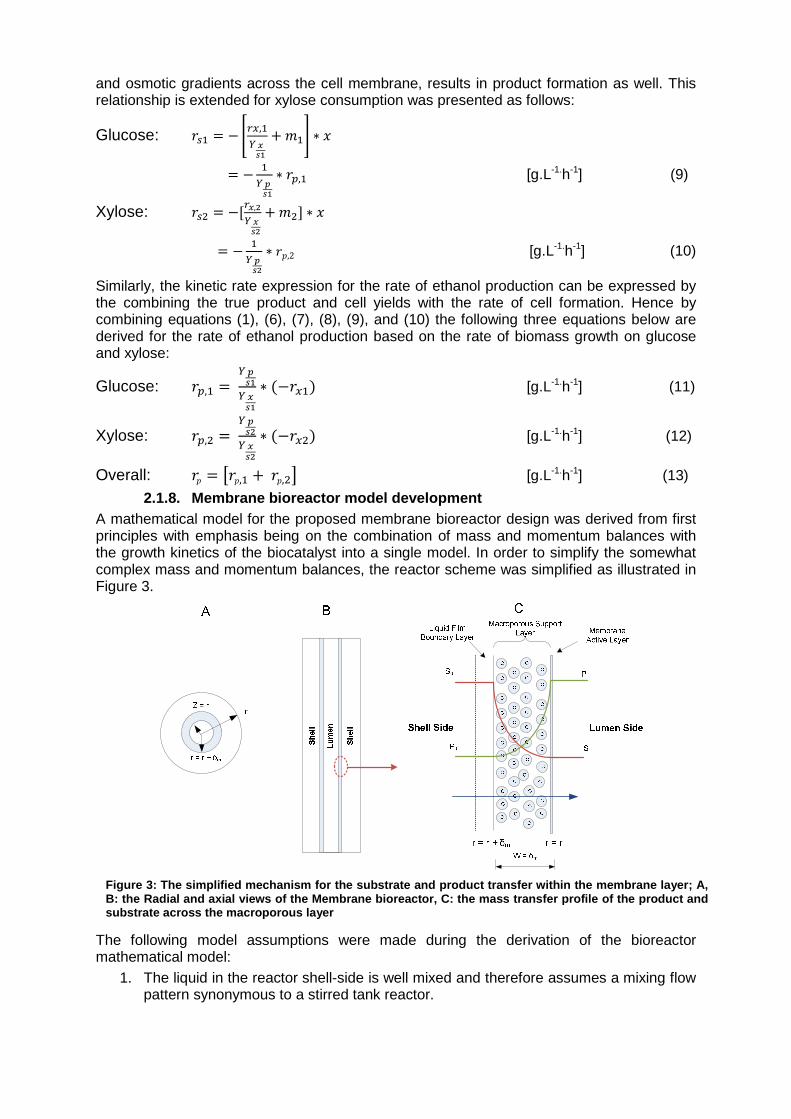
2.1.8. Membrane bioreactor model development A mathematical model for the proposed membrane bioreactor design was derived from first principles with emphasis being on the combination of mass and momentum balances with the growth kinetics of the biocatalyst into a single model. In order to simplify the somewhat complex mass and momentum balances, the reactor scheme was simplified as illustrated in Figure 3. The following model assumptions were made during the derivation of the bioreactor mathematical model:
1. The liquid in the reactor shell-side is well mixed and therefore assumes a mixing flow pattern synonymous to a stirred tank reactor.
Figure 3: The simplified mechanism for the substrate and pr oduct transfer within the membrane layer; A, B: the Radial and axial views of the Membrane biore actor, C: the mass transfer profile of the product and substrate across the macroporous layer
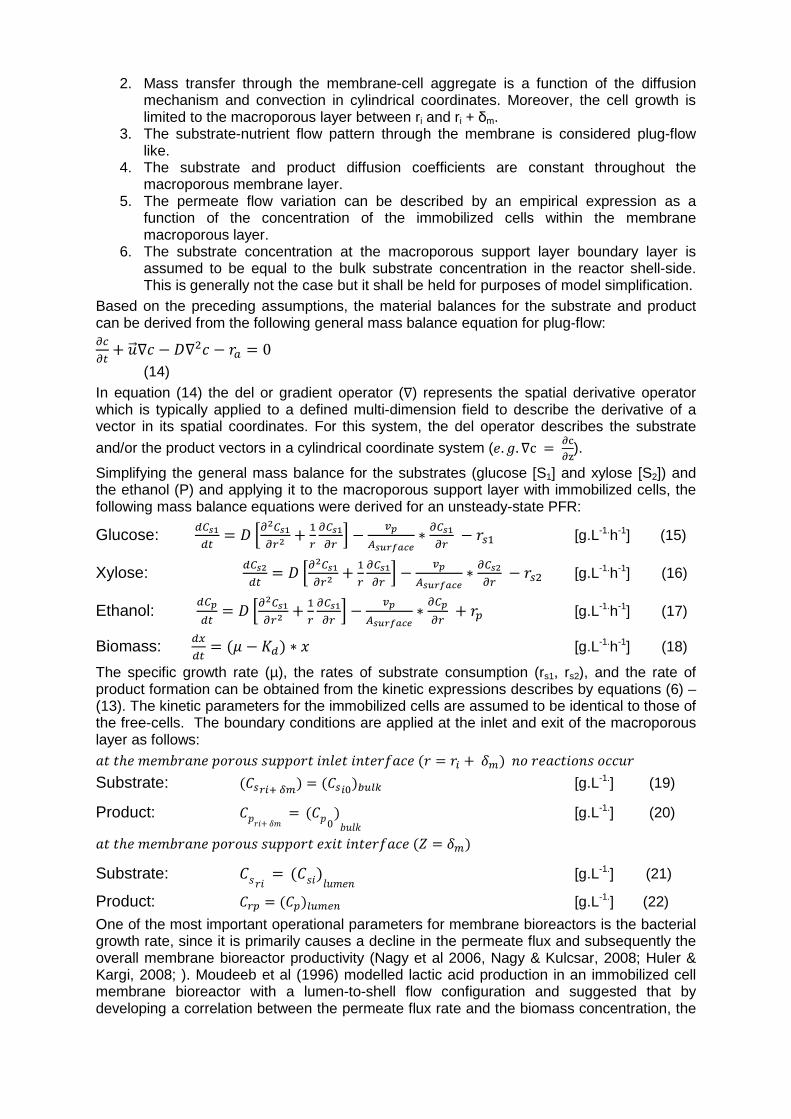
2. Mass transfer through the membrane-cell aggregate is a function of the diffusion mechanism and convection in cylindrical coordinates. Moreover, the cell growth is limited to the macroporous layer between ri and ri + δm.
3. The substrate-nutrient flow pattern through the membrane is considered plug-flow like.
4. The substrate and product diffusion coefficients are constant throughout the macroporous membrane layer.
5. The permeate flow variation can be described by an empirical expression as a function of the concentration of the immobilized cells within the membrane macroporous layer.
6. The substrate concentration at the macroporous support layer boundary layer is assumed to be equal to the bulk substrate concentration in the reactor shell-side. This is generally not the case but it shall be held for purposes of model simplification.
Based on the preceding assumptions, the material balances for the substrate and product can be derived from the following general mass balance equation for plug-flow: 343� # 56789 $ :8�9 $ �� � 0 (14) In equation (14) the del or gradient operator (8) represents the spatial derivative operator which is typically applied to a defined multi-dimension field to describe the derivative of a vector in its spatial coordinates. For this system, the del operator describes the substrate
and/or the product vectors in a cylindrical coordinate system (<. >. 8c � @A@B). Simplifying the general mass balance for the substrates (glucose [S1] and xylose [S2]) and the ethanol (P) and applying it to the macroporous support layer with immobilized cells, the following mass balance equations were derived for an unsteady-state PFR:
Glucose: ���� � : C3 �3& # �
&3�3& D $ E+FGHIJKL ∗ 3�3& $ ��� [g.L-1.h-1] (15)
Xylose: �� �� � : C3 �3& # �
&3�3& D $ E+FGHIJKL ∗ 3� 3& $ ��� [g.L-1.h-1] (16)
Ethanol: ��+�� � : C3 �3& # �&3�3& D $ E+FGHIJKL ∗ 3�+3& # �� [g.L-1.h-1] (17)
Biomass: ���� � /� $ M�0 ∗ * [g.L-1.h-1] (18)
The specific growth rate (µ), the rates of substrate consumption (rs1, rs2), and the rate of product formation can be obtained from the kinetic expressions describes by equations (6) – (13). The kinetic parameters for the immobilized cells are assumed to be identical to those of the free-cells. The boundary conditions are applied at the inlet and exit of the macroporous layer as follows: NOOP<(<(Q�NR<.S�S5TT5..S�OURV<OURO<�WN9</� � �X #Y�0RS�<N9OUSRTS995� Substrate: /Z�&X�[�0 � /Z�X�0\]^_ [g.L-1.] (19)
Product: Z.�U#Y( � /Z.00Q5V` [g.L-1.] (20)
NOOP<(<(Q�NR<.S�S5TT5..S�O<*UOURO<�WN9</a � Y�0 Substrate: ZT�U � /ZTU0V5(<R [g.L-1.] (21)
Product: Z&� � /Z�0^]�bc [g.L-1.] (22)
One of the most important operational parameters for membrane bioreactors is the bacterial growth rate, since it is primarily causes a decline in the permeate flux and subsequently the overall membrane bioreactor productivity (Nagy et al 2006, Nagy & Kulcsar, 2008; Huler & Kargi, 2008; ). Moudeeb et al (1996) modelled lactic acid production in an immobilized cell membrane bioreactor with a lumen-to-shell flow configuration and suggested that by developing a correlation between the permeate flux rate and the biomass concentration, the
change in the bacteria concentration can be accurately estimated. Furthermore, these authors documented an empirical correlation that defines the permeate flux decline in a logarithmic function as a function of the biomass concentration. Adapting this empirical correlation to our proposed system, the rate of permeate flux decline as a function of the immobilized cell concentration can be approximated using the following correlation:
d� �d�,�ln/gh0 [m3.m-2.h-1] (23)
In equation (23), vp0 represents the initial flux (at time zero) and b is a fouling index which describes the significance of the biomass concentration on the flux decline. The reactor performance will be evaluated in terms of the instantaneous conversion of the sugar substrate at a specific and the instantaneous productivity any time during operation is defined as the product of the measured product concentration in the permeate stream. The quantification of these process evaluation parameters can be achieved through the following formulations:
a � /�+0iLHjLJkL,k�klkJmGnJHKlokLokpLmmqLrL,s (24)
�t �Z� ∗ E+ujLjvHJoL [g.L-1.min-1] (25)
The afore-mentioned mathematical model equations shall be solved using an ordinary differential equation software package such as MatlabTM. Modifications to the developed model shall be made upon the gathering of the experimental data.
3. Results and discussion 3.1. Free cell kinetics of Z. mobilis ZM4
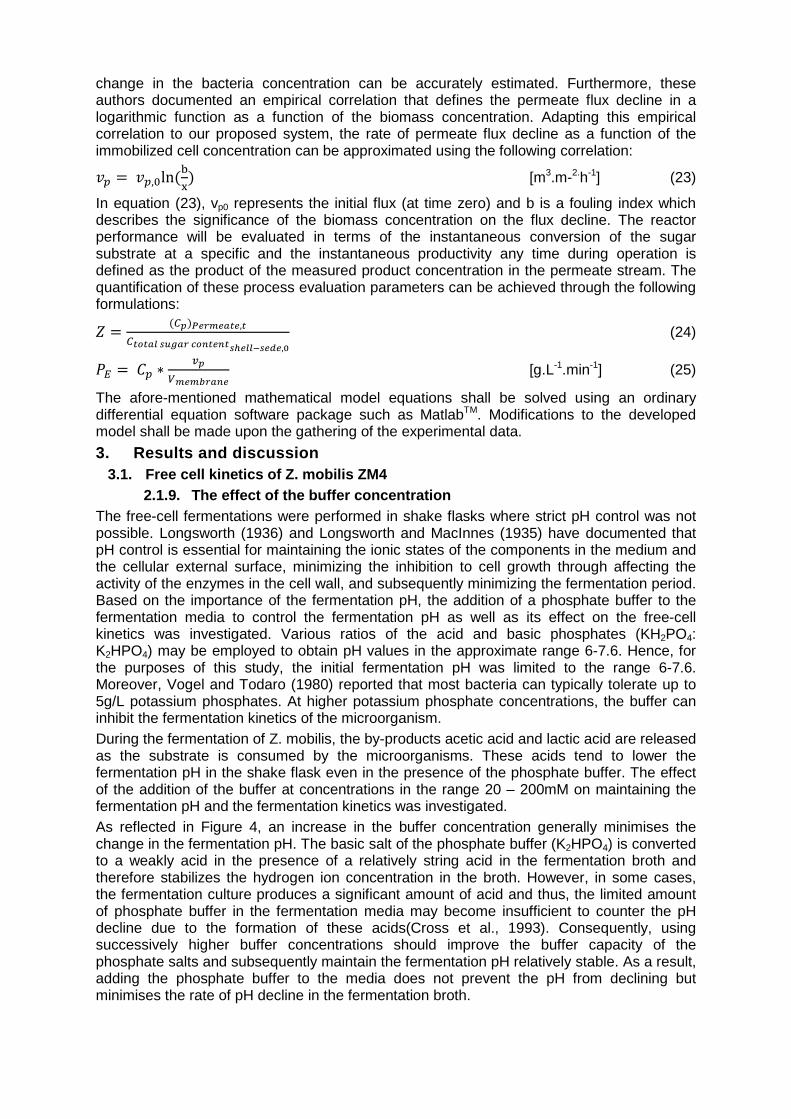
2.1.9. The effect of the buffer concentration The free-cell fermentations were performed in shake flasks where strict pH control was not possible. Longsworth (1936) and Longsworth and MacInnes (1935) have documented that pH control is essential for maintaining the ionic states of the components in the medium and the cellular external surface, minimizing the inhibition to cell growth through affecting the activity of the enzymes in the cell wall, and subsequently minimizing the fermentation period. Based on the importance of the fermentation pH, the addition of a phosphate buffer to the fermentation media to control the fermentation pH as well as its effect on the free-cell kinetics was investigated. Various ratios of the acid and basic phosphates (KH2PO4: K2HPO4) may be employed to obtain pH values in the approximate range 6-7.6. Hence, for the purposes of this study, the initial fermentation pH was limited to the range 6-7.6. Moreover, Vogel and Todaro (1980) reported that most bacteria can typically tolerate up to 5g/L potassium phosphates. At higher potassium phosphate concentrations, the buffer can inhibit the fermentation kinetics of the microorganism. During the fermentation of Z. mobilis, the by-products acetic acid and lactic acid are released as the substrate is consumed by the microorganisms. These acids tend to lower the fermentation pH in the shake flask even in the presence of the phosphate buffer. The effect of the addition of the buffer at concentrations in the range 20 – 200mM on maintaining the fermentation pH and the fermentation kinetics was investigated. As reflected in Figure 4, an increase in the buffer concentration generally minimises the change in the fermentation pH. The basic salt of the phosphate buffer (K2HPO4) is converted to a weakly acid in the presence of a relatively string acid in the fermentation broth and therefore stabilizes the hydrogen ion concentration in the broth. However, in some cases, the fermentation culture produces a significant amount of acid and thus, the limited amount of phosphate buffer in the fermentation media may become insufficient to counter the pH decline due to the formation of these acids(Cross et al., 1993). Consequently, using successively higher buffer concentrations should improve the buffer capacity of the phosphate salts and subsequently maintain the fermentation pH relatively stable. As a result, adding the phosphate buffer to the media does not prevent the pH from declining but minimises the rate of pH decline in the fermentation broth.
The influence of various buffer concentrations on the fermentation kinetics of Z. mobilis ZM4 was quantified in terms of the biomass yield (Yxs, based on the substrate consumed under anaerobic conditions), the product yield (Yps, based on the amount of ethanol produced relative to the amount of substrate consumed) and the volumetric productivity of ethanol. At buffer concentrations below 100mM, the biomass yield and the subsequent volumetric productivity increase as the buffer concentration increases. This can be attributed to the effect of the buffer on stabilising the pH close to the initial pH value. Lawford (1988) performed a series batch fermentation of glucose by Z. mobilis ZM4 and concluded that the maximum specific growth rate for this biocatalyst is pH dependent and occurs at pH 6-6.5. Hence, as expected, the final cell concentration was highest at experimental conditions where the pH deviation from this optimal growth rate range was minimized. Since, ethanol production from Z. mobilis is growth dependent, the faster the cells grow, the shorter period of time required to completely exhaust the substrate and consequently a higher volumetric productivity will be achieved. At buffer concentrations higher than 100mM, the buffer was found to inhibit the cell growth and the subsequent volumetric productivity. Samson et al (1954) reported that high concentrations of the acidic portion of the buffer inhibitory effect on the specific growth rate and the productivity of yeasts(Samson et al., 1954). This reported trend was also found for Z. mobilis ZM4 in this study as the biomass yield and the productivity were observed to decrease despite the stabilization of the fermentation pH. Hence, at these high buffer concentrations, the inhibitory attribute of the buffer becomes more significant than the maintenance of a constant pH. All fermentation experiments from this point forth were performed at a buffer concentration of 100mM.
Figure 5: The effect of the Phosphate buffer concentration o n the fermentation kinetics of Z. mobilis ZM4 at an initi al pH of 6, T = 35 ºC, 5% (m/v) Glucose
4
4.5
5
5.5
6
6.5
0 5 10 15 20 25 30
pH
Fermentation Time (h)
20 mM 50mM 100mM 200mM
Figure 4: The pH variation during the fermentation at vario us buffer concentrations at an initial pH of 6, T = 35 C, 5% (m/v) Glucose
0.000
0.005
0.010
0.015
0.020
0.025
0.030
0.035
0.040
0.0
0.2
0.4
0.6
0.8
1.0
1.2
1.4
1.6
1.8
0 50 100 150 200 250 Ce
ll Y
ield
, Y
xs
(g c
ell
s/g
su
bst
rate
co
nsu
me
d)
Vo
lum
etr
ic P
rod
uct
ivit
y;
Eth
an
ol Y
ield
, Y
ps
Buffer concentration (mM)Volumetric Productivity Yps Yxs
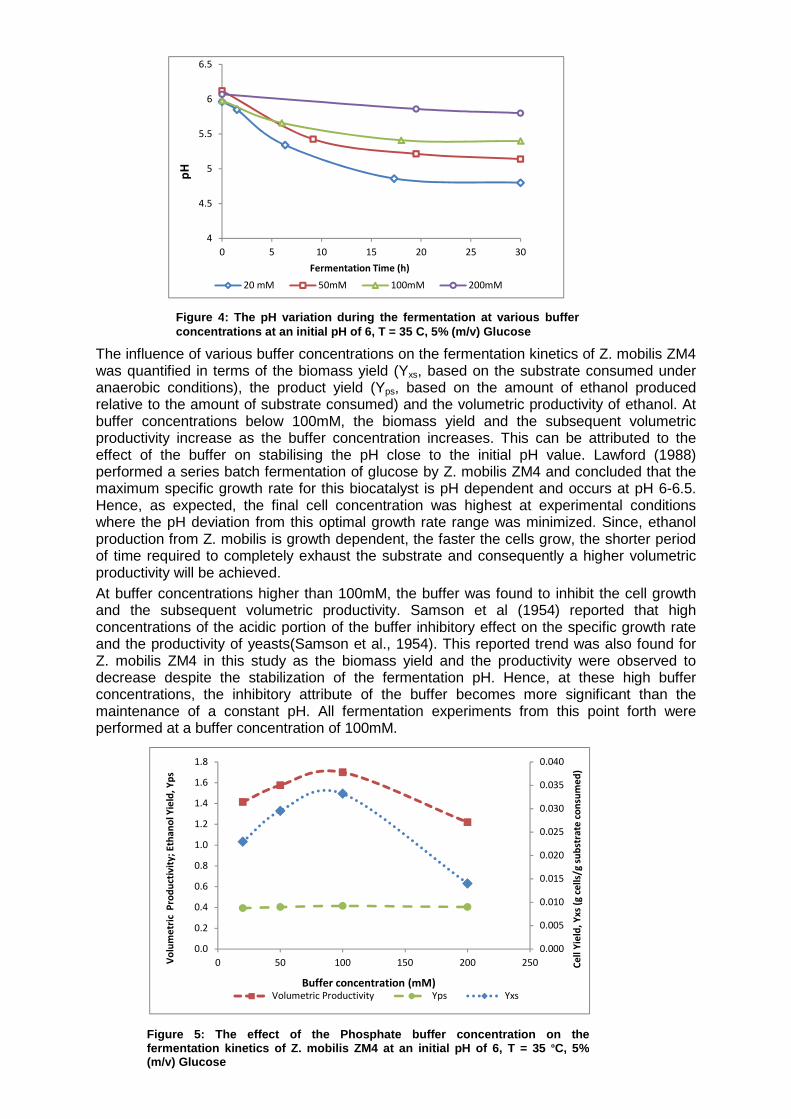
2.1.10. The effect of temperature and pH The individual effects of the fermentation temperature and pH have been well documented in literature for many different strains of Z. mobilis (King and Hossain, 1982; Lawford, 1988; Lee et al., 1981, 1980). The general agreement between these publications is that as the fermentation temperature is increased (above 30 ºC); the cell viability, biomass yield, ethanol yield, and the final ethanol concentration decrease since the ethanol production enzymes in the microorganism are inhibited by these higher fermentation temperatures. The experimental results for the variation of the fermentation temperature on the biomass growth, ethanol production and glucose consumption profiles are illustrated in Figures 6 and 7. A kinetic analysis of the effect of the fermentation temperature and pH on various process performance parameters is presented in Table 1. The results from this study concur with the literature findings as the biomass yield, ethanol yield and the maximal ethanol concentration all decrease with an increase in the fermentation temperature. As a result of the decline of these parameters with a temperature increase, the volumetric productivity of the shake-flask decreases. Moreover, it was found that the increase in the fermentation temperature favoured an increase in the concentration of the by-products. Experiments performed at a temperature of 40 ºC and pH0 of 7 resulted in the formation of 4.85 gL-1 glycerol and 1.09gL-
1 of the inhibitory acetic acid relative to 0.1 gL-1 acetic acid and 1.186gL-1 glycerol at 30 ºC and a pH0 of 7. Hence, this suggests that the reduction in the product yield with an increase in the fermentation temperature can be attributed to either the increase in the production of by-products and/or the increase in the cell maintenance coefficient at these inhibitory temperatures. Furthermore, since the experiments were performed in the carbon-limited regime where ethanol and substrate inhibition were negligible, the effect of the fermentation temperature on the degree of ethanol and substrate inhibition could not be quantified. Documentation of the effect of the fermentation pH has been reported for systems with strict pH control. This work reports on the effect of the fermentation pH within a confined pH range on the biomass yield, ethanol yield, the final ethanol concentration and the volumetric productivity. Figures 8 and 9 illustrate the effect of the fermentation pH on the biomass growth rate and the rates of ethanol production and substrate consumption. Based on the experimental data, it is apparent that cell growth is favoured at the observed pH range of 7 – 6.4. Lawford (1988) performed a series of batch fermentations at various controlled pH values and reported that the optimal pH range for cell growth is 6.5-6. The experimental fermentations performed at an initial pH of 7 concur with this reported optimal pH range since the highest specific growth rate was found in the exponential phase where the fermentation pH was approximately 6.8-6.4 (cell growth curve not shown). The effect of the initial pH can be seen more clearly by examining the rate of substrate consumption at various pH0 values. At higher pH (e.g. 7.65) values, both the rates of substrate consumption and the rate of ethanol production have an initial lag that is absent at the other two studied
Figure 6: The effect of the fermentation temperature on the substrate consumption rate at a buffer concentratio n of 100mM, initial pH of 6
0
5
10
15
20
25
30
0 10 20 30 40 50 60 70
Eth
an
ol C
on
cen
tra
tio
n (
g/L
)
Time (h)Ethanol at 30 C Ethanol 35 C Ethanol 40 C
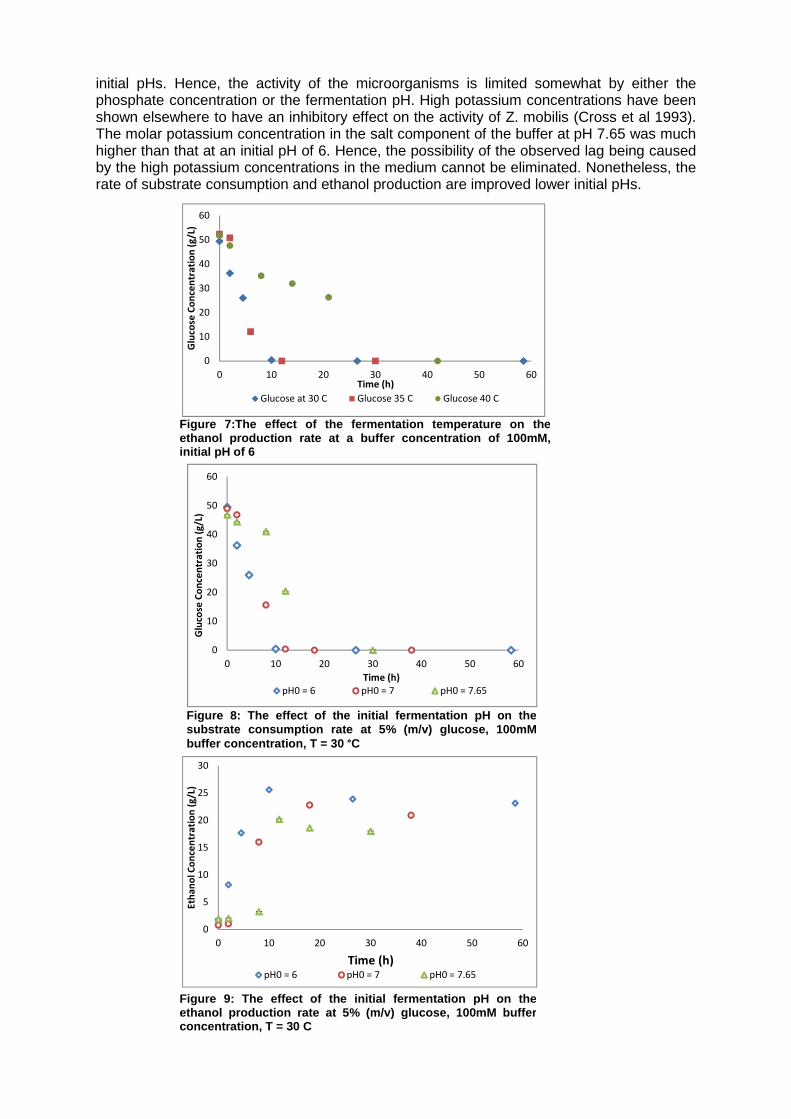
initial pHs. Hence, the activity of the microorganisms is limited somewhat by either the phosphate concentration or the fermentation pH. High potassium concentrations have been shown elsewhere to have an inhibitory effect on the activity of Z. mobilis (Cross et al 1993). The molar potassium concentration in the salt component of the buffer at pH 7.65 was much higher than that at an initial pH of 6. Hence, the possibility of the observed lag being caused by the high potassium concentrations in the medium cannot be eliminated. Nonetheless, the rate of substrate consumption and ethanol production are improved lower initial pHs.
0
10
20
30
40
50
60
0 10 20 30 40 50 60
Glu
cose
Co
nce
ntr
ati
on
(g
/L)
Time (h)
Glucose at 30 C Glucose 35 C Glucose 40 C
0
5
10
15
20
25
30
0 10 20 30 40 50 60
Eth
an
ol C
on
cen
tra
tio
n (
g/L
)
Time (h)pH0 = 6 pH0 = 7 pH0 = 7.65
0
10
20
30
40
50
60
0 10 20 30 40 50 60
Glu
cose
Co
nce
ntr
ati
on
(g
/L)
Time (h)
pH0 = 6 pH0 = 7 pH0 = 7.65
Figure 8: The effect of the initial fermentation pH on the substrate consumption rate at 5% (m/v) glucose, 100mM buffer concentration, T = 30 °C
Figure 9: The effect of the initial fermentation pH on the ethanol production rate at 5% (m/v) glucose, 100mM buffer concentration, T = 30 C
Figure 7:The effect of the fermentation temperature on the ethanol production rate at a buffer concentration o f 100mM, initial pH of 6

Table 1: The effect of temperature and the initial pH on the fermentation kinetic parameters. All experiments were performed at 5% (m/v) initial gluc ose concentration, 100mM buffer concentration.
Kinetic Parameters Experimental Conditions
T_30 ºC; pH0_6
T_35 ºC; pH0_6
T_30 ºC; pH0_7.65
T_35 ºC ;pH0_6
T_35 ºC; pH0_7
T_35 ºC; pH0_7.65
T_40 ºC; pH0_6
T_40 ºC; pH0_7
T_40 ºC; pH0_7.65
µmax (h-1) 0.324 0.378 0.336 0.402 0.500 0.264 0.180 0.172 0.200 Yx/s (g cells/g sugar) 0.0349 0.0388 0.0219 0.0332 0.0355 0.0195 0.0276 0.0334 0.0134 Yp/s (g EtOH/ g sugar) 0.4834 0.4494 0.3902 0.4168 0.3974 0.3743 0.4092 0.3682 0.3236 Max Ethanol Concentration 25.58 22.77 20.19 22.26 22.01 20.02 20.45 19.98 16.77
Sugar Conversion 100% 100% 100% 100% 100% 100% 100% 100% 100% Ethanol Productivity 2.655 1.812 1.014 2.135 2.080 1.079 1.459 1.426 0.399 pH range 6-5.2 6.9-6.34 7.64-6.41 6.-5.2 7.-6.44 7.6-6.3 6.1-5. 6.8-5.4 7.6-6.11
2.1.11. The optimization of the fermentation temper ature and pH
In the many studies on the fermentation kinetics of Z. mobilis documented in literature, the fermentation temperature and pH have been optimized individually and consequently no publications on the significance of the interaction between temperature and pH has been reported at the time of this research. It was hypothesized that the interaction between the fermentation temperature and the initial fermentation pH was significant towards the volumetric ethanol productivity. A 32 full factorial design was performed to quantify the significance of the on with the fermentation temperature and pH being the process variables and the biomass yield (Yxs), the product yield (Yps), and volumetric productivity of the microorganisms being the selected response factors. A non-linear regression model consisting of all combinations of temperature (30 ºC, 35 ºC, 40 ºC) and the initial fermentation pH0 (6, 7, 7.6) was generated for each of the investigated response variables using the statistical software package DesignExpertTM . The significance of the model parameters was highlighted by an ANOVA analysis by identifying all factors that are significant towards the biomass yield, product yield and the volumetric productivity in a 95% confidence interval (Meyers et al, 2009). In the development of the empirical model, the residuals were assumed to be homogeneous and originate from a normal distribution. The following base non-liner regression model was used to evaluate for the three response factors: "X � w� #wX�X # wx�x # wXx�X�x # wXX�X� #wxx�x� (26)
In equation (26), Yi denotes the response factor, Xi and Xj denote the process variables (temperature, pH0); β0, βi, βij, and βii represent the model intercept, the model coefficient for the process variable factor Xi, the model coefficient for the interaction of the process variables XiXj, and the model coefficient for product of the process variable Xi respectively. The ANOVA analysis (not shown) showed a model F-value of 13 and indicated that the developed model was statistically significant. Moreover, the statistically generated non-linear regression achieved a “goodness fit” quantified by a correlation coefficient of 0.94. Based on an ANOVA analysis performed on the experimental data, it was found that the both temperature and the initial pH had a significant effect on all three response variables, with the initial fermentation pH having a more significant effect than the fermentation temperature. Contrary to the initial hypotheses, it was statistically proven that the temperature-pH interaction did not have a significant effect on the volumetric ethanol productivity. A surface plot of the predicted ethanol volumetric productivity as a function of the fermentation temperature and pH was generated on DesignExpertTM. According to this statistical model, it was illustrated that the optimal temperature and pH range for maximizing the volumetric productivity was 30 ºC and 6-5.2 respectively.
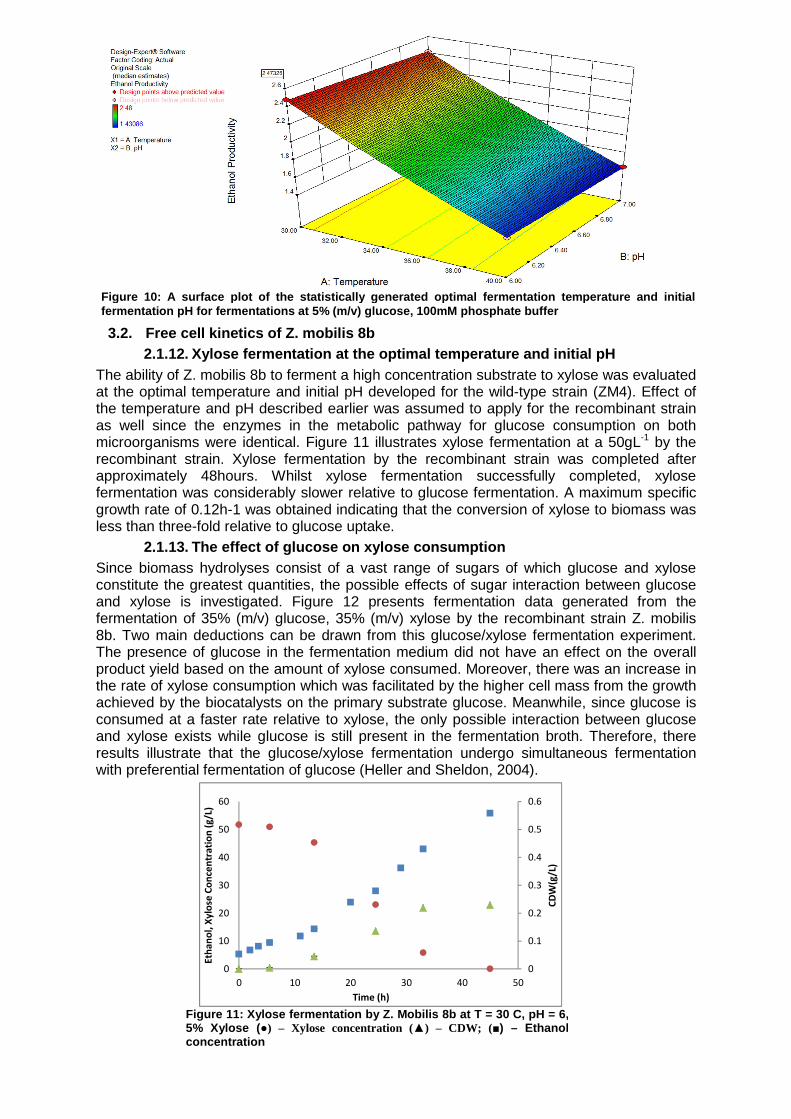
3.2. Free cell kinetics of Z. mobilis 8b 2.1.12. Xylose fermentation at the optimal temperat ure and initial pH
The ability of Z. mobilis 8b to ferment a high concentration substrate to xylose was evaluated at the optimal temperature and initial pH developed for the wild-type strain (ZM4). Effect of the temperature and pH described earlier was assumed to apply for the recombinant strain as well since the enzymes in the metabolic pathway for glucose consumption on both microorganisms were identical. Figure 11 illustrates xylose fermentation at a 50gL-1 by the recombinant strain. Xylose fermentation by the recombinant strain was completed after approximately 48hours. Whilst xylose fermentation successfully completed, xylose fermentation was considerably slower relative to glucose fermentation. A maximum specific growth rate of 0.12h-1 was obtained indicating that the conversion of xylose to biomass was less than three-fold relative to glucose uptake.
2.1.13. The effect of glucose on xylose consumption Since biomass hydrolyses consist of a vast range of sugars of which glucose and xylose constitute the greatest quantities, the possible effects of sugar interaction between glucose and xylose is investigated. Figure 12 presents fermentation data generated from the fermentation of 35% (m/v) glucose, 35% (m/v) xylose by the recombinant strain Z. mobilis 8b. Two main deductions can be drawn from this glucose/xylose fermentation experiment. The presence of glucose in the fermentation medium did not have an effect on the overall product yield based on the amount of xylose consumed. Moreover, there was an increase in the rate of xylose consumption which was facilitated by the higher cell mass from the growth achieved by the biocatalysts on the primary substrate glucose. Meanwhile, since glucose is consumed at a faster rate relative to xylose, the only possible interaction between glucose and xylose exists while glucose is still present in the fermentation broth. Therefore, there results illustrate that the glucose/xylose fermentation undergo simultaneous fermentation with preferential fermentation of glucose (Heller and Sheldon, 2004).
Figure 10: A surface plot of the statistically generated opt imal fermentation temperature and initial fermentation pH for fermentations at 5% (m/v) gluco se, 100mM phosphate buffer
0
0.1
0.2
0.3
0.4
0.5
0.6
0
10
20
30
40
50
60
0 10 20 30 40 50
CD
W(g
/L)
Eth
an
ol,
Xy
lose
Co
nce
ntr
ati
on
(g
/L)
Time (h)
Figure 11: Xylose fermentation by Z. Mobilis 8b at T = 30 C, pH = 6, 5% Xylose ( ●) – Xylose concentration (▲) – CDW; (■) – Ethanol concentration

Figure 12: The fermentation of a glucose/xylose mixture substrate at T = 30 °C,
pH0 = 6, 3.5% glucose, 3.5% xylose
3.3. Free cell kinetic model evaluation 2.1.14. Model evaluation for glucose fermentation w ith Z. mobilis ZM4
The developed kinetic model for the free-cell kinetics was evaluated at the optimal temperature and initial pH conditions. The kinetic parameters of the model were obtained from a non-linear regression fit to the experimental data and through the minimization of the residuals through a least squares analyses. The simulation of the model against the experiment data is presented by Figure 13. A correlation coefficient of the developed model was 0.96 which indicates an excellent fit of the model to the experimental data. A sensitivity analysis was performed by varying the model parameters by 5% and evaluating the correlation coefficient. Based on this analysis, it was found that cell and product yields had the most significant effects on the model performance. The kinetic parameters used are presented in Table 2. The successful development of this model will be extended to the development of the mathematical model for the membrane bioreactor. Therefore, the combination of the free-cell kinetic model and the mass and momentum balances in the bioreactor is a promising prospect for the development of a mathematical model for a membrane bioreactor.
0
0.5
1
1.5
2
2.5
0
5
10
15
20
25
30
35
40
0 5 10 15 20 25 30 35
CD
W (
g d
ry c
ell
we
igh
t/L)
Glu
cose
, E
tha
no
l C
on
cen
tra
tio
n (
g/L
)
Time (h)Ethanol Conc. (g/L) Glucose Xylose CDW (g dry cell weight/L)
0
0.5
1
1.5
2
2.5
0
10
20
30
40
50
60
0 10 20 30 40 50 60
CD
W(g
/L)
Glu
cose
, E
tha
no
l Co
nce
ntr
ati
on
s (g
/L)
Time (h)
Glucose Ethanol
Rogers-Type Model (Ethanol Conc) Glucose (Model)
Cell Concetration Model (Cell Conc)
Figure 13: The evaluation of the free -cell kinetic model for glucose substrate by the wil d-type strain Z. mobilis ZM4 at 100mM buffer concentr ation, pH 0 = 6 and T = 30 °C
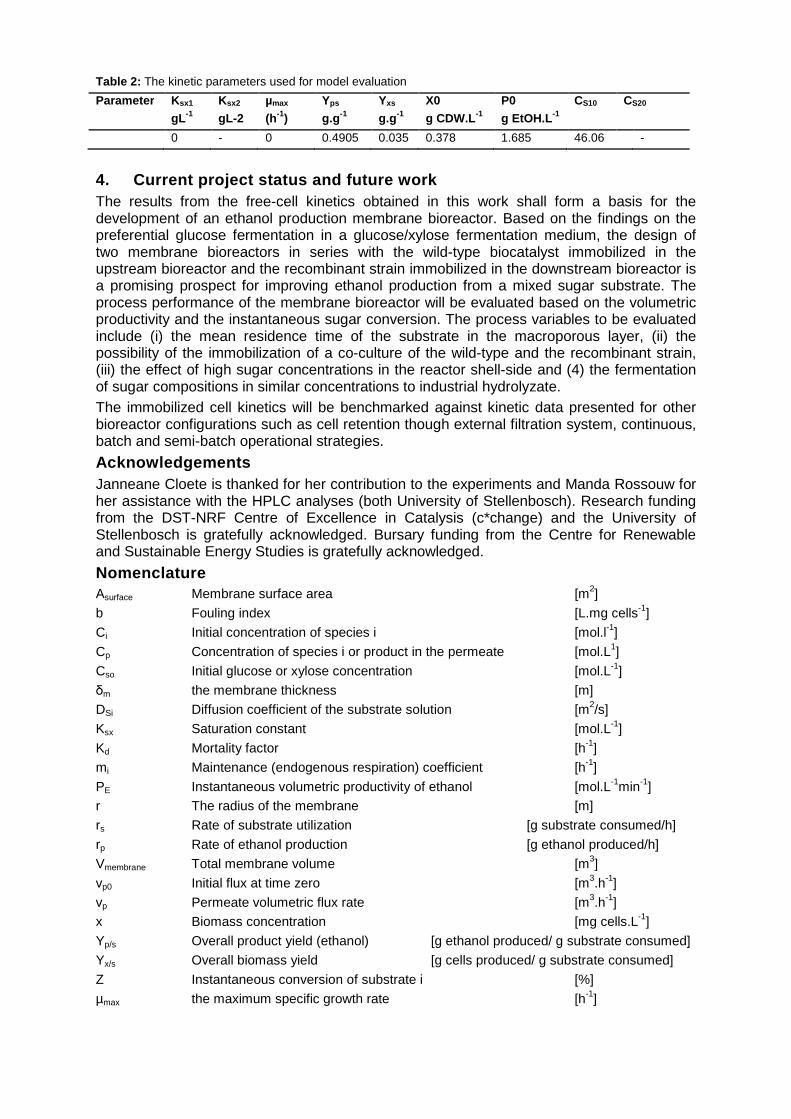
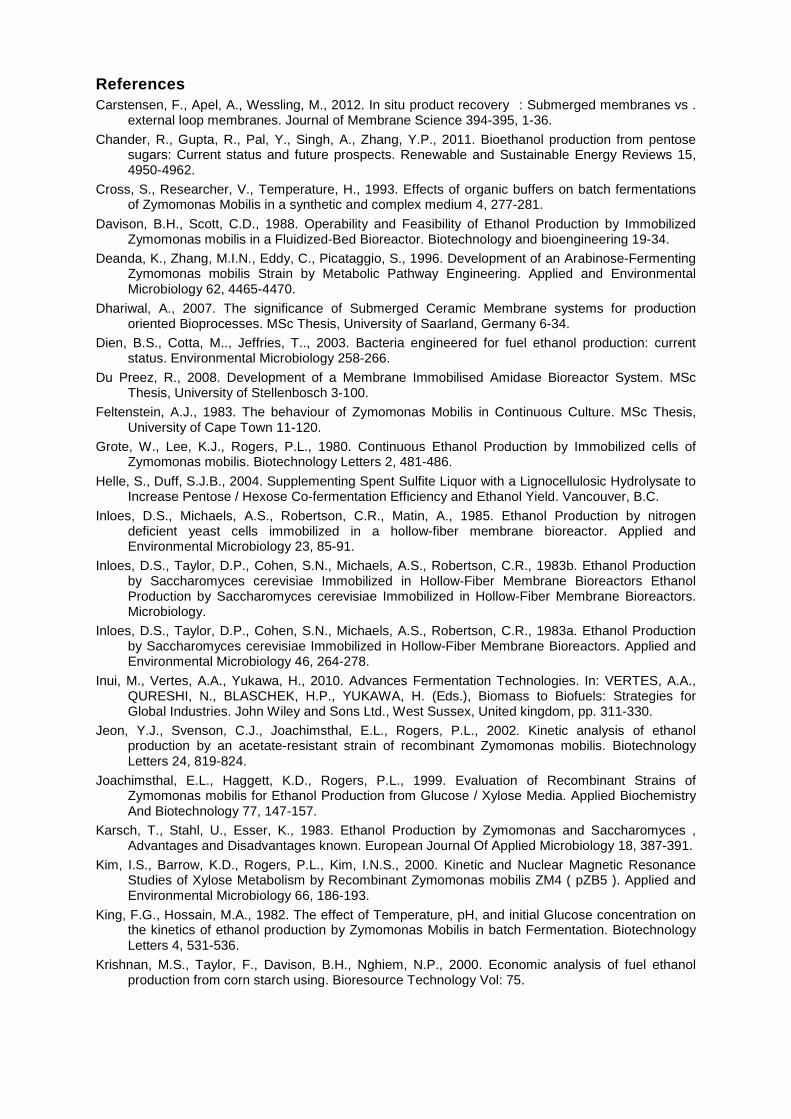
Table 2: The kinetic parameters used for model evaluation
Parameter Ksx1
gL -1
Ksx2
gL-2
µmax
(h-1)
Yps
g.g -1
Yxs
g.g -1
X0
g CDW.L -1
P0
g EtOH.L -1
CS10 CS20
0 - 0 0.4905 0.035 0.378 1.685 46.06 -
4. Current project status and future work The results from the free-cell kinetics obtained in this work shall form a basis for the development of an ethanol production membrane bioreactor. Based on the findings on the preferential glucose fermentation in a glucose/xylose fermentation medium, the design of two membrane bioreactors in series with the wild-type biocatalyst immobilized in the upstream bioreactor and the recombinant strain immobilized in the downstream bioreactor is a promising prospect for improving ethanol production from a mixed sugar substrate. The process performance of the membrane bioreactor will be evaluated based on the volumetric productivity and the instantaneous sugar conversion. The process variables to be evaluated include (i) the mean residence time of the substrate in the macroporous layer, (ii) the possibility of the immobilization of a co-culture of the wild-type and the recombinant strain, (iii) the effect of high sugar concentrations in the reactor shell-side and (4) the fermentation of sugar compositions in similar concentrations to industrial hydrolyzate. The immobilized cell kinetics will be benchmarked against kinetic data presented for other bioreactor configurations such as cell retention though external filtration system, continuous, batch and semi-batch operational strategies.
Acknowledgements Janneane Cloete is thanked for her contribution to the experiments and Manda Rossouw for her assistance with the HPLC analyses (both University of Stellenbosch). Research funding from the DST-NRF Centre of Excellence in Catalysis (c*change) and the University of Stellenbosch is gratefully acknowledged. Bursary funding from the Centre for Renewable and Sustainable Energy Studies is gratefully acknowledged.
Nomenclature Asurface Membrane surface area [m2]
b Fouling index [L.mg cells-1]
Ci Initial concentration of species i [mol.l-1]
Cp Concentration of species i or product in the permeate [mol.L1]
Cso Initial glucose or xylose concentration [mol.L-1]
δm the membrane thickness [m]
DSi Diffusion coefficient of the substrate solution [m2/s]
Ksx Saturation constant [mol.L-1]
Kd Mortality factor [h-1]
mi Maintenance (endogenous respiration) coefficient [h-1]
PE Instantaneous volumetric productivity of ethanol [mol.L-1min-1]
r The radius of the membrane [m]
rs Rate of substrate utilization [g substrate consumed/h]
rp Rate of ethanol production [g ethanol produced/h]
Vmembrane Total membrane volume [m3]
vp0 Initial flux at time zero [m3.h-1]
vp Permeate volumetric flux rate [m3.h-1]
x Biomass concentration [mg cells.L-1]
Yp/s Overall product yield (ethanol) [g ethanol produced/ g substrate consumed] Yx/s Overall biomass yield [g cells produced/ g substrate consumed]
Z Instantaneous conversion of substrate i [%]
µmax the maximum specific growth rate [h-1]
References Carstensen, F., Apel, A., Wessling, M., 2012. In situ product recovery�: Submerged membranes vs .
external loop membranes. Journal of Membrane Science 394-395, 1-36.
Chander, R., Gupta, R., Pal, Y., Singh, A., Zhang, Y.P., 2011. Bioethanol production from pentose sugars: Current status and future prospects. Renewable and Sustainable Energy Reviews 15, 4950-4962.
Cross, S., Researcher, V., Temperature, H., 1993. Effects of organic buffers on batch fermentations of Zymomonas Mobilis in a synthetic and complex medium 4, 277-281.
Davison, B.H., Scott, C.D., 1988. Operability and Feasibility of Ethanol Production by Immobilized Zymomonas mobilis in a Fluidized-Bed Bioreactor. Biotechnology and bioengineering 19-34.
Deanda, K., Zhang, M.I.N., Eddy, C., Picataggio, S., 1996. Development of an Arabinose-Fermenting Zymomonas mobilis Strain by Metabolic Pathway Engineering. Applied and Environmental Microbiology 62, 4465-4470.
Dhariwal, A., 2007. The significance of Submerged Ceramic Membrane systems for production oriented Bioprocesses. MSc Thesis, University of Saarland, Germany 6-34.
Dien, B.S., Cotta, M.., Jeffries, T.., 2003. Bacteria engineered for fuel ethanol production: current status. Environmental Microbiology 258-266.
Du Preez, R., 2008. Development of a Membrane Immobilised Amidase Bioreactor System. MSc Thesis, University of Stellenbosch 3-100.
Feltenstein, A.J., 1983. The behaviour of Zymomonas Mobilis in Continuous Culture. MSc Thesis, University of Cape Town 11-120.
Grote, W., Lee, K.J., Rogers, P.L., 1980. Continuous Ethanol Production by Immobilized cells of Zymomonas mobilis. Biotechnology Letters 2, 481-486.
Helle, S., Duff, S.J.B., 2004. Supplementing Spent Sulfite Liquor with a Lignocellulosic Hydrolysate to Increase Pentose / Hexose Co-fermentation Efficiency and Ethanol Yield. Vancouver, B.C.
Inloes, D.S., Michaels, A.S., Robertson, C.R., Matin, A., 1985. Ethanol Production by nitrogen deficient yeast cells immobilized in a hollow-fiber membrane bioreactor. Applied and Environmental Microbiology 23, 85-91.
Inloes, D.S., Taylor, D.P., Cohen, S.N., Michaels, A.S., Robertson, C.R., 1983b. Ethanol Production by Saccharomyces cerevisiae Immobilized in Hollow-Fiber Membrane Bioreactors Ethanol Production by Saccharomyces cerevisiae Immobilized in Hollow-Fiber Membrane Bioreactors. Microbiology.
Inloes, D.S., Taylor, D.P., Cohen, S.N., Michaels, A.S., Robertson, C.R., 1983a. Ethanol Production by Saccharomyces cerevisiae Immobilized in Hollow-Fiber Membrane Bioreactors. Applied and Environmental Microbiology 46, 264-278.
Inui, M., Vertes, A.A., Yukawa, H., 2010. Advances Fermentation Technologies. In: VERTES, A.A., QURESHI, N., BLASCHEK, H.P., YUKAWA, H. (Eds.), Biomass to Biofuels: Strategies for Global Industries. John Wiley and Sons Ltd., West Sussex, United kingdom, pp. 311-330.
Jeon, Y.J., Svenson, C.J., Joachimsthal, E.L., Rogers, P.L., 2002. Kinetic analysis of ethanol production by an acetate-resistant strain of recombinant Zymomonas mobilis. Biotechnology Letters 24, 819-824.
Joachimsthal, E.L., Haggett, K.D., Rogers, P.L., 1999. Evaluation of Recombinant Strains of Zymomonas mobilis for Ethanol Production from Glucose / Xylose Media. Applied Biochemistry And Biotechnology 77, 147-157.
Karsch, T., Stahl, U., Esser, K., 1983. Ethanol Production by Zymomonas and Saccharomyces , Advantages and Disadvantages known. European Journal Of Applied Microbiology 18, 387-391.
Kim, I.S., Barrow, K.D., Rogers, P.L., Kim, I.N.S., 2000. Kinetic and Nuclear Magnetic Resonance Studies of Xylose Metabolism by Recombinant Zymomonas mobilis ZM4 ( pZB5 ). Applied and Environmental Microbiology 66, 186-193.
King, F.G., Hossain, M.A., 1982. The effect of Temperature, pH, and initial Glucose concentration on the kinetics of ethanol production by Zymomonas Mobilis in batch Fermentation. Biotechnology Letters 4, 531-536.
Krishnan, M.S., Taylor, F., Davison, B.H., Nghiem, N.P., 2000. Economic analysis of fuel ethanol production from corn starch using. Bioresource Technology Vol: 75.

Lawford, H.., Rousseau, J.D., 2002. Performance Testing of Zymomonas mobilis Metabolically Engineered for Cofermentation of Glucose , Xylose , and Arabinose. Applied Biochemistry And Biotechnology 98, 429-448.
Lawford, H.G., 1988. A New Approach to Improving the Performance of Zymomonas in Continuous Ethanol Fermentations. Biotechnology and bioengineering Vol 33, 203-219.
Lee, K.J., Rogers, P.., Tribe, D.., 1979. Ethanol Production by Zymomonas Mobilis in Continuous Culture at High Glucose Concentrations. Biotechnology Letters 1, 421-426.
Lee, K.J., Skotnicki, M.., Tribe, D.., Rogers, P.L., 1980. Kinetic Studies on a highly productive strain of Zymomonas Mobilis. Biotechnology Letters 2, 339-344.
Lee, K.J., Tribe, D.., Rogers, P.., 1981. KINETICS OF ALCOHOL PRODUCTION BY ZYMOMONAS AT HIGH SUGAR CONCENTRATIONS. Biotechnology Letters 3, 165-170.
Leksawasdi, N., Joachimsthal, E.L., Rogers, P.L., 2001. Mathematical modelling of ethanol production from glucose / xylose mixtures by recombinant Zymomonas mobilis. Biotechnology Letters 23, 1087-1093.
Lin, M.-review Y., Tanaka, S., 2006. Ethanol fermentation from biomass resources�: current state and prospects. Applied Microbiology 627-642.
Liu, S., 2010. Conversion of Biomass to Ethanol by Other Organisms. In: Vertes, A., Quereshi, N., Blascheck, H.P., Yukawa, H. (Eds.), Biomass to Biofuels: Strategies for Global Industries. John Wiley and Sons Ltd., West Sussex, United kingdom, pp. 293-310.
Mohagheghi, A., Dowe, N., Schell, D., Chou, Y.-C., Eddy, C., Zhang, M., 2004. Performance of a newly developed integrant of Zymomonas mobilis for ethanol production on corn stover hydrolysate. Biotechnology letters 26, 321-5.
Mohagheghi, A., Evans, K., Chou, Y.-C., Zhang, M., 2002. Cofermentation of Glucose , Xylose , and Arabinose by Genomic DNA – Integrated Xylose / Arabinose Fermenting Strain of Zymomonas mobilis AX101. Applied Biochemistry And Biotechnology 98-100, 885-898.
Mohagheghi, A., Ruth, M., Schell, D.J., 2006. Conditioning Hemicellulose Hydrolysates for Fermentation: Effects of Overliming pH on Sugar and Ethanol Yields. Process Biochemistry 41, 1806-1811.
Nellaiah, H., Karunakaran, T., Gunasekaran, P., 1988. Ethanol fermentation by an efficient Strain, NRRL B-4286, of Zymomonas mobilis. Journal of fermentation Technology 66, 219-223.
Olsson, L., Hahn-Hagerdal, B., 1996. Fermentation of lignocellulosic hydrolysates for ethanol production. Applied Microbiology 18, 312-331.
Samson, F.E., Katz, A.M., Harris, D.L., 1954. Effects of Acetate and Other Short-Chain on Yeast MetabolismI , 2 Fatty Acids 406-423.
Shuler, M.L., Kargi, F., 2008. Operating Considerations for bioreactors for Suspension and Immobilized Cultures. In: Bioprocess Engineering: Basic Concepts. Prentice Hall, pp. 263-275.
Stanley, G., Hahn-H€agerdal, B., 2010. Fuel Ethanol Production From Lignocellulosic Raw Materials Using Recombinant Yeasts. In: Vertes, A., Qureshi, N., Blaschek, H., Yukawa, H. (Eds.), Biomass to Biofuels: Strategies for Global Industries. John Wiley and Sons Ltd., West Sussex, United kingdom, pp. 261-291.
Zhang, M., Eddy, C., Deanda, K., Finkelstein, M., Picataggio, S., 1995. Metabolic engineering of a pentose metabolism pathway in ethanologenic Zymomonas mobilis. Science 267, 240-243.
Znad, H., Blažej, M., Báleš, V., Markoš, J., 2004. A Kinetic Model for Gluconic Acid Production by Aspergillus niger: Chemical Papers Vol: 58, 23-28.