ethekwini transport authority - durban · warwick flyover - report4.doc ... 5 communications and...
TRANSCRIPT
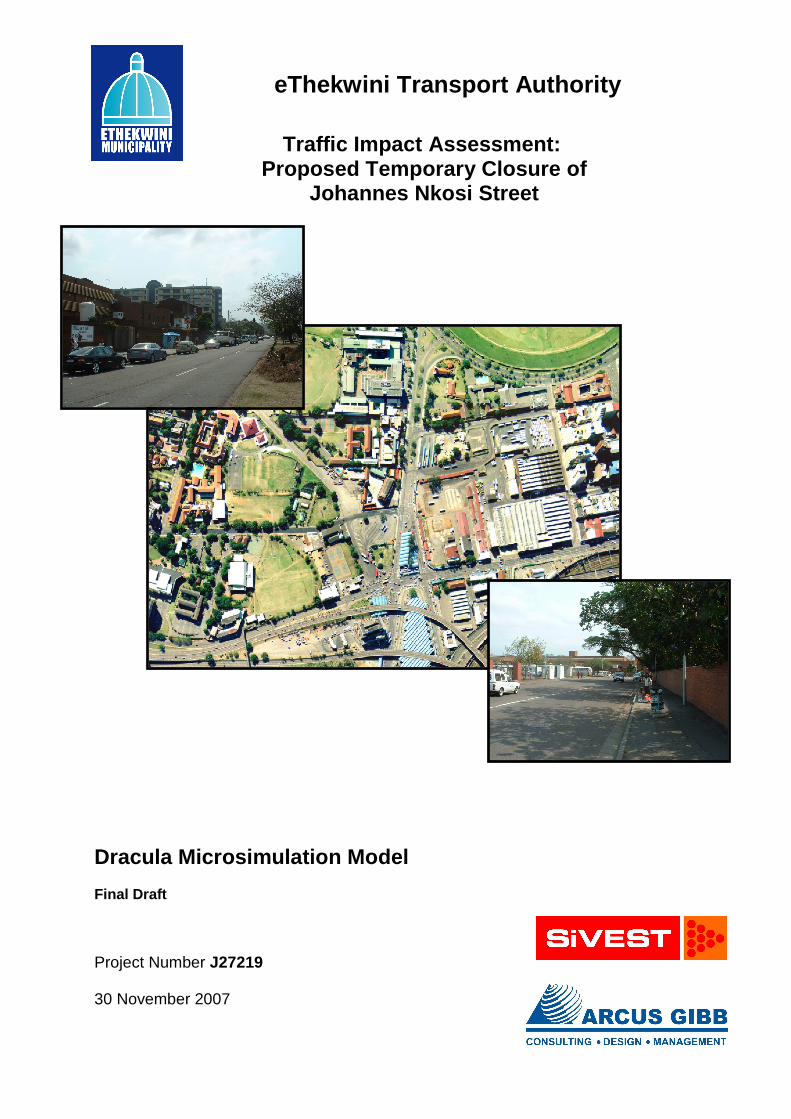
eThekwini Transport Authority
Traffic Impact Assessment: Proposed Temporary Closure of
Johannes Nkosi Street
Dracula Microsimulation Model Final Draft Project Number J27219 30 November 2007
Warwick Flyover - Report4.doc Issue 1.0 / Issue Date
TRAFFIC IMPACT ASSESSMENT
TEMPORARY ROAD CLOSURE OF JOHANNES NKOSI STREET
CONTENTS
Chapter Description Page
1 INTRODUCTION 1
2 IMPACT OF PROPOSED ROAD CLOSURES AND SCENARIOS 4
2.1 Volume of traffic affected by road closures 4
2.2 Reduction in through traffic demand and traffic scenarios 4
2.3 Proposed road detour 5
2.4 Public Transport and Parking Considerations 5 2.4.1 Public Transport 5 2.4.2 Parking 6 2.4.3 Access Along Johannes Nkosi Street 6
2.5 Pedestrians 6
2.6 Network and Traffic Scenarios Tested 7
3 METHODOLOGY 8
3.1 Overview of Study Methodology 8
3.2 Data Collection 9
3.3 Modelling Software 9
3.4 Development of SATURN Model 12 3.4.1 Network Coding 12 3.4.2 Trip Matrix Derivation 12 3.4.3 SATURN Assignment / Simulation 22 3.4.4 SATURN Model Calibration / Validation 22
(i) Network checks 22 (ii) Traffic Flow Validation 22
3.5 Development of DRACULA Model 23 3.5.1 Base Network Models 23
4 RESULTS 25
4.1 Overall Network Performance Measures 25
4.2 Queues at Critical Intersections 27
4.3 Corridor Travel Time and Travel Speeds 31
Warwick Flyover - Report4.doc Issue 1.0 / Issue Date
4.4 Simulation Videos 32
5 COMMUNICATIONS AND TRAFFIC MONITORING STRATEGY 33
5.1 Communications Strategy 33
5.2 Traffic Monitoring Strategy 33
6 CONCLUSIONS AND RECOMMENDATIONS 34
6.1 Conclusions 34
6.2 Recommendations 34 ANNEXURE 1 VALIDATION OF NETWORK CODING
ANNEXURE 2 VALIDATION OF TRAFFIC FLOWS
ANNEXURE 3 CD CONTAINING SIMULATION VIDEOS
ANNEXURE 4 DOCUMENT CONTROL SHEET
Warwick Flyover - Report4.doc 1 Issue 1.0 / 2007/12/04
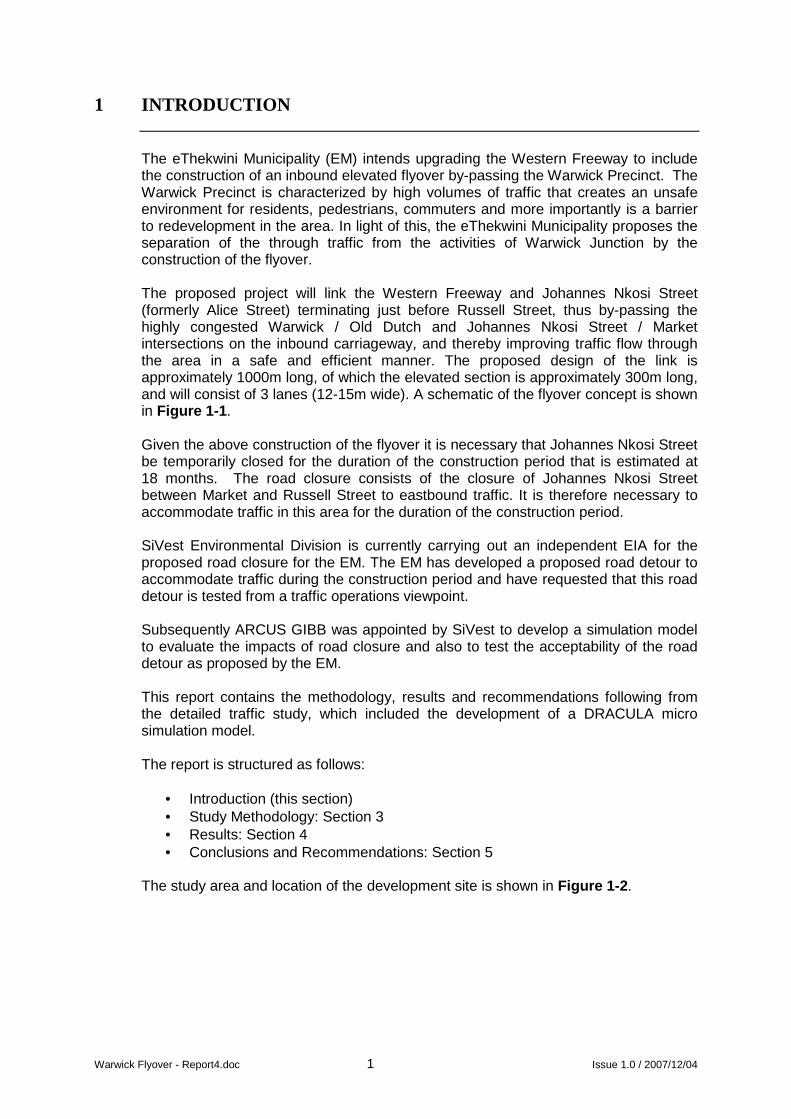
1 INTRODUCTION
The eThekwini Municipality (EM) intends upgrading the Western Freeway to include the construction of an inbound elevated flyover by-passing the Warwick Precinct. The Warwick Precinct is characterized by high volumes of traffic that creates an unsafe environment for residents, pedestrians, commuters and more importantly is a barrier to redevelopment in the area. In light of this, the eThekwini Municipality proposes the separation of the through traffic from the activities of Warwick Junction by the construction of the flyover. The proposed project will link the Western Freeway and Johannes Nkosi Street (formerly Alice Street) terminating just before Russell Street, thus by-passing the highly congested Warwick / Old Dutch and Johannes Nkosi Street / Market intersections on the inbound carriageway, and thereby improving traffic flow through the area in a safe and efficient manner. The proposed design of the link is approximately 1000m long, of which the elevated section is approximately 300m long, and will consist of 3 lanes (12-15m wide). A schematic of the flyover concept is shown in Figure 1-1 . Given the above construction of the flyover it is necessary that Johannes Nkosi Street be temporarily closed for the duration of the construction period that is estimated at 18 months. The road closure consists of the closure of Johannes Nkosi Street between Market and Russell Street to eastbound traffic. It is therefore necessary to accommodate traffic in this area for the duration of the construction period. SiVest Environmental Division is currently carrying out an independent EIA for the proposed road closure for the EM. The EM has developed a proposed road detour to accommodate traffic during the construction period and have requested that this road detour is tested from a traffic operations viewpoint. Subsequently ARCUS GIBB was appointed by SiVest to develop a simulation model to evaluate the impacts of road closure and also to test the acceptability of the road detour as proposed by the EM. This report contains the methodology, results and recommendations following from the detailed traffic study, which included the development of a DRACULA micro simulation model. The report is structured as follows:
• Introduction (this section) • Study Methodology: Section 3 • Results: Section 4 • Conclusions and Recommendations: Section 5
The study area and location of the development site is shown in Figure 1-2 .

Warwick Flyover - Report4.doc 2 Issue 1.0 / 2007/12/04
Figure 1-1 Flyover

Warwick Flyover - Report4.doc 3 Issue 1.0 / 2007/12/04
Figure 1-2 Study Area
Warwick Flyover - Report4.doc 4 Issue 1.0 / 2007/12/04
2 IMPACT OF PROPOSED ROAD CLOSURES AND SCENARIOS
2.1 Volume of traffic affected by road closures
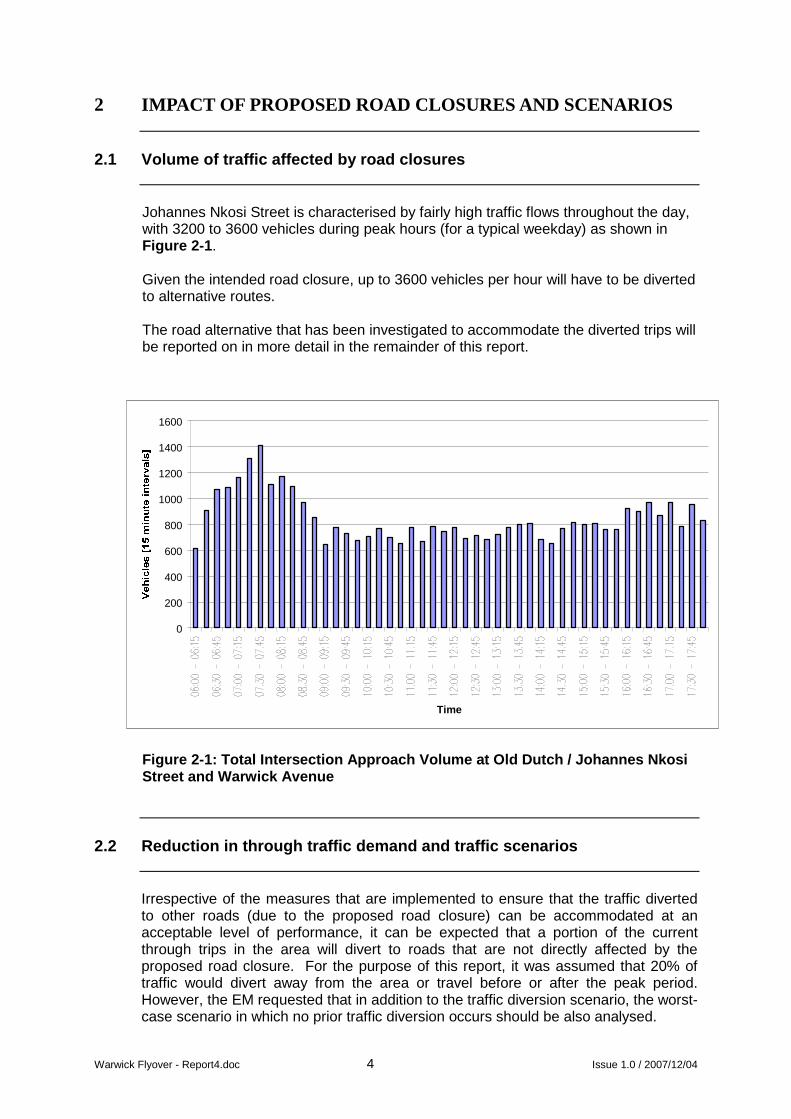
Johannes Nkosi Street is characterised by fairly high traffic flows throughout the day, with 3200 to 3600 vehicles during peak hours (for a typical weekday) as shown in Figure 2-1 . Given the intended road closure, up to 3600 vehicles per hour will have to be diverted to alternative routes. The road alternative that has been investigated to accommodate the diverted trips will be reported on in more detail in the remainder of this report.
Figure 2-1: Total Intersection Approach Volume at O ld Dutch / Johannes Nkosi Street and Warwick Avenue
2.2 Reduction in through traffic demand and traffic scenarios
Irrespective of the measures that are implemented to ensure that the traffic diverted to other roads (due to the proposed road closure) can be accommodated at an acceptable level of performance, it can be expected that a portion of the current through trips in the area will divert to roads that are not directly affected by the proposed road closure. For the purpose of this report, it was assumed that 20% of traffic would divert away from the area or travel before or after the peak period. However, the EM requested that in addition to the traffic diversion scenario, the worst-case scenario in which no prior traffic diversion occurs should be also analysed.
0
200
400
600
800
1000
1200
1400
1600
Time
Warwick Flyover - Report4.doc 5 Issue 1.0 / 2007/12/04
Two traffic scenarios are considered in this report: • Scenario 1 – worst case scenario i.e. all existing traffic route via the proposed
road detour • Scenario 2 – 20% diversion of traffic for the road closure scenario The 20% diversion of traffic includes a reduction in traffic at key entry points into the study area that include: • Old Dutch Road eastbound traffic at the intersection with Warwick Avenue • Warwick Avenue northbound traffic at the intersection with Johannes Nkosi
Street • Centenary Road southbound traffic at the intersection with Carlise Street • Mansfield Road eastbound traffic at the intersection with Centenary Road.
2.3 Proposed road detour
The EM have proposed the following road detour for accommodating traffic during the construction of the flyover: • Closure of Johannes Nkosi Street between Warwick Avenue and Russell
Street • Divert traffic along Centenary Road to Carlise Street, to Cross Street and to
Johannes Nkosi Street • Upgrade Centenary Street to accommodate one additional northbound lane • Upgrade Carlise Street to three eastbound lanes and one westbound lane • Convert Carlise Street to two lanes one-way eastbound betweem Cross Street
and Grey Street. • Convert Cross Street that is currently one-way northbound to two-way
between Carlise and Beatrice Streets and one-way southbound between Beatrice and Johannes Nkosi Streets.
The existing road network and proposed road detour road network lane configuration is shown in Figures 2-2 and 2-3 .
2.4 Public Transport and Parking Considerations
2.4.1 Public Transport
Existing public transport facilities and operations along Johannes Nkosi Street between Warwick Avenue and Russell Street will be affected by the road closure. Currently some 1000 public transport vehicles route via Johannes Nkosi Street in the morning and afternoon peaks with a 90/10 taxi/bus vehicle split. In addition, the existing public transport movement from Johannes Nksoi Street into Cross Street will also be affected by the road closure. Approximately 42 vehicles and
Warwick Flyover - Report4.doc 6 Issue 1.0 / 2007/12/04
18 vehicles execute this manoeuvre during the morning and afternoon peak hour periods respectively. Consequently, public transport routing would be affected by the road closure and the option of public transport vehicles using the road detour or other suitable routing needs to be discussed with public transport operators. A meeting was held on the 21 August 2007 between the eThekwini Municipality and Durban Transport regarding the impact of the road closure on the Durban Transport public transport operations. Based on the proposed road detour discussed at this meeting, it was accepted by the Durban Transport that the road detour would not adversely impact on their operations and the public transport routing. Discussions regarding the impact on privately owned public transport operators needs to be facilitated by the eThekwini Municipality or appointed specialist consultants by the eThekwini Municipality.
2.4.2 Parking The road detour would impact on on-street private vehicle parking and loading facilities that would be used for the accommodation of traffic. The number of affected parking bays is as follows: • 11 parking bays on Centenary Road • 40 parking and loading bays on Cross Street. It is anticipated that the above loss of parking bays may negatively impact on adjacent businesses and other social services. It is necessary that discussions be held with affected parties in order to accommodate the parking needs and that this is to be facilitated by the eThekwini Municipality or appointed specialist consultants by the eThekwini Municipality.
2.4.3 Access Along Johannes Nkosi Street The road closure would affect accesses to developments along Johannes Nkosi Street between Warwick Avenue and Russell Street. Discussion needs to be facilitated between the eThekwini Municipality and development owners regarding access to the developments. The option of implementing restricted access during the construction period should be considered.
2.5 Pedestrians
The Warwick Junction is a public transport intensive area and therefore also pedestrian intensive. Consequently the accommodation of pedestrians on the section of Johannes Nkosi Street that is proposed to be closed needs to be evaluated. The road closure would affect the pedestrian crossing on the eastern approach of the Johannes Nkosi / Market Road intersection. This pedestrian crossing is a part of a major desire line between the Berea Station / taxi and bus inter modal facility in the south and bus/taxi ranks in the north and also to tertiary and social institutions in the
Warwick Flyover - Report4.doc 7 Issue 1.0 / 2007/12/04
north. In this regard, the need for accommodating this movement must be considered. Options such as temporary grade separation structures or rerouting pedestrians to the adjacent crossings must be considered. It is important that the accommodation of pedestrians is also considered in conjunction with the Public Transport operators.
2.6 Network and Traffic Scenarios Tested
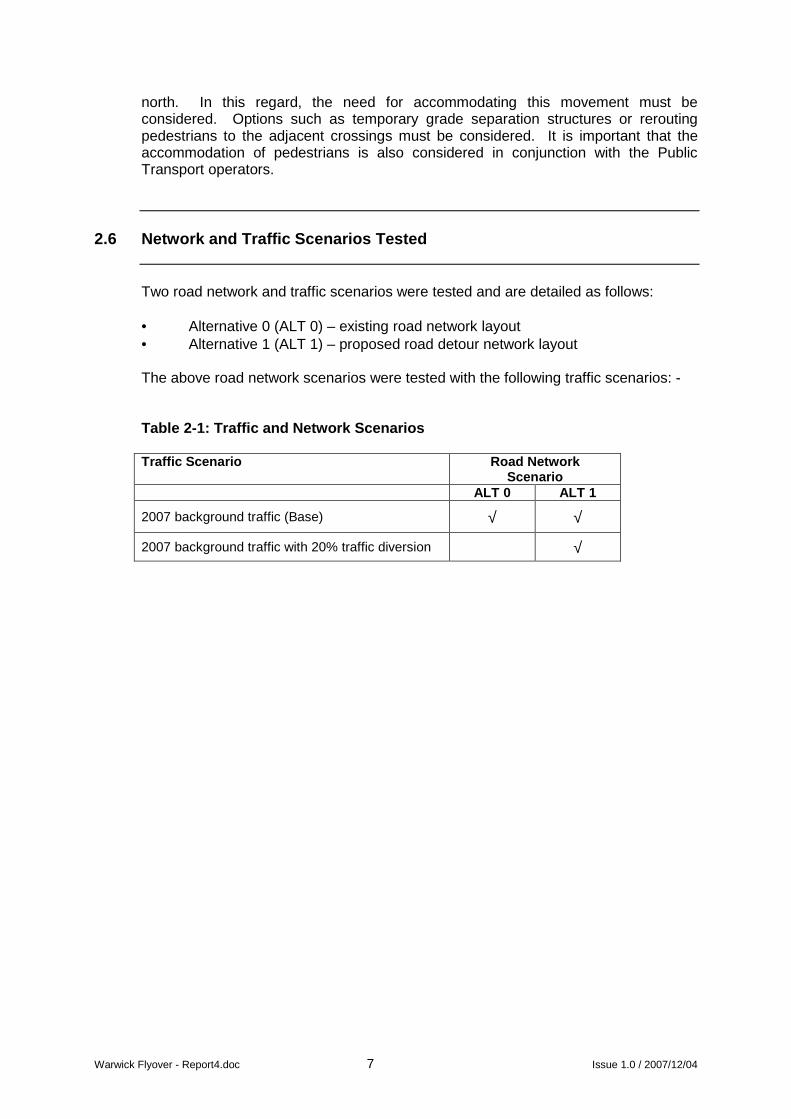
Two road network and traffic scenarios were tested and are detailed as follows: • Alternative 0 (ALT 0) – existing road network layout • Alternative 1 (ALT 1) – proposed road detour network layout The above road network scenarios were tested with the following traffic scenarios: - Table 2-1: Traffic and Network Scenarios Traffic Scenario Road Network
Scenario ALT 0 ALT 1
2007 background traffic (Base) √ √
2007 background traffic with 20% traffic diversion √
Warwick Flyover - Report4.doc 8 Issue 1.0 / 2007/12/04
3 METHODOLOGY
3.1 Overview of Study Methodology
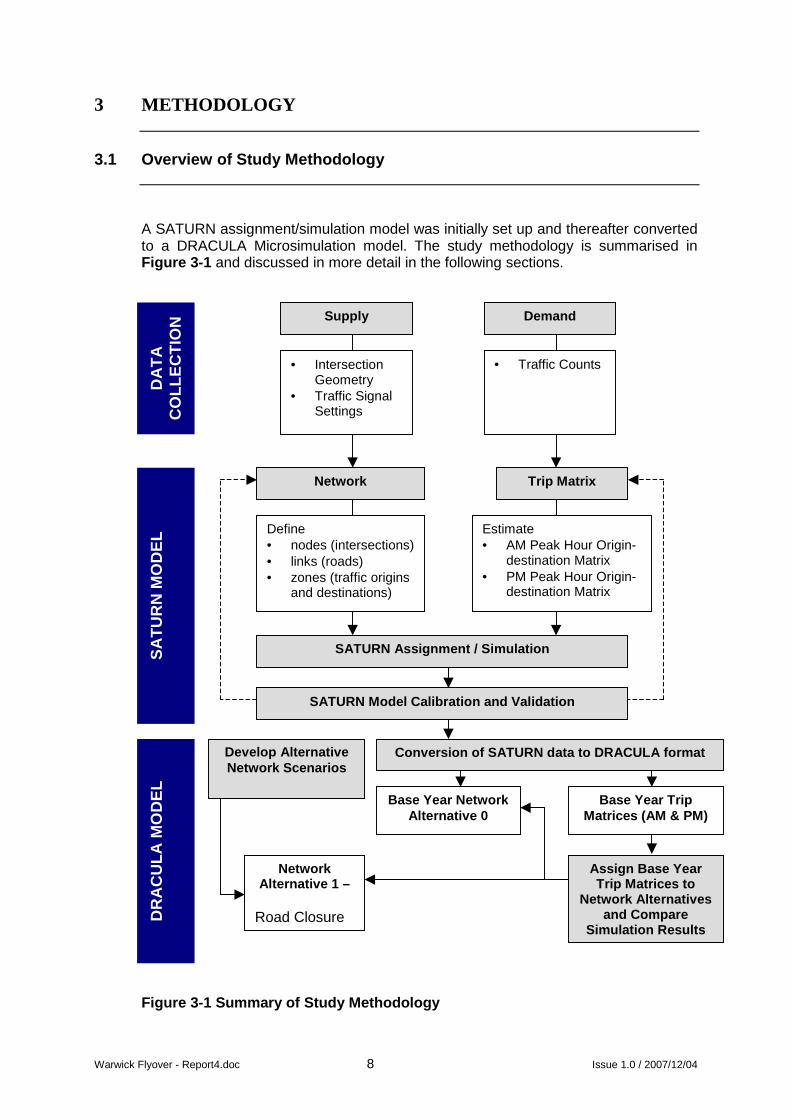
A SATURN assignment/simulation model was initially set up and thereafter converted to a DRACULA Microsimulation model. The study methodology is summarised in Figure 3-1 and discussed in more detail in the following sections. Figure 3-1 Summary of Study Methodology
Trip Matrix
DA
TA
C
OLL
EC
TIO
N
Supply
• Traffic Counts
Demand
• Intersection Geometry
• Traffic Signal Settings
SA
TU
RN
MO
DE
L
Network
Estimate • AM Peak Hour Origin-
destination Matrix • PM Peak Hour Origin-
destination Matrix
Define • nodes (intersections)• links (roads) • zones (traffic origins
and destinations)
SATURN Assignment / Simulation
SATURN Model Calibration and Validation
DR
AC
ULA
MO
DE
L
Conversion of SATURN data to DRACULA format
Base Year Network Alternative 0
Base Year Trip Matrices (AM & PM)
Network Alternative 1 –
Road Closure
Develop Alternative Network Scenarios
Assign Base Year Trip Matrices to
Network Alternatives and Compare
Simulation Results

Warwick Flyover - Report4.doc 9 Issue 1.0 / 2007/12/04
3.2 Data Collection
The data collected for this study were:
• Traffic counts at intersections in the study area for the AM and PM Peak hours. The morning and afternoon peak hour counts are indicated in Figure 3-2.
• Intersection geometry from site visits and aerial photographs. • Traffic signal timings, obtained from eThekwini Municipality.
12-Hour traffic counts (06:00 to 18:00) were carried out at key intersections in the study area on 14 August 2007. A common peak hour for the analysis was selected as follows:
• AM Peak – 07:17 to 08:15 • PM Peak – 16:00 to 17:00
The individual peak hours and total intersection approach volumes are shown in Table 3-1.
Table 3-1: Peak Hour Traffic Summary
Name of Junction Peak Time
AM Peak Volume AM (veh/h)
Peak Time PM
Peak Volume PM (veh/h)
Carlisle Street and Access to Bus Rank (East) 7:00 - 8:00 554 16:00 - 17:00 405 Centenary Road and Access to Bus Rank (West) 7:15 - 8:15 2044 16:00 - 17:00 1468 Centenary Road and Carlisle Street 7:15 - 8:15 2184 16:00 - 17:00 1478 Centenary Road and Mansfield Road 7:15 - 8:15 2777 15:45 - 16:45 1977 Cross Street and Carlisle Street 7:15 - 8:15 868 16:00 - 17:00 797 Intersection of Cross Str, Depot, Beatrice Str 7:45 - 8:45 769 16:00 - 17:00 832 Intersection of Johannes Nkosi Str, Cross Str 7:15 - 8:15 6128 16:15 - 17:15 4435 Intersection of Market Rd, Johannes Nkosi Street 7:15 - 8:15 4554 16:00 - 17:00 4128 Intersection Old Dutch Rd, Johannes Nkosi Str, Warwick Ave 7:15 - 8:15 5001 16:15 - 17:15 3714
Lorne Street and Cross Street 7:15 - 8:15 604 16:00 - 17:00 698
3.3 Modelling Software
The decision to use SATURN and its companion micro-simulation software DRACULA was approved by the eThekwini Transport Authority. SATURN (Simulation and Assignment of Traffic to Urban Road Networks) is a suite of flexible network
Warwick Flyover - Report4.doc 10 Issue 1.0 / 2007/12/04
analysis programs developed at the Institute for Transport Studies, University of Leeds since 1981. SATURN has over 300 users worldwide in some 30 countries over all six continents and has been tested and applied by Local Authority planners, consultants and universities for the evaluation of road schemes. It is also widely used for research projects, e.g. for the evaluation of road charging and route guidance systems. The dynamic network microsimulation model DRACULA (Dynamic Route Assignment Combining User Learning and microsimulation) has been developed at University of Leeds since 1993. As a combined simulation and assignment model - its original function - SATURN is most suitable for the analysis of road network changes such as the introduction of one-way streets, changes to junction controls, bus-only streets, etc. which can be loosely categorised as “traffic management measures” and whose evaluation requires a detailed analysis of traffic behaviour at junctions. These may then interface with smaller localised models using the greater precision of the junction simulation models or indeed using the DRACULA micro-simulation with routes generated by SATURN. SATURN is primarily a traffic assignment model. There are two general inputs:
• The network which specifies the physical structure of the roads upon which trips take place and
• The trip matrix , which specifies the number of, trips from each zone to each other zone in the study area during the time period modelled.
These may be thought of as the “supply” and “demand” inputs, the information of which is provided by the user. Both the matrix and network are input to a “route choice” model which allocates trips to “routes” through the network, as a result of which total flow along links in the network in the network may be summed and the output can then be analysed by the user or used as input into the DRACULA model for further analysis. DRACULA is a micro-simulation of the movement of vehicles through the network (pre-specified, using SATURN output). Drivers follow their pre-determined routes and en-route encounter signals, queues and interact with other vehicles on the road. Vehicles move in real-time and their space-time trajectories are determined by car-following and lane-changing models and network controls such as signals.

Warwick Flyover - Report4.doc 11 Issue 1.0 / 2007/12/04
Figure 3-2 AM and PM Peak Traffic Counts
Warwick Flyover - Report4.doc 12 Issue 1.0 / 2007/12/04
3.4 Development of SATURN Model
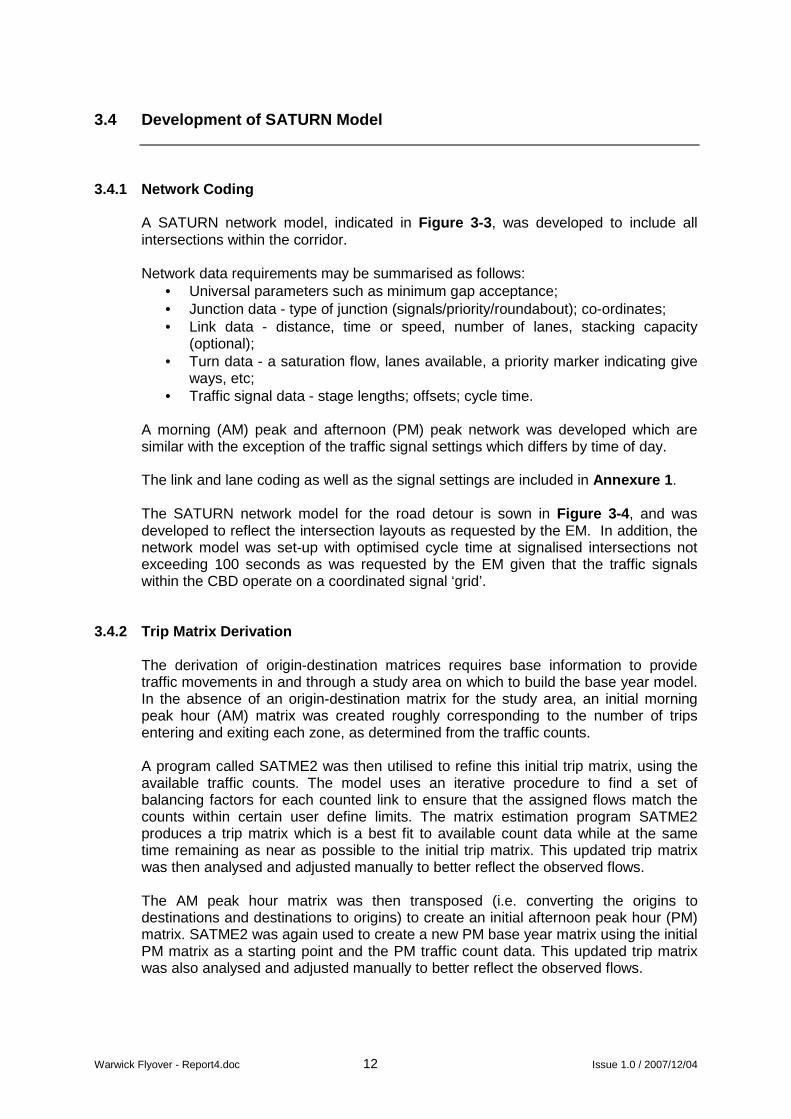
3.4.1 Network Coding A SATURN network model, indicated in Figure 3-3 , was developed to include all intersections within the corridor. Network data requirements may be summarised as follows:
• Universal parameters such as minimum gap acceptance; • Junction data - type of junction (signals/priority/roundabout); co-ordinates; • Link data - distance, time or speed, number of lanes, stacking capacity
(optional); • Turn data - a saturation flow, lanes available, a priority marker indicating give
ways, etc; • Traffic signal data - stage lengths; offsets; cycle time.
A morning (AM) peak and afternoon (PM) peak network was developed which are similar with the exception of the traffic signal settings which differs by time of day. The link and lane coding as well as the signal settings are included in Annexure 1 . The SATURN network model for the road detour is sown in Figure 3-4 , and was developed to reflect the intersection layouts as requested by the EM. In addition, the network model was set-up with optimised cycle time at signalised intersections not exceeding 100 seconds as was requested by the EM given that the traffic signals within the CBD operate on a coordinated signal ‘grid’.
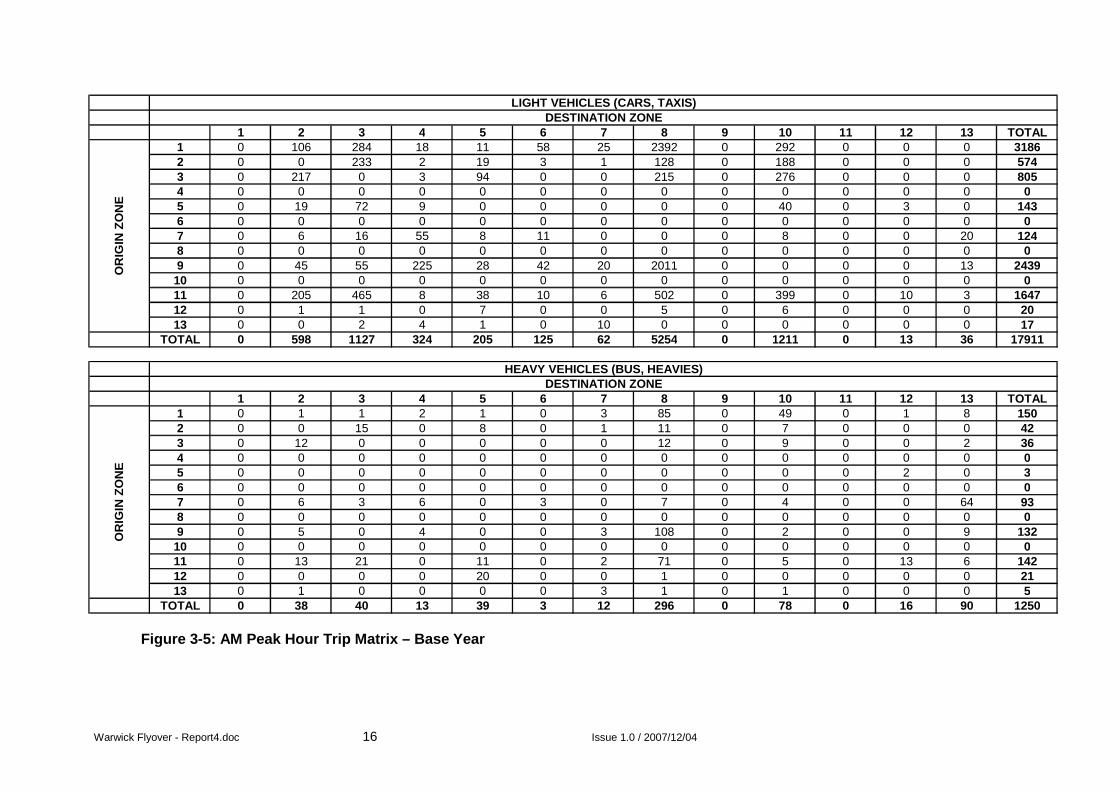
3.4.2 Trip Matrix Derivation The derivation of origin-destination matrices requires base information to provide traffic movements in and through a study area on which to build the base year model. In the absence of an origin-destination matrix for the study area, an initial morning peak hour (AM) matrix was created roughly corresponding to the number of trips entering and exiting each zone, as determined from the traffic counts. A program called SATME2 was then utilised to refine this initial trip matrix, using the available traffic counts. The model uses an iterative procedure to find a set of balancing factors for each counted link to ensure that the assigned flows match the counts within certain user define limits. The matrix estimation program SATME2 produces a trip matrix which is a best fit to available count data while at the same time remaining as near as possible to the initial trip matrix. This updated trip matrix was then analysed and adjusted manually to better reflect the observed flows. The AM peak hour matrix was then transposed (i.e. converting the origins to destinations and destinations to origins) to create an initial afternoon peak hour (PM) matrix. SATME2 was again used to create a new PM base year matrix using the initial PM matrix as a starting point and the PM traffic count data. This updated trip matrix was also analysed and adjusted manually to better reflect the observed flows.
Warwick Flyover - Report4.doc 13 Issue 1.0 / 2007/12/04
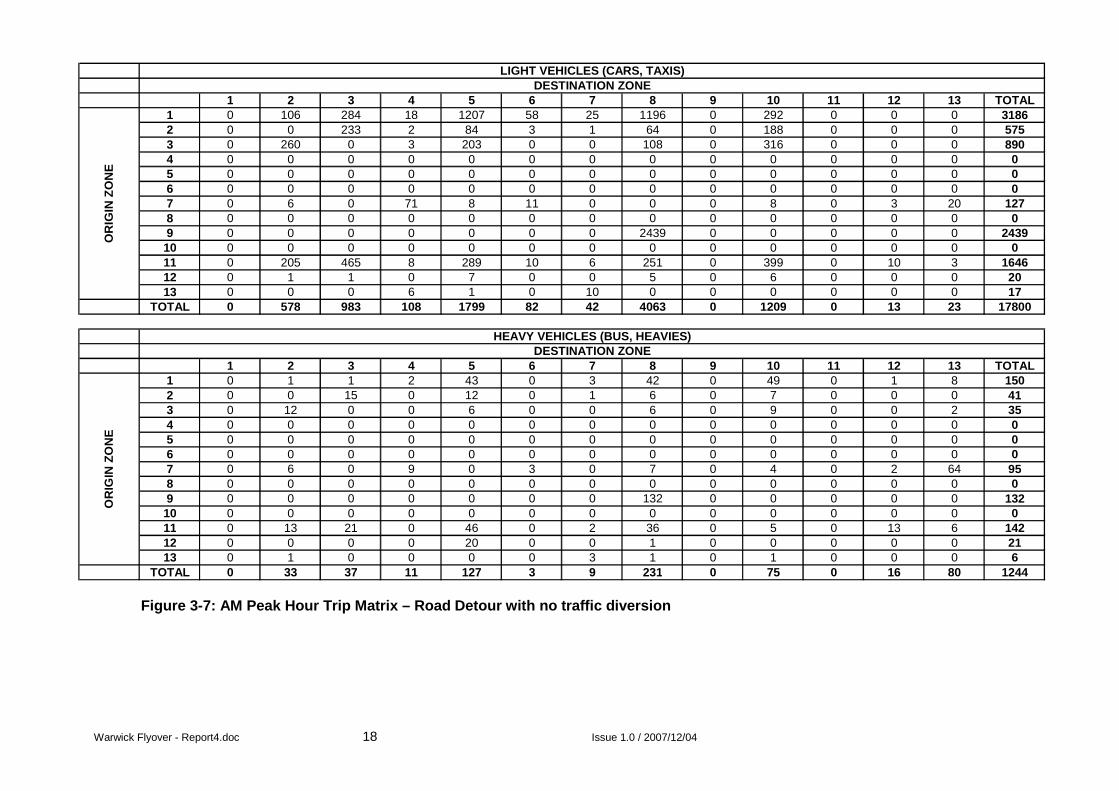
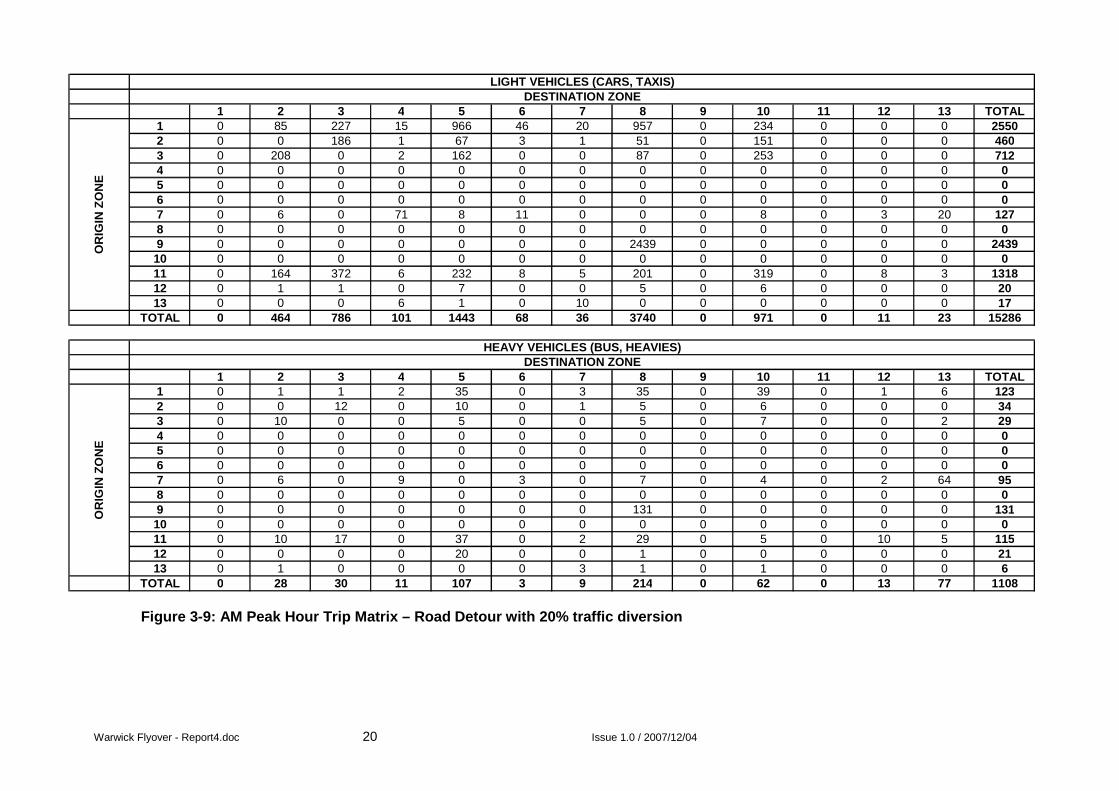
A two level matrix was developed for analysis encompassing two vehicle classes: • Vehicle class 1 – private vehicles and taxis – light vehicles • Vehicle class 2 – buses and heavy vehicles – heavy vehicle The base year AM and PM Trip Matrices are shown in Figures 3-5 and 3-6 Respectively. The road detour matrices were derived for the two scenarios: • The no traffic diversion scenario (refer to Figure 3-7 and 3-8) • The 20% traffic diversion scenario at key entry points (refer to Figure 3-9 and
3-10)

Warwick Flyover - Report4.doc 14 Issue 1.0 / 2007/12/04
Figure 3-3 SATURN Network

Warwick Flyover - Report4.doc 15 Issue 1.0 / 2007/12/04
Figure 3-4 SATURN Network – Road Detour
Warwick Flyover - Report4.doc 16 Issue 1.0 / 2007/12/04
Figure 3-5: AM Peak Hour Trip Matrix – Base Year
1 2 3 4 5 6 7 8 9 10 11 12 13 TOTAL1 0 106 284 18 11 58 25 2392 0 292 0 0 0 31862 0 0 233 2 19 3 1 128 0 188 0 0 0 5743 0 217 0 3 94 0 0 215 0 276 0 0 0 8054 0 0 0 0 0 0 0 0 0 0 0 0 0 05 0 19 72 9 0 0 0 0 0 40 0 3 0 1436 0 0 0 0 0 0 0 0 0 0 0 0 0 07 0 6 16 55 8 11 0 0 0 8 0 0 20 1248 0 0 0 0 0 0 0 0 0 0 0 0 0 09 0 45 55 225 28 42 20 2011 0 0 0 0 13 2439
10 0 0 0 0 0 0 0 0 0 0 0 0 0 011 0 205 465 8 38 10 6 502 0 399 0 10 3 164712 0 1 1 0 7 0 0 5 0 6 0 0 0 2013 0 0 2 4 1 0 10 0 0 0 0 0 0 17
TOTAL 0 598 1127 324 205 125 62 5254 0 1211 0 13 36 17911
1 2 3 4 5 6 7 8 9 10 11 12 13 TOTAL1 0 1 1 2 1 0 3 85 0 49 0 1 8 1502 0 0 15 0 8 0 1 11 0 7 0 0 0 423 0 12 0 0 0 0 0 12 0 9 0 0 2 364 0 0 0 0 0 0 0 0 0 0 0 0 0 05 0 0 0 0 0 0 0 0 0 0 0 2 0 36 0 0 0 0 0 0 0 0 0 0 0 0 0 07 0 6 3 6 0 3 0 7 0 4 0 0 64 938 0 0 0 0 0 0 0 0 0 0 0 0 0 09 0 5 0 4 0 0 3 108 0 2 0 0 9 132
10 0 0 0 0 0 0 0 0 0 0 0 0 0 011 0 13 21 0 11 0 2 71 0 5 0 13 6 14212 0 0 0 0 20 0 0 1 0 0 0 0 0 2113 0 1 0 0 0 0 3 1 0 1 0 0 0 5
TOTAL 0 38 40 13 39 3 12 296 0 78 0 16 90 1250
OR
IGIN
ZO
NE
LIGHT VEHICLES (CARS, TAXIS)DESTINATION ZONE
HEAVY VEHICLES (BUS, HEAVIES)DESTINATION ZONE
OR
IGIN
ZO
NE

Warwick Flyover - Report4.doc 17 Issue 1.0 / 2007/12/04
Figure 3-6: PM Peak Hour Trip Matrix – Base Year
1 2 3 4 5 6 7 8 9 10 11 12 13 TOTAL1 0 41 80 9 25 41 20 1430 0 283 0 1 1 19312 0 0 211 0 35 2 1 55 0 164 0 1 0 4693 0 126 0 0 36 3 2 101 0 304 0 0 0 5724 0 0 0 0 0 0 0 0 0 0 0 0 0 05 0 13 19 13 0 0 1 10 0 30 0 0 0 866 0 0 0 0 0 0 0 0 0 0 0 0 0 07 0 12 15 133 7 41 0 6 0 20 0 0 9 2438 0 0 0 0 0 0 0 0 0 0 0 0 0 09 0 7 13 117 6 36 18 1292 0 19 0 0 1 150910 0 0 0 0 0 0 0 0 0 0 0 0 0 011 0 144 287 90 27 31 14 879 0 198 0 0 1 167112 0 1 1 0 2 0 0 0 0 0 0 0 0 413 0 2 2 18 1 5 38 0 0 2 0 0 0 68
TOTAL 0 346 628 380 139 159 94 3773 0 1020 0 2 12 13106
1 2 3 4 5 6 7 8 9 10 11 12 13 TOTAL1 0 3 6 1 0 0 2 87 0 43 0 2 1 1452 0 0 26 0 10 0 0 6 0 8 0 6 0 563 0 7 0 0 0 0 0 3 0 8 0 0 0 184 0 0 0 0 0 0 0 0 0 0 0 0 0 05 0 0 0 0 0 0 0 0 0 2 0 0 0 26 0 0 0 0 0 0 0 0 0 0 0 0 0 07 0 1 0 1 0 1 0 16 0 23 0 3 6 518 0 0 0 0 0 0 0 0 0 0 0 0 0 09 0 0 0 0 0 0 1 41 0 0 0 0 0 4210 0 0 0 0 0 0 0 0 0 0 0 0 0 011 0 12 29 1 2 0 2 54 0 32 0 0 0 13212 0 0 0 0 19 0 0 5 0 6 0 0 0 3013 0 3 1 2 0 0 55 0 0 0 0 0 0 61
TOTAL 0 26 62 5 31 1 60 212 0 122 0 11 7 1074
OR
IGIN
ZO
NE
LIGHT VEHICLES (CARS, TAXIS)DESTINATION ZONE
HEAVY VEHICLES (BUS, HEAVIES)DESTINATION ZONE
OR
IGIN
ZO
NE
Warwick Flyover - Report4.doc 18 Issue 1.0 / 2007/12/04
Figure 3-7: AM Peak Hour Trip Matrix – Road Detour with no traffic diversion
1 2 3 4 5 6 7 8 9 10 11 12 13 TOTAL1 0 106 284 18 1207 58 25 1196 0 292 0 0 0 31862 0 0 233 2 84 3 1 64 0 188 0 0 0 5753 0 260 0 3 203 0 0 108 0 316 0 0 0 8904 0 0 0 0 0 0 0 0 0 0 0 0 0 05 0 0 0 0 0 0 0 0 0 0 0 0 0 06 0 0 0 0 0 0 0 0 0 0 0 0 0 07 0 6 0 71 8 11 0 0 0 8 0 3 20 1278 0 0 0 0 0 0 0 0 0 0 0 0 0 09 0 0 0 0 0 0 0 2439 0 0 0 0 0 243910 0 0 0 0 0 0 0 0 0 0 0 0 0 011 0 205 465 8 289 10 6 251 0 399 0 10 3 164612 0 1 1 0 7 0 0 5 0 6 0 0 0 2013 0 0 0 6 1 0 10 0 0 0 0 0 0 17
TOTAL 0 578 983 108 1799 82 42 4063 0 1209 0 13 23 17800
1 2 3 4 5 6 7 8 9 10 11 12 13 TOTAL1 0 1 1 2 43 0 3 42 0 49 0 1 8 1502 0 0 15 0 12 0 1 6 0 7 0 0 0 413 0 12 0 0 6 0 0 6 0 9 0 0 2 354 0 0 0 0 0 0 0 0 0 0 0 0 0 05 0 0 0 0 0 0 0 0 0 0 0 0 0 06 0 0 0 0 0 0 0 0 0 0 0 0 0 07 0 6 0 9 0 3 0 7 0 4 0 2 64 958 0 0 0 0 0 0 0 0 0 0 0 0 0 09 0 0 0 0 0 0 0 132 0 0 0 0 0 13210 0 0 0 0 0 0 0 0 0 0 0 0 0 011 0 13 21 0 46 0 2 36 0 5 0 13 6 14212 0 0 0 0 20 0 0 1 0 0 0 0 0 2113 0 1 0 0 0 0 3 1 0 1 0 0 0 6
TOTAL 0 33 37 11 127 3 9 231 0 75 0 16 80 1244
OR
IGIN
ZO
NE
LIGHT VEHICLES (CARS, TAXIS)DESTINATION ZONE
HEAVY VEHICLES (BUS, HEAVIES)DESTINATION ZONE
OR
IGIN
ZO
NE

Warwick Flyover - Report4.doc 19 Issue 1.0 / 2007/12/04
Figure 3-8: PM Peak Hour Trip Matrix – Road Detour with no traffic diversion
1 2 3 4 5 6 7 8 9 10 11 12 13 TOTAL1 0 41 80 9 740 41 20 715 0 283 0 1 1 19312 0 0 211 0 62 2 1 28 0 164 0 1 0 4693 0 139 0 0 87 3 2 50 0 334 0 0 0 6154 0 0 0 0 0 0 0 0 0 0 0 0 0 05 0 0 0 0 0 0 0 0 0 0 0 0 0 06 0 0 0 0 0 0 0 0 0 0 0 0 0 07 0 12 0 148 7 41 0 6 0 20 0 0 9 2438 0 0 0 0 0 0 0 0 0 0 0 0 0 09 0 0 0 0 0 0 0 1490 0 0 0 0 1 149110 0 0 0 0 0 0 0 0 0 0 0 0 0 011 0 144 287 91 467 31 14 439 0 198 0 0 1 167212 0 1 1 0 2 0 0 0 0 0 0 0 0 413 0 2 0 20 1 5 38 0 0 2 0 0 0 68
TOTAL 0 339 579 268 1366 123 75 2728 0 1001 0 2 12 12986
1 2 3 4 5 6 7 8 9 10 11 12 13 TOTAL1 0 3 6 1 44 0 2 43 0 43 0 2 1 1452 0 0 26 0 13 0 0 2 0 8 0 6 0 553 0 7 0 0 2 0 0 2 0 10 0 0 0 214 0 0 0 0 0 0 0 0 0 0 0 0 0 05 0 0 0 0 0 0 0 0 0 0 0 0 0 06 0 0 0 0 0 0 0 0 0 0 0 0 0 07 0 1 0 1 0 1 0 16 0 23 0 3 6 518 0 0 0 0 0 0 0 0 0 0 0 0 0 09 0 0 0 0 0 0 0 42 0 0 0 0 0 4210 0 0 0 0 0 0 0 0 0 0 0 0 0 011 0 12 29 1 29 0 2 27 0 32 0 0 0 13212 0 0 0 0 19 0 0 5 0 6 0 0 0 3013 0 3 1 2 0 0 55 0 0 0 0 0 0 61
TOTAL 0 26 62 5 107 1 59 137 0 122 0 11 7 1074
OR
IGIN
ZO
NE
LIGHT VEHICLES (CARS, TAXIS)DESTINATION ZONE
HEAVY VEHICLES (BUS, HEAVIES)DESTINATION ZONE
OR
IGIN
ZO
NE
Warwick Flyover - Report4.doc 20 Issue 1.0 / 2007/12/04
Figure 3-9: AM Peak Hour Trip Matrix – Road Detour with 20% traffic diversion
1 2 3 4 5 6 7 8 9 10 11 12 13 TOTAL1 0 85 227 15 966 46 20 957 0 234 0 0 0 25502 0 0 186 1 67 3 1 51 0 151 0 0 0 4603 0 208 0 2 162 0 0 87 0 253 0 0 0 7124 0 0 0 0 0 0 0 0 0 0 0 0 0 05 0 0 0 0 0 0 0 0 0 0 0 0 0 06 0 0 0 0 0 0 0 0 0 0 0 0 0 07 0 6 0 71 8 11 0 0 0 8 0 3 20 1278 0 0 0 0 0 0 0 0 0 0 0 0 0 09 0 0 0 0 0 0 0 2439 0 0 0 0 0 243910 0 0 0 0 0 0 0 0 0 0 0 0 0 011 0 164 372 6 232 8 5 201 0 319 0 8 3 131812 0 1 1 0 7 0 0 5 0 6 0 0 0 2013 0 0 0 6 1 0 10 0 0 0 0 0 0 17
TOTAL 0 464 786 101 1443 68 36 3740 0 971 0 11 23 15286
1 2 3 4 5 6 7 8 9 10 11 12 13 TOTAL1 0 1 1 2 35 0 3 35 0 39 0 1 6 1232 0 0 12 0 10 0 1 5 0 6 0 0 0 343 0 10 0 0 5 0 0 5 0 7 0 0 2 294 0 0 0 0 0 0 0 0 0 0 0 0 0 05 0 0 0 0 0 0 0 0 0 0 0 0 0 06 0 0 0 0 0 0 0 0 0 0 0 0 0 07 0 6 0 9 0 3 0 7 0 4 0 2 64 958 0 0 0 0 0 0 0 0 0 0 0 0 0 09 0 0 0 0 0 0 0 131 0 0 0 0 0 13110 0 0 0 0 0 0 0 0 0 0 0 0 0 011 0 10 17 0 37 0 2 29 0 5 0 10 5 11512 0 0 0 0 20 0 0 1 0 0 0 0 0 2113 0 1 0 0 0 0 3 1 0 1 0 0 0 6
TOTAL 0 28 30 11 107 3 9 214 0 62 0 13 77 1108
OR
IGIN
ZO
NE
LIGHT VEHICLES (CARS, TAXIS)DESTINATION ZONE
HEAVY VEHICLES (BUS, HEAVIES)DESTINATION ZONE
OR
IGIN
ZO
NE

Warwick Flyover - Report4.doc 21 Issue 1.0 / 2007/12/04
Figure 3-10: PM Peak Hour Trip Matrix – Road Detour with 20% traffic diversion
1 2 3 4 5 6 7 8 9 10 11 12 13 TOTAL1 0 32 64 7 592 33 16 572 0 226 0 1 1 15442 0 0 169 0 50 2 1 22 0 131 0 1 0 3763 0 111 0 0 70 3 2 40 0 267 0 0 0 4934 0 0 0 0 0 0 0 0 0 0 0 0 0 05 0 0 0 0 0 0 0 0 0 0 0 0 0 06 0 0 0 0 0 0 0 0 0 0 0 0 0 07 0 12 0 148 7 41 0 6 0 20 0 0 9 2438 0 0 0 0 0 0 0 0 0 0 0 0 0 09 0 0 0 0 0 0 0 1490 0 0 0 0 0 149010 0 0 0 0 0 0 0 0 0 0 0 0 0 011 0 115 230 72 374 25 11 351 0 158 0 0 1 133712 0 1 1 0 2 0 0 0 0 0 0 0 0 413 0 2 0 20 1 5 38 0 0 2 0 0 0 68
TOTAL 0 273 464 247 1096 109 68 2481 0 804 0 2 11 11110
1 2 3 4 5 6 7 8 9 10 11 12 13 TOTAL1 0 2 5 1 35 0 2 35 0 34 0 1 1 1162 0 0 21 0 11 0 0 2 0 7 0 5 0 463 0 6 0 0 1 0 0 1 0 9 0 0 0 174 0 0 0 0 0 0 0 0 0 0 0 0 0 05 0 0 0 0 0 0 0 0 0 0 0 0 0 06 0 0 0 0 0 0 0 0 0 0 0 0 0 07 0 1 0 1 0 1 0 16 0 23 0 3 6 518 0 0 0 0 0 0 0 0 0 0 0 0 0 09 0 0 0 0 0 0 0 42 0 0 0 0 0 4210 0 0 0 0 0 0 0 0 0 0 0 0 0 011 0 10 23 1 23 0 2 21 0 26 0 0 0 10612 0 0 0 0 19 0 0 5 0 6 0 0 0 3013 0 3 1 2 0 0 55 0 0 0 0 0 0 61
TOTAL 0 22 50 5 89 1 59 122 0 105 0 9 7 938
OR
IGIN
ZO
NE
LIGHT VEHICLES (CARS, TAXIS)DESTINATION ZONE
HEAVY VEHICLES (BUS, HEAVIES)DESTINATION ZONE
OR
IGIN
ZO
NE
Warwick Flyover - Report4.doc 22 Issue 1.0 / 2007/12/04
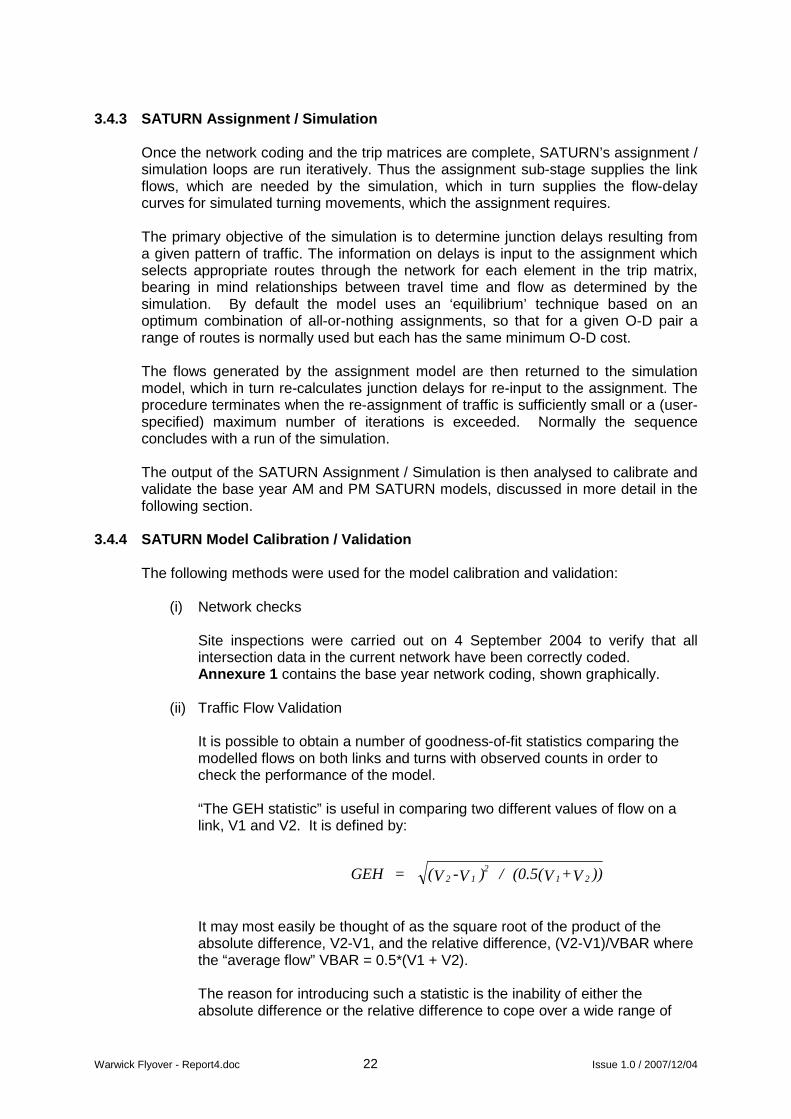
3.4.3 SATURN Assignment / Simulation
Once the network coding and the trip matrices are complete, SATURN’s assignment / simulation loops are run iteratively. Thus the assignment sub-stage supplies the link flows, which are needed by the simulation, which in turn supplies the flow-delay curves for simulated turning movements, which the assignment requires. The primary objective of the simulation is to determine junction delays resulting from a given pattern of traffic. The information on delays is input to the assignment which selects appropriate routes through the network for each element in the trip matrix, bearing in mind relationships between travel time and flow as determined by the simulation. By default the model uses an ‘equilibrium’ technique based on an optimum combination of all-or-nothing assignments, so that for a given O-D pair a range of routes is normally used but each has the same minimum O-D cost. The flows generated by the assignment model are then returned to the simulation model, which in turn re-calculates junction delays for re-input to the assignment. The procedure terminates when the re-assignment of traffic is sufficiently small or a (user-specified) maximum number of iterations is exceeded. Normally the sequence concludes with a run of the simulation. The output of the SATURN Assignment / Simulation is then analysed to calibrate and validate the base year AM and PM SATURN models, discussed in more detail in the following section.
3.4.4 SATURN Model Calibration / Validation The following methods were used for the model calibration and validation:
(i) Network checks Site inspections were carried out on 4 September 2004 to verify that all intersection data in the current network have been correctly coded. Annexure 1 contains the base year network coding, shown graphically.
(ii) Traffic Flow Validation
It is possible to obtain a number of goodness-of-fit statistics comparing the modelled flows on both links and turns with observed counts in order to check the performance of the model. “The GEH statistic” is useful in comparing two different values of flow on a link, V1 and V2. It is defined by: It may most easily be thought of as the square root of the product of the absolute difference, V2-V1, and the relative difference, (V2-V1)/VBAR where the “average flow” VBAR = 0.5*(V1 + V2). The reason for introducing such a statistic is the inability of either the absolute difference or the relative difference to cope over a wide range of
GEH = (V -V ) / (0.5(V +V ))2 12
1 2
Warwick Flyover - Report4.doc 23 Issue 1.0 / 2007/12/04
flows. For example an absolute difference of 100 pcu/h may be considered a big difference if the flows are of the order of 100 pcu/h, but would be totally unimportant for flows of the order of several thousand pcu/h. Equally a 10% error in 100 pcu/h would not be important, whereas a 10% error in, say, 3000 pcu/h might mean the difference between building an extra lane or not. Generally speaking the GEH parameter is less sensitive to such problems since a modeller would probably feel that an error of 20 in 100 would be roughly as bad as an error of 90 in 2,000, and both would have a GEH statistic of, roughly, 2. As a rule of thumb in comparing assigned volumes with observed volumes a GEH parameter of 5 or less would indicate an acceptable fit, while links with GEH parameters greater than 10 would probably require closer attention. The validation of the model was performed using the link and turn volumes determined from the intersection counts. The calibration standards adopted are as per the standard UK Department of Transport specifications and include that more than 85% of counts should satisfy the following criteria:
• Counts > 700 vph – modelled flows within 15%
• Counts < 700 vph – modelled flows within 100
• GEH statistic < 5
Annexure 2 contains plots of the observed flows versus the modelled flows and Tables showing absolute differences, percentage differences and the GEH statistic for turning counts. The R2 values of 0.9972 and 0.9951 for the AM and PM base year models respectively and the Average GEH statistic of 1.54 for both models indicates an excellent fit.
3.5 Development of DRACULA Model
3.5.1 Base Network Models Once the SATURN AM and PM peak hour models have been calibrated and validated, the network and trip matrices are converted to a format that can be input into DRACULA and the base year simulation runs are carried out. As a measure of network performance, the simulation outputs network, link and route specific measures such as:
• average travel time, • speed, • queue length, • fuel consumption and pollutant emission

Warwick Flyover - Report4.doc 24 Issue 1.0 / 2007/12/04
A graphical animation of the vehicles’ movements is also shown in parallel with the simulation, giving a direct view of the traffic condition on the network. In addition to the validation of modelled flows and travel times, as discussed in the previous section, this shows graphically whether the traffic behaves as observed in the field. As both the base year models behave as observed, it was concluded that the models reflected reality and the final base year AM and PM networks were copied and modified to reflect the proposed network changes. Video clips of the animation are included on CD attached in Annexure 3 .
Warwick Flyover - Report4.doc 25 Issue 1.0 / 2007/12/04
4 RESULTS
The model results are presented at three levels:
• Overall Network performance measures • Queues at critical intersections • Simulation videos
4.1 Overall Network Performance Measures
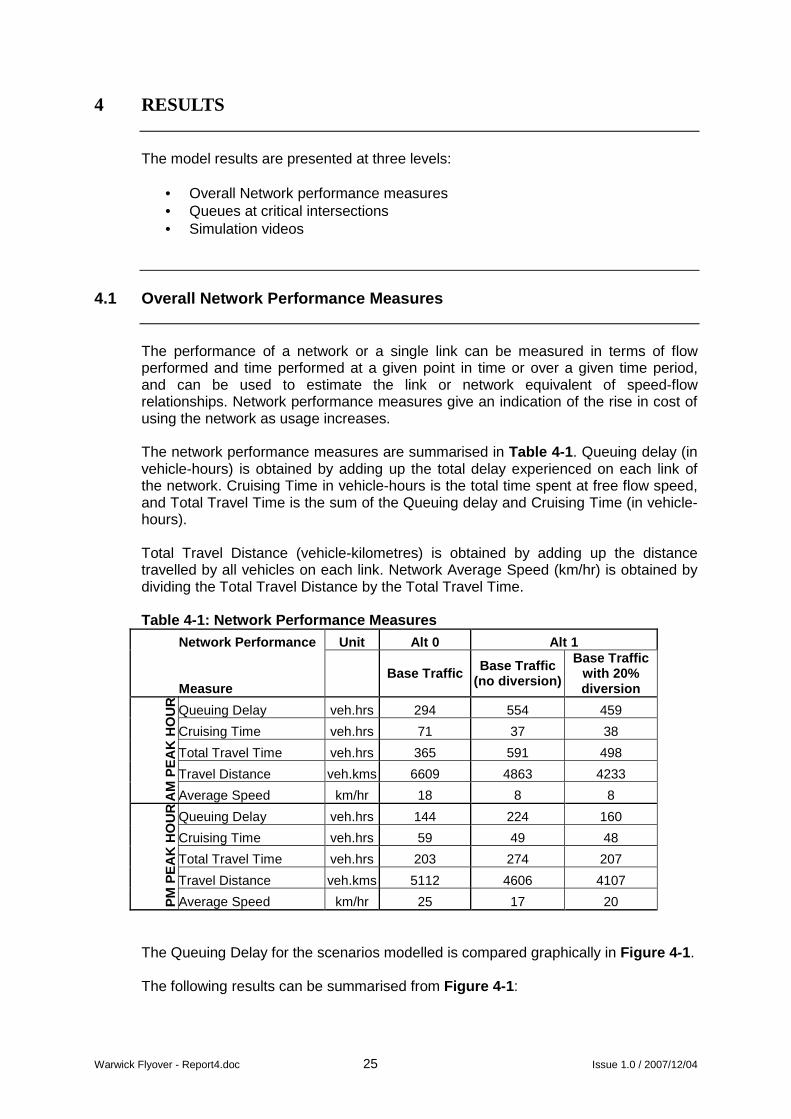
The performance of a network or a single link can be measured in terms of flow performed and time performed at a given point in time or over a given time period, and can be used to estimate the link or network equivalent of speed-flow relationships. Network performance measures give an indication of the rise in cost of using the network as usage increases. The network performance measures are summarised in Table 4-1 . Queuing delay (in vehicle-hours) is obtained by adding up the total delay experienced on each link of the network. Cruising Time in vehicle-hours is the total time spent at free flow speed, and Total Travel Time is the sum of the Queuing delay and Cruising Time (in vehicle-hours). Total Travel Distance (vehicle-kilometres) is obtained by adding up the distance travelled by all vehicles on each link. Network Average Speed (km/hr) is obtained by dividing the Total Travel Distance by the Total Travel Time. Table 4-1: Network Performance Measures
Network Performance Unit Alt 0 Alt 1
Measure Base Traffic Base Traffic
(no diversion)
Base Traffic with 20% diversion
Queuing Delay veh.hrs 294 554 459
Cruising Time veh.hrs 71 37 38
Total Travel Time veh.hrs 365 591 498
Travel Distance veh.kms 6609 4863 4233
AM
PE
AK
HO
UR
Average Speed km/hr 18 8 8
Queuing Delay veh.hrs 144 224 160
Cruising Time veh.hrs 59 49 48
Total Travel Time veh.hrs 203 274 207
Travel Distance veh.kms 5112 4606 4107
PM
PE
AK
HO
UR
Average Speed km/hr 25 17 20 The Queuing Delay for the scenarios modelled is compared graphically in Figure 4-1 . The following results can be summarised from Figure 4-1 :

Warwick Flyover - Report4.doc 26 Issue 1.0 / 2007/12/04
• With the same traffic volumes simulated as the base year, there is a 88% and 56% increase in queuing delay for Alternative 1 in the morning and afternoon peak hours respectively in comparison to Alternative 0.
AM Peak Hour
294
459
554
0
100
200
300
400
500
600
700
Existing Traffic 20% Diverted Traffic
Sensitivity
Que
uing
Del
ay [v
eh.h
rs]
Base Network (ALT 0) Road Closure (ALT 1)
PM Peak Hour
144160
224
0
50
100
150
200
250
Existing Traffic 20% Diverted Traffic
Sensitivity
Que
uing
Del
ay [v
eh.h
rs]
Base Network (ALT 0) Road Closure (ALT 1)
Figure 4-1: AM and PM Peak Hour Queuing Delay
• Given a 20% reduction of traffic volumes at key nodes (i.e. the traffic diversion), increases in queuing delays of 56% and 11% for the morning and afternoon peaks respectively are experienced for Alternative 1 in comparison to Alternative 0.
Warwick Flyover - Report4.doc 27 Issue 1.0 / 2007/12/04
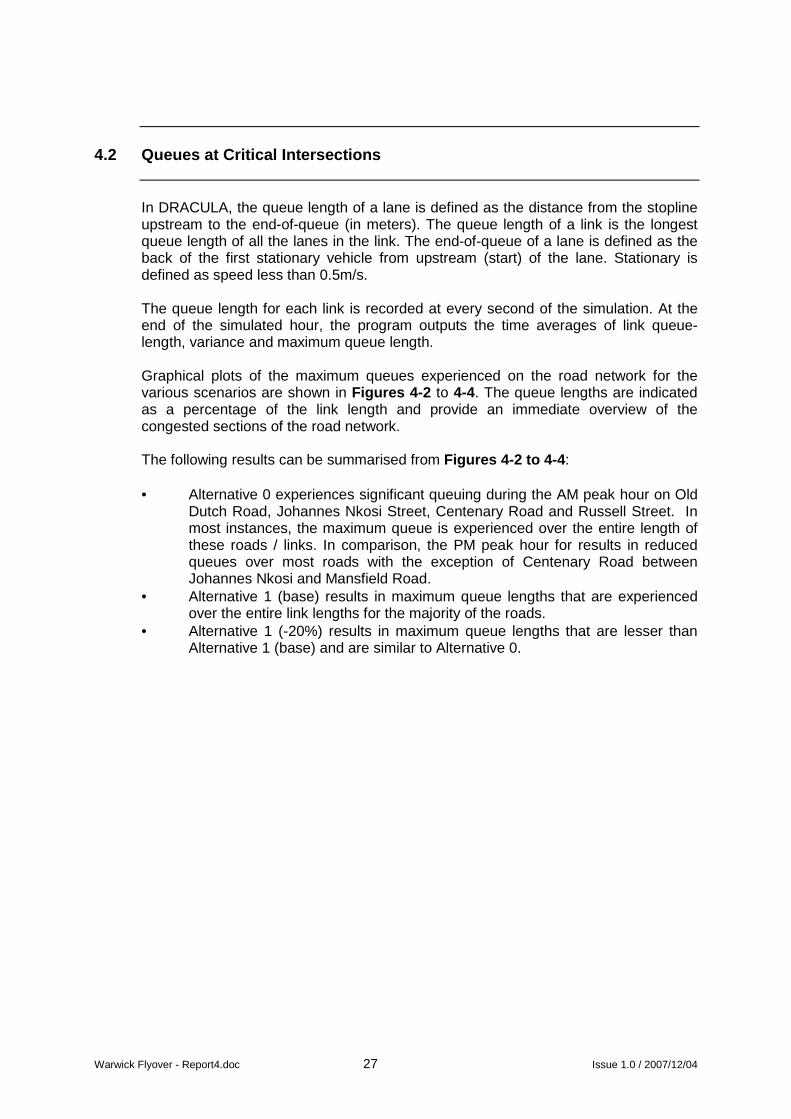
4.2 Queues at Critical Intersections
In DRACULA, the queue length of a lane is defined as the distance from the stopline upstream to the end-of-queue (in meters). The queue length of a link is the longest queue length of all the lanes in the link. The end-of-queue of a lane is defined as the back of the first stationary vehicle from upstream (start) of the lane. Stationary is defined as speed less than 0.5m/s. The queue length for each link is recorded at every second of the simulation. At the end of the simulated hour, the program outputs the time averages of link queue-length, variance and maximum queue length. Graphical plots of the maximum queues experienced on the road network for the various scenarios are shown in Figures 4-2 to 4-4. The queue lengths are indicated as a percentage of the link length and provide an immediate overview of the congested sections of the road network. The following results can be summarised from Figures 4-2 to 4-4 : • Alternative 0 experiences significant queuing during the AM peak hour on Old
Dutch Road, Johannes Nkosi Street, Centenary Road and Russell Street. In most instances, the maximum queue is experienced over the entire length of these roads / links. In comparison, the PM peak hour for results in reduced queues over most roads with the exception of Centenary Road between Johannes Nkosi and Mansfield Road.
• Alternative 1 (base) results in maximum queue lengths that are experienced over the entire link lengths for the majority of the roads.
• Alternative 1 (-20%) results in maximum queue lengths that are lesser than Alternative 1 (base) and are similar to Alternative 0.

Warwick Flyover - Report4.doc 28 Issue 1.0 / 2007/12/04
Figure 4-2

Warwick Flyover - Report4.doc 29 Issue 1.0 / 2007/12/04
Figure 4-3

Warwick Flyover - Report4.doc 30 Issue 1.0 / 2007/12/04
Figure 4-4
Warwick Flyover - Report4.doc 31 Issue 1.0 / 2007/12/04
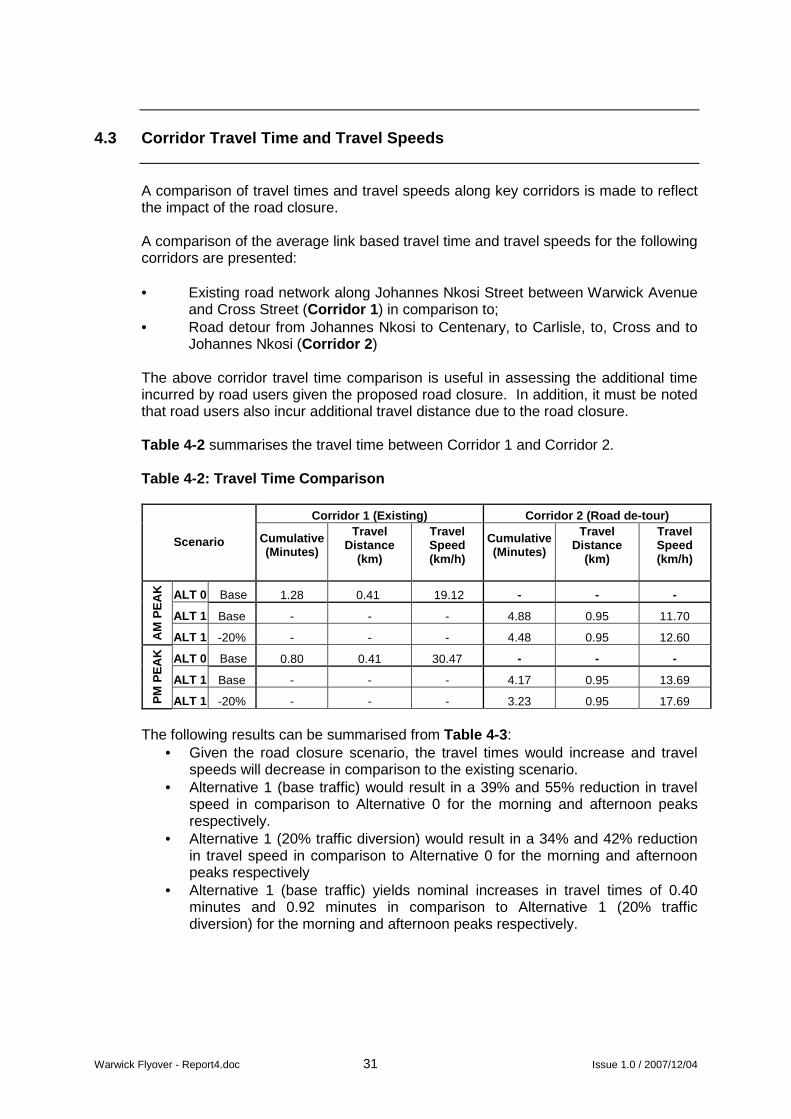
4.3 Corridor Travel Time and Travel Speeds
A comparison of travel times and travel speeds along key corridors is made to reflect the impact of the road closure. A comparison of the average link based travel time and travel speeds for the following corridors are presented: • Existing road network along Johannes Nkosi Street between Warwick Avenue
and Cross Street (Corridor 1 ) in comparison to; • Road detour from Johannes Nkosi to Centenary, to Carlisle, to, Cross and to
Johannes Nkosi (Corridor 2 ) The above corridor travel time comparison is useful in assessing the additional time incurred by road users given the proposed road closure. In addition, it must be noted that road users also incur additional travel distance due to the road closure. Table 4-2 summarises the travel time between Corridor 1 and Corridor 2. Table 4-2: Travel Time Comparison
Corridor 1 (Existing) Corridor 2 (Road de-tour)
Scenario Cumulative (Minutes)
Travel Distance
(km)
Travel Speed (km/h)
Cumulative (Minutes)
Travel Distance
(km)
Travel Speed (km/h)
ALT 0 Base 1.28 0.41 19.12 - - -
ALT 1 Base - - - 4.88 0.95 11.70
AM
PE
AK
ALT 1 -20% - - - 4.48 0.95 12.60
ALT 0 Base 0.80 0.41 30.47 - - -
ALT 1 Base - - - 4.17 0.95 13.69
PM
PE
AK
ALT 1 -20% - - - 3.23 0.95 17.69
The following results can be summarised from Table 4-3 :
• Given the road closure scenario, the travel times would increase and travel speeds will decrease in comparison to the existing scenario.
• Alternative 1 (base traffic) would result in a 39% and 55% reduction in travel speed in comparison to Alternative 0 for the morning and afternoon peaks respectively.
• Alternative 1 (20% traffic diversion) would result in a 34% and 42% reduction in travel speed in comparison to Alternative 0 for the morning and afternoon peaks respectively
• Alternative 1 (base traffic) yields nominal increases in travel times of 0.40 minutes and 0.92 minutes in comparison to Alternative 1 (20% traffic diversion) for the morning and afternoon peaks respectively.
Warwick Flyover - Report4.doc 32 Issue 1.0 / 2007/12/04
4.4 Simulation Videos
The simulation for each Scenario tested was recorded and is included in Annexure 3 in digital format - CD).
Warwick Flyover - Report4.doc 33 Issue 1.0 / 2007/12/04
5 COMMUNICATIONS AND TRAFFIC MONITORING STRATEGY
5.1 Communications Strategy
The communications strategy is of vital importance in terms of accommodating traffic during the road closure. The road closure together with the detour needs to communicated with affected parties and the public at large through: • Advertising in newspapers • Pamphlets • Radio broadcasts, etc. The implementation of the road detour is also dependent road signage indicating the road detour and also advanced road signage being necessary to indicate alternative routes.
5.2 Traffic Monitoring Strategy
It would be necessary that Metro Police are involved in the planning stages of the road closure and detour and also are available onsite in the monitoring of traffic in the early stages of the operations during the road closure. Traffic monitoring for the first three months of the road closure would be necessary to address: • Adjustments to traffic signal settings • Adjustments to accommodation of pedestrians • Adjustments necessary to public transport operations Traffic monitoring would include carrying out of traffic counts and onsite visits.
Warwick Flyover - Report4.doc 34 Issue 1.0 / 2007/12/04
6 CONCLUSIONS AND RECOMMENDATIONS
6.1 Conclusions
The DRACULA micro-simulation model was developed to investigate the traffic operations given the temporary road closure of Johannes Nkosi Street between Warwick Avenue and Russell Street. Based on the DRACULA micro simulation and results of the investigation, it can be concluded that: - • The model was calibrated and validated satisfactory for the purpose it this
investigation and is deemed robust and accurate. • The existing road network is congested along Old Dutch Road, Johannes
Nkosi Street, Centenary Road and Warwick Avenue. • The temporary road closure would result in a decrease in overall network
performance in terms of queuing delay, travel times / speeds. • The overall network performance in terms of queuing delay significantly
increase in comparison to the existing scenario that is in the order of some 88% more when considering the road closure with no traffic diversion.
• The 20% traffic diversion (for the road closure) results in overall network queuing delay that is some 11% to 56% more in comparison to the existing scenario.
• The road closure would result in reduced average travel speeds and travel times of some 20% to 50% less in comparison to the existing scenario and is considered acceptable in terms of CBD operations given the proposed road closure.
• Travel speeds are estimated in the region of 8 km/h to 20 km/h for the proposed road closure and are considered acceptable given the CBD context and construction activities.
• The road closure would impact on a public transport operations and routing. Approximately 1000 peak hour public transport vehicles would be affected by the road closure.
• The road closure would impact on the Durban Transport Public transport operations, however the vehicle routing has been discussed and agreed with Durban Transport.
• On street parking and loading bays would be affected by the proposed road closure.
• Pedestrian movements on Johannes Nkosi Street would be affected by the road closure.
6.2 Recommendations
Based on the results and conclusions, the following phased recommendations are made:
Warwick Flyover - Report4.doc 35 Issue 1.0 / 2007/12/04
Negotiations and Consultation Prior to implementation of the road detour, negotiations and consultation with various stakeholders are necessary. This report only identifies two aspects of the negotiations, that needs to be addressed in addition to other aspects that will be carried out by specialist consultants appointed by the EM: • Negotiations with privately owned public transport operators are carried out
regarding the affected public transport facilities and routing • Negotiations with business owners and social service operations needs to be
carried out regarding the loss of parking bays along Centenary and Cross Street.
Communications Strategy The communications strategy is developed once negotiations and finalisation of the intended road de-tour is reached with various stakeholders: • A communication strategy (advertising, pamphlets, road broadcast,
implementation of road signage) is developed to inform affected parties and the public at large of the road closure and road detour.
Road, Transport and Traffic Operations Implementati on • The road / lane channelisation layout (Figure 2-3 ) as presented in this report
is implemented for the road closure subject to detailed geometric design • A new signalised intersection is implemented for the duration of the road
closure at the intersection of Johannes Nkosi and Cross Street • New signal settings and timings are implemented for the duration of the road
closure (refer Annexure 1 ) • A pedestrian accommodation plan is developed particularly with reference to
pedestrians along Johannes Nksosi Street that need to be considered with options of temporary grade separation structures and / or re routing alternatives.
Traffic Monitoring of Road Closure and Road Detour After implementation of the road closure and detour, a traffic monitoring programme is necessary and should be addressed as follows: • On site presence and traffic monitoring is carried out by Metro Police in the
initial stages of the road closure. • Traffic monitoring programme is carried out for the first three months of the
road closure to “fine tune” traffic signal settings, pedestrian accommodation and public transport operations.

Warwick Flyover - Report4.doc Issue 1.0 / 2007/12/04
ANNEXURE 1
VALIDATION OF NETWORK CODING

Warwick Flyover - Report4.doc Issue 1.0 / 2007/12/04
ANNEXURE 2
VALIDATION OF TRAFFIC FLOWS

Warwick Flyover - Report4.doc Issue 1.0 / 2007/12/04
ANNEXURE 3
CD CONTAINING SIMULATION VIDEOS

Warwick Flyover - Report4.doc Issue 1.0 / 2007/12/04
ANNEXURE 4
DOCUMENT CONTROL SHEET
Warwick Flyover - Report4.doc Issue 1.0 / Issue Date
DOCUMENT CONTROL SHEET (FORM IP180/B) CLIENT : SiVest Environmental Division (Pty) Ltd PROJECT : Traffic Impact Assessment : Warwick Flyover PROJECT No : J27219 TITLE : DRACULA MICROSIMULATION MODEL Prepared by Reviewed by Approved by
ORIGINAL NAME C Chaithram
NAME R Dookhi
NAME W J Vogelzang
DATE 12.09.2007
SIGNATURE
SIGNATURE
SIGNATURE
REVISION NAME C Chaithram
NAME R Dookhi
NAME W J Vogelzang
DATE 30.11.2007
SIGNATURE
SIGNATURE
SIGNATURE
REVISION NAME
NAME
NAME
DATE
SIGNATURE
SIGNATURE
SIGNATURE
REVISION NAME
NAME
NAME
DATE
SIGNATURE
SIGNATURE
SIGNATURE
This report, and information or advice, which it contains, is provided by ARCUS GIBB solely for internal use and reliance by its Client in performance of ARCUS GIBB duties and liabilities under its contract with the Client. Any advice, opinions, or recommendations within this report should be read and relied upon only in the context of the report as a whole. The advice and opinions in this report are based upon the information made available to ARCUS GIBB at the date of this report and on current SA standards, codes, technology and construction practices as at the date of this report. Following final delivery of this report to the Client, ARCUS GIBB will have no further obligations or duty to advise the Client on any matters, including development affecting the information or advice provided in this report. This report has been prepared by ARCUS GIBB in their professional capacity as Consulting Engineers. The contents of the report do not, in any way, purport to include any manner of legal advice or opinion. This report is prepared in accordance with the terms and conditions of the ARCUS GIBB contract with the Client. Regard should be had to those terms and conditions when considering and/or placing any reliance on this report. Should the Client wish to release this report to a Third Party for that party's reliance, ARCUS GIBB may, at its discretion, agree to such release provided that: (a) ARCUS GIBB written agreement is obtained prior to such release, and (b) By release of the report to the Third Party, that Third Party does not acquire any rights, contractual or otherwise, whatsoever against ARCUS GIBB and ARCUS GIBB,
accordingly, assume no duties, liabilities or obligations to that Third Party, and (c) ARCUS GIBB accepts no responsibility for any loss or damage incurred by the Client or for any conflict of ARCUS GIBB interests arising out of the Client's release of
this report to the Third Party. ARCUS GIBB (Pty) Ltd 54 Norfolk Terrace, IBM House Westville, 3630 South Africa Tel : +27 21 469 9100 Fax : +27 21 424 5571 Email : [email protected] Website : www.arcusgibb.co.za