ethiopia - food and agriculture organization · fra 2010 – country report, ethiopia 3 contents...
TRANSCRIPT
Forestry Department Food and Agriculture Organization of the United Nations
FRA2010/065 Rome, 2010
GLOBAL FOREST RESOURCES
ASSESSMENT 2010
COUNTRY REPORT
ETHIOPIA
2
The Forest Resources Assessment Programme Sustainably managed forests have multiple environmental and socio-economic functions important at the global, national and local scales, and play a vital part in sustainable development. Reliable and up-to-date information on the state of forest resources - not only on area and area change, but also on such variables as growing stock, wood and non-wood products, carbon, protected areas, use of forests for recreation and other services, biological diversity and forests’ contribution to national economies - is crucial to support decision-making for policies and programmes in forestry and sustainable development at all levels.
FAO, at the request of its member countries, regularly monitors the world’s forests and their management and uses through the Forest Resources Assessment Programme. This country report forms part of the Global Forest Resources Assessment 2010 (FRA 2010). The reporting framework for FRA 2010 is based on the thematic elements of sustainable forest management acknowledged in intergovernmental forest-related fora and includes variables related to the extent, condition, uses and values of forest resources, as well as the policy, legal and institutional framework related to forests. More information on the FRA 2010 process and the results - including all the country reports - is available on the FRA Web site (www.fao.org/forestry/fra ). The Global Forest Resources Assessment process is coordinated by the Forestry Department at FAO headquarters in Rome. The contact person for matters related to FRA 2010 is: Mette Løyche Wilkie Senior Forestry Officer FAO Forestry Department Viale delle Terme di Caracalla Rome 00153, Italy E-mail: [email protected] Readers can also use the following e-mail address: [email protected]
DISCLAIMER The designations employed and the presentation of material in this information product do not imply the expression of any opinion whatsoever on the part of the Food and Agriculture Organization of the United Nations concerning the legal status of any country, territory, city or area or of its authorities, or concerning the delimitation of its frontiers or boundaries. The Global Forest Resources Assessment Country Report Series is designed to document and make available the information forming the basis for the FRA reports. The Country Reports have been compiled by officially nominated country correspondents in collaboration with FAO staff. Prior to finalisation, these reports were subject to validation by forestry authorities in the respective countries.
FRA 2010 – Country Report, Ethiopia
3
Contents
1 TABLE T1 – EXTENT OF FOREST AND OTHER WOODED LAND......................................................5
2 TABLE T2 – FOREST OWNERSHIP AND MANAGEMENT RIGHTS ..................................................11
3 TABLE T3 – FOREST DESIGNATION AND MANAGEMENT ...............................................................14
4 TABLE T4 – FOREST CHARACTERISTICS ............................................................................................17
5 TABLE T5 – FOREST ESTABLISHMENT AND REFORESTATION....................................................19
6 TABLE T6 – GROWING STOCK.................................................................................................................21
7 TABLE T7 – BIOMASS STOCK ..................................................................................................................24
8 TABLE T8 – CARBON STOCK ...................................................................................................................27
9 TABLE T9 – FOREST FIRES ......................................................................................................................29
10 TABLE T10 – OTHER DISTURBANCES AFFECTING FOREST HEALTH AND VITALITY ............29
11 TABLE T11 – WOOD REMOVALS AND VALUE OF REMOVALS ......................................................30
12 TABLE T12 – NON-WOOD FOREST PRODUCTS REMOVALS AND VALUE OF REMOVALS....33
13 TABLE T13 – EMPLOYMENT .....................................................................................................................36
14 TABLE T14 – POLICY AND LEGAL FRAMEWORK ..............................................................................37
15 TABLE T15 – INSTITUTIONAL FRAMEWORK .......................................................................................39
16 TABLE T16 – EDUCATION AND RESEARCH.........................................................................................41
17 TABLE T17 – PUBLIC REVENUE COLLECTION AND EXPENDITURE ............................................43
FRA 2010 – Country Report, Ethiopia
4
Report preparation and contact persons The present report was prepared by the following person(s):
Name (FAMILY NAME, First name)
Institution / address E-mail Fax Tables
Mesfin Hailesellassie NRMD, Addis Ababa, Ethiopia
[email protected] T1 to T17
FRA 2010 – Country Report, Ethiopia
5
1 Table T1 – Extent of Forest and Other wooded land
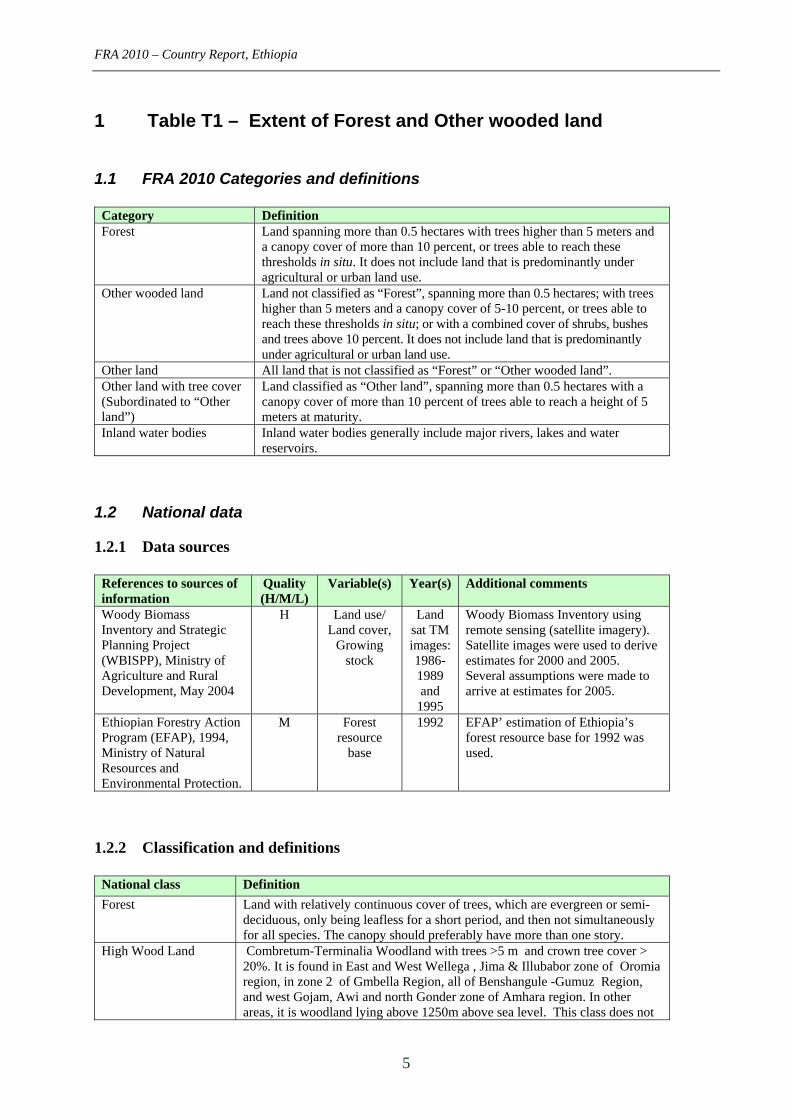
1.1 FRA 2010 Categories and definitions
Category Definition Forest Land spanning more than 0.5 hectares with trees higher than 5 meters and
a canopy cover of more than 10 percent, or trees able to reach these thresholds in situ. It does not include land that is predominantly under agricultural or urban land use.
Other wooded land Land not classified as “Forest”, spanning more than 0.5 hectares; with trees higher than 5 meters and a canopy cover of 5-10 percent, or trees able to reach these thresholds in situ; or with a combined cover of shrubs, bushes and trees above 10 percent. It does not include land that is predominantly under agricultural or urban land use.
Other land All land that is not classified as “Forest” or “Other wooded land”. Other land with tree cover (Subordinated to “Other land”)
Land classified as “Other land”, spanning more than 0.5 hectares with a canopy cover of more than 10 percent of trees able to reach a height of 5 meters at maturity.
Inland water bodies Inland water bodies generally include major rivers, lakes and water reservoirs.
1.2 National data
1.2.1 Data sources
References to sources of information
Quality (H/M/L)
Variable(s) Year(s) Additional comments
Woody Biomass Inventory and Strategic Planning Project (WBISPP), Ministry of Agriculture and Rural Development, May 2004
H
Land use/ Land cover,
Growing stock
Land sat TM images: 1986-1989 and
1995
Woody Biomass Inventory using remote sensing (satellite imagery). Satellite images were used to derive estimates for 2000 and 2005. Several assumptions were made to arrive at estimates for 2005.
Ethiopian Forestry Action Program (EFAP), 1994, Ministry of Natural Resources and Environmental Protection.
M Forest resource
base
1992
EFAP’ estimation of Ethiopia’s forest resource base for 1992 was used.
1.2.2 Classification and definitions
National class Definition
Forest Land with relatively continuous cover of trees, which are evergreen or semi-deciduous, only being leafless for a short period, and then not simultaneously for all species. The canopy should preferably have more than one story.
High Wood Land Combretum-Terminalia Woodland with trees >5 m and crown tree cover > 20%. It is found in East and West Wellega , Jima & Illubabor zone of Oromia region, in zone 2 of Gmbella Region, all of Benshangule -Gumuz Region, and west Gojam, Awi and north Gonder zone of Amhara region. In other areas, it is woodland lying above 1250m above sea level. This class does not
FRA 2010 – Country Report, Ethiopia
6
include shrubs and bushes.
Plantation Mainly Eucalyptus, Cupressus and Pinus plantation with >5 m and crown density > 20% & thus is included in "Forest " as defined by FAO
Low woodland All other woodlands and shrubland <5m in height and with crown cover >20%
Other land Other land is land area that is not categorized as forest. This includes agricultural land, settlements, etc
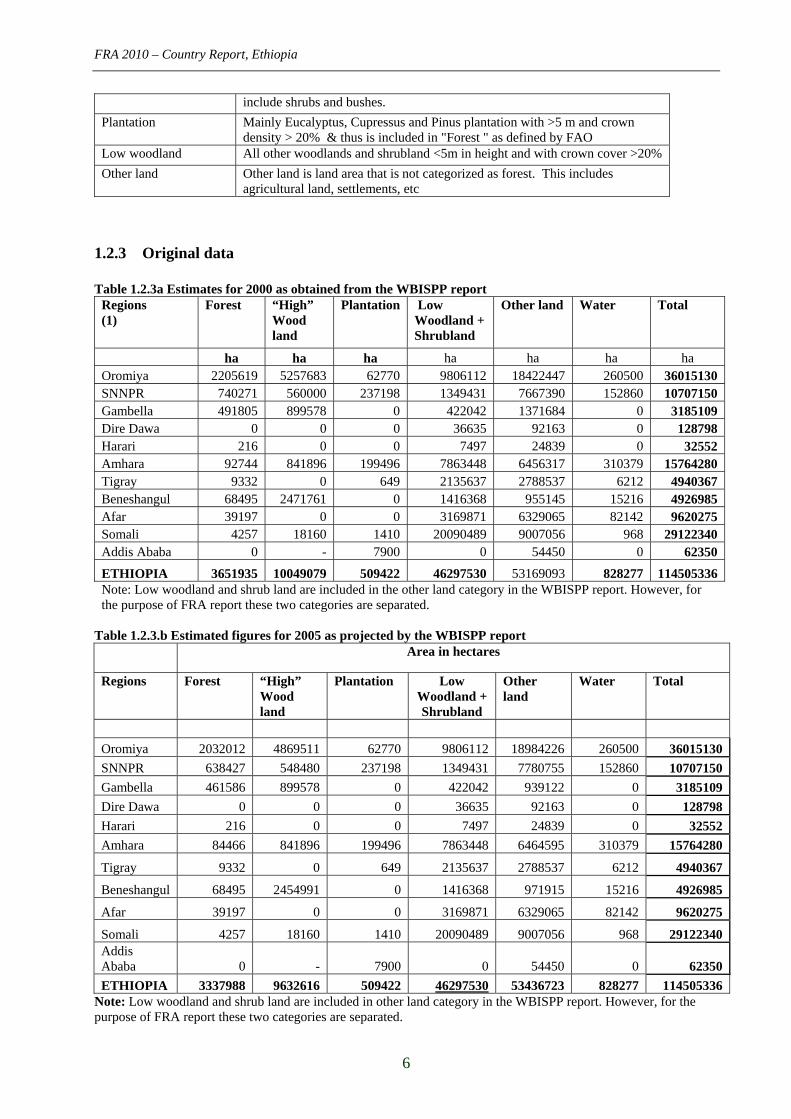
1.2.3 Original data Table 1.2.3a Estimates for 2000 as obtained from the WBISPP report
Regions (1)
Forest “High” Wood land
Plantation Low Woodland + Shrubland
Other land Water Total
ha ha ha ha ha ha ha Oromiya 2205619 5257683 62770 9806112 18422447 260500 36015130 SNNPR 740271 560000 237198 1349431 7667390 152860 10707150 Gambella 491805 899578 0 422042 1371684 0 3185109 Dire Dawa 0 0 0 36635 92163 0 128798 Harari 216 0 0 7497 24839 0 32552 Amhara 92744 841896 199496 7863448 6456317 310379 15764280 Tigray 9332 0 649 2135637 2788537 6212 4940367 Beneshangul 68495 2471761 0 1416368 955145 15216 4926985 Afar 39197 0 0 3169871 6329065 82142 9620275 Somali 4257 18160 1410 20090489 9007056 968 29122340 Addis Ababa 0 - 7900 0 54450 0 62350
ETHIOPIA 3651935 10049079 509422 46297530 53169093 828277 114505336 Note: Low woodland and shrub land are included in the other land category in the WBISPP report. However, for the purpose of FRA report these two categories are separated.
Table 1.2.3.b Estimated figures for 2005 as projected by the WBISPP report
Area in hectares
Regions Forest “High” Wood land
Plantation Low Woodland + Shrubland
Other land
Water Total
Oromiya 2032012 4869511 62770 9806112 18984226 260500 36015130
SNNPR 638427 548480 237198 1349431 7780755 152860 10707150
Gambella 461586 899578 0 422042 939122 0 3185109
Dire Dawa 0 0 0 36635 92163 0 128798
Harari 216 0 0 7497 24839 0 32552
Amhara 84466 841896 199496 7863448 6464595 310379 15764280
Tigray 9332 0 649 2135637 2788537 6212 4940367
Beneshangul 68495 2454991 0 1416368 971915 15216 4926985
Afar 39197 0 0 3169871 6329065 82142 9620275
Somali 4257 18160 1410 20090489 9007056 968 29122340Addis Ababa 0
- 7900 0 54450 0 62350
ETHIOPIA 3337988 9632616 509422 46297530 53436723 828277 114505336 Note: Low woodland and shrub land are included in other land category in the WBISPP report. However, for the purpose of FRA report these two categories are separated.
FRA 2010 – Country Report, Ethiopia
7
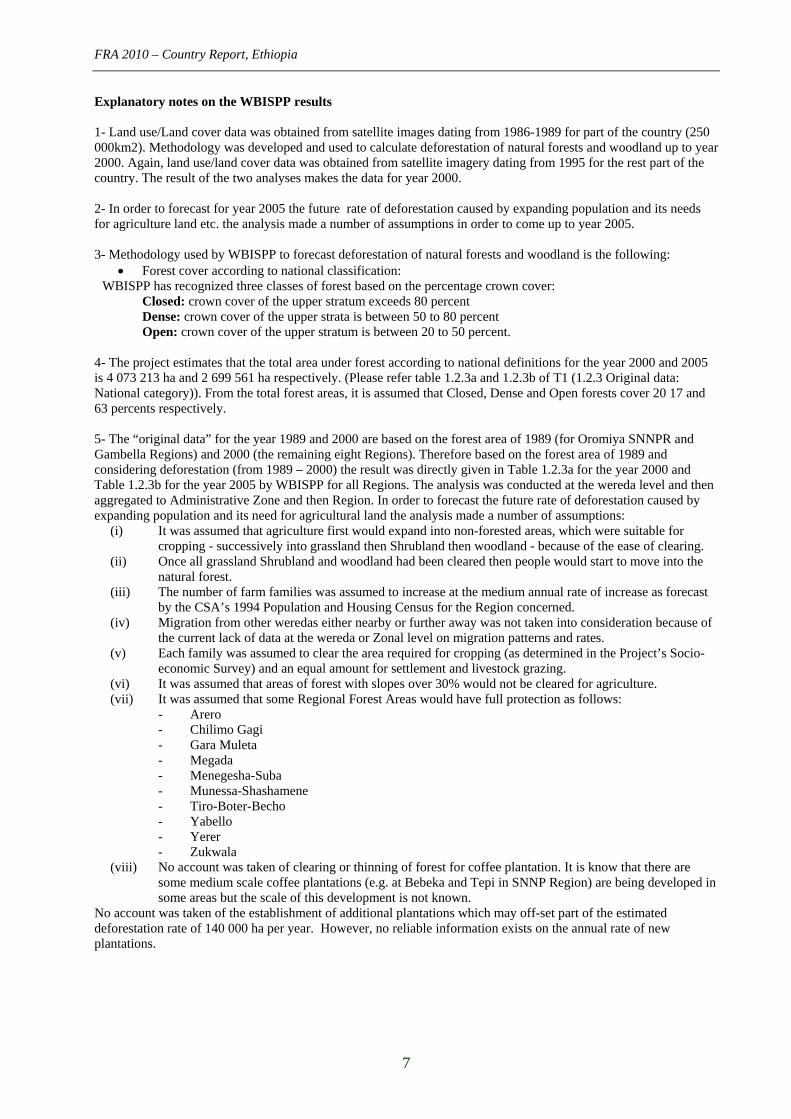
Explanatory notes on the WBISPP results 1- Land use/Land cover data was obtained from satellite images dating from 1986-1989 for part of the country (250 000km2). Methodology was developed and used to calculate deforestation of natural forests and woodland up to year 2000. Again, land use/land cover data was obtained from satellite imagery dating from 1995 for the rest part of the country. The result of the two analyses makes the data for year 2000. 2- In order to forecast for year 2005 the future rate of deforestation caused by expanding population and its needs for agriculture land etc. the analysis made a number of assumptions in order to come up to year 2005. 3- Methodology used by WBISPP to forecast deforestation of natural forests and woodland is the following:
Forest cover according to national classification: WBISPP has recognized three classes of forest based on the percentage crown cover:
Closed: crown cover of the upper stratum exceeds 80 percent Dense: crown cover of the upper strata is between 50 to 80 percent Open: crown cover of the upper stratum is between 20 to 50 percent.
4- The project estimates that the total area under forest according to national definitions for the year 2000 and 2005 is 4 073 213 ha and 2 699 561 ha respectively. (Please refer table 1.2.3a and 1.2.3b of T1 (1.2.3 Original data: National category)). From the total forest areas, it is assumed that Closed, Dense and Open forests cover 20 17 and 63 percents respectively. 5- The “original data” for the year 1989 and 2000 are based on the forest area of 1989 (for Oromiya SNNPR and Gambella Regions) and 2000 (the remaining eight Regions). Therefore based on the forest area of 1989 and considering deforestation (from 1989 – 2000) the result was directly given in Table 1.2.3a for the year 2000 and Table 1.2.3b for the year 2005 by WBISPP for all Regions. The analysis was conducted at the wereda level and then aggregated to Administrative Zone and then Region. In order to forecast the future rate of deforestation caused by expanding population and its need for agricultural land the analysis made a number of assumptions:
(i) It was assumed that agriculture first would expand into non-forested areas, which were suitable for cropping - successively into grassland then Shrubland then woodland - because of the ease of clearing.
(ii) Once all grassland Shrubland and woodland had been cleared then people would start to move into the natural forest.
(iii) The number of farm families was assumed to increase at the medium annual rate of increase as forecast by the CSA’s 1994 Population and Housing Census for the Region concerned.
(iv) Migration from other weredas either nearby or further away was not taken into consideration because of the current lack of data at the wereda or Zonal level on migration patterns and rates.
(v) Each family was assumed to clear the area required for cropping (as determined in the Project’s Socio-economic Survey) and an equal amount for settlement and livestock grazing.
(vi) It was assumed that areas of forest with slopes over 30% would not be cleared for agriculture. (vii) It was assumed that some Regional Forest Areas would have full protection as follows:
- Arero - Chilimo Gagi - Gara Muleta - Megada - Menegesha-Suba - Munessa-Shashamene - Tiro-Boter-Becho - Yabello - Yerer - Zukwala
(viii) No account was taken of clearing or thinning of forest for coffee plantation. It is know that there are some medium scale coffee plantations (e.g. at Bebeka and Tepi in SNNP Region) are being developed in some areas but the scale of this development is not known.
No account was taken of the establishment of additional plantations which may off-set part of the estimated deforestation rate of 140 000 ha per year. However, no reliable information exists on the annual rate of new plantations.
FRA 2010 – Country Report, Ethiopia
8
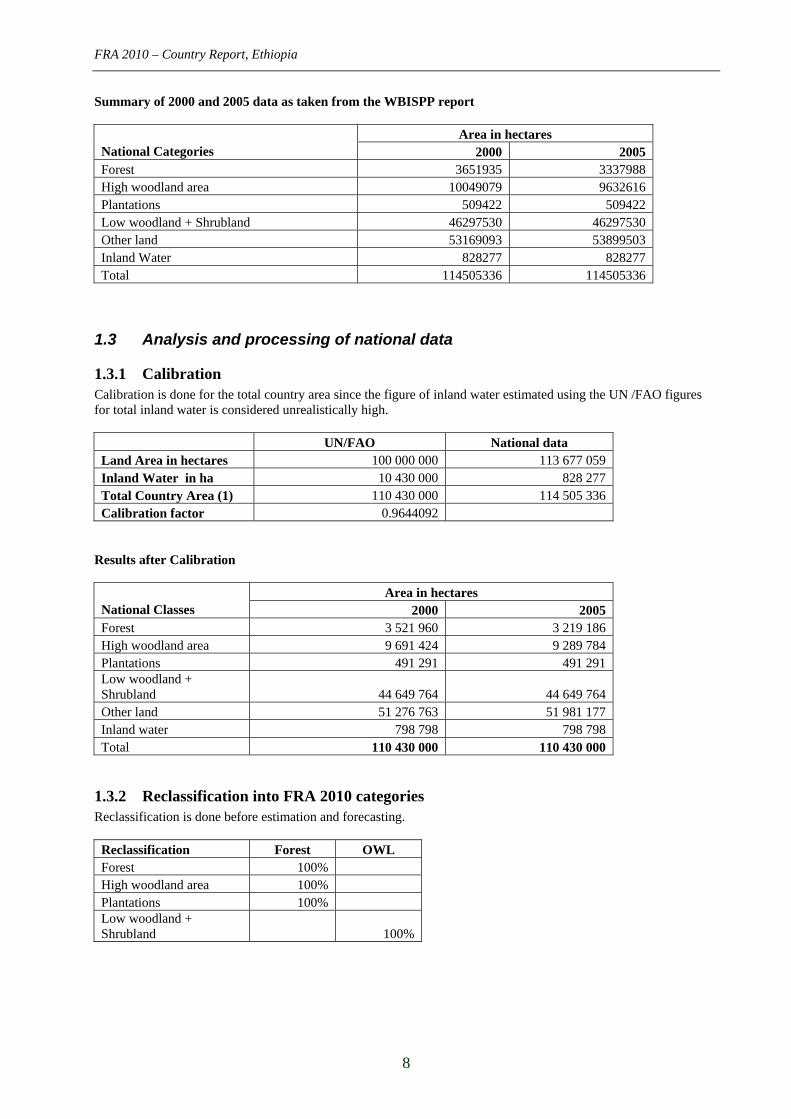
Summary of 2000 and 2005 data as taken from the WBISPP report
Area in hectares National Categories 2000 2005 Forest 3651935 3337988 High woodland area 10049079 9632616 Plantations 509422 509422 Low woodland + Shrubland 46297530 46297530 Other land 53169093 53899503 Inland Water 828277 828277 Total 114505336 114505336
1.3 Analysis and processing of national data
1.3.1 Calibration Calibration is done for the total country area since the figure of inland water estimated using the UN /FAO figures for total inland water is considered unrealistically high.
UN/FAO National data Land Area in hectares 100 000 000 113 677 059 Inland Water in ha 10 430 000 828 277 Total Country Area (1) 110 430 000 114 505 336 Calibration factor 0.9644092
Results after Calibration
Area in hectares National Classes 2000 2005 Forest 3 521 960 3 219 186 High woodland area 9 691 424 9 289 784 Plantations 491 291 491 291 Low woodland + Shrubland 44 649 764 44 649 764 Other land 51 276 763 51 981 177 Inland water 798 798 798 798 Total 110 430 000 110 430 000
1.3.2 Reclassification into FRA 2010 categories Reclassification is done before estimation and forecasting.
Reclassification Forest OWL Forest 100% High woodland area 100% Plantations 100% Low woodland + Shrubland 100%
FRA 2010 – Country Report, Ethiopia
9
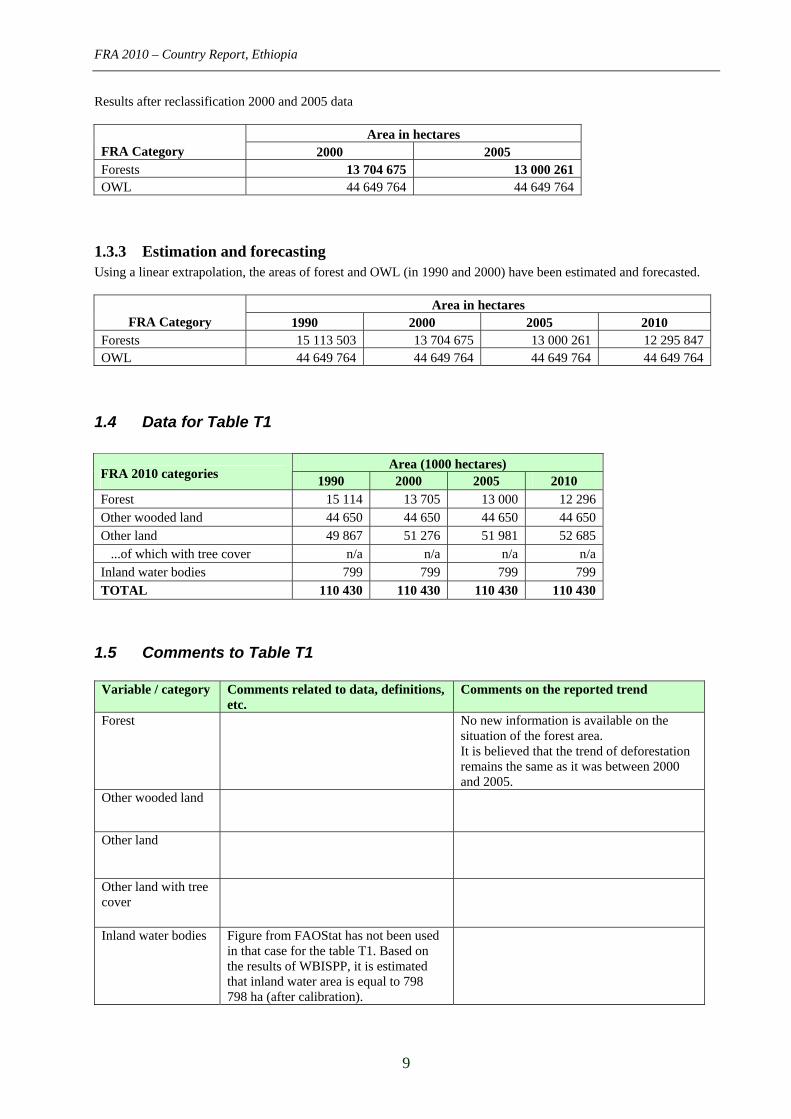
Results after reclassification 2000 and 2005 data
Area in hectares FRA Category 2000 2005 Forests 13 704 675 13 000 261 OWL 44 649 764 44 649 764
1.3.3 Estimation and forecasting Using a linear extrapolation, the areas of forest and OWL (in 1990 and 2000) have been estimated and forecasted.
Area in hectares FRA Category 1990 2000 2005 2010
Forests 15 113 503 13 704 675 13 000 261 12 295 847 OWL 44 649 764 44 649 764 44 649 764 44 649 764
1.4 Data for Table T1
Area (1000 hectares) FRA 2010 categories
1990 2000 2005 2010 Forest 15 114 13 705 13 000 12 296 Other wooded land 44 650 44 650 44 650 44 650 Other land 49 867 51 276 51 981 52 685 ...of which with tree cover n/a n/a n/a n/a Inland water bodies 799 799 799 799 TOTAL 110 430 110 430 110 430 110 430
1.5 Comments to Table T1
Variable / category Comments related to data, definitions, etc.
Comments on the reported trend
Forest No new information is available on the situation of the forest area. It is believed that the trend of deforestation remains the same as it was between 2000 and 2005.
Other wooded land
Other land
Other land with tree cover
Inland water bodies Figure from FAOStat has not been used in that case for the table T1. Based on the results of WBISPP, it is estimated that inland water area is equal to 798 798 ha (after calibration).
FRA 2010 – Country Report, Ethiopia
10
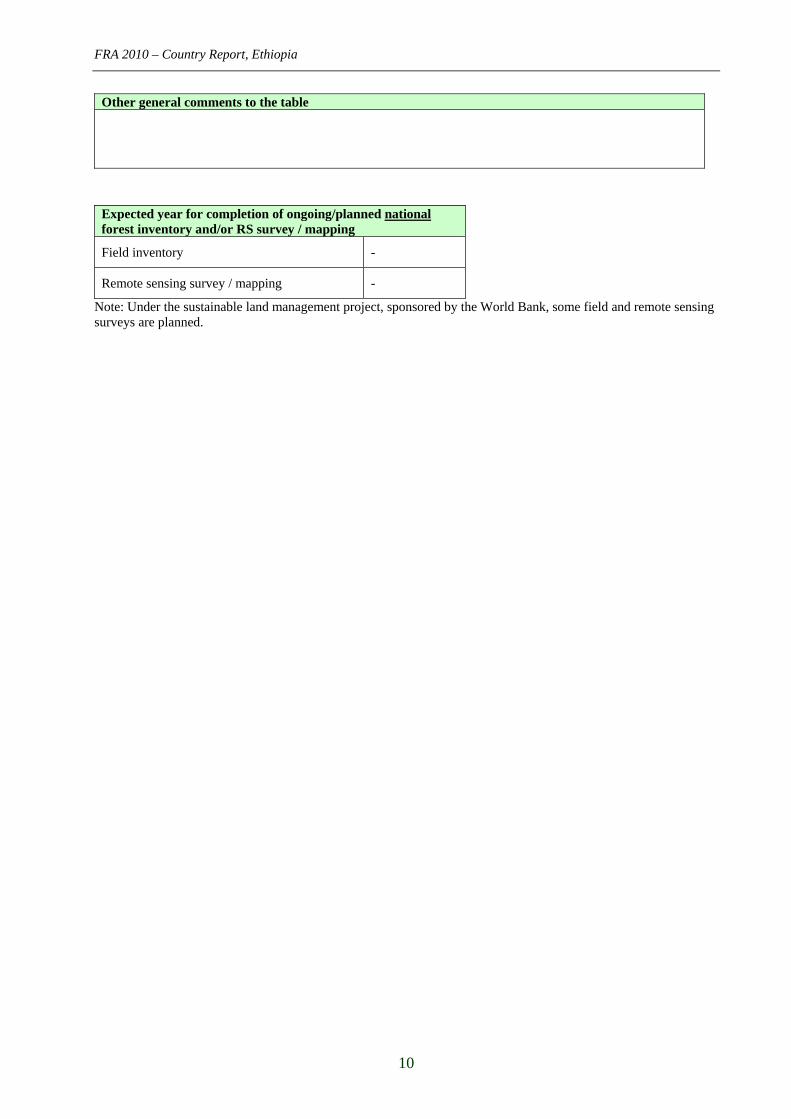
Other general comments to the table
Expected year for completion of ongoing/planned national forest inventory and/or RS survey / mapping
Field inventory -
Remote sensing survey / mapping -
Note: Under the sustainable land management project, sponsored by the World Bank, some field and remote sensing surveys are planned.
FRA 2010 – Country Report, Ethiopia
11
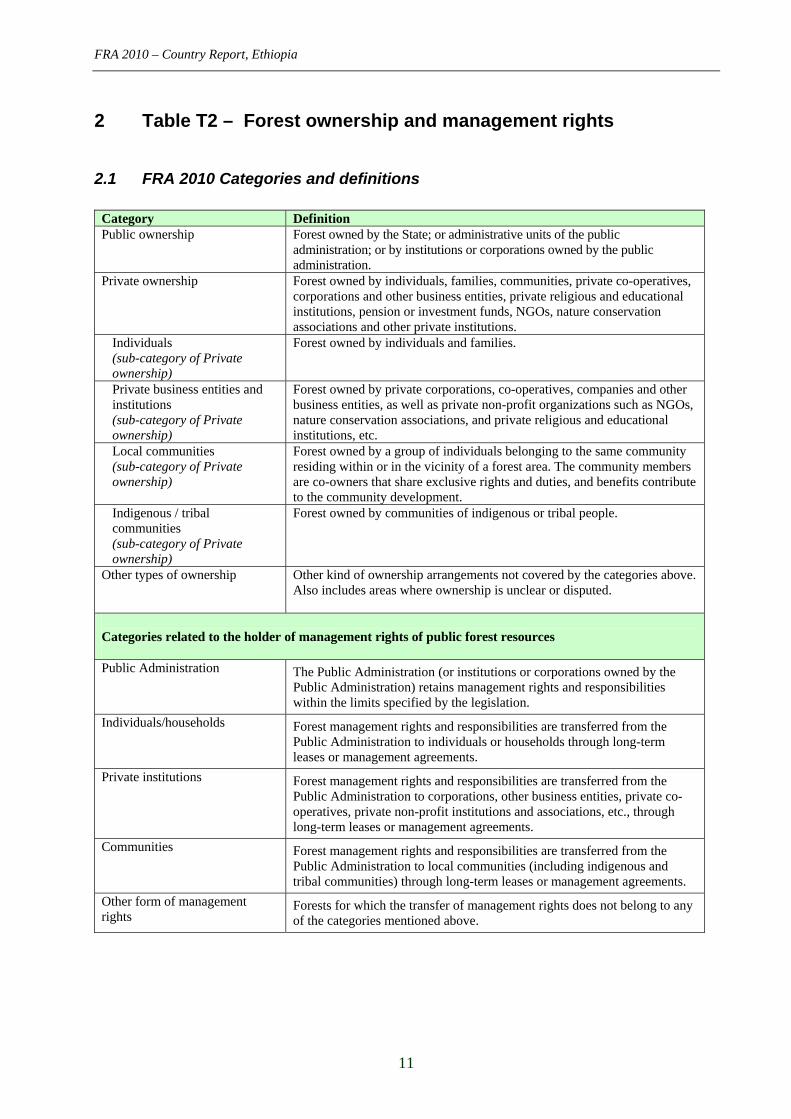
2 Table T2 – Forest ownership and management rights
2.1 FRA 2010 Categories and definitions
Category Definition Public ownership Forest owned by the State; or administrative units of the public
administration; or by institutions or corporations owned by the public administration.
Private ownership Forest owned by individuals, families, communities, private co-operatives, corporations and other business entities, private religious and educational institutions, pension or investment funds, NGOs, nature conservation associations and other private institutions.
Individuals (sub-category of Private ownership)
Forest owned by individuals and families.
Private business entities and institutions (sub-category of Private ownership)
Forest owned by private corporations, co-operatives, companies and other business entities, as well as private non-profit organizations such as NGOs, nature conservation associations, and private religious and educational institutions, etc.
Local communities (sub-category of Private ownership)
Forest owned by a group of individuals belonging to the same community residing within or in the vicinity of a forest area. The community members are co-owners that share exclusive rights and duties, and benefits contribute to the community development.
Indigenous / tribal communities (sub-category of Private ownership)
Forest owned by communities of indigenous or tribal people.
Other types of ownership Other kind of ownership arrangements not covered by the categories above. Also includes areas where ownership is unclear or disputed.
Categories related to the holder of management rights of public forest resources Public Administration
The Public Administration (or institutions or corporations owned by the Public Administration) retains management rights and responsibilities within the limits specified by the legislation.
Individuals/households Forest management rights and responsibilities are transferred from the Public Administration to individuals or households through long-term leases or management agreements.
Private institutions
Forest management rights and responsibilities are transferred from the Public Administration to corporations, other business entities, private co-operatives, private non-profit institutions and associations, etc., through long-term leases or management agreements.
Communities
Forest management rights and responsibilities are transferred from the Public Administration to local communities (including indigenous and tribal communities) through long-term leases or management agreements.
Other form of management rights
Forests for which the transfer of management rights does not belong to any of the categories mentioned above.
FRA 2010 – Country Report, Ethiopia
12
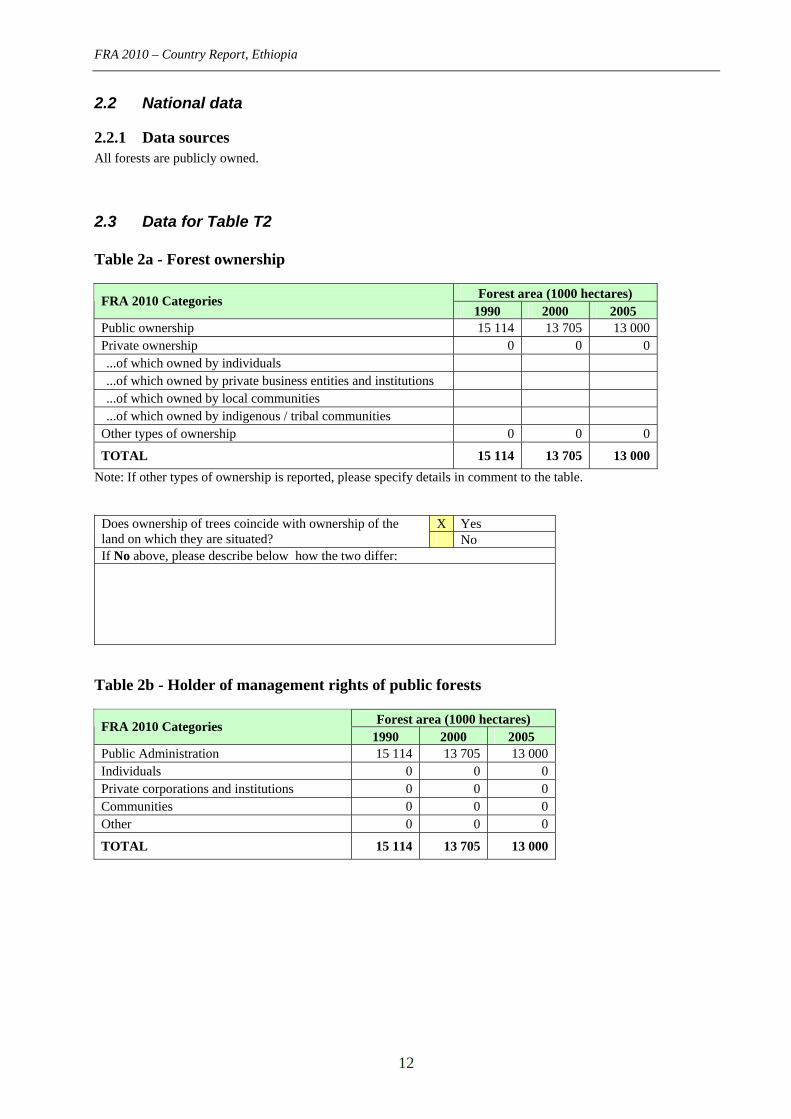
2.2 National data
2.2.1 Data sources All forests are publicly owned.
2.3 Data for Table T2 Table 2a - Forest ownership
Forest area (1000 hectares) FRA 2010 Categories
1990 2000 2005 Public ownership 15 114 13 705 13 000 Private ownership 0 0 0 ...of which owned by individuals ...of which owned by private business entities and institutions ...of which owned by local communities ...of which owned by indigenous / tribal communities
Other types of ownership 0 0 0
TOTAL 15 114 13 705 13 000
Note: If other types of ownership is reported, please specify details in comment to the table.
X Yes Does ownership of trees coincide with ownership of the land on which they are situated? No If No above, please describe below how the two differ:
Table 2b - Holder of management rights of public forests
Forest area (1000 hectares) FRA 2010 Categories
1990 2000 2005 Public Administration 15 114 13 705 13 000 Individuals 0 0 0 Private corporations and institutions 0 0 0 Communities 0 0 0 Other 0 0 0
TOTAL 15 114 13 705 13 000
FRA 2010 – Country Report, Ethiopia
13
2.4 Comments to Table T2
Variable / category
Comments related to data, definitions, etc.
Comments on the reported trend
Public ownership
Private ownership
Other types of ownership
Community ownership on forest is not clearly assessed. Therefore it is assumed that all forests are public ones.
Management rights
Other general comments to the table
FRA 2010 – Country Report, Ethiopia
14
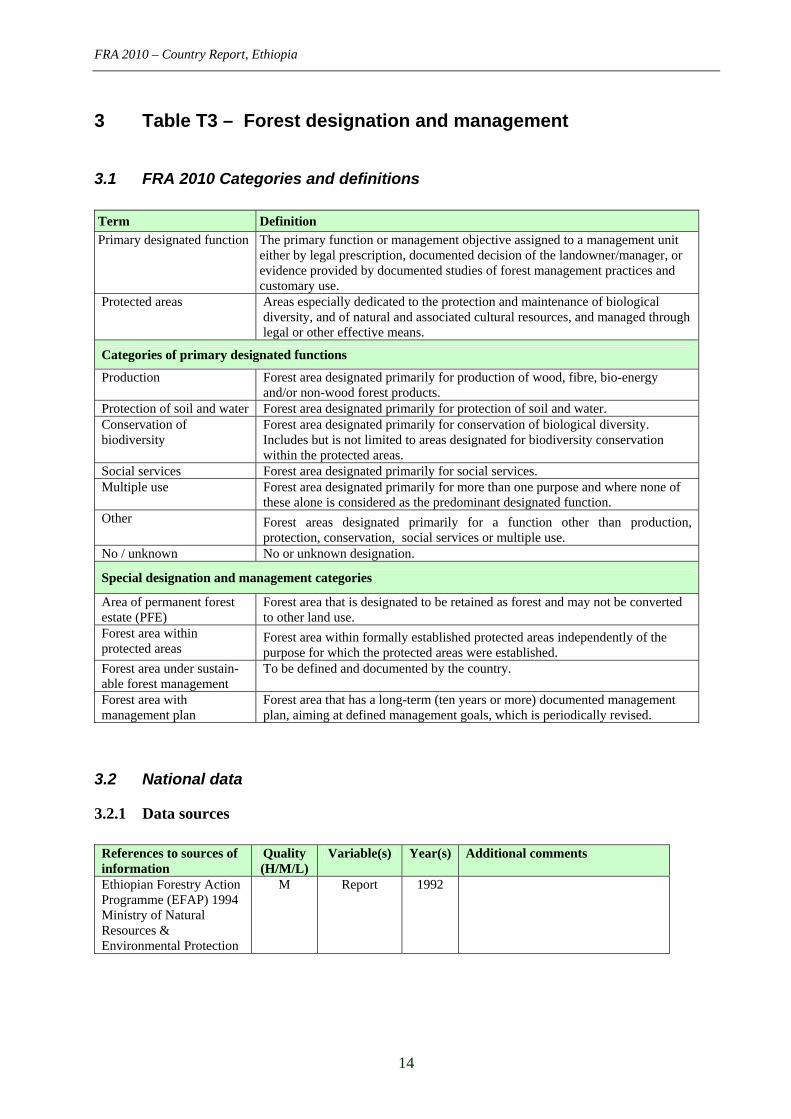
3 Table T3 – Forest designation and management
3.1 FRA 2010 Categories and definitions Term Definition
Primary designated function The primary function or management objective assigned to a management unit either by legal prescription, documented decision of the landowner/manager, or evidence provided by documented studies of forest management practices and customary use.
Protected areas Areas especially dedicated to the protection and maintenance of biological diversity, and of natural and associated cultural resources, and managed through legal or other effective means.
Categories of primary designated functions
Production Forest area designated primarily for production of wood, fibre, bio-energy and/or non-wood forest products.
Protection of soil and water Forest area designated primarily for protection of soil and water. Conservation of biodiversity
Forest area designated primarily for conservation of biological diversity. Includes but is not limited to areas designated for biodiversity conservation within the protected areas.
Social services Forest area designated primarily for social services. Multiple use Forest area designated primarily for more than one purpose and where none of
these alone is considered as the predominant designated function. Other Forest areas designated primarily for a function other than production,
protection, conservation, social services or multiple use. No / unknown No or unknown designation.
Special designation and management categories
Area of permanent forest estate (PFE)
Forest area that is designated to be retained as forest and may not be converted to other land use.
Forest area within protected areas
Forest area within formally established protected areas independently of the purpose for which the protected areas were established.
Forest area under sustain-able forest management
To be defined and documented by the country.
Forest area with management plan
Forest area that has a long-term (ten years or more) documented management plan, aiming at defined management goals, which is periodically revised.
3.2 National data
3.2.1 Data sources
References to sources of information
Quality (H/M/L)
Variable(s) Year(s) Additional comments
Ethiopian Forestry Action Programme (EFAP) 1994 Ministry of Natural Resources & Environmental Protection
M Report 1992
FRA 2010 – Country Report, Ethiopia
15
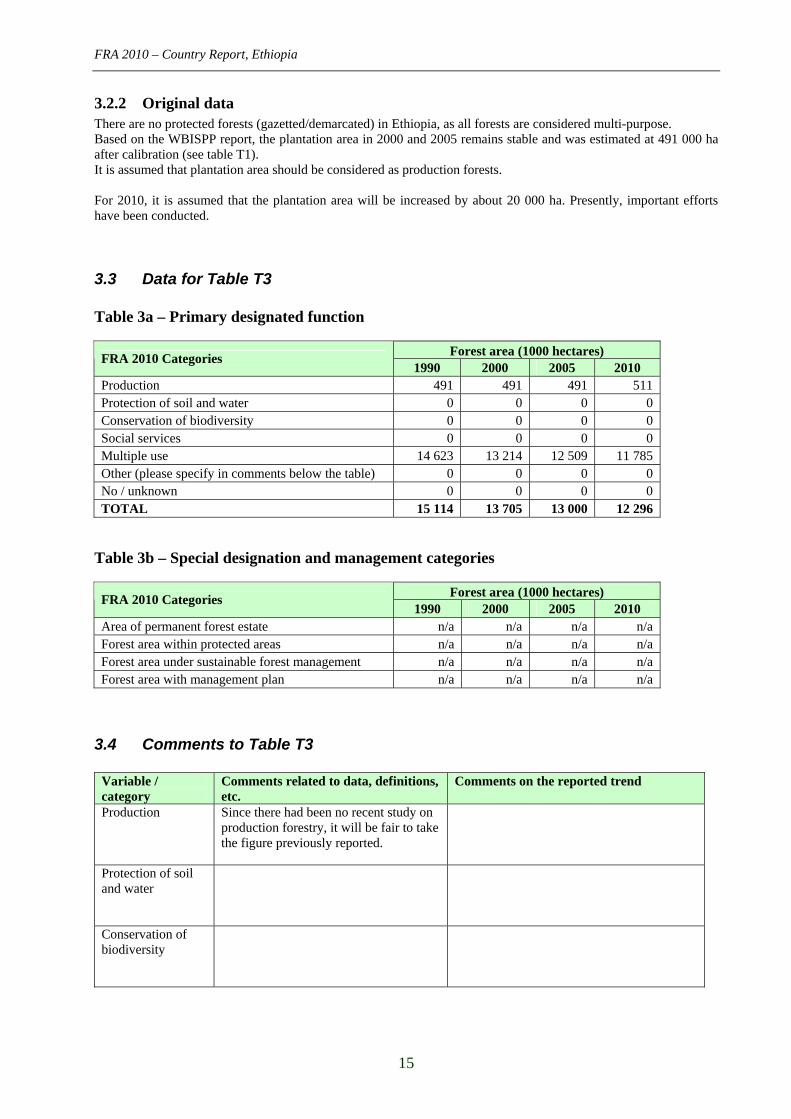
3.2.2 Original data There are no protected forests (gazetted/demarcated) in Ethiopia, as all forests are considered multi-purpose. Based on the WBISPP report, the plantation area in 2000 and 2005 remains stable and was estimated at 491 000 ha after calibration (see table T1). It is assumed that plantation area should be considered as production forests. For 2010, it is assumed that the plantation area will be increased by about 20 000 ha. Presently, important efforts have been conducted.
3.3 Data for Table T3 Table 3a – Primary designated function
Forest area (1000 hectares) FRA 2010 Categories
1990 2000 2005 2010 Production 491 491 491 511 Protection of soil and water 0 0 0 0 Conservation of biodiversity 0 0 0 0 Social services 0 0 0 0 Multiple use 14 623 13 214 12 509 11 785 Other (please specify in comments below the table) 0 0 0 0 No / unknown 0 0 0 0 TOTAL 15 114 13 705 13 000 12 296
Table 3b – Special designation and management categories
Forest area (1000 hectares) FRA 2010 Categories
1990 2000 2005 2010 Area of permanent forest estate n/a n/a n/a n/a Forest area within protected areas n/a n/a n/a n/a Forest area under sustainable forest management n/a n/a n/a n/a Forest area with management plan n/a n/a n/a n/a
3.4 Comments to Table T3
Variable / category
Comments related to data, definitions, etc.
Comments on the reported trend
Production Since there had been no recent study on production forestry, it will be fair to take the figure previously reported.
Protection of soil and water
Conservation of biodiversity
FRA 2010 – Country Report, Ethiopia
16
Social services
Multiple use
Other
No / unknown designation
Area of permanent forest estate
No data available
Forest area within protected areas
No data available
Forest area under sustainable forest management
No data available
Forest area with management plan
No data available
Other general comments to the table
FRA 2010 – Country Report, Ethiopia
17
4 Table T4 – Forest characteristics
4.1 FRA 2010 Categories and definitions
Term / category Definition Naturally regenerated forest Forest predominantly composed of trees established through natural
regeneration. Introduced species A species, subspecies or lower taxon, occurring outside its natural range
(past or present) and dispersal potential (i.e. outside the range it occupies naturally or could occupy without direct or indirect introduction or care by humans).
Characteristics categories Primary forest Naturally regenerated forest of native species, where there are no clearly
visible indications of human activities and the ecological processes are not significantly disturbed.
Other naturally regenerated forest Naturally regenerated forest where there are clearly visible indications of human activities.
Other naturally regenerated forest of introduced species (sub-category)
Other naturally regenerated forest where the trees are predominantly of introduced species.
Planted forest Forest predominantly composed of trees established through planting and/or deliberate seeding.
Planted forest of introduced species (sub-category)
Planted forest, where the planted/seeded trees are predominantly of introduced species.
Special categories Rubber plantations Forest area with rubber tree plantations.
Mangroves Area of forest and other wooded land with mangrove vegetation.
Bamboo Area of forest and other wooded land with predominant bamboo
vegetation.
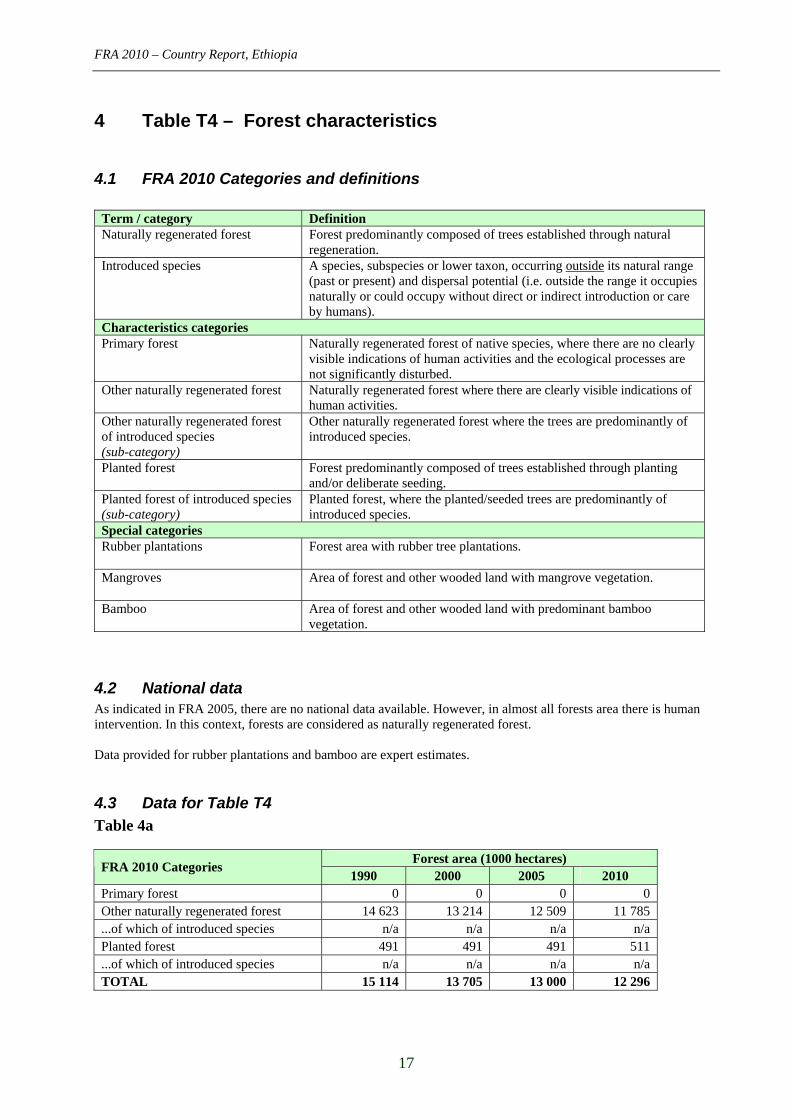
4.2 National data As indicated in FRA 2005, there are no national data available. However, in almost all forests area there is human intervention. In this context, forests are considered as naturally regenerated forest. Data provided for rubber plantations and bamboo are expert estimates.
4.3 Data for Table T4
Table 4a
Forest area (1000 hectares) FRA 2010 Categories
1990 2000 2005 2010 Primary forest 0 0 0 0 Other naturally regenerated forest 14 623 13 214 12 509 11 785 ...of which of introduced species n/a n/a n/a n/a Planted forest 491 491 491 511 ...of which of introduced species n/a n/a n/a n/a TOTAL 15 114 13 705 13 000 12 296
FRA 2010 – Country Report, Ethiopia
18
Table 4b
Area (1000 hectares) FRA 2010 Categories
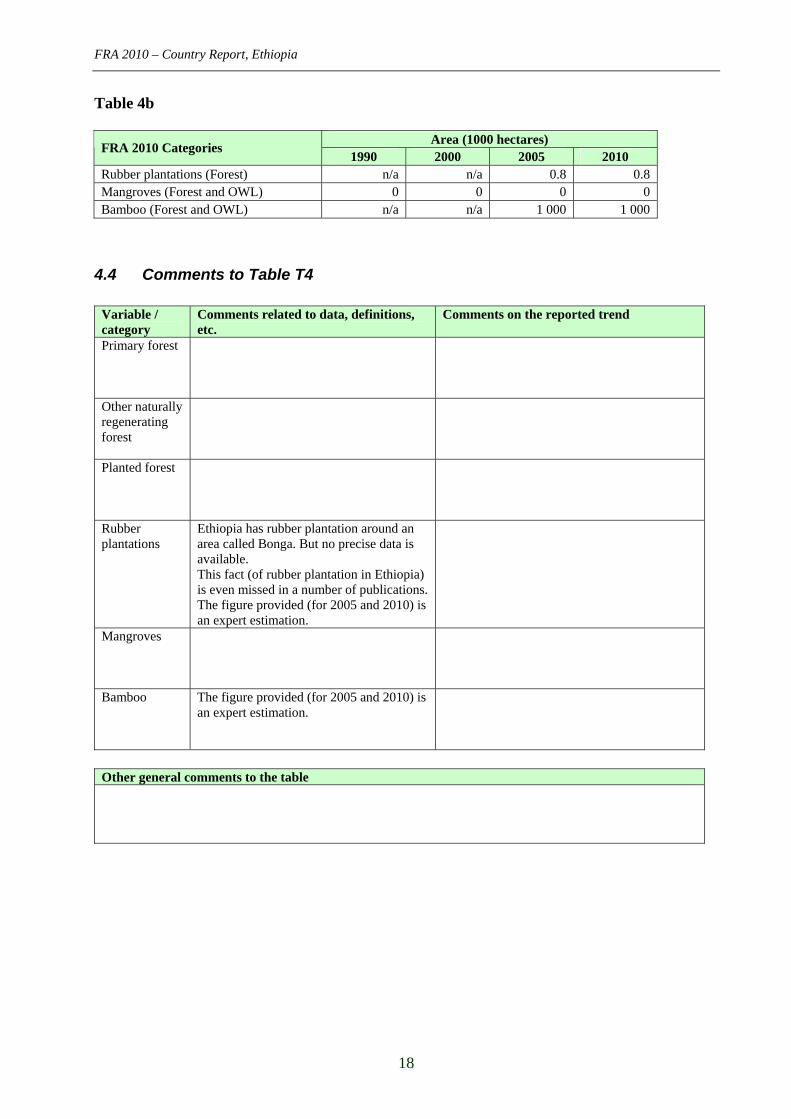
1990 2000 2005 2010 Rubber plantations (Forest) n/a n/a 0.8 0.8 Mangroves (Forest and OWL) 0 0 0 0 Bamboo (Forest and OWL) n/a n/a 1 000 1 000
4.4 Comments to Table T4
Variable / category
Comments related to data, definitions, etc.
Comments on the reported trend
Primary forest
Other naturally regenerating forest
Planted forest
Rubber plantations
Ethiopia has rubber plantation around an area called Bonga. But no precise data is available. This fact (of rubber plantation in Ethiopia) is even missed in a number of publications. The figure provided (for 2005 and 2010) is an expert estimation.
Mangroves
Bamboo The figure provided (for 2005 and 2010) is an expert estimation.
Other general comments to the table
FRA 2010 – Country Report, Ethiopia
19
5 Table T5 – Forest establishment and reforestation
5.1 FRA 2010 Categories and definitions
Term Definition Afforestation Establishment of forest through planting and/or deliberate seeding on
land that, until then, was not classified as forest. Reforestation Re-establishment of forest through planting and/or deliberate seeding on
land classified as forest. Natural expansion of forest Expansion of forests through natural succession on land that, until then,
was under another land use (e.g. forest succession on land previously used for agriculture).
5.2 National data
5.2.1 Data sources
References to sources of information
Quality (H/M/L)
Variable(s) Year(s) Additional comments
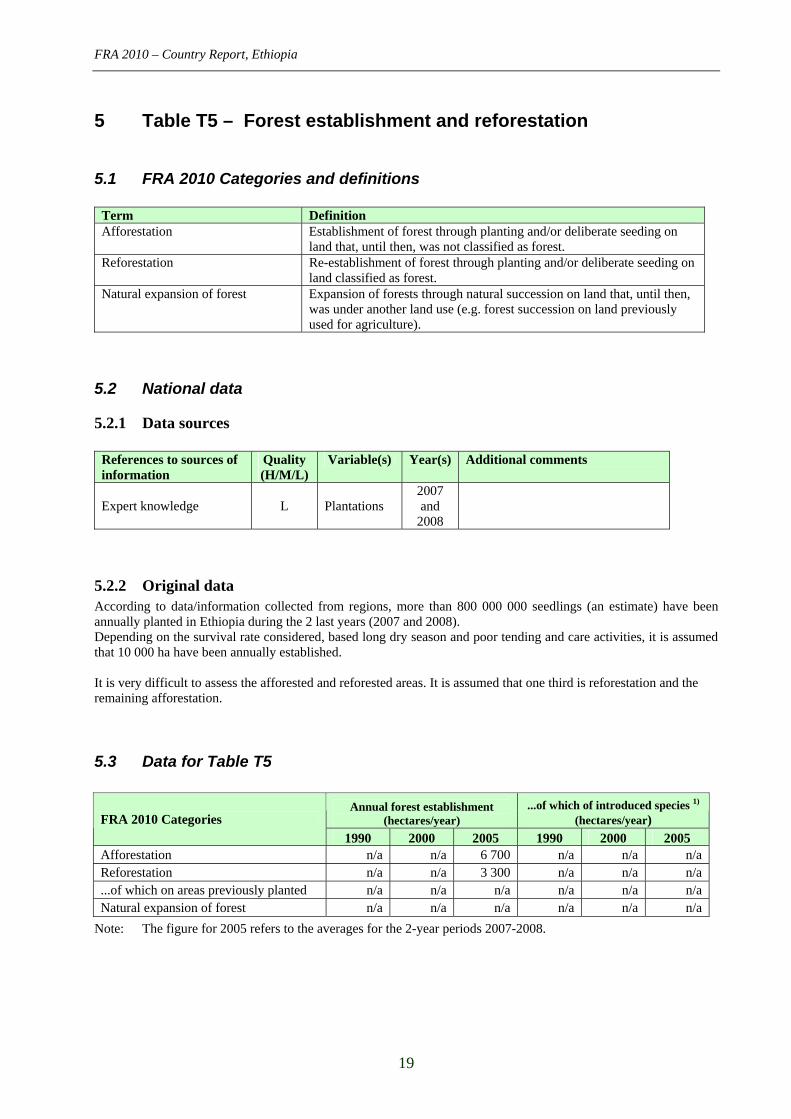
Expert knowledge L Plantations 2007 and
2008
5.2.2 Original data According to data/information collected from regions, more than 800 000 000 seedlings (an estimate) have been annually planted in Ethiopia during the 2 last years (2007 and 2008). Depending on the survival rate considered, based long dry season and poor tending and care activities, it is assumed that 10 000 ha have been annually established. It is very difficult to assess the afforested and reforested areas. It is assumed that one third is reforestation and the remaining afforestation.
5.3 Data for Table T5
Annual forest establishment (hectares/year)
...of which of introduced species 1) (hectares/year) FRA 2010 Categories
1990 2000 2005 1990 2000 2005 Afforestation n/a n/a 6 700 n/a n/a n/a Reforestation n/a n/a 3 300 n/a n/a n/a ...of which on areas previously planted n/a n/a n/a n/a n/a n/a Natural expansion of forest n/a n/a n/a n/a n/a n/a
Note: The figure for 2005 refers to the averages for the 2-year periods 2007-2008.
FRA 2010 – Country Report, Ethiopia
20
5.4 Comments to Table T5
Variable / category
Comments related to data, definitions, etc. Comments on the reported trend
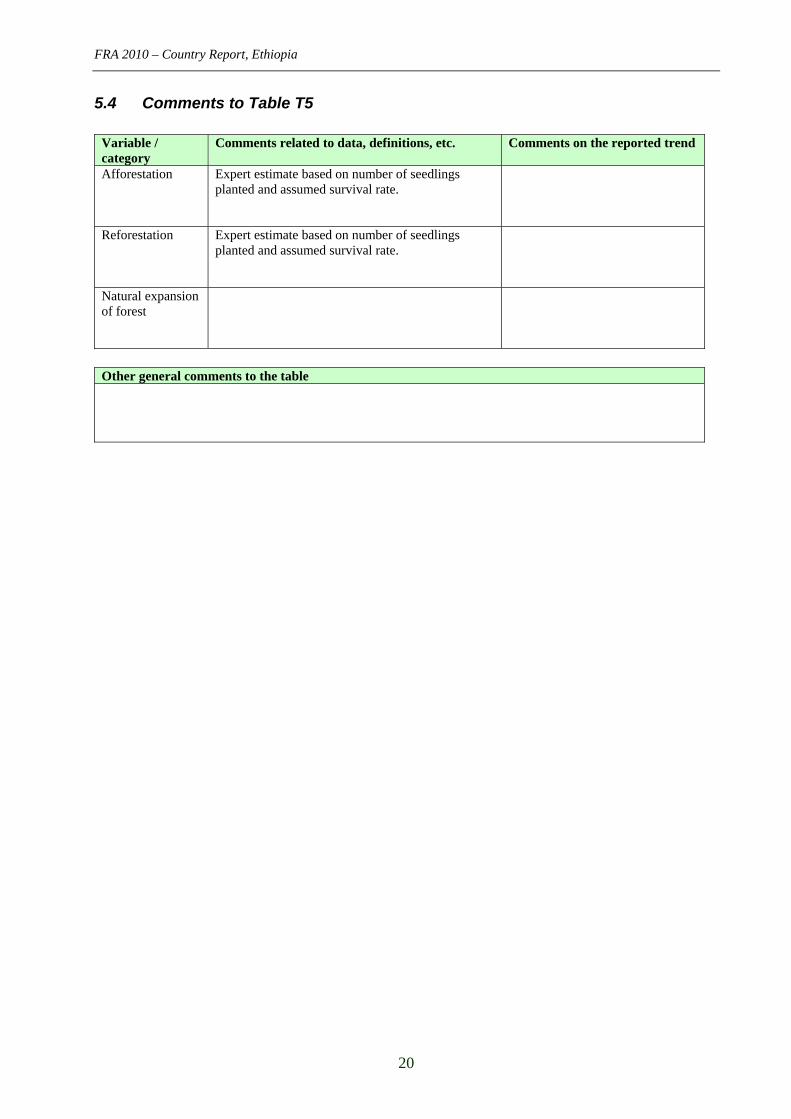
Afforestation Expert estimate based on number of seedlings planted and assumed survival rate.
Reforestation Expert estimate based on number of seedlings planted and assumed survival rate.
Natural expansion of forest
Other general comments to the table
FRA 2010 – Country Report, Ethiopia
21
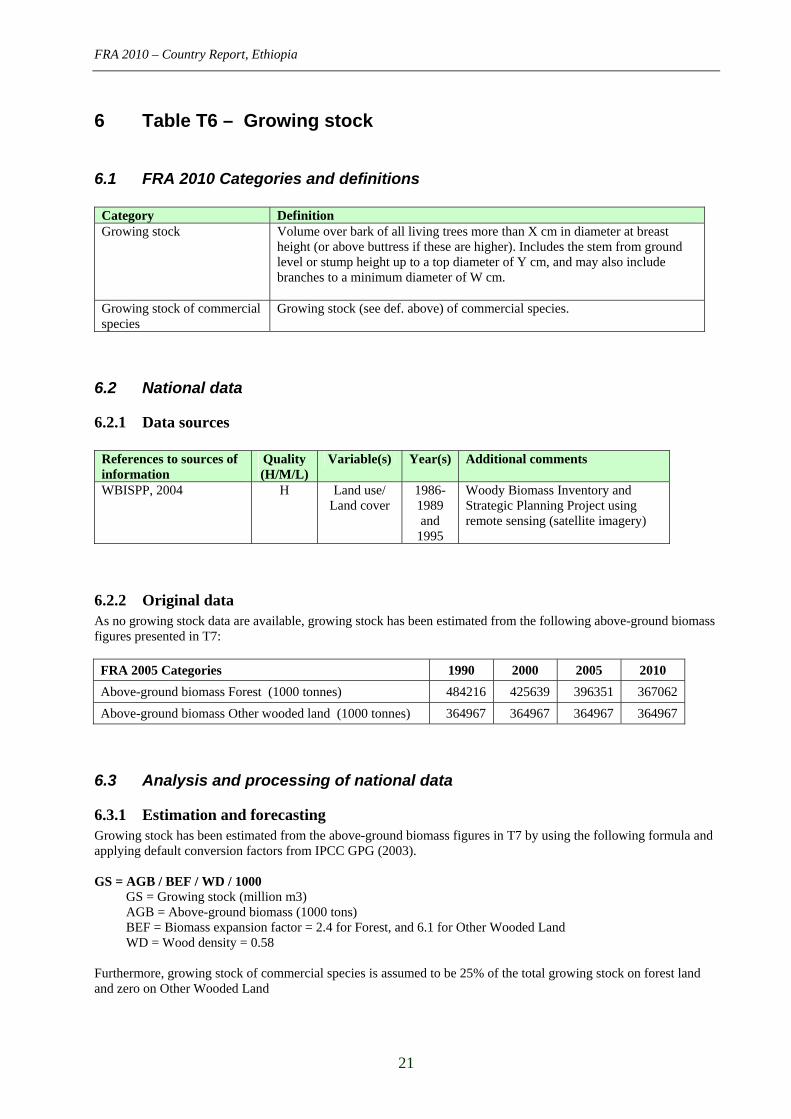
6 Table T6 – Growing stock
6.1 FRA 2010 Categories and definitions
Category Definition Growing stock Volume over bark of all living trees more than X cm in diameter at breast
height (or above buttress if these are higher). Includes the stem from ground level or stump height up to a top diameter of Y cm, and may also include branches to a minimum diameter of W cm.
Growing stock of commercial species
Growing stock (see def. above) of commercial species.
6.2 National data
6.2.1 Data sources
References to sources of information
Quality (H/M/L)
Variable(s) Year(s) Additional comments
WBISPP, 2004 H Land use/ Land cover
1986-1989 and
1995
Woody Biomass Inventory and Strategic Planning Project using remote sensing (satellite imagery)
6.2.2 Original data As no growing stock data are available, growing stock has been estimated from the following above-ground biomass figures presented in T7:
FRA 2005 Categories 1990 2000 2005 2010
Above-ground biomass Forest (1000 tonnes) 484216 425639 396351 367062
Above-ground biomass Other wooded land (1000 tonnes) 364967 364967 364967 364967
6.3 Analysis and processing of national data
6.3.1 Estimation and forecasting Growing stock has been estimated from the above-ground biomass figures in T7 by using the following formula and applying default conversion factors from IPCC GPG (2003). GS = AGB / BEF / WD / 1000
GS = Growing stock (million m3) AGB = Above-ground biomass (1000 tons) BEF = Biomass expansion factor = 2.4 for Forest, and 6.1 for Other Wooded Land WD = Wood density = 0.58
Furthermore, growing stock of commercial species is assumed to be 25% of the total growing stock on forest land and zero on Other Wooded Land
FRA 2010 – Country Report, Ethiopia
22
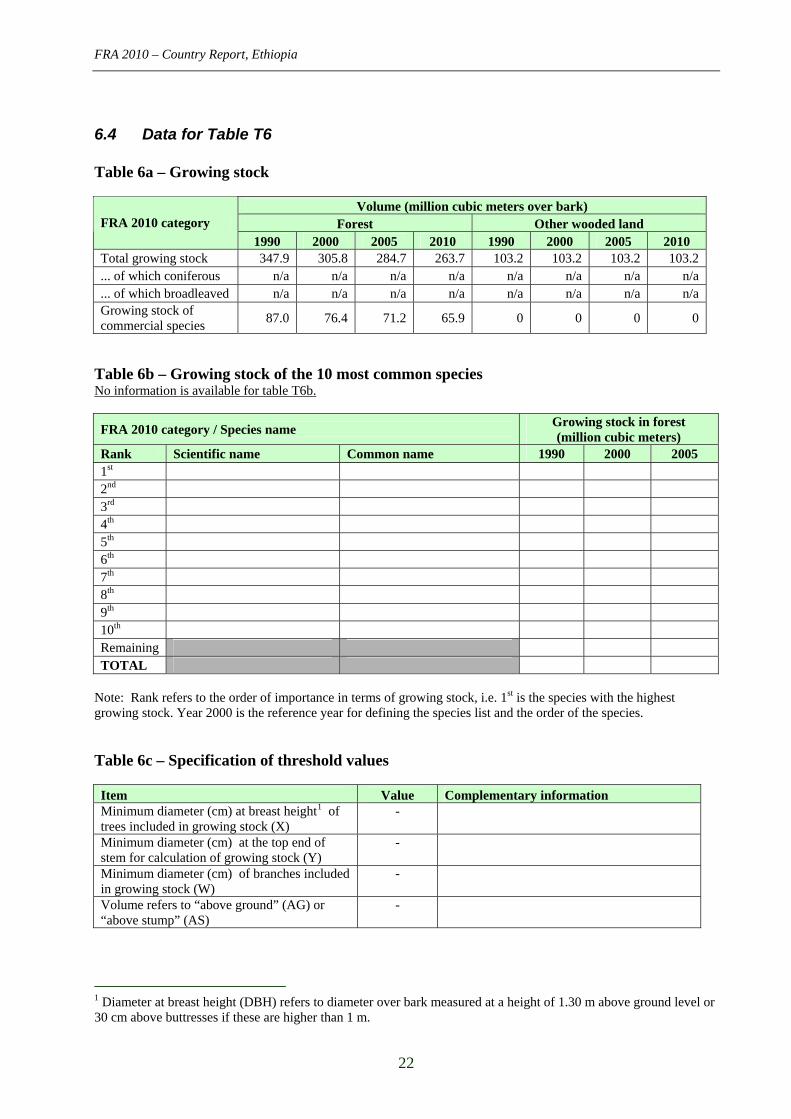
6.4 Data for Table T6 Table 6a – Growing stock
Volume (million cubic meters over bark) Forest Other wooded land FRA 2010 category
1990 2000 2005 2010 1990 2000 2005 2010 Total growing stock 347.9 305.8 284.7 263.7 103.2 103.2 103.2 103.2... of which coniferous n/a n/a n/a n/a n/a n/a n/a n/a ... of which broadleaved n/a n/a n/a n/a n/a n/a n/a n/a Growing stock of commercial species
87.0 76.4 71.2 65.9 0 0 0 0
Table 6b – Growing stock of the 10 most common species No information is available for table T6b.
FRA 2010 category / Species name Growing stock in forest (million cubic meters)
Rank Scientific name Common name 1990 2000 2005 1st 2nd 3rd 4th 5th 6th 7th 8th 9th 10th Remaining TOTAL
Note: Rank refers to the order of importance in terms of growing stock, i.e. 1st is the species with the highest growing stock. Year 2000 is the reference year for defining the species list and the order of the species. Table 6c – Specification of threshold values Item Value Complementary information Minimum diameter (cm) at breast height1 of trees included in growing stock (X)
-
Minimum diameter (cm) at the top end of stem for calculation of growing stock (Y)
-
Minimum diameter (cm) of branches included in growing stock (W)
-
Volume refers to “above ground” (AG) or “above stump” (AS)
-
1 Diameter at breast height (DBH) refers to diameter over bark measured at a height of 1.30 m above ground level or 30 cm above buttresses if these are higher than 1 m.
FRA 2010 – Country Report, Ethiopia
23
6.5 Comments to Table T6
Variable / category
Comments related to data, definitions, etc.
Comments on the reported trend
Total growing stock
Estimated from available data on above-ground biomass using IPCC-GPG default factors.
Growing stock of broadleaved / coniferous
Growing stock of commercial species
Growing stock composition
Other general comments to the table
FRA 2010 – Country Report, Ethiopia
24
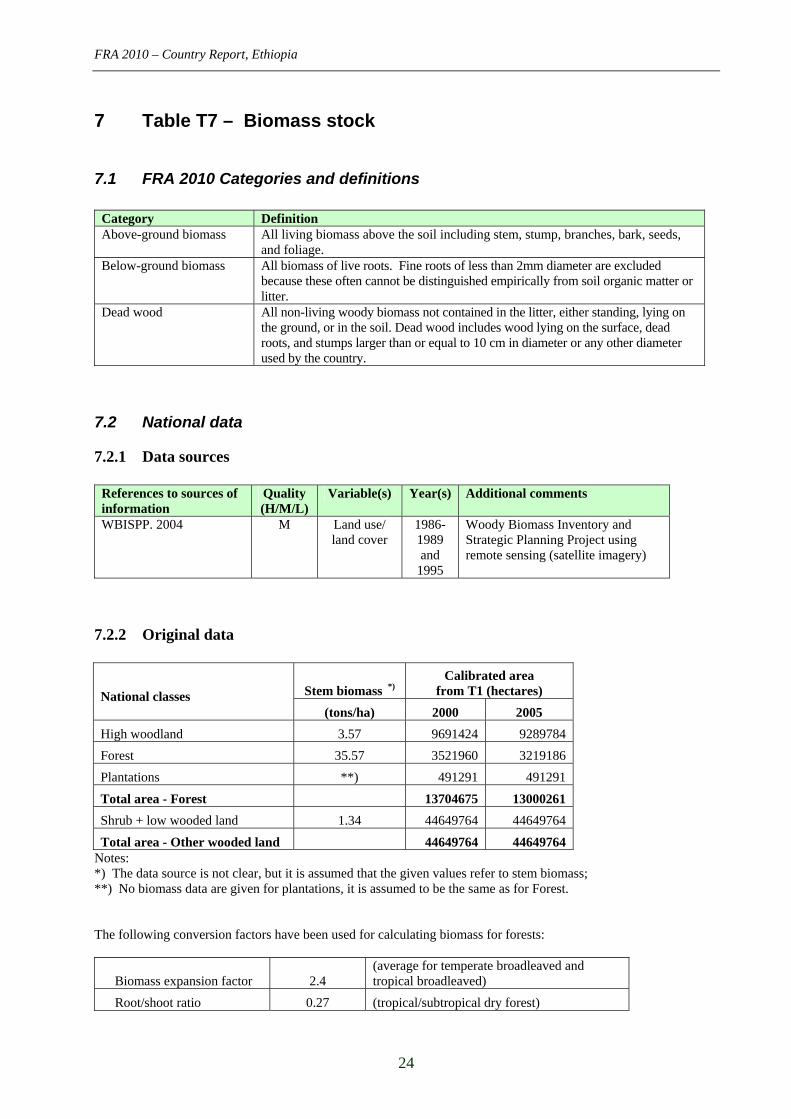
7 Table T7 – Biomass stock
7.1 FRA 2010 Categories and definitions
Category Definition Above-ground biomass All living biomass above the soil including stem, stump, branches, bark, seeds,
and foliage. Below-ground biomass All biomass of live roots. Fine roots of less than 2mm diameter are excluded
because these often cannot be distinguished empirically from soil organic matter or litter.
Dead wood All non-living woody biomass not contained in the litter, either standing, lying on the ground, or in the soil. Dead wood includes wood lying on the surface, dead roots, and stumps larger than or equal to 10 cm in diameter or any other diameter used by the country.
7.2 National data
7.2.1 Data sources
References to sources of information
Quality (H/M/L)
Variable(s) Year(s) Additional comments
WBISPP. 2004 M Land use/ land cover
1986-1989 and
1995
Woody Biomass Inventory and Strategic Planning Project using remote sensing (satellite imagery)
7.2.2 Original data
Stem biomass *) Calibrated area
from T1 (hectares) National classes (tons/ha) 2000 2005
High woodland 3.57 9691424 9289784
Forest 35.57 3521960 3219186
Plantations **) 491291 491291
Total area - Forest 13704675 13000261
Shrub + low wooded land 1.34 44649764 44649764
Total area - Other wooded land 44649764 44649764 Notes: *) The data source is not clear, but it is assumed that the given values refer to stem biomass; **) No biomass data are given for plantations, it is assumed to be the same as for Forest. The following conversion factors have been used for calculating biomass for forests:
Biomass expansion factor 2.4 (average for temperate broadleaved and tropical broadleaved)
Root/shoot ratio 0.27 (tropical/subtropical dry forest)
FRA 2010 – Country Report, Ethiopia
25
The following conversion factors have been used for calculating biomass for shrubs and other woodlands:
Biomass expansion factor 6.1 (average for temperate broadleaved and tropical broadleaved)
Root/shoot ratio 0.48 Tropical Shrubland
7.3 Analysis and processing of national data
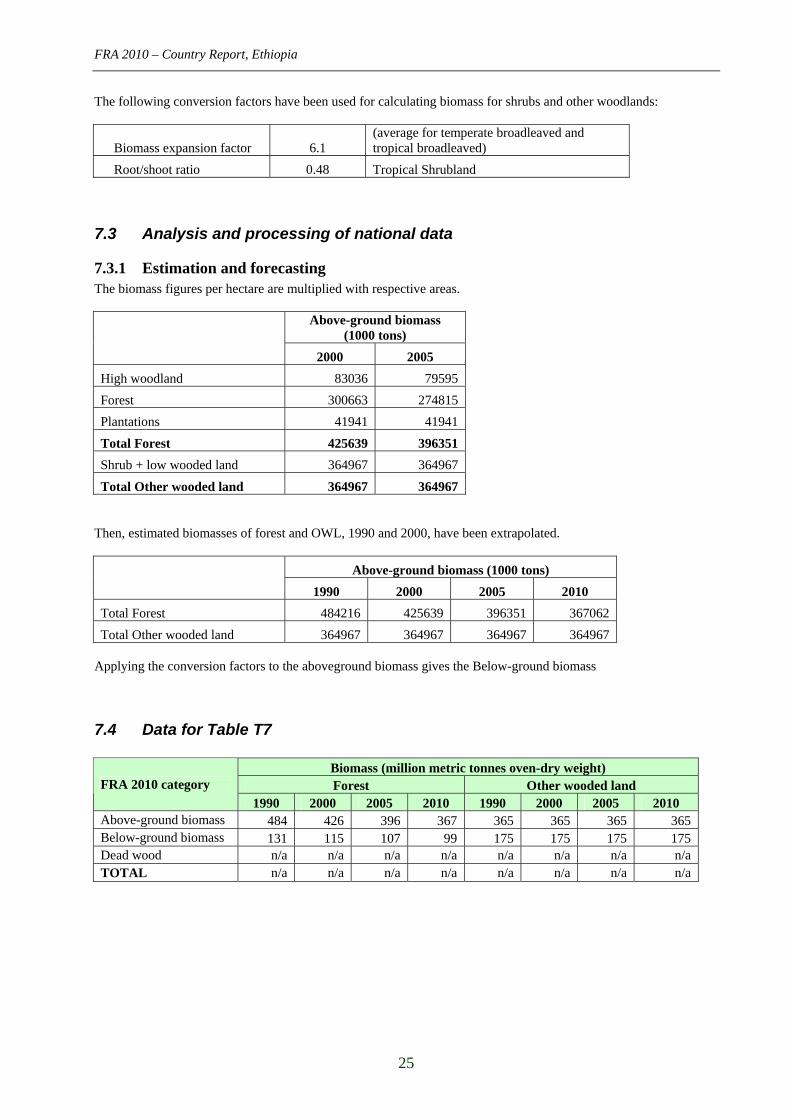
7.3.1 Estimation and forecasting The biomass figures per hectare are multiplied with respective areas.
Above-ground biomass (1000 tons)
2000 2005
High woodland 83036 79595
Forest 300663 274815
Plantations 41941 41941
Total Forest 425639 396351
Shrub + low wooded land 364967 364967
Total Other wooded land 364967 364967 Then, estimated biomasses of forest and OWL, 1990 and 2000, have been extrapolated.
Above-ground biomass (1000 tons)
1990 2000 2005 2010
Total Forest 484216 425639 396351 367062
Total Other wooded land 364967 364967 364967 364967 Applying the conversion factors to the aboveground biomass gives the Below-ground biomass
7.4 Data for Table T7
Biomass (million metric tonnes oven-dry weight) Forest Other wooded land FRA 2010 category
1990 2000 2005 2010 1990 2000 2005 2010 Above-ground biomass 484 426 396 367 365 365 365 365 Below-ground biomass 131 115 107 99 175 175 175 175 Dead wood n/a n/a n/a n/a n/a n/a n/a n/aTOTAL n/a n/a n/a n/a n/a n/a n/a n/a

FRA 2010 – Country Report, Ethiopia
26
7.5 Comments to Table T7
Variable / category
Comments related to data, definitions, etc.
Comments on the reported trend
Above-ground biomass
Below-ground biomass
Dead wood
Other general comments to the table
FRA 2010 – Country Report, Ethiopia
27
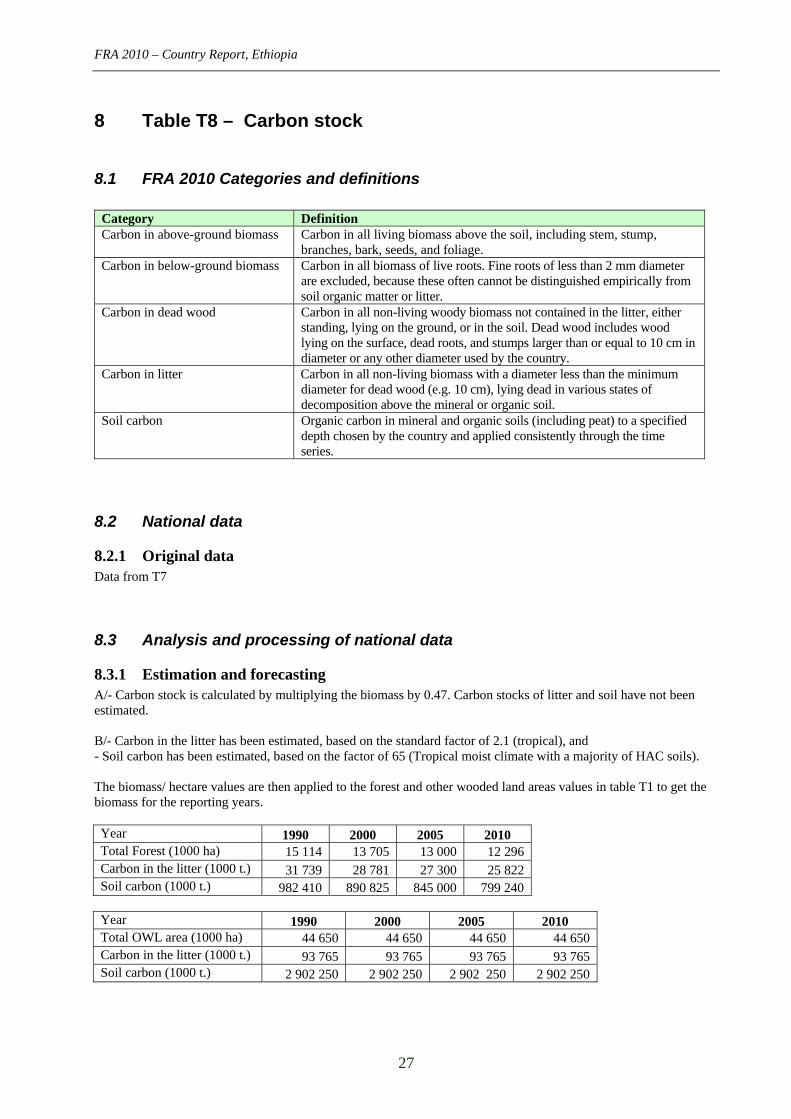
8 Table T8 – Carbon stock
8.1 FRA 2010 Categories and definitions
Category Definition Carbon in above-ground biomass Carbon in all living biomass above the soil, including stem, stump,
branches, bark, seeds, and foliage. Carbon in below-ground biomass Carbon in all biomass of live roots. Fine roots of less than 2 mm diameter
are excluded, because these often cannot be distinguished empirically from soil organic matter or litter.
Carbon in dead wood Carbon in all non-living woody biomass not contained in the litter, either standing, lying on the ground, or in the soil. Dead wood includes wood lying on the surface, dead roots, and stumps larger than or equal to 10 cm in diameter or any other diameter used by the country.
Carbon in litter Carbon in all non-living biomass with a diameter less than the minimum diameter for dead wood (e.g. 10 cm), lying dead in various states of decomposition above the mineral or organic soil.
Soil carbon Organic carbon in mineral and organic soils (including peat) to a specified depth chosen by the country and applied consistently through the time series.
8.2 National data
8.2.1 Original data Data from T7
8.3 Analysis and processing of national data
8.3.1 Estimation and forecasting A/- Carbon stock is calculated by multiplying the biomass by 0.47. Carbon stocks of litter and soil have not been estimated. B/- Carbon in the litter has been estimated, based on the standard factor of 2.1 (tropical), and - Soil carbon has been estimated, based on the factor of 65 (Tropical moist climate with a majority of HAC soils). The biomass/ hectare values are then applied to the forest and other wooded land areas values in table T1 to get the biomass for the reporting years. Year 1990 2000 2005 2010 Total Forest (1000 ha) 15 114 13 705 13 000 12 296 Carbon in the litter (1000 t.) 31 739 28 781 27 300 25 822 Soil carbon (1000 t.) 982 410 890 825 845 000 799 240
Year 1990 2000 2005 2010 Total OWL area (1000 ha) 44 650 44 650 44 650 44 650 Carbon in the litter (1000 t.) 93 765 93 765 93 765 93 765 Soil carbon (1000 t.) 2 902 250 2 902 250 2 902 250 2 902 250
FRA 2010 – Country Report, Ethiopia
28
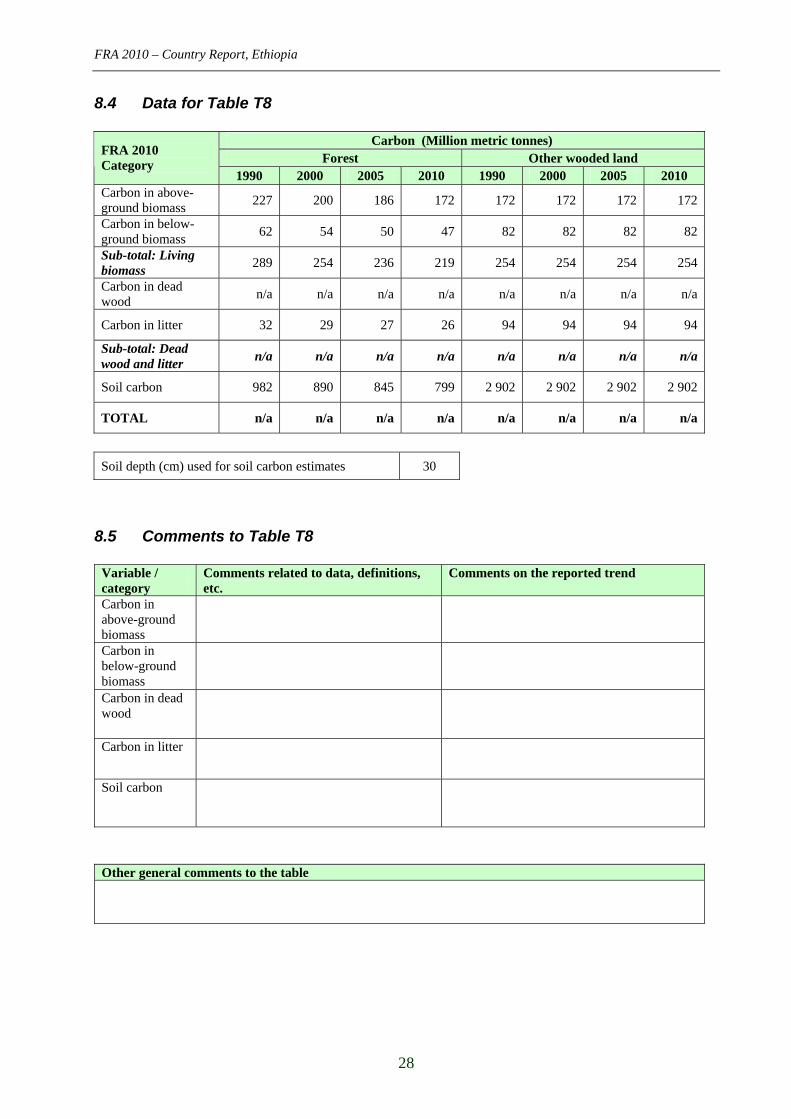
8.4 Data for Table T8
Carbon (Million metric tonnes) Forest Other wooded land
FRA 2010 Category
1990 2000 2005 2010 1990 2000 2005 2010 Carbon in above-ground biomass
227 200 186 172 172 172 172 172
Carbon in below-ground biomass
62 54 50 47 82 82 82 82
Sub-total: Living biomass
289 254 236 219 254 254 254 254
Carbon in dead wood
n/a n/a n/a n/a n/a n/a n/a n/a
Carbon in litter 32 29 27 26 94 94 94 94
Sub-total: Dead wood and litter
n/a n/a n/a n/a n/a n/a n/a n/a
Soil carbon 982 890 845 799 2 902 2 902 2 902 2 902
TOTAL n/a n/a n/a n/a n/a n/a n/a n/a
Soil depth (cm) used for soil carbon estimates 30
8.5 Comments to Table T8
Variable / category
Comments related to data, definitions, etc.
Comments on the reported trend
Carbon in above-ground biomass
Carbon in below-ground biomass
Carbon in dead wood
Carbon in litter
Soil carbon
Other general comments to the table
FRA 2010 – Country Report, Ethiopia
29
9 Table T9 – Forest fires No data available for this table. It could be noted that in 2008 the fire affected 16 163 ha of land in the autonomous region of Oromiya.
10 Table T10 – Other disturbances affecting forest health and vitality
No data available for this table. Some seasonal outbreaks of disease had been noticed on "Cupressus lusitanica". But still the exact affected area is not known. There are certain woodland areas in Eastern Ethiopia where "Prosopis juliflora" is causing some socio-cultural damage. But the exact extent of area affected by this invasive woody species and the magnitude of damage is not known exactly. That needs its own detailed study.
FRA 2010 – Country Report, Ethiopia
30
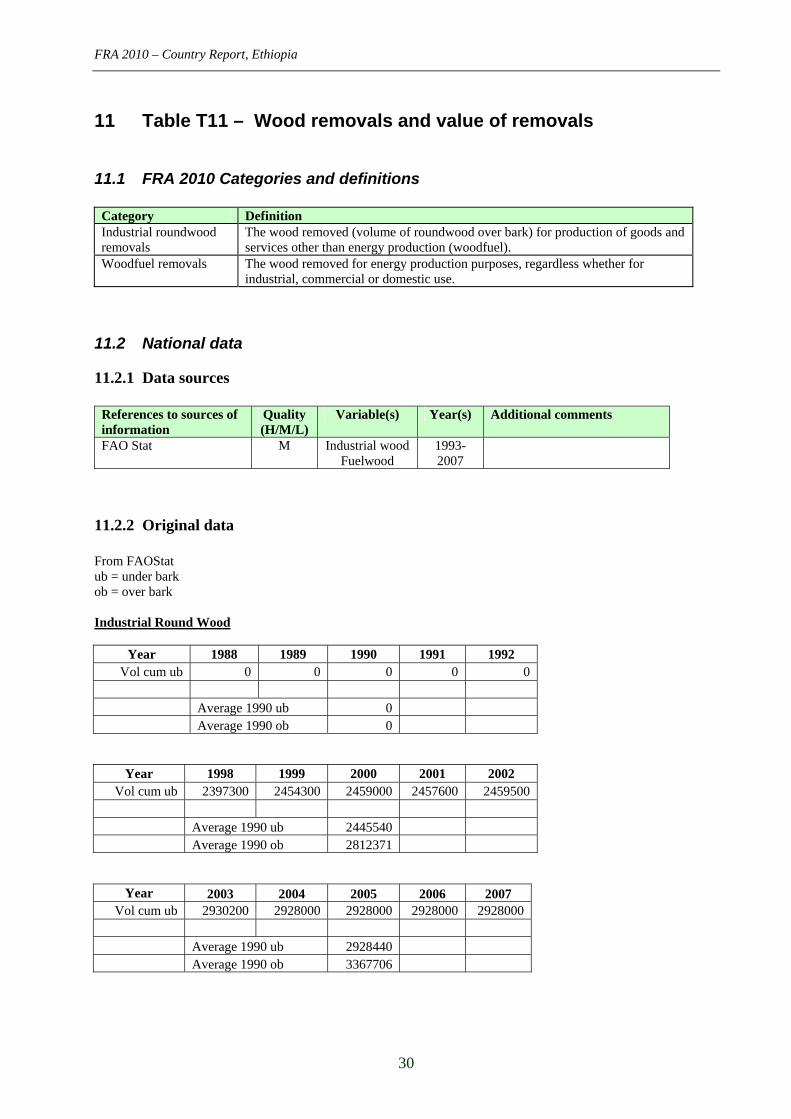
11 Table T11 – Wood removals and value of removals
11.1 FRA 2010 Categories and definitions
Category Definition Industrial roundwood removals
The wood removed (volume of roundwood over bark) for production of goods and services other than energy production (woodfuel).
Woodfuel removals
The wood removed for energy production purposes, regardless whether for industrial, commercial or domestic use.
11.2 National data
11.2.1 Data sources
References to sources of information
Quality (H/M/L)
Variable(s) Year(s) Additional comments
FAO Stat M Industrial wood Fuelwood
1993-2007
11.2.2 Original data From FAOStat ub = under bark ob = over bark Industrial Round Wood
Year 1988 1989 1990 1991 1992 Vol cum ub 0 0 0 0 0
Average 1990 ub 0 Average 1990 ob 0
Year 1998 1999 2000 2001 2002 Vol cum ub 2397300 2454300 2459000 2457600 2459500
Average 1990 ub 2445540 Average 1990 ob 2812371
Year 2003 2004 2005 2006 2007 Vol cum ub 2930200 2928000 2928000 2928000 2928000
Average 1990 ub 2928440 Average 1990 ob 3367706
FRA 2010 – Country Report, Ethiopia
31
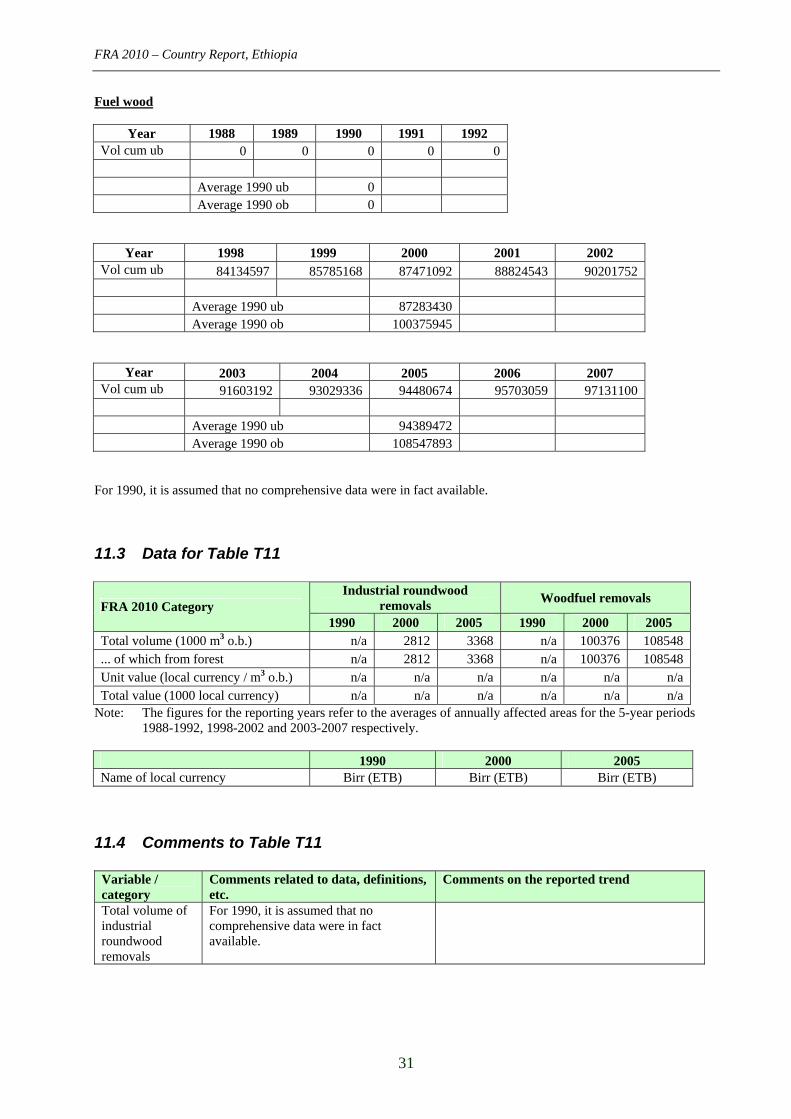
Fuel wood
Year 1988 1989 1990 1991 1992 Vol cum ub 0 0 0 0 0 Average 1990 ub 0 Average 1990 ob 0
Year 1998 1999 2000 2001 2002 Vol cum ub 84134597 85785168 87471092 88824543 90201752 Average 1990 ub 87283430 Average 1990 ob 100375945
Year 2003 2004 2005 2006 2007 Vol cum ub 91603192 93029336 94480674 95703059 97131100 Average 1990 ub 94389472 Average 1990 ob 108547893
For 1990, it is assumed that no comprehensive data were in fact available.
11.3 Data for Table T11
Industrial roundwood removals
Woodfuel removals FRA 2010 Category
1990 2000 2005 1990 2000 2005 Total volume (1000 m3 o.b.) n/a 2812 3368 n/a 100376 108548 ... of which from forest n/a 2812 3368 n/a 100376 108548 Unit value (local currency / m3 o.b.) n/a n/a n/a n/a n/a n/a Total value (1000 local currency) n/a n/a n/a n/a n/a n/a
Note: The figures for the reporting years refer to the averages of annually affected areas for the 5-year periods 1988-1992, 1998-2002 and 2003-2007 respectively.
1990 2000 2005 Name of local currency Birr (ETB) Birr (ETB) Birr (ETB)
11.4 Comments to Table T11
Variable / category
Comments related to data, definitions, etc.
Comments on the reported trend
Total volume of industrial roundwood removals
For 1990, it is assumed that no comprehensive data were in fact available.

FRA 2010 – Country Report, Ethiopia
32
Total volume of woodfuel removals
Data on woodfuel are mainly estimates. To assess and update the situation, national survey is required.
Unit value It is difficult to have a clear idea about the roundwood value, which is between 25 and 40 US$/m3 (according to different expert options).
Total value
Other general comments to the table
FRA 2010 – Country Report, Ethiopia
33
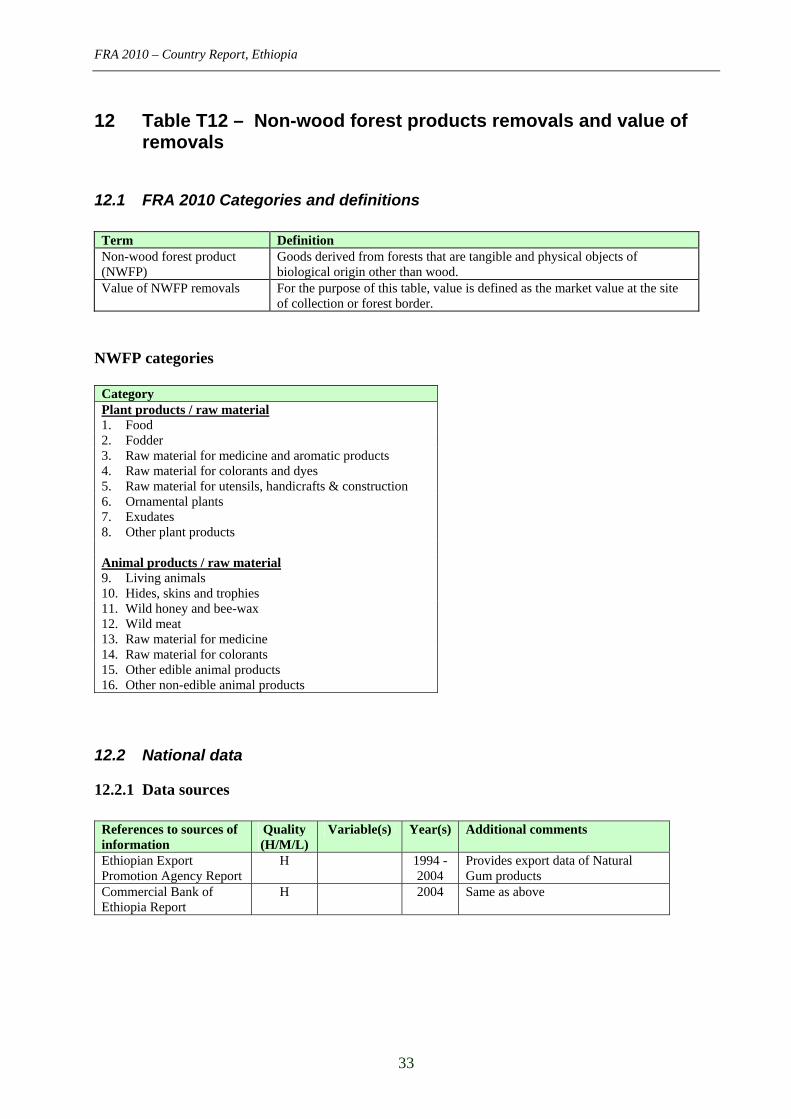
12 Table T12 – Non-wood forest products removals and value of removals
12.1 FRA 2010 Categories and definitions
Term Definition Non-wood forest product (NWFP)
Goods derived from forests that are tangible and physical objects of biological origin other than wood.
Value of NWFP removals For the purpose of this table, value is defined as the market value at the site of collection or forest border.
NWFP categories
Category Plant products / raw material 1. Food 2. Fodder 3. Raw material for medicine and aromatic products 4. Raw material for colorants and dyes 5. Raw material for utensils, handicrafts & construction 6. Ornamental plants 7. Exudates 8. Other plant products Animal products / raw material 9. Living animals 10. Hides, skins and trophies 11. Wild honey and bee-wax 12. Wild meat 13. Raw material for medicine 14. Raw material for colorants 15. Other edible animal products 16. Other non-edible animal products
12.2 National data
12.2.1 Data sources
References to sources of information
Quality (H/M/L)
Variable(s) Year(s) Additional comments
Ethiopian Export Promotion Agency Report
H 1994 -2004
Provides export data of Natural Gum products
Commercial Bank of Ethiopia Report
H 2004 Same as above
FRA 2010 – Country Report, Ethiopia
34
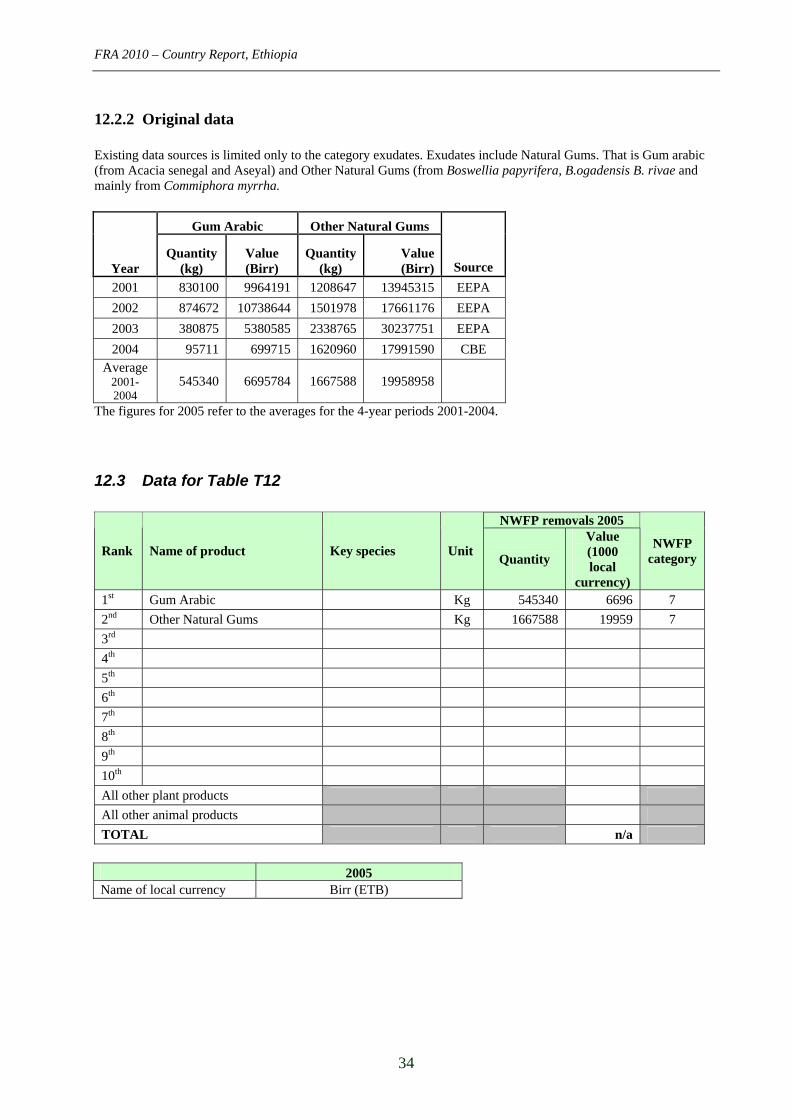
12.2.2 Original data Existing data sources is limited only to the category exudates. Exudates include Natural Gums. That is Gum arabic (from Acacia senegal and Aseyal) and Other Natural Gums (from Boswellia papyrifera, B.ogadensis B. rivae and mainly from Commiphora myrrha.
Gum Arabic Other Natural Gums
Year Quantity
(kg) Value (Birr)
Quantity (kg)
Value (Birr) Source
2001 830100 9964191 1208647 13945315 EEPA
2002 874672 10738644 1501978 17661176 EEPA
2003 380875 5380585 2338765 30237751 EEPA
2004 95711 699715 1620960 17991590 CBE Average
2001-2004
545340 6695784 1667588 19958958
The figures for 2005 refer to the averages for the 4-year periods 2001-2004.
12.3 Data for Table T12
NWFP removals 2005
Rank Name of product Key species Unit Quantity
Value (1000 local
currency)
NWFP category
1st Gum Arabic Kg 545340 6696 7
2nd Other Natural Gums Kg 1667588 19959 7
3rd
4th
5th
6th
7th
8th
9th
10th
All other plant products
All other animal products
TOTAL n/a
2005 Name of local currency Birr (ETB)
FRA 2010 – Country Report, Ethiopia
35
12.4 Comments to Table T12
Variable / category Comments related to data, definitions, etc. 10 most important products
Other plant products
Other animal products
Value by product
Total value
Other general comments to the table

FRA 2010 – Country Report, Ethiopia
36
13 Table T13 – Employment No comprehensive data is available for this table.
FRA 2010 – Country Report, Ethiopia
37
14 Table T14 – Policy and legal framework
14.1 FRA 2010 Categories and definitions
Term Definition Forest policy Forest policy is the set of orientations and principles of actions adopted by
public authorities in harmony with national socio-economic and environmental policies in a given country to guide future decisions in relation to the management, use and conservation of forest and tree resources for the benefit of the society.
Forest law Set of rules enacted by the legislative authority of a country regulating the access, management, conservation and use of forest resources.
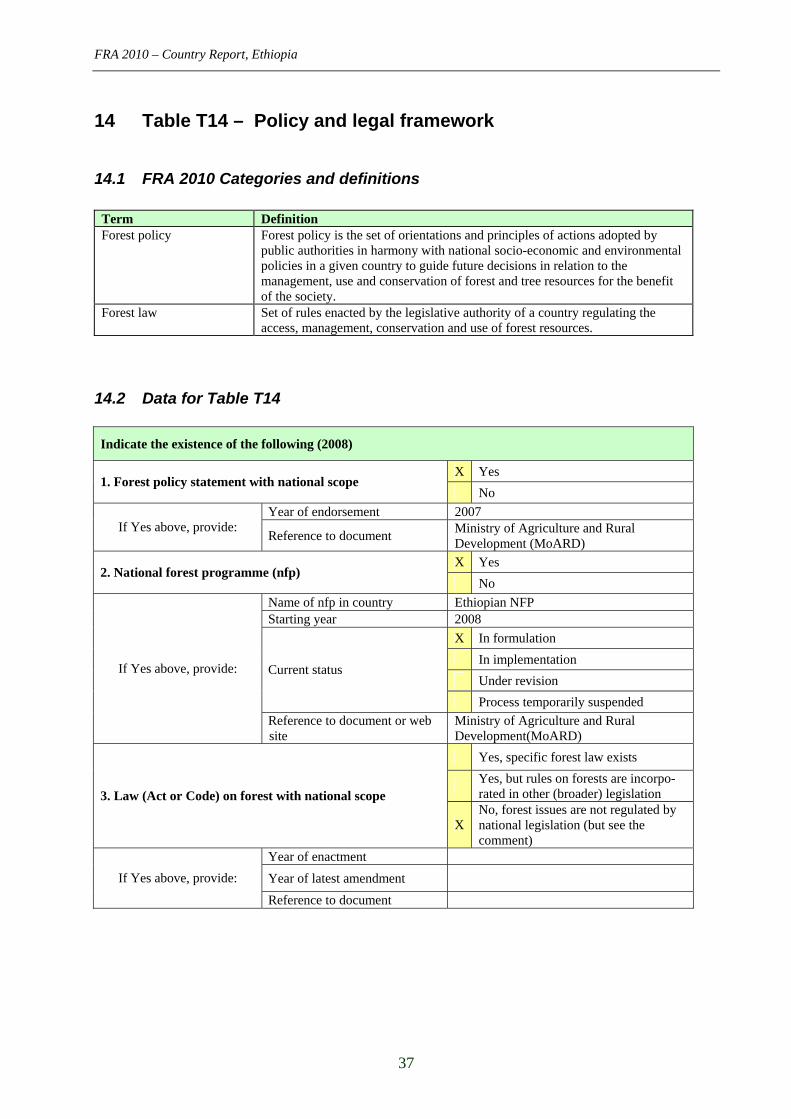
14.2 Data for Table T14
Indicate the existence of the following (2008)
X Yes 1. Forest policy statement with national scope
No
Year of endorsement 2007 If Yes above, provide:
Reference to document Ministry of Agriculture and Rural Development (MoARD)
X Yes 2. National forest programme (nfp)
No
Name of nfp in country Ethiopian NFP Starting year 2008
X In formulation
In implementation
Under revision Current status
Process temporarily suspended
If Yes above, provide:
Reference to document or web site
Ministry of Agriculture and Rural Development(MoARD)
Yes, specific forest law exists
Yes, but rules on forests are incorpo-rated in other (broader) legislation 3. Law (Act or Code) on forest with national scope
X No, forest issues are not regulated by national legislation (but see the comment)
Year of enactment
Year of latest amendment If Yes above, provide:
Reference to document
FRA 2010 – Country Report, Ethiopia
38
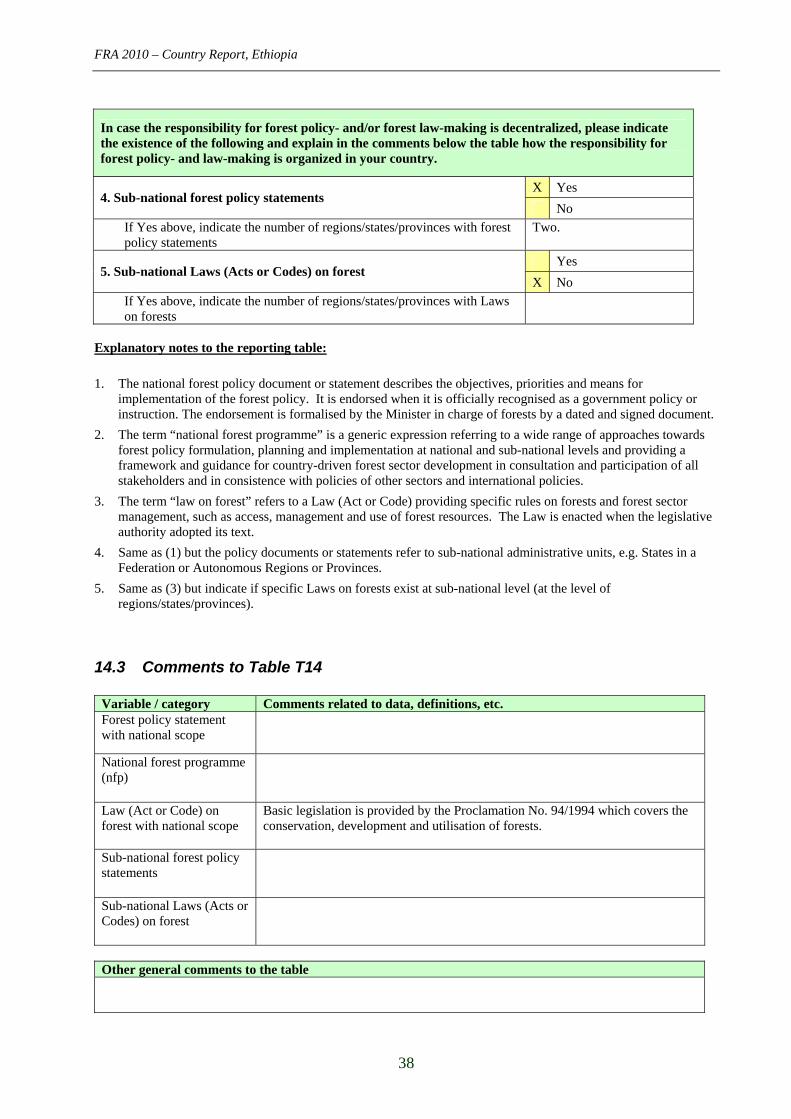
In case the responsibility for forest policy- and/or forest law-making is decentralized, please indicate the existence of the following and explain in the comments below the table how the responsibility for forest policy- and law-making is organized in your country.
X Yes 4. Sub-national forest policy statements
No
If Yes above, indicate the number of regions/states/provinces with forest policy statements
Two.
Yes 5. Sub-national Laws (Acts or Codes) on forest
X No
If Yes above, indicate the number of regions/states/provinces with Laws on forests
Explanatory notes to the reporting table:
1. The national forest policy document or statement describes the objectives, priorities and means for implementation of the forest policy. It is endorsed when it is officially recognised as a government policy or instruction. The endorsement is formalised by the Minister in charge of forests by a dated and signed document.
2. The term “national forest programme” is a generic expression referring to a wide range of approaches towards forest policy formulation, planning and implementation at national and sub-national levels and providing a framework and guidance for country-driven forest sector development in consultation and participation of all stakeholders and in consistence with policies of other sectors and international policies.
3. The term “law on forest” refers to a Law (Act or Code) providing specific rules on forests and forest sector management, such as access, management and use of forest resources. The Law is enacted when the legislative authority adopted its text.
4. Same as (1) but the policy documents or statements refer to sub-national administrative units, e.g. States in a Federation or Autonomous Regions or Provinces.
5. Same as (3) but indicate if specific Laws on forests exist at sub-national level (at the level of regions/states/provinces).
14.3 Comments to Table T14
Variable / category Comments related to data, definitions, etc. Forest policy statement with national scope
National forest programme (nfp)
Law (Act or Code) on forest with national scope
Basic legislation is provided by the Proclamation No. 94/1994 which covers the conservation, development and utilisation of forests.
Sub-national forest policy statements
Sub-national Laws (Acts or Codes) on forest
Other general comments to the table
FRA 2010 – Country Report, Ethiopia
39
15 Table T15 – Institutional framework
15.1 FRA 2010 Categories and definitions
Term Definition Minister responsible for forest policy-making
Minister holding the main responsibility for forest issues and the formulation of the forest policy.
Head of Forestry The Head of Forestry is the Government Officer responsible for implementing the mandate of the public administration related to forests.
Level of subordination Number of administrative levels between the Head of Forestry and the Minister. University degree Qualification provided by University after a minimum of 3 years of post
secondary education.
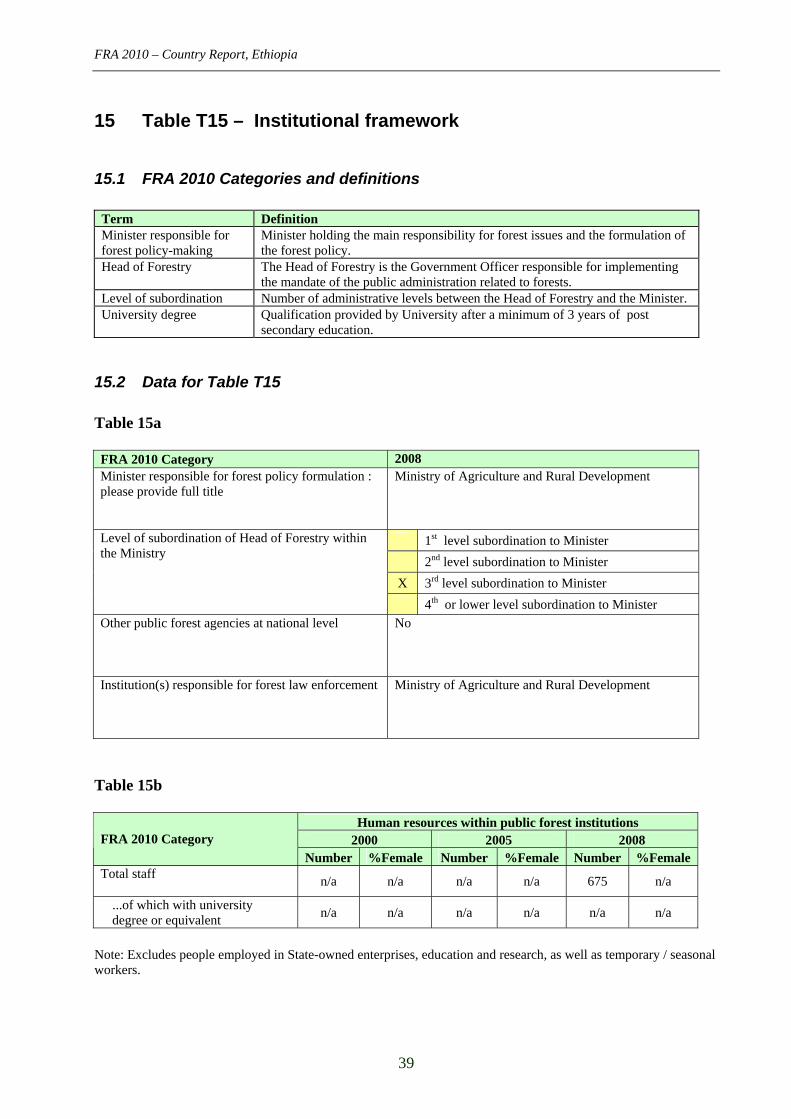
15.2 Data for Table T15 Table 15a FRA 2010 Category 2008 Minister responsible for forest policy formulation : please provide full title
Ministry of Agriculture and Rural Development
1st level subordination to Minister
2nd level subordination to Minister
X 3rd level subordination to Minister
Level of subordination of Head of Forestry within the Ministry
4th or lower level subordination to Minister Other public forest agencies at national level
No
Institution(s) responsible for forest law enforcement
Ministry of Agriculture and Rural Development
Table 15b
Human resources within public forest institutions 2000 2005 2008 FRA 2010 Category
Number %Female Number %Female Number %Female Total staff
n/a n/a n/a n/a 675 n/a
...of which with university degree or equivalent
n/a n/a n/a n/a n/a n/a
Note: Excludes people employed in State-owned enterprises, education and research, as well as temporary / seasonal workers.
FRA 2010 – Country Report, Ethiopia
40
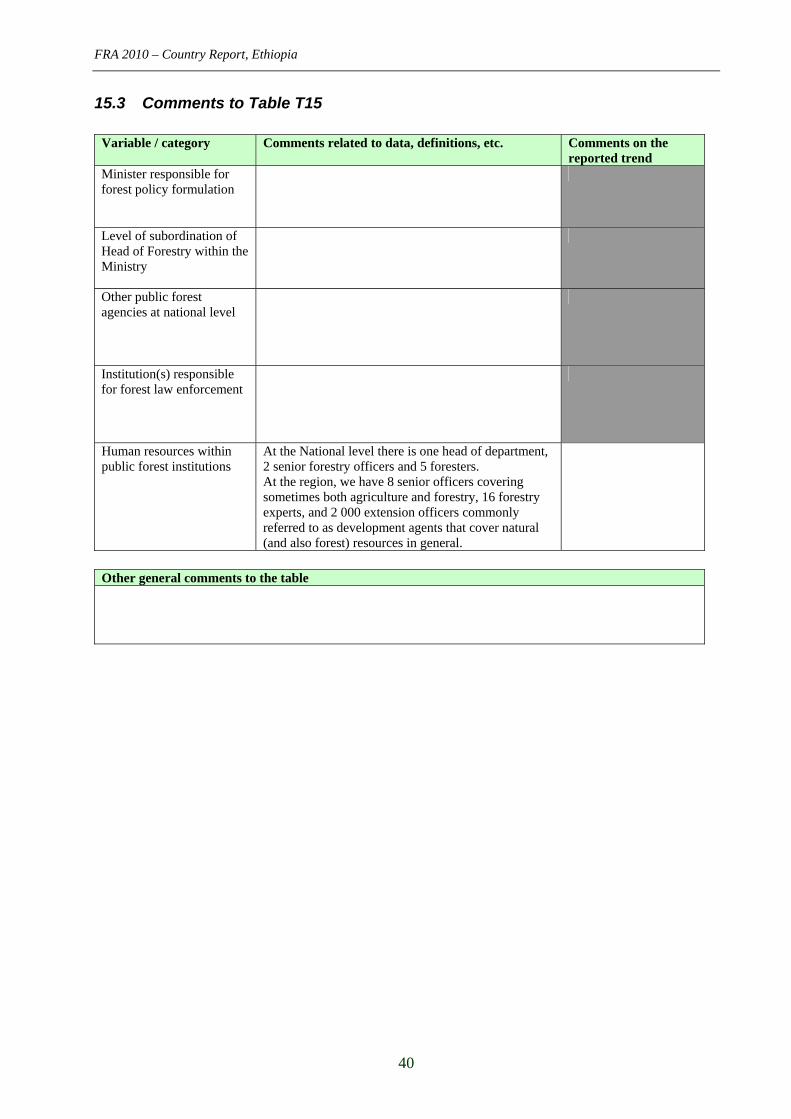
15.3 Comments to Table T15
Variable / category Comments related to data, definitions, etc. Comments on the reported trend
Minister responsible for forest policy formulation
Level of subordination of Head of Forestry within the Ministry
Other public forest agencies at national level
Institution(s) responsible for forest law enforcement
Human resources within public forest institutions
At the National level there is one head of department, 2 senior forestry officers and 5 foresters. At the region, we have 8 senior officers covering sometimes both agriculture and forestry, 16 forestry experts, and 2 000 extension officers commonly referred to as development agents that cover natural (and also forest) resources in general.
Other general comments to the table
FRA 2010 – Country Report, Ethiopia
41
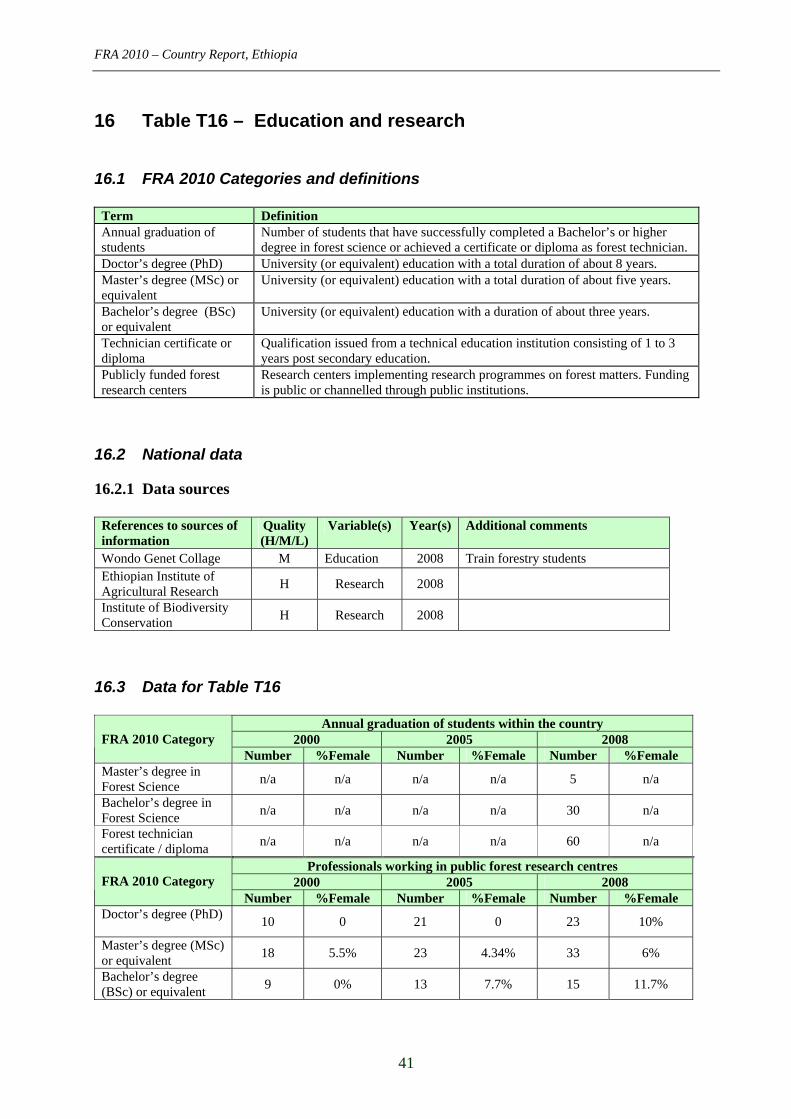
16 Table T16 – Education and research
16.1 FRA 2010 Categories and definitions
Term Definition Annual graduation of students
Number of students that have successfully completed a Bachelor’s or higher degree in forest science or achieved a certificate or diploma as forest technician.
Doctor’s degree (PhD) University (or equivalent) education with a total duration of about 8 years. Master’s degree (MSc) or equivalent
University (or equivalent) education with a total duration of about five years.
Bachelor’s degree (BSc) or equivalent
University (or equivalent) education with a duration of about three years.
Technician certificate or diploma
Qualification issued from a technical education institution consisting of 1 to 3 years post secondary education.
Publicly funded forest research centers
Research centers implementing research programmes on forest matters. Funding is public or channelled through public institutions.
16.2 National data
16.2.1 Data sources
References to sources of information
Quality (H/M/L)
Variable(s) Year(s) Additional comments
Wondo Genet Collage M Education 2008 Train forestry students Ethiopian Institute of Agricultural Research
H Research 2008
Institute of Biodiversity Conservation
H Research 2008
16.3 Data for Table T16
Annual graduation of students within the country 2000 2005 2008 FRA 2010 Category
Number %Female Number %Female Number %Female Master’s degree in Forest Science
n/a n/a n/a n/a 5 n/a
Bachelor’s degree in Forest Science
n/a n/a n/a n/a 30 n/a
Forest technician certificate / diploma
n/a n/a n/a n/a 60 n/a
Professionals working in public forest research centres 2000 2005 2008 FRA 2010 Category
Number %Female Number %Female Number %Female Doctor’s degree (PhD)
10 0 21 0 23 10%
Master’s degree (MSc) or equivalent
18 5.5% 23 4.34% 33 6%
Bachelor’s degree (BSc) or equivalent
9 0% 13 7.7% 15 11.7%
FRA 2010 – Country Report, Ethiopia
42
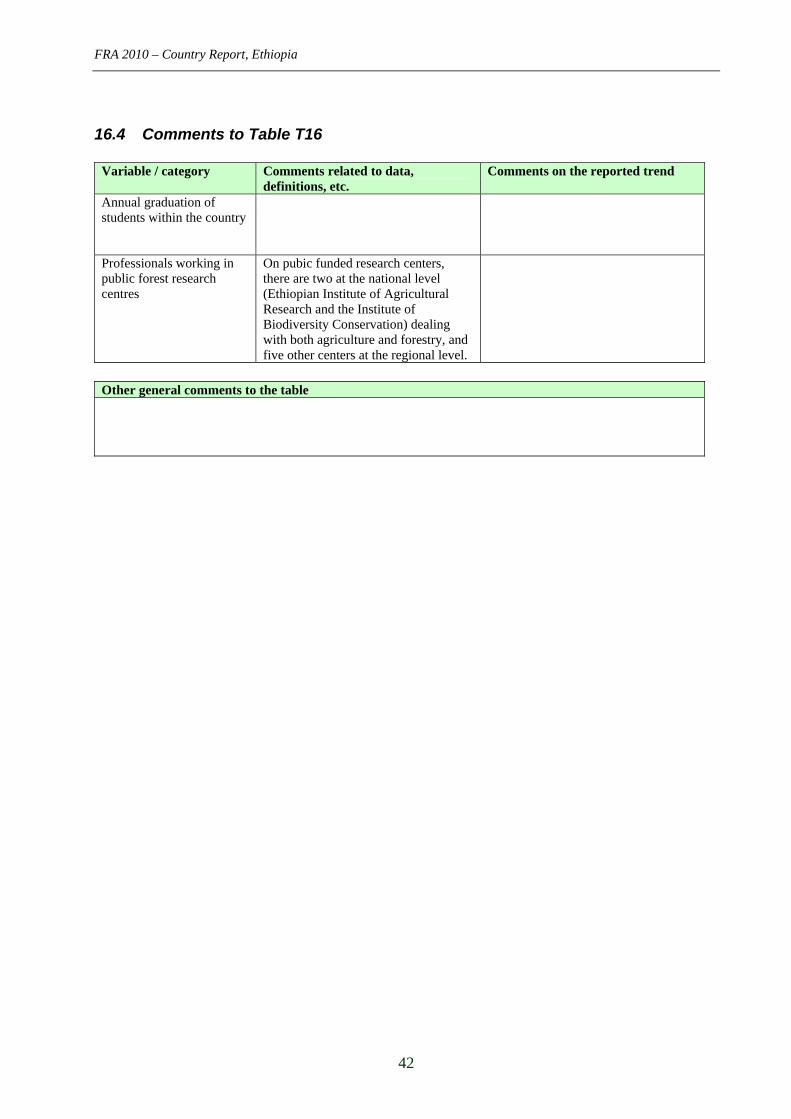
16.4 Comments to Table T16
Variable / category Comments related to data, definitions, etc.
Comments on the reported trend
Annual graduation of students within the country
Professionals working in public forest research centres
On pubic funded research centers, there are two at the national level (Ethiopian Institute of Agricultural Research and the Institute of Biodiversity Conservation) dealing with both agriculture and forestry, and five other centers at the regional level.
Other general comments to the table
FRA 2010 – Country Report, Ethiopia
43
17 Table T17 – Public revenue collection and expenditure No national data is available for this table. Since public revenue collection is done at various levels including regions, it is very difficult to get comprehensive data.