ethnic diversity and firms’ export behavior - ftp.iza.orgftp.iza.org/dp7923.pdf · ethnic...
TRANSCRIPT
DI
SC
US
SI
ON
P
AP
ER
S
ER
IE
S
Forschungsinstitut zur Zukunft der ArbeitInstitute for the Study of Labor
Ethnic Diversity and Firms’ Export Behavior
IZA DP No. 7923
January 2014
Pierpaolo ParrottaDario PozzoliDavide Sala

Ethnic Diversity and Firms’ Export Behavior
Pierpaolo Parrotta Maastricht University
Dario Pozzoli
KORA, Aarhus University and IZA
Davide Sala University of Southern Denmark
Discussion Paper No. 7923 January 2014
IZA
P.O. Box 7240 53072 Bonn
Germany
Phone: +49-228-3894-0 Fax: +49-228-3894-180
E-mail: [email protected]
Any opinions expressed here are those of the author(s) and not those of IZA. Research published in this series may include views on policy, but the institute itself takes no institutional policy positions. The IZA research network is committed to the IZA Guiding Principles of Research Integrity. The Institute for the Study of Labor (IZA) in Bonn is a local and virtual international research center and a place of communication between science, politics and business. IZA is an independent nonprofit organization supported by Deutsche Post Foundation. The center is associated with the University of Bonn and offers a stimulating research environment through its international network, workshops and conferences, data service, project support, research visits and doctoral program. IZA engages in (i) original and internationally competitive research in all fields of labor economics, (ii) development of policy concepts, and (iii) dissemination of research results and concepts to the interested public. IZA Discussion Papers often represent preliminary work and are circulated to encourage discussion. Citation of such a paper should account for its provisional character. A revised version may be available directly from the author.

IZA Discussion Paper No. 7923 January 2014
ABSTRACT
Ethnic Diversity and Firms’ Export Behavior* Selling internationally requires products that resonate with an international customer base and therefore an approach to markets that is in keeping with diverse cultures (i.e., relational capital). As emphasized by international business studies, this relational capital is in turn related to the successful teaming of a diverse workforce, as this process teaches employees to operate in multicultural environments. This knowledge becomes like an intangible asset to which firms can resort, also when engaging in international transactions. We explore this channel empirically, investigating the impact of workforce diversity on firms’ exporting performances and find that ethnic diversity further justifies firms’ different presence in international markets. Since hiring is not a random practice, and firms ultimately select into ethnically different labor forces, we exploit the EU enlargement of 2004 to instrument for the diversity of the pool of workers locally recruitable. Because migrants tend to settle where the attitude toward them is most favorable, we use the median voter’s political ideology at firm’s location to measure the hostility at time of settlement. This gives our instrument spatial variation besides time variation. JEL Classification: J15, F14, F15, F16, D22 Keywords: ethnic diversity, export, EU enlargement, median-voter ideology Corresponding author: Dario Pozzoli KORA, Det Nationale Institut for Kommuners og Regioners Analyse og Forskning Købmagergade 22 1150 København K Denmark E-mail: [email protected]
* Funding from the Danish Council for Independent Research-Social Sciences, Grant no. x12-124857/FSE, and from Swiss NCCR LIVES is gratefully acknowledged. We appreciate comments from Thomas Baranga, Julie Cullen, Gordon Hanson, Harms Philipp, Marc Muendler, Jennifer Poole, Stefano Della Vigna, and participants at numerous seminars and conferences. We thank Yosef Bhatti and Lene Holm Pedersen for providing us with data on Danish elections at the municipality level, and the Tuborg Research Centre for Globalisation and Firms at the School of Business and Social Sciences, Aarhus University, for granting access to the Danish registry data. Registry data build on anonymized micro data sets owned by Statistics Denmark. In the interest of scientific validation of analyses published using DS micro data, the Department of Economics and Business, Aarhus University, will assist researchers in obtaining access to the data set. The usual disclaimer applies.

1 Introduction
The internationalization of a firm is a complex process, and offering products or services
that meet customers’ needs is only part of this process, but the ability to successfully
cater to multicultural environments (relational capital) is equally important when en-
gaging international transactions. The novelty of the paper in relation to international
business studies is that it relates such an ability intrinsically to the ethnical diversity
of firms’ labor forces. Although its effects on team productivity are studied the most,
diversity has also implications for other firm activities.
Mohr and Shoobridge (2011) have conjectured that firms that successfully manage
a diverse workforce contextually form a set of capabilities, meta-competences as they
define them, that also favor their internationalization process. Because a diverse work-
force entails learning how to operate in a multicultural environment, this knowledge
becomes applicable to other scenarios (i.e., international markets) and enables the firm
to, for instance, i) engage opportunely with individuals with different values, norms,
and tastes; ii) understand and target specific customers’ needs and niche markets;
and iii) timely adjust its products to distinct customer and regulatory requirements
in several markets. Within Dunning’s famous OLI framework, attributes of the work-
force become the firm’s source of advantage which contributes to reduce the liabilities
associated with operating in foreign contexts, acting as a proper intangible asset.1
In spite of the importance of social trust and culture in shaping country trade and
FDI flows (Guiso et al., 2009) and of the growing attention of international business
studies to the strategic importance of building internationally diversified teams, in-
ternational economics has devoted only meagre attention to workforce diversity as a
driver for firms’ internationalization. In this paper, we focus on the export status,
the number of destinations and exported products (i.e., market reach), and foreign
1OLI is the acronym for ownership, location, internationalization framework. See Dunning (1977,1981).
2
sales (i.e., market penetration) to measure different aspects of firms’ internationaliza-
tion processes, and we study how they causally relate to a measure of firms’ workforce
(ethnical) diversity.
The direct effect that diversity has on firms’ exporting performance (the “meta-
competence” channel) stems from the development of capabilities that occurs inter-
nally within the firm in the process of managing its labor diversity. These capabilities
permit companies to distill various information about foreign markets and cultures
into an operative knowledge in these markets. This effect goes beyond (without being
antithetical to) the theory of international trade based on high fixed costs of export-
ing (Montagna, 2001; Melitz, 2003), as this form of knowledge has global scope and
is therefore applicable to multiple markets. Its implication is similar to the learning
mechanism underlying the theory of sequential exporting (Albornoz et al., 2012). Ac-
cording to this theory, fledgling exporters use their first international market access as
a “testing ground” to learn about their own profitability and export potential. Because
this process builds the necessary confidence for operating internationally, it generates
knowledge that has a global scope and becomes useful during all subsequent expansions
abroad.2 Likewise, in our context diversity has a global scope and gives firms the expe-
rience required to operate in a multicultural environment and respond more promptly
to new opportunities arising on international markets. The key difference compared
to the sequential exporting theory is that this experience does not form on the first
penetrated international market, but rather on the domestic market, and internally
within the firm.
The relation between diversity and trading, however, does not need to be unidi-
rectional and positive, as this positive direct effect may be offset by other indirect
effects. A large amount of macro and micro evidence points to a similar trade-off:
the development of meta-competences and the increased problem solving potential for
2See p. 18, Albornoz et al. (2012).
3

creative decisions may be lost to the increased communication difficulties and distrust
arising from the clash of cultures.3 Moreover, both Grossman and Maggi (2000) and
Osborne (2000) show that the relation between diversity and trading is theoretically
ambiguous since technology acts as a mediating factor. Because technology attributes
may command teaming of workers with either different or similar abilities, or because
managing diversity is costly (“bundling costs”), increasing diversity may also hamper
the export performance.
This therefore remains a very interesting empirical question to analyze, with poten-
tially different answers across different countries or sectors. Although interesting, this
question has presumably been held back by the inadequacy of available data. The na-
ture of employer-employee linked data opens to the possibility of analyzing this matter
adequately: We are able to link firm level data not only to accounting information and
worker characteristics but also to custom level transactions for the whole population of
firms and workers between 1995 and 2007. Our estimates suggest, on average, a pos-
itive (and very robust) effect: Increasing the diversity among the employees not only
improves the likelihood of exporting but it also increases the number of destinations
reached or the number of products sold at a given destination.
Because firms are profit maximizing, they are likely to hire workers with specific
profiles non-randomly, self-selecting into specific worker-firm matches and, ultimately,
into different levels of workforce diversity. In the absence of randomized experiments
we rely on IV techniques to deal with this problem and provide causal interpretations
of our estimates.
To construct our instrument we opportunely combine the recent EU enlargement in
2004 with the distribution of political votes across all Danish electoral constituencies.
3See Becker (1957), Lang (1986), Lazear (1998), and (1999) for a negative impact of diversity. SeeHong and Page (2001), and (2004), Berliant and Fujita (2008), Glaeser et al. (2000), Casella andRauch (2003) for a positive impact of divesity. See Alesina and La Ferrara (2005) for a review ofmacro studies.
4

We advocate that EU’s eastward enlargement is out of the influence of a single firm,
yet it affects the availability of diverse workers through the significant abatement of
migration barriers. But it is unlikely that it affects all firms equally, since firms located
in areas mostly hostile to migrant settlements are also benefiting the least from the in-
creased diversity of the local pool of workers. We therefore capture the intensity of the
“EU shock” with the median voter’s ideology at firm’s location under the presumption
that the more open the median voter’s attitude toward immigrants is in a given area,
the more favorable is the environment to immigrant settlement.4 We exploit the spatial
variation in the course of the median voter ideology before and after the enlargement
process to instrument our firm’s diversity index. Our instrumentation strategy is in-
novative in that it uses a methodology inspired by the two-sided linear discontinuity
approach. Although it concerns a different topic, our strategy resembles the approach
followed in some political economy studies (Nannicini et al., 2013; Brollo et al., 2013;
Bordignon et al., 2013).
Our work intersects two strands of the literature: one investigating the economic
effects of (cultural) diversity, the other analyzing the determinants of firms’ internation-
alization. Indeed, genetic or cultural inheritance as well as socialization and migration
processes are all factors contributing to an ethnically diversified workforce within a
country (Bisin and Verdier, 2010). While it is consolidated that productivity deter-
mines firms’ selection into exporting, recent hypotheses have started to investigate
more closely the deliberate efforts undertaken by firms to become exporters (conscious
self-selection). Some studies have explored technological investments or quality up-
grading (Alvarez and Lopez, 2005; Iacovone and Javorcik, 2012), while other studies
have focused on human capital investments with firms building up the right expertise
in preparation for exporting (Sala and Yalcin, 2012; Molina and Muendler, 2013). Our
paper identifies the diversity of the workforce as a driver of internationalization, which
4See Waisman and Larsen (2008).
5

is distinguished from networking. Networking is about prospective exporters using
foreign employees’ knowledge about their country of origin to overcome informational
barriers (Andrews et al., 2011; Hiller, 2013). We design our analysis to discern poten-
tial network effects from the channel, meta-competences, which is the one we are most
interested in.
The paper proceeds in Section 2 with a description of the empirical strategy, and
in Section 3 with a discussion of our measure of diversity of the workforce and of our
instrument. In the same section we also present the firm level data, linguistic data,
and electoral data that we need for our analysis in Section 4. After discussing our
robustness checks, we conclude in Section 5.
2 Empirical strategy
We investigate the relation between ethnic diversity and firms’ export behavior using
the following linear regression model:
yit = α + γethnicit + x′
itβ + ηj + ηk + ηt + ηjt + vit, (1)
where i is the index for the firm and t is the index for time. We shall adopt the notation
where j indicates the industry and k the firm location (i.e., commuting area). y is the
export performance, in terms of export status, or export turnover in logarithm, or
number of markets and destinations. Each outcome describes a different aspect of the
export activity of a company. ethnic is an index of the workforce diversity of a firm,
and x is a column vector of firm and workforce characteristics. While we defer the
discussion of all entries of x and of the methodology for computing ethnic to the next
section, it is important to emphasize here how diversity of the labor force can affect
exports directly.
The hypothesis that we deem most interesting is the one advanced in Mohr and
6

Shoobridge (2011), namely the meta-competence channel. Firms that successfully man-
age a diverse workforce, also develop those core capabilities, meta-competences, that
are required to conduct international transactions with people of different cultures.
Indeed, diversity plays a key role in processing information about foreign markets and
transforming it into operative knowledge for these markets. This type of knowledge is
clearly non-rival and is consequently applicable to all markets (i.e., global scope), but
is excludable to other firms. Therefore, it becomes an intangible asset of the firm like
patents or blue prints are.
However, diversity can in some realities exacerbate emotional conflicts among em-
ployees and hinder their performance or communication, but also, in other circum-
stances, improve the problem-solving capacity and creativity of working teams (Barkema
and Shvyrkov, 2007). Without neglecting the importance of these effects, we assume
that they affect exporting only indirectly through (lagged) productivity, which we shall
always include in x.5 Diversity can also be confounded with plausible network effects,
as firms may be hiring people with specific backgrounds with the intention to start
exporting to specific destinations. To discern the effects of hiring a mix of diverse
workers from hiring a specific group of foreigners, we include in our vector x also the
shares of foreign employees with common ethnic backgrounds in some of our regres-
sions. We furthermore account for unobserved confounding factors in all regressions
with industry (ηj), location (ηk), and time (ηt) fixed effects as well as industry-time
(ηjt) fixed effects. In the fixed effects panel regressions, the error term vit is assumed
to be composed of a time-invariant firm specific ui and an idiosyncratic component εit.
The meta-competence channel suggested in Mohr and Shoobridge (2011) may take
time to build. By taking the current level of diversity rather than a lagged value, we
are, if anything, underestimating the effects. However, we abstain from taking lags to
avoid a plausible simultaneity with lagged productivity.
5See also Parrotta et al. (2014).
7

We exploit our custom data to round off the exporting performances of a firm, and
investigate the firm’s pervasiveness in a specific market in terms of the log of export
sales or number of products sold at each destination. Our regression line changes to
yitd = α + γethnicit + x′
itβ + ηj + ηk + ηt + ηjt + ηd + vitd (2)
as the outcome becomes destination specific, and we add destination fixed effects (ηd).
While the latter can account for idiosyncratic shocks at destinations, they cannot
capture plausible spillover effects occurring in the domestic market. Indeed, both
employees with origins from d and firms within the same industry already exporting
into d may be valuable sources to reduce the liability to trade with these countries. To
control for these possible network effects in our analysis, we include in our vector of
firm characteristics two additional variables: the number of foreign employees from each
export destination (employee network) and the number of firms in the same industry
that export to the same destination (firm network).6
When the export status is our dependent variable in (1), we estimate our coefficients
with the linear probability model (LPM). While such an approach is not obviously in-
ferior to a probit or logit model, at least if the “right” non-linear model is unknown
(Angrist and Pischke, 2010), it eases the comparability of the effects of diversity across
all outcomes considered, and it is more suitable for addressing econometric issues like
endogeneity and omitted variable bias (Miguel et al., 2004).7 This is of extreme impor-
tance in our context: Not only may the diversity of the workforce develop in response
of the internationalization process of a firm (reverse causality), but it may also reflect
specific technology needs of firms (selection). Whether it is sub- or super-modular
technologies (Grossman and Maggi, 2000), technology adoption (Yeaple, 2005), or pro-
6See Krautheim (2012) for such effects.7The linear probability model (LPM) also tends to give better estimates of the partial effects on
the response probability near the center of the distribution of a generic xβ than at extreme values(i.e., close to 0 and 1).
8

duction complementarities between natives and immigrants (Peri and Ottaviano, 2012)
that act as the driver for firm-worker idiosyncrasies, our estimates would be biased
without appropriately addressing these issues.
This discussion leads us to present our IV approach below.
2.1 Instrumental variable approach
The ideal instrument in our context would be a shock external to the firm that would
trigger a change in the diversity of its labor force.
We regard the EU enlargement process of 2004 as having some of the desired prop-
erties in our context. From the perspective of a single enterprise, we can think of it
as an exogenous labor supply shock, as barriers to international labor mobility were
selectively reduced within Europe. Because negotiations were carried at the EU level,
the influence of single Danish firms on the outcome of the whole process is likely irrel-
evant. The best these firms could have hoped for was lobbying at the national level for
introducing (or avoiding) the optional temporary restrictions that each member state
could have resorted to for a maximum period of eight years and which are anyway
subject to approval by the European Commission. Even with such restrictions in place
between 2004 and 2008, the enlargement process meant ample facilitations in obtain-
ing legal working permits for all workers from the new member states. Although the
process was not quite as liberal in Denmark as in Sweden, the UK or Ireland, where
no restrictions applied, our descriptive statistics below show that migrant inflow into
Denmark between 2004 and 2007 was nevertheless substantial, with a greater presence
of temporary and permanent migrants from the new member states.
While such a shock applies to all of Denmark, it is unlike to affect all firms equally.
As migrants prefer to settle in areas where locals’ “attitudes” toward them are histor-
ically less negative (Waisman and Larsen, 2008), we postulate that firms located in
areas that are more open to migrants, become exposed to a more diverse pool of work-
9
ers. “Politically open” areas therefore become the locations where the “intensity of the
shock” is greater. To measure the degree of openness of a given area to the settlement
of migrants, we look at the median voter ideology prevailing in that area. Collecting
election data for the Danish National Parliament all the way back to 1981, we can
therefore infer the median voter’s political position at each electoral constituency from
the political distribution of votes. Opportunely combining this information with the
EU enlargement timing, we can build an instrument that has both time and spatial
variation.
In the data section below, we shall present how exactly electoral cycles map into
years and electoral seats map into a median voter ideology. However, to discuss the
properties of our instrument, it is only important to know that the index of the (local)
attitude toward immigrants (ati), henceforth labelled as ati index, is constructed from
the median voter ideology and comprises at least two electoral outcomes in the last
decade. As an example, the index expressing the attitude toward immigrants in 2004
reflects all preceding elections in the last decade; that is, national elections held in
2001, 1998 and 1994. Likewise, the same index for 1998 constructs the attitude toward
immigrants from the outcomes of elections held in 1994, 1990 and 1988. While the most
recent electoral round reflects the current geographical distribution of the attitude
toward immigrants more accurately (good instrument), we would like our attitude
index to partly reflect the historical local sentiment, too, and therefore also include
past electoral outcomes in the computation of our index.
The identifying assumption for the validity of ati index as an instrument is that the
location of firms should be exogenous, or at least pre-determined, to the distribution of
political votes across Denmark, so that the increase in the foreign labor force in a given
location occurs for factors external to the firm. The example of a worldwide famous
Danish company will help to put things into a context. Our assumption is implying
that a firm like LEGO should not choose its headquarter location in Billund because
10
of political factors (i.e. median voter ideology) but that agglomeration economies or
historical reasons should be more prominent factors in such a choice.8
While we deem such a scenario highly plausible, we recognize that there are in-
stances in which such an assumption is vulnerable to unobservables that we cannot
properly account for. One example will be again clarifying. Assume that firms that
are more inclined to take risks are also more likely to export and to locate in areas
with a more liberal ideology toward foreigners. Under this assumption, the failure
to adequately account for the firm’s attitude toward risk in the analysis would ren-
der a traditional IV strategy invalid. To render our instrument less prone to failures
of our identification assumption, we propose an approach inspired by the regression
discontinuity design.
To motivate our IV strategy, it is instructive to look at Figure 1: For each year
the left panel plots the average firm-level ethnic diversity (averaged across all firms),
and the right panel plots the average index for the attitude toward migrants (across
all locations k). The vertical dashed line marks the EU enlargement year. While it is
clear that on average firms’ labor forces have become increasingly diverse, we note that
average diversity has a jump in 2004 and accelerates its growth with time: It increases
at decreasing rates prior to 2004 and at increasing rates in the post-accession period.
Contextually, the attitude toward immigrants peaks in 2004, after a jump from the
previous year, and inverts its upward trend afterwards.
[Insert Figure 1 about here]
Therefore, similarly to a regression discontinuity design (RDD), our IV strategy can
exploit both the jump and the change in the course of the attitude toward immigrants
8See Fujita and Thisse (2013) on how agglomeration economies determine industrial location.LEGO’s recent opening of a plant in northern Mexico hardly responds to a political consideration,but rather to the company’s need for a timely supply of toys onto US distributors’ shelves at times ofpeak demand around Christmas.
11

around the accession year to explain the changes in firm level diversity. Inspired by
the two-sided linear regression design, we specify the IV first stage as follows:
ethnicit = cons+ δ[ati indexkt ? I(t ≥ 2004)
]+ ζ1 [ati indexkt ? (t− 2004)
]+ζ2
[ati indexkt ? I(t ≥ 2004) ? (t− 2004)
]+ ζ3
[ati indexkt ? I(t ≥ 2004)
]2+ζ4
[ati indexkt ? (t− 2004)
]2+ ζ5
[ati indexkt ? I(t ≥ 2004) ? (t− 2004)
]2+x
′itβ + ηj + ηk + ξit, t ∈ [2001, 2007],
(3)
where ati indexkt measures the “attitudes towards immigrants” in the commuting area
k where firm i is located, and I(t ≥2004) is the post-EU accession dummy. The logic is
that we are using a quadratic polynomial approximation of ati indexkt centered in 2004
to instrument labor diversity at the firm level. The first addendum in the right-hand
side of the equation after the constant term captures the jump of our index in 2004; the
second addendum is the trend of our index; the third addendum is the post-2004 trend
that, as shown in the figure, could potentially differ from the pre-2004 course. The
quadratic terms follow the same logic and simply allow a functional approximation of
higher order. The exogenous regressors and the battery of location and industry fixed
effects complete our specification.
As the variation in the course of ati indexkt around the timing of the “EU shock”
is essential to the success of this method, we restrict time t in equation (3) to a time
window between the election years 2001 and 2007. The longer this window is, the less
likely can the change in diversity be ascribable to the EU enlargement, and the less
precise becomes our ati index as a measure of the attitude towards immigrants around
2004. Spatial variation of the attitude towards immigrants index is also important for
the success of our strategy. In Figures 2 and 3 we map the growth of the local average
firm diversity and attitudes towards immigrants between the triennia 2001-2003 (pre-
EU) and 2005-2007 (post-EU). Even eyeball evidence suggests that the small size of
12
Denmark is not a limiting factor for our analysis as there is considerable variation
across all Danish commuting areas.
[Insert Figures 2 and 3 about here]
The advantage of this formulation over the more traditional IV approach of using
solely ati index as an instrument for diversity is a greater solidity to unobservables.9
To illustrate this point, let us refer again to the example above where firms that are
more prone to risk taking are more likely to export and to locate in politically liberal
areas. To invalidate our identification assumption, it is no longer enough that the
firm’s attitude toward risk is unobservable. Because we are using only the variation of
firms’ labor force diversity explained by the variation of ati index along the time win-
dow centered in 2004, invalidation of our strategy also requires that any unobservable
(e.g., the risk attitude) should have an analogous variation in the same time window
as ati index. While it is likely, as shown in our example, that the unobserved firm’s
attitude toward risk would challenge the validity of a traditional approach to IV, it is
less plausible that the firm’s attitude toward risk changes dramatically in correspon-
dence of our time window, and even less plausible that it changes in the same way as
our instrument around 2004.
One final concern in our approach is the contextual trade liberalization that the
EU enlargement process entails, and that affects exports of firms. Econometrically, we
believe that the post-accession dummy as well as the industry dummies in (3) effectively
capture these effects.10 However, there are also economic reasons to believe that these
effects are of little concern. After the fall of the Iron Curtain, the European Council
in 1993 declared its intention to enlarge the EU to include the Central and Eastern
9To strengthen our identification assumption, in the robustness checks we also drop firms foundedafter the start of our time window in 2001.
10Indeed, including a specific time dummy for the year 2001 to control for trade liberalization andthe introduction of the euro currency does no change any of the results presented below. It is, however,clear from equation (3) that the inclusion of time-fixed effects is not compatible with our specificationof the first stage.
13
European Countries (CEEC). As part of the EU expansion goal, a number of bilateral
agreements, known as European Associations (EAs), facilitated the elimination of trade
barriers between the EU and CEEC countries before accession, and set the date of
January 1, 2002 as the limit for the completion of the liberalization process.11 The
rolling program of reforms in CEEC countries seems to indicate that the trade effects
associated with the EU enlargement were gradually realized before 2004, possibly even
before the start of our time window (2001), “pre-empting”, at least partially, the full
trade potential of the EU extension.
3 Data
Before we can explain our measures for the firms’ labor force diversity and local citizens’
attitudes toward migrants in detail, it is necessary to briefly describe our data and
sources.
3.1 Data sources
Our data has four pillars: firm level data from Danish registries, ethnic and language
data from “Ethnologue: Language of the World”, political ideology data from the
“Manifesto Research Group/Comparative Manifestos Project”, and finally electoral
outcomes data from the Danish parliamentary elections.12 The Ethnologue data is
necessary for our measure of workforce diversity, while data from the Comparative
Manifestos Project and Danish elections are combined together to construct our in-
strument.
11See Baldwin (1995), De Benedictis et al. (2005), and Baas and Bruecker (2011).12But for Danish registry data, all sources are freely available on the web. More details
about “Ethnologue” can be found at “http://www.ethnologue.com”. The Manifesto Researchdata and Danish Election data can be downloaded at “https://manifestoproject.wzb.eu/” and“http://valgdata.ps.au.dk/Kontakt.aspx”, respectively. Danish registry data are exclusively adminis-tered by the official Danish statistical institute, “Statistics Denmark”.
14
Firm level information is collected from different registers: the Integrated Database
for Labor Market Research (IDA), the “Accounting Statistics Registers” (REGN-
SKAB and FIRE ), and the “Foreign Trade Statistics Register” (UDENRIGSHAN-
DELSSTATISTIKKEN ).
IDA is a longitudinal employer-employee register, containing information on the
age, gender, nationality, place of residence and work, education, labor market status,
occupation, and wage of each individual aged 15-74 between 1980 and 2007. The
information is updated once a year in week 48: Apart from deaths and permanent
migration, there is no attrition in the data.
For each firm REGNSKAB and FIRE provide the annual value of capital stock,
the turnover, the industry affiliation, an indicator of foreign ownership, a multi-plant
establishment indicator, the year of establishment, and the possible closure date.13
The “Foreign Trade Statistics Register” shows export-sales, and the number of ex-
ported products at the firm level. These data are available both at specific destinations
and aggregated over all destinations. Exports are recorded in Danish kroner (DKK)
according to the 8-digit Combined Nomenclature as long as the transaction is at least
worth 7500 DKK or involves goods whose weight is at least 1000 kg.14 To make the
classification of products consistent across time and to minimize potential measurement
errors, we aggregate these flows to the 3-digit level.
We exclude firms with fewer than 10 employees to avoid both self-employment and
typical migrant businesses.15 We end up with 14,065 firms over the period 1995-2007
(about 157,586 observations).
Given the linked employee-employer nature of this data, we use individual infor-
13The capital stock comprises the sum of the values (in Danish krone) of land, buildings, machines,equipment and inventory. We deflate all monetary values using the World Bank’s GDP deflator with2000 as the base year.
147500 DKK are about 1000 euros at the time of writing. Since the introduction of the euro currency,the Danish Central Bank has adopted a fixed exchange rate policy vis--vis the euro.
15A similar sampling is implemented in other studies concerning labor diversity and using Danishregister data. See Parrotta et al. (2014) and Marino et al. (2012).
15
mation in IDA to infer (at the firm level) the share of workers with secondary and
post-secondary education (skill1 and skill2 ); the percentage of male employees (men);
the share of blue-collar workers; the share of middle managers and managers; the share
of non-Danish employees (foreigners); and the share of differently aged workers in each
quartile of the firm’s age distribution (age1 to age5 ). Because we can track people
along the years, we can also establish the average tenure of all employees (tenure).
Combining the individual data with the “Ethnologue” data, we also know the share
of foreigner workers with the same ethnical or linguistic background. All in all, this
information is as good as it gets to control for both the composition and the quality of
the firms’ workforce in our vector x in equation (1).
As mentioned above, it is important to account for plausible network effects: em-
ployee network is the share of workers from the same destinations to which a firm
exports, and firm network is the number of firms within the same industry (2 digits)
exporting to the same destination.
It is important to control for the relevant firm characteristics that affect exports, i.e.,
firm size, labor productivity, and the firm’s experience on international markets. Firm
size is the total number of employees that we split into two sub-categories, size1 (10-49
employees), and size2 (50 or more workers); labor productivity is sales per employee
in logarithmic scale. We depart from the typical approach in the literature measuring
the firm’s export experience by means of the lagged export status, and compute, in
any given year, the (cumulative) number of years a firm has been exporting for (export
experience). Indicators for foreign ownership and multi-plant establishment complete
the list of our controls.
The smallest unit of a firm that we can observe is the plant, and we have about
twelve percent multi-plant firms. The variables in IDA described above are observed
for each workplace and have to be aggregated at the firm level. Throughout the text we
16

shall use the words plant and workplace interchangeably.16 We observe the municipality
where each workplace is located, and we assign to the firm the municipality of its
headquarter. For reasons related to our instrumenting strategy, we map firms’ location
into a wider area than municipalities, known as “commuting” areas. The idea behind
such an agglomeration is that people tend to reside and work within these areas: the
local sentiment measured at this geographical unit therefore becomes a good measure
of the hostility faced by migrants at settlement.17
Below we describe in detail the methodology we use to construct the variable of our
interest, ethnic, and our instrumental variable ati index.
3.2 Ethnic diversity
While the percentage of employees with a given nationality is a legitimate description
of the workforce composition, we deem it inadequate to capture two important features
of firms’ workforce ethnic diversity, namely “richness”, the number of ethnic groups
in a workplace, and “evenness”, the balanced distribution of different ethnicities. To
incorporate these dimensions of diversity, we adopt the index of ethnic fragmentation
that Peri and Ottaviano (2006) have proposed to describe the cultural diversity of a
city.18 Defining pswt as the share of foreigners with ethnic background s in workplace w
among the total number of foreigners only (i.e., pswt ≡ foreignersswt/foreignerswt),
we obtain our workforce diversity index, ethnicit, for firm i at time t as
16Occasionally, we also use the words firm and establishment interchangeably.17The commuting areas are identified using a specific algorithm based on the following two criteria:
First, a group of municipalities constitute a commuting area if the interaction within the group ofmunicipalities is high compared to the interaction with other areas; second, at least one municipalityin the area must be a center; i.e., a certain share of the employees living in the municipality mustwork in the municipality, too (Andersen, 2000). In total 50 commuting areas are identified.
18Parrotta et al. (2014) similarly measure ethnic diversity at the firm level.
17

ethnicit =W∑w=1
Nw
Ni
(1−
(S∑
s=1
p2swt
)), (4)
where W is the total number of workplaces belonging to firm i, S is the total number
of ethnic categories, and Nw and Ni are the number of employees in workplace w and
firm i, respectively.19 The ethnic diversity has a minimum value equal to 0 if there is
only one category represented within the workplace, and a maximum value equal to(1− 1
S
)if all linguistic groups are represented equally.20 The term in parenthesis in
the ethnic diversity index represents the probability that two randomly drawn foreign
employees in a workplace belong to different linguistic groups.
We exclude natives from the computation of our shares p to prevent the contamina-
tion of our measure of ethnic diversity with possible networking effects. If a firm hires
specific foreign groups with the purpose of exporting to specific destinations (“network-
ing”), the share of foreigners in the total labor force (natives and foreigners) inexorably
increases, but whether ethnic diversity in the firm improves depends jointly on two fac-
tors: whether the language group of the new hires is new within the firm (richness),
and whether the distribution of groups is altered (evenness).
We identify the employee’s ethnic background with the major language spoken in
her or his country of origin, so that s is a specific language group and S is the collection
of language groups in a given plant (see Appendix A).21 This choice is grounded on the
argument that linguistic distance serves as a good proxy for cultural distance (Guiso et
al., 2009; Adsera and Pytlikova, 2012). Moreover, such an approach avoids the compli-
19Second-generation immigrants are treated as foreigners in the main analysis. However, excludingthe latter in the ethnic diversity does not substantially change our main results.
20When the total number of employees N is lower than the number of linguistic groups S, weadjust the ethnic diversity to take firm size into account. Specifically, we standardize the index for amaximum value equal to (1− 1/N).
21As different language refinements are possible, the language category s in the definition of pswt
corresponds to the third level of the linguistic family tree in the Ethnologue data.
18

cation arising with a nationality-based index weighting each nationality with some sort
of “cultural” distance. Arguably, an Italian and a French employee are culturally closer
than an Italian and a Mongolian. In our computation based on linguistic groups, an
Italian would be closer to a French than to a Mongolian, whereas in a nationality-based
index they would appear equally distant, unless a weighting scheme is introduced.
3.3 Attitudes towards immigrants
As mentioned above, our index for the “attitudes towards immigrants”, ati index, re-
flects the (political) ideology of the median voter in a given commuting area. Our
starting point to define this ideology is looking at the political manifesto of each polit-
ical party running for a Parliament election and at their electoral results. Accordingly,
the “Manifesto Research Group/Comparative Manifestos Project” data is a particu-
larly useful source as it comparatively measures the political preferences of (major)
parties along several ideological dimensions for 25 Western democracies throughout
the postwar period.22
In particular, we focus on a restricted number of ideology dimensions, about 12 out
of 25, that pertain to immigrants, internationalization and ethnic diversity. Appendix
B reports the precise statements in the political Manifestos that are interpreted as
being in favor or against immigration along all ideological dimensions analyzed. To
each statement the data assigns a score, so that the sum of scores for all statements
in favor of immigration, id favor, can be interpreted as the percentage of all party
statements that show a positive attitude toward immigration. Likewise, the total score
on statements against immigration, id against, can be interpreted as the share of
statements with a negative attitude toward immigration.
As in Kim and Fording (2001), the party level ideology is then computed as the
22Several scholars in political economy and economics have taken advantage of this database: SeeCongleton and Bose (2010), Pickering and Rockey (2011), Belke and Potrafke (2012).
19
party net ideological position,
id party = (id favor − id against)/(id favor + id against), (5)
a measure bounded between −1 and 1. Accordingly, we can rank all parties in order
of positive attitude toward immigrants (i.e., from the smallest to the highest value of
id party). Along with parties’ percentages of received votes in a given election, we
compute the median voter position in the municipality, m, as follows:
median voterm = L+ [(50− C) /F ] ? W, (6)
where L is the lower end of the interval containing the median ideology score (i.e.,
median id party), C is the cumulative frequency (vote share) up to, but not including,
the interval containing the median, F is the frequency in the interval containing the
median, and W is the width of the interval containing the median.23 By construction,
the political position of the median voterm also takes values between 1 (completely
positive attitude towards immigrants) and -1 (completely negative attitude towards
immigrants). Given that a commuting area where a firm is located comprises multiple
municipalities, we have to aggregate our median voter political position across munic-
ipalities, using the share of voters in each municipality as weights. The median voter
ideology in municipality m within commuting area k in electoral round t is
23The reason why we refer to the interval containing the median is that the distribution of votesis discrete. For example, it is possible that the first two ranked parties account for 30% of votes.If the next ranked party is quite large with a high share of votes, the share of votes will add up tomore than 50%, e.g., 60%, of votes. L is then the ideology score of the second ranked party, and Cis 30%. F is the percentage of votes of the median party (the third ranked party in this example),whereas W is the numerical difference between midpoint-left (the mean between the ideology of themedian party and of the party ranked just before) and midpoint-right (the mean between the ideologyof the median party and of the next ranked party). For more details on the methodology, see Kimand Fording (2001).
20
ati indexkmt =M∑
j = 1, j 6= m
VjtVkt − Vmt
∗median voterjt, j,m ∈ [1, ...,M ] ∈ k, (7)
where Vj is the number of voters in municipality j within commuting area k, and
likewise Vk and Vm is the total number of voters, in, respectively, k and m. It is clear
that when computing the weighted average of the median voter position in the k-th
area for municipality m ∈ k, we are excluding from the summation in (7) both the
voters in and the median voter of municipality m. Such a construction is a way of
dealing with the reflection problem (Manski, 1993), which may occur in the handful of
municipalities in which a particularly large firm is the main employer of the area. In
such instances, the workers of the most prominent firm are mostly residing and voting
in the same municipality as where the firm is located.24 Therefore, the exclusion of
the municipality from our computation avoids that the firm’s native workers are in the
count of voters that determine the value of our instrument.
The ati index therefore varies by municipality (even within the same commuting
area), by commuting area, and by (electoral) year. However, to simplify our notation
and enhance readability we keep using ati indexkt instead of ati indexkmt in the rest
of the paper.
We have collected data on 10 electoral rounds, from the most recent in 2007 all the
way back to 1981.25 In the years between two electoral rounds, our ati index takes
24The firm “Danfoss” located in Nordborg, Denmark, is a good example of this situation. Becausethe municipality level is the smallest administrative unit observed in the data, there would be no prac-tical solution to attenuate the reflection problem if we had conducted our analysis at the municipalitylevel. Whether we account for the reflection problem or not hardly has an impact on our estimates.
25The election years were 1981, 1984, 1987, 1988, 1990, 1994, 1998, 2001, 2005, and 2007. TheDanish parties covered for these electoral rounds are: New Alliance (2007), Left Socialist Party (1981-1984), Danish Communist Party (1981-1984), Common Course (1987), Red-Green Unity List (1994-2007), Socialist People’s Party (1981-2007), Social Democratic Party (1981-2007), Centre Democrats(1998, 2005), Radical Party (1981-2007), Liberals (1981-2007), Christian People’s Party (1981-2005),Conservative People’s Party (1981-2007), Danish People’s Party (1998-2007), Progress Party (1981-1997) and Justice Party (1981-1984).
21
the same value as in the past closest round: Along time, it is therefore a step-wise
function. As mentioned above, we take the ten-year moving average of ati index in
(7), which we denoted ati indexkt, as our instrument. The moving average ensures
that the median voter position always reflects at least two standard mandates in the
past decade, so that its value in the two most recent electoral rounds (2007, 2005)
also relates to a historical attitude toward migrants and not just to the recent inflow
of people from the new EU accession countries. Likewise, it is desirable that the
index does not reflect the outcome of current Danish governmental policies aiming at
enhancing integration. Since ideology typically affects governmental actions with some
lags, taking past lags into account supports some sort of Granger causality from our
ati indexk to governmental actions (see Pickering and Rockey, 2011).
3.4 Descriptive statistics
Table 1 groups the descriptive statistics of all our main variables: Less than half of the
firms in our sample (5,333 firms) engage in some export activities, while the majority of
firms (72%) are relatively small companies with less than 50 employees, a feature that is
common in small open economies. Our data set shows figures that are largely consistent
with abundant evidence on firm-level trade statistics: Larger firms tend to export more,
export more products, export to a wider set of markets, and export for more prolonged
periods of time. Moreover, they employ bigger shares of women, foreigners, and middle
managers, have longer tenured employees, and have a higher proportion of workers with
secondary education. Finally, they tend to have multiple plants and present a more
diverse workforce. The gap in terms of workforce diversity further widens if only white-
collar occupations are factored in. However, no consistent differences are registered in
terms of labor productivity and foreign ownership for differently sized firms.
About 27% of firms in our sample are above the average ethnic diversity level,
and their ethnic diversity of white-and blue-collar workers is on average approximately
22
four times larger than in the rest of the sample. These firms are relatively large
enterprises, and more than half of them export. They export not only a larger number
of products, but also to more destinations. This preliminary and descriptive evidence
will be confirmed in our subsequent econometric analysis.
[Insert Table 1 about here]
In Table 2 we look at the evolution of ethnic diversity by industry over time. We
observe both a general upward trend of our index of diversity across all industries
and a remarkable increase in the growth rate of the index in the post-accession period
(2004-2007) compared to the pre-accession period (2000-2003). For the manufacturing
sector the growth rate in the post-accession period is 18.4% relative to 6% in the
pre-accession period; for financial and business services 15.1% post-accession growth
against a negative pre-accession growth of -1%; for wholesale and retail trade 26.8%
growth against 10.8% growth; 48% against 4.9% for the construction sector; the only
exception being the transport sector with 11.5% against 37%. Similar figures, with
even more remarkable growth rates, appear in Table 3 for the share of immigrants
(from all source countries): 35% post-accession (-3.3% pre-accession) growth rates for
manufacturing, 32.7% (5.4%) growth rates for financial and business services, 31%
(12%) for the wholesale and retail trade, 32.2% (22.1%) for transports, and 104% (-
7.5%) for the construction sector. This table implicitly confirms the importance of
controlling for the share of foreign workers with different ethnic backgrounds when
assessing the importance of the ethnic diversity for firm’s export activity.
[Insert Tables 2 and 3 about here]
Table 4 reports the migrants’ areas of provenance. As mentioned above, and in line
with other studies, the inflow of people after 2004 reflects the EU’s eastward expansion
with a greater presence of both permanent and temporary migrant workers from the
23
new member states.26 The average share of foreign workers from the new EU members
went from 0.26% prior to 2004 to 0.75% in 2007, a growth rate of about 188% in a
very short time span and in spite of the implemented temporary restrictions.27 None
of the other groups of foreigners show a similar growth, in spite of a positive trend in
migration from all over the world: In the same period the shares of South Americans
and Africans have grown 66% and 52%, respectively.
[Insert Table 4 about here]
As the ten new accessing countries map into seven different language groups (Czech
Republic, Poland, and Slovakia to Slavic West; Cyprus to Attic; Estonia to Finno-
Permic; Hungary to Ugric; Latvia and Lithuania to Baltic East ; Malta to Semitic
Central ; Slovenia to Slavic South), it is plausible that the “richness” dimension of
our index picks up these changes and translates into an overall increase of our ethnic
diversity index.28 In Figure 1, panel a, we superimpose to the actual data points
the quadratic fit of our diversity index and note a significant jump of our index. To
such a rise corresponds specularly a more hostile attitude toward immigrants (panel
b), confirming that the local sentiment seems to respond to migration flows. A quite
reasonable explanation is that a non-negligible part of natives were worrying about
the extraordinary spurt of immigrants: The most enthusiastic advocate of placing
restrictions on immigration, the Danish People’s Party, was widely seen as the “big
election winner”, as its share of votes and seats in Parliament rose substantially in
26The expansion on May 1st, 2004, meant that ten new states joined the European Union: Eightwere Central or Eastern European countries (Czech Republic, Estonia, Hungary, Latvia, Lithuania,Poland, the Slovak Republic and Slovenia), and two were Mediterranean countries (Cyprus and Malta).See Kahanec (2010)and Zaiceva and Zimmermann (2008) for detailed evidence on migration from newto old member states.
27Fears of social dumping and immigration of cheap labor from the new member states lead Den-mark, together with a few other member states, to restrict access to the their labor markets until2009.
28The outcome would be similar with a nationality-based index, as each new member state wouldrepresent a new nationality, and therefore “richness” would also increase.
24

2005 (Statistisk Aarbog, 2005).29 Taking the moving average of the attitude index also
mitigates the direct influence of migration flows into political outcomes.
4 Results
4.1 OLS and FE results
Table 5 presents both the OLS and FE estimates of equation (1) where the depen-
dent variable is firms’ export status. The coefficient we find is robustly positive and
significant across different specifications. While columns 1 and 4 present the most par-
simonious regressions, columns 2 and 5 add labor productivity (lagged one period) and
export experience (the cumulative years of exports) as controls. Consistent with a large
body of the empirical trade literature, firms that are more productive or draw on a
longer export experience are also more likely to export. This is a further confirmation
that there are no particular issues with our data set.30
In columns 3 and 6 we further control for the composition and quality of the labor
force. Besides skills and occupational characteristics, we include the share of workers
belonging to each of the quartiles of employees’ age distribution and the share of
foreigners belonging to each language group. The correlation between ethnic diversity
and export probability is hardly affected.
[Insert Table 5 about here]
29It is worth remembering that the Muhammad cartoons affair started in the same year, too. TheMuhammad cartoons affair began after 12 editorial cartoons depicting the Islamic prophet Muham-mad were published in the Danish newspaper Jyllands-Posten on 30 September 2005. Some Islamicorganizations filed a judicial complaint against the newspaper, which was dismissed in January 2006.The cartoons were reprinted in newspapers in more than 50 other countries over the following fewmonths, further deepening the controversy. The bulk of the reprints nevertheless took place after thelarge-scale protests in January and February 2006.
30In analogy to a vast trade literature, Tables C.1 and C.2 present the same regression without ourvariable of interest. This confirms that firm productivity is a strong predictor of the export status inour data set, too, even after controlling for the composition and quality of the labor force.
25

Quantitatively, our firm fixed effects regression suggests that a (within-firm) stan-
dard deviation increase in ethnic diversity (0.135) is associated with approximately 0.2
percentage points increase in the export probability, equivalent to a rise in the prob-
ability of export initiation of about 0.5 percent.31 We deem this effect sizable as it is
of the same order of magnitude as improving firm’s labor productivity of one standard
deviation.32 For a better understanding of our results, it is important to stress that
firms with average ethnic diversity in the full sample (exporters and non-exporters)
employ about nine foreign ethnic groups and that the share of these groups is between
two and 23% of the foreign firm workforce. Firms characterized by an ethnic diversity
equal to the “average plus a (within-firm) standard deviation increase” present about
16 language (7 more) categories with similar distribution among foreign employees.33
In the following tables, we turn to the other export activities of firms, namely export
turnover and export turnover per destination (Table 6), number of destinations (Table
7), number of products (3-digits classification), and products per destination (Table
8). Since each of these outcomes is only observable for exporters, we focus only on
the relevant population of exporting firms, and all results have to be interpreted as
conditional on exporting.
Overall we learn that ethnic diversity positively correlates with all outcomes, and
the results are again robust across all specifications. However, the share of foreigners
belonging to each linguistic group is insignificant, confirming that our diversity index
is not capturing networking from employees and that diversity and network effects
operate through different channels.34
31This figure is obtained by using the average probability of exporting. From the estimates inTable 5, the average probability of exporting is approximately 39%. Therefore, the changes in theprobability of exporting, in percentage terms, are (0.002/0.39)*100=0.51.
32Specifically a within standard deviation increase in productivity (0.254) is associated with a 0.3percentage points increase in the export probability.
33Concerning the sample of exporters, we have firms with average ethnic diversity employing for-eigners belonging to 14 different language categories and firms with a standard deviation above theaverage diversity presenting 17 ethnic (three more) groups.
34Recall that there are about 35 linguistic groups, and therefore as many shares of foreigners in our
26

[Insert Tables 6, 7, and 8 about here]
Turning to equation (2), we consider export sales per destination (Table 6, col.
7 - col. 9) and number of products per destination (Table 8, col. 7 - col. 9) as
destination-specific outcomes. Not only do we include destination fixed effects among
the regressors, but also firm network (the number of firms that in the same indus-
try export to the same destination) and employee network (the number of employees
coming from the same destination to which the firm exports). Both network terms
are statistically significant at conventional levels, a result that, in light of the trade
literature on networks, we interpret in two ways: First, the exchange of information
between firms at the formal or informal level, possibly through fairs, informal alliances,
or memberships in the Danish export association, can reduce the fixed costs associated
with expanding the business abroad (Krautheim, 2012; Mitchell et al., 2000); and sec-
ond, employees’ knowledge about their country of origin may be useful in connection
with firms’ expansion abroad (Hiller, 2013; Rauch, 2001).
Consistent with Mohr and Shoobridge’s (2011) hypothesis, the impact of ethnic
diversity should not vary with destinations, as the capabilities acquired from managing
an ethnically diverse workforce have global scope and are in principle functional to all
markets. In Table C.3 in the appendix, we distinguish between Western and non-
Western destinations. Because non-Western destinations exclude Nordic countries,
South and West Europe, and North America and Oceania, they are, with the exclusion
of China, the least popular destinations from the perspective of Danish firms, and yet
the coefficient on ethnic diversity remains qualitatively very similar.35
regression.35For Denmark Germany is the most popular, and Azerbaijan the least popular destination market.
The most popular non-Western destination is Lebanon with 8% of firms (22% of exporters) exportingto this market.
27
4.2 IV results
Although the numerous controls included in our FE regressions account for many con-
founding factors, in this section we present IV estimates that address further economet-
ric issues, such as reverse causality and self-selection into employer-employee matching.
We first present in Table 9 the estimates of the first stage as specified in equation
(3) above. The first three columns present specifications with an increasing number
of controls: The first column is just the polynomial of the ati index center in 2004,
whereas the last column also includes all exogenous variables used in the second stage.
[Insert Table 9 about here]
The results we obtain are very interesting per se: they show that both the jump
in 2004 and the change in the trend of the attitude index can explain the variation of
firm level workforce diversity. Therefore, the local attitude towards immigrants affects
migrants’ settlement and ultimately the diversity of firms’ local labor supply, consistent
with the work of Waisman and Larsen (2008).
Columns 4 and 5 of Table 9 perform some robustness checks. Column 4 just uses
the current value of our attitude index, ati index, to show that the moving average
process is not driving any of the results. Column 5 entirely gives up the polynomial
approximation and simply uses ati index as an instrument (traditional IV-approach).
It is apparent that the results are very robust and similar across all these specifications.
Tables 10 and 11 condense the IV estimates for all outcomes considered. For each
outcome, we present five specifications, each corresponding to the respective column
of the first stage regression presented in Table 9. Coherent with all the estimates
presented, for a given outcome each column includes progressively more controls with
the third column being the most complete. The fourth and fifth columns are always
the same specification as column 3, but with the correspondent variation of the first
stage specification as presented in Table 9.
28

[Insert Tables 10 and 11 about here]
Overall, ethnic diversity improves firms’ export performances, but the coefficient
remains at the 1% statistical significance level only when export status, the number
of destinations, or the number of products are the dependent variables, and becomes
not significant with the logarithm of export sales. Taking Mohr and Shoobridge’s
(2011) meta-competence argument to its logical consequence, we should expect that the
skills developed along with diversity management are facilitating the engagement into
international activities. If we regard export status as well as number of destinations and
products pertaining to the engagement stage, as these are more closely related to the
extensive margins of firm’s internationalization, our results would again be consistent
with that prediction. In the trade literature export turnover, on the contrary, is often
associated with the intensive margin of the firm’s expansion abroad as it presupposes
a presence into foreign markets already.36
Taking the third column as our preferred specification, the quantitative implications
of our findings is that on average a standard deviation increase in ethnic diversity
enhances the probability to export by 3.3% and induces firms to export approximately
two more products to two additional markets.
The tests for weak instruments are all well within the comforting range (Stock
and Yogo, 2005), further confirming the good fit of our first stage and indicating that
the estimates of our coefficients are not possibly inflated by a weak instrument. As
is often the case, we find the IV point estimates to be larger than the FE estimates
presented above. We can offer two plausible interpretations. First, besides ethnic
diversity, other forms of investment, such as technological investments (Alvarez and
Lopez, 2005; Atkeson and Burstein, 2010), quality upgrading (Iacovone and Javorcik,
36In our text we avoid to refer to the “number of products exported” as the proper extensive marginof the firm because we do not measure it dynamically as the result of product creation and destruction,as in Iacovone and Javorcik (2010). In our case it is a yearly stock measure that clearly (cor)relateswith the proper extensive margin. In some instances the number of destinations has been associatedwith “market reach”, whereas sales abroad have been linked to “market penetration”.
29
2012), and human capital investments (Molina and Muendler, 2013, Sala and Yalcin,
2012, Mion and Opromolla, 2011), affect exporting and the traded product mix. If
these activities are substitutes (complements) to ethnic diversity, but unobservable
to the econometrician, the substitutability (complementarity) can induce a negative
(positive) bias in the estimates of the parameter of our diversity index. Second, a
LATE interpretation of our instrument could be at play (Imbens and Angrist, 1994;
Card, 2001; Angrist and Krueger, 2001; Imbens and Wooldridge, 2009). Given that
the growing hostility toward immigrants mirrors the increased diversity of the pool
of workers, the firms that are more likely to increase the diversity of their workforce
are arguably the least diverse. If our estimated marginal effect reflects the “return” of
increasing diversity for these firms, it is likely to exceed the average return for the whole
population. Indeed, the highly diversified firms, regardless of time (before and after
2004) and local labor supply conditions (attitude toward immigrants), gain less at the
margin than the subgroup of firms most affected by the variation of our instruments.
A final note is that the shares of foreigners in the third column are also likely to
be endogenous and ought in principal to be instrumented. As we are not interested
in quantifying the effect of networking, just controlling for the effect, the properties of
the LPM come in handy. Because of linearity, the coefficient of our interest will not
be affected by other potentially endogenous regressors.37 Indeed, comparing the third
column to the other columns that do not include the shares of foreigners among the
regressors, we do not observe worrying jumps of our point estimates.38
4.3 Robustness checks
In this section we expand our results in three directions. First, we assess whether the
effect of diversity differs across various groups of Danish firms. Second, we confirm
37See Wooldridge (2002).38We have also estimated the third column with and without the shares of foreigners (not reported),
and the main result hardly changes.
30
our results using alternative variants to our diversity index. Finally, we perform a
sensitivity analysis for our IV results.
In Table 12, we first consider whether firms of different size are able to reap more
benefits from investing in ethnic diversity. Not only may large firms dispose of the re-
sources necessary to activate “diversity awareness training programs”, but just because
they face the challenge of organizing numerous employees, they are already remuner-
ating and implementing career policies that reward contributions made by employees
with different backgrounds. We therefore proceed by splitting our sample into small
firms (less than 50 employees) and large firms (50 and more employees). As the coef-
ficient of ethnic diversity is more precisely estimated and larger in the sub-sample of
large firms, the benefits of diversity can vary with size.
To test whether the effects of diversity change with the share of non-native workers,
we split firms into two alternative subsamples, depending on whether their share of
foreign employees is above or below the average in the industry. Sub-panels 4 and 5 of
Table 12 show that the effects of diversity are neither less precisely estimated nor of
lower magnitude for below average firms, dismissing the hypothesis that the benefit of
diversity ought to coincide with a large share of non-native workers.
While the available evidence on firm level trade is mostly confined to the manufac-
turing sector, we have presented our estimates for the whole Danish firm population.
We present our estimates distinctively for the manufacturing and service sectors, in
sub-panels 6 and 7 respectively. While the statistical significance of ethnic diversity
remains similar across all export outcomes in the manufacturing sector, in the service
sector it is markedly high only for the outcomes “number of destinations” and “number
of products”. The lower significance of the effect of diversity for companies’ sales found
above is most likely driven by the pooling together of these two broad sectors. Looking
closer at the sectoral characteristics helps to rationalize our findings. Not only is the
share of aggregate output that is exported in the service sector substantially lower than
31

in manufacturing, but it is also heavily concentrated in the transportation sector. Ex-
ports in the manufacturing sector are more evenly distributed with a slight prevalence
in the electronic industry. As the number of products and destinations varies greatly
within the transportation sector, and this variation is larger than in any other sector,
our findings are perhaps not surprising.
[Insert Table 12 about here]
Now we turn our attention to testing the solidity of our firm level measure of
diversity.
First, we investigate if the aggregation of our Herfindhal index across all workplaces
that we apply to obtain the firm level diversity has an influence on our results. Because
the plant and the firm unit coincide for mono-establishment firms, no aggregation is
necessary, but our results do not change significantly if the effects of diversity are
estimated only with these firms in our sample (third panel of Table 12).
Since our diversity index distinguishes workers by linguistic groups, but not by work
categories, in Table 13 we control whether the effect of diversity differs for white-collar
and blue-collar occupations. As white-collar workers are typically more influential on
firms’ business plans and export strategies, ethnic diversity in senior occupations may
promote firms’ export activities more effectively. The first two sub-panels of Table 13
report evidence supporting this conjecture for all the export dimensions: The estimated
coefficients of diversity referring to white-collar workers are generally larger and more
precisely estimated than those for blue-collar workers.
Language grouping constitutes an implicit form of aggregation in our measure of
diversity. While the main analysis refines language groups to the third level of the
linguistic family tree (35 language groups), we experiment here with a less detailed
linguistic classification. Restricting ourselves just to the first linguistic tree level, Ger-
manic West, Germanic North, and Romance languages are classified under the same
32

group of “Indo-European languages”, and in total there are 20 such language groups.
With this formulation, people from Western Europe, Nordic countries, and Romania
- a large fraction of the EU-27 - would be considered as having identical ethnic back-
grounds.
Furthermore, we also give up on a language-based index and recompute the index
based on foreign employees’ nationalities. As numerous nationalities pose data dimen-
sionality challenges, for practical matters and based on the UN’s regional maps, we
group nationalities into the following eight categories: North America and Oceania,
Central and South America, Africa, West and South Europe, former Communist coun-
tries, Asia, East Asia, and Muslim countries.39 We deem this distinction sufficient to
test whether a nationality based index would change our figures dramatically.
Overall, our results (third and fourth sub-panels of Table 13) prove robust to differ-
ent formulations of our diversity index, eliminating any concern that data aggregation
issues may be driving our findings.
[Insert Table 13 about here]
Finally, we provide further sensitivity analysis on the IV findings. First, we check
whether using a narrower time window around 2004, i.e. from 2002 to 2006, affects the
IV estimates. The first sub-panel of Table 14 indicates that the IV results obtained
39Based on the UN regional maps, the nationality groups are as follows: i) North America and Ocea-nia: United States, Canada, Australia, New Zealand; ii) Central and South America: Guatemala, Be-lize, Costa Rica, Honduras, Panama, El Salvador, Nicaragua, Venezuela, Ecuador, Peru, Bolivia,Chile, Argentina, Brazil; iii) Former Communist countries: Armenia, Belarus, Estonia, Georgia,Latvia, Lithuania, Moldova, Russia, Tajikistan, Ukraine, Bulgaria, Czech Republic, Hungary, Poland,Romania, Slovakia, Albania, Bosnia and Herzegovina, Bulgaria, Croatia, Rep. of Macedonia, Mon-tenegro, Serbia, and Slovenia; iv) Muslim countries: Afghanistan, Algeria, Arab Emirates, Azerbaijan,Bahrain, Bangladesh, Brunei Darussalam, Burkina Faso, Comoros, Chad, Djibouti, Egypt, Eritrea,Gambia, Guinea, Indonesia, Iran, Iraq, Jordan, Kazakhstan, Kyrgyzstan, Kuwait, Lebanon, LibyanArab Jamahiriya, Malaysia, Maldives, Mali, Mauritania, Morocco, Nigeria, Oman, Pakistan, Pales-tine, Qatar, Saudi Arabia, Senegal, Sierra Leone, Somalia, Sudan, Syria, Tajikistan, Tunisia, Turkey,Turkmenistan, Uzbekistan, Yemen; v) East Asia: China, Hong Kong, Japan, Korea, Korea Dem. Peo-ple’s Rep. of, Macao, Mongolia, Taiwan; vi) Asia: all the other Asian countries non included in bothEast Asia and Muslim countries categories; vii) Africa: all the other African countries not includedin the Muslim countries; viii) Western and Southern Europe: all the other European countries notincluded in the Former Communist countries category.
33
from a shorter sample period do not substantially differ from those reported in Tables
10 and 11, even though the coefficient on ethnic diversity is less precisely estimated
in the export status equation. The next check is about the potential endogeneity
of firms’ location within our identification strategy. As we explained above, firms’
location should be unrelated to the median voter ideology of that area. Given that
our IV uses the time window 2001-2007, the location of firms founded prior to 2001 is
predetermined. Were our identification assumption to fail, we should be observing a
clear difference in our results using only firms founded prior to 2001. But our results
in the second sub-panel of Table 14 are qualitatively similar to the IV results reported
above.
We further consolidate our results by changing our IV strategy tout court, and
instrument the firm diversity with the attitude toward immigrants registered before
the 2001-2007 time window. In the vein of a difference in difference (DiD) approach,
we modify the first stage regression (3) to:
ethnicit =cons+ δ0ati indexk90s + δ1I(t ≥ 2004) + δ2ati indexk90s ∗ I(t ≥ 2004)
+ x′
itβ + ηj + ηk + ξit, (8)
where ati indexk90s denotes the moving average of ati indexkmt in (7) over the whole
90s. All results prove robust to this specification, too (Table 14, last panel), and
the coefficient of ethnic diversity for the outcomes “number of export markets” and
“number of exported products” are even very close in magnitude to the ones reported
with our other strategy inspired by regression discontinuity analysis.
We turn to evaluate the robustness of our findings to different computations of our
“attitudes towards immigrants” index, ati index.
A first concern is that the median voter position also reflects statements in parties’
manifestos which concern trade policy, so that our hostility measure to migrant settle-
34

ments in practice also reflects a liberal or protectionist attitude of the median voter.
To sterilize our index from any possible trade influence, we exclude from equation (5)
all statements (pro or con) related to trade.40
A second concern is related to the computation of our index. We expect the time
variation of our ati index in equation (7) to respond largely to vote shifts across parties
in different electoral cycles rather than to modifications of parties’ manifestos. The
reason for such vote swops could be what the electoral base takes as a poor political
performance, but in fact it is an idiosyncratic downturn at the municipality level. Then,
our strategy would confound changes in local economic conditions with modifications
of the local attitudes towards immigrants if the location fixed effects that we include in
the first stage are not enough to factor out local business cycles. We propose a slight
alteration of our index to account for this possibility: We recompute equation (7) using
the political ideology of the 90th percentile voter rather than the 50th percentile voter
(i.e., the median voter).41 Extreme voters are indeed not pivotal and hardly modify
their political preferences based on economic conditions.
The results are reported in Table 14 and do not differ qualitatively from the main
findings.
[Insert Table 14 about here]
5 Conclusions
Motivated by Mohr and Shoobridge’s (2011) hypothesis that firms learn to operate
internationally by managing a diverse workforce, we have investigated at the firm level
the causal effect of increasing labor force (ethnical) diversity on different exporting
40Specifically we rule out all the statements pertaining to the European community, international-ism, and protections.
41In analogy with equation (6), we let the extreme voter be computed as extreme voterm = L +[(90− C) /F ] ? W . We then replace the median voterm in (7) with extreme voterm.
35

performances, namely export status, export turnover, number of destinations, number
of products exported, and number of products exported per destination.
Using employer-employee data for the whole Danish population of firms (and work-
ers) between 1995 and 2007, we find that on average more ethnically diversified firms
perform better on the international market along all measures considered. The effect is
stronger for those outcomes that are more strictly connected with firms’ adjustments
at the extensive margin (export status, number of products and destinations).
Even if we cannot directly observe firms’ efforts at managing their employee diver-
sity, our results are in line with Mohr and Shoobridge’s (2011) conjecture, and therefore
reinforce it. They do establish that productivity is not the only driver of firms’ selec-
tion into international markets, but other characteristics of the workforce, in this case
diversity, are just as important and deserve closer attention by (trade) economists, as
they become proper intangible assets for the firm and determine their success. We have
pointed out how technology mediates the effects of workforce diversity in Grossman
and Maggi (2000). Similarly, in Yeaple (2005), different technologies induce firms to
hire workers with different abilities. It is therefore not surprising that selection on pro-
ductivity is ultimately conjunct with the selection on workforce characteristics. More
theoretical and empirical future research is necessary to deepen our understanding of
how these channels interact and shape the internationalization process of firms.
In the absence of randomized experiments, we rely on the EU enlargement process
of 2004 as quasi-experimental evidence for the diversity of the pool of workers locally
recruitable by firms. The value added of our instrumental strategy is, however, that it
combines this one time event with the attitude toward immigrants at firm’s location,
as measured by the political median voter ideology. Indeed, if migrants tend to settle
in the areas least hostile to them, firms located in these areas are the ones that benefit
the most in terms of “employable diversity”.
We have been very careful to disentangle the effects of workforce diversity from
36
those induced by networking. Even allowing for different network channels (firm and
employee networks), our findings on the effects of diversity are confirmed. Moreover,
diversity impacts exporting regardless of the popularity of destinations. This is con-
sistent with the notion that the acquired meta-competences are universal knowledge
more directly transferable across different contexts.
From the perspective of firms, the challenges and costs associated with managing
a diverse workforce may constitute investments rewarded with an increased ability to
initiate, manage, and expand international business. These findings open new perspec-
tives to policy makers about designing export promotion and integration policies.
37
References
[1] Adsera, A., and Pytlikova, M. 2012. The Role of Language in Shaping International
Migration. IZA Discussion Paper No. 6333.
[2] Albornoz, F., Calvo Pardo, H.F., Corcos, G., and Ornelas, E. 2012. Sequential
exporting. Journal of International Economics 88: 17-31.
[3] Alesina, A., and La Ferrara, E. 2005. Ethnic Diversity and Economic Performance.
Journal of Economic Literature XLIII: 762-800.
[4] Alvarez, R., and Lopez, R. 2005. Exporting and Performance: Evidence from
Chilean Plants. Canadian Journal of Economics 38 (4): 1384-1400.
[5] Andersen, A.K. 2000. Commuting Areas in Denmark. AKF Working paper.
[6] Andrews, M., Schank, T., and Upward, R. 2011. Do Foreign Workers Reduce
Trade Barriers? Microeconomic Evidence. Mimeo, University of Manchester.
[7] Angrist, J. D., and Krueger, A. B. 2001. Instrumental Variables and the Search for
Identification: From Supply and Demand to Natural Experiments. The Journal of
Economic Perspectives 15 (4): 69-85.
[8] Angrist, J. D., and Pischke, J. 2010. The Credibility Revolution in Empirical
Economics: How Better Research Design Is Taking the Con out of Econometrics.
Journal of Economic Perspectives 24 (2): 3–30.
[9] Atkeson, A., and Burstein, A. 2010. Innovation, Firm Dynamics, and International
Trade. Journal of Political Economy 118 (3): 433-484.
[10] Baas, T., and Bruecker, H. (2011). EU Eastern Enlargement: The Benefits from
Integration and Free Labour Movement. CESifo DICE Report 2/2011.
38
[11] Baldwin, R. 1995. The Eastern enlargement of the European Union. European
Economic Review 39: 474-481.
[12] Barkema, H., and Shvyrkov, O. 2007. Does Top Management Team Diversity
Promote or Hamper Foreign Expansion? Strategic Management Journal 28: 663-
680.
[13] Becker, G., 1957. The Economics of Discrimination. University of Chicago Press,
Chicago.
[14] Belke, A., and Potrafke, N. 2012. Does Government Ideology Matter in Monetary
Policy? A Panel Data Analysis for OECD Countries. Working Paper 2011-48,
Department of Economics, University of Konstanz.
[15] Berliant, M., and Fujita, M. 2008. Knowledge Creation as a Square Dance on the
Hilbert Cube. International Economic Review 49: 1251–1295.
[16] Bisin, A., and Verdier, T. 2010. The Economics of Cultural Transmission and
Socialization. NBER Working Paper No. 16512.
[17] Bordignon, M., Nannicini, T., and Tabellini, G. 2013. Moderating Political Ex-
tremism: Single Round vs Runoff Elections under Plurality rule. IZA Discussion
Papers 7561.
[18] Brollo, F., Nannicini, T., Perotti, R., and Tabellini, G. 2013. The Political Re-
source Curse. American Economic Review 103 (5): 1759-1796.
[19] Card, D. 2001. Immigrant Inflows, Native Outflows, and the Local Labor Market
Impacts of Higher Immigration. Journal of Labor Economics 19 (1): 22–64.
[20] Casella, A., and Rauch, J. E. 2002. Anonymous Market and Group Ties In Inter-
national Trade. Journal of International Economics 58 (1): 19-47.
39

[21] Casella, A., and Rauch, J. E. 2003. Overcoming Informational Barriers to Inter-
national Resource Allocation: Prices and Ties. Economic Journal 113: 21-42.
[22] Congleton, R. and Bose, F. 2010. The Rise of the Modern Welfare State, Ideology,
Institutions and Income Security: Analysis and Evidence. Public Choice 144: 535-
555.
[23] De Benedictis, L., De Santis, R., and Vicarelli, C. 2005. Hub-and-Spoke or Else?
Free Trade Agreements in the “Enlarged” European Union. European Journal of
Comparative Economics 2 (2): 245-260.
[24] Dunning, J. H. 1977. Trade, Location of Economic Activity and MNE: A Search
for an Eclectic Approach. In Ohlin, B., Hesselborn P. Ø., and Wijkman, P. M.
(eds.), The International Allocation of Economic Activity. London: Macmillan,
pp. 395-418.
[25] Dunning, J. H. 1981. International Production and the Multinational Enterprise.
London: George Allen and Unwin.
[26] Fujita, M., and Thisse, J. 2013. Economics of Agglomeration: Cities, Industrial
Location, and Globalization. Cambridge University Press.
[27] Glaeser, E. L., Laibson, D. I., Scheinkman J. A., and Soutter, C.L. 2000. Measuring
Trust. The Quarterly Journal of Economics 115: 811-846.
[28] Grossman, G., and Maggi, G. 2000. Diversity and Trade. American Economic
Review 90 (5): 1255-1275.
[29] Guiso, L., Sapienza, P., and Zingales, L. 2009. Cultural Biases in Economic Ex-
change? Quarterly Journal of Economics 124: 1095-1131.
[30] Hiller, S. 2013. Does Immigrant Employment Matter for Export Sales? Evidence
from Denmark. Review of World Economics 149: 369-394.
40

[31] Hong, L., and Page Scott, E. 2001. Problem Solving by Heterogeneous Agents.
Journal of Economic Theory 97 (1): 123-163.
[32] Hong, L., Page Scott, E. 2004. Groups of Diverse Problem Solvers Can Outperform
Groups of High-Ability Problem Solvers, Proceedings of the National Academy of
Sciences 101 (46): 16385-16389.
[33] Iacovone, L., and Javorcik, B. 2012. Getting Ready: Preparation for Exporting.
CEPR Discussion Papers 8926.
[34] Iacovone, L. and Javorcik, B. 2010. Multi-Product Exporters: Product Churning,
Uncertainty and Export Discoveries. Economic Journal 120 (544): 481-489.
[35] Imbens, G. W. and Angrist, J. D. 1994. Identification and Estimation of Local
Average Treatment Effects. Econometrica 62: 467-475.
[36] Imbens, G. W., and Wooldridge, J.M. 2009. Recent Developments in the Econo-
metrics of Program Evaluation. Journal of Economic Literature 47: 5–86.
[37] Kahanec, M., 2010. Labor Mobility in an Enlarged European Union. In A. F. Con-
stant and K. F. Zimmermann (eds.), International Handbook on the Economics
of Migration, Cheltenham: Edward Elgar.
[38] Kim, H., and Fording, R. C. 2001. Does Tactical Voting Matter? The Political Im-
pact of Tactical Voting in Recent British Elections. Comparative Political Studies
34: 294-311.
[39] Krautheim, S. 2012. Heterogeneous Firms, Exporter Networks and the Effect of
Distance on International Trade. Journal of International Economics 87: 27-35.
[40] Lang, K. 1986. A Language Theory of Discrimination. Quarterly Journal of Eco-
nomics 101: 363-382.
41

[41] Lazear, E.P. 1998. Personnel Economics for Managers. New York, John Wiley &
Sons.
[42] Lazear, E.P. 1999. Globalisation and the Market for Team-Mates. The Economic
Journal 109: c15-c40.
[43] Marino, M., Parrotta, P. and Pozzoli, D. 2012. Does Labor Diversity Promote
Entrepreneurship? Economics Letters 116: 15-19.
[44] Manski, C. F. 1993. Identification of Endogenous Social Effects: The Reflection
Problem. The Review of Economic Studies 60 (3): 531-542.
[45] Melitz, M. J. 2003. The impact of Trade on Intra Industry Reallocations and
Aggregate Industry Productivity. Econometrica 71 (6): 1695-1725.
[46] Miguel, E., Satyanath, S. and Sergenti, E. 2004. Economic Shocks and Civil
Conflict: An Instrumental Variable Approach. Journal of Political Economy 112:
725–753.
[47] Mitchell, R., Smith, B., Seawright, K., and Morse, E. 2000. Cross-cultural Cog-
nitions and the Venture Creation Decision. Academy of Management Journal 43
(5): 974-993.
[48] Mohr, A. and Shoobridge, G. E. 2011. The Role of Multi-Ethnic Workforces in
the Internationalisation of SMEs. Journal of Small Business and Enterprise De-
velopment 18 (4), 748-763.
[49] Molina, D., and Muendler, M. 2013. Preparing to Export. NBER Working Paper
No. 18962.
[50] Montagna, C. 2001. Efficiency, Gaps, Love of Variety and International Trade.
Economica 68: 27-44.
42

[51] Nannicini, T., Stella, A., Tabellini, G., and Troiano, U. 2013. Social Capital and
Political Accountability. American Economic Journal: Economic Policy 5 (2): 222-
250.
[52] Osborne, E., 2000. The Deceptively Simple Economics of Workplace Diversity.
Journal of Labor Research 21: 463-475.
[53] Parrotta, P., Pozzoli, D., Pytlikova, M. 2014. The Nexus between Labor Diversity
and Firm’s Innovation. Forthcoming Journal Population Economics.
[54] Parrotta, P., Pozzoli, D., and Pytlikova, M. 2014. Labor Diversity and Firm Pro-
ductivity. Forthcoming European Economic Review.
[55] Peri G., and Ottaviano, G.I.P. 2006. The Economic Value of Cultural Diversity:
Evidence from US Cities. Journal of Economic Geography 6: 9-44.
[56] Peri, G., and Ottaviano, G.I.P. 2012. Rethinking the Effect of Immigration on
Wages. Journal of the European Economic Association 10 (1): 152-197.
[57] Pickering, A., and Rockey, J. 2011. Ideology and the Growth of Government. The
Review of Economics and Statistics 93: 907-919.
[58] Rauch, J. E. 2001. Business and Social Networks in International Trade. Journal
of Economic Literature 39 (4): 1177-1203.
[59] Sala, D., and Yalcin, E. 2012. Export Experience of Managers and the Interna-
tionalization of Firms. Ifo Working Paper No. 139.
[60] Statistisk Aarbog, 2005, Danmarks Statistik.
[61] Stock, J. H., and Yogo, M. 2005. Testing for Weak Instruments in Linear IV
Regression. In D.W.K. Andrews and J.H. Stock (eds.), Identication and Inference
43

for Econometric Models: Essays in honour of Thomas Rothenberg, Cambridge
MA: Cambridge University Press.
[62] Waisman, G., and Larsen, B. 2008. Do Attitudes Towards Immigrants Matter?,
SULCIS Working Papers 2008:5, Stockholm University Linnaeus Center for Inte-
gration Studies - SULCIS.
[63] Wooldridge, J. M. 2002. Econometric Analysis of Cross Section and Panel Data.
The MIT Press.
[64] Yeaple, S. (2005). A Simple Model of Firm Heterogeneity, International Trade,
and Wages. Journal of International Economics 65: 1-20.
[65] Zaiceva, A., and Zimmermann, K. 2008. Scale, Diversity, and Determinants of
Labour Migration in Europe. Oxford Review of Economic Policy 24 (3): 428-452.
44
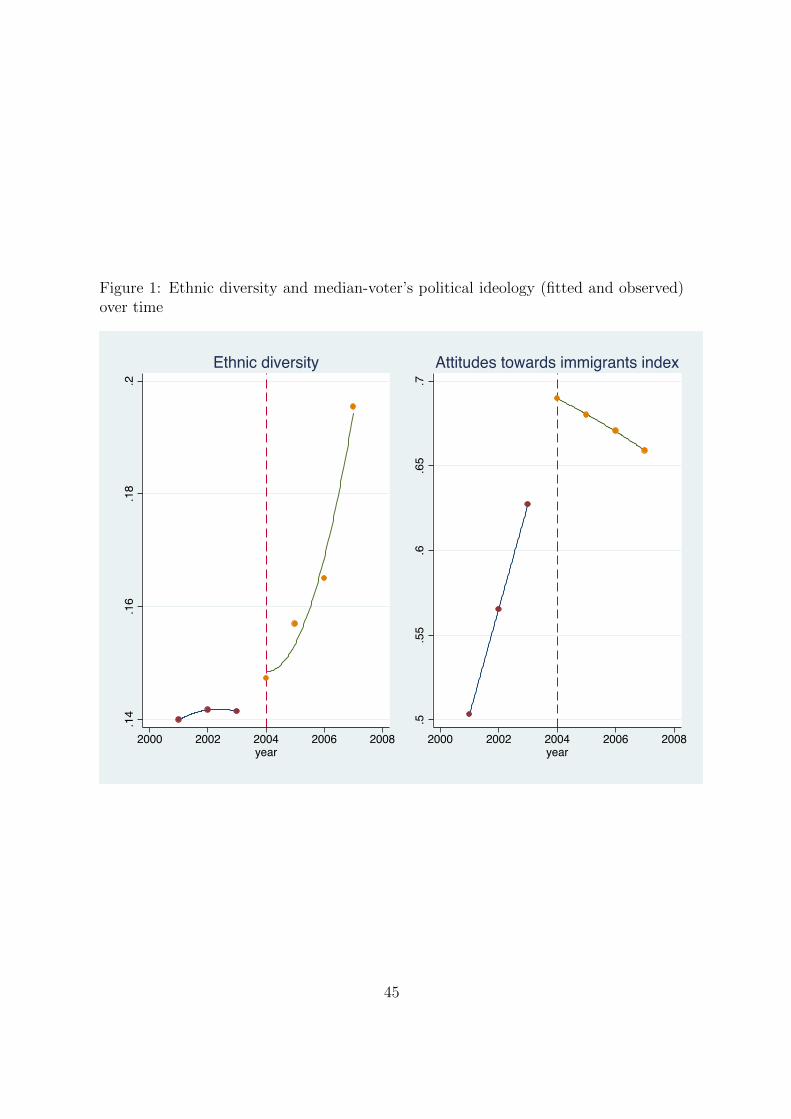
Figure 1: Ethnic diversity and median-voter’s political ideology (fitted and observed)over time
.14
.16
.18
.2
2000 2002 2004 2006 2008year
Ethnic diversity
.5.5
5.6
.65
.7
2000 2002 2004 2006 2008year
Attitudes towards immigrants index
45
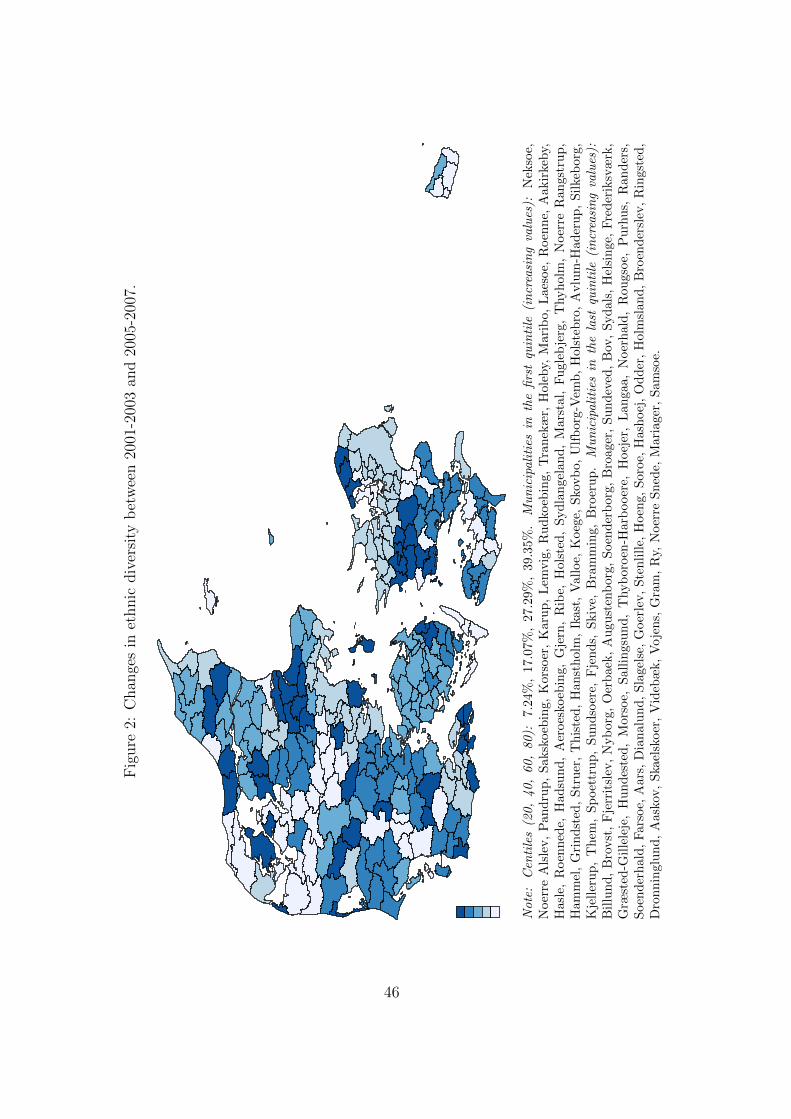
Fig
ure
2:C
han
ges
inet
hnic
div
ersi
tyb
etw
een
2001
-200
3an
d20
05-2
007.
Note
:C
enti
les
(20
,40,
60,
80):
7.24
%,
17.0
7%
,27.2
9%
,39.3
5%
.M
un
icip
ali
ties
inth
efi
rst
quin
tile
(in
crea
sin
gva
lues
):N
ekso
e,N
oer
reA
lsle
v,
Pan
dru
p,
Sak
skoeb
ing,
Kors
oer
,K
aru
p,
Lem
vig
,R
ud
koeb
ing,
Tra
nek
ær,
Hole
by,
Mari
bo,
Laes
oe,
Roen
ne,
Aakir
keby,
Has
le,
Roen
ned
e,H
adsu
nd
,A
eroes
koeb
ing,
Gje
rn,
Rib
e,H
ols
ted
,S
yd
lan
gel
an
d,
Mars
tal,
Fu
gle
bje
rg,
Thyh
olm
,N
oer
reR
an
gst
rup
,H
amm
el,
Gri
nd
sted
,S
tru
er,
Th
iste
d,
Han
sth
olm
,Ik
ast
,V
all
oe,
Koeg
e,S
kovb
o,
Ulf
borg
-Vem
b,
Hols
teb
ro,
Avlu
m-H
ad
eru
p,
Sil
keb
org
,K
jell
eru
p,
Th
em,
Sp
oet
tru
p,
Su
nd
soer
e,F
jen
ds,
Skiv
e,B
ram
min
g,
Bro
eru
p.
Mu
nic
ipali
ties
inth
ela
stqu
inti
le(i
ncr
easi
ng
valu
es):
Bil
lun
d,
Bro
vst
,F
jerr
itsl
ev,
Nyb
org,
Oer
baek
,A
ugu
sten
borg
,S
oen
der
borg
,B
roager
,S
un
dev
ed,
Bov
,S
yd
als
,H
elsi
nge,
Fre
der
iksv
ærk
,G
ræst
ed-G
ille
leje
,H
un
des
ted,
Mor
soe,
Sall
ingsu
nd
,T
hyb
oro
en-H
arb
ooer
e,H
oej
er,
Lan
gaa,
Noer
hald
,R
ou
gso
e,P
urh
us,
Ran
der
s,S
oen
der
hal
d,
Far
soe,
Aar
s,D
ian
alu
nd
,S
lagel
se,
Goer
lev,
Ste
nli
lle,
Hoen
g,
Soro
e,H
ash
oej
,O
dd
er,
Holm
slan
d,
Bro
end
ersl
ev,
Rin
gst
ed,
Dro
nn
ingl
un
d,
Aas
kov,
Ska
elsk
oer
,V
ideb
æk,
Vo
jen
s,G
ram
,R
y,N
oer
reS
ned
e,M
ari
ager
,S
am
soe.
46
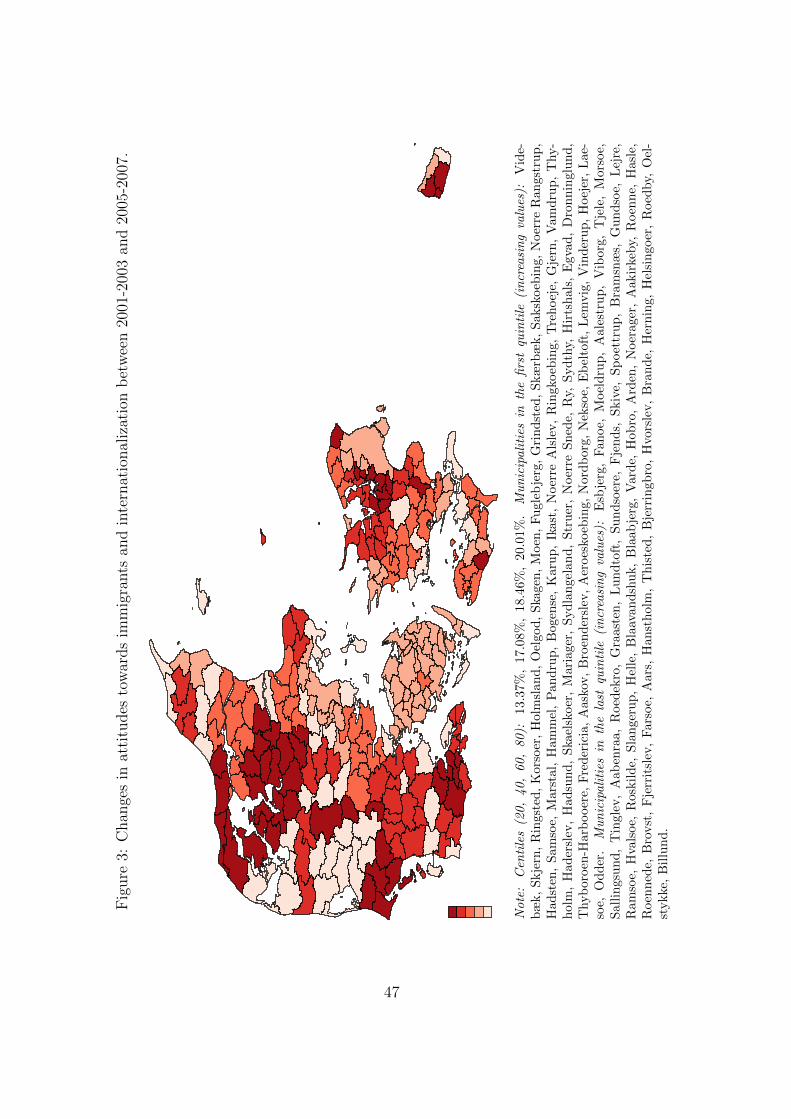
Fig
ure
3:C
han
ges
inat
titu
des
tow
ards
imm
igra
nts
and
inte
rnat
ional
izat
ion
bet
wee
n20
01-2
003
and
2005
-200
7.
Note
:C
enti
les
(20,
40,
60,
80):
13.3
7%,
17.0
8%
,18.4
6%
,20.0
1%
.M
un
icip
ali
ties
inth
efi
rst
quin
tile
(in
crea
sin
gva
lues
):V
ide-
bæ
k,
Skje
rn,
Rin
gste
d,
Kor
soer
,H
olm
slan
d,
Oel
god
,S
kagen
,M
oen
,F
ugle
bje
rg,
Gri
nd
sted
,S
kæ
rbæ
k,
Saksk
oeb
ing,
Noer
reR
an
gst
rup
,H
adst
en,
Sam
soe,
Mar
stal
,H
amm
el,
Pan
dru
p,
Bogen
se,
Karu
p,
Ikast
,N
oer
reA
lsle
v,
Rin
gko
ebin
g,
Tre
hoej
e,G
jern
,V
am
dru
p,
Thy-
hol
m,
Had
ersl
ev,
Had
sun
d,
Ska
elsk
oer
,M
ari
ager
,S
ydla
ngel
an
d,
Str
uer
,N
oer
reS
ned
e,R
y,S
yd
thy,
Hir
tsh
als
,E
gva
d,
Dro
nn
inglu
nd
,T
hyb
oroen
-Har
booer
e,F
red
eric
ia,
Aas
kov,
Bro
end
ersl
ev,
Aer
oes
koeb
ing,
Nord
borg
,N
ekso
e,E
bel
toft
,L
emvig
,V
ind
eru
p,
Hoej
er,
Lae-
soe,
Od
der
.M
un
icip
ali
ties
inth
ela
stqu
inti
le(i
ncr
easi
ng
valu
es):
Esb
jerg
,F
an
oe,
Moel
dru
p,
Aale
stru
p,
Vib
org
,T
jele
,M
ors
oe,
Sal
lin
gsu
nd
,T
ingl
ev,
Aab
enra
a,R
oed
ekro
,G
raast
en,
Lu
nd
toft
,S
und
soer
e,F
jen
ds,
Skiv
e,S
poet
tru
p,
Bra
msn
æs,
Gu
nd
soe,
Lej
re,
Ram
soe,
Hva
lsoe,
Ros
kil
de,
Sla
nge
rup
,H
elle
,B
laav
an
dsh
uk,
Bla
ab
jerg
,V
ard
e,H
ob
ro,
Ard
en,
Noer
ager
,A
akir
keby,
Roen
ne,
Hasl
e,R
oen
ned
e,B
rovst
,F
jerr
itsl
ev,
Far
soe,
Aars
,H
an
sth
olm
,T
his
ted
,B
jerr
ingb
ro,
Hvo
rsle
v,
Bra
nd
e,H
ern
ing,
Hel
sin
goer
,R
oed
by,
Oel
-st
ykke
,B
illu
nd
.
47
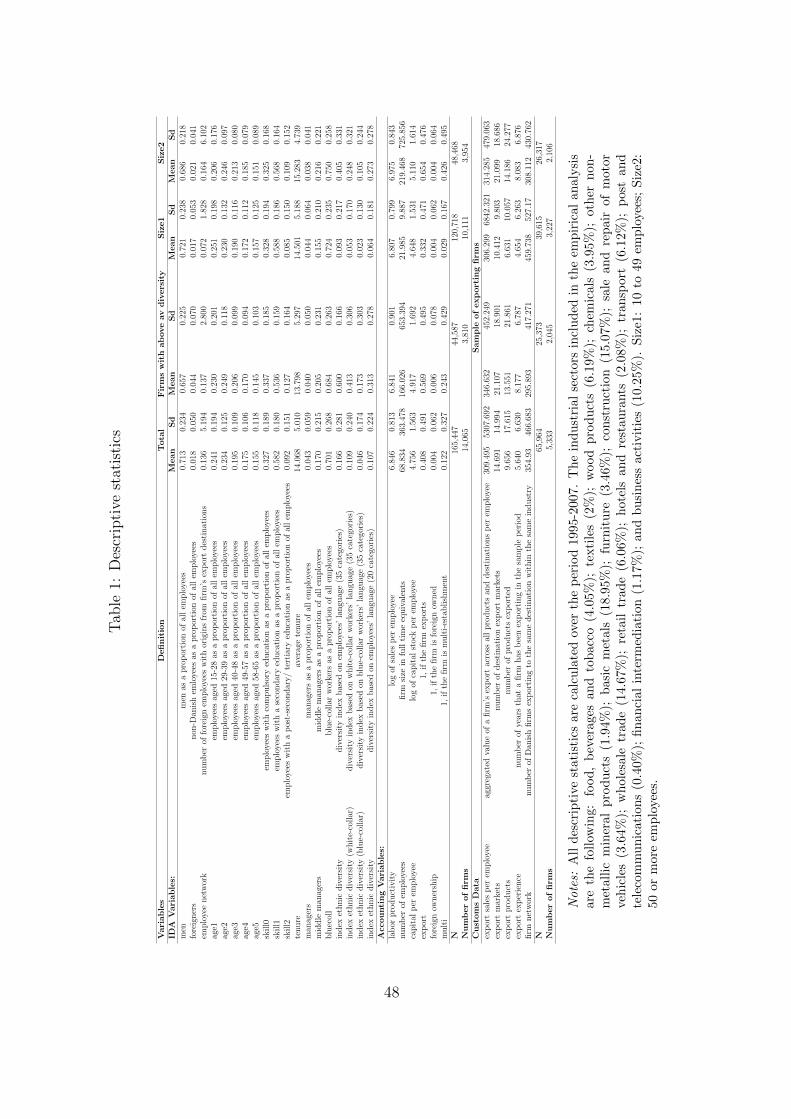
Tab
le1:
Des
crip
tive
stat
isti
cs
Vari
able
sD
efinit
ion
Tota
lF
irm
sw
ith
ab
ove
av
div
ers
ity
Siz
e1
Siz
e2
IDA
Vari
able
s:M
ean
Sd
Mean
Sd
Mean
Sd
Mean
Sd
men
men
asa
pro
por
tion
ofal
lem
plo
yees
0.71
30.
234
0.65
70.
225
0.72
10.
238
0.68
60.
218
fore
igner
snon
-Dan
ish
emlo
yees
asa
pro
por
tion
ofal
lem
plo
yees
0.01
80.
050
0.04
40.
070
0.01
70.
053
0.02
10.
041
emplo
yee
net
wor
knum
ber
offo
reig
nem
plo
yees
wit
hor
igin
sfr
omfirm
’sex
por
tdes
tinat
ions
0.13
65.
194
0.13
72.
800
0.07
21.
828
0.16
46.
102
age1
emplo
yees
aged
15-2
8as
apro
por
tion
ofal
lem
plo
yees
0.24
10.
194
0.23
00.
201
0.25
10.
198
0.20
60.
176
age2
emplo
yees
aged
29-3
9as
apro
por
tion
ofal
lem
plo
yees
0.23
40.
125
0.24
90.
118
0.23
00.
132
0.24
60.
097
age3
emplo
yees
aged
40-4
8as
apro
por
tion
ofal
lem
plo
yees
0.19
50.
109
0.20
60.
099
0.19
00.
116
0.21
30.
080
age4
emplo
yees
aged
49-5
7as
apro
por
tion
ofal
lem
plo
yees
0.17
50.
106
0.17
00.
094
0.17
20.
112
0.18
50.
079
age5
emplo
yees
aged
58-6
5as
apro
por
tion
ofal
lem
plo
yees
0.15
50.
118
0.14
50.
103
0.15
70.
125
0.15
10.
089
skill0
emplo
yees
wit
hco
mpuls
ory
educa
tion
asa
pro
por
tion
ofal
lem
plo
yees
0.32
70.
189
0.33
70.
185
0.32
80.
194
0.32
50.
168
skill1
emplo
yees
wit
ha
seco
ndar
yed
uca
tion
asa
pro
por
tion
ofal
lem
plo
yees
0.58
20.
180
0.53
60.
159
0.58
80.
186
0.56
80.
164
skill2
emplo
yees
wit
ha
pos
t-se
condar
y/
tert
iary
educa
tion
asa
pro
por
tion
ofal
lem
plo
yees
0.09
20.
151
0.12
70.
164
0.08
50.
150
0.10
90.
152
tenure
aver
age
tenure
14.0
685.
010
13.7
985.
297
14.5
015.
188
15.2
834.
739
man
ager
sm
anag
ers
asa
pro
por
tion
ofal
lem
plo
yees
0.04
30.
059
0.04
00.
050
0.04
40.
064
0.03
80.
041
mid
dle
man
ager
sm
iddle
man
ager
sas
apro
por
tion
ofal
lem
plo
yees
0.17
00.
215
0.20
50.
231
0.15
50.
210
0.21
60.
221
blu
ecol
lblu
e-co
llar
wor
kers
asa
pro
por
tion
ofal
lem
plo
yees
0.70
10.
268
0.68
40.
263
0.72
40.
235
0.75
00.
258
index
ethnic
div
ersi
tydiv
ersi
tyin
dex
bas
edon
emplo
yees
’la
ngu
age
(35
cate
gori
es)
0.16
60.
281
0.60
00.
166
0.09
30.
217
0.40
50.
331
index
ethnic
div
ersi
ty(w
hit
e-co
llar
)div
ersi
tyin
dex
bas
edon
whit
e-co
llar
wor
kers
’la
ngu
age
(35
cate
gori
es)
0.10
90.
240
0.41
30.
306
0.05
30.
170
0.24
80.
321
index
ethnic
div
ersi
ty(b
lue-
collar
)div
ersi
tyin
dex
bas
edon
blu
e-co
llar
wor
kers
’la
ngu
age
(35
cate
gori
es)
0.04
60.
174
0.17
30.
303
0.02
30.
130
0.10
50.
244
index
ethnic
div
ersi
tydiv
ersi
tyin
dex
bas
edon
emplo
yees
’la
ngu
age
(20
cate
gori
es)
0.10
70.
224
0.31
30.
278
0.06
40.
181
0.27
30.
278
Acc
ounti
ng
Vari
able
s:la
bor
pro
duct
ivit
ylo
gof
sale
sp
erem
plo
yee
6.84
60.
813
6.84
10.
901
6.80
70.
799
6.97
50.
843
num
ber
ofem
plo
yees
firm
size
infu
llti
me
equiv
alen
ts68
.834
363.
478
166.
026
653.
394
21.9
859.
887
219.
468
725.
856
capit
alp
erem
plo
yee
log
ofca
pit
alst
ock
per
emplo
yee
4.75
61.
563
4.91
71.
692
4.64
81.
531
5.11
01.
614
exp
ort
1,if
the
firm
exp
orts
0.40
80.
491
0.56
90.
495
0.33
20.
471
0.65
40.
476
fore
ign
owner
ship
1,if
the
firm
isfo
reig
now
ned
0.00
40.
062
0.00
60.
078
0.00
40.
062
0.00
40.
064
mult
i1,
ifth
efirm
ism
ult
i-es
tablish
men
t0.
122
0.32
70.
243
0.42
90.
029
0.16
70.
426
0.49
5N
165,
447
44,5
8712
0,71
848
,468
Num
ber
of
firm
s14
,065
3,81
010
,111
3,95
4C
ust
om
sD
ata
Sam
ple
of
exp
ort
ing
firm
sex
por
tsa
les
per
emplo
yee
aggr
egat
edva
lue
ofa
firm
’sex
por
tac
ross
all
pro
duct
san
ddes
tinat
ions
per
emplo
yee
309.
495
5307
.692
346.
632
452.
249
306.
299
6842
.321
314.
285
479.
063
exp
ort
mar
kets
num
ber
ofdes
tinat
ion
exp
ort
mar
kets
14.6
9114
.994
21.1
0718
.901
10.4
129.
803
21.0
9918
.686
exp
ort
pro
duct
snum
ber
ofpro
duct
sex
por
ted
9.65
617
.615
13.5
5121
.861
6.63
110
.057
14.1
8624
.277
exp
ort
exp
erie
nce
num
ber
ofye
ars
that
afirm
has
bee
nex
por
ting
inth
esa
mple
per
iod
5.64
06.
630
8.17
76.
787
4.65
46.
263
8.08
36.
876
firm
net
wor
knum
ber
ofD
anis
hfirm
sex
por
ting
toth
esa
me
des
tinat
ion
wit
hin
the
sam
ein
dust
ry35
4.93
466.
683
295.
893
417.
271
459.
738
527.
1730
8.11
243
0.76
2N
65,9
6425
,373
39,6
1526
,317
Num
ber
of
firm
s5,
333
2,04
53,
227
2,10
6
Note
s:A
lldes
crip
tive
stat
isti
csar
eca
lcu
late
dov
erth
ep
erio
d1995-2
007.
The
ind
ust
rial
sect
ors
incl
ud
edin
the
emp
iric
al
an
aly
sis
are
the
foll
owin
g:fo
od
,b
ever
ages
and
tob
acc
o(4
.05%
);te
xti
les
(2%
);w
ood
pro
du
cts
(6.1
9%
);ch
emic
als
(3.9
5%
);oth
ern
on
-m
etal
lic
min
eral
pro
du
cts
(1.9
4%);
bas
icm
etals
(18.9
5%
);fu
rnit
ure
(3.4
6%
);co
nst
ruct
ion
(15.0
7%
);sa
lean
dre
pair
of
moto
rve
hic
les
(3.6
4%);
wh
oles
ale
trad
e(1
4.67%
);re
tail
trad
e(6
.06%
);h
ote
lsan
dre
stau
rants
(2.0
8%
);tr
ansp
ort
(6.1
2%
);p
ost
and
tele
com
mu
nic
atio
ns
(0.4
0%);
fin
anci
alin
term
edia
tion
(1.1
7%
);an
db
usi
nes
sact
ivit
ies
(10.2
5%
).S
ize1
:10
to49
emp
loyee
s;S
ize2
:50
orm
ore
emp
loyee
s.
48

Tab
le2:
Eth
nic
div
ersi
tyby
indust
ryan
dye
ar
Ind
ust
ryY
ear
Manu
fact
uri
ng
Con
stru
ctio
nW
hole
sale
an
dre
tail
trad
eT
ran
sport
Fin
an
cial
an
db
usi
ness
serv
ice
1995
0.16
820.
0339
0.04
27-
-19
960.
1824
0.03
810.
0509
--
1997
0.19
170.
0459
0.05
71-
-19
980.
2082
0.04
770.
0949
--
1999
0.21
120.
0500
0.10
720.
0727
0.18
1020
000.
2290
0.05
540.
1182
0.10
360.
2039
2001
0.23
780.
0599
0.12
530.
1133
0.20
0820
020.
2424
0.05
740.
1303
0.13
330.
2006
2003
0.24
250.
0581
0.13
100.
1419
0.20
1920
040.
2490
0.05
810.
1433
0.15
340.
2054
2005
0.25
660.
0701
0.16
270.
1631
0.21
7620
060.
2728
0.08
020.
1717
0.17
570.
2329
2007
0.29
490.
0860
0.18
170.
1710
0.23
64
49

Tab
le3:
Shar
eof
fore
igner
sby
indust
ryan
dye
ar
Ind
ust
ryY
ear
Manu
fact
uri
ng
Con
stru
ctio
nW
hole
sale
an
dre
tail
trad
eT
ran
sport
Fin
an
cial
an
db
usi
ness
serv
ice
1995
0.01
600.
0054
0.00
76-
-19
960.
0165
0.00
630.
0093
--
1997
0.01
700.
0069
0.01
00-
-19
980.
0186
0.00
700.
0147
--
1999
0.01
800.
0072
0.01
620.
0096
0.02
4920
000.
0184
0.00
800.
0172
0.01
270.
0243
2001
0.01
900.
0078
0.01
770.
0138
0.02
3320
020.
0186
0.00
800.
0191
0.01
440.
0244
2003
0.01
780.
0074
0.01
940.
0155
0.02
5620
040.
0180
0.00
750.
0203
0.01
520.
0254
2005
0.01
960.
0102
0.02
430.
0148
0.02
7720
060.
0213
0.01
290.
0261
0.01
980.
0309
2007
0.02
430.
0153
0.02
660.
0201
0.03
37
50
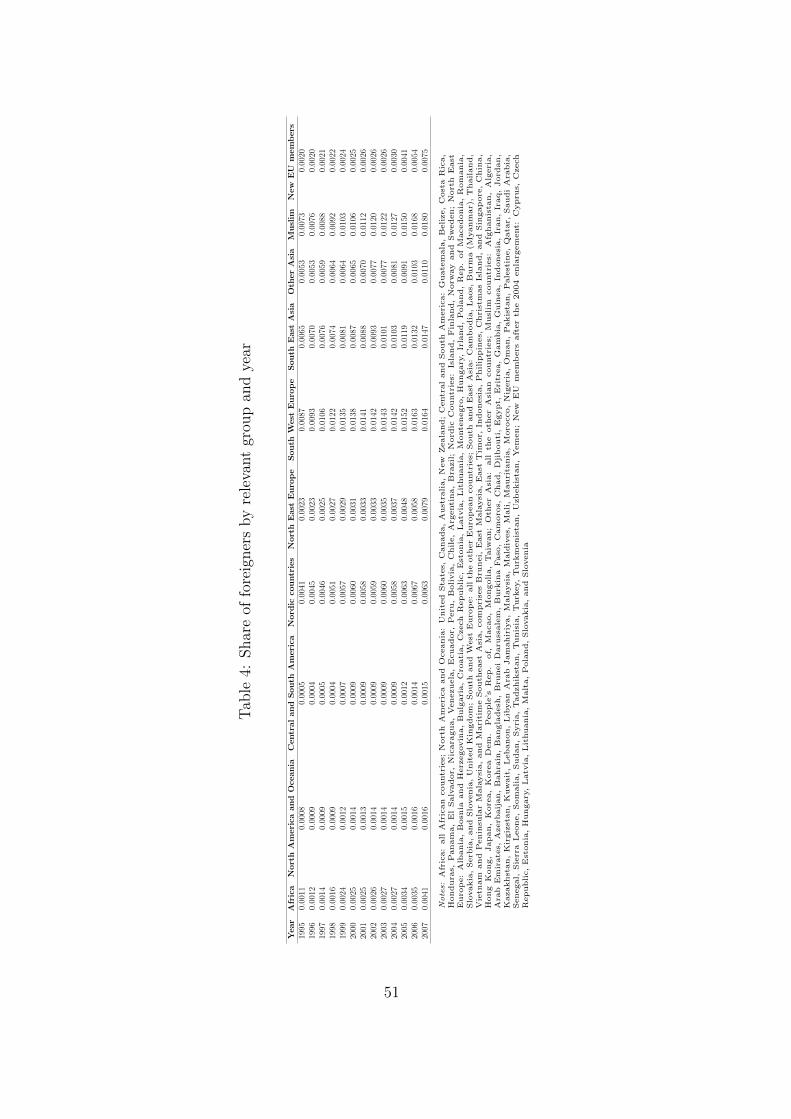
Tab
le4:
Shar
eof
fore
igner
sby
rele
vant
grou
pan
dye
ar
Year
Afr
ica
Nort
hA
meri
caan
dO
cean
iaC
entr
al
an
dS
ou
thA
meri
caN
ord
icco
untr
ies
Nort
hE
ast
Eu
rop
eS
ou
thW
est
Eu
rop
eS
ou
thE
ast
Asi
aO
ther
Asi
aM
usl
imN
ew
EU
mem
bers
1995
0.00
110.
0008
0.00
050.
0041
0.00
230.
0087
0.00
650.
0053
0.00
730.
0020
1996
0.00
120.
0009
0.00
040.
0045
0.00
230.
0093
0.00
700.
0053
0.00
760.
0020
1997
0.00
140.
0009
0.00
050.
0046
0.00
250.
0106
0.00
760.
0059
0.00
880.
0021
1998
0.00
160.
0009
0.00
040.
0051
0.00
270.
0122
0.00
740.
0064
0.00
920.
0022
1999
0.00
240.
0012
0.00
070.
0057
0.00
290.
0135
0.00
810.
0064
0.01
030.
0024
2000
0.00
250.
0014
0.00
090.
0060
0.00
310.
0138
0.00
870.
0065
0.01
060.
0025
2001
0.00
250.
0013
0.00
090.
0058
0.00
330.
0141
0.00
880.
0070
0.01
120.
0026
2002
0.00
260.
0014
0.00
090.
0059
0.00
330.
0142
0.00
930.
0077
0.01
200.
0026
2003
0.00
270.
0014
0.00
090.
0060
0.00
350.
0143
0.01
010.
0077
0.01
220.
0026
2004
0.00
270.
0014
0.00
090.
0058
0.00
370.
0142
0.01
030.
0081
0.01
270.
0030
2005
0.00
340.
0015
0.00
120.
0063
0.00
480.
0152
0.01
190.
0091
0.01
500.
0041
2006
0.00
350.
0016
0.00
140.
0067
0.00
580.
0163
0.01
320.
0103
0.01
680.
0054
2007
0.00
410.
0016
0.00
150.
0063
0.00
790.
0164
0.01
470.
0110
0.01
800.
0075
Notes:
Afr
ica:
all
Afr
ican
countr
ies;
Nort
hA
meri
ca
and
Oceania
:U
nit
ed
Sta
tes,
Canada,
Aust
ralia,
New
Zeala
nd;
Centr
al
and
South
Am
eri
ca:
Guate
mala
,B
elize,
Cost
aR
ica,
Hondura
s,P
anam
a,
El
Salv
ador,
Nic
ara
gua,
Venezuela
,E
cuador,
Peru
,B
olivia
,C
hile,
Arg
enti
na,
Bra
zil;
Nord
icC
ountr
ies:
Isla
nd,
Fin
land,
Norw
ay
and
Sw
eden;
Nort
hE
ast
Euro
pe:
Alb
ania
,B
osn
iaand
Herz
egovin
a,
Bulg
ari
a,
Cro
ati
a,
Czech
Republic,
Est
onia
,L
atv
ia,
Lit
huania
,M
onte
negro
,H
ungary
,Ir
land,
Pola
nd,
Rep.
of
Macedonia
,R
om
ania
,Slo
vakia
,Serb
ia,
and
Slo
venia
,U
nit
ed
Kin
gdom
;South
and
West
Euro
pe:
all
the
oth
er
Euro
pean
countr
ies;
South
and
East
Asi
a:
Cam
bodia
,L
aos,
Burm
a(M
yanm
ar)
,T
hailand,
Vie
tnam
and
Penin
sula
rM
ala
ysi
a,
and
Mari
tim
eSouth
east
Asi
a,
com
pri
ses
Bru
nei,
East
Mala
ysi
a,
East
Tim
or,
Indonesi
a,
Philip
pin
es,
Chri
stm
as
Isla
nd,
and
Sin
gap
ore
,C
hin
a,
Hong
Kong,
Japan,
Kore
a,
Kore
aD
em
.P
eople
’sR
ep.
of,
Macao,
Mongolia,
Taiw
an;
Oth
er
Asi
a:
all
the
oth
er
Asi
an
countr
ies;
Musl
imcountr
ies:
Afg
hanis
tan,
Alg
eri
a,
Ara
bE
mir
ate
s,A
zerb
aij
an,
Bahra
in,
Bangla
desh
,B
runei
Daru
ssale
m,
Burk
ina
Faso
,C
am
oro
s,C
had,
Dji
bouti
,E
gypt,
Eri
trea,
Gam
bia
,G
uin
ea,
Indonesi
a,
Iran,
Iraq,
Jord
an,
Kazakhst
an,
Kir
giz
stan,
Kuw
ait
,L
ebanon,
Lib
yan
Ara
bJam
ahir
iya,
Mala
ysi
a,
Mald
ives,
Mali,
Mauri
tania
,M
oro
cco,
Nig
eri
a,
Om
an,
Pakis
tan,
Pale
stin
e,
Qata
r,Saudi
Ara
bia
,Senegal,
Sie
rra
Leone,
Som
alia,
Sudan,
Syri
a,
Tadzhik
stan,
Tunis
ia,
Turk
ey,
Turk
menis
tan,
Uzb
ekis
tan,
Yem
en;
New
EU
mem
bers
aft
er
the
2004
enla
rgem
ent:
Cypru
s,C
zech
Republic,
Est
onia
,H
ungary
,L
atv
ia,
Lit
huania
,M
alt
a,
Pola
nd,
Slo
vakia
,and
Slo
venia
51

Table 5: Ethnic diversity and the export decision
Probability of exporting(1) (2) (3) (4) (5) (6)
OLS OLS OLS FE FE FEindex ethnic diversity 0.184*** 0.036*** 0.033*** 0.020*** 0.016*** 0.016***
(0.008) (0.006) (0.006) (0.005) (0.005) (0.005)export experience 0.052*** 0.052*** 0.063*** 0.063***
(0.000) (0.000) (0.001) (0.001)lagged labor productivity 0.029*** 0.022*** 0.013*** 0.012**
(0.002) (0.003) (0.004) (0.004)skill1 0.043*** 0.008
(0.017) (0.012)skill2 0.056*** 0.042*
(0.009) (0.025)men 0.006 -0.009
(0.009) (0.015)middle managers 0.062** -0.002
(0.023) (0.021)managers 0.049*** 0.007
(0.011) (0.011)N 165,447 118,207 118,207 165,447 118,207 118,207R2 0.426 0.724 0.726 0.009 0.011 0.013
Notes: The dependent variable is the probability of exporting. All regressions include whether thefirm is foreign-owned, a multi-establishment dummy, the log of capital stock per employee, a full setof industry (2 digit), size, year, and commuting areas dummies, and all year-industry interactions.Specifications in columns 3 and 6 also include the share of differently aged workers belonging to theemployees’ age distribution quartiles, the firm average tenure, and the share of foreigners for eachlinguistic group. Standard errors are clustered at the firm level. Significance levels: ***1%, **5%,*10%.
52

Tab
le6:
Eth
nic
div
ersi
tyan
dth
epro
por
tion
ofou
tput
exp
orte
d
Log
of
exp
ort
sale
sp
er
em
plo
yee
(1)
(2)
(3)
(4)
(5)
(6)
(7)
(8)
(9)
OL
SO
LS
OL
SP
ool
edF
EP
ool
edF
EP
ool
edF
ED
esti
nat
ion
FE
Des
tinat
ion
FE
Des
tinat
ion
FE
index
ethnic
div
ersi
ty1.
151*
**1.
112*
**0.
627*
**0.
161*
**0.
157*
**0.
141*
**0.
928*
**0.
925*
**0.
555*
**(0
.065
)(0
.070
)(0
.071
)(0
.037
)(0
.039
)(0
.040
)(0
.015
)(0
.017
)(0
.018
)ex
por
tex
per
ience
0.10
9***
0.10
2***
0.00
10.
002
0.00
5***
0.00
5***
(0.0
05)
(0.0
05)
(0.0
07)
(0.0
07)
(0.0
01)
(0.0
01)
lagg
edla
bor
pro
duct
ivit
y0.
365*
**0.
343*
**0.
151*
**0.
155*
**0.
030*
**0.
045*
**(0
.036
)(0
.037
)(0
.035
)(0
.035
)(0
.008
)(0
.008
)sk
ill1
0.59
7***
-0.1
54-0
.527
***
(0.1
68)
(0.1
34)
(0.0
52)
skill2
0.88
5***
0.24
00.
507*
**(0
.266
)(0
.254
)(0
.075
)m
en-0
.941
***
-0.3
36**
-1.7
05**
*(0
.125
)(0
.150
)(0
.030
)ag
e1-3
.077
***
-0.0
64-3
.160
***
(0.3
76)
(0.2
65)
(0.1
34)
age2
-1.2
62**
*0.
114
-1.0
09**
*(0
.309
)(0
.228
)(0
.110
)ag
e3-0
.647
**0.
160
-1.5
03**
*(0
.269
)(0
.196
)(0
.096
)ag
e4-0
.121
0.32
4**
-1.4
39**
*(0
.240
)(0
.162
)(0
.105
)m
iddle
man
ager
s0.
883*
*0.
003
0.02
2(0
.272
)(0
.174
)(0
.093
)m
anag
ers
0.17
6***
0.09
20.
218*
**(0
.038
)(0
.111
)(0
.034
)te
nure
-0.0
87**
*-0
.003
-0.0
99**
*(0
.011
)(0
.009
)(0
.004
)em
plo
yee
net
wor
k0.
001*
*(0
.001
)firm
net
wor
k0.
001*
**(0
.000
)N
65,9
6451
,712
51,7
1265
,964
51,7
1251
,712
3,09
6,50
22,
651,
049
2,65
1,04
9R
20.
235
0.28
30.
308
0.02
50.
026
0.02
70.
296
0.31
30.
380
Note
s:In
colu
mn
s1-
6,th
ed
epen
den
tva
riab
leis
the
log
of
exp
ort
sale
sp
erem
plo
yee,
con
dit
ion
al
onex
por
tin
g.In
colu
mn
s7-9
,th
ed
epen
den
tva
riab
leis
the
des
tin
ati
on
spec
ific
log
of
exp
ort
sale
sp
erem
plo
yee,
con
dit
ion
al
on
exp
ort
ing.
All
regre
ssio
ns
incl
ud
ew
het
her
the
firm
isfo
reig
n-o
wn
ed,
am
ult
i-es
tab
lish
men
td
um
my,
the
log
ofca
pit
alst
ock
per
emp
loye
e,a
full
set
ofin
du
stry
(2d
igit
),si
ze,
year
,an
dco
mm
uti
ng
area
sd
um
mie
s,an
dall
year-
ind
ust
ryin
tera
ctio
ns.
Sp
ecifi
cati
on
sin
colu
mn
s3
and
6al
soin
clu
de
the
share
of
diff
eren
tly
aged
work
ers
bel
on
gin
gto
the
emp
loyee
s’age
dis
trib
uti
on
qu
arti
les,
the
firm
aver
age
tenu
re,an
dth
esh
are
of
fore
ign
ers
for
each
lin
gu
isti
cgro
up
.S
pec
ifica
tion
sin
colu
mn
s7-
9al
soin
clu
de
firm
-des
tin
ati
on
fixed
effec
ts.
Sta
nd
ard
erro
rsare
clu
ster
edat
the
firm
leve
l.S
ign
ifica
nce
leve
ls:
***1%
,**5%
,*10%
.
53

Table 7: Ethnic diversity and the number of export markets
Number of export markets(1) (2) (3) (4) (5) (6)
OLS OLS OLS FE FE FEindex ethnic diversity 12.973*** 12.294*** 11.125*** 2.362*** 2.010*** 1.875***
(0.596) (0.639) (0.649) (0.180) (0.183) (0.186)export experience 0.574*** 0.508*** 0.094** 0.096**
(0.031) (0.030) (0.041) (0.041)lagged labor productivity 4.017*** 3.405*** 1.095*** 1.098***
(0.243) (0.236) (0.160) (0.159)skill1 0.019 0.894*
(0.939) (0.546)skill2 9.258*** 1.476
(1.775) (1.332)men -11.699*** -0.903
(0.846) (0.719)middle managers 0.426 -0.273
(1.632) (0.723)managers 8.951*** -0.144
(0.903) (0.523)N 65,964 51,740 51,740 65,964 51,740 51,740R2 0.273 0.316 0.361 0.152 0.148 0.152
Notes: The dependent variable is the number of export markets, conditional on exporting. Allregressions include whether the firm is foreign-owned, a multi-establishment dummy, the log ofcapital stock per employee, a full set of industry (2 digit), size, year, and commuting areas dummies,and all year-industry interactions. Specifications in columns 3 and 6 also include the share ofdifferently aged workers belonging to the employees’ age distribution quartiles, the firm averagetenure, and the share of foreigners for each linguistic group. Standard errors are clustered at thefirm level. Significance levels: ***1%, **5%, *10%.
54
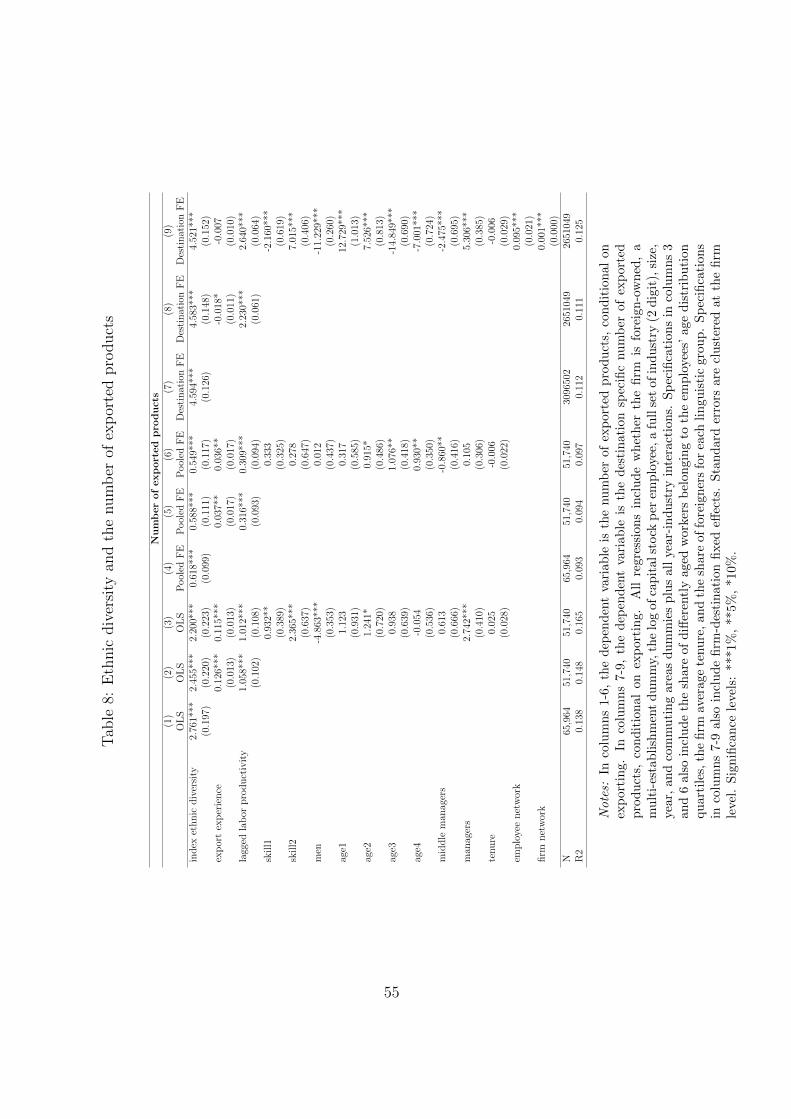
Tab
le8:
Eth
nic
div
ersi
tyan
dth
enum
ber
ofex
por
ted
pro
duct
s
Num
ber
of
exp
ort
ed
pro
duct
s(1
)(2
)(3
)(4
)(5
)(6
)(7
)(8
)(9
)O
LS
OL
SO
LS
Pool
edF
EP
ool
edF
EP
ool
edF
ED
esti
nat
ion
FE
Des
tinat
ion
FE
Des
tinat
ion
FE
index
ethnic
div
ersi
ty2.
761*
**2.
455*
**2.
200*
**0.
618*
**0.
588*
**0.
549*
**4.
594*
**4.
583*
**4.
521*
**(0
.197
)(0
.220
)(0
.223
)(0
.099
)(0
.111
)(0
.117
)(0
.126
)(0
.148
)(0
.152
)ex
por
tex
per
ience
0.12
6***
0.11
5***
0.03
7**
0.03
6**
-0.0
18*
-0.0
07(0
.013
)(0
.013
)(0
.017
)(0
.017
)(0
.011
)(0
.010
)la
gged
lab
orpro
duct
ivit
y1.
058*
**1.
012*
**0.
316*
**0.
309*
**2.
230*
**2.
640*
**(0
.102
)(0
.108
)(0
.093
)(0
.094
)(0
.061
)(0
.064
)sk
ill1
0.93
2**
0.33
3-2
.160
***
(0.3
89)
(0.3
25)
(0.6
19)
skill2
2.36
5***
0.27
87.
015*
**(0
.637
)(0
.647
)(0
.406
)m
en-4
.863
***
0.01
2-1
1.22
9***
(0.3
53)
(0.4
37)
(0.2
60)
age1
1.12
30.
317
12.7
29**
*(0
.931
)(0
.585
)(1
.013
)ag
e21.
241*
0.91
5*7.
526*
**(0
.720
)(0
.486
)(0
.813
)ag
e30.
938
1.07
6**
-14.
849*
**(0
.639
)(0
.418
)(0
.690
)ag
e4-0
.054
0.93
0**
-7.0
01**
*(0
.536
)(0
.350
)(0
.724
)m
iddle
man
ager
s0.
613
-0.8
60**
-2.4
75**
*(0
.666
)(0
.416
)(0
.695
)m
anag
ers
2.74
2***
0.10
55.
306*
**(0
.410
)(0
.306
)(0
.385
)te
nure
0.02
5-0
.006
-0.0
06(0
.028
)(0
.022
)(0
.029
)em
plo
yee
net
wor
k0.
095*
**(0
.021
)firm
net
wor
k0.
001*
**(0
.000
)N
65,9
6451
,740
51,7
4065
,964
51,7
4051
,740
3096
502
2651
049
2651
049
R2
0.13
80.
148
0.16
50.
093
0.09
40.
097
0.11
20.
111
0.12
5
Note
s:In
colu
mn
s1-
6,th
ed
epen
den
tva
riab
leis
the
nu
mb
erof
exp
ort
edp
rod
uct
s,co
nd
itio
nal
on
exp
orti
ng.
Inco
lum
ns
7-9
,th
ed
epen
den
tva
riab
leis
the
des
tin
ati
on
spec
ific
nu
mb
erof
exp
ort
edp
rod
uct
s,co
ndit
ion
alon
exp
ort
ing.
All
regre
ssio
ns
incl
ud
ew
het
her
the
firm
isfo
reig
n-o
wn
ed,
am
ult
i-es
tab
lish
men
td
um
my,
the
log
ofca
pit
alst
ock
per
emp
loye
e,a
full
set
ofin
du
stry
(2d
igit
),si
ze,
year
,an
dco
mm
uti
ng
area
sd
um
mie
sp
lus
all
yea
r-in
du
stry
inte
ract
ion
s.S
pec
ifica
tion
sin
colu
mn
s3
and
6al
soin
clu
de
the
share
of
diff
eren
tly
aged
work
ers
bel
on
gin
gto
the
emp
loyee
s’age
dis
trib
uti
on
qu
arti
les,
the
firm
aver
age
tenu
re,an
dth
esh
are
of
fore
ign
ers
for
each
lin
gu
isti
cgro
up
.S
pec
ifica
tion
sin
colu
mn
s7-
9al
soin
clu
de
firm
-des
tin
ati
on
fixed
effec
ts.
Sta
nd
ard
erro
rsare
clu
ster
edat
the
firm
leve
l.S
ign
ifica
nce
leve
ls:
***1%
,**5%
,*10%
.
55

Table 9: First stage regression results
First step(1) First step(2) First step(3) First step(4) First step(5)
ati index 0.016**(0.007)
(year>=2004)*ati index 0.024*** 0.020** 0.040** 0.091***(0.011) (0.010) (0.020) (0.023)
((year>=2004)*ati index)2 -0.095*** -0.084*** -0.075** -0.038*(0.022) (0.025) (0.023) (0.023)
(year-2004)*ati index 0.065*** 0.065*** 0.035*** -0.047***(0.008) (0.009) (0.008) (0.009)
(year>=2004)*(year-2004)*ati index -0.055*** -0.043*** -0.019** 0.035**(0.009) (0.010) (0.009) (0.013)
((year-2004)*ati index)2 0.014*** 0.014*** 0.007** -0.013***(0.002) (0.002) (0.002) (0.002)
((year>=2004)*(year-2004)*ati index)2 -0.011*** -0.015*** -0.009*** 0.024***(0.003) (0.003) (0.003) (0.004)
export experience 0.006*** 0.004*** 0.006*** 0.005***(0.000) (0.000) (0.000) (0.000)
lagged labor productivity -0.009*** -0.000 0.001 0.004**(0.001) (0.001) (0.002) (0.002)
skill1 -0.015** -0.037*** -0.037***(0.006) (0.006) (0.006)
skill2 0.008 -0.018* -0.008(0.010) (0.010) (0.010)
men -0.014** -0.015** -0.017**(0.005) (0.005) (0.005)
middle managers -0.063*** -0.051*** -0.051***(0.013) (0.014) (0.014)
managers 0.034*** 0.032*** 0.033***(0.006) (0.006) (0.006)
N 88,590 68,725 68,725 68,725 68,725R2 0.201 0.259 0.400 0.312 0.307
Notes: The dependent variable is the ethnic diversity at the firm level. In columns 1-3 ethnic diversity is instrumented using a polynomialapproximation centered on the year 2004, interacted with the ten-year moving average of the ati index in the commuting area wherethe firm is located. In column 4 ethnic diversity is instrumented using a polynomial approximation centered on the year 2004, interactedwith the current ati index within the commuting area where the firm is located. In column 5 ethnic diversity is instrumented with themoving average of the ati index within the commuting area where the firm is located. The estimation sample is from 2001 to 2007. Allregressions include whether the firm is foreign-owned, a multi-establishment dummy, the log of capital stock per employee, a full set ofindustry (2 digit), size, and commuting areas dummies. Columns 3-5 also include the share of differently aged workers belonging to theemployees age’ distribution quartiles, the firm average tenure, and the share of foreigners for each linguistic group. Standard errors areclustered at the commuting area level. Significance levels: ***1%, **5%, *10%.
56
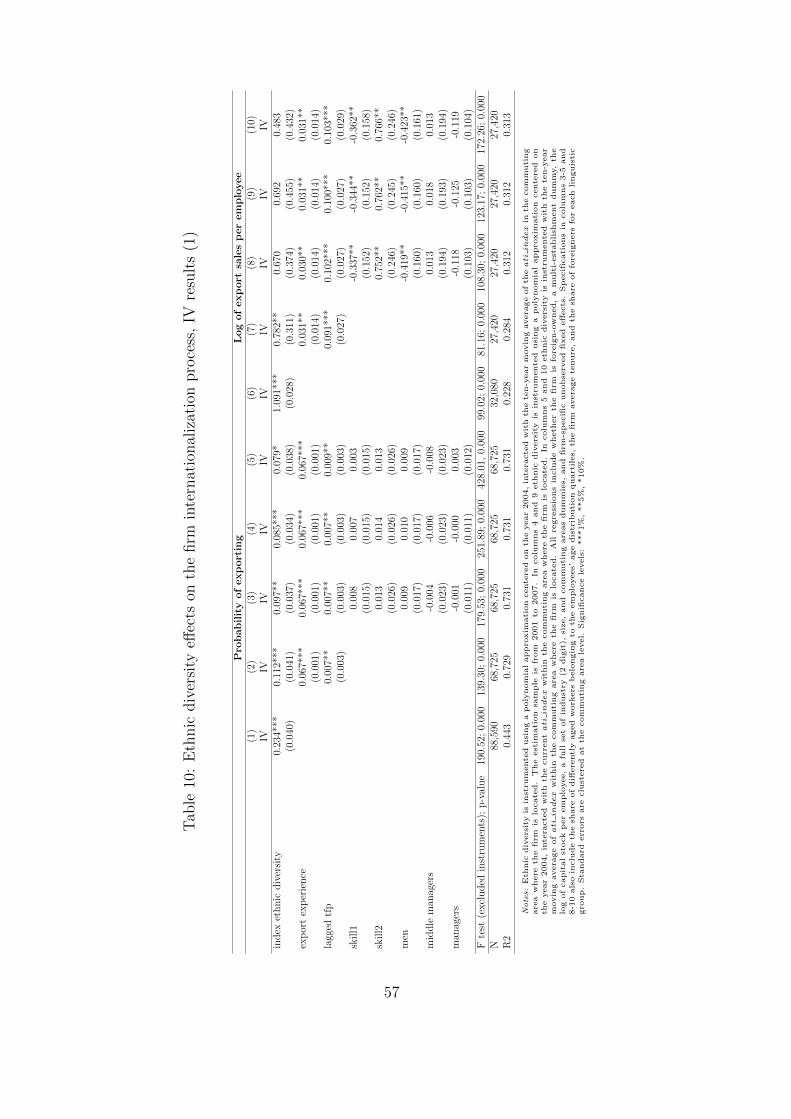
Tab
le10
:E
thnic
div
ersi
tyeff
ects
onth
efirm
inte
rnat
ional
izat
ion
pro
cess
,IV
resu
lts
(1)
Pro
bab
ilit
yof
exp
ort
ing
Log
of
exp
ort
sale
sp
er
em
plo
yee
(1)
(2)
(3)
(4)
(5)
(6)
(7)
(8)
(9)
(10)
IVIV
IVIV
IVIV
IVIV
IVIV
index
ethnic
div
ersi
ty0.
234*
**0.
112*
**0.
097*
*0.
085*
**0.
079*
1.09
1***
0.78
2**
0.67
00.
692
0.48
3(0
.040
)(0
.041
)(0
.037
)(0
.034
)(0
.038
)(0
.028
)(0
.311
)(0
.374
)(0
.455
)(0
.432
)ex
por
tex
per
ience
0.06
7***
0.06
7***
0.06
7***
0.06
7***
0.03
1**
0.03
0**
0.03
1**
0.03
1**
(0.0
01)
(0.0
01)
(0.0
01)
(0.0
01)
(0.0
14)
(0.0
14)
(0.0
14)
(0.0
14)
lagg
edtf
p0.
007*
*0.
007*
*0.
007*
*0.
009*
*0.
091*
**0.
102*
**0.
100*
**0.
103*
**(0
.003
)(0
.003
)(0
.003
)(0
.003
)(0
.027
)(0
.027
)(0
.027
)(0
.029
)sk
ill1
0.00
80.
007
0.00
3-0
.337
**-0
.344
**-0
.362
**(0
.015
)(0
.015
)(0
.015
)(0
.152
)(0
.152
)(0
.158
)sk
ill2
0.01
30.
014
0.01
30.
752*
*0.
762*
*0.
766*
*(0
.026
)(0
.026
)(0
.026
)(0
.246
)(0
.245
)(0
.246
)m
en0.
009
0.01
00.
009
-0.4
19**
-0.4
15**
-0.4
23**
(0.0
17)
(0.0
17)
(0.0
17)
(0.1
60)
(0.1
60)
(0.1
61)
mid
dle
man
ager
s-0
.004
-0.0
06-0
.008
0.01
30.
018
0.01
3(0
.023
)(0
.023
)(0
.023
)(0
.194
)(0
.193
)(0
.194
)m
anag
ers
-0.0
01-0
.000
0.00
3-0
.118
-0.1
25-0
.119
(0.0
11)
(0.0
11)
(0.0
12)
(0.1
03)
(0.1
03)
(0.1
04)
Fte
st(e
xcl
uded
inst
rum
ents
);p-v
alue
190.
52;
0.00
013
9.30
;0.
000
179.
53;
0.00
025
1.89
;0.
000
428.
01,
0.00
099
.02;
0.00
081
.16;
0.00
010
8.30
;0.
000
123.
17;
0.00
017
2.26
;0.
000
N88
,590
68,7
2568
,725
68,7
2568
,725
32,0
8027
,420
27,4
2027
,420
27,4
20R
20.
443
0.72
90.
731
0.73
10.
731
0.22
80.
284
0.31
20.
312
0.31
3
Notes:
Eth
nic
div
ers
ity
isin
stru
mente
dusi
ng
ap
oly
nom
ial
appro
xim
ati
on
cente
red
on
the
year
2004,
inte
racte
dw
ith
the
ten-y
ear
movin
gavera
ge
of
theati
index
inth
ecom
muti
ng
are
aw
here
the
firm
islo
cate
d.
The
est
imati
on
sam
ple
isfr
om
2001
to2007.
Incolu
mns
4and
9eth
nic
div
ers
ity
isin
stru
mente
dusi
ng
ap
oly
nom
ial
appro
xim
ati
on
cente
red
on
the
year
2004,
inte
racte
dw
ith
the
curr
entati
index
wit
hin
the
com
muti
ng
are
aw
here
the
firm
islo
cate
d.
Incolu
mns
5and
10
eth
nic
div
ers
ity
isin
stru
mente
dw
ith
the
ten-y
ear
movin
gavera
ge
ofati
index
wit
hin
the
com
muti
ng
are
aw
here
the
firm
islo
cate
d.
All
regre
ssio
ns
inclu
de
wheth
er
the
firm
isfo
reig
n-o
wned,
am
ult
i-est
ablish
ment
dum
my,
the
log
of
capit
al
stock
per
em
plo
yee,
afu
llse
tof
indust
ry(2
dig
it),
size,
and
com
muti
ng
are
as
dum
mie
s,and
firm
-sp
ecifi
cunobse
rved
fixed
eff
ects
.Sp
ecifi
cati
ons
incolu
mns
3-5
and
8-1
0als
oin
clu
de
the
share
of
diff
ere
ntl
yaged
work
ers
belo
ngin
gto
the
em
plo
yees’
age
dis
trib
uti
on
quart
iles,
the
firm
avera
ge
tenure
,and
the
share
of
fore
igners
for
each
linguis
tic
gro
up.
Sta
ndard
err
ors
are
clu
stere
dat
the
com
muti
ng
are
ale
vel.
Sig
nifi
cance
levels
:***1%
,**5%
,*10%
.
57

Tab
le11
:E
thnic
div
ersi
tyeff
ects
onth
efirm
inte
rnat
ional
izat
ion
pro
cess
,IV
resu
lts
(2)
Num
ber
of
exp
ort
mark
ets
Num
ber
of
exp
ort
ed
pro
duct
s(1
)(2
)(3
)(4
)(5
)(6
)(7
)(8
)(9
)(1
0)IV
IVIV
IVIV
IVIV
IVIV
IVin
dex
ethnic
div
ersi
ty23
.610
***
15.3
40**
*14
.916
***
13.8
57**
*16
.111
***
17.7
87**
*15
.482
***
13.1
68**
*12
.604
***
16.7
09**
*(1
.422
)(1
.345
)(1
.185
)(1
.083
)(2
.274
)(1
.013
)(1
.047
)(0
.869
)(0
.796
)(1
.803
)ex
por
tex
per
ience
0.24
1***
0.24
3***
0.24
5***
0.24
6***
0.08
1*0.
084*
0.08
4**
0.08
7*(0
.060
)(0
.059
)(0
.058
)(0
.060
)(0
.046
)(0
.043
)(0
.043
)(0
.048
)la
gged
tfp
1.19
4***
1.06
0***
1.04
3***
1.01
4***
0.50
1***
0.36
9***
0.35
1***
0.29
9***
(0.1
07)
(0.1
07)
(0.1
05)
(0.1
12)
(0.0
83)
(0.0
78)
(0.0
78)
(0.0
89)
skill1
0.24
50.
185
0.39
7-0
.043
-0.0
200.
367
(0.6
58)
(0.6
50)
(0.6
97)
(0.4
83)
(0.4
78)
(0.5
53)
skill2
1.21
11.
394
1.34
31.
522*
1.39
0*1.
482*
(1.0
63)
(1.0
48)
(1.0
84)
(0.7
80)
(0.7
70)
(0.8
60)
men
-0.2
07-0
.191
-0.1
01-0
.735
-0.7
28-0
.565
(0.6
94)
(0.6
85)
(0.7
12)
(0.5
09)
(0.5
03)
(0.5
65)
mid
dle
man
ager
s-0
.585
-0.5
57-0
.489
-0.7
91-0
.723
-0.5
99(0
.839
)(0
.828
)(0
.858
)(0
.615
)(0
.609
)(0
.681
)m
anag
ers
-0.6
67-0
.622
-0.7
04-0
.212
-0.1
77-0
.327
(0.4
45)
(0.4
39)
(0.4
60)
(0.3
27)
(0.3
23)
(0.3
65)
Fte
st(e
xcl
uded
inst
rum
ents
);p-v
alue
94.4
1;0.
000
82.7
8;0.
000
109.
30;
0.00
012
4.98
;0.
000
177.
37;
0.00
094
.41;
0.00
082
.78;
0.00
010
9.30
;0.
000
124.
98;
0.00
017
7.37
;0.
000
N32
,080
27,4
2027
,420
27,4
2027
,420
32,0
8027
,420
27,4
2027
,420
27,4
20R
20.
252
0.29
90.
344
0.34
40.
344
0.12
40.
133
0.15
10.
151
0.15
2
Notes:
Eth
nic
div
ers
ity
isin
stru
mente
dusi
ng
ap
oly
nom
ial
appro
xim
ati
on
cente
red
on
the
year
2004,
inte
racte
dw
ith
the
ten-y
ear
movin
gavera
ge
of
theati
index
inth
ecom
muti
ng
are
aw
here
the
firm
islo
cate
d.
The
est
imati
on
sam
ple
isfr
om
2001
to2007.
Incolu
mns
4and
9eth
nic
div
ers
ity
isin
stru
mente
dusi
ng
ap
oly
nom
ial
appro
xim
ati
on
cente
red
on
the
year
2004,
inte
racte
dw
ith
the
curr
entati
index
wit
hin
the
com
muti
ng
are
aw
here
the
firm
islo
cate
d.
Incolu
mns
5and
10
eth
nic
div
ers
ity
isin
stru
mente
dw
ith
the
ten-y
ear
movin
gavera
ge
ofati
index
wit
hin
the
com
muti
ng
are
aw
here
the
firm
islo
cate
d.
All
regre
ssio
ns
inclu
de
wheth
er
the
firm
isfo
reig
n-o
wned,
am
ult
i-est
abli
shm
ent
dum
my,
the
log
of
capit
al
stock
per
em
plo
yee,
afu
llse
tof
indust
ry(2
dig
it),
size,
and
com
muti
ng
are
as
dum
mie
s,and
firm
-sp
ecifi
cunobse
rved
fixed
eff
ects
.A
llre
gre
ssio
ns
inclu
de
wheth
er
the
firm
isfo
reig
n-o
wned,
am
ult
i-est
ablish
ment
dum
my,
the
log
of
capit
al
stock
per
em
plo
yee,
afu
llse
tof
indust
ry(2
dig
it),
size,
and
com
muti
ng
are
as
dum
mie
s,and
firm
-sp
ecifi
cunobse
rved
fixed
eff
ects
.Sp
ecifi
cati
ons
incolu
mns
3-5
and
8-1
0als
oin
clu
de
the
share
of
diff
ere
ntl
yaged
work
ers
belo
ngin
gto
the
em
plo
yees’
age
dis
trib
uti
on
quart
iles,
the
firm
avera
ge
tenure
,and
the
share
of
fore
igners
for
each
linguis
tic
gro
up.
Sta
ndard
err
ors
are
clu
stere
dat
the
com
muti
ng
are
ale
vel.
Sig
nifi
cance
levels
:***1%
,**5%
,*10%
.
58
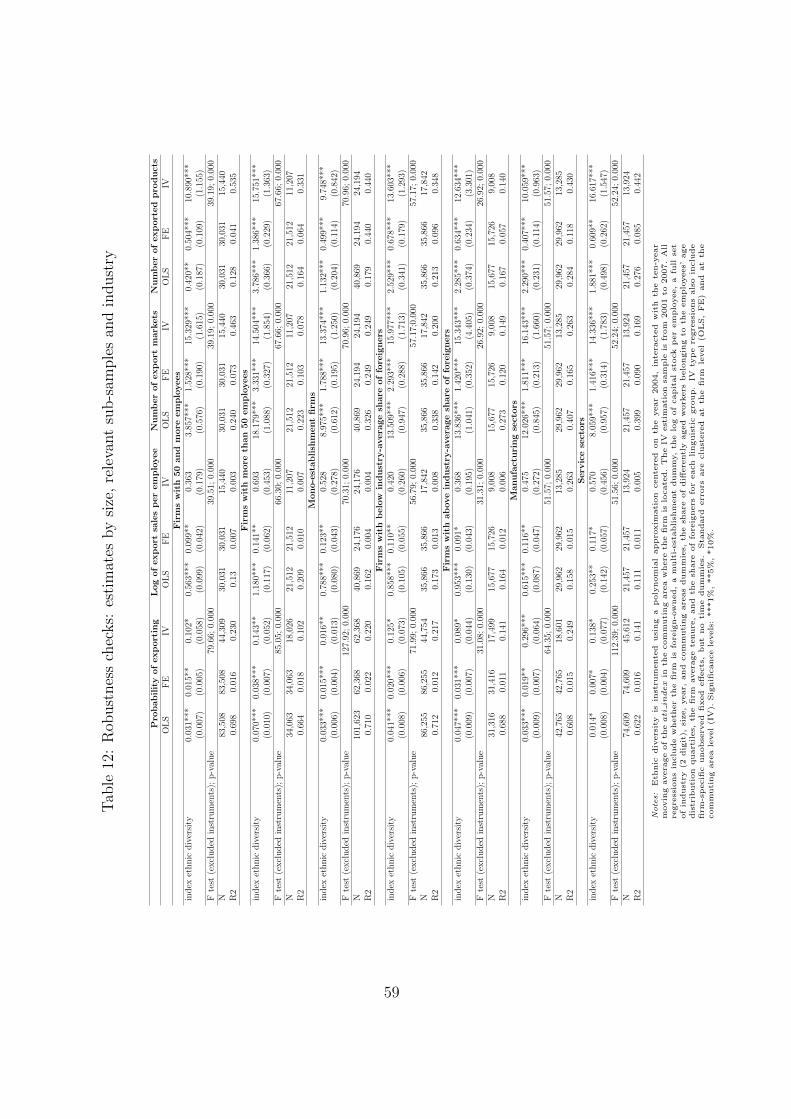
Tab
le12
:R
obust
nes
sch
ecks:
esti
mat
esby
size
,re
leva
nt
sub-s
ample
san
din
dust
ry
Pro
bab
ilit
yof
exp
ort
ing
Log
of
exp
ort
sale
sp
er
em
plo
yee
Nu
mb
er
of
exp
ort
mark
ets
Nu
mb
er
of
exp
ort
ed
pro
du
cts
OL
SF
EIV
OL
SF
EIV
OL
SF
EIV
OL
SF
EIV
Fir
ms
wit
h50
an
dm
ore
em
plo
yees
ind
exet
hn
icd
iver
sity
0.03
1***
0.01
5**
0.10
2*0.
563*
**0.
099*
*0.
363
3.85
7***
1.52
8***
15.3
29**
*0.
420*
*0.
504*
**10
.890
***
(0.0
07)
(0.0
05)
(0.0
58)
(0.0
99)
(0.0
42)
(0.1
79)
(0.5
76)
(0.1
90)
(1.6
15)
(0.1
87)
(0.1
09)
(1.1
55)
Fte
st(e
xcl
ud
edin
stru
men
ts);
p-v
alu
e79
.66;
0.00
039
.51;
0.00
039
.19;
0.00
039
.19;
0.00
0N
83,5
0883
,508
44,3
0930
,031
30,0
3115
,440
30,0
3130
,031
15,4
4030
,031
30,0
3115
,440
R2
0.69
80.
016
0.23
00.
130.
007
0.00
30.
240
0.07
30.
463
0.12
80.
041
0.53
5F
irm
sw
ith
more
than
50
em
plo
yees
ind
exet
hn
icd
iver
sity
0.07
0***
0.03
8***
0.14
3**
1.18
0***
0.14
1**
0.69
318
.179
***
3.33
1***
14.5
04**
*3.
786*
**1.
386*
**15
.751
***
(0.0
10)
(0.0
07)
(0.0
52)
(0.1
17)
(0.0
62)
(0.4
53)
(1.0
88)
(0.3
27)
(1.8
54)
(0.3
66)
(0.2
29)
(1.3
63)
Fte
st(e
xcl
ud
edin
stru
men
ts);
p-v
alu
e85
.05;
0.00
066
.30;
0.00
067
.66;
0.00
067
.66;
0.00
0N
34,0
6334
,063
18,0
2621
,512
21,5
1211
,207
21,5
1221
,512
11,2
0721
,512
21,5
1211
,207
R2
0.66
40.
018
0.10
20.
209
0.01
00.
007
0.22
30.
103
0.07
80.
164
0.06
40.
331
Mon
o-e
stab
lish
ment
firm
sin
dex
eth
nic
div
ersi
ty0.
033*
**0.
015*
**0.
016*
*0.
788*
**0.
123*
*0.
528
8.97
5***
1.78
8***
13.3
74**
*1.
132*
**0.
499*
**9.
748*
**(0
.006
)(0
.004
)(0
.013
)(0
.080
)(0
.043
)(0
.278
)(0
.612
)(0
.195
)(1
.250
)(0
.204
)(0
.114
)(0
.842
)F
test
(excl
ud
edin
stru
men
ts);
p-v
alu
e12
7.92
;0.
000
70.3
1;0.
000
70.9
6;0.
000
70.9
6;0.
000
N10
1,62
362
,368
62,3
6840
,869
24,1
7624
,176
40,8
6924
,194
24,1
9440
,869
24,1
9424
,194
R2
0.71
00.
022
0.22
00.
162
0.00
40.
004
0.32
60.
249
0.24
90.
179
0.44
00.
440
Fir
ms
wit
hb
elo
win
du
stry
-avera
ge
share
of
fore
ign
ers
ind
exet
hn
icd
iver
sity
0.04
1***
0.02
0***
0.12
5*0.
858*
**0.
110*
*0.
420
13.5
09**
*2.
293*
**15
.977
***
2.52
9***
0.67
8***
13.6
03**
*(0
.008
)(0
.006
)(0
.073
)(0
.105
)(0
.055
)(0
.260
)(0
.947
)(0
.288
)(1
.713
)(0
.341
)(0
.179
)(1
.293
)F
test
(excl
ud
edin
stru
men
ts);
p-v
alu
e71
.99;
0.00
056
.79;
0.00
057
.17;
0.00
057
.17;
0.00
0N
86,2
5586
,255
44,7
5435
,866
35,8
6617
,842
35,8
6635
,866
17,8
4235
,866
35,8
6617
,842
R2
0.71
20.
012
0.21
70.
173
0.01
30.
008
0.33
80.
142
0.20
00.
213
0.09
60.
348
Fir
ms
wit
hab
ove
ind
ust
ry-a
vera
ge
share
of
fore
ign
ers
ind
exet
hn
icd
iver
sity
0.04
7***
0.03
1***
0.08
9*0.
953*
**0.
091*
0.36
813
.836
***
1.42
0***
15.3
43**
*2.
285*
**0.
634*
**12
.634
***
(0.0
09)
(0.0
07)
(0.0
44)
(0.1
30)
(0.0
43)
(0.1
95)
(1.0
41)
(0.3
52)
(4.4
05)
(0.3
74)
(0.2
34)
(3.3
01)
Fte
st(e
xcl
ud
edin
stru
men
ts);
p-v
alu
e31
.08;
0.00
031
.31;
0.00
026
.92;
0.00
026
.92;
0.00
0N
31,3
1631
,416
17,4
9915
,677
15,7
269,
008
15,6
7715
,726
9,00
815
,677
15,7
269,
008
R2
0.68
80.
011
0.14
10.
164
0.01
20.
006
0.27
30.
120
0.14
90.
167
0.05
70.
140
Manu
fact
uri
ng
sect
ors
ind
exet
hn
icd
iver
sity
0.03
3***
0.01
9**
0.29
6***
0.61
5***
0.11
6**
0.47
512
.026
***
1.81
1***
16.1
43**
*2.
290*
**0.
407*
**10
.059
***
(0.0
09)
(0.0
07)
(0.0
64)
(0.0
87)
(0.0
47)
(0.2
72)
(0.8
45)
(0.2
13)
(1.6
60)
(0.2
31)
(0.1
14)
(0.9
63)
Fte
st(e
xcl
ud
edin
stru
men
ts);
p-v
alu
e64
.35;
0.00
051
.57;
0.00
051
.57;
0.00
051
.57;
0.00
0N
42,7
6542
,765
18,6
0129
,962
29,9
6213
,285
29,9
6229
,962
13,2
8529
,962
29,9
6213
,285
R2
0.60
80.
015
0.24
90.
158
0.01
50.
263
0.40
70.
165
0.26
30.
284
0.11
80.
430
Serv
ice
sect
ors
ind
exet
hn
icd
iver
sity
0.01
4*0.
007*
0.13
8*0.
253*
*0.
117*
0.57
08.
059*
**1.
416*
**14
.336
***
1.88
1***
0.60
9**
16.6
17**
*(0
.008
)(0
.004
)(0
.077
)(0
.142
)(0
.057
)(0
.456
)(0
.957
)(0
.314
)(1
.783
)(0
.498
)(0
.262
)(1
.547
)F
test
(excl
ud
edin
stru
men
ts);
p-v
alu
e11
2.39
;0.
000
51.5
6;0.
000
52.2
4;0.
000
52.2
4;0.
000
N74
,609
74,6
0945
,612
21,4
5721
,457
13,9
2421
,457
21,4
5713
,924
21,4
5721
,457
13,9
24R
20.
622
0.01
60.
141
0.11
10.
011
0.00
50.
399
0.09
00.
169
0.27
60.
085
0.44
2
Notes:
Eth
nic
div
ers
ity
isin
stru
mente
dusi
ng
ap
oly
nom
ial
appro
xim
ati
on
cente
red
on
the
year
2004,
inte
racte
dw
ith
the
ten-y
ear
movin
gavera
ge
of
theati
index
inth
ecom
muti
ng
are
aw
here
the
firm
islo
cate
d.
The
IVest
imati
on
sam
ple
isfr
om
2001
to2007.
All
regre
ssio
ns
inclu
de
wheth
er
the
firm
isfo
reig
n-o
wned,
am
ult
i-est
ablish
ment
dum
my,
the
log
of
capit
al
stock
per
em
plo
yee,
afu
llse
tof
indust
ry(2
dig
it),
size,
year,
and
com
muti
ng
are
as
dum
mie
s,th
esh
are
of
diff
ere
ntl
yaged
work
ers
belo
ngin
gto
the
em
plo
yees’
age
dis
trib
uti
on
quart
iles,
the
firm
avera
ge
tenure
,and
the
share
of
fore
igners
for
each
linguis
tic
gro
up.
IVty
pe
regre
ssio
ns
als
oin
clu
de
firm
-sp
ecifi
cunobse
rved
fixed
eff
ects
,but
no
tim
edum
mie
s.Sta
ndard
err
ors
are
clu
stere
dat
the
firm
level
(OL
S,
FE
)and
at
the
com
muti
ng
are
ale
vel
(IV
).Sig
nifi
cance
levels
:***1%
,**5%
,*10%
.
59

Tab
le13
:R
obust
nes
sch
ecks:
esti
mat
esunder
alte
rnat
ive
defi
nit
ions
ofet
hnic
div
ersi
ty
Pro
babilit
yof
exp
ort
ing
Log
of
exp
ort
sale
sp
er
em
plo
yee
Num
ber
of
exp
ort
mark
ets
Num
ber
of
exp
ort
ed
pro
duct
sO
LS
FE
IVO
LS
FE
IVO
LS
FE
IVO
LS
FE
IVW
hit
e-c
ollar
ind
exet
hn
icd
iver
sity
0.02
5***
0.01
2**
0.03
3*0.
549*
**0.
091*
*0.
819
11.4
13**
*1.
964*
**10
.684
***
1.86
6***
0.45
5***
11.1
80**
*(0
.006
)(0
.004
)(0
.014
)(0
.069
)(0
.039
)(0
.425
)(0
.682
)(0
.191
)(1
.324
)(0
.213
)(0
.112
)(0
.986
)F
test
(excl
ud
edin
stru
men
ts);
p-v
alu
e13
1.47
;0.
000
72.5
4;0.
000
73.5
3;0.
000
73.5
3;0.
000
N11
8,20
711
8,20
778
,197
51,7
4051
,740
27,4
2051
,740
51,7
4027
,420
51,7
4051
,740
27,4
20R
20.
726
0.01
40.
728
0.30
80.
011
0.29
50.
364
0.13
30.
345
0.16
30.
068
0.13
4B
lue-c
ollar
ind
exet
hn
icd
iver
sity
0.01
8**
0.01
1**
0.08
80.
122
0.12
9***
0.44
76.
656*
**0.
997*
**7.
512*
**2.
207*
**0.
363*
*9.
956*
**(0
.007
)(0
.004
)(0
.052
)(0
.080
)(0
.036
)(0
.256
)(0
.761
)(0
.200
)(2
.320
)(0
.311
)(0
.115
)(1
.773
)F
test
(excl
ud
edin
stru
men
ts);
p-v
alu
e50
.02;
0.00
041
.64;
0.00
042
.05;
0.00
042
.05;
0.00
0N
118,
207
118,
207
78,1
9751
,740
51,7
4027
,420
51,7
4051
,740
27,4
2051
,740
51,7
4027
,420
R2
0.72
60.
011
0.73
10.
307
0.01
20.
311
0.34
60.
130
0.32
60.
164
0.06
80.
146
Index
base
don
20
linguis
tic
cate
gori
es
ind
exet
hn
icd
iver
sity
0.05
1***
0.02
3***
0.06
60.
975*
**0.
155*
*0.
431
12.0
02**
*1.
792*
**20
.148
***
5.72
7***
0.62
8***
17.5
68**
*(0
.008
)(0
.005
)(0
.027
)(0
.100
)(0
.051
)(0
.234
)(0
.841
)(0
.342
)(1
.572
)(0
.850
)(0
.153
)(1
.146
)F
test
(excl
ud
edin
stru
men
ts);
p-v
alu
e15
5.00
;0.
000
106.
73;
0.00
010
8.24
;0.
000
108.
24;
0.00
0N
118,
207
118,
207
78,1
9751
,740
51,7
4027
,420
51,7
4051
,740
27,4
2051
,740
51,7
4027
,420
R2
0.70
60.
013
0.73
00.
168
0.02
70.
310
0.29
80.
151
0.34
40.
133
0.12
50.
151
Index
base
don
nati
onality
(8ca
tegori
es)
ind
exet
hn
icd
iver
sity
0.04
4***
0.01
8***
0.05
70.
948*
**0.
135*
*0.
553
13.8
49**
*1.
710*
**19
.348
***
2.33
2***
0.50
8***
17.5
49**
*(0
.007
)(0
.005
)(0
.032
)(0
.093
)(0
.048
)(0
.399
)(0
.835
)(0
.227
)(1
.686
)(0
.271
)(0
.135
)(1
.264
)F
test
(excl
ud
edin
stru
men
ts);
p-v
alu
e12
3.02
;0.
000
72.5
1;0.
000
76.4
2;0.
000
76.4
2;0.
000
N11
8,20
711
8,20
778
,197
51,7
4051
,740
27,4
2051
,740
51,7
4027
,420
51,7
4051
,740
27,4
20R
20.
706
0.01
30.
730
0.16
80.
027
0.31
00.
298
0.15
10.
344
0.13
30.
125
0.15
1
Notes:
Eth
nic
div
ers
ity
isin
stru
mente
dusi
ng
ap
oly
nom
ial
appro
xim
ati
on
cente
red
on
the
year
2004,
inte
racte
dw
ith
the
ten-y
ear
movin
gavera
ge
of
theati
index
inth
ecom
muti
ng
are
aw
here
the
firm
islo
cate
d.
The
IVest
imati
on
sam
ple
isfr
om
2001
to2007.
All
regre
ssio
ns
inclu
de
wheth
er
the
firm
isfo
reig
n-o
wned,
am
ult
i-est
ablish
ment
dum
my,
the
log
of
capit
al
stock
per
em
plo
yee,
afu
llse
tof
indust
ry(2
dig
it),
size,
year,
and
com
muti
ng
are
as
dum
mie
s,th
esh
are
of
diff
ere
ntl
yaged
work
ers
belo
ngin
gto
the
em
plo
yees’
age
dis
trib
uti
on
quart
iles,
the
firm
avera
ge
tenure
,and
the
share
of
fore
igners
for
each
linguis
tic
gro
up.
IVty
pe
regre
ssio
ns
als
oin
clu
de
firm
-sp
ecifi
cunobse
rved
fixed
eff
ects
,but
no
tim
edum
mie
s.Sta
ndard
err
ors
are
clu
stere
dat
the
firm
level
(OL
S,
FE
)and
at
the
com
muti
ng
are
ale
vel
(IV
).Sig
nifi
cance
levels
:***1%
,**5%
,*10%
.
60

Tab
le14
:R
obust
nes
sch
ecks:
test
ing
our
iden
tifica
tion
stra
tegy
Pro
bab
ilit
yof
exp
ort
ing
Log
of
exp
ort
sale
sN
um
ber
of
exp
ort
mark
ets
Nu
mb
er
of
exp
ort
pro
du
cts
Sam
ple
2002-2
006
index
ethnic
div
ersi
ty0.
064
0.57
314
.084
***
10.6
97**
*(0
.035
)(0
.266
)(0
.795
)(1
.703
)F
test
(excl
uded
inst
rum
ents
);p-v
alue
1204
.66,
0.00
076
0.26
,0.
000
770.
16,
0.00
077
0.16
,0.
000
N55
,168
23,8
9523
,879
23,8
95R
20.
731
0.33
50.
293
0.13
3F
irm
sest
ab
lish
ed
befo
re2001
index
ethnic
div
ersi
ty0.
088*
0.66
716
.127
***
19.0
27**
*(0
.045
)(0
.369
)(2
.586
)(1
.894
)F
test
(excl
uded
inst
rum
ents
);p-v
alue
57.6
3;0.
000
41.3
3;0.
000
41.2
1;0.
000
41.2
1;0.
000
N16
,401
8,95
08,
950
8,95
0R
20.
126
0.00
60.
102
0.57
2A
ttit
ud
es
tow
ard
sin
dex
base
don
the
90th
perc
enti
levote
rp
osi
tion
index
ethnic
div
ersi
ty0.
020*
0.37
214
.990
***
13.4
21**
*(0
.011
)(0
.227
)(1
.189
)(0
.876
)F
test
(excl
uded
inst
rum
ents
);p-v
alue
179.
73;
0.00
010
7.84
;0.
000
108.
89;
0.00
010
8.89
;0.
000
N68
,725
27,4
2027
,420
27,4
20R
20.
194
0.00
40.
188
0.43
3A
ttit
ud
es
tow
ard
sin
dex,
excl
ud
ing
pote
nti
all
yen
dogen
ou
sst
ate
ments
index
ethnic
div
ersi
ty0.
022*
0.37
514
.894
***
13.3
39**
*(0
.011
)(0
.274
)(1
.184
)(0
.872
)F
test
(excl
uded
inst
rum
ents
);p-v
alue
180.
28;
0.00
010
8.44
;0.
000
109.
47;
0.00
010
9.47
;0.
000
N68
,725
27,4
2027
,420
27,4
20R
20.
194
0.00
20.
185
0.42
7D
iffere
nce
ind
iffere
nce
ap
pro
ach
index
ethnic
div
ersi
ty0.
014*
0.50
213
.317
***
9.23
5***
(0.0
08)
(0.3
38)
(1.4
20)
(0.9
71)
Fte
st(e
xcl
uded
inst
rum
ents
);p-v
alue
360.
05;
0.00
020
5.36
;0.
000
209.
71;
0.00
020
9.71
;0.
000
N68
,725
27,4
2027
,420
27,4
20R
20.
194
0.00
20.
185
0.42
7
Notes:
Inth
efi
rst
four
sub-p
anels
eth
nic
div
ers
ity
isin
stru
mente
dusi
ng
ap
oly
nom
ial
appro
xim
ati
on
cente
red
on
the
year
2004,
inte
racte
dw
ith
the
ten-y
ear
movin
gavera
ge
of
the
ati
index
inth
ecom
muti
ng
are
aw
here
the
firm
islo
cate
d.
Inth
ela
stsu
b-p
anel
eth
nic
div
ers
ity
isin
stru
mente
dusi
ng
the
2004
Euro
pean
Unio
nenla
rgem
ent
dum
my
inte
racte
dw
ith
the
avera
ge
of
the
ati
index
over
the
cours
eof
the
90s,
inth
ecom
muti
ng
are
aw
here
the
firm
islo
cate
d.
Inall
sub-p
anels
the
est
imati
on
sam
ple
isfr
om
2001
to2007.
All
regre
ssio
ns
inclu
de
wheth
er
the
firm
isfo
reig
n-o
wned,
am
ult
i-est
ablish
ment
dum
my,
the
log
of
capit
al
stock
per
em
plo
yee,
afu
llse
tof
indust
ry(2
dig
it),
size,
and
com
muti
ng
are
as
dum
mie
s,th
esh
are
of
diff
ere
ntl
yaged
work
ers
belo
ngin
gto
the
em
plo
yees’
age
dis
trib
uti
on
quart
iles,
the
firm
avera
ge
tenure
,th
esh
are
of
fore
igners
for
each
linguis
tic
gro
up,
and
firm
-sp
ecifi
cunobse
rved
fixed
eff
ects
.Sta
ndard
err
ors
are
clu
stere
dat
the
com
muti
ng
are
ale
vel.
Sig
nifi
cance
levels
:***1%
,**5%
,*10%
.
61
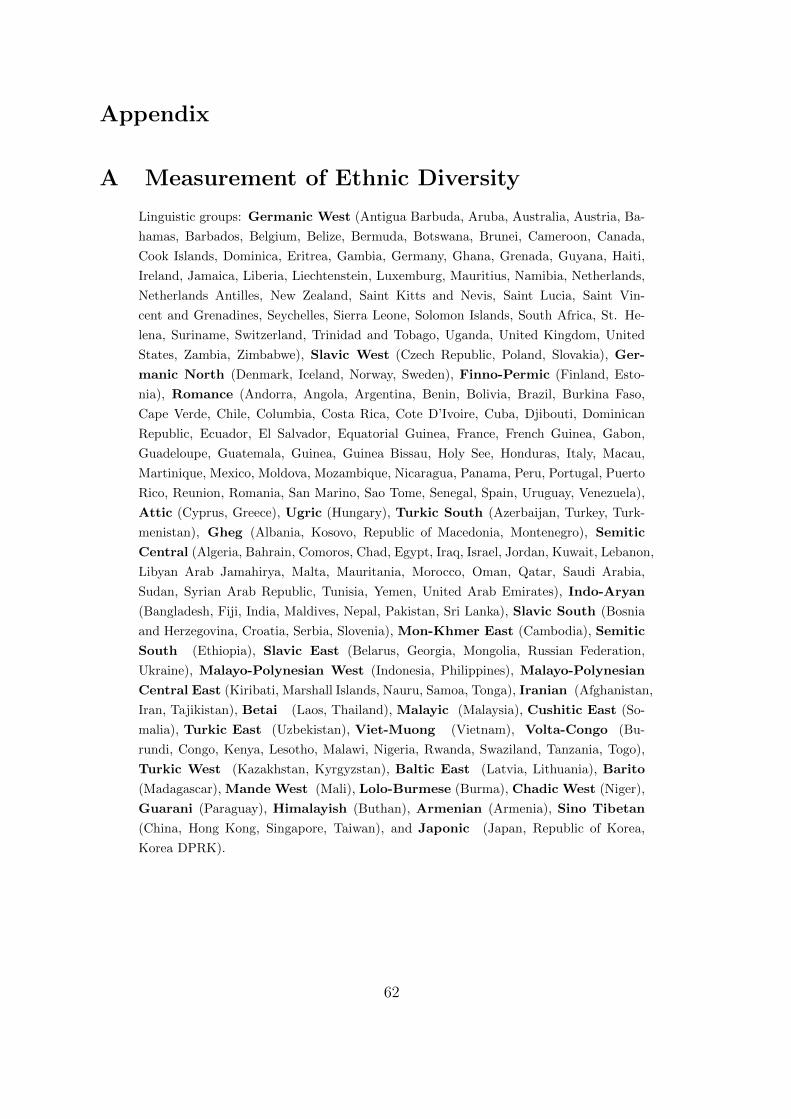
Appendix
A Measurement of Ethnic Diversity
Linguistic groups: Germanic West (Antigua Barbuda, Aruba, Australia, Austria, Ba-
hamas, Barbados, Belgium, Belize, Bermuda, Botswana, Brunei, Cameroon, Canada,
Cook Islands, Dominica, Eritrea, Gambia, Germany, Ghana, Grenada, Guyana, Haiti,
Ireland, Jamaica, Liberia, Liechtenstein, Luxemburg, Mauritius, Namibia, Netherlands,
Netherlands Antilles, New Zealand, Saint Kitts and Nevis, Saint Lucia, Saint Vin-
cent and Grenadines, Seychelles, Sierra Leone, Solomon Islands, South Africa, St. He-
lena, Suriname, Switzerland, Trinidad and Tobago, Uganda, United Kingdom, United
States, Zambia, Zimbabwe), Slavic West (Czech Republic, Poland, Slovakia), Ger-
manic North (Denmark, Iceland, Norway, Sweden), Finno-Permic (Finland, Esto-
nia), Romance (Andorra, Angola, Argentina, Benin, Bolivia, Brazil, Burkina Faso,
Cape Verde, Chile, Columbia, Costa Rica, Cote D’Ivoire, Cuba, Djibouti, Dominican
Republic, Ecuador, El Salvador, Equatorial Guinea, France, French Guinea, Gabon,
Guadeloupe, Guatemala, Guinea, Guinea Bissau, Holy See, Honduras, Italy, Macau,
Martinique, Mexico, Moldova, Mozambique, Nicaragua, Panama, Peru, Portugal, Puerto
Rico, Reunion, Romania, San Marino, Sao Tome, Senegal, Spain, Uruguay, Venezuela),
Attic (Cyprus, Greece), Ugric (Hungary), Turkic South (Azerbaijan, Turkey, Turk-
menistan), Gheg (Albania, Kosovo, Republic of Macedonia, Montenegro), Semitic
Central (Algeria, Bahrain, Comoros, Chad, Egypt, Iraq, Israel, Jordan, Kuwait, Lebanon,
Libyan Arab Jamahirya, Malta, Mauritania, Morocco, Oman, Qatar, Saudi Arabia,
Sudan, Syrian Arab Republic, Tunisia, Yemen, United Arab Emirates), Indo-Aryan
(Bangladesh, Fiji, India, Maldives, Nepal, Pakistan, Sri Lanka), Slavic South (Bosnia
and Herzegovina, Croatia, Serbia, Slovenia), Mon-Khmer East (Cambodia), Semitic
South (Ethiopia), Slavic East (Belarus, Georgia, Mongolia, Russian Federation,
Ukraine), Malayo-Polynesian West (Indonesia, Philippines), Malayo-Polynesian
Central East (Kiribati, Marshall Islands, Nauru, Samoa, Tonga), Iranian (Afghanistan,
Iran, Tajikistan), Betai (Laos, Thailand), Malayic (Malaysia), Cushitic East (So-
malia), Turkic East (Uzbekistan), Viet-Muong (Vietnam), Volta-Congo (Bu-
rundi, Congo, Kenya, Lesotho, Malawi, Nigeria, Rwanda, Swaziland, Tanzania, Togo),
Turkic West (Kazakhstan, Kyrgyzstan), Baltic East (Latvia, Lithuania), Barito
(Madagascar), Mande West (Mali), Lolo-Burmese (Burma), Chadic West (Niger),
Guarani (Paraguay), Himalayish (Buthan), Armenian (Armenia), Sino Tibetan
(China, Hong Kong, Singapore, Taiwan), and Japonic (Japan, Republic of Korea,
Korea DPRK).
62

B Definition of the ideological dimensions
B.1 Statements in favor of immigration, internationalization and ethnic diver-
sity
1. European community/union plus: Favorable mentions of European Community/Union
in general; desirability of expanding the European Community/Union and/or of in-
creasing its competence; desirability of expanding the competences of the European
Parliament; desirability of the manifesto country joining (or remaining a member).
2. Internationalism plus: Need for international cooperation; need for aid to devel-
oping countries; need for world planning of resources; need for international courts;
support for any international goal or world state; support for UN.
3. Lax citizenship plus: Favorable mentions of lax citizenship and election laws; no or
few restrictions to enfranchisement.
4. Multiculturalism plus: Cultural diversity, communalism, cultural plurality and pil-
larization; preservation of autonomy of religious, linguistic heritages within the country
including special educational provisions.
5. National way of life minus: Against patriotism and/or nationalism; opposition to
the existing national state; otherwise as National way of life minus, but negative.
6. Protectionism minus: Negative support for the concept of free trade; otherwise as
Protectionism plus, but negative.
7. Refugees plus: Favorable mentions of, or need for, assistance to people who left their
homes because of war (for instance, in the territory of ex-Yugoslavia) or were forcibly
displaced.
8. Social justice plus: Concept of equality; need for fair treatment of all people; special
protection for underprivileged; need for fair distribution of resources; removal of class
barriers; end with discrimination such as racial or sexual discrimination, etc.
63

9. Social harmony plus: Appeal for national effort and solidarity; need for society to
see itself as united; appeal for public spiritedness; decrying anti-social attitudes in
times of crisis; support for the public interest; favorable mention of the civil society
This category neither captures what your country can do for you nor what you can do
for your country, but what you can do for your fellow citizens.
10. Traditional morality minus: Opposition to traditional moral values; support for
divorce, abortion, etc.; otherwise as Traditional morality plus, but negative.
11. Underprivileged minority groups plus: Favorable references to underprivileged
minorities who are defined neither in economic nor in demographic terms; e.g., the
disabled, homosexuals, immigrants, etc.
12. Welfare state plus: Favorable mentions of need to introduce, maintain, or expand
any social service or social security scheme; support for social services such as health
services or social housing. This category excludes education.
B.2 Statements against immigration, internationalization and ethnic diversity
1. European community/union minus: Hostile mentions of the European Commu-
nity/Union; opposition to specific European policies which are preferred by European
authorities; opposition to the net-contribution of the manifesto country to the EU
budget.
2. Internationalism minus: Favorable mentions of national independence and sovereignty
as opposed to internationalism.
3. Multiculturalism minus: Enforcement or encouragement of cultural integration;
otherwise as Multiculturalism plus, but negative.
4. National way of life plus: In favor of patriotism and/or nationalism; suspension of
some freedoms in order to protect the state against subversion; support for established
national ideas.
64

5. Protectionism plus: Favorable mentions of extension or maintenance of tariffs to
protect internal markets; other domestic economic protectionism such as quota restric-
tions.
6. Restrictive citizenship plus: Favorable mentions of restrictions in citizenship; re-
strictions in enfranchisement with respect to (ethnic) groups.
7. Traditional morality plus: Favorable mentions of traditional moral values; prohi-
bition, censorship and suppression of immorality and unseemly behavior; maintenance
and stability of family; religion.
8. Welfare state minus: Limiting expenditure on social services or social security; oth-
erwise as Welfare state plus, but negative.
65

C Additional results
Table C.1: Estimation of the export decision without ethnic diversity, all sample
Probability of exportingOLS(1) OLS(2) FE(1) FE(2)
export experience 0.052*** 0.052*** 0.063*** 0.063***(0.000) (0.000) (0.001) (0.001)
lagged labor productivity 0.022*** 0.022*** 0.013** 0.012**(0.003) (0.003) (0.004) (0.004)
skill1 0.047*** 0.048*** 0.007 0.009(0.009) (0.009) (0.012) (0.012)
skill2 0.057** 0.055** 0.043* 0.042*(0.017) (0.017) (0.025) (0.025)
men -0.000 0.002 -0.008 -0.010(0.009) (0.009) (0.015) (0.015)
middle managers 0.059** 0.059** -0.003 -0.003(0.023) (0.023) (0.021) (0.021)
managers 0.049*** 0.050*** 0.007 0.008(0.011) (0.011) (0.011) (0.011)
N 118,207 118,207 118,207 118,207R2 0.725 0.725 0.013 0.013
Notes: The dependent variable is the probability of exporting. All regressions include whether thefirm is foreign-owned, a multi-establishment dummy, the log of capital stock per employee, a fullset of industry (2 digit), size, year, and commuting areas dummies, all year-industry interactions,the share of differently aged workers belonging to the employees’ age distribution quartiles, and thefirm average tenure. Columns 2 and 4 also include the share of foreigners for each linguistic group.Standard errors are clustered at the firm level. Significance levels: ***1%, **5%, *10%.
66

Table C.2: Estimation of the export decision without ethnic diversity, manufacturingsector
Probability of exportingOLS(1) OLS(2) FE(1) FE(2)
export experience 0.052*** 0.051*** 0.065*** 0.065***(0.000) (0.000) (0.002) (0.002)
lagged labor productivity 0.029*** 0.029*** 0.017** 0.018**(0.006) (0.006) (0.006) (0.006)
skill1 0.050** 0.059** 0.028 0.028(0.021) (0.022) (0.024) (0.024)
skill2 0.059** 0.064** 0.080* 0.082*(0.026) (0.026) (0.048) (0.048)
men 0.030* 0.036** -0.016 -0.017(0.018) (0.018) (0.029) (0.029)
middle managers 0.028 0.033 0.011 0.011(0.043) (0.043) (0.034) (0.034)
managers 0.029 0.036 0.023 0.025(0.029) (0.029) (0.024) (0.025)
N 42,829 42,829 42,829 42,829R2 0.618 0.618 0.022 0.022
Notes: The dependent variable is the probability of exporting. All regressions include whether thefirm is foreign-owned, a multi-establishment dummy, the log of capital stock per employee, a fullset of industry (2 digit), size, year, and commuting areas dummies, all year-industry interactions,the share of differently aged workers belonging to the employees’ age distribution quartiles, and thefirm average tenure. Columns 2 and 4 also include the share of foreigners for each linguistic group.Standard errors are clustered at the firm level. Significance levels: ***1%, **5%, *10%.
67

Table C.3: Ethnic diversity effects on the firm internationalization process, estimationby destination area
Log of export sales per employee Number of exported productsWestern Non western Western Non western
index ethnic diversity 0.553*** 0.561*** 5.454*** 3.836***(0.025) (0.045) (0.260) (0.283)
export experience -0.001 0.009** 0.042*** 0.015**(0.002) (0.004) (0.005) (0.006)
lagged labor productivity 0.176*** 0.061** 0.732*** 0.559***(0.012) (0.024) (0.032) (0.040)
skill1 -0.471*** -0.583*** 0.792*** 0.603**(0.070) (0.161) (0.200) (0.258)
skill2 0.230** 0.965*** 2.433*** 1.477***(0.107) (0.205) (0.293) (0.351)
men -1.472*** -2.136*** -2.950*** -1.935***(0.041) (0.093) (0.112) (0.159)
middle managers -0.051 -0.153* 0.539*** -0.185(0.131) (0.083) (0.159) (0.202)
managers 0.257*** 0.664** 0.518 0.697*(0.050) (0.228) (0.350) (0.398)
employee network 0.001* 0.001 0.001** 0.015***(0.001) (0.001) (0.000) (0.003)
firm network 0.001*** 0.001*** 0.001*** 0.001***(0.000) (0.000) (0.000) (0.000)
N 1,668,274 996,360 1,669,349 996,933R2 0.242 0.210 0.132 0.075
Notes: All regressions include whether the firm is foreign-owned, a multi-establishment dummy, the log of capitalstock per employee, a full set of industry (2 digit), size, year, and commuting areas dummies, all year-industryinteractions, firm-destination specific unobserved fixed effects, the share of differently aged workers belonging tothe employees’ age distribution quartiles, the firm average tenure, and the share of foreigners for each linguisticgroup. Non-Western destinations exclude Nordic countries, South and West Europe, North America and Oceania.Standard errors are clustered at the firm level. Significance levels: ***1%, **5%, *10%.
68