ethnic favoritism in primary education in kenya*
TRANSCRIPT

Ethnic Favoritism in Primary Education in Kenya*
Eric Kramon
Department of Political Science University of California, Los Angeles
Daniel N. Posner
Department of Political Science Massachusetts Institute of Technology
This Draft: 24 March 2012
Abstract African leaders are widely presumed to favor members of their own ethnic groups with patronage resources. We assess the empirical validity of this claim by studying ethnic favoritism in the education sector in Kenya. We use data on the educational attainment of more than fifty thousand Kenyans dating back to the colonial era, as well as information about the ethnic identities of Kenyan presidents, cabinet members, and high-level education bureaucrats since independence. We find that having a coethnic as president during one’s primary school-age years is associated with about a one-quarter of a year increase in years of primary schooling with and substantial increases in the probability of attending and completing both primary and secondary school. We also find that ethnic favoritism extends beyond the president: coethnics of the minister of education also acquire more schooling than children from other ethnic groups. In contrast to the findings of some recent studies, we find that multiparty political competition has no impact on the degree of ethnic favoritism by presidents and ministers of education. Nor has ethnic favoritism in the education sector varied across Kenya’s presidents. However, we find that the effect of the entire cabinet’s ethnic composition does vary over time: having more coethnics in the cabinet impacts educational attainment during the multiparty era during the tenure of a president of a relatively small ethnic group, which we suggest may have generated incentives to allocate more discretion over resources to ministers from other ethnic communities and which may have induced these ministers to be more redistributive with their spoils from office. Having established the role of ethnic favoritism in educational outcomes, we identify and provide suggestive evidence about the possible mechanisms explaining these patterns. We also highlight the substantive importance of ethnic favoritism by comparing our estimated effects to those estimated in studies of policy interventions designed to increase educational achievement in the developing world and by estimating the long-term impact of ethnic favoritism through education on a number of long-term socio-economic outcomes. * The authors thank members of the Working Group in African Political Economy (WGAPE) and seminar participants at MIT, Stanford, Oxford, Georgetown, Princeton, University of Virginia, the World Bank, and the Juan March Institute for their helpful comments on earlier drafts. We also thank Antony Munene for his research assistance.
1
Universal free primary education was introduced with great fanfare in Kenya in 2003. A major campaign promise of President Mwai Kibaki, whose Rainbow Coalition had come to power the year before, the commitment to provide free primary education for all Kenyan children was both a shrewd political move and a productive investment in the country’s long-term development (Psacharopoulos 1994; Duflo 2001; Case 2002). Education Minister George Saitoti summarized the new government’s position succinctly when he promised that “we will not be content until every child of primary school age is enrolled…By educating the children we are investing in the future of this country. In the long term, educating children is one way to eradicate poverty” (UN Office for the Coordination of Humanitarian Affairs 2003).
The Kibaki administration was not the first Kenyan government to pledge that all Kenyan children would have the opportunity to attend primary school. The pledge to provide universal primary education had been a promise of every Kenyan president since independence (Sifuna 2005; Nungu 2010). It featured prominently in the Kenya Africa National Union’s (KANU) post-independence manifestos of 1963 and 1969 and in the country’s first 5-year development plan (1964-69) (Oketch and Rollenton 2007). It was the rationale behind Jomo Kenyatta’s abolition of school fees for the first four years of primary education in 1973. It motivated Kenyatta’s successor, Daniel arap Moi, to scrap building levies and introduce a free school milk program in 1979 (Amutabi 2003; Oketch and Rolleston 2007). And it inspired the curricular reforms that Moi initiated in 1984, which were designed to reduce dropout rates by making primary schooling more practically oriented (Nungu 2010).
However, despite these policy initiatives, and notwithstanding repeated promises of “education for all,” significant inequalities in educational attainment persist across Kenya’s citizens. This paper focuses on one particular—and particularly politically consequential—aspect of these inequalities: those that exist across members of the country’s major ethnic groups. We focus on inter-ethnic inequality in educational attainment both because it is important in its own right (Alwy and Schech 2004) and because it provides a window onto the broader phenomenon of ethnic favoritism by political leaders in Kenya. By probing its sources and uncovering its patterns we can glean valuable lessons about how distributive politics operates in an African setting.1
Cross-group differences in primary school attainment are driven by multiple factors, political favoritism being only a part of the explanation. Differential rates of access to education during the pre-independence era gave some groups a leg up in terms of educational attainment, and this early access to schooling has had long-term consequences (Rothchild 1969; Oyugi 2000; Nunn 2011; Gallego and Woodberry 2010). Educational attainment is also shaped by a range of private and social factors unrelated to politics and policy such as a family’s socioeconomic status, religious affiliation, local norms about girls’ education, and the expected returns to investing in schooling (Clemens 2004). Our strategy, which we elaborate below, is to control for these individual- and group-level factors in order to isolate the impact of having a coethnic in a position of political power on the number of years of primary schooling that a child receives.
1 We must be cautious, however, in making general claims about distributive politics from the patterns of ethnic favoritism we observe in the education sector, as patterns of favoritism may differ in other areas (Kramon and Posner 2011).

2
Using data from the five separate Demographic and Health Surveys (DHS) conducted in Kenya between 1989 and 2008, we construct a time-series cross-sectional dataset that includes information on the educational attainment of more than fifty thousand individuals dating back to before the country’s independence in 1963. These data permit us to analyze the impact on educational attainment of having a coethnic in a position of political power during one’s primary school years, and of the ways in which this effect varies across both leaders and political regime type. To underscore the substantive importance of our results, we also estimate the impact of coethnic favoritism in the primary education sector on a range of outcomes that relate directly to an individual’s wellbeing later in life.
In keeping with findings of other researchers who have investigated ethnic favoritism by Kenyan presidents (Barkan and Chege 1989; Burgess et al 2011; Morjaria 2011; Carlson, Min and Posner 2010), we find evidence that the president’s ethnic kin are, in fact favored with respect to their educational achievements. Specifically, we find that having a coethnic as president during one’s primary school years is associated with an increase of 0.22 years of primary schooling, or about 3.9 percent. These results are robust to a regression discontinuity (RD) test, in which we analyze attendance and completion rates among the subset of Kenyan children who were enrolled in primary school during the three years preceding and following the transition from President Kenyatta to President Moi. Here again, we find strong effects of having a coethnic president: children who were members of the president’s ethnic group were 8 percentage points more likely to have attended and 4 percentage points more likely to have completed primary school.
We go beyond previous studies, however, by also investigating the impact on primary schooling of having a coethnic serving as the minister of education or as the permanent secretary in that ministry, and of having coethnics dominate the cabinet. While we find no general effect of having a coethnic serving as the permanent secretary or of an ethnic group’s share of the cabinet, we do find that for every one of an individual’s primary school years that corresponds with the tenure in office of a coethnic minister of education, that individual completes an average of 0.04 more years of primary schooling. This amounts to an additional quarter of a year of schooling if a coethnic served as minister of education during all seven of a person’s primary school years—a slightly larger effect than of having a coethnic president.
In addition, we investigate how ethnic favoritism varies across regimes and individual leaders. Whereas we do not find that patterns of ethnic favoritism by the president or the minister of education were altered by the introduction of multiparty politics in Kenya, we do find that the role of coethnic cabinet members varied across the tenures of Kenya’s first two presidents. Under Kenyatta, we find no evidence that cabinet members had an impact on their coethnics’ educational outcomes. Under Moi, however, we find that having coethnics in the cabinet is associated with greater educational achievement—a finding that we attribute to the comparatively small size of Moi’s ethnic support coalition and the need that this generated for him to decentralize distributive power to ministers from other ethnic communities.

3
Data
DHS are periodic, nationally representative surveys that collect information on population, health, and nutrition at the household level in more than 85 developing countries. We pool the individual-level data from the DHS surveys from the Kenyan survey years of 1989, 1993, 1998, 2003, and 2008. The DHS interviews every woman in the households it samples, along with male household members in a sub-sample of households. We combine the male and female data sets, generating a master data set with more than 50,000 observations that includes age cohorts, based on the year in which an individual began primary school, that stretch from the mid-1950s to the late-1990s.2
Our main dependent variable, which comes straightforwardly from the DHS data, is the number of years of primary schooling that an individual has received.3 Primary schooling is closely associated with a host of positive development outcomes such as infant mortality, age at first marriage, number of children, and formal employment—all results we confirm below. It is also strongly demanded (Stasavage 2005), so studying its distribution provides insight into how governments choose to allocate a highly valued resource.
To get a sense of the variation we seek to explain, Table 1 presents the average number of years of primary school completed, broken down by each of Kenya’s major ethnic groups and by decade.4 As the last column makes clear, average rates of primary schooling in Kenya vary markedly across ethnic groups. For example, Kikuyu children, the most advantaged group according to the data, have had since independence about 13 percent more years of primary schooling than Kalenjin children (6.32 years vs. 5.59 years) and about 25 percent more years of primary schooling than children from other ethnic communities (that is, ethnic groups other than the five largest ones—6.32 years vs. 5.06 years). The Table also makes clear that the sizes of the gaps among Kenya’s ethnic groups have varied over time. Kikuyu children have the highest rates of primary school attainment in all periods, but the distance between them the other major groups has shifted markedly over the years. Whereas Kikuyu children in the 1960s completed an average of 37 percent more years of primary education than Kalenjin children and 24 percent more years of primary education than Luo children, these gaps narrowed to just 4 percent and one percent, respectively, in the 1980s. Part of this is no doubt due to the natural process of catch-up, as groups with little exposure to formal education during the colonial era were incorporated into the national education system after independence. But the pattern also raises questions about whether something about the nature of politics that varied across the decades
2 We correct for the imbalance in female and male sample sizes by weighting in analyses that report raw education outcomes and by including a control variable for respondent’s gender in all regressions. 3 Until 1985, students attended primary school for seven years. Thereafter, the system was changed to an 8-4-4 system, adding an eighth year to primary schooling. Thus the variable ranges from 0 to 8 years. 4 We exclude the 2000s because our most recent DHS survey was conducted in 2008 and the sample of individuals who had completed the majority (i.e., ≥ 4) of their primary school years between 2000 and 2008 (which implies having started primary school between 2000 and 2003) is too small to generate reliable group-specific estimates.

4
may have also contributed to the changes over time in the comparative fortunes of children from different ethnic groups.5
Table 1 Here
Our main independent variable, which we employ to test whether ethnic favoritism might be behind these changes, is an indicator variable that takes a value of 1 if the individual was a member of the same ethnic group as the president who was in office at the time that the individual attended primary school, and a value of 0 otherwise. Following Franck and Rainer (2009), we determine an ethnic match with the president by connecting the ethnicity of the individual to the ethnicity of the president when the individual was between 6 and 13 years old.6 Integrating a two-year time lag into our coding rule to account for the fact that policies put in place by a president are not likely to have an immediate impact (and that policies put in place by a president’s predecessor are likely still to shape educational outcomes for a period of time after he has left office), we code a presidential ethnic match based on the ethnicity of the president when the respondent was aged 4-11.7 If a change in the president occurred during a child’s primary school years, the match is coded based on the ethnicity of the president who was in power for the majority of the time that the child was in primary school (that is, for four or more years, subject to the two year lag).
A drawback of using the DHS data for our purposes is that the DHS surveys are administered to adults, whereas the outcome we are interested in—primary educational attainment—took place when the survey respondents were children. Since a survey respondent’s circumstances may have changed between childhood and the time that he or she was interviewed, we (unfortunately) cannot use most of the rich individual- and household-level information that the DHS collects to control for the circumstances facing an individual’s family at the time he/she was of primary school age. Our models are therefore by necessity sparse, although we can and do control for whether the individual spent his/her childhood (and thus
5 Group specific differences aside, Table 1 also illustrates some interesting general trends in primary school attainment rates. The 1960s and 1970s were a time of broad growth in primary completion rates, with average years of primary schooling jumping from 4.19 in the colonial era to 6.13 by the 1980s. With the economy growing and the introduction of free primary education by Jomo Kenyatta in the 1970s, all groups experienced increases during this period. Most of these gains were lost, however, during the 1980s, when, much like Kenya’s economy, primary school attainment rates sagged significantly, as evidenced in the drop in average number of years of primary school completed in the 1990s. This decline in average years of primary schooling becomes even more striking when we account for the fact that the Kenyan primary schooling shifted from seven to eight years in 1985. 6 The Kenyan education system is designed for students to begin at age six (or sometimes seven) and to last for 7 (until 1985) or 8 (after 1985) years. Primary school age is thus roughly age 6 to 13. To the extent that students delay entry into primary school or withdraw for a period and return when they are older, this will bias our analyses against finding an effect of ethnic favoritism. 7 Our results are robust to changing the lag to one year, as well as to omitting the lag altogether (see Appendix A). Extending the lag to three or four years weakens the results.

5
attended primary school) in a rural area and for the individual’s religion (Catholic, Muslim, or Protestant), since the DHS does collect information about this issue.
Empirical Strategy
A major challenge in estimating the impact of political favoritism on educational attainment is to isolate the effects of such favoritism from individual- and group-specific factors that might also affect schooling outcomes. For example, if we found that, on average, members of the president’s ethnic group completed more years of primary schooling than members of other ethnic groups, it would be difficult to know whether this association was a product of ethnic favoritism by the president or of deeper causes such as the group’s earlier exposure to colonial education, its proximity to the national capital, its higher than average wealth or greater job opportunities (both of which might affect the cost-benefit decisions families make about whether to send their children to school), or some other group-specific natural advantage. Our strategy for solving this inferential problem is to leverage changes in the ethnicity of the president (which happened in 1978, when Kenyatta, a Kikuyu, was succeeded by Moi, a Kalenjin, and in 2002, when Moi was succeeded by Mwai Kibaki, a Kikuyu) and to run our models with ethnic group fixed effects, which control for unchanging group-specific factors that may predispose members of one group to over- or under-perform others. This set up allows us to study the changing fortunes of each group over time, comparing the group’s primary school attainment rates during periods when it has a president in the state house and when it does not, thereby holding group-specific characteristics constant. This makes it possible to separate the relative contributions of having a coethnic in power from the presumably unchanging group-specific factors that are positively (or negatively) associated with educational achievement.
In addition to ethnic-group fixed effects, each model also includes age cohort-specific fixed effects, whose inclusion helps to control for time-specific shocks that might impact primary education attainment differently across different age cohorts. This might be an issue for the associations we are trying to estimate if, for example, a president’s tenure in office coincided with a severe economic downturn that caused parents to keep their children home from school (because they could not afford school fees or uniforms, or so that the children could help generate income for the household). In such a scenario, it would be hard to separate out the impact of the president’s efforts to help his group from the impact of the negative shock that happened to coincide with his presidency. The inclusion of age cohort fixed effects helps control for this possibility. We also include robust standard errors, clustered at the ethnic group-president level (since this is the level at which the treatment—presidential favoritism—is applied), and ethnic group-specific quadratic time trends to account for the fact that secular trends unrelated to who is in power may affect primary school attainment rates and that groups may experience these trends differently, and for reasons unrelated to their connections to a political figure in high office.8
8 Our results are robust to alternate specifications in which we cluster at the ethnic group-age cohort and ethnic group levels (see Appendix B) and when we compute standard errors using block bootstrap, as suggested by Bertrand, Duflo, and Mullainathan (2004).

6
Results
Can ethnic favoritism by political leaders explain any of the raw group differences in educational attainment we see in Table 1? We first investigate the impact of ethnic favoritism by the president. Examining the coefficients on the ethnic group dummy variables in the first column of Table 2 permits us to revisit the results of Table 1, this time controlling for coethnicity with the president, gender, religion, and whether or not a person’s childhood was spent in the countryside. We find, again, that Kikuyus are significantly favored with respect to their primary educational attainment, spending an average of 1.4 more years in primary school than other Kenyans. Luo and Kamba are disfavored, spending 1.2 fewer years in primary school than other Kenyans. Religious group membership also appears to be highly salient. Catholics and Protestants acquire an average of more than two years of additional primary schooling than Muslims and members of other faiths. We also see that growing up in the countryside is negatively associated with the number of primary school years that a child attains. Children who grow up in rural areas have an average of 0.76 fewer years of primary school than children who grow up in towns or cities. Boys also spend 0.84 years longer in primary school than girls.
Table 2 Here
Evidence for Presidential Ethnic Favoritism
In column 1 of Table 2, we also test for the impact of presidential ethnic favoritism on an individual’s number of primary school years. The presidential ethnic match variable is highly statistically significant, with a point estimate of 0.22. The interpretation is that, controlling for an individual’s religion, urban or rural upbringing, gender, and the positive or negative impact on educational attainment that comes from being a member of a particular ethnic community, having a president from one’s own ethnic group in power during one’s primary school years increases the average number of years of primary schooling that the person receives by just under a quarter of a year. This is a substantively meaningful effect: since the average Kenyan in our sample has 5.66 years of primary schooling, this is equivalent to about a 4 percent increase in the number of primary school years that a person receives. In column 2, we revisit this result but redefine our ethnic match variable slightly to reflect the number of years (from among an individual’s seven or eight primary school age years) in which a coethnic was president, and generate a nearly identical finding.9 In appendices A, B, and C1, we illustrate that these results are robust to changes in the lag of the ethnic match variable (0-4 years), changes in the clustering of the standard errors, and changes in the group specific time trends (none or linear).
9 The two operationalizations are identical for the majority of individuals whose primary school-age years coincide with the tenure of a single president (subject to the two year lag). Only in situations where an individual’s primary school-age years occurred under two different leaders (as is the case for children born between 1974 and 1983 and after 1997) does the number of presidential ethnic match years variable generate a slightly different result, but this is a quite small share of our sample.
7
Thus far, we have investigated the impact of having a coethnic president on the number of years of primary schooling an individual completes. In columns 3 and 4 of Table 2, we test for the impact of having a coethnic president on the likelihood that an individual has any primary schooling at all. We find that having a coethnic president matters considerably: having a president from one’s own ethnic group during one’s primary school-age years is associated with a roughly 8 percentage point increase in the probability of ever attending primary school.10 The results are similar when we redefine the ethnic match variable to capture the number a person’s primary school-age years during which a coethnic was president.
As a further robustness check, we replicate these results in columns 5 and 6 using as our main outcome variable the dichotomous measure of whether or not an individual completed primary school. Inasmuch as finishing primary school constitutes a real achievement, this measure has the advantage of capturing something tangible and potentially important for real world outcomes. However, unlike the primary years variable, the primary completion measure cannot distinguish between individuals who completed six years of primary school and individuals who completed none, which may be quite important for the level of skills that a child acquires in school. In any case, the results are very similar: measured either in terms of whether a coethnic was president for a majority of one’s primary school-age years (as in column 5) or in terms of the number of years in which a coethnic was president during one’s primary school-age years (as in column 6), we find that having a president from one’s own group in power is associated with a significant increase in an individual’s likelihood of having completed primary school.
While primary schooling is critically important from a developmental standpoint and (largely as a consequence) is highly demanded, secondary education is perhaps even more powerfully associated with job opportunities. Space in secondary schools is also more scarce than space in primary schools. Hence, at least for those who have completed primary school (and thus qualify to continue on to secondary school), one could argue that secondary schooling attendance is even more powerfully subject to political (and ethnic) favoritism. We therefore also test for the impact of having a coethnic president on secondary school attendance and completion. To do this, we redefine the presidential ethnic match variable to capture coethnicity with the president between ages 14 and 17. Columns 7 and 8 of Table 2 present these results, which again provide evidence that Kenyans achieve better educational outcomes when they are members of the same ethnic group as the president. We estimate that individuals are about 4 percentage points more likely to attend and to complete secondary school when they have a coethnic in power during their secondary school-age years.11
Table 2 presents strong evidence that coethnics of the president are favored with respect to their educational attainment in Kenya. Yet one potential concern with these results is that, despite our efforts to control for ethnic group-specific temporal trends, what our presidential ethnic match coefficients may really be picking up are temporal changes in the educational achievement of Kikuyu and Kalenjin children that have nothing to do with ethnic favoritism (for example, the natural catch-up of non-Kikuyu groups due to the post-independence expansion of the public school system is likely to be more strongly apparent in the more recent era, which 10 We use Clarify (King et. al, 2000) to simulate the predicted probabilities. 11 Again, we use Clarify (King et. al, 2000) to simulate the predicted probabilities.

8
happens to coincide with the shift from a Kikuyu to a non-Kikuyu president). To address this potential issue, we employ a RD approach by narrowing the sample to include only those individuals who would have started or finished primary school in the three years immediately before and after the transition of power from President Kenyatta to President Moi (subject to the two year lag). In addition to controlling for temporal changes that are not captured by the time trends and cohort fixed effects in the main specifications, constraining the sample in this way also helps us respond to the challenge that, notwithstanding our large sample size, our leverage in estimating the impact of having a coethnic president is coming from a comparison of just two presidencies.
Table 3 presents these results. In the first column, we constrain the sample to include only those individuals who would have started primary school between 1977 and 1983 (3 years before and after the transition from Kenyatta to Moi, accounting for the 2 year lag) and test for the impact on primary school attendance of having a coethnic president at the time an individual would have started primary school (i.e., at age 6). In this sub-sample of respondents who came of primary school age in the years immediately before and after Kenyatta’s death, we find that those who shared an ethnicity with the president at the time they were eligible to begin their primary schooling were more likely to have attended. In the second column, we constrain the sample to include only those individuals who started primary school and who would have finished between 1980 and 1985 (and whose decision to stay in school might have been affected by the policies put in place by the president at the time). We find that among this sub-sample, those who share an ethnicity with the president for the majority of their primary school age years are more likely to complete primary school than those who do not.
To give a sense of the magnitude of the effect of the political transition, we estimate that the probability that a rural Kikuyu woman was attending primary school was 4 percentage points higher during the three years preceding President Kenyatta's death (subject to the two year lag) than during the first three years under President Moi (91 percent versus 87 percent). Meanwhile, the estimated probability of primary school attendance for a rural Kalenjin woman rose 8 percentage points during the same period (from 70 to 78 percent). Primary school completion rates were similarly affected. Specifically, we estimate that the likelihood that a rural Kikuyu woman would complete primary school dropped 3 percentage points following the transition from Kenyatta to Moi (74 percent versus 71 percent) whereas the estimated probability that a rural Kalenjin woman would complete primary school increased by 4 percentage points (from 40 to 44 percent). Taken together, these results give us more confidence in the estimates presented in Table 2.
Table 3 here
In generating our presidential ethnic match variable, we matched survey respondents and presidents based on the ethnic categories used in the standard DHS. Thus, Presidents Kenyatta and Kibaki were coded as Kikuyu and President Moi was coded as Kalenjin. However, Kenyatta and Kibaki were from different Kikuyu districts, each with its own client networks, identity, and community aspirations (Throup and Hornsby 1998). And while Moi was indeed a Kalenjin, he came from a particular sub-tribe of that larger umbrella category, the Tugen. So while it is reasonable to investigate whether Kenyatta and Kibaki favored the Kikuyu and whether Moi favored the Kalenjin—these, after all, are the broad, politically meaningful units to which most

9
Kenyans expected to see resources channeled by these presidents—it is also reasonable to wonder whether the real favoritism might be toward each president’s sub-group. To test this intuition, we re-estimated the impact of presidential ethnic match, redefining it to include only people from the president’s home district: Kiambu district for Kenyatta; Barengo and Koibatek districts for Moi; and Nyeri district for Kibaki.12 Our results (not shown) provide no evidence for ethnic favoritism at this more micro-level. It would appear that Kenyan presidents are more concerned with buying the support of broad (if ethnically defined) political coalitions than about simply favoring their close ethnic kin.
Beyond the President
The analyses discussed above focus on the role of the president in favoring his ethnic kin. The idea that presidents will channel development resources to their coethnics has long been assumed in the African politics literature (e.g., Posner 2005) and has in recent years been subjected to careful empirical scrutiny (e.g., Burgess et al 2011; Kasara 2007; Kudamatsu 2009; Frank and Rainer 2009). So this approach is in keeping with the way most scholars of African politics think about distributive politics.
However, it may also be that, from the standpoint of benefiting from government favoritism in the area of education, the relevant ethnic connection is not with the president but with the person who controls the ministry of education. The idea that ministers will favor their ethnic kin also has broad currency among students of African affairs. Scholars such as Joseph (1987), van de Walle (2007), and Arriola (2009) emphasize the extent to which presidents keep themselves in power by co-opting other powerful elites—usually elites that control ethnic or regional support bases that are distinct from the president’s—by granting them access to portions of the state (what Joesph, following Weber, calls prebends) in exchange for their loyalty and that of their followers. In practice, this is done by allocating cabinet positions, with the understanding that the holders of those cabinet positions will use their ministries to enrich themselves and shore up their own regional or ethnic support bases, and then deliver them to the president when called upon. To the extent that such a system operates in Kenya, we would expect to see coethnics not just of the president but also of the minister of education receive disproportionate benefits in the education sector—even when the president and minister are from different ethnic groups.
To test whether the pattern of educational outcomes we observe is consistent with such a “prebendal” strategy, we identify and code the ethnicity of every minister who has served in the Kenyan cabinet since independence and then test whether children who share an ethnic group membership with the minister of education during their primary school years completed more
12 We limit the analyses to respondents who were born in these districts so as not to include migrants. This is necessary because, unlike in the other analyses where we have respondents’ self-reported ethnic group memberships, here we are inferring ethnicity from residential location.

10
years of primary schooling than other Kenyan children.13 Because education ministers tend to hold their posts for shorter periods than the presidents who appoint them, we estimate the impact on educational attainment of the number of years during which a coethnic served as the minister of education during a person’s primary school days, rather than whether a person had a coethnic as education minister during the majority of his or her primary schooling.14 Column 1 of Table 4 presents the results of our analysis. Controlling for our usual set of covariates (ethnic group membership, gender, religion, place of childhood residence, and age cohort) as well as an individual’s ethnic match with the president (which we continue to find to be substantively and statistically importantly associated with more years of primary schooling), we find that having a minister of education from one’s ethnic group in office during one’s primary school years is associated with 0.039 more years of schooling for every year in which the coethnic holds that office. This effect is slightly larger than that of having a coethnic as president, corresponding to an estimated 4.8 percent increase in a child’s primary school years if the minister of education is a coethnic during the entire period that the child is of primary school age.15
Table 4 Here
It is also possible that the impact of having ethnic kin in the cabinet extends beyond the minister of education. This might be the case, for example, if educational attainment were a product not just of spending in the education sector but of the allocation of resources in other areas that have indirect effects on the likelihood that children will attend and/or stay in school—a possibility we investigate directly later in the paper. If so, then the impact on schooling attainment should be roughly proportional to the share of coethnics in the cabinet. To test this expectation, we compiled information on the ethnic backgrounds of all ministers in Kenya since independence, computed annual shares of the composition of the cabinet by ethnic group, and calculated the average share of coethnic ministers during the primary school-age years of each survey respondent. As reported in column 2 of Table 4, however, we find that the average share of coethnic ministers in the cabinet during a child’s primary school-age years has no impact on the number of years of primary school that he or she completes.
Although ministers in Kenya have significant discretion over how their ministries’ resources are allocated, the real process of day-to-day administration in the ministry is directed by the permanent secretary rather than the minister. So it is reasonable to inquire whether, from 13 We are grateful to Leo Arriola for generously sharing his data on the ethnic composition of the Kenyan cabinet with us. Arriola’s data range from 1970 to 2005, so we extended his data back to 1963 and up through 2008. 14 Note that this strategy biases against finding an effect of having a coethnic minister of education, as we are including cases where the impact on educational attainment is likely to be quite small. 15 We cannot entirely rule out the possibility that the appointment of a member of a particular ethnic group as the minister of education is endogenous to that group’s need to catch up educationally, and hence an indicator rather than a cause of the government’s decision to try to improve educational outcomes among that group’s children. However, given the way cabinet appointments are typically made in Kenya—as political pay-offs—and the frequency of cabinet reshuffles (more than a dozen different people served as minister of education between independence and 2005), we think this is unlikely.

11
the standpoint of ethnic favoritism, the salient ethnic match might be with the permanent secretary. To test this hypothesis, we collected information on the ethnic backgrounds of all permanent secretaries in the ministry of education since independence and calculated, for each respondent, the number of their primary school age years in which a coethnic occupied the position of permanent secretary. Although we find no effect (see column 3, Table 4), we cannot rule out that this is because permanent secretaries are operating as instruments of the president, playing a role analogous to that described by Thies (2001) in the coalition governments of Italy, Japan and the Netherlands of keeping tabs on ministers from other ethnic groups. Indeed, between 1963 and 2005, there is a nearly perfect correlation between the ethnic background of the president and that of the permanent secretary of education.16
Taken together, these findings suggest that, while an individual’s ethnic connection with the president matters, so too does his or her ethnic connection with the minister in charge of allocating resources in a particular area. In keeping with the logic of prebendalism, it would appear that ministers do, in fact, have significant discretion in allocating resources to their ethnic kin—even when those kin are of a different group than the president. A natural question that arises is whether the relative importance of having a president or a minister from one’s ethnic group varies in any systematic way with the degree of competition that exists among political parties.
The Impact of Regime Type
Our estimation strategy takes advantage of the fact that the ethnic affiliations of Kenya’s presidents have varied over time. Another salient feature of Kenya’s political landscape that has varied over time is the nature of the country’s political institutions. Kenya began its post-independence life in 1963 as a multiparty regime but, by 1969, it had become a de facto one party state. This single party era continued until 1992, when popular pressure forced President Moi to liberalize and led to the return of multiparty elections. This fortuitous shift in formal political institutions makes it possible for us to test whether the patterns of ethnic favoritism we have identified thus far shift with changes in regime type.17 Specifically, we can ask: does the shift from single-party to multiparty politics (or vice versa) intensify, reduce or have no effect on ethnic favoritism by the president? Does the change in regime type alter the degree of favoritism displayed by ministers? We address these questions by introducing a variable that captures the number of an individual’s primary school years that took place under a multiparty political
16 The only period in which a permanent secretary of education did not share the ethnic background of the president was between 1979 and 1986, when, for all but one year, the minister of education was a coethnic of the president (and therefore presumably did not need keeping tabs on). 17 Note that what changed formally in 1992 was the ability of multiple parties to compete for political power, not the degree of de facto competition in the political sphere. Most accounts of Kenyan politics suggest that real change in the competitiveness of the political system (and the emergence of something closer to real “democracy”) did not occur until 2002. Hence our analysis in this section is of only questionable value as a test of the impact of “democracy.”

12
system, and then testing to see how the ethnic favoritism of the president and the education minister is affected by this measure.
Kenya’s shift from single-party to multiparty rule also permits us to estimate the independent effect of multiparty competition on educational outcomes, thus contributing to the literature that has investigated the effects of regime type on public goods provision and well-being (e.g., Kudamatsu 2009; Lake and Baum 2001; Ross 2006; Stasavage 2005; Harding and Stasavage 2012). So, before discussing the impact of regime type on patterns of ethnic favoritism, we note the quite substantial independent effect of multiparty politics on educational outcomes. As the results reported in column 1 of Table 5 indicate, Kenyan children actually complete 0.09 fewer years of primary school for every year of primary school completed during a multiparty era. Those who completed all of their primary school years during a multiparty era thus spend about two-thirds of a year less in school than do those whose primary schooling took place entirely during the single-party era. Note that the inclusion of a quadratic time trend in our analyses, combined with the fact that Kenya had two periods of multi-party elections (albeit one quite brief), permits us to distinguish between the impact of multiparty political institutions and a secular trend toward lower primary school attainment rates in the 1990s. We can therefore be fairly confident of the independent impact of multiparty rule on average primary schooling rates.18
Table 5 Here
Quite apart from its direct effect on primary school attainment, does regime type have an impact on the degree of ethnic favoritism we observe by presidents, cabinet ministers, or permanent secretaries? To answer this question we interact the democracy indicator variable with the presidential ethnic match, education minister match and permanent secretary match dummies (see Table 5, columns 2, 3 and 5). We find evidence that the introduction of multiparty politics has no discernible effect on the degree ethnic favoritism by any of these actors. Although we find evidence in these specifications that presidents and ministers of education (but not permanent secretaries) do favor their coethnics, the extent to which they do so is not altered by the multiparty institutional environment.
However, when we investigate the effect of multiparty politics on the impact of having coethnics in the cabinet more generally, we find there to be a statistically and substantively important effect. The interpretation of the interaction term in column 4 of Table 5 is as follows. In the single-party era, an increase in coethnic cabinet members from 10 percent of the cabinet to 40 percent is associated with a decrease in schooling of about one-fifth of a year. For someone who spent all of their primary school years in the multiparty era, on the other hand, the same
18 Note that these estimates are not affected by the improvements in primary school attainment rates that were caused by the introduction of free primary education by the National Rainbow Coalition (NARC) government in December of 2002, as only a tiny fraction of the respondents in our sample would have benefited from this policy. The youngest respondents in our sample were aged 15 in 2008, which means they were of primary school starting age in 1999, and so would only have had three years left of primary school after the introduction of free primary education, less than half of their total primary school years.

13
increase in coethnic cabinet members is associated with a 0.72 increase in primary years.19 These results are consistent with the interpretation that groups that control the cabinet are more inclined (or more able) to use their power to favor their ethnic kin under multiparty than single-party rule, perhaps because, in a more politically competitive environment, the president has no choice but to devolve distributive power to cabinet ministers in return for political support. Such an interpretation matches not just the patterns we observe in the data, but also the argument of van de Walle (2007), who claims that the introduction of multiparty politics in Africa in the late 1980s has not altered the underlying dynamics of politics (which he regards as still fundamentally prebendal), but made it more redistributive.20
Moi Versus Kenyatta
Our estimates in Table 2 capture the average effect on primary schooling attainment of having a coethnic in the state house during one’s primary school-age years—effectively pooling the ethnic favoritism of Presidents Kenyatta and Moi. However, it is at least possible that these two leaders favored their coethnics to different degrees, or that the impact of having a coethnic minister of education or permanent secretary, or of having coethnics dominate the cabinet, varied across these presidencies. Indeed, the circumstances under which each president ruled were quite different: Kenyatta ruled under a booming economy, whereas Moi dealt with a declining resource base. Furthermore, Kenyatta enjoyed the status as father of his country and was the leader of the largest and most powerful ethnic group in the country. Moi, by contrast, was the leader of a much smaller and politically weak ethnic coalition—indeed, that is precisely why he was selected to be Kenyatta’s vice president in the first place—and he lacked the patronage resources that Kenyatta enjoyed at independence (Branch and Cheeseman 2009; Widner 1993).
In Table 6, we test for differences in patterns of ethnic favoritism across the Moi and Kenyatta presidencies. In column 1, we investigate whether Kenyatta and Moi favored their coethnics to different degrees. We do this by adding a dummy variable for whether or not the individual’s school-age years coincided with the Moi presidency and interacting this dummy with our presidential ethnic match variable. This permits us to interpret the presidential ethnic match variable as capturing coethnic favoritism under Kenyatta and the sum of the Moi era*presidential ethnic match interaction and the presidential ethnic match variable as capturing coethnic favoritism under Moi. We find evidence of significant coethnic favoritism under Kenyatta: during his presidency, Kikuyus finished an additional of 0.26 more years of primary schooling than other Kenyans. But because the coefficient on the interaction term is not 19 These estimates are generated by holding all other covariates fixed and using the values of the coefficients on multiparty years, the share of coethnic ministers, and their interaction to calculate predicted number of years completed during the single-party era with few coethnic ministers, the single-party era with many coethnic ministers, the multiparty era with few coethnic ministers, and the multiparty era with many coethnic ministers. 20 As we show in Appendix C2, however, these results are quite sensitive to our specification of the group specific time trends, and so should be interpreted as suggestive rather than definitive. Also, as we show below, the effect appears to be driven entirely by the pattern of cabinet-level coethnic favoritism that took place under President Moi.

14
significant, we must conclude that coethnic favoritism under Moi was no different. Coethnic favoritism in the education sector would appear to be a Kenyan phenomenon, not a characteristic of any particular president.
Table 6 Here
In columns 2 through 4, we investigate whether favoritism—or a lack thereof—by the minister of education, cabinet members as a whole, and the permanent secretary varies across the Kenyatta and Moi eras. We find that coethnics of the minister of education are favored to the same degree during each presidency, and that the permanent secretary has no independent effect in either time period. The impact of having coethnics in the cabinet, however, varies significantly between the Kenyatta and Moi eras (see column 3 of Table 6). Whereas the average share of coethnics in the cabinet has no impact on an individual’s primary school years under Kenyatta, a 25 percentage point increase in coethnic cabinet members under Moi is associated with roughly an extra one-sixth of a year of schooling.21 This result is consistent with the notion that Moi, given his smaller ethnic group and limited patronage resource base, had to allocate greater discretion to other ethnic elites in the cabinet in order to maintain his ruling coalition.
Why Does Having a Coethnic President or Cabinet Matter for Educational Attainment?
We find strong evidence that Kenyan children spend more years in primary school when their primary school-age years coincide with the tenure in office of a president or minister of education who is from their ethnic group. We also find that, during the Moi years, the number of years of primary schooling that a child completes is positively associated with the share of coethnics in the cabinet during that time period. All of these findings are consistent with a well-known pattern in Africa whereby individuals benefit when they have a coethnic in a position of political power. But what is the precise mechanism that links having a coethnic occupying the presidency or serving as minister of education with the number of years that a child spends in primary school? There are at least five possible channels.
The most straightforward explanation is that individuals who share an ethnicity with a president or minister of education acquire more years of schooling because they receive preferential access to critical educational inputs such as funds to create or improve existing educational infrastructure, hire skilled teachers, or purchase books and other educational materials. These inputs may be channeled directly to coethnics through the allocation of government funds or they may come indirectly through the president’s or minister’s donations to Harambee (“self-help”) groups. Such groups have played a central role in the development of educational infrastructure in Kenya and often receive substantial contributions from senior
21 This is a rough approximation calculated by first identifying the point estimate of the effect of cabinet share in the Moi era (0.72-0.14). Then, as the point estimate tells us how many years an individual would gain from moving from having 0 coethnic ministers to a cabinet that is only coethnics, we divide that by 4 to get the estimated increase associated with moving from 0 to 25 percent of the cabinet, an increase that is more reasonable. As we show in Appendix C3, these results are robust to changes in the model specification.

15
government officials (Widner 1993). To the extent that presidents and ministers are able (and expected) to make large donations to Harambee campaigns, their coethnics may benefit disproportionately. A second possibility is that coethnics benefit from having coethnics in power not because of the greater amount of funding they are allocated but due to the efficiency with which these funds are translated into concrete outputs. Leakage and inefficiency are major problems in the education sector in African countries (Reinikka and Svensson 2004). But when presidents and ministers share an ethnic connection with the local agents who implement education policies at the local level, they may be better able to monitor these agents’ activities, and this may lead to less wastage.22 Coethnic elites and agents may also be better able to cooperate (Habyarimana et al 2009) or may share similar preferences about education policy and its implementation (Lieberman and McClendon, forthcoming), which could also generate improved educational outcomes.
Coethnic favoritism might also impact primary school attainment indirectly through its effect on outcomes that make it easier for children to stay in school. For example, having a coethnic president or cabinet minister may lead to improvements in health and nutrition (Franck and Rainer 2009), which may, in turn, make it more likely that children will stay in school and progress up the educational ladder (Miguel and Kremer 2004). It may also lead to higher family incomes, which may reduce the opportunity costs that parents face in releasing their children from household labor, and hence lead to higher attendance rates.
A fourth potential mechanism relates to the perceptions that children (and parents) hold about the longer-term returns they will receive for investments in their education. Since the economic returns to schooling are closely related to opportunities for formal employment, and since such opportunities—especially in the public sector—are presumed to depend on whether or not one has coethnics in a position to do the hiring (Barkan and Chege 1989; Wrong 2009), having a coethnic serving as president or controlling one or more job-rich ministries may increase the expected payoffs to schooling and therefore lead to higher levels of educational attainment.
A final channel through which having coethnics occupying senior government positions—especially the presidency—may matter is through the inspiration it provides to children from that group. Recent research in the United States demonstrates that Barak Obama’s rise to national prominence, and eventually to the White House, has had a positive effect on the school performance of traditionally underperforming African American children, who view him as a role model (Marx, Ko and Friedman 2009). It is possible that similar dynamics drive the association we find in Kenya between having a coethnic president and school attainment among Kenyan children, who, like African American children in the United States, may face challenges to progressing through the ranks in primary school.
All five of these mechanisms offer plausible explanations for the connection we find between having a coethnic in a position of political power and improved primary school 22 The logic here echoes Kasara’s (2007) argument about the greater efficiency of interactions between coethnic elites and agents in the area of tax collection.

16
attainment. Systematically adjudicating among them is, however, quite difficult absent reliable longitudinal data on district-level educational spending or ethnic group-specific income or public sector employment figures (none of which, to our knowledge, is available). Nonetheless, it is possible to exploit the DHS data to investigate at least some of these hypotheses.
For example, the third channel, which links primary school attainment to health and nutrition, can be evaluated by testing whether having a coethnic president during one’s childhood years is associated with better health and nutrition outcomes. While the DHS collects an enormous amount of information about nutrition and health, this information only provides direct insight into a respondent’s disposition at the time that the survey was conducted, not at the time that the respondent attended primary school, which may have been decades earlier. The DHS does, however, collect information on female adult heights as well as information from which we can calculate ethnic group- and age cohort-specific infant mortality rates.23 Both of these outcomes are highly correlated with health, nutrition, and general well-being during a child’s early years.24 If having a coethnic as president affects these outcomes, then we should find an association between presidential ethnic match at birth and infant survival, and between the number of years that a coethnic was in power during a child’s first four years of life and their adult height. Using a similar econometric set-up to ours, Franck and Rainer (2009) find a strong relationship between presidential coethnicity and infant mortality in a cross-section of African countries, so we would expect to find support for this channel.
Our results, however, provide no evidence that Franck and Rainer’s findings hold in Kenya. As we show in Table 7, having a coethnic president at the time of a child’s birth, or during the child’s first four years of life, is not associated with either the likelihood that the child will die before reaching age one or, if she is a girl, her adult height. Both of our analyses include ethnic group fixed effects, controls for urban/rural location, a quadratic time trend (to account for general improvements in health that may have taken place over time), and robust standard errors clustered at the ethnic group-president level. Our estimates of infant survival also include controls for the gender of the infant, the birth order and its square, whether the birth was a multiple birth, and the age of the mother and its square, all of which are standard in the public health literature. While we cannot rule out the possibility that our measures of infant mortality and adult height are imperfect proxies for well-being during a child’s youth, the fact that we find no association between having a coethnic president and these outcomes—along with the fact that we do find a strong association between having a coethnic minister of education and educational
23 To calculate group-specific infant mortality rates from the DHS data, we construct a dataset where the unit of observation is the live birth and where infant mortality is defined as death in the first twelve months of life. Using live births as the unit of analysis takes advantage of the fact that DHS collects retrospective information about all live births to all adult females in the household, as well as information about each child’s current mortality status (including the date of death, if applicable). Because each adult female household member reports multiple live childbirths, each in different years, this strategy permits us to generate annual estimates of infant mortality with a sample size that greatly exceeds that of the DHS sample itself (hence the very high number of observations in our analysis). 24 Adult body height is strongly associated with health and nutrition status during a child’s first four years of life (Silventoinen 2003; Moradi 2009).
17
outcomes—casts doubt on the hypothesis that the strong relationship we find between primary school attainment and having a coethnic president operates through this third channel.
Table 7 Here
The fact that we also find no robust impact on educational outcomes of having a coethnic minister of health, finance or works (results not shown) reinforces the conclusion that the outcomes we are seeking to explain are products of favoritism within the education sector, not positive externalities of favoritism in other domains.25
Our data also permit us to test the fifth possible channel, which hypothesizes that having a fellow ethnic group member occupying the presidency affects primary school attainment by inspiring students to work harder and stay in school. This mechanism can be distinguished from the first and third mechanisms by looking specifically at districts where the president’s coethnics are a large majority and comparing the average number of primary school years attained by the president’s coethnics and others in those districts. The assumption underlying this test is that funding for schools, health, water, roads, and other public goods is allocated at the level of the district and is non-excludable on the basis of ethnic group membership (and hence should have an equal impact on the well being of everyone living in the district, irrespective of the match between their ethnic background and that of the president). By comparing the primary school attainment of the president’s coethnics with that of non-coethnics living within the president’s home district(s), we can tease out the relative impact of inspiration (which should affect only the pupils who share an ethnic group membership with the president) and public spending (which should affect all pupils in the district equally). We present the results of this analysis in Table 8.
The first row reports estimates of a series of educational outcomes among children who are coethnics of the president and who are living in districts in which 60 percent or more of the population are members of the president’s ethnic group—that is, Kikuyu children living in Kikuyu-dominated districts under Kenyatta or Kalenjin children living in Kalenjin-dominated districts under Moi. The second row reports estimates of the same set of outcomes among children who are living in the same districts but who are not coethnics of the president. The findings are mixed: whereas children from the president’s ethnic group are no more likely to attend or spend more years in primary school, they are statistically significantly more likely to complete primary school and attend and complete secondary school (although the secondary school completion result is somewhat weaker). We therefore find at least some evidence that is consistent with the inspiration story.
Does Ethnic Favoritism in Education Matter?
We find that having a coethnic serving as president during one’s primary school age years leads to an increase in schooling of 0.22 years and a roughly 5 percentage point increase in
25 These are the three ministries that, along with education, have the highest recurrent annual expenditures during the period under study.

18
the probability of primary school completion.26 A review of the literature on educational interventions in other developing country settings suggests that these effects are roughly comparable to a number of other policy interventions. In Kenya, for example, Miguel and Kremer (2004) find that improvements in student health achieved by the allocation of de-worming drugs decrease absenteeism by 7 percentage points. Evans, Kremer, and Ngati (2009) find that distributing free school uniforms increases attendance by about 6 percentage points. Vermeersch and Kremer (2004) analyze the impact of a school breakfast program in pre-schools in Kenya, and find that enrollment in schools where the breakfast was served was about 30 percentage points higher—an effect substantially larger than our own.
Outside of Kenya, Duflo (2001), in a study of school construction in Indonesia, finds that each school constructed per 1000 children in a region increases schooling by between 0.12 to 0.19 years. In Mexico, Schultz (2004) leverages the randomized nature of the Progresa conditional cash transfer program and finds that the cash payments to parents increased enrollments by about 3 percentage points. And in Colombia, Angrist et al. (2002) find that a lottery that randomly subsidized private schooling for some students increases completion of the eighth grade by 10 percentage points.
The effect of ethnic favoritism by presidents is therefore roughly comparable to a range of policy interventions designed to improve schooling outcomes in Kenya and elsewhere in the developing world. The importance of this effect is magnified by the fact that much variation in individual educational outcomes is unrelated to political or policy interventions—which makes education different from other government provided goods, such as electricity or roads—and so the potential impact of political intervention is often constrained (Clemens 2004).
Conclusion
Kenyan politics—like that of many African countries—has long been characterized by favoritism of coethnics by political leaders. In this paper we document this phenomenon in the education sector by taking advantage of an extremely rich source of data on primary school attainment among more than 50,000 Kenyans whose primary school age years span from the late colonial era through the end of the millennium. Controlling for an array of individual- and group-specific determinants of educational attainment, we show that children whose primary school years coincide with the tenure of a president from their same ethnic group obtain more years of primary schooling than children from the same ethnic group whose primary school years coincide with the tenure of a president from a different ethnic group. We subject this finding to a number of robustness tests. We show that the results are not substantively or statistically different when we measure educational achievement differently, when we measure coethnicity with the president differently, and we when make different decisions about the time lag of our ethnic match variables or about the form of our ethnic-group specific time trends. In addition, we employ a regression discontinuity approach and study the primary school attendance and completion only of students who would have begun or finished school in a short time period 26 The predicted probability is simulated using Clarify (King et al 2000) from logistic regression results in Column 5 of Table 2.

19
before and after the principal presidential turnover during the time period we study. Again, the evidence suggests that children are more likely to attend and complete primary school when they have a coethnic in power.
In addition to studying ethnic favoritism by the president, we show that having the minister of education from one’s ethnic group during one’s primary school years has a positive impact on primary school attainment. We also use the DHS data to investigate whether these patterns of favoritism in the education sector differ across single-party and multiparty eras. We find evidence that coethnic favoritism by the cabinet (but not by the president or the minister of education in particular) increases under multiparty rule. And we find that this cabinet-level ethnic favoritism is driven by the multiparty period under president Moi. Although several of these results are consistent with the conventional wisdom about Kenyan politics and with what other scholars have found empirically, two findings bear underscoring the contribution here lies in the confidence we can have in our findings due to the richness of the data we use and the strength of our empirical strategy.
An additional contribution is our investigation of how democratization impacts distributive politics. A number of studies ask how democracy impacts overall levels of public goods provision and well-being. Fewer ask how democratization—or, in our case, the transition from single-party to multi-party politics—impacts the distributional strategies of political elites. We show, perhaps surprisingly, that ethnic favoritism by Kenyan presidents and ministers of education has persisted, and been of roughly the same magnitude, in the country’s single- and multi-party eras.
We also study the impact of cabinet ethnic composition and how it changes across
presidencies that face different challenges in building a ruling coalition. Under Kenyatta, having more coethnics in the cabinet does not improve one’s educational outcomes, but under Moi it does. Though we cannot rule out that these differences are specific to the leadership styles of Moi and Kenyatta, we interpret this difference as indicative of the different coalitional challenges each faced. Kenyatta was a member of Kenya’s largest ethnic group and ruled during a period of relative prosperity. Moi, on the other hand, is a member of a smaller group and ruled during a period of economic decline. With fewer patronage resources, due to the economic downturn, and more non-coethnics to co-opt, due to his smaller group size, we expect that Moi had to distribute more discretion and rent-seeking opportunities to cabinet members, which they could then use to benefit their own coethnics in a way that would not have been possible under Kenyatta.
A final contribution of the paper is to link the effects on educational outcomes that we estimate to a set of outcomes that speak more broadly to the benefits of coethnic favoritism for people’s well-being. In so doing, we highlight that the effects of ethnic favoritism in education are persistent and may shape longer-term patterns of ethnic inequality.

20
References
Alwy, Alwiya and Susanne Schech. 2004. “Ethnic Inequalities in Education in Kenya.” International Education Journal 5 (2): 266-274.
Amutabi, M. N. 2003. “Political interference in the running of education in post-independence Kenya: a critical retrospection.” International Journal of Educational Development 23(2): 127-144.
Arriola, Leonardo. 2009. “Patronage and political stability in Africa.” Comparative Political Studies 42(10): 1339.
Barkan, Joel and Michael Chege. 1989. “Decentralizing the State: District Focus and the Politics of Reallocation in Kenya.” Journal of Modern African Studies 27, 3: 431-453.
Bertrand, Marianne, Esther Duflo, and Sendhil Mullainathan. 2004. “How Much Should We Trust Differences-In-Differences Estimates.” Quarterly Journal of Economics 199, 1: 249-75.
Branch, Daniel and Nic Cheeseman. 2009. “Democratization, Sequencing, and State Failure in Africa: Lessons from Kenya.” African Affairs 108 (430): 1-26.
Burgess, Robin, Remi Jedwab, Edward Miguel, Ameet Morjaria, and Gerard Padro i Miquel. 2011. “Ethnic Favoritism.” Unpublished ms.
Case, Anne. 2002. “Health, income and Economic Development.” In Annual World Bank Conference on Development Economics 2001-2002, edited by B. Pleskovic and N. Stern, 221-241. Washington, DC.
Carlson, Elizabeth, Brian Min and Daniel N. Posner. 2010. “Using Satellite Imagery of Night Lights to Study Patronage and Politics in Africa.” Unpublished ms.
Clemens, Michael A. 2004. “The Long Walk to School: International Education Goals in Historical Perspective.” Center for Global Development Working Paper 37.
Duflo, Esther. 2001. “Schooling and Labor Market Consequences of School Construction in Indonesia: Evidence from an Unusual Policy Experiment.” American Economic Review 91: 795-813.
Evans, David, Michael Kremer, and Muthoni Ngatia. 2009. “The Impact of Distributing School Uniforms on Children’s Education in Kenya.” Unpublished ms.
Franck, Raphael, and Ilia Rainer. 2009. “Does the Leader’s Ethnicity Matter? Ethnic Favoritism, Education and Health in Sub-Saharan Africa.” Unpublished ms.
Gakidou, Emmanuela, Krycia Cowling, Rafael Lorenzo, and Christopher J. L. Murray. 2010. “Increased Educational Attainment and its Effect on Child Mortality in 175 Countries Between 1970 and 2009: A Systematic Analysis.” The Lancet 376 (September 18): 959-974.

21
Gallego, Francisco and Robert Woodberry. 2010. “Christian Missionaries and Education in Former African Colonies: How Competition Mattered.” Journal of African Economies 19 (3): 294-329.
Habyarimana, James, Macartan Humphreys, Daniel N. Posner, and Jeremy Weinstein. 2009. Coethnicity: Diversity and the Dilemmas of Collective Action. New York: Russell Sage Foundation Publications.
Harding, Robin and David Stasavage. 2012. “What Democracy Does (and Doesn’t) do for Basic Services: School Fees, School Quality, and African Elections. Unpublished paper New York University.
Haugerud, Angelique. 1995. The Culture of Politics in Modern Kenya. New York: Cambridge University Press.
Joseph, Richard. 1987. Democracy and Prebendalism in Nigeria. Cambridge: Cambridge University Press.
Kasara, Kimuli. 2007. “Tax Me If You Can: Ethnic Geography, Democracy, and the Taxation of Agriculture in Africa.” American Political Science Review 101(01): 159-172.
King, Gary, Michael Tomz and Jason Wittenberg. 2000. “Making the Most of Statistical Analysis: Improving Interpretation and Presentation.” American Journal of Political Science 44(2): 347-61.
Kramon, Eric and Daniel N. Posner. 2011. “Who Benefits from Distributive Politics? How the Outcome One Studies Affects the Answer One Gets.” Unpublished paper.
Kudamatsu, Masayuki. “Has Democratization Reduced Infant Mortality in Sub-Saharan Africa? Evidence from Micro Data.” Unpublished ms.
Lake, D. A, and M. A Baum. 2001. “The invisible hand of democracy.” Comparative Political Studies 34(6): 587.
Lieberman, Evan and Gwyneth McClendon. Forthcoming. “The Ethnicity-Policy Preferences Link in Sub-Saharan Africa.” Comparative Political Studies.
Mark, David M., Sei Jin Ko, and Ray Friedman. 2009. “The ‘Obama Effect’: How a Salient Role Model Reduces Race-Based Performance Differences.” Journal of Experimental Social Psychology 45 (July): 953-956.
Miguel, Edward, and Michael Kremer. 2004. “Worms: Identifying Impacts on Education and Health in the Presence of Treatment Externalities.” Econometrica 72(1): 159-217.
Morjaria, Ameet. 2011. “Electoral Politics and Deforestation.” Unpublished ms.
Moradi, Alexander. 2009. “Toward and Objective Account of Nutrition and Health in Colonial Kenya: A Study of Stature in African Army Recruits and Civilians: 1880-1980.” Journal of Economic History 69 (September): 719-754.

22
Nungu, Musembi. 2010. “Universalizing Access to Primary Education in Kenya: Myth and Realities.” Canadian Journal for New Scholars in Education 3 (August). Retrieved 25 May 2011from http://www.cjnse-rcjce.ca/ojs2/index.php/cjnse/article/view/130.
Nunn, Nathan. 2011. “Gender and Missionary Influence in Colonial Africa.” Unpublished paper. Oketch, Moses and Caine Rolleston. 2007. “Policies on Free Primary and Secondary Education
in East Africa: Retrospect and Prospect.” Review of Research in Education 31 (March): 131-158.
Oyugi, Edward. 2000. The Legacy of Colonialism. Nairobi: Kenya Coalition for Social Watch.
Posner, Daniel N. 2005. Institutions and ethnic politics in Africa. Cambridge: Cambridge University Press.
Psacharopoulos, George. 1994. “Returns to Investment in Education: A Global Update.” World Development 22: 1325-1343.
Reinikka, Ritva and Jakob Svensson. 2004. “Local Capture: Evidence from a Central Government Transfer Program in Uganda.” Quarterly Journal of Economics 119 (2): 679-705.
Ross, Michael. 2006. “Is Democracy Good for the Poor?” American Journal of Political Science 50(4): 860–874.
Rothchild, Donald. 1969. “Ethnic Inequalities in Kenya.” Journal of Modern African Studies 7, 4: 689-711.
Sifuna, Daniel N. 2005. “The Illusion of Universal Free Primary Education in Kenya.” Wajibu 20 (4). Retrieved 25 May 2011 from http:// africa.peacelink.org/wajibu/articles/art_6901.html.
Silventoinen, Karri. 2003. “Determinants of Variation in Adult Body Height.” Journal of Biological Science 35: 263-285.
Stasavage, David. 2005. “Democracy and Education Spending in Africa.” American Journal of Political Science 49(2): 343-358.
Thies, Michael. 2001. “Keeping Tabs on Partners: The Logic of Delegation in Coalition Governments.” American Journal of Political Science 45(3): 580-598.
Throup, David and Charles Hornsby. 1998. Multi-Party Politics in Kenya: The Kenyatta and Moi States and the Triumph of the System in the 1992 Election. Oxford: James Currey.
UN Office for the Coordination of Humanitarian Affairs. 2003. “Kenya: The Challenge of Providing Free Primary Education.” ReliefWeb Report (7 February). Retrieved 29 June 2011 from http://reliefweb.int/node/118766.

23
van de Walle, Nicolas. 2007. “Meet the new boss, same as the old boss? The evolution of political clientelism in Africa.” in Kitschelt, Herbert and Steven I. Wilkinson, eds. Patrons, clients, and policies: Patterns of democratic accountability and political competition. Cambridge: Cambridge University Press. 50–67.
Widner, Jennifer. 1993. The Rise of A Party-State in Kenya: From Harambee! to Nyayo! Berkeley and Los Angeles: University of California Press.
Wrong, Michela. 2009. It’s Our Turn to Eat. The Story of a Kenyan Whistle-Blower. New York: Harper Collins.

24
Table 1: Average Years of Primary School Completed, by Ethnic Group and Time Period
Colonial 1960s 1970s 1980s 1990s All Years Kalenjin 3.66 4.31 5.48 6.36 6.20 5.59 Kamba 4.25 5.39 6.14 6.45 6.28 6.00 Kikuyu 5.00 5.90 6.52 6.60 6.70 6.32 Luhya 4.55 4.97 5.94 6.35 6.18 5.90 Luo 4.20 4.75 5.86 6.53 6.44 5.93 Others 3.57 4.19 4.92 5.53 5.35 5.06 All Kenyans 4.19 4.82 5.67 6.13 5.96 5.66 Sample Size 5,403 5,272 13,623 15,948 11,484 53,403
Note: Children are coded as having attended primary school during a given period if they spent the majority of their primary school years (i.e., >4 years) during that decade. The colonial era is the mid-1950s to 1963. Means are weighted to reflect the under-sampling of men in the DHS, assuming a 50-50 split by gender.

25
Table 2: Presidential Ethnic Favoritism and Education Outcomes
(1) (2) (3) (4) (5) (6) (7) (8) Primary
Years Primary Years
Primary Attendance
Primary Attendance
Primary Completion
Primary Completion
Secondary Attendance
Secondary Completion
Presidential Ethnic Match 0.22*** 0.57*** 0.27*** 0.22*** 0.19*** (0.04) (0.11) (0.06) (0.05) (0.07) # of Pres. Ethnic Match Years 0.02* 0.08*** 0.03*** (0.01) (0.02) (0.01) Kalenjin -0.35 -0.35 -0.35*** -1.19*** -0.63*** -0.63*** -0.36** -0.98*** (0.33) (0.31) (0.13) (0.18) (0.09) (0.10) (0.15) (0.17) Kamba -1.23*** -1.43*** -0.48*** -1.31*** -0.22 -0.38*** 0.55*** 0.14 (0.15) (0.29) (0.01) (0.20) (0.25) (0.14) (0.13) (0.14) Kikuyu 1.39*** 1.64*** -0.78*** -1.75*** 0.68*** 0.83** 0.35*** 0.06 (0.16) (0.25) (0.15) (0.24) (0.21) (0.35) (0.11) (0.16) Luhya 0.09 0.09 0.40*** -0.21 -0.16 -0.16 0.58*** 0.02 (0.14) (0.13) (0.152) (0.18) (0.11) (0.11) (0.09) (0.13) Luo -1.18*** -1.18*** -0.13 0.06 -0.22 -0.22 -0.19 -0.63*** (0.26) (0.27) (0.12) (0.26) (0.30) (0.31) (0.13) (0.17) Catholic 2.02*** 2.02*** 1.78*** 1.84*** 1.04*** 1.04*** 0.86*** 0.52*** (0.34) (0.34) (0.21) (0.23) (0.10) (0.10) (0.07) (0.09) Muslim -0.15 -0.15 -0.18** -0.15 -0.00 -0.00 -0.21** -0.39*** (0.19) (0.19) (0.09) (0.10) (0.11) (0.11) (0.09) (0.11) Protestant 2.27*** 2.27*** 2.15*** 2.21*** 1.25*** 1.25*** 1.04*** 0.75*** (0.39) (0.39) (0.20) (0.21) (0.14) (0.14) (0.07) (0.09) Childhood in Countryside -0.76*** -0.76*** -1.00*** -0.99*** -0.83*** -0.83*** -1.01*** -1.12*** (0.23) (0.23) (0.26) (0.24) (0.12) (0.12) (0.03) (0.04) Male 0.84*** 0.84*** 1.55*** 1.45*** 0.65*** 0.65*** 0.58*** 0.69*** (0.17) (0.17) (0.11) (0.09) (0.11) (0.11) (0.03) (0.04) Constant 1.45*** 1.45*** -1.23*** -2.04*** -4.11*** -4.12*** -2.00*** -1.14*** (0.40) (0.40) (0.36) (0.16) (0.16) (0.16) (0.24) (0.27) Observations 48,615 48,615 51,942 49, 522 49,522 49,522 49,522 49,522 R-squared 0.29 0.29 n/a n/a n/a n/a n/a n/a
Notes: Columns 1 and 2 are OLS; all others are logistic regressions. All models include age cohort fixed effects and ethnic group specific quadratic time trends. Robust standard errors, clustered at the ethnic group-president level. *** p<0.01, ** p<0.05, * p<0.1. Ethnic match in columns 7 and 8 is defined by the ethnicity of the president from ages 13-17.

26
Table 3: Presidential Ethnic Favoritism Around the Kenyatta-Moi Transition
Robust standard errors in parentheses; *** p<0.01, ** p<0.05, * p<0.1. Each model includes age cohort fixed effects, ethnic group fixed effects, and covariates included in Table 2. Column 1 includes only those individuals who would have started school between 1977 and 1983. Column 2 includes only individuals who would have finished school between 1980 and 1985, and who started primary school.
(1) (2) Primary
Attendance 1977-1983
Primary Completion 1980-1985
Presidential Ethnic Match at Age 6 0.429** (0.209) Presidential Ethnic Match 0.163*** (0.027) Observations 10, 968 8,159

27
Table 4: Ministerial Ethnic Favoritism
(1) (2) (3) Primary Years Primary Years Primary Years Presidential Ethnic Match 0.196*** 0.026 0.197** (0.027) (0.102) (0.068) # of Education Minister Match Years 0.039*** (0.013) Average Share of Coethnic Ministers 0.280 (0.718) # of Permanent Secretary Match Years 0.001 (0.010) Observations 47,853 42,660 45,743 R-squared 0.289 0.257 0.287 Each model includes ethnic group fixed effects, age cohort fixed effects, and controls for gender, religion, and childhood in a rural area. Robust standard errors in parentheses, clustered at the ethnic group-president level. Each model includes ethnic group specific quadratic time trends. *** p<0.01, ** p<0.05, * p<0.1.

28
Table 5: The Impact of Regime Type
(1) (2) (3) (4) (5) Primary
Years Primary Years
Primary Years
Primary Years
Primary Years
Multiparty Years -0.0905*** -0.0614** -0.0688** -0.0974*** 0.0941*** (0.0227) (0.0245) (0.0250) (0.0121) (0.0320) Presidential Ethnic Match 0.222*** 0.202*** 0.121 0.195** (0.0388) (0.0249) (0.0699) (0.0703) Presidential Ethnic Match* Multiparty Years
-0.0173 (0.0106)
Education Minister Match Years 0.0443** (0.0169) Education Minister Match Years* Multiparty Years
-0.00253 (0.00381)
Average Share of Coethnic Ministers
-0.813 (0.594)
Average Share of Coethnic Ministers* Multiparty Years
0.462*** (0.113)
Permanent Secretary Match Years 0.00165 (0.00997) Permanent Secretary Match Years* Multiparty Years
-0.000393 (0.00166)
Age Cohort Fixed Effects? No Yes Yes Yes Yes Observations 48,615 48,615 47,853 42,660 45,743 R-squared 0.278 0.287 0.289 0.257 0.287
Each model includes ethnic group fixed effects and controls for gender, religion, and childhood in a rural area. Robust standard errors in parentheses, clustered at the ethnic group-president level. Each model includes ethnic group specific quadratic time trends. *** p<0.01, ** p<0.05, * p<0.1.

29
Table 6: Moi versus Kenyatta
(1) (2) (3) (4) Primary Years Primary Years Primary Years Primary Years Presidential Ethnic Match 0.26*** 0.23*** 0.11 0.16* (0.07) (0.04) (0.10) (0.09) Presidential Ethnic Match * Moi Era -0.10 (0.10) Education Minister Match Years 0.06*** (0.02) Education Minister Match Years * Moi Era
-0.02 (0.02)
Average Share of Coethnic Ministers -0.14 (0.70)
Average Share of Coethnic Ministers * Moi Era
0.72** (0.27)
Permanent Secretary Match Years 0.01 (0.02) Permanent Secretary Match Years * Moi Era
-0.02 (0.02)
Observations 48,615 47,853 44,436 45,743 R-squared 0.29 0.29 0.29 0.29
Each model includes a Moi era dummy variable, ethnic group fixed effects, and controls for gender, religion, and childhood in a rural area. Robust standard errors in parentheses, clustered at the ethnic group-president level. Each model includes ethnic group specific quadratic time trends. *** p<0.01, ** p<0.05, * p<0.1.

30
Table 7: General Improvements in Well-Being?
(1) (2) Infant Survival Female Adult Height (cms) Presidential Ethnic Match at Birth
-0.118
(0.0990) Number of Ethnic Match Years Age 0-4 -0.261 (0.217) Kalenjin -0.462 -9.446*** (0.393) (1.914) Kamba -0.721* -3.531 (0.405) (4.448) Kikuyu -0.669 -4.855*** (0.414) (1.514) Luhya 0.275 -1.107 (0.224) (1.045) Luo -0.330 -2.540** (0.446) (1.075) Catholic 0.368*** 2.214*** (0.0870) (0.404) Protestant 0.387*** 2.131*** (0.0941) (0.355) Muslim -0.0302 2.331*** (0.0435) (0.648) Countryside -0.349*** (0.0807) Rural -0.266*** (0.0973) Constant -0.620 149.3*** (0.501) (2.134) Observations 116,007 20,267
Models include ethnic group specific quadratic time trend. City/Town is the omitted childhood place of residence category in column 2. All models include robust standard errors, clustered at the ethnic group-president level. The infant survival model includes birth-year fixed effects, and controls for the gender of the infant, the birth order and its square, whether the birth was a multiple birth (twin, triplet, and so on), and the age of the mother and the age of the mother squared. The adult height models link female adult height to the ethnicity of the president from ages 0-4, the time at which the largest proportion of growth takes place during the lifespan. Both ethnic match variables are lagged two years. The results are the same without the lag. *** p<0.01, ** p<0.05, * p<0.1

31
Table 8: Educational Attainment of Coethnics and Non-Coethnics in Districts Where the Majority Shares an Ethnicity with the President
Probability of Primary
Attendance
Predicted # of Primary
Years
Probability of Primary
Completion
Probability of Secondary Attendance
Probability of Secondary
Completion Ethnic Majority in Districts Dominated by Presidents Coethnics
.96 [.95-.97]
5.9 [5.7, 6.1]
.58 [.55, .61]
.32 [.29, .36]
.145 [.12-.17]
Ethnic Minority in Districts Dominated by Presidents Coethnics
.96 [.94-.98]
5.8 [5.5, 6.1]
.44 [.36, .51]
.21 [.21-.27]
.11 [.07-.15]
Upper and lower bounds of 95 percent confidence intervals in brackets. Predicted probabilities, number of years, and confidence intervals simulated using Clarify (King et al 2000). All models include age cohort fixed effects, ethnic group fixed effects, and the covariates included in Table 2, as well as dummy variables indicating whether the district is a Kalenjin or Kikuyu majority district (based on whether 60 percent or more of the population in the district is of the same ethnicity as the president, according to 1989 census data).

32
Appendix A: Ethnic Match and Ethnic Match Years Coefficients with Different Lags and Different Models
The first four rows replicate columns 1, 5, 2, and 6 in Table 2, respectively, using different lag coding rules. The final two rows replicate columns 1 and 5 in Table 2 using a Poisson count model, rather than an OLS regression model. Robust standard errors in parentheses, clustered at the ethnic group-president level. Each model includes ethnic group specific quadratic time trends. *** p<0.01, ** p<0.05, * p<0.1.
(1) (2) (3) (4) (5) No Lag One Yr Two Yrs Three Yrs Four Yrs DV=Primary Years IV=Dichotomous Ethnic Match
0.22*** (0.04)
0.24*** (0.05)
0.22*** (0.04)
0.12** (0.05)
0.08* (0.04)
DV=Primary Completion IV=Dichotomous Ethnic Match
0.30*** (0.04)
0.28*** (0.05)
0.26*** (0.06)
0.15 (0.09)
0.13 (0.10)
DV=Primary Years IV=Ethnic Match Years
0.04*** (0.01)
0.03** (0.01)
0.03** (0.01)
0.02 (0.01)
0.01 (0.01)
DV=Primary Completion IV=Ethnic Match Years
0.04*** (0.01)
0.04*** (0.01)
0.03** (0.01)
0.02 (0.01)
0.03* (0.02)
Primary Years (Poisson Model) IV=Dichotomous Ethnic Match
0.02** (0.01)
0.03** (0.01)
0.02** (0.01)
0.004 (0.006)
0.00 (0.01)
Primary Years (Poisson Model) IV=Ethnic Match Years
0.004** (0.001)
0.002 (0.001)
0.000 (0.001)
0.000 (0.001)
0.000 (0.001)

33
Appendix B: Robustness to Different Ways of Clustering the Standard Errors
(1) (2) (3) Ethnic Group
Age Cohort Ethnic Group
President Ethnic Group
DV=Primary Years IV=Dichotomous Ethnic Match
0.288*** (0.072)
0.288** (0.118)
0.288*** (0.018)
DV=Primary Years IV=Ethnic Match Years
0.026** (0.012)
0.026* (0.013)
0.026** (0.010)
DV=Primary Completion IV=Dichotomous Ethnic Match
0.283*** (0.061)
0.283*** (0.074)
0.283*** (0.100)
DV=Primary Years IV=Dichotomous Ethnic
0.036*** (0.013)
0.036*** (0.013)
0.036** (0.015)
Robust standard errors in parentheses. *** p<0.01, ** p<0.05, * p<0.1.
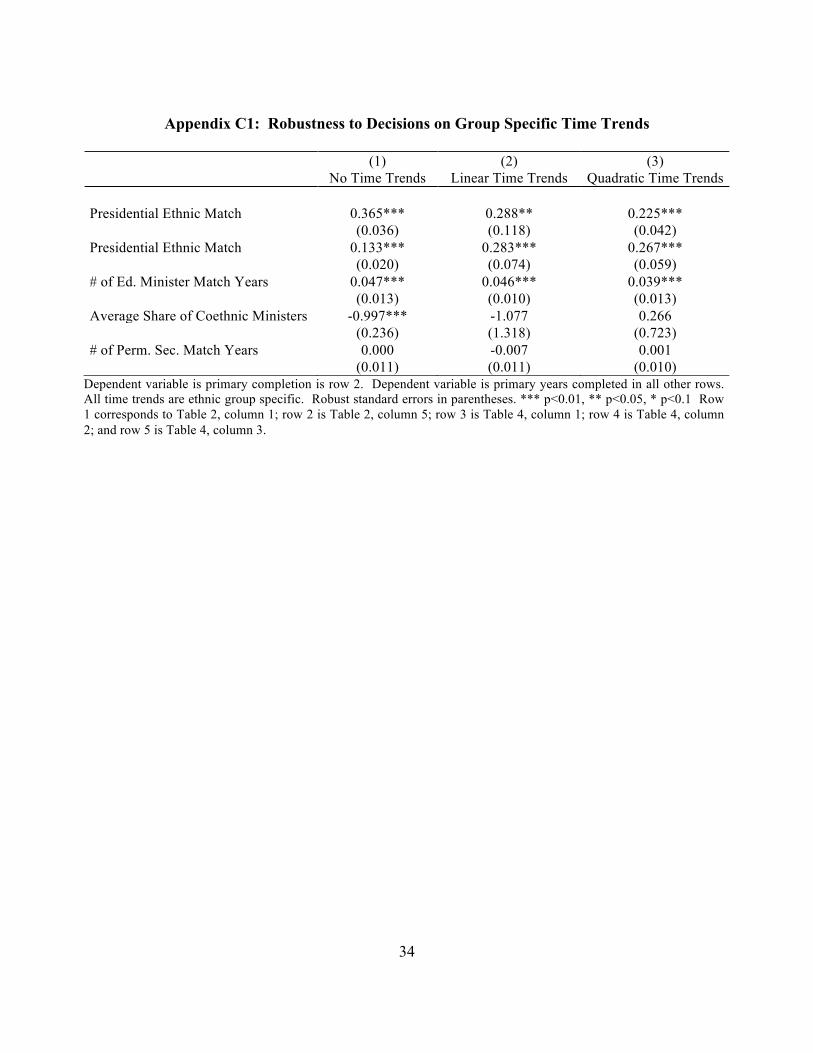
34
Appendix C1: Robustness to Decisions on Group Specific Time Trends
(1) (2) (3) No Time Trends Linear Time Trends Quadratic Time Trends Presidential Ethnic Match 0.365*** 0.288** 0.225*** (0.036) (0.118) (0.042) Presidential Ethnic Match 0.133*** 0.283*** 0.267*** (0.020) (0.074) (0.059) # of Ed. Minister Match Years 0.047*** 0.046*** 0.039*** (0.013) (0.010) (0.013) Average Share of Coethnic Ministers -0.997*** -1.077 0.266 (0.236) (1.318) (0.723) # of Perm. Sec. Match Years 0.000 -0.007 0.001 (0.011) (0.011) (0.010)
Dependent variable is primary completion is row 2. Dependent variable is primary years completed in all other rows. All time trends are ethnic group specific. Robust standard errors in parentheses. *** p<0.01, ** p<0.05, * p<0.1 Row 1 corresponds to Table 2, column 1; row 2 is Table 2, column 5; row 3 is Table 4, column 1; row 4 is Table 4, column 2; and row 5 is Table 4, column 3.

35
Appendix C2: Robustness to Decisions on Group Specific Time Trends Replication of Table 5, columns 2-5
(1) (2) (3) No Time
Trends Linear Time
Trends Quadratic
Time Trends Column 2 Presidential Ethnic Match 0.357*** 0.281** 0.222*** (0.042) (0.115) (0.039) Pres. Ethnic Match* Multiparty Years
0.006 -0.018 -0.017
(0.012) (0.012) (0.011) Multiparty Years 0.457*** -0.223*** -0.061** (0.024) (0.027) (0.024) Column 3 Ed. Minister Match Years 0.058** 0.056*** 0.044** (0.020) (0.013) (0.017) Ed. Minister Match Years* Multiparty Years
-0.004 (0.004)
-0.005 (0.003)
-0.003 (0.004)
Multiparty Years 0.454*** -0.218*** -0.069** (0.023) (0.025) (0.025) Column 4 Share of Coethnic Ministers -1.002*** -0.865 -0.825 (0.266) (0.936) (0.598) Share of Coethnic Ministers* Multiparty Years
0.100 (0.078)
0.152 (0.093)
0.461*** (0.113)
Multiparty Years 0.414*** -0.228*** -0.029* (0.023) (0.032) (0.016) Column 5 Permanent Secretary Match Years
-0.003 -0.006 0.002
(0.015) (0.011) (0.010) Permanent Secretary Match Years* Multiparty Years
0.001 (0.002)
-0.001 (0.002)
-0.000 (0.002)
Multiparty Years 0.457*** -0.005 0.094*** (0.024) (0.042) (0.032) Robust standard errors in parentheses. *** p<0.01, ** p<0.05, * p<0.1. Dependent variable is primary years.

36
Appendix C3: Robustness to Changes in the Time Trends Replication of Table 6, columns 1-4
(1) (2) (3) No Time
Trends Linear Time
Trends Quadratic Time
Trends Column 1 Presidential Ethnic Match 0.32*** 0.33** 0.26*** (0.07) (0.15) (0.07) Pres. Ethnic Match* Moi Era 0.12 -0.11 -0.10 (0.14) (0.17) (0.10) Column 2 Ed. Minister Match Years 0.06*** 0.06*** 0.06*** (0.02) (0.01) (0.02) Ed. Minister Match Years* Moi Era -0.01 -0.03 -0.02 (0.02) (0.02) (0.02) Column 3 Share of Coethnic Ministers -1.36*** -1.97 -0.14 (0.25) (1.38) (0.70) Share of Coethnic Ministers* Moi Era 0.77*** 0.86* 0.72** (0.19) (0.48) (0.27) Column 4 Permanent Secretary Match Years -0.02 -0.01 0.01 (0.02) (0.02) (0.02) Permanent Secretary Match Years* Moi Era 0.02 0.01 -0.02 (0.01) (0.02) (0.02)
Robust standard errors in parentheses. *** p<0.01, ** p<0.05, * p<0.1. Dependent variable is primary years.