ethosuximide stabilizes sleep-related … · the effects of ethanol on sleep in both alcoholics and...
TRANSCRIPT

ETHOSUXIMIDE STABILIZES SLEEP-RELATED OSCILLATIONS AND
REDUCES SLEEP FRAGMENTATION DURING ALCOHOL WITHDRAWAL
BY
WALTER F. WIGGINS
A Dissertation Submitted to the Graduate Faculty of
WAKE FOREST UNIVERSITY GRADUATE SCHOOL OF ARTS & SCIENCES
In Partial Fulfillment of the Requirements
For the Degree of
DOCTOR OF PHILOSOPHY
In Neuroscience
May 2012
Winston-Salem, NC
Approved by:
Dwayne W. Godwin, Ph.D., Advisor
Examining Committee:
David C.S. Roberts, Ph.D., Chairman
W. Vaughn McCall, M.D.
Ronald W. Oppenheim, Ph.D.
Emilio Salinas, Ph.D.

ii
TABLE OF CONTENTS
LIST OF TABLES AND FIGURES iv
LIST OF ABBREVIATIONS v
ABSTRACT vi
CHAPTER 1: SLEEP-RELATED THALAMOCORTICAL OSCILLATIONS AND THE INSTABILITY OF SLEEP IN ALCOHOL WITHDRAWAL-RELATED INSOMNIA 1 SECTION 1.1: INTRODUCTION 2 SECTION 1.2: EFFECTS OF ACUTE ALCOHOL CONSUMPTION ON SLEEP 4 SECTION 1.3: SLEEP AFTER WITHDRAWAL FROM ALCOHOL 6 SECTION 1.4: THE NEUROBIOLOGY OF PROPOSED TREATMENTS FOR ALCOHOL WITHDRAWAL-RELATED INSOMNIA 8 SECTION 1.5: ALCOHOL, THALAMOCORTICAL OSCILLATIONS, AND SLEEP 11 SECTION 1.6: CONCLUSION 16 SECTION 1.7: REFERENCES 18
CHAPTER 2: ETHOSUXIMIDE REDUCES ALCOHOL WITHDRAWAL-MEDIATED DISRUPTIONS IN SLEEP-RELATED EEG PATTERNS 24 SECTION 2.1: ABSTRACT 25 SECTION 2.2: INTRODUCTION 27 SECTION 2.3: MATERIALS AND METHODS 29 Subsection 2.3.1: Animals and Experimental Design 29 Subsection 2.3.2: Data Acquisition 30 Subsection 2.3.3: Cosinor Analysis of EEG 31 Subsection 2.3.4: Sleep Scoring 32 Subsection 2.3.5: Spectral Analysis of Vigilance States 33 Subsection 2.3.6: Statistical Analysis 34 SECTION 2.4: RESULTS 35 Subsection 2.4.1: Multiple Intermittent Ethanol Exposures and Withdrawals Disrupt Diurnal EEG Patterns 35 Subsection 2.4.2: Ethosuximide Restores Altered Patterns during the Withdrawal Period 39 Subsection 2.4.3: Ethosuximide Restores Relative Power in Low Frequency Bands during Withdrawal 40 Subsection 2.4.4: Ethosuximide Increases the Spectral Power of the Sleep EEG 46 SECTION 2.5: DISCUSSION 51 SECTION 2.6: REFERENCES 57
CHAPTER 3: DIFFERENTIAL EFFECTS OF ETHOSUXIMIDE TREATMENT AND GENETIC SUPPRESSION OF A T-TYPE CA2+ CHANNEL SUBTYPE ON ALTERED SLEEP HOMEOSTASIS IN RESPONSE TO CHRONIC INTERMITTENT ETHANOL 63 SECTION 3.1: ABSTRACT 64 SECTION 3.2: INTRODUCTION 66 SECTION 3.3: MATERIALS AND METHODS 69 Subsection 3.3.1: Animals and Experimental Design 69 Subsection 3.3.2: Data Acquisition 70 Subsection 3.3.3: Experiment 1: Effect of Ethosuximide on Sleep during Sustained Withdrawal from Ethanol 70

iii
Subsection 3.3.4: Experiment 2: Effect of Ethanol Withdrawal on Sleep in Ca(v)3.2-deficient Mice 70 Subsection 3.3.5: Sleep Scoring 71 Subsection 3.3.6: Vigilance Cycling Analysis 72 Subsection 3.3.7: Cosinor Rhythmometry 72 Subsection 3.3.8: Statistical Analysis 73 SECTION 3.4: RESULTS 74 Subsection 3.4.1: Experiment 1: Effect of Ethosuximide on Sleep during Sustained Withdrawal from Ethanol 74 Subsection 3.4.2: CIE Vapor Administration has a Prominent Sedating Effect 74 Subsection 3.4.3: CIE Exposure Attenuates Diurnal Rhythms and Decouples NREM from Activity and Temperature 81 Subsection 3.4.4: Some Effects of CIE are Partially Reversed during the Early Withdrawal Phase 83 Subsection 3.4.5: Increase in BW during Sustained Withdrawal from CIE is Partially Reversed by Ethosuximide 83 Subsection 3.4.6: Experiment 2: Effect of Ethanol Withdrawal on Sleep in Ca(v)3.2-deficient Mice 86 Subsection 3.4.7: CIE Exposure Suppresses REM Sleep of Ca(v)3.2-deficient, but not Wild-type Mice 86 Subsection 3.4.8: NREM Sleep Remains Increased in Ca(v)3.2-deficient Mice during the Withdrawal Dark Period 92 SECTION 3.5: DISCUSSION 94 SECTION 3.6: REFERENCES 100
CHAPTER 4: MECHANISMS OF SLEEP, SLEEP-RELATED OSCILLATIONS, AND ALCOHOL WITHDRAWAL-RELATED INSOMNIA 104
SECTION 4.1: INTRODUCTION 105 SECTION 4.2: THE NEUROBIOLOGY OF SLEEP 106 SECTION 4.3: THALAMOCORTICAL OSCILLATIONS AND THE MAINTENANCE OF NREM SLEEP 109 SECTION 4.4: FUNCTIONAL IMPLICATIONS FOR NORMAL SLEEP AND AWI 111 SECTION 4.5: POTENTIAL MECHANISMS OF ETX ACTION IN AWI 112 SECTION 4.6: CONCLUSION: A PATH TO TRANSLATION 118 SECTION 4.7: REFERENCES 121
CURRICULUM VITAE 127
iv
LIST OF TABLES
Table I. Values from cosinor analysis of all EEG bands during baseline, fourth week of ethanol exposure
and subsequent week of withdrawal 38
Table II. Vigilance cycling analysis parameters for Experiment 1 79
Table III. Cosinor analysis of diurnal rhythms for Experiment 1 82
Table IV. Vigilance cycling analysis parameters for Experiment 2 93
LIST OF FIGURES
Figure 1. Cosinor analysis of normalized theta (4-8Hz) EEG band during ethanol exposure and
withdrawal 37
Figure 2. CIE exposure increases relative power in low frequency EEG bands 42
Figure 3. Ethosuximide restores relative delta and alpha power during the withdrawal week 44
Figure 4. Ethosuximide increases spectral power in the delta and theta bands of the sleep EEG after ethanol
withdrawal 47
Figure 5. Ethosuximide does not significantly alter the sleep EEG spectra in the absence of ethanol 49
Figure 6. CIE exposure has a prominent sedating effect in mice 76
Figure 7. CIE suppresses REM in the light period 77
Figure 8. CIE effects on LDW for Experiment 1 80
Figure 9. ETX partially reverses withdrawal-mediated sleep fragmentation in the light period 85
Figure 10. Ca(v)3.2-deficient mice exhibit increased sleep during WD 88
Figure 11. CIE exposure suppresses REM in Ca(v)3.2-deficient mice during the light period 89
Figure 12. CIE effects on LDW for Experiment 2 90
Figure 13. No effect of CIE on BW in Ca(v)3.2-deficient mice after 1 week of exposure 91
Figure 14. A schematic of brain regions involved in the regulation of sleep-wake cycles 107
Figure 15. Effects of depolarizing shift in half-inactivation of T-type calcium current on a model of
thalamocortical spindles 116
Figure 16. Effects of depolarizing shift in half-inactivation of T-type calcium current on a model of
thalamocortical delta waves 117

v
LIST OF ABBREVIATIONS
ADH ALCOHOL DEHYDROGENASE AED ANTIEPILEPTIC DRUG ANOVA ANALYSIS OF VARIANCE AWI ALCOHOL WITHDRAWAL-RELATED INSOMNIA AWS ALCOHOL WITHDRAWAL SYNDROME BEC BLOOD-ETHANOL CONCENTRATION BK BIG-CONDUCTANCE CALCIUM-DEPENDENT POTASSIUM CHANNEL BRF BRAINSTEM RETICULAR FORMATION BW BRIEF WAKENING BZD BENZODIAZEPINE CA2+ CALCIUM CIE CHRONIC INTERMITTENT ETHANOL CNS CENTRAL NERVOUS SYSTEM DFT DISCRETE FOURIER TRANSFORM EEG ELECTROENCEPHALOGRAPHY EMG ELECTROMYOGRAPHY ERP EVENT-RELATED POTENTIAL ETOH ETHANOL ETX ETHOSUXIMIDE EXP EXPOSURE FDA FOOD & DRUG ADMINISTRATION FMRI FUNCTIONAL MAGNETIC RESONANCE IMAGING GABA γ-AMINOBUTYRIC ACID GIRK G PROTEIN-MEDIATED INWARDLY RECTIFYING POTASSIUM CHANNEL K+ POTASSIUM KO KNOCKOUT LDW LONG-DURATION WAKE MESOR MIDLINE-ESTIMATING STATISTIC OF RHYTHM NA+ SODIUM NAD NICOTINAMIDE ADENINE DINUCLEOTIDE NE NOREPINEPHRINE NREM NON-RAPID EYE MOVEMENT PSG POLYSOMNOGRAPHY REM RAPID EYE MOVEMENT SCN SUPRACHIASMATIC NUCLEUS SD STANDARD DEVIATION SEM STANDARD ERROR OF THE MEAN SK SMALL-CONDUCTANCE CALCIUM-DEPENDENT POTASSIUM CHANNEL SRO SLEEP-RELATED OSCILLATION SWD SPIKE-AND-WAVE DISCHARGE SWA SLOW-WAVE ACTIVITY SWS SLOW-WAVE SLEEP TMN TUBEROMAMILLARY NUCLEUS TRN THALAMIC RETICULAR NUCLEUS VC VIGILANCE CYCLING VLPO VENTROLATERAL PREOPTIC NUCLEUS W WAKE WD WITHDRAWAL WK WEEK WT WILD TYPE
vi
Abstract
The central focus of my dissertation is the study of the effects of ethanol on brain
rhythms, measured by electroencephalography (EEG), as they pertain to alcohol
withdrawal-related insomnia (AWI). AWI is an important clinical problem for chronic
alcoholics undergoing treatment for alcoholism. The severity of AWI is highly correlated
with increased risk of relapse. Furthermore, the current first-line therapy for alcohol
withdrawal, chlordiazepoxide, is inappropriate for long-term management of AWI due to
potential for abuse and negative side effects. While much of the research into the
mechanisms underlying AWI has focused on mechanisms of global inhibition and
excitation, more specific mechanisms of coordinated activity implicated in the
maintenance of sleep are adversely affected by chronic alcohol use. The work described
herein employs the chronic intermittent ethanol (CIE) vapor administration method in
mice to study the effects of ethanol exposure and withdrawal on sleep and oscillations in
neuronal activity between the thalamus and cortex (or thalamocortical oscillations).
Sleep-related oscillations (SROs) in neuronal activity are a subset of thalamocortical
oscillations that occur during the rapid eye movement (REM) and, more importantly,
non-REM (NREM) stages of sleep. T-type calcium channels are an important component
of the cellular processes that generate and maintain SROs. In two complementary studies,
we examined the effects of ethosuximide (ETX), a purported T-type calcium current
inhibitor, and genetic suppression of a T channel subtype on SROs and sleep in mice
during ethanol exposure and withdrawal. In the first study, we observed reversal of
withdrawal-mediated disruptions in SROs with ETX treatment, which we predicted
would help stabilize sleep during withdrawal. In the second study, we observed increased
vii
stability of sleep during withdrawal in both ETX-treated and genetically modified mice.
These results suggest, for the first time, an important role for T-type calcium channels in
the treatment of AWI. Furthermore, these studies lay the groundwork for investigating
the potential use of ETX, an FDA-approved drug with a minimal side effect profile, in
the treatment of AWI.

1
CHAPTER 1
SLEEP-RELATED THALAMOCORTICAL OSCILLATIONS AND THE
INSTABILITY OF SLEEP IN ALCOHOL WITHDRAWAL-RELATED INSOMNIA

2
Introduction
Chronic alcohol abuse results in a wide array of deleterious effects on the central
nervous system (CNS). Upon withdrawal from alcohol, these effects result in widespread
CNS hyperexcitability leading to alcohol withdrawal syndrome (AWS). AWS comprises
an array of symptoms including difficulty sleeping, anxiety, and – in severe cases –
seizures. These effects relate back to both the toxic effects of ethanol as well as the
accommodation of the CNS to the effects of chronic ethanol exposure. Difficulty sleeping
is a common complaint related to clinicians by abstinent alcoholics and alcoholics
undergoing withdrawal (Brower et al., 2001a). As a result, the impact of ethanol exposure
and withdrawal on sleep has been examined in a plethora of studies conducted since the
late 1960s.
More recently, the severity of alcohol withdrawal-related insomnia (AWI) has
been correlated with the likelihood of relapse into alcohol use (Brower, Aldrich, & Hall,
1998; Brower et al., 2001b; Drummond et al., 1998; Gillin et al., 1994). While it is still
unknown whether successful treatment of AWI can prevent relapse, AWI is nevertheless
an important clinical problem in the treatment of AWS. Despite a considerable increase
in knowledge with respect to the mechanisms of ethanol’s effects on the CNS and sleep,
successful treatment of AWI remains elusive.
The effects of ethanol on sleep in both alcoholics and nonalcoholic control
subjects have been well described in the literature. Ethanol disrupts many, if not all, of
the major neurotransmitter systems, complicating the study of specific mechanisms and,
thus, the development of prospective treatments. Much of the existing literature focuses
on the inhibitory effects of chronic ethanol exposure at the level of synaptic
3
communication. Hence, the primary focus in the study of ethanol exposure and
withdrawal relates to effects on GABA and glutamate receptors, the primary inhibitory
and excitatory neurotransmitters in the CNS, respectively. However, treatments based on
these synaptic mechanisms have demonstrated mixed results. The current first-line
therapy for AWS is the benzodiazepine (BZD) class of drugs. Long-acting BZDs, such as
chlordiazepoxide, are preferred over short-acting drugs, such as lorazepam, due to
decreased potential for abuse of the drugs. Given the abuse potential of these drugs, as
well as possible pathology associated with withdrawal after extended treatment with
BZDs, these drugs are only recommended for the acute treatment of AWS (Amato,
Minozzi, & Davoli, 2011). Whereas, the problem of AWI often persists long after other
symptoms of acute AWS have subsided.
Sleep is a complex neurobiological phenomenon characterized by widespread
network oscillations and the involvement of various hormones, neuromodulators, and ion
channels in the induction and maintenance of sleep. Therefore, a more complete
understanding of ethanol-mediated sleep disruption will likely be necessary in the
development of successful treatments for AWI. Furthermore, the most prominent features
of AWI are those of sleep fragmentation and the instability of sleep states, implicating a
potential role for the stability of sleep-related oscillations in the pathophysiology of AWI.
Thus, in the ensuing review of the literature, we form a basis for the investigation of
sleep-related oscillations as a mechanism and treatment for AWI, founded upon existing
clinical evidence and recent work in our lab.
Effects of Acute Alcohol Consumption on Sleep
4
It is well known that ethanol is a CNS depressant that exerts a prominent sedating
effect on nonalcoholics and sober alcoholics when administered at high doses or at stable
blood ethanol concentrations (BECs). Interestingly, at low doses of ethanol with rising
BEC, ethanol can exert excitatory effects. Furthermore, an excitatory rebound effect
occurs once ethanol has been sufficiently metabolized after the cessation of drinking
(Pohorecky, 1977). This biphasic relationship between BEC and the nature of its effects
on the CNS may help explain the effects of acute ethanol consumption on sleep.
The most common subjective method for measuring sleep employs several
physiologic measures, collectively termed polysomnography (PSG). Since the advent of
this technique in the 1950s (Aserinsky & Kleitman, 1953), sleep is divided into two
major stages – rapid eye movement (REM) sleep and non-REM (NREM) sleep. In
humans, NREM is subdivided into four stages of increasing depth of sleep (as determined
by the increasing level of stimulation required for arousal). Stages 3 and 4 are often
referred to as slow-wave sleep (SWS) due to the predominance of low frequency
oscillations in the electroencephalogram (EEG). In the absence of drugs or pathology,
sleep occurs in approximately 90-minute cycles interrupted by periods of brief wakening
(BW). The first half of the night is characterized by increasing depth of NREM sleep (i.e.
increasing percent of sleep as SWS, SWS%) with REM% increasing in the second half of
the night, predominantly occurring towards the end of a sleep cycle (for review, see
Hobson, 2005).
Since the late 1960s, numerous clinical studies have examined the effect of acute
ethanol consumption on sleep in both nonalcoholics and sober alcoholics. In several
studies, consumption prior to bedtime was found to increase NREM% and/or SWS%
5
during the first half of the night, while decreasing NREM/SWS% during the second half
of the night (Allen et al., 1971; Gross, Goodenough, Hastey, & Lewis, 1973; Johnson,
Burdick, & Smith, 1970; MacLean & Cairns, 1982; Mello & Mendelson, 1970; Rundell
et al., 1972; Wagman & Allen, 1975; Williams, MacLean, & Cairns, 1983; Yules,
Freedman, & Chandler, 1966). This initial sedating effect of ethanol was reduced when
ethanol was consumed 4 hours prior to bedtime (Yules, Lippman, & Freedman, 1967).
Furthermore, tolerance to this sedating effect is often developed over 4-5 consecutive
nights of ethanol consumption, but the effect has been observed to return after a period of
abstinence (Williams & Rundell, 1981). Many of these studies also observed a
suppression of REM sleep during the first half of the night (Gross et al., 1973; MacLean
& Cairns, 1982; Rundell et al., 1972; Williams et al., 1983; Yules et al., 1966). In a
subset of studies, increases in REM% over baseline values – termed REM “rebound”
were observed during the second half of the night (Yules et al., 1966, 1967).
Inhibitory mechanisms are commonly thought to mediate the onset and
maintenance of NREM sleep, whereas excitatory mechanisms are thought to mediate
REM sleep (see España & Scammell, 2011, for a thorough review of the neurobiology of
sleep). Thus, it is assumed that the potentiation of NREM and suppression on REM seen
in the first half of the night are due to inhibitory effects ethanol, whereas REM rebound is
thought to be due to metabolic rebound following sufficient metabolism of ethanol
towards the middle of the night (Gross et al., 1973).
Given the sedating effect of acute ethanol consumption, many patients admit to
using ethanol to facilitate sleep. At least 33% of insomnia patients admit to using ethanol
to help them get to sleep (Brower, 2003). On the other hand, young adults who report
6
getting less sleep (< 7 hours/night) are more likely to be heavy alcohol users than those
who report getting more sleep (Schuckit & Bernstein, 1981). These findings led the
authors of this study to formulate the hypothesis that difficulty sleeping increases one’s
risk for developing alcohol dependence. Interestingly, in a study of chronic alcoholics,
prior use of ethanol to facilitate sleep was not associated with an increased risk of relapse
(Brower et al., 2001b).
In summary, acute ethanol consumption exerts a prominent sedating effect in both
nonalcoholics and alcoholics, resulting in increased NREM sleep with suppression of
REM during the first half of the night. This sedating effect provides the motivation for
the use of ethanol as a sleep aid. However, this effect is short-lived, as the metabolism of
ethanol during sleep results in a rebound effect during the second half of the night.
Furthermore, tolerance to the sedating effect is developed in a matter of days.
Sleep after Withdrawal from Alcohol
The tolerance to the sedating effect of acute ethanol developed over a period of
days is attributed to the adaptation of the brain to repeated ethanol exposure (Roehrs &
Roth, 2001). Over periods of chronic ethanol abuse, it is well established that the brain
continues to change as a result of both this adaptation to exposure and ethanol toxicity.
Chronic alcoholics undergoing acute withdrawal from ethanol (on the order of days-to-
weeks) demonstrate significantly fragmented sleep as demonstrated by increases in
episodes of brief wakening (BW) during the night and increases in the number of
transitions between sleep stages during a sleep cycle (Adamson & Burdick, 1973; Allen
et al., 1971; Drummond et al., 1998; Johnson et al., 1970; Williams & Rundell, 1981).

7
Several studies have also noted a significant decrease in SWS and/or NREM sleep during
the acute withdrawal period (Allen et al., 1971; Gross et al., 1973; Wagman & Allen,
1975; Williams & Rundell, 1981). The effect of acute withdrawal on REM sleep has been
more variable, with some studies describing REM rebound during acute withdrawal
(Johnson et al., 1970; Williams & Rundell, 1981) and others observing no change or
decreases in REM sleep (Adamson & Burdick, 1973; Allen et al., 1971; Snyder &
Karacan, 1985; Wagman & Allen, 1975). In a behavioral study of alcoholics undergoing
acute withdrawal, subjective measures of sleep and reporting of sleep quality were found
to be highly correlated with the more objective EEG-based findings (Mello &
Mendelson, 1970).
While some alterations in sleep are reversed with continued abstinence (or
subacute withdrawal, on the order of weeks-to-months), sleep fragmentation appears to
persist after 1-2 years of abstinence (Drummond et al., 1998; Gillin et al., 1990).
However, this finding was not consistent across all subjects studied, with some subjects’
objective sleep measures normalizing after several months of abstinence (Drummond et
al., 1998). Furthermore, age seems to be an important factor, with older alcoholics
experiencing more severe and protracted sleep disruption than younger alcoholics
(Brower & Hall, 2001).
The severity of sleep disruption during subacute withdrawal and sustained
abstinence has been correlated with both decreased quality of life and increased risk of
relapse (Brower et al., 1998; Brower et al., 2001b; Cohn, Foster, & Peters, 2003;
Drummond et al., 1998). As mentioned in the previous section, it is interesting to note
that despite this relationship, past history of using ethanol to facilitate sleep as an
8
independent variable was not found to be associated with increased risk of relapse
(Brower et al., 2001b). Furthermore, it is yet unresolved as to whether treatment of
alcohol withdrawal-related insomnia (AWI) itself is preventative of relapse (Roth, 2009).
However, the combination of decreased quality of life, increased risk of relapse, and
increases in all-cause mortality with long-term sleep deprivation (Cappuccio et al., 2010;
Grandner et al., 2010) make the treatment of AWI a very important clinical problem.
The Neurobiology of Proposed Treatments for Alcohol Withdrawal-Related
Insomnia
In order to understand the motivation behind some of the proposed therapies and
the pitfalls of others, it is important to understand what is known about the neurobiology
of alcohol as it relates to sleep-promoting mechanisms in the brain. Ethanol is a small,
lipid-soluble alcohol that affects a wide array of ion channels and receptors in the brain. It
is best known for its direct effects on receptors of γ-amino-butyric acid (GABA), the
primary inhibitory neurotransmitter in the brain. However, the initial focus of sleep
research with respect to alcohol withdrawal was on the monoamine neurotransmitter
serotonin.
While early theories of sleep implicated serotonin and norepinephrine as the
principal neurotransmitters involved in the induction and maintenance of sleep (Jouvet,
1969), a more recent study demonstrated that serotonin receptor antagonists actually
increased SWS in humans (Sharpley et al., 1994). These findings may explain why early
attempts to treat AWI with serotonin analogs were met with questionable success
(Asheychik et al., 1989; Zarcone, 1978). Despite the uncertain role of serotonin in sleep,

9
compounds with monoaminergic effects used to treat depression have been selected by
clinicians for use in the treatment of AWI because of their sedative side effects
(Friedmann et al., 2008). It is possible that the efficacy these compounds demonstrate in
AWI is related to their actions on the norepinephrine (NE) system. Mice genetically
modified to lack the enzyme responsible for synthesis of NE in the brain demonstrated
enhanced sensitivity to the sedative effect of ethanol (Weinshenker et al., 2000). Over the
course of chronic exposure, it is hypothesized that NE activity is upregulated to
counteract this effect, as evidenced by increased NE activity during withdrawal (Hawley
et al., 1985). Increased NE has an excitatory effect on the cortex and may, thus,
contribute to the sleep fragmentation observed during sleep in abstaining chronic
alcoholics.
Given the mixed results with the monoamine neurotransmitters, the focus in
recent years has returned to effects on GABA. Initial reports suggested that ethanol
directly enhances inhibitory ion conductance of postsynaptic GABAA receptors (Suzdak
et al., 1986). More recent studies have suggested a primary effect on extrasynaptic
GABAA receptors, producing a form of tonic inhibition on a wide variety of neuronal
subtypes (Santhakumar, Wallner, & Otis, 2007). Interestingly, the balance between
synaptic and extrasynaptic effects may reverse over the course of chronic ethanol
exposure (Liang et al., 2006).
Compounds that potentiate the GABAA receptor have demonstrated efficacy in
both animal and human studies of alcohol withdrawal (Aubin, Barrucand, & Auzépy,
1993; Rouhani et al., 1998). However, the majority of such compounds approved for
clinical use (i.e. benzodiazepines and barbiturates) are burdened with a high potential for
10
abuse and significant withdrawal-mediated toxicity and, thus, remain controversial in the
treatment of AWI (Roth, 2009). Recently, attention has turned to gabapentin, a
medication developed as an antiepileptic drug that is also used for the treatment of
neuropathic pain. Gabapentin was originally developed as a GABA analog, but has been
subsequently shown to inhibit neuronal trafficking of voltage-gated calcium channels
(Hendrich et al., 2008). This may result in effects on neuronal plasticity, as well as
changes in probability of synaptic release and intrinsic (membrane) excitability of central
neurons (Davies et al., 2007). The exact mechanism of gabapentin-mediated CNS
inhibition is still under debate, but it has nevertheless demonstrated significant
improvements in AWI in direct comparison with monoaminergic-based therapies without
the controversy surrounding benzodiazepines (Karam-Hage & Brower, 2003; Myrick et
al., 2009). Furthermore, gabapentin has also been shown to significantly decrease other
symptoms of alcohol withdrawal and reduce the probability of drinking in the immediate
post-withdrawal period (Myrick et al., 2009). However, the effects of gabapentin on AWI
were not found to be different from placebo in a randomized, placebo-controlled trial
(Brower et al., 2008).
The difficulties encountered in attempts to find an effective therapy for AWI have
inspired many investigations of alternative uses for currently available drugs based on a
combination of the known effects of ethanol on the neurobiology of the brain and known
sedative side effects of drugs approved for other neuropsychiatric disorders. A clear
efficacious therapy has not emerged from these attempts, nor has it been determined that
successful treatment of AWI can, itself, prevent relapse to alcoholism. Much of the
difficulty has arisen out of an uncoordinated approach between basic science and

11
clinicians. In the era of translational medicine, the solution to this problem may lie
outside the classical approach of focusing on GABA and the other major neurotransmitter
systems.
Alcohol, Thalamocortical Oscillations, and Sleep
Central neurons receive input within and between functional areas of the brain in
the form of electrical impulses from other neurons. The electrical impulses are believed
to carry information with respect to the sensory environment; active behavioral plans, as
well as feedback from other systems in the body; and the internal state of the brain. These
inputs are integrated in the dendritic tree of a neuron, generating a net potential that can
be measured as electrical signal emanating from the region surrounding the neuron.
Depending on the distance and electromagnetic properties of the recording device, these
signals emitted from the region surrounding single neurons are summed to generate a
population potential representing hundreds or thousands of neurons (Logothetis, 2008).
Greater synchrony of inputs in time will generate a stronger, more regular potential. As
the activity in a region changes, these potentials fluctuate. In practice, the potential is
recorded with respect to another region of the brain (called a reference). Thus, changes in
incoming activity generate fluctuations in the region that are often described as
oscillations, a term borrowed from mathematics and physics due to the cyclical nature of
these variations about the referenced signal. Hence, when the term “oscillations” is used
in this manuscript, this refers to the synchronized integration of inputs across a region.
Not long after the invention of EEG revealed the first oscillations measured in the
brain, the first investigation into the role of the thalamus as an oscillator demonstrated an

12
intricate relationship between thalamic and cortical oscillations (Dempsey & Morison,
1941). Later investigations revealed significant interactions between the thalamus and
cortex during spindle oscillations observed in anesthetized cats (Andersen, Andersson, &
Lomo, 1967). The spindles observed in these animals were quite similar to those
observed in EEGs recorded during human sleep, thus, inspiring the theory that both types
of spindles are generated by a common mechanism. Two independent groups identified
intrinsic oscillatory activity capable of generating such rhythms in the isolated thalamus
in a series of experiments in the 1980s (Llinás & Jahnsen, 1982; Steriade & Deschenes,
1984; Steriade & Llinás, 1988). It was subsequently shown that intrinsic thalamic
oscillations during anesthesia and natural sleep were generated as a result of transitions
between tonic (or regular) firing and burst firing modes of thalamic neurons, mediated by
the voltage-dependent properties of T-type calcium current (Domich et al., 1986; Jahnsen
& Llinás, 1984a, 1984b; Steriade et al., 1993). Such transitions are also implicated in
other sleep-related oscillations, such as delta waves and the slow oscillation (Dossi,
Nuñez, & Steriade, 1992).
The thalamocortical sleep-related oscillations (spindles, delta waves, theta
rhythm, and the slow oscillation) are important components of the EEG recorded from
the scalp or cortex during SWS (Llinás & Steriade, 2006). According to Steriade (2005),
the slow oscillation describes a 0.5-4 Hz transition from periods of low cortical activity in
a local region (or “down” state) to periods of desynchronized activity not unlike that
found in the waking state (“up” state). When measured across larger regions of the brain,
this activity appears as delta waves in the EEG – the hallmark of SWS. Sleep spindles are
more commonly observed during up states and the frequency of their occurrence has been

13
correlated with increased memory consolidation (Diekelmann & Born, 2010). However, a
recent study found that interrupting the continuity of sleep impaired memory independent
of sleep time or depth (Rolls et al., 2011). Depth of sleep has also been implicated as
important contributor to the restfulness of sleep (Benington & Heller, 1995). Taking the
above results together, investigation into potential alterations in the mechanisms leading
to the generation and maintenance of sleep-related thalamocortical oscillations could
prove vital in the study of alcohol’s effects on sleep.
As mentioned above, the T-type calcium current (or simply T current) plays a
critical role in the generation of oscillatory activity in the thalamus. Three isoforms of the
T-type calcium channel have been identified (see Perez-Reyes, 2003, for review).
Ca(v)3.1 is the predominant isoform expressed in the brain and demonstrates fast
inactivation kinetics. Whereas, Ca(v)3.2 is more widely distributed in the periphery and
demonstrates slower inactivation kinetics and a slower recovery from inactivation.
Ca(v)3.3 is expressed at similar levels to Ca(v)3.2 in the thalamic reticular nucleus and
the hippocampus – where these two isoforms predominate over Ca(v)3.1 – and exhibits
slower inactivation kinetics with a more rapid recovery from inactivation (Chemin et al.,
2002; Klöckner et al., 1999; McRory et al., 2001; Talley et al., 1999). The differential
kinetics of these isoforms gives rise to the unique firing profiles of neurons expressing
high levels of T channels.
T current is typically activated after a period of hyperpolarization of thalamic
neurons, such as occurs during the down state of SWS (Huguenard, 1996). Ca(v)3.1 is
thought to be the primary source of T current in cortically projecting thalamic neurons,
such as those found in the primary and higher-order “relay” nuclei; whereas, Ca(v)3.3
14
contributes significantly to the T current of reticular neurons, found in the thalamic
reticular nucleus (Talley et al., 1999). The slower inactivation of Ca(v)3.3 and faster
recovery from inactivation results in a firing profile consisting primarily of intense,
rhythmic bursts in reticular neurons (Chemin et al., 2002). These reticular neurons project
onto the relay neurons; thus, setting the pace of thalamocortical oscillations. Mice
genetically modified to lack the Ca(v)3.1 and Ca(v)3.3 subtypes of T-type calcium
channels demonstrate fragmented sleep and virtual absence of sleep spindles, respectively
(Anderson et al., 2005; Astori et al., 2011). The role of Ca(v)3.2 in sleep is, as yet,
undetermined. Certain alterations in T channels, resulting in a net increase in T current at
more depolarized potentials may underlie pathological synchronization of thalamocortical
oscillations (Becker et al., 2008; Graef et al., 2009; Jeanmonod, Magnin, & Morel, 1996;
Steriade, 2005).
Several studies have examined the effects of ethanol on T-type calcium channels
in thalamic neurons. Similar to the biphasic effects of ethanol on sleep, ethanol appears to
exert biphasic effects on T current in thalamic neurons. At low concentrations, ethanol
was found to enhance T current; whereas, at higher concentrations, ethanol inhibited T
current (Mu et al., 2003). Recent work in our lab suggests that this effect of ethanol is
selective for the Ca(v)3.2 isoform (Shan, Hammarback, & Godwin, unpublished data), as
suggested by earlier results in another lab using octanol, a longer-chain alcohol (Joksovic
et al., 2005). Furthermore, chronic intermittent ethanol (CIE) vapor administration in
mice resulted in a progressive depolarizing shift in the inactivation of T current in
midline thalamic neurons that persisted during withdrawal (Graef et al., 2011).
Interestingly, this depolarizing shift appeared to demonstrate a dose-response relationship

15
with increasing numbers of exposure/withdrawal cycles reminiscent of the “kindling”
hypothesis of alcohol withdrawal, for which the CIE paradigm was developed as a model
(Becker & Hale, 1993). Under the “kindling” hypothesis, successive withdrawals from
ethanol increase the severity of withdrawal symptoms (including sleep), similar to the
progressive increase in severity of seizures observed in the kindling model of epilepsy –
an effect supported by studies in chronic alcoholics (Brown et al., 1988).
Ethanol has also been shown to disrupt diurnal patterns of T channel expression in
the midline thalamus (Nordskog, Hammarback, & Godwin, 2006). In the CIE model,
alterations in T current voltage-dependence in the midline thalamus were associated with
suppression of the diurnal variation in theta band (4-8 Hz) power in the cortical EEG
(Graef et al., 2011). Theta power is particularly increased in the cortical EEG during
NREM and REM sleep, though moderate theta power is normally observed during active
wake (Lancel, 1993). Significant thalamocortical theta coherence is observed during
NREM sleep in humans (Tsai et al., 2010). However, pathological increases in
thalamocortical theta coherence during the waking state have been observed in a various
neurological and psychiatric disorders, inspiring the term “thalamocortical dysrhythmia”,
used to describe a state of pathological thalamocortical oscillations (Llinás et al., 1999).
Thus, the suppression in the diurnal pattern of theta power in the cortical EEG may
represent a systems-level correlate of altered thalamocortical oscillations and, hence, T
current dysregulation in the thalamus as a result of alcohol withdrawal. These findings
carry significant implications for the proper generation and maintenance of
thalamocortical oscillations following withdrawal from chronic ethanol. Furthermore,
16
they open up the possibility of T-type calcium channels as a target for pharmacologic
therapy in AWI.
Conclusion
Recent studies in animals and humans have begun to reveal the importance of
thalamocortical oscillations in the proper maintenance of sleep and, conversely, the
inappropriate appearance of these oscillations in the waking period as a potential
contributor to neurological and psychiatric pathology. While there are significant
associations between abnormal thalamocortical oscillations and known effects of alcohol
withdrawal on sleep, the role of these oscillations in the pathology of AWI requires
further investigation. Furthermore, it must be determined whether improvement in these
abnormal rhythms is associated with improved outcomes in AWI. Future studies should
investigate the therapeutic potential of drugs designed to inhibit the mechanisms leading
to instability of sleep-related oscillations and subsequent fragmentation of sleep after
withdrawal from chronic alcohol.
17
References
Adamson, J., & Burdick, J. A. (1973). Sleep in dry alcoholics. Archives of General Psychiatry, 28(1), 146-9.
Allen, R. P., Wagman, A., Faillace, L. A., & McIntosh, M. (1971). Electroencephalographic (EEG) sleep recovery following prolonged alcohol intoxication in alcoholics. Journal of Nervous and Mental Disease, 153(6), 424-33.
Amato, L., Minozzi, S., & Davoli, M. (2011). Efficacy and safety of pharmacological interventions for the treatment of the Alcohol Withdrawal Syndrome. Cochrane Database of Systematic Reviews, (6), CD008537.
Andersen, P., Andersson, S. A., & Lomo, T. (1967). Nature of thalamo-cortical relations during spontaneous barbiturate spindle activity. Journal of Physiology, 192(2), 283-307.
Anderson, M. P., Mochizuki, T., Xie, J., Fischler, W., Manger, J. P., Talley, E. M., Scammell, T. E., et al. (2005). Thalamic Cav3.1 T-type Ca2+ channel plays a crucial role in stabilizing sleep. Proceedings of the National Academy of Sciences U S A, 102(5), 1743-8.
Aserinsky, E., & Kleitman, N. (1953). Regularly occurring periods of eye motility, and concomitant phenomena, during sleep. Science, 118(3062), 273-4.
Asheychik, R., Jackson, T., Baker, H., Ferraro, R., Ashton, T., & Kilgore, J. (1989). The efficacy of L-tryptophan in the reduction of sleep disturbance and depressive state in alcoholic patients. Journal of Studies on Alcohol, 50(6), 525-32.
Astori, S., Wimmer, R. D., Prosser, H. M., Corti, C., Corsi, M., Liaudet, N., Volterra, A., et al. (2011). The Ca(V)3.3 calcium channel is the major sleep spindle pacemaker in thalamus. Proceedings of the National Academy of Sciences of the United States of America, 108(33), 13823-8.
Aubin, H. J., Barrucand, D., & Auzépy, P. (1993). [Alcohol withdrawal syndrome and delirium tremens. Their treatment]. Revue du Praticien, 43(16), 2064-70.
Becker, A. J., Pitsch, J., Sochivko, D., Opitz, T., Staniek, M., Chen, C.-C., Campbell, K. P., et al. (2008). Transcriptional upregulation of Cav3.2 mediates epileptogenesis in the pilocarpine model of epilepsy. Journal of Neuroscience, 28(49), 13341-53.
Becker, H C, & Hale, R. L. (1993). Repeated episodes of ethanol withdrawal potentiate the severity of subsequent withdrawal seizures: an animal model of alcohol withdrawal “kindling”. Alcoholism: Clinical & Experimental Research, 17(1), 94-8.
18
Benington, J. H., & Heller, H. C. (1995). Restoration of brain energy metabolism as the function of sleep. Progress in Neurobiology, 45(4), 347-60.
Brower, K J, & Hall, J. M. (2001). Effects of age and alcoholism on sleep: a controlled study. Journal of Studies on Alcohol, 62(3), 335-43.
Brower, K J, Aldrich, M. S., & Hall, J. M. (1998). Polysomnographic and subjective sleep predictors of alcoholic relapse. Alcoholism: Clinical & Experimental Research, 22(8), 1864-71.
Brower, K.J., Aldrich, M. S., Robinson, E. A. R., Zucker, R. A., & Greden, J. F. (2001). Insomnia, self-medication, and relapse to alcoholism. American Journal of Psychiatry, 158(3), 399.
Brower, K. J. (2003). Insomnia, alcoholism and relapse. Sleep Medicine Reviews, 7(6), 523-39.
Brower, K. J., Myra Kim, H., Strobbe, S., Karam-Hage, M. A., Consens, F., & Zucker, R. A. (2008). A randomized double-blind pilot trial of gabapentin versus placebo to treat alcohol dependence and comorbid insomnia. Alcoholism: Clinical & Experimental Research, 32(8), 1429-38.
Brown, M. E., Anton, R. F., Malcolm, R., & Ballenger, J. C. (1988). Alcohol detoxification and withdrawal seizures: clinical support for a kindling hypothesis. Biological Psychiatry, 23(5), 507-14.
Cappuccio, F. P., D’Elia, L., Strazzullo, P., & Miller, M. a. (2010). Sleep duration and all-cause mortality: a systematic review and meta-analysis of prospective studies. Sleep, 33(5), 585-92.
Chemin, J., Monteil, A., Perez-Reyes, E., Bourinet, E., Nargeot, J., & Lory, P. (2002). Specific contribution of human T-type calcium channel isotypes (alpha(1G), alpha(1H) and alpha(1I)) to neuronal excitability. Journal of Physiology, 540(Pt 1), 3-14.
Cohn, T. J., Foster, J. H., & Peters, T. J. (2003). Sequential studies of sleep disturbance and quality of life in abstaining alcoholics. Addiction Biology, 8(4), 455-62.
Davies, A., Hendrich, J., Van Minh, A. T., Wratten, J., Douglas, L., & Dolphin, A. C. (2007). Functional biology of the alpha(2)delta subunits of voltage-gated calcium channels. Trends in Pharmacological Sciences, 28(5), 220-8.
Dempsey, E., & Morison, R. (1941). The production of rhythmically recurrent cortical potentials after localized thalamic stimulation. American Journal of Physiology, 135, 293-300.
19
Diekelmann, S., & Born, J. (2010). The memory function of sleep. Nature Reviews Neuroscience, 11(2), 114-26.
Domich, L., Oakson, G., & Steriade, M. (1986). Thalamic burst patterns in the naturally sleeping cat: a comparison between cortically projecting and reticularis neurones. Journal of Physiology, 379, 429-49.
Dossi, R. C., Nuñez, A., & Steriade, M. (1992). Electrophysiology of a slow (0.5-4 Hz) intrinsic oscillation of cat thalamocortical neurones in vivo. Journal of Physiology, 447, 215-34.
Drummond, S. P., Gillin, J. C., Smith, T. L., & DeModena, A. (1998). The sleep of abstinent pure primary alcoholic patients: natural course and relationship to relapse. Alcoholism: Clinical & Experimental Research, 22(8), 1796-802.
España, R. A., & Scammell, T. E. (2011). Sleep neurobiology from a clinical perspective. Sleep, 34(7), 845-58.
Friedmann, P. D., Rose, J. S., Swift, R., Stout, R. L., Millman, R. P., & Stein, M. D. (2008). Trazodone for sleep disturbance after alcohol detoxification: a double-blind, placebo-controlled trial. Alcoholism: Clinical & Experimental Research, 32(9), 1652-60.
Gillin, J. C., Smith, T. L., Irwin, M., Butters, N., Demodena, A., & Schuckit, M. (1994). Increased pressure for rapid eye movement sleep at time of hospital admission predicts relapse in nondepressed patients with primary alcoholism at 3-month follow-up. Archives of General Psychiatry, 51(3), 189-97.
Gillin, J. C., Smith, T. L., Irwin, M., Kripke, D. F., & Schuckit, M. (1990). EEG sleep studies in “pure” primary alcoholism during subacute withdrawal: relationships to normal controls, age, and other clinical variables. Biological Psychiatry, 27(5), 477-88.
Graef, J. D., Huitt, T. W., Nordskog, B. K., Hammarback, J. H., & Godwin, D. W. (2011). Disrupted thalamic T-type Ca2+ channel expression and function during ethanol exposure and withdrawal. Journal of Neurophysiology, 105(2), 528-40.
Graef, J. D., Nordskog, B. K., Wiggins, W. F., & Godwin, D. W. (2009). An acquired channelopathy involving thalamic T-type Ca2+ channels after status epilepticus. Journal of Neuroscience, 29(14), 4430-41.
Grandner, M. A., Hale, L., Moore, M., & Patel, N. P. (2010). Mortality associated with short sleep duration: The evidence, the possible mechanisms, and the future. Sleep Medicine Reviews, 14(3), 191-203.

20
Gross, M. M., Goodenough, D. R., Hastey, J., & Lewis, E. (1973). Experimental study of sleep in chronic alcoholics before, during, and after four days of heavy drinking with a nondrinking comparison. Annals of the New York Academy of Sciences, 215(1), 254–265.
Hawley, R. J., Major, L. F., Schulman, E. A., & Linnoila, M. (1985). Cerebrospinal fluid 3-methoxy-4-hydroxyphenylglycol and norepinephrine levels in alcohol withdrawal. Correlations with clinical signs. Archives of General Psychiatry, 42(11), 1056-62.
Hendrich, J., Van Minh, A. T., Heblich, F., Nieto-Rostro, M., Watschinger, K., Striessnig, J., Wratten, J., et al. (2008). Pharmacological disruption of calcium channel trafficking by the alpha2delta ligand gabapentin. Proceedings of the National Academy of Sciences U S A, 105(9), 3628-33.
Hobson, J. A. (2005). Sleep is of the brain, by the brain and for the brain. Nature, 437(7063), 1254-6.
Huguenard, J. R. (1996). Low-threshold calcium currents in central nervous system neurons. Annual Review of Physiology, 58, 329-48.
Jahnsen, H., & Llinás, R. (1984a). Ionic basis for the electro-responsiveness and oscillatory properties of guinea-pig thalamic neurones in vitro. Journal of Physiology, 349, 227-47.
Jahnsen, H., & Llinás, R. (1984b). Electrophysiological properties of guinea-pig thalamic neurones: an in vitro study. Journal of Physiology, 349, 205-26.
Jeanmonod, D., Magnin, M., & Morel, A. (1996). Low-threshold calcium spike bursts in the human thalamus. Brain, 119, 363-75.
Johnson, L. C., Burdick, J. A., & Smith, J. (1970). Sleep during alcohol intake and withdrawal in the chronic alcoholic. Archives of General Psychiatry, 22(5), 406-18.
Joksovic, P. M., Brimelow, B. C., Murbartián, J., Perez-Reyes, E., & Todorovic, S. M. (2005). Contrasting anesthetic sensitivities of T-type Ca2+ channels of reticular thalamic neurons and recombinant Ca(v)3.3 channels. British Journal of Pharmacology, 144(1), 59-70.
Jouvet, M. (1969). Biogenic amines and the states of sleep. Science, 163(3862), 32-41.
Karam-Hage, M., & Brower, K. J. (2003). Open pilot study of gabapentin versus trazodone to treat insomnia in alcoholic outpatients. Psychiatry & Clinical Neurosciences, 57(5), 542-4.
Klöckner, U., Lee, J. H., Cribbs, L. L., Daud, A., Hescheler, J., Pereverzev, A., Perez-Reyes, E., et al. (1999). Comparison of the Ca2 + currents induced by expression of
21
three cloned alpha1 subunits, alpha1G, alpha1H and alpha1I, of low-voltage-activated T-type Ca2 + channels. European Journal of Neuroscience, 11(12), 4171-8.
Lancel, M. (1993). Cortical and subcortical EEG in relation to sleep-wake behavior in mammalian species. Neuropsychobiology, 28(3), 154-9.
Liang, J., Zhang, N., Cagetti, E., Houser, C. R., Olsen, R. W., & Spigelman, I. (2006). Chronic intermittent ethanol-induced switch of ethanol actions from extrasynaptic to synaptic hippocampal GABAA receptors. Journal of Neuroscience, 26(6), 1749-58.
Llinás, R., & Jahnsen, H. (1982). Electrophysiology of mammalian thalamic neurones in vitro. Nature, 297(5865), 406-8.
Llinás, R. R., & Steriade, M. (2006). Bursting of thalamic neurons and states of vigilance. Journal of Neurophysiology, 95(6), 3297-308.
Logothetis, N. K. (2008). What we can do and what we cannot do with fMRI. Nature, 453(7197), 869-78.
MacLean, A. W., & Cairns, J. (1982). Dose-response effects of ethanol on the sleep of young men. Journal of Studies on Alcohol, 44(3), 515-23.
McRory, J. E., Santi, C. M., Hamming, K. S., Mezeyova, J., Sutton, K. G., Baillie, D. L., Stea, A., et al. (2001). Molecular and functional characterization of a family of rat brain T-type calcium channels. Journal of Biological Chemistry, 276(6), 3999-4011.
Mello, N., & Mendelson, J. (1970). Behavioral studies of sleep patterns in alcoholics during intoxication and withdrawal. Journal of Pharmacology & Experimental Therapeutics, 175(1), 94–112.
Mu, J., Carden, W. B., Kurukulasuriya, N. C., Alexander, G. M., & Godwin, D. W. (2003). Ethanol influences on native T-type calcium current in thalamic sleep circuitry. Journal of Pharmacology & Experimental Therapeutics, 307(1), 197-204.
Myrick, H., Malcolm, R., Randall, P. K., Boyle, E., Anton, R. F., Becker, H. C., & Randall, C. L. (2009). A double-blind trial of gabapentin versus lorazepam in the treatment of alcohol withdrawal. Alcoholism: Clinical & Experimental Research, 33(9), 1582-8.
Nordskog, B. K., Hammarback, J. A., & Godwin, D. W. (2006). Diurnal gene expression patterns of T-type calcium channels and their modulation by ethanol. Neuroscience, 141(3), 1365-73.
Perez-Reyes, E. (2003). Molecular physiology of low-voltage-activated t-type calcium channels. Physiological Reviews, 83(1), 117-61.
22
Pohorecky, L. A. (1977). Biphasic action of ethanol. Biobehavioral Reviews, 1(4), 231-240.
Roehrs, T., & Roth, T. (2001). Sleep, sleepiness, sleep disorders and alcohol use and abuse. Sleep Medicine Reviews, 5(4), 287-297.
Rolls, A., Colas, D., Adamantidis, A., Carter, M., Lanre-Amos, T., Heller, H. C., & de Lecea, L. (2011). Optogenetic disruption of sleep continuity impairs memory consolidation. Proceedings of the National Academy of Sciences U S A, 108(32), 13305-10.
Roth, T. (2009). Does effective management of sleep disorders reduce substance dependence? Drugs, 69 Suppl 2, 65-75.
Rouhani, S., Dall’Ava-Santucci, J., Bajenaru, O., Emmanouilidis, E., Tran, G., Manicom, R., Dinh-Xuan, A. T., et al. (1998). Effects of muscimol or homotaurine on sleep-wake states in alcohol-dependent rats during withdrawal. Pharmacology, Biochemistry, and Behavior, 59(4), 955-60.
Rundell, O. H., Lester, B. K., Griffiths, W. J., & Williams, H. L. (1972). Alcohol and sleep in young adults. Psychopharmacologia, 26(3), 201-18.
Santhakumar, V., Wallner, M., & Otis, T. S. (2007). Ethanol acts directly on extrasynaptic subtypes of GABAA receptors to increase tonic inhibition. Alcohol, 41(3), 211-21.
Schuckit, M. A., & Bernstein, L. I. (1981). Sleep time and drinking history: a hypothesis. American Journal of Psychiatry, 138(4), 528-30.
Sharpley, A. L., Elliott, J. M., Attenburrow, M. J., & Cowen, P. J. (1994). Slow wave sleep in humans: role of 5-HT2A and 5-HT2C receptors. Neuropharmacology, 33(3-4), 467-71.
Snyder, S., & Karacan, I. (1985). Sleep patterns of sober chronic alcoholics. Neuropsychobiology, 13(1-2), 97-100.
Steriade, M, & Deschenes, M. (1984). The thalamus as a neuronal oscillator. Brain Research, 320(1), 1-63.
Steriade, M, & Llinás, R. R. (1988). The functional states of the thalamus and the associated neuronal interplay. Physiological reviews, 68(3), 649-742.
Steriade, M, McCormick, D. A., & Sejnowski, T. J. (1993). Thalamocortical oscillations in the sleeping and aroused brain. Science, 262(5134), 679-85.

23
Steriade, Mircea. (2005). Sleep, epilepsy and thalamic reticular inhibitory neurons. Trends in Neurosciences, 28(6), 317-24.
Suzdak, P. D., Schwartz, R. D., Skolnick, P., & Paul, S. M. (1986). Ethanol stimulates gamma-aminobutyric acid receptor-mediated chloride transport in rat brain synaptoneurosomes. Proceedings of the National Academy of Sciences U S A, 83(11), 4071-5.
Talley, E M, Cribbs, L. L., Lee, J. H., Daud, A., Perez-Reyes, E., & Bayliss, D. a. (1999). Differential distribution of three members of a gene family encoding low voltage-activated (T-type) calcium channels. Journal of Neuroscience, 19(6), 1895-911.
Tsai, Y.-T., Chan, H.-L., Lee, S.-T., Tu, P.-H., Chang, B.-L., & Wu, T. (2010). Significant thalamocortical coherence of sleep spindle, theta, delta, and slow oscillations in NREM sleep: recordings from the human thalamus. Neuroscience Letters, 485(3), 173-7.
Wagman, A. M., & Allen, R. P. (1975). Effects of alcohol ingestion and abstinence on slow wave sleep of alcoholics. Advances in Experimental Medicine and Biology, 59, 453-66.
Weinshenker, D., Rust, N. C., Miller, N. S., & Palmiter, R. D. (2000). Ethanol-associated behaviors of mice lacking norepinephrine. Journal of Neuroscience, 20(9), 3157-64.
Williams, D. L., MacLean, A. W., & Cairns, J. (1983). Dose-response effects of ethanol on the sleep of young women. Journal of Studies on Alcohol, 44(3), 515-23.
Williams, H. L., & Rundell, O. H. (1981). Altered sleep physiology in chronic alcoholics: reversal with abstinence. Alcoholism: Clinical & Experimental Research, 5(2), 318-25.
Yules, R. B., Freedman, D. X., & Chandler, K. A. (1966). The effect of ethyl alcohol on man’s electroencephalographic sleep cycle. Electroencephalography & Clinical Neurophysiology, 20(2), 109-11.
Yules, R. B., Lippman, M. E., & Freedman, D. X. (1967). Alcohol Administration Prior to Sleep. The effect on EEG stages. Archives of General Psychiatry, 16(1), 94-7.
Zarcone, V. (1978). Alcoholism and sleep. Advances in the Biosciences, 21, 29-38.

24
CHAPTER 2
ETHOSUXIMIDE REDUCES ETHANOL WITHDRAWAL-MEDIATED
DISRUPTIONS IN SLEEP-RELATED EEG PATTERNS
W.F. Wiggins*, J.D. Graef*, T.W. Huitt, D.W. Godwin
This manuscript has been submitted for publication in Alcoholism: Clinical and
Experimental Research. A portion of this manuscript was previously submitted as a part
of the doctoral dissertation of J.D. Graef. The experiments were performed by W.F.
Wiggins and J.D. Graef with the help of T.W. Huitt. The manuscript was written by W.F.
Wiggins and J.D. Graef and prepared by W.F. Wiggins. Dr. Dwayne W. Godwin
designed experiments, wrote portions of the manuscript, and served in an editorial and
advisory capacity.

25
Abstract
BACKGROUND: Chronic ethanol leads to disruptions in resting EEG activity and in
sleep patterns that can persist into the withdrawal period. These disruptions have been
suggested to be predictors of relapse. The thalamus is a key structure involved in both
normal brain oscillations, such as sleep-related oscillations, and abnormal rhythms found
in disorders such as epilepsy and Parkinson's disease. Previously, we have shown
progressive changes in mouse thalamic T-type Ca2+ channels during chronic, intermittent
ethanol (CIE) exposures that occurred in parallel with alterations in theta (4-8Hz) EEG
patterns. METHODS: Two groups of eight-week old male C57BL/6 mice were implanted
with wireless EEG/EMG telemetry and subjected to 4 weeks of CIE vapor exposure and
withdrawal. During the week after the final withdrawal, mice were administered
ethosuximide (200 mg/kg) or saline. EEG data were analyzed via discrete Fourier
transform and sleep scored for further analysis. RESULTS: CIE exposure produced
changes in the diurnal rhythms of the delta (0.5-4Hz) and theta bands that persisted into a
subsequent week of withdrawal. These disruptions were prevented with the T-channel
blocker ethosuximide. Repeated ethanol exposures preferentially increased the relative
proportion of lower frequency power (delta and theta), whereas higher frequencies (8-
24Hz) were decreased. The ethanol-induced decreases in relative power for the higher
frequencies continued into the subsequent week of withdrawal for both groups. Increases
in absolute delta and theta power were observed in averaged NREM and REM sleep
spectral data during withdrawal in ethosuximide-treated animals, suggesting increased
sleep intensity. CONCLUSIONS: These results suggest that persistent alterations in delta
and theta EEG rhythms during withdrawal from chronic intermittent ethanol exposure

26
can be ameliorated with ethosuximide and that this treatment might also increase sleep
intensity during withdrawal.
27
Introduction
Preventing relapse after withdrawal from alcohol represents a significant hurdle in
overcoming alcohol dependence. Chronic alcohol use leads to disruptions in resting EEG
activity and in the sleep patterns of alcoholics that can persist into the withdrawal period,
where they have been suggested to be effective predictors of relapse (Bauer, 2001;
Brower, 2001; Brower and Perron, 2009). In rodents, repeated ethanol exposures and
withdrawals that model the binge/abstain consumption patterns of human alcoholics
(Becker and Hale, 1993) have also resulted in similar EEG and sleep alterations (Ehlers
and Slawecki, 2000; Veatch, 2006). It is still unresolved whether restoring normal sleep
patterns alone can prevent relapse (Friedmann et al., 2008; Brower and Perron, 2009);
however, understanding the underlying mechanisms and brain structures involved in
progressive EEG and sleep pattern alterations that occur during chronic alcoholism and
continue into protracted withdrawal will help provide the basis for additional avenues of
adjunct therapies in the treatment of alcohol dependence.
The thalamus is a key brain structure involved in the generation and maintenance
of normal brain rhythms during sleep, as well as different states of vigilance (Llinas and
Steriade, 2006). Abnormal thalamic activity has also been implicated in several
pathological conditions that are marked by abnormal increases in thalamocortical theta
coherence (Sarnthein and Jeanmonod, 2007, 2008) and have been described as
thalamocortical "dysrhythmias" (Jeanmonod et al., 1996; Llinas et al., 1999). These
dysrhythmias are characterized by enhanced activity of T-type Ca2+ channels (Steriade,
2005; Jeanmonod et al., 1996; Nelson et al., 2006), which generate characteristic bursts
of action potentials that support intrinsic neuronal oscillations (Huguenard, 1996).
28
Results from our lab (Graef et al., 2011) have demonstrated that chronic ethanol
exposure also produces alterations in thalamic T-type channel expression and function
that occur in parallel with disruptions in EEG theta activity. These changes persisted into
a subsequent week of withdrawal, but were ameliorated with the relatively selective T-
type channel blocker ethosuximide (ETX). Such disruptions are consistent with
observations of abnormal EEG activity in alcoholics (Porjesz and Begleiter, 2003;
Rangaswamy et al., 2003), including increases in interhemispheric theta coherence that
have also been suggested to arise from altered thalamocortical function (Porjesz and
Rangaswamy, 2007).
In this study, we expanded upon our previous findings by investigating the effects
of chronic intermittent ethanol exposures on the rhythmic patterns and relative power of
different EEG power bands and the average spectrum during two types of sleep. We also
assessed the efficacy of ETX as a pharmacologic intervention during a subsequent week
of withdrawal. We found that chronic ethanol induced disruptions in the diurnal pattern
of sleep-related EEG rhythms that continued into a subsequent week of withdrawal and
could be restored to baseline rhythms with ETX. Furthermore, we observed significant
increases in the absolute spectral power of these rhythms during REM and non-REM
sleep in response to ETX treatment. These results provide new data on changes in
important sleep-related rhythms that are elicited by withdrawal from ethanol, and further
implicate T-type channel involvement in these CNS alterations.

29
Materials and Methods
Animals and Experimental Design
All experiments were conducted with the advanced approval of the Institutional Animal
Care and Use Committee at Wake Forest University School of Medicine. Ethanol was
chronically administered by the inhalation route previously described by Becker and Hale
(1993). Briefly, 18 individually housed 8-week old C57Bl/6 male mice (Harlan, Inc.
Indianapolis, IN, USA) were placed in a sealed Plexiglas vapor chamber modified after
Goldstein (1972) in a room with a 12hr light/dark schedule with lights on at 5am. Ethanol
(95%) was volatilized and delivered to one of the chambers at a rate of 2.0 L/min by a
vacuum pump. This, in combination with air being delivered to the chambers at a rate of
20 L/min, maintained the ethanol concentration in the chamber in the range of 14–16 mg
per L of air (mean±SEM: 15.6±0.5mg/L). An 8hr period of abstinence allowed complete
clearance of ethanol from circulation prior to the next cycle of intoxication (Becker and
Hale, 1993; Becker, 1994). At the beginning of each exposure cycle (5pm), all mice
(whether receiving room air or ethanol vapor) were treated with a subcutaneous injection
of the alcohol dehydrogenase inhibitor pyrazole (100 mg/kg). Pyrazole is commonly
employed in the CIE paradigm to stabilize blood-ethanol concentrations (BECs) over the
course of repeated ethanol exposures. Pyrazole was prepared daily by dissolving in
sufficient saline to achieve an injection volume of approximately 0.2 mL per animal.
BECs achieved under these conditions remained relatively stable from one bout of
intoxication to the next. Mean BECs were 221.9±12.7, 189.0±21.0, 149.3±11.2, and
155.5±10.5 mg/dl for weeks 1-4 of exposure, respectively. The mean BEC was 186.0-
±9.4mg/dl for all four weeks of exposure. BECs for all mice were measured by taking 5µl
30
blood samples from the tail (stored in vials containing 45µl of 6.25% trichloroacetic acid)
and analyzed using a NAD-ADH enzyme assay (Diagnostic Chemicals, Oxford, CT).
Data Acquisition
Mice were implanted subcutaneously with telemetric physiologic monitors (Model F20-
EET; Data Sciences International (DSI), Arden Hills, MN) that simultaneously record
electroencephalogram (EEG), electromyogram (EMG), temperature and activity. Briefly,
animals were anesthetized with isoflurane followed by the implantation of electrodes for
recording EEG signals and EMG signals. For placement of EEG wire leads, holes slightly
larger than the coil diameter of the transmitter lead wire were drilled in the skull 2 mm on
either side of midline suture half way between bregma and lambda. The exposed portions
of the leads were placed between the skull and underlying dura. Wires were secured to
the skull with dental acrylic. EMG leads were placed in the neck muscles and secured
with sutures. The signal transmitter body was placed subcutaneously over the dorsal
thorax. Mice were allowed to recover from surgery for one week prior to recording. The
exposure paradigm during the 6-week recording period was as follows: one week of
baseline and four weeks of intermittent ethanol exposure (5pm-9am on days 1-5, no
exposure days 6 and 7), followed by 1 week of chronic withdrawal. One EEG and one
EMG channel were continuously acquired over the entire six-week paradigm using the
Dataquest A.R.T. acquisition system (DSI, Arden Hills, MN) at a sampling frequency of
500Hz. The EEG data was then band-pass filtered from 0.5-100Hz and the EMG data
filtered from 10-100Hz for analysis. Average activity counts were obtained every 10s.
During the withdrawal week, mice received isovolumic (0.2mL) injections of either

31
saline or 250mg/kg ethosuximide (ETX) daily at 5pm (corresponded to time of beginning
of ethanol during exposure weeks 1-4) for the first 5 days. ETX was prepared by
dissolution in sufficient saline to achieve an injection volume of approximately 0.2 mL
per animal.
Cosinor Analysis of EEG
EEG Data were divided into 10-s epochs and analyzed with a conventional Discrete
Fourier Transform (DFT) power spectra function using the software program NeuroScore
(DSI, Arden Hills, MN). Using a customized MATLAB (The MathWorks, Natick, MA)
program, epochs were then filtered into five power bands: delta (0.5-4Hz), theta (4-8Hz),
alpha (8-12Hz), sigma (12-16Hz) and beta (16-24Hz). Normalized power was obtained
by dividing the power in each 10-s epoch by the maximum power within its respective
24-hr period (5pm-5pm) for each frequency band. Normalized power was then further
averaged into 1-h bins for Cosinor analysis (Nelson et al., 1979). Relative power for each
band was determined by dividing the raw spectral power for that band by the total power
for all frequencies analyzed (0.5-25Hz). Diurnal patterns were analyzed with a custom
Cosinor analysis function written in MATLAB on all 24hr periods over the course of the
six-week exposure paradigm for each animal. The Cosinor function, given by the
following equation:
C(t) = Mesor + A*cos[2π(t – Acrophase) / P]
determines through least squares approximation the Mesor (midline estimating statistic of
rhythm), amplitude (A) and time of peak (Acrophase) values for the fitted cosine function
from a predetermined set phase (P). For all animals, a custom MATLAB function was

32
written so that each 24-hr period (5pm-5pm) over the 6-week paradigm was double-
plotted and fitted with Cosinor curves using a phase range of 18-32hrs in 10-m
increments. A zero-amplitude test was then performed for each fit, using error estimates
for the least-squares fit of the amplitude, to determine whether the amplitude of the fitted
curve was significantly different from zero. The parameters from the best Cosinor fit, as
determined by the lowest p-value, were returned. Data was then grouped and averaged
for all 24hr baseline periods, exposure periods (weeks 1-4, days 1-5) and withdrawal
periods (week 5, days 1-5), excluding any 24-hr periods that failed the zero-amplitude
test (as indicated by the best Cosinor fit having a p-value greater than 0.05). Statistical
analysis was performed between weeks both within each treatment group and between
treatment groups.
Sleep Scoring
EEG, EMG, and activity data were sleep-scored in 10-s epochs using a customizable
rodent sleep scoring algorithm available with NeuroScore. The primary measures
employed by this algorithm are the delta and theta power bands, delta ratio, theta ratio,
EMG threshold, activity threshold, and EMG and EEG artifact thresholds. These settings
were adjusted for the analysis of each week for each animal according to manual
verification of randomly selected sleep-scored epochs to account for individual variations
in signal strength and noise over time. The algorithm proceeds as follows for each epoch
analyzed: Any epoch containing a significant amount of artifact is discarded. If activity or
EMG signal exceed their respective thresholds, the epoch is scored as wake. If the first
condition is not met and the delta ratio exceeds its threshold, the epoch is scored as
33
NREM sleep. If the previous two conditions are not met and the theta ratio exceeds its
threshold, the epoch is scored as REM sleep. If none of the preceding criteria are met, the
default scoring is wake. The delta and theta bands remained constant for all animals and
all time points at 0.5-4Hz and 6-9Hz, respectively, consistent with previous studies in this
model (Veatch, 2006). As compared to the bands used in the analyses above, the theta
band was narrowed for the sleep scoring algorithm. This was done to isolate the theta
peak observed during REM sleep from any overlap with delta activity and, thus,
minimize the number of false positive REM epoch identifications. The delta ratio is
defined as the ratio of delta power to the total power in the spectrum from 0.5-25Hz and
ranged from 0.35-0.45 in the present analysis. The theta ratio is defined as the ratio of
theta power to delta power and ranged from 2-3. The EMG threshold ranged from 10-
50µV, depending on the noise in the signal. The activity threshold remained constant
across all animals at 0.1 counts per minute. Finally, the EEG and EMG artifact thresholds
ranged from 0.5-1.0mV. Sleep epochs were scored as rapid eye movement (REM), non-
REM (NREM), wake (W), or artifact, consistent with previous studies in this model
(Veatch, 2006).
Spectral Analysis of Vigilance States
The DFT power spectrum of each sleep-scored epoch was exported in 1Hz bins from 1-
25Hz in order to analyze the average spectral characteristics of individual vigilance states
(NREM, REM, and W) across baseline, exposure, and withdrawal weeks. A custom
MATLAB function was written to normalize each spectral bin to its maximum value in a
24-hr period. The function then binned the spectra by their associated vigilance state and

34
averaged the normalized power across all epochs for each animal in each week. The end
result was an average spectrum for each vigilance state across the baseline, exposure, and
withdrawal weeks, with the exception that the exposure week was further divided into
averages for exposure and withdrawal days, respectively.
Statistical Analysis
Statistical analysis was performed between weeks both within each treatment group and
between treatment groups using either MATLAB or Prism (Graph Pad Software, La
Jolla, CA). One- or two-way ANOVA was used to assess effects of ethanol and/or
withdrawal treatment for each group. Post-hoc tests were either Newman-Keuls Multiple
Comparison tests or unpaired t-tests for planned comparisons. All statistical tests are
specified in the Results section at first mention, and then clarified with any change in the
choice of test.
35
Results
Multiple Intermittent Ethanol Exposures and Withdrawals Disrupt Diurnal EEG Patterns
In order to determine the effects of chronic, intermittent ethanol exposures on frequency
band patterns, surface EEG for two groups of mice (n = 5 in each group) was continually
recorded for one week of baseline, four weeks of multiple intermittent ethanol exposures
and one week of subsequent withdrawal.
Figure 1A shows that during the baseline week, a diurnal pattern can be seen for
theta frequencies (4-8Hz), with lower normalized power exhibited during the animals’
dark (active) period as compared to the light (inactive) period. In order to statistically
compare variations in this diurnal rhythm, a Cosinor function was used to fit a cosine
curve to each double-plotted 24-hr period for all power bands. The parameters derived
from the fitted curves include the Mesor, which gives the estimated midline of the
rhythm, the amplitude between the peak and trough of the curve, the time at which the
peak of the curve occurs, and the length of the period. Figure 1 illustrates fitted Cosinor
curves to the average normalized theta power for the baseline week (A), the fourth week
of ethanol (B), and the subsequent withdrawal week for both saline (C) and ETX-treated
mice.
Analysis between the baseline power band rhythms and the fourth week of
intermittent ethanol exposures revealed that chronic ethanol significantly increased the
Mesor for the theta power band (F2,62 = 34.42, p < 0.001, one-way ANOVA with
Newman-Keuls post-hoc), as well as significantly decreasing the Mesor for the beta
frequency (F2,47 = 25.97, p < 0.05; see Table 1). Additionally, the amplitude between the
peak and trough of the fitted curve was significantly decreased for delta and theta

36
frequencies (F2,47 = 7.762, p < 0.05, and F2,47 = 16.64, p < 0.001, respectively), and the
time of the peak was significantly shifted forward in time for the theta, alpha (F2,47 =
3.829, p < 0.05), sigma (F2,47 = 16.18, p < 0.05) and beta (F2,47 = 3.728, p < 0.05) bands.
Chronic ethanol exposure did not have a significant effect on the average length of the
period for any frequency band (see Table 1).
These results indicate that multiple intermittent ethanol exposures disrupted
diurnal EEG rhythms for the lower delta and theta bands, and shifted the peak of
normalized power towards the end of each subsequent withdrawal period for all
frequencies greater than 4Hz.

37
Figure 1. Cosinor analysis of normalized theta (4-8Hz) EEG band during ethanol
exposure and withdrawal. An average 24-hr theta (4-8Hz) rhythm was compiled by
double-plotting the mean of each respective time point during the first five days (M-F) of
the baseline week (A), the fourth week of ethanol exposure (EtOH Week 4), and the
week of withdrawal with either saline or ethosuximide (ETX) treatment and fitted with a
Cosinor function. The values for Mesor, amplitude, period and time of peak for each
fitted curve are indicated on the graph. (B) The Mesor was significantly increased, the
amplitude was significantly attenuated, and the peak was significantly shifted (p < 0.05
for each parameter) during EtOH Week 4. (C, D) Only the peak was restored in the saline
group, whereas the Mesor and amplitude were also restored in the ETX group.

38
Table 1. Mesor Amplitude
Power Band
Base EtOH (Wk4)
WD (saline)
WD (ETX)
Base EtOH (Wk4)
WD (saline)
WD (ETX)
Delta (0.5-4Hz)
0.80±0.01 0.83±0.03 0.84±0.02 0.81±0.03 0.09±0.01 0.07±0.01*
0.05±0.01$
0.08±0.01
Theta (4-8Hz)
0.77±0.02 0.83±0.01*
0.85±0.02 0.74±0.02%#
0.12±0.02 0.08±0.01*
0.05±0.01$
0.11±0.01%#
Alpha (8-12Hz)
0.75±0.02 0.74±0.01 0.84±0.04 0.71±0.01#
0.14±0.02 0.11±0.01 0.07±0.02 0.12±0.01
Sigma (12-16Hz)
0.75±0.02 0.75±0.01 0.81±0.03 0.74±0.02#
0.14±0.02 0.12±0.01 0.08±0.02 0.11±0.01
Beta (16-24Hz)
0.82±0.02 0.77±0.02*
0.82±0.05 0.82±0.01 0.09±0.01 0.11±0.01 0.05±0.01%
0.07±0.01
Table 1 (cont’d).
Period Length (hrs) Peak of Rhythm (hr) Power Band
Base EtOH (Wk4)
WD (saline)
WD (ETX)
Base EtOH (Wk4)
WD (saline)
WD (ETX)
Delta (0.5-4Hz)
25.0±0.2 24.7±0.2 23.6±0.5$ 25.8±0.5# 17.6±0.6 19.7±1.3 17.5±1.7 16.4±1.1
Theta (4-8Hz)
25.1±0.2 24.8±0.2 24.7±0.3 26.0±0.3# 17.4±0.7 20.4±1.1* 18.6±0.7 18.3±0.5
Alpha (8-12Hz)
25.1±0.3 25.3±0.2 25.8±0.2 26.2±0.4 18.4±0.5 22.0±0.7* 19.5±0.5% 19.0±0.6%
Sigma (12-16Hz)
25.3±0.2 25.1±0.2 25.4±0.3 26.2±0.3 19.2±0.5 22.8±0.4* 20.1±0.2% 19.3±0.8%
Beta (16-24Hz)
25.2±0.3 24.9±0.1 24.5±0.2 26.3±0.4%
# 19.6±0.6 22.5±0.5* 21.0±1.1 19.3±0.8
Table 1. Values from Cosinor analysis for all EEG bands during baseline, fourth
week of ethanol exposure and subsequent week of withdrawal. (*p<0.05, repeated
measures ANOVA, with Bonferroni’s post test, compared to baseline (n=10; both
treatment groups); $p<0.05, repeated measures ANOVA, with Bonferroni’s post test,
compared to baseline (n=5; within treatment group); %p<0.05, repeated measures
ANOVA, with Bonferroni’s post test, compared to ethanol week 4 (within treatment
group); #p<0.05, unpaired t-test (between treatment groups)

39
Ethosuximide Restores Altered EEG Patterns during the Withdrawal Period
Since chronic, intermittent ethanol exposures and withdrawals disrupted diurnal EEG
variations seen during the baseline week, we next sought to determine if these changes
persisted during the week following the final withdrawal. In addition, we tested the
effects of ETX treatment administered daily at the start of the dark period (5pm),
corresponding to the beginning of each intermittent bout of ethanol exposure experienced
during the previous four weeks.
Figure 1C shows the normalized theta power for saline-treated mice during the
withdrawal period (hereafter, referred to as “withdrawal”), while Figure 1D illustrated the
normalized power for ETX-treated mice during the same withdrawal week. Cosinor
analysis of the theta bands revealed that both the significant increase in the Mesor (F2,62 =
34.42, p < 0.001) and the significant decrease in amplitude (F2,47 = 16.64, p < 0.001)
observed during ethanol exposure persisted into withdrawal for saline-treated animals,
however this returned to baseline levels for ETX-treated animals (p > 0.05 for both, when
compared to baseline; see Table 1). In addition, the average period length of the fitted
cosine curves for the delta band during the withdrawal week was significantly reduced
compared to the baseline week for saline-treated mice (F2,62 = 21.01, p < 0.05), whereas
the average period for the fitted curves for ETX-treated animals was not statistically
different from the baseline (p > 0.05).
While unaffected during ethanol exposure, derived values from the fitted cosine
curves for the alpha and sigma bands revealed significantly greater Mesor values during
the withdrawal week in saline-treated mice as compared to ETX-treated animals (p < 0.05
for both bands, unpaired t-test; see Table 1).
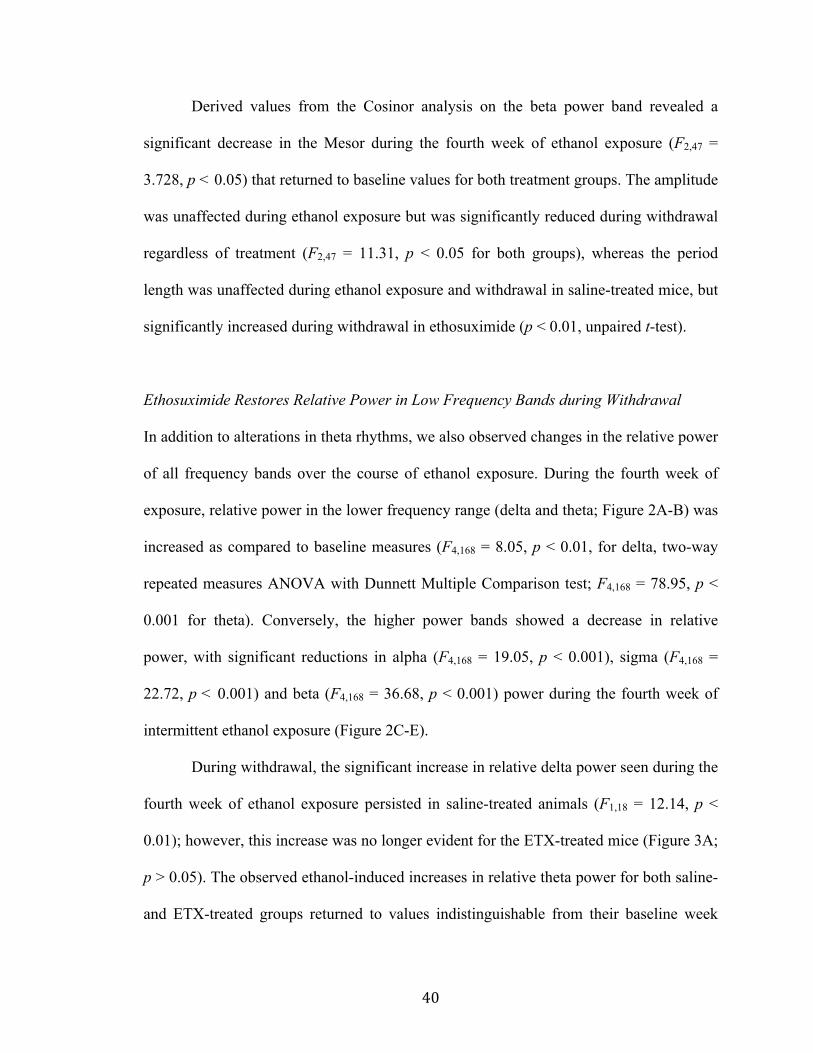
40
Derived values from the Cosinor analysis on the beta power band revealed a
significant decrease in the Mesor during the fourth week of ethanol exposure (F2,47 =
3.728, p < 0.05) that returned to baseline values for both treatment groups. The amplitude
was unaffected during ethanol exposure but was significantly reduced during withdrawal
regardless of treatment (F2,47 = 11.31, p < 0.05 for both groups), whereas the period
length was unaffected during ethanol exposure and withdrawal in saline-treated mice, but
significantly increased during withdrawal in ethosuximide (p < 0.01, unpaired t-test).
Ethosuximide Restores Relative Power in Low Frequency Bands during Withdrawal
In addition to alterations in theta rhythms, we also observed changes in the relative power
of all frequency bands over the course of ethanol exposure. During the fourth week of
exposure, relative power in the lower frequency range (delta and theta; Figure 2A-B) was
increased as compared to baseline measures (F4,168 = 8.05, p < 0.01, for delta, two-way
repeated measures ANOVA with Dunnett Multiple Comparison test; F4,168 = 78.95, p <
0.001 for theta). Conversely, the higher power bands showed a decrease in relative
power, with significant reductions in alpha (F4,168 = 19.05, p < 0.001), sigma (F4,168 =
22.72, p < 0.001) and beta (F4,168 = 36.68, p < 0.001) power during the fourth week of
intermittent ethanol exposure (Figure 2C-E).
During withdrawal, the significant increase in relative delta power seen during the
fourth week of ethanol exposure persisted in saline-treated animals (F1,18 = 12.14, p <
0.01); however, this increase was no longer evident for the ETX-treated mice (Figure 3A;
p > 0.05). The observed ethanol-induced increases in relative theta power for both saline-
and ETX-treated groups returned to values indistinguishable from their baseline week

41
(Figure 3B, p > 0.05 for both bands). Similar to the effect on delta, we observed a
significant effect of withdrawal on the relative alpha power in the saline-treated, but not
ETX-treated mice (Figure 3C; F1,18 = 9.691, p < 0.01). We also observed a significant
main effect of ETX treatment for both delta (F1,36 = 7.317, p < 0.05, two-way ANOVA)
and alpha (F1,36 = 5.182, p < 0.05) bands during withdrawal. We did not observe a
significant main effect of ETX treatment for the sigma (Figure 3D, p > 0.05) and beta
(Figure 3E, p > 0.05) bands, but with both treatment conditions pooled, a significant main
effect of withdrawal was seen for both sigma (F1,42 = 6.725, p < 0.05, one-way ANOVA)
and beta (F1,42 = 8.275, p < 0.01).
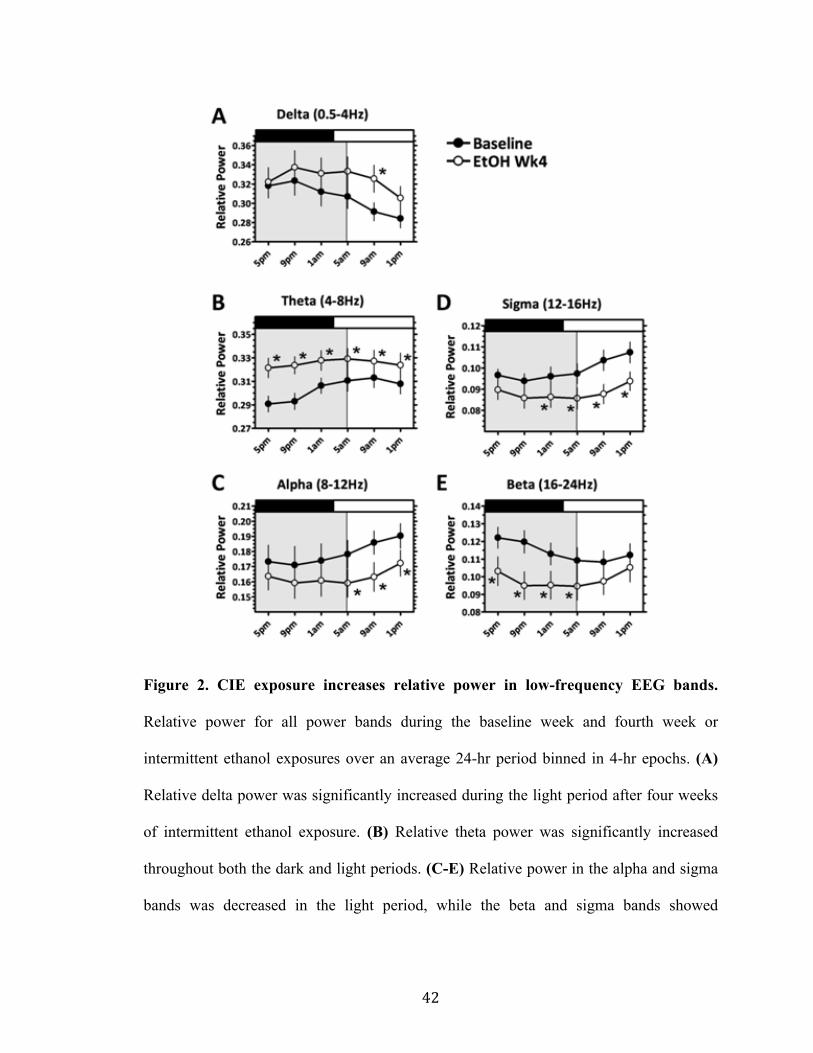
42
Figure 2. CIE exposure increases relative power in low-frequency EEG bands.
Relative power for all power bands during the baseline week and fourth week or
intermittent ethanol exposures over an average 24-hr period binned in 4-hr epochs. (A)
Relative delta power was significantly increased during the light period after four weeks
of intermittent ethanol exposure. (B) Relative theta power was significantly increased
throughout both the dark and light periods. (C-E) Relative power in the alpha and sigma
bands was decreased in the light period, while the beta and sigma bands showed

43
decreases in the dark period. Dark and light periods indicated by black and white bars at
the top of the graph. Ethanol exposure is illustrated by the shaded region. *p < 0.05
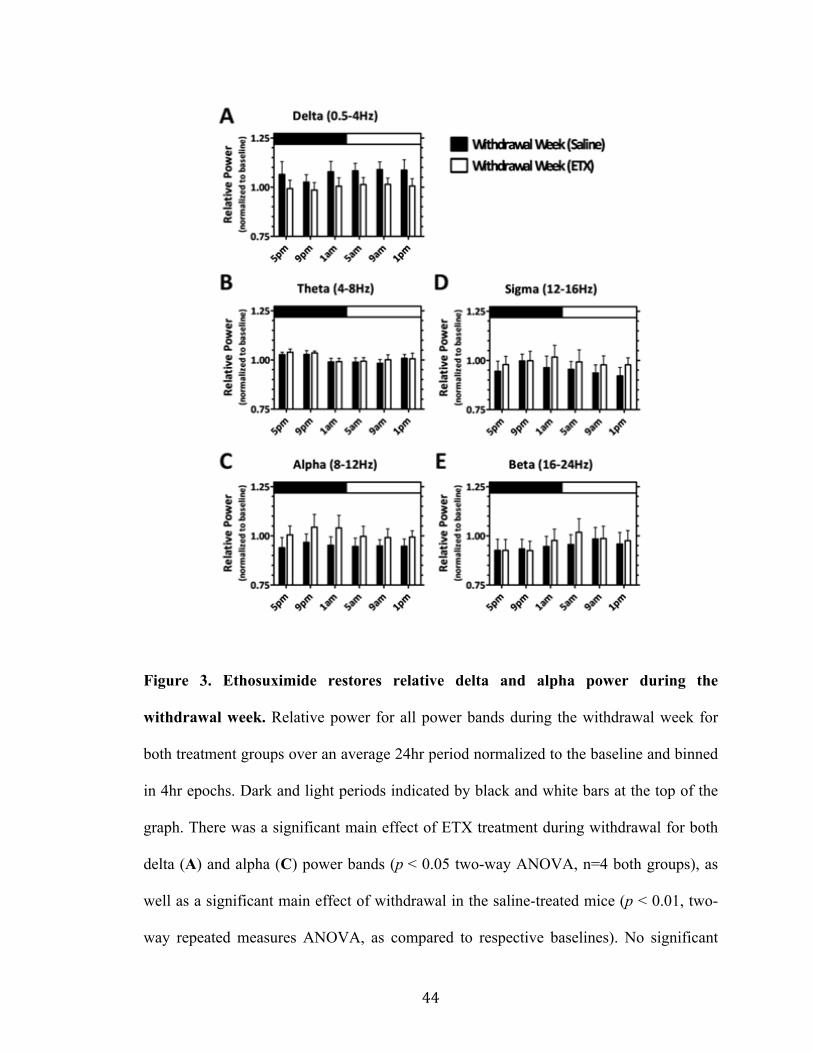
44
Figure 3. Ethosuximide restores relative delta and alpha power during the
withdrawal week. Relative power for all power bands during the withdrawal week for
both treatment groups over an average 24hr period normalized to the baseline and binned
in 4hr epochs. Dark and light periods indicated by black and white bars at the top of the
graph. There was a significant main effect of ETX treatment during withdrawal for both
delta (A) and alpha (C) power bands (p < 0.05 two-way ANOVA, n=4 both groups), as
well as a significant main effect of withdrawal in the saline-treated mice (p < 0.01, two-
way repeated measures ANOVA, as compared to respective baselines). No significant

45
main effect of ETX treatment was observed for theta (B), sigma (D) or beta (E) bands.
However, there was a significant main effect of withdrawal with both treatment groups
pooled for the sigma (D) and beta (E) bands (p < 0.05, two-way repeated measures
ANOVA, as compared to baseline).
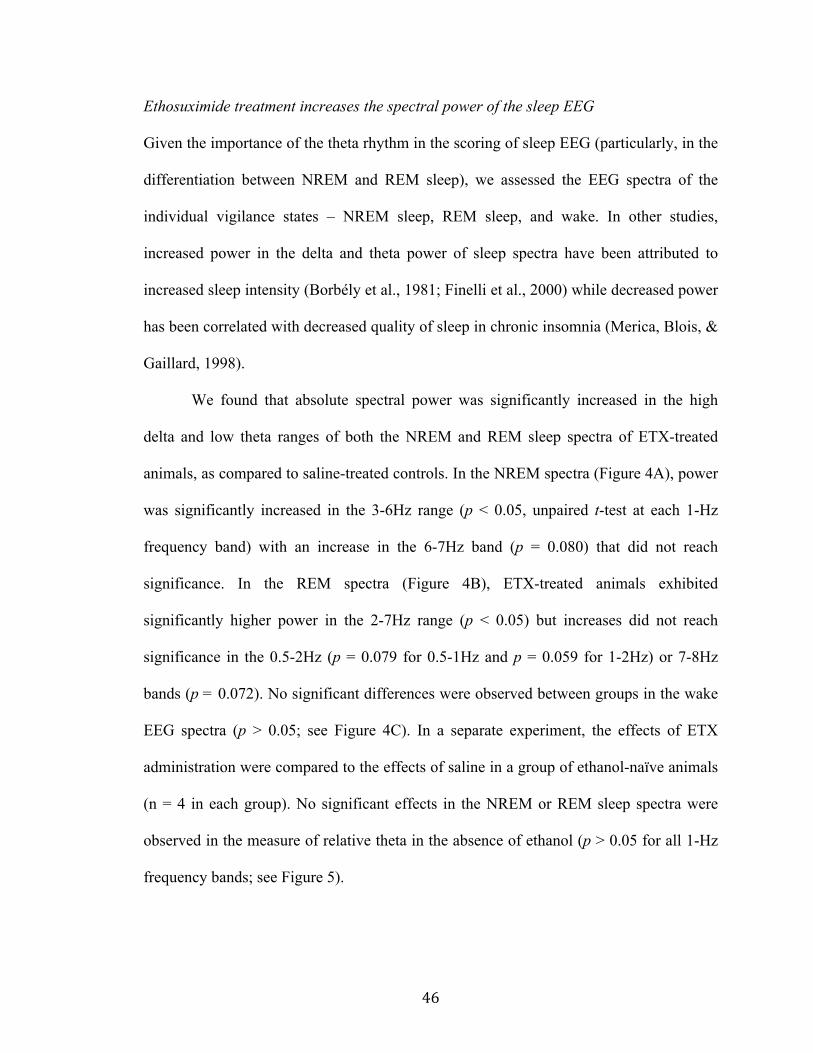
46
Ethosuximide treatment increases the spectral power of the sleep EEG
Given the importance of the theta rhythm in the scoring of sleep EEG (particularly, in the
differentiation between NREM and REM sleep), we assessed the EEG spectra of the
individual vigilance states – NREM sleep, REM sleep, and wake. In other studies,
increased power in the delta and theta power of sleep spectra have been attributed to
increased sleep intensity (Borbély et al., 1981; Finelli et al., 2000) while decreased power
has been correlated with decreased quality of sleep in chronic insomnia (Merica, Blois, &
Gaillard, 1998).
We found that absolute spectral power was significantly increased in the high
delta and low theta ranges of both the NREM and REM sleep spectra of ETX-treated
animals, as compared to saline-treated controls. In the NREM spectra (Figure 4A), power
was significantly increased in the 3-6Hz range (p < 0.05, unpaired t-test at each 1-Hz
frequency band) with an increase in the 6-7Hz band (p = 0.080) that did not reach
significance. In the REM spectra (Figure 4B), ETX-treated animals exhibited
significantly higher power in the 2-7Hz range (p < 0.05) but increases did not reach
significance in the 0.5-2Hz (p = 0.079 for 0.5-1Hz and p = 0.059 for 1-2Hz) or 7-8Hz
bands (p = 0.072). No significant differences were observed between groups in the wake
EEG spectra (p > 0.05; see Figure 4C). In a separate experiment, the effects of ETX
administration were compared to the effects of saline in a group of ethanol-naïve animals
(n = 4 in each group). No significant effects in the NREM or REM sleep spectra were
observed in the measure of relative theta in the absence of ethanol (p > 0.05 for all 1-Hz
frequency bands; see Figure 5).

47
Figure 4. Ethosuximide increases spectral power in the delta and theta bands of the
sleep EEG after ethanol withdrawal. Average power across all epochs scored as
NREM sleep (A), REM sleep (B), or Wake (C) is plotted against frequency (1-Hz bands
48
from 0.5-25 Hz) for each treatment group during the WD Week. (A) Spectral power in
the 4-7 Hz range (high-delta to low-theta band) of the NREM sleep EEG is significantly
increased in the ETX group, as compared to saline-treated control. (B) Spectral power in
the 2-7 Hz range (mid-delta to low-theta band) of the REM sleep EEG is significantly
increased in the ETX group. (C) No significant differences were detected between the
EEG spectra of the two groups during wake. One animal from the saline group was
excluded from the analysis as an outlier as it demonstrated spectral power an order of
magnitude greater than that of all other animals across all frequency bands analyzed in
the spectrum. Data are presented as mean ± SD. * p < 0.05, unpaired t-test at the given
frequency

49
Figure 5. Ethosuximide does not significantly affect the sleep EEG spectra in the
absence of ethanol. Average power across all epochs scored as NREM sleep (A), REM
sleep (B), or Wake (C) is plotted against frequency (1-Hz bands from 0.5-25 Hz) in a

50
cohort of ethanol-naïve animals who received either ethosuximide or saline treatment. No
significant differences were detected at any frequency for the three spectra (p > 0.05 for
all comparisons, unpaired t-test). Data are presented as mean ± SD.

51
Discussion
In this study, we have demonstrated ethanol-mediated disruptions in both delta and theta
diurnal rhythms that persist into withdrawal. These disrupted patterns could be
ameliorated with ethosuximide (ETX), a purported T-type Ca2+ channel blocker. In
addition, we observed significant ethanol-induced increases in relative delta power and
significant decreases in relative alpha power that continued into the subsequent
withdrawal week that could be restored to baseline levels with ETX. Furthermore, when
the absolute power spectra were aggregated according to sleep score, ETX increased
power in the delta and theta bands of both the NREM and REM sleep spectra, without
any effect on the wake spectrum. The significant ethanol-induced reductions in the higher
frequency sigma and beta bands also persisted into withdrawal; however, ETX had no
effect on the relative power of these frequencies ranges. Our results suggest that
pharmacologically targeting alterations in rhythmic brain patterns that persist beyond the
acute withdrawal window could be effective treatments in managing protracted
withdrawal symptoms such as sleep disturbances. These types of interventions would be
particularly beneficial as adjunctive therapies for treatment-seeking alcoholics since
disruptions in sleep have been shown to be effective predictors of relapse (Bauer, 2001;
Brower, 2001; Brower and Perron, 2009).
Abnormalities in the EEG of alcoholics have been well documented (for review,
see Porjesz and Begleiter, 2003). The most consistent EEG deficiency found among
alcoholics has been reduced sensory-evoked or event-related potentials (ERPs). Several
studies have shown that the P300, a particular ERP that is believed to reflect the cognitive
processing of a sensory stimulus rather than the stimuli’s physical features, is
52
significantly attenuated in alcoholics (Cohen et al., 1997; Rodriguez Holguin et al.,
1999). However, studies of resting spectral power have yielded conflicting results, with
some showing increases in certain EEG power bands (Rangaswamy et al., 2003; 2005;
Feige et al., 2007) and others reporting decreases (Saletu-Zyhlarz et al., 2004; Coutin-
Churchman et al., 2006). In general, it appears that alcoholics exhibit both abnormal
resting and evoked EEG signals as compared to control subjects.
In contrast to the abundance of investigations of EEG alterations in human
alcoholics, there have been considerably fewer studies on chronic ethanol’s effects on
EEG bands in rodents. Ehlers and Slawecki (2000) reported that rats chronically exposed
to ethanol in a vapor chamber demonstrated decreased spectral power in the delta, theta,
alpha and beta bands during a four-hour recording period immediately following six
weeks of multiple, intermittent exposures. In addition, they showed that the significant
decreases in power remained five weeks later for both the delta and theta band,
suggesting alterations in low-frequency EEG power can persist for a prolonged period
during withdrawal. Kubota et al. (2002) also reported an overall decrease in spectral
power for bands within the 2-25Hz frequency range in rats fed a three-week liquid
ethanol diet, however this reduction was no longer apparent one week later. The authors
of the latter study attributed this discrepancy to differences in administration methods
(ethanol vapor versus liquid diet) and length of exposure (six weeks versus three weeks).
In the present study, we did not find any significant differences in absolute power spectra
values during our ethanol exposure and withdrawal paradigm until we segregated the data
by sleep score. However, we did observe overall shifts in the relative proportion of power
among bands that favored increases in lower frequencies and decreases in higher
53
frequency bands. In addition, our results showing that ethanol-induced alterations in delta
and theta EEG rhythms continue into the subsequent week of withdrawal are consistent
with the results of Ehlers and Slawecki (2000), which suggested that disruptions in the
lower frequency bands are long lasting.
In this study, we treated ethanol exposed animals with a T-type channel blocker,
ETX. ETX is a first-choice antiepileptic drug (AED) in the treatment of absence
epilepsy, a non-convulsive seizure disorder characterized by generalized 3Hz spike-and-
wave discharges (SWDs) recorded on the EEG (for review, see Hughes, 2009). ETX has
been shown to inhibit low-threshold T-type Ca2+ currents in both the thalamic ventrobasal
nucleus (Coulter et al., 1989) and thalamic reticular nucleus of the rat (Huguenard and
Prince, 1994). It is commonly held that ETX produces its antiepileptic effects by
reducing T-type channel-mediated thalamic bursts, thereby disrupting the synchronized
oscillations within this circuit that underlie SWDs. While some controversy has arisen
over the specificity of ETX in blocking T-type currents (see Crunelli and Leresche,
2002), it has been suggested that ETX preferentially inhibits a T-type window current
(Gomora et al., 2001) that arises from the interaction of the voltage-dependent activation
and inactivation properties of whole-cell T-type current (Hughes et al., 1999; Crunelli et
al., 2005).
Previously described experiments from our lab (Graef et al., 2011) demonstrated a
progressive, functional upregulation of midline thalamic T-type channels, including
alterations in steady-state properties that occurred in parallel with progressive alterations
in the theta EEG band during chronic ethanol exposure and withdrawal. It was also noted
in that study that disruptions in thalamocortical circuitry can give rise to disruptions in

54
normal thalamocortical rhythms, which have been shown to display a significant increase
in medial thalamic T-type channel-mediated bursts, as well as augmented power and
thalamocortical coherence in the theta (4-9Hz) band range (Jeanmonod et al. 1996; Llinas
et al. 1999; Sarnthein and Jeanmonod 2007, 2008). In addition, increases in resting EEG
theta coherence have been reported in alcoholics that were also suggested to arise from
altered thalamocortical function (Porjesz and Rangaswamy, 2007). Considering that the
persistent, ethanol-mediated alterations in theta rhythms we observed during the
subsequent week of withdrawal could be ameliorated with ETX, it is possible that ETX is
exerting its effects by inhibiting this functional increase in midline thalamic T-type
channels, thereby restoring normal neural rhythms. Furthermore, it is possible that this
effect of ETX is limited to sleep, when T-type channels are most activated, given the
increase in sleep intensity observed in NREM and REM sleep spectra, but not the wake
spectrum of ETX-treated animals. This beneficial effect of ETX would be in partial
agreement with an earlier study where ETX was able to reduced withdrawal signs in
ethanol-dependent mice (Kaneto et al., 1986). It is also interesting to note that in addition
to its antiepileptic effects, ETX has been shown to be effective in other models of
thalamocortical dysrhythmias, including neuropathic pain (Dogrul et al., 2003),
Parkinson’s disease (Gomez-Mancilla et al, 1992), and depression (Shaw et al., 2009).
Caution should be used in interpreting the role of thalamic T-type calcium
channels from these studies. In our study, ETX was administered systemically and T-type
channels are diffusely expressed throughout the nervous system (Talley et al., 1999;
Perez-Reyes, 2003). Few studies have characterized the interaction between ethanol and
T-type channel expression and function outside of the thalamus (Nordskog et al., 2006;
55
Newton et al., 2008). Additionally, despite known effects on T-type calcium channels
(Gomora et al., 2001; Huguenard, 1996; Todorovic & Lingle, 1998), ETX has been
suggested to also affect other currents, such as the persistent Na+ current and Ca2+-
dependent K+ currents (Leresche et al., 1998; Crunelli and Leresche, 2002). It is
important to note that a decrease in T current-mediated burst firing was observed in the
latter study. However, both of these studies were carried out at high concentrations of
ETX, well above what is considered to be the physiologically relevant range. A separate
study of the effects of low concentration ETX confirmed blockade of T-type calcium
current at physiologically-relevant concentrations (Gomora et al., 2001). While no studies
have investigated the effects of ethanol on persistent Na+ currents, other studies have
demonstrated significant modulation of both small (SK) and large (BK) Ca2+-dependent
K+ channels during both acute and chronic ethanol exposure (Brodie et al., 2007).
Additionally, G-protein mediated inwardly-rectifying K+ (GIRK) channels are also
inhibited by ETX, where it has been shown to attenuate the ethanol-induced potentiation
of GIRK currents; however, the concentration of ETX used in this study was well above
the range of therapeutically relevant concentrations (Kobayashi et al., 2009). Future
investigations involving localized application of more specific T-type channel inhibitors
will clarify the exact role of T-type channels in the ethanol-mediated disruption of EEG
rhythms.
In this study, we demonstrated chronic ethanol-induced disruption in both delta
and theta EEG rhythms important for normal sleep, as well as relative delta and alpha
power, which persisted into the subsequent week of withdrawal. These effects could be
ameliorated with ETX, suggesting a role for T-type Ca2+ channels in underlying these

56
chronic ethanol effects. Since sleep disturbances during withdrawal have been implicated
as potential cause for relapse, it will be important to determine if the increased sleep
intensity we observed with ETX treatment translates into the restoration of disrupted
sleep patterns and sleep-related symptoms associated with protracted withdrawal from
chronic ethanol exposure. Moreover, the effects of alcohol withdrawal are complex and
these same observations could have implications for other pathology resulting from
hyperexcitability in this network, such as alcohol withdrawal-related seizure.

57
References
Bauer LO (2001) Predicting relapse to alcohol and drug abuse via quantitative
electroencephalography. Neuropsychopharmacology 25: 332-340.
Becker HC, Hale RL (1993) Repeated episodes of ethanol withdrawal potentiate the
severity of subsequent withdrawal seizures: an animal model of alcohol
withdrawal "kindling". Alcohol Clin Exp Res 17: 94-98.
Borbély AA, Baumann F, Brandeis D, Strauch I, Lehmann D (1981) Sleep deprivation:
effect on sleep stages and EEG power density in man. Electroencephalogr Clin
Neurophysiol 51: 483-495.
Brodie MS, Scholz A, Weiger TM, Dopico AM (2007) Ethanol interactions with
calcium-dependent potassium channels. Alcohol Clin Exp Res 31: 1625-1632.
Brower KJ, Aldrich MS, Robinson EA, Zucker RA, Greden JF (2001) Insomnia, self-
medication, and relapse to alcoholism. Am J Psychiatry 158: 399-404.
Brower KJ, Perron BE (2009) Sleep disturbance as a universal risk factor for relapse in
addictions to psychoactive substances. Med Hypotheses.
Cohen HL, Porjesz B, Begleiter H, Wang W (1997) Neurophysiological correlates of
response production and inhibition in alcoholics. Alcohol Clin Exp Res 21: 1398-
1406.
Coulter DA, Huguenard JR, Prince DA (1989) Specific petit mal anticonvulsants reduce
calcium currents in thalamic neurons. Neurosci Lett 98: 74-78.
58
Coutin-Churchman P, Moreno R, Anez Y, Vergara F (2006) Clinical correlates of
quantitative EEG alterations in alcoholic patients. Clin Neurophysiol 117: 740-
751.
Crunelli V, Leresche N (2002) Block of Thalamic T-Type Ca(2+) Channels by
Ethosuximide Is Not the Whole Story. Epilepsy Curr 2: 53-56.
Crunelli V, Toth TI, Cope DW, Blethyn K, Hughes SW (2005) The 'window' T-type
calcium current in brain dynamics of different behavioural states. J Physiol 562:
121-129.
Dogrul A, Gardell LR, Ossipov MH, Tulunay FC, Lai J, Porreca F (2003) Reversal of
experimental neuropathic pain by T-type calcium channel blockers. Pain 105:
159-168.
Ehlers CL, Slawecki CJ (2000) Effects of chronic ethanol exposure on sleep in rats.
Alcohol 20: 173-179.
Feige B, Scaal S, Hornyak M, Gann H, Riemann D (2007) Sleep electroencephalographic
spectral power after withdrawal from alcohol in alcohol-dependent patients.
Alcohol Clin Exp Res 31: 19-27.
Finelli LA, Baumann H, Borbély AA, Achermann P (2000) Dual electroencephalogram
markers of human sleep homeostasis: correlation between theta activity in waking
and slow-wave activity in sleep. Neuroscience 101: 523-529.
Friedmann PD, Rose JS, Swift R, Stout RL, Millman RP, Stein MD (2008) Trazodone for
sleep disturbance after alcohol detoxification: a double-blind, placebo-controlled
trial. Alcohol Clin Exp Res 32: 1652-1660.
59
Goldstein DB (1972) An animal model for testing effects of drugs on alcohol withdrawal
reactions. J Pharmacol Exp Ther 183: 14-22.
Gomez-Mancilla B, Latulippe JF, Boucher R, Bedard PJ (1992) Effect of ethosuximide
on rest tremor in the MPTP monkey model. Mov Disord 7: 137-141.
Gomora JC, Daud AN, Weiergraber M, Perez-Reyes E (2001) Block of cloned human T-
type calcium channels by succinimide antiepileptic drugs. Mol Pharmacol 60:
1121-1132.
Graef JD, Huitt TW, Nordskog BK, Hammarback JH, Godwin DW (2011) Disrupted T-
type Ca2+ channel expression and function during ethanol exposure and
withdrawal. J Neurophysiol 105: 528-40.
Hughes JR (2009) Absence seizures: a review of recent reports with new concepts.
Epilepsy Behav 15: 404-412.
Hughes SW, Cope DW, Toth TI, Williams SR, Crunelli V (1999) All thalamocortical
neurones possess a T-type Ca2+ 'window' current that enables the expression of
bistability-mediated activities. J Physiol 517 ( Pt 3): 805-815.
Huguenard JR (1996) Low-threshold calcium currents in central nervous system neurons.
Annu Rev Physiol 58: 329-348.
Huguenard JR, Prince DA (1994) Intrathalamic rhythmicity studied in vitro: nominal T-
current modulation causes robust antioscillatory effects. J Neurosci 14: 5485-
5502.
Jeanmonod D, Magnin M, Morel A (1996) Low-threshold calcium spike bursts in the
human thalamus. Common physiopathology for sensory, motor and limbic
positive symptoms. Brain 119 ( Pt 2): 363-375.
60
Kaneto H, Kawatani S, Kaneda H (1986) Differentiation of alcohol and barbital physical
dependence. Yakubutsu Seishin Kodo 6: 267-273.
Kobayashi T, Hirai H, Iino M, Fuse I, Mitsumura K, Washiyama K, Kasai S, Ikeda K
(2009) Inhibitory effects of the antiepileptic drug ethosuximide on G protein-
activated inwardly rectifying K+ channels. Neuropharmacology 56: 499-506.
Kubota T, De A, Brown RA, Simasko SM, Krueger JM (2002) Diurnal effects of acute
and chronic administration of ethanol on sleep in rats. Alcohol Clin Exp Res 26:
1153-1161.
Leresche N, Parri HR, Erdemli G, Guyon A, Turner JP, Williams SR, Asprodini E,
Crunelli V (1998) On the action of the anti-absence drug ethosuximide in the rat
and cat thalamus. J Neurosci 18: 4842-4853.
Llinas RR, Ribary U, Jeanmonod D, Kronberg E, Mitra PP (1999) Thalamocortical
dysrhythmia: A neurological and neuropsychiatric syndrome characterized by
magnetoencephalography. Proc Natl Acad Sci U S A 96: 15222-15227.
Llinas RR, Steriade M (2006) Bursting of thalamic neurons and states of vigilance. J
Neurophysiol 95: 3297-3308.
Merica H, Blois R, Gaillard J-M (1998) Spectral characteristics of sleep EEG in chronic
insomnia. Eur J Neurosci 10: 1826-1834.
Nelson MT, Todorovic SM, Perez-Reyes E (2006) The role of T-type calcium channels
in epilepsy and pain. Curr Pharm Des 12: 2189-2197.
Nelson W, Tong YL, Lee JK, Halberg F (1979) Methods for cosinor-rhythmometry.
Chronobiologia 6(4):305-23.
61
Newton PM, Zeng L, Wang V, Connolly J, Wallace MJ, Kim C, Shin HS, Belardetti F,
Snutch
TP, Messing RO (2008) A blocker of N- and T-type voltage-gated calcium
channels attenuates ethanol-induced intoxication, place preference, self-
administration, and reinstatement. J Neurosci 28(45):11712-9.
Nordskog BK, Hammarback JA, Godwin DW (2006) Diurnal gene expression patterns of
T-type calcium channels and their modulation by ethanol. Neuroscience 141:
1365-1373.
Perez-Reyes E (2003) Molecular physiology of low-voltage-activated t-type calcium
channels. Physiol Rev 83: 117-161.
Porjesz B, Begleiter H (2003) Alcoholism and human electrophysiology. Alcohol Res
Health 27: 153-160.
Porjesz B, Rangaswamy M (2007) Neurophysiological endophenotypes, CNS
disinhibition, and risk for alcohol dependence and related disorders.
ScientificWorldJournal 7: 131-141.
Rangaswamy M, Porjesz B, Chorlian DB, Choi K, Jones KA, Wang K, Rohrbaugh J,
O'Connor S, Kuperman S, Reich T, Begleiter H (2003) Theta power in the EEG
of alcoholics. Alcohol Clin Exp Res 27: 607-615.
Rodriguez HS, Porjesz B, Chorlian DB, Polich J, Begleiter H (1999) Visual P3a in male
alcoholics and controls. Alcohol Clin Exp Res 23: 582-591.
Saletu-Zyhlarz GM, Arnold O, Anderer P, Oberndorfer S, Walter H, Lesch OM, Boning
J, Saletu B (2004) Differences in brain function between relapsing and abstaining

62
alcohol-dependent patients, evaluated by EEG mapping. Alcohol Alcohol 39:
233-240.
Sarnthein J, Jeanmonod D (2007) High thalamocortical theta coherence in patients with
Parkinson's disease. J Neurosci 27: 124-131.
Sarnthein J, Jeanmonod D (2008) High thalamocortical theta coherence in patients with
neurogenic pain. Neuroimage 39: 1910-1917.
Shaw FZ, Chuang SH, Shieh KR, Wang YJ (2009) Depression- and anxiety-like
behaviors of a rat model with absence epileptic discharges. Neuroscience 160:
382-393.
Steriade M (2005) Sleep, epilepsy and thalamic reticular inhibitory neurons. Trends
Neurosci 28: 317-324.
Talley EM, Cribbs LL, Lee JH, Daud A, Perez-Reyes E, Bayliss DA (1999) Differential
distribution of three members of a gene family encoding low voltage-activated (T-
type) calcium channels. J Neurosci 19: 1895-1911.
Todorovic S, Lingle C (1998) Pharmacological properties of T-type Ca2+ current in adult
rat sensory neurons: effects of anticonvulsant and anesthetic agents. J
Neurophysiol 79: 240-52.
Veatch LM (2006) Disruptions in sleep time and sleep architecture in a mouse model of
repeated ethanol withdrawal. Alcohol Clin Exp Res 30: 1214-1222.
63
CHAPTER 3
DIFFERENTIAL EFFECTS OF ETHOSUXIMIDE TREATMENT AND GENETIC
SUPPRESSION OF A T-TYPE CA2+ CHANNEL SUBTYPE ON ALTERED SLEEP
HOMEOSTASIS IN RESPONSE TO CHRONIC INTERMITTENT ETHANOL
W.F. Wiggins, T.W. Huitt, J.D. Graef, and D.W. Godwin
This manuscript is in preparation to be submitted for publication in Alcoholism: Clinical
and Experimental Research. The experiments were performed by W.F. Wiggins and T.W.
Huitt with the help of J.D. Graef. The manuscript was written and prepared by W.F.
Wiggins. Dr. Dwayne W. Godwin designed experiments, wrote portions of the
manuscript and served in an editorial and advisory capacity.
64
Abstract
BACKGROUND: Alcohol withdrawal-related insomnia is an important problem for
chronic alcoholics and has been suggested to be a significant predictor of relapse.
Previously, we have identified disruptions in sleep-related oscillations important for the
maintenance of sleep that were partially reversed by administration of ethosuximide
(ETX), a purported T-type calcium current blocker.
METHODS: Two separate experiments were conducted. In the first experiment, data
from two groups of C57BL/6 mice (n = 5 in each group) were implanted with wireless
telemetric monitoring devices and subjected to six weeks of continuous EEG, EMG,
activity, and temperature recording. After one week of baseline, mice were subjected to 4
cycles of chronic intermittent ethanol (CIE) vapor administration, consisting of 5 days of
CIE exposure and 2 days of subacute withdrawal (WD). During the final week of
recording (sustained WD), mice were either administered saline or ETX (200 mg/kg). In
the second experiment, a group of Ca(v)3.2-deficient mice (n = 6), bred on a C56BL/6
background, and a group of wild-type littermate controls (n = 6) were implanted with
telemetry and subjected to 2 weeks of continuous recording, including 1 cycle of CIE
vapor administration, as described above. Data from both experiments were sleep-scored
and compared within and between groups using standard statistical methods.
RESULTS: Significant sedating effects of EtOH were observed in all groups from both
experiments, as reflected by increases in non-REM sleep and vigilance cycling. In the
first experiment, an increase in brief wakening observed during sustained WD was
partially reversed by ETX treatment. In the second experiment, Ca(v)3.2-deficient mice
demonstrated increased sleep during the WD period, as compared to baseline.

65
CONCLUSIONS: These results suggest that ETX may act to stabilize sleep during the
WD period. Furthermore, the results of the second experiment suggest a role for Ca(v)3.2
in withdrawal-mediated sleep disruption.
66
Introduction
Alcohol withdrawal-related sleep disruption plays a key role in the progression of
alcoholism. Prolonged abuse of ethanol leads to long-term disruptions in sleep patterns,
resting EEG activity, and profound disturbances in diurnal behaviors of alcoholics
(Kubota et al., 2002). These disturbances last well beyond the cessation of ethanol
consumption, persist into withdrawal, and have been suggested to be predictive of relapse
during alcohol withdrawal (Brower, Aldrich, & Hall, 1998; Brower & Perron, 2010;
Cohn, Foster, & Peters, 2003). Prevention of relapse represents a significant hurdle in
overcoming alcohol dependence.
The thalamus is involved in the generation and maintenance of normal brain rhythms
during both sleep and states of vigilance (Llinás & Steriade, 2006). Low-threshold
thalamic bursts have been demonstrated to underlie certain aspects of both normal sleep
oscillations and pathological states (Steriade, 2005). These bursts of action potentials are
mediated by a class of T-type Ca2+ channels that possess unique gating properties,
forming the basis of generation of intrinsic neuronal oscillations that are a characteristic
of the thalamus (Huguenard, 1996). Changes leading to altered T-type channel function
have been associated with certain pathological conditions that are marked by abnormal
increases in thalamocortical theta coherence (Sarnthein & Jeanmonod, 2007, 2008) and
have been termed thalamocortical "dysrhythmias" (Llinás, Ribary, Jeanmonod, Kronberg,
& Mitra, 1999).
Abnormal EEG activity in alcoholics has been well established (Porjesz & Begleiter,
2003; Rangaswamy et al., 2003), including increases in interhemispheric theta coherence
that have also been suggested to arise from altered thalamocortical function (Porjesz &

67
Rangaswamy, 2007). In rodents, repeated ethanol exposures and withdrawals that model
the binge/abstain consumption patterns of human alcoholics (Becker & Hale, 1993)
increases the severity of subsequent withdrawal-related hyperexcitability, leading to
altered sleep architecture (Ehlers & Slawecki, 2000; Kubota et al., 2002; Veatch, 2006),
heightened anxiety (Overstreet, Knapp, & Breese, 2002), and abnormal EEG activity
(Veatch & Gonzalez, 1996; Veatch & Becker, 2002). The neural substrates involved in
the progressive disruption of EEG and sleep patterns form a network composed of medial
thalamic, limbic, and prefrontal regions, all of which are especially vulnerable to the
adverse effects of chronic ethanol (Fadda & Rossetti, 1998).
We have recently shown that chronic intermittent ethanol exposure in C57BL/6 mice
alters normal daily variation of both thalamic T-type Ca2+ channel mRNA expression
levels and gating properties. These changes were associated with an increase in low-
threshold bursts of action potentials during acute withdrawal periods and a progressive
disruption in the mean peak frequency and normal diurnal variations in relative EEG
theta power (Graef et al., 2011). Subsequently, we identified alterations in relative delta
power and spectral power in the theta and delta bands of the sleep EEG, both of which
were partially reversed by administration of ethosuximide (ETX), a purported T-type
calcium channel antagonist (see Chapter 2).
In this study, we sought to determine the effects of pharmacologic and genetic
inhibition of T-type calcium channels on sleep patterns after multiple withdrawals from
chronic, intermittent exposure to ethanol vapor. While it is still unresolved if restoring
normal sleep and EEG patterns alone can prevent relapse (Brower & Perron, 2010),
furthering our understanding of the progressive EEG and sleep pattern alterations that

68
occur during chronic alcoholism and continue into protracted withdrawal will help
provide the basis for additional avenues for therapy.
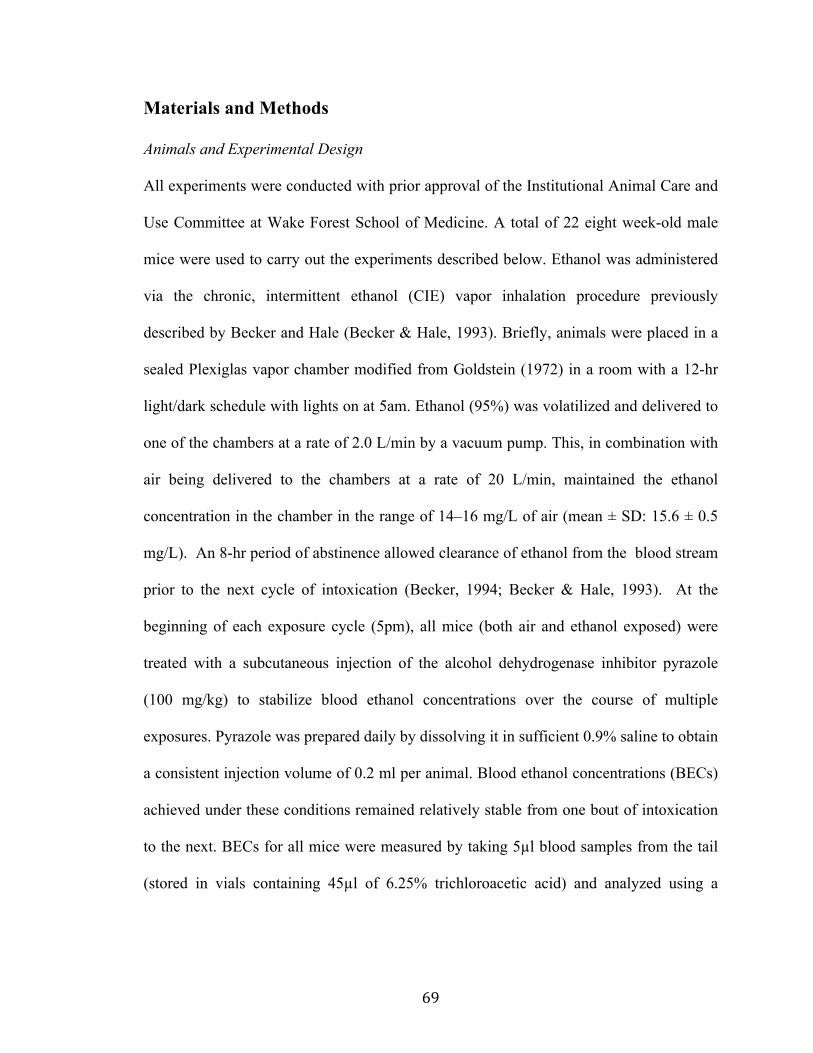
69
Materials and Methods
Animals and Experimental Design
All experiments were conducted with prior approval of the Institutional Animal Care and
Use Committee at Wake Forest School of Medicine. A total of 22 eight week-old male
mice were used to carry out the experiments described below. Ethanol was administered
via the chronic, intermittent ethanol (CIE) vapor inhalation procedure previously
described by Becker and Hale (Becker & Hale, 1993). Briefly, animals were placed in a
sealed Plexiglas vapor chamber modified from Goldstein (1972) in a room with a 12-hr
light/dark schedule with lights on at 5am. Ethanol (95%) was volatilized and delivered to
one of the chambers at a rate of 2.0 L/min by a vacuum pump. This, in combination with
air being delivered to the chambers at a rate of 20 L/min, maintained the ethanol
concentration in the chamber in the range of 14–16 mg/L of air (mean ± SD: 15.6 ± 0.5
mg/L). An 8-hr period of abstinence allowed clearance of ethanol from the blood stream
prior to the next cycle of intoxication (Becker, 1994; Becker & Hale, 1993). At the
beginning of each exposure cycle (5pm), all mice (both air and ethanol exposed) were
treated with a subcutaneous injection of the alcohol dehydrogenase inhibitor pyrazole
(100 mg/kg) to stabilize blood ethanol concentrations over the course of multiple
exposures. Pyrazole was prepared daily by dissolving it in sufficient 0.9% saline to obtain
a consistent injection volume of 0.2 ml per animal. Blood ethanol concentrations (BECs)
achieved under these conditions remained relatively stable from one bout of intoxication
to the next. BECs for all mice were measured by taking 5µl blood samples from the tail
(stored in vials containing 45µl of 6.25% trichloroacetic acid) and analyzed using a
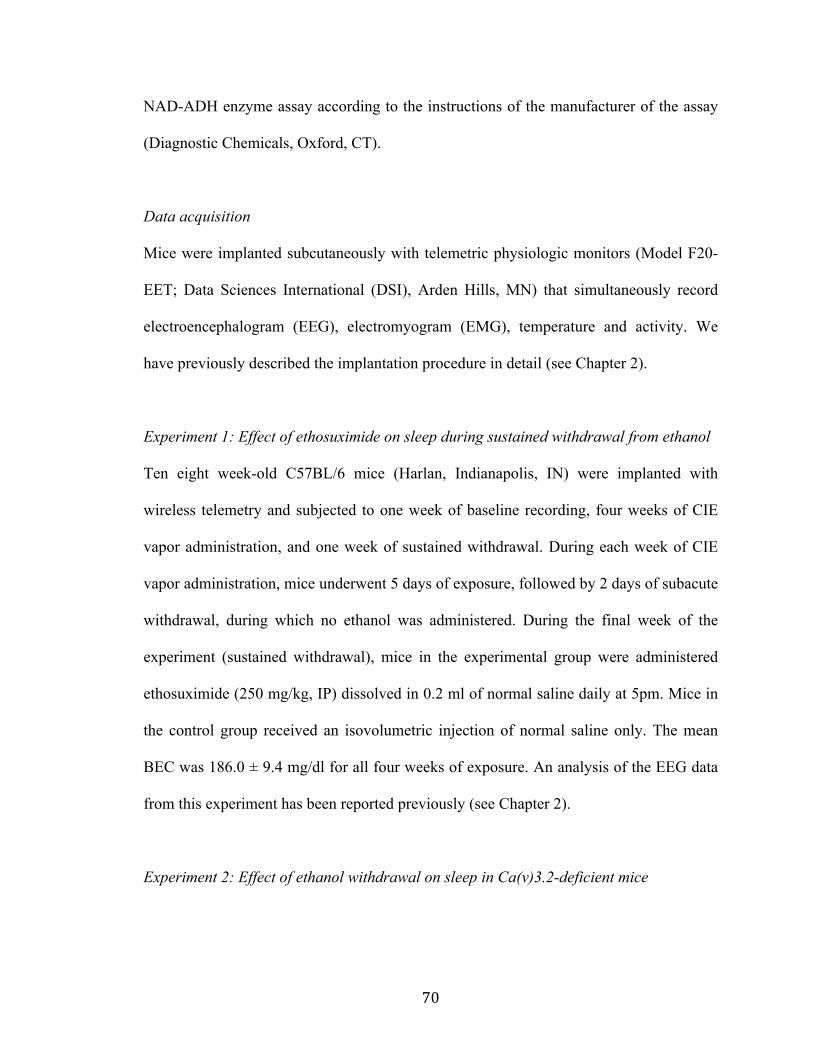
70
NAD-ADH enzyme assay according to the instructions of the manufacturer of the assay
(Diagnostic Chemicals, Oxford, CT).
Data acquisition
Mice were implanted subcutaneously with telemetric physiologic monitors (Model F20-
EET; Data Sciences International (DSI), Arden Hills, MN) that simultaneously record
electroencephalogram (EEG), electromyogram (EMG), temperature and activity. We
have previously described the implantation procedure in detail (see Chapter 2).
Experiment 1: Effect of ethosuximide on sleep during sustained withdrawal from ethanol
Ten eight week-old C57BL/6 mice (Harlan, Indianapolis, IN) were implanted with
wireless telemetry and subjected to one week of baseline recording, four weeks of CIE
vapor administration, and one week of sustained withdrawal. During each week of CIE
vapor administration, mice underwent 5 days of exposure, followed by 2 days of subacute
withdrawal, during which no ethanol was administered. During the final week of the
experiment (sustained withdrawal), mice in the experimental group were administered
ethosuximide (250 mg/kg, IP) dissolved in 0.2 ml of normal saline daily at 5pm. Mice in
the control group received an isovolumetric injection of normal saline only. The mean
BEC was 186.0 ± 9.4 mg/dl for all four weeks of exposure. An analysis of the EEG data
from this experiment has been reported previously (see Chapter 2).
Experiment 2: Effect of ethanol withdrawal on sleep in Ca(v)3.2-deficient mice
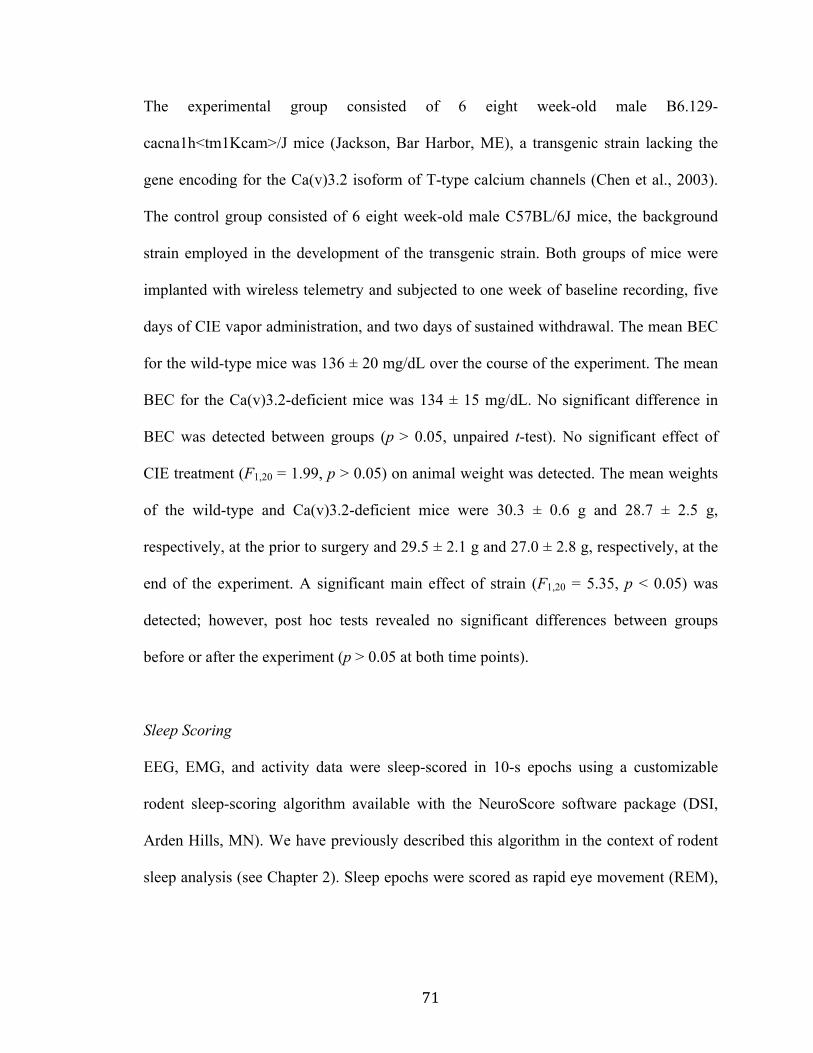
71
The experimental group consisted of 6 eight week-old male B6.129-
cacna1h<tm1Kcam>/J mice (Jackson, Bar Harbor, ME), a transgenic strain lacking the
gene encoding for the Ca(v)3.2 isoform of T-type calcium channels (Chen et al., 2003).
The control group consisted of 6 eight week-old male C57BL/6J mice, the background
strain employed in the development of the transgenic strain. Both groups of mice were
implanted with wireless telemetry and subjected to one week of baseline recording, five
days of CIE vapor administration, and two days of sustained withdrawal. The mean BEC
for the wild-type mice was 136 ± 20 mg/dL over the course of the experiment. The mean
BEC for the Ca(v)3.2-deficient mice was 134 ± 15 mg/dL. No significant difference in
BEC was detected between groups (p > 0.05, unpaired t-test). No significant effect of
CIE treatment (F1,20 = 1.99, p > 0.05) on animal weight was detected. The mean weights
of the wild-type and Ca(v)3.2-deficient mice were 30.3 ± 0.6 g and 28.7 ± 2.5 g,
respectively, at the prior to surgery and 29.5 ± 2.1 g and 27.0 ± 2.8 g, respectively, at the
end of the experiment. A significant main effect of strain (F1,20 = 5.35, p < 0.05) was
detected; however, post hoc tests revealed no significant differences between groups
before or after the experiment (p > 0.05 at both time points).
Sleep Scoring
EEG, EMG, and activity data were sleep-scored in 10-s epochs using a customizable
rodent sleep-scoring algorithm available with the NeuroScore software package (DSI,
Arden Hills, MN). We have previously described this algorithm in the context of rodent
sleep analysis (see Chapter 2). Sleep epochs were scored as rapid eye movement (REM),

72
non-REM (NREM), wake (W), or artifact, consistent with previous reports in rodents
(Simasko & Mukherjee, 2009; Veatch, 2006).
Vigilance Cycling Analysis
A custom MATLAB (The Math Works, Natick, MA) function was written to segregate
vigilance cycles (VC) from episodes of long-duration wake (LDW). Briefly, this function
removed artifact from the dataset, then combined adjacent bouts of the same type
previously separated by artifact. Bouts of BW were then distinguished from bouts of
LDW by the previously determined cutoff value of 300s duration, consistent with
Simasko & Mukherjee (2009). A VC was identified as an episode of sleep (NREM or
REM) followed by at least one other epoch of sleep or BW. To account for long periods
of isolated NREM, we selected 300s as a cutoff for identifying an isolated bout of NREM
(surrounded by two episodes of LDW) as a VC. All other isolated bouts of NREM were
excluded from subsequent VC analysis.
Cosinor Rhythmometry
A custom MATLAB script was designed to bin the activity, temperature, and NREM
sleep data into 1-hr bins in order to fit the parameters of the following cosinor equation to
each dataset:
𝑦 = 𝑀𝐸𝑆𝑂𝑅 + 𝐴𝑚𝑝𝑙𝑖𝑡𝑢𝑑𝑒 ∗ cos 2𝜋 ∗ 𝑝𝑒𝑟𝑖𝑜𝑑 + 𝑎𝑐𝑟𝑜𝑝ℎ𝑎𝑠𝑒
where MESOR is the midline estimating statistic of rhythm and acrophase describes the
peak of the curve (Nelson et al., 1979). Fits were calculated using nonlinear least-squares
regression for individual animals for each day across the baseline week, the fourth week

73
of CIE administration, and the sustained withdrawal week assuming a period of 24 hrs.
The parameters were then averaged for each animal across the baseline week, the
exposure days of EtOH Wk 4, the withdrawal days of EtOH Wk4, and the first 5 days of
the sustained withdrawal week.
Statistical Analysis
Statistical analysis was performed between exposure periods both within each treatment
group and between treatment groups using either MATLAB or SPSS (IBM Software,
Armonk, NY). Two-way repeated-measures or mixed-model (between-/within-subjects)
ANOVA was used to assess effects of ethanol, group/strain, and/or time of day for all
datasets. Post-hoc comparisons were made between exposure/withdrawal periods and
baseline and between treatment groups using Tukey’s least significant difference
procedure. All results are reported as mean ± SEM.

74
Results
Experiment 1: Effect of ethosuximide on sleep during sustained withdrawal from ethanol
Electroencephalographic (EEG), electromyographic (EMG), activity, and body
temperature data were continuously recorded from two groups of C57BL/6 mice (n = 5 in
each group) during a baseline week, four weeks of chronic intermittent ethanol (CIE)
administration, and one week of sustained withdrawal from ethanol. During the sustained
withdrawal week, each group either received ethosuximide (ETX) or saline treatment.
These data were sleep scored and analyzed for measures of sleep quantity, sleep
architecture, and diurnal rhythmicity. Measures of sleep or wake time are reported as the
total percentage of each period (dark or light) spent in the corresponding vigilance state.
Measures of sleep architecture are reported within the “vigilance cycling” framework of
sleep analysis (Mukherjee & Simasko, 2009; Simasko & Mukherjee, 2009). The diurnal
rhythmicity of NREM sleep, activity, and body temperature was assessed via cosinor
rhythmometry (Nelson et al., 1979).
CIE vapor administration has a prominent sedating effect
We first examined the effects of ethanol exposure on sleep time. Ethanol exposure in the
CIE paradigm demonstrated a significant effect on the proportion of time spent in NREM
sleep (F5,108 = 17.15, p < 0.001). During the ethanol exposure days of the first week of
CIE administration (EtOH Exp 1), mice exhibited a significant increase in the percent
time spent in NREM sleep (Fig. 6A) with a corresponding decrease in wake time (Fig. 8).
The percent of the dark period (the active phase for mice under normal conditions) spent
in NREM sleep increased from 25.0 ± 3.9% during the baseline week to 65.4 ± 3.9% by

75
the last exposure day of the first week of CIE (p < 0.05). The effect persisted through the
fourth and final week of CIE administration (Exp 4; Fig. 6A, p < 0.05). For the light
period, NREM sleep time increased from 53.2 ± 5.1% to 75.9 ± 5.1% during the EtOH
Exp 1 (p < 0.05), but this effect was not observed in EtOH Exp 4 (p > 0.05).
Interestingly, the animals did not appear to develop tolerance to the effects of ethanol
exposure during the dark period, as the average NREM sleep time was not significantly
different between EtOH Exp 1 and EtOH Exp 4 (p > 0.05 for both). No main effect of
ethanol exposure was observed for the overall percent time spent in REM sleep (Fig. 7A,
F5,108 = 1.01, p > 0.05).
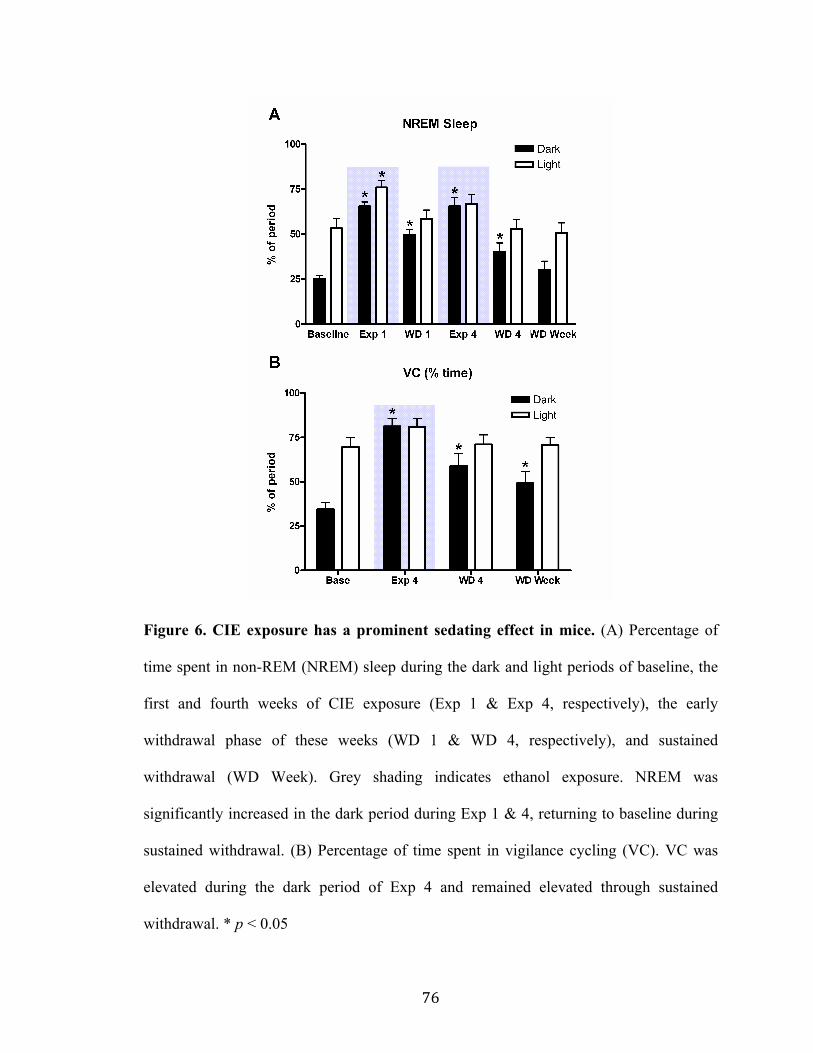
76
Figure 6. CIE exposure has a prominent sedating effect in mice. (A) Percentage of
time spent in non-REM (NREM) sleep during the dark and light periods of baseline, the
first and fourth weeks of CIE exposure (Exp 1 & Exp 4, respectively), the early
withdrawal phase of these weeks (WD 1 & WD 4, respectively), and sustained
withdrawal (WD Week). Grey shading indicates ethanol exposure. NREM was
significantly increased in the dark period during Exp 1 & 4, returning to baseline during
sustained withdrawal. (B) Percentage of time spent in vigilance cycling (VC). VC was
elevated during the dark period of Exp 4 and remained elevated through sustained
withdrawal. * p < 0.05
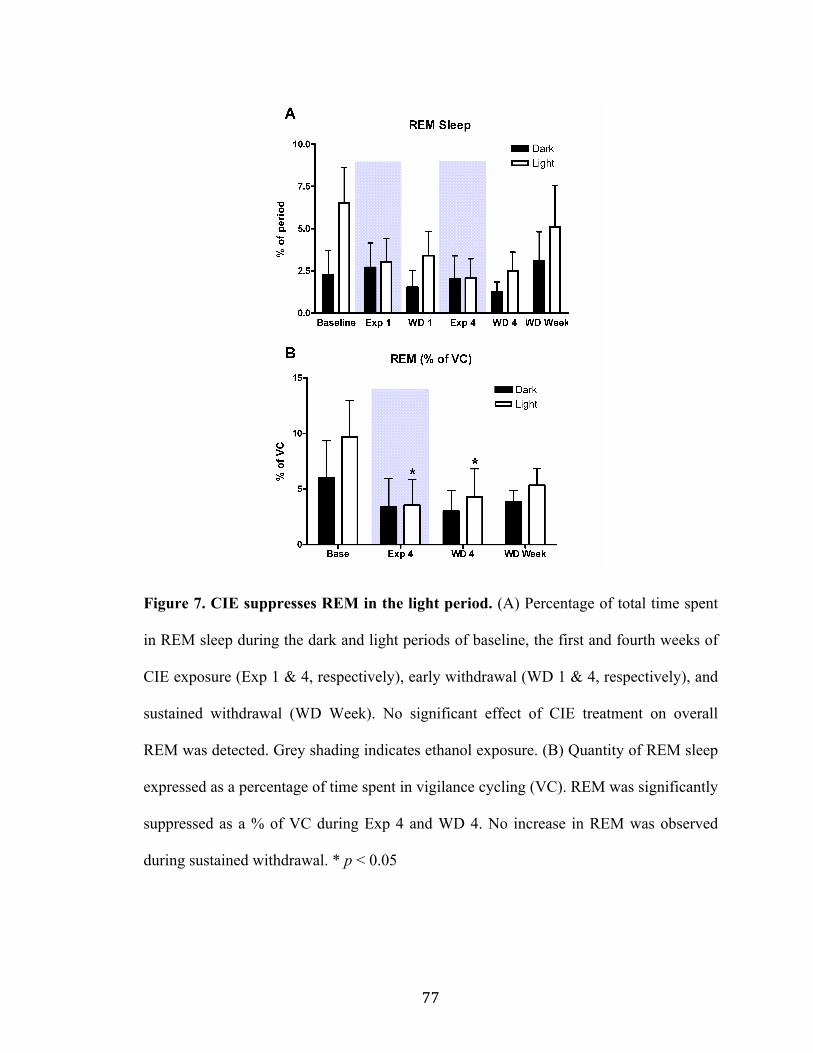
77
Figure 7. CIE suppresses REM in the light period. (A) Percentage of total time spent
in REM sleep during the dark and light periods of baseline, the first and fourth weeks of
CIE exposure (Exp 1 & 4, respectively), early withdrawal (WD 1 & 4, respectively), and
sustained withdrawal (WD Week). No significant effect of CIE treatment on overall
REM was detected. Grey shading indicates ethanol exposure. (B) Quantity of REM sleep
expressed as a percentage of time spent in vigilance cycling (VC). REM was significantly
suppressed as a % of VC during Exp 4 and WD 4. No increase in REM was observed
during sustained withdrawal. * p < 0.05
78
To characterize effects on and within sleep architecture, we employed the
vigilance cycling framework of sleep analysis (Simasko & Mukherjee, 2009). According
to this framework, rodents alternate between episodes of long-duration wake (LDW) and
vigilance cycling. A vigilance cycle (VC) is defined as a period during which alternation
between NREM sleep, REM sleep, and brief wakening (BW) occurs without interruption
by a period of long-duration wake. The results of this analysis are summarized in Table
II.
During the dark period of EtOH Exp 4, the number and average duration of VC
episodes were increased significantly (p < 0.05 for both) with a net effect of increasing
the percent of total time spent in VC (Fig. 6B). There was a corresponding decrease in the
number and duration of LDW episodes with a net effect of decreasing the percent of total
time spent in LDW during the dark period (Fig. 8). Within vigilance cycles, there was an
increase in NREM episode duration for both periods (p < 0.05 for both periods) and an
increase in the average percent of the VC spent in NREM for the dark period (p < 0.05).
Importantly, there was also a decrease in REM episode duration during the light period
(Fig. 7B, p < 0.05).
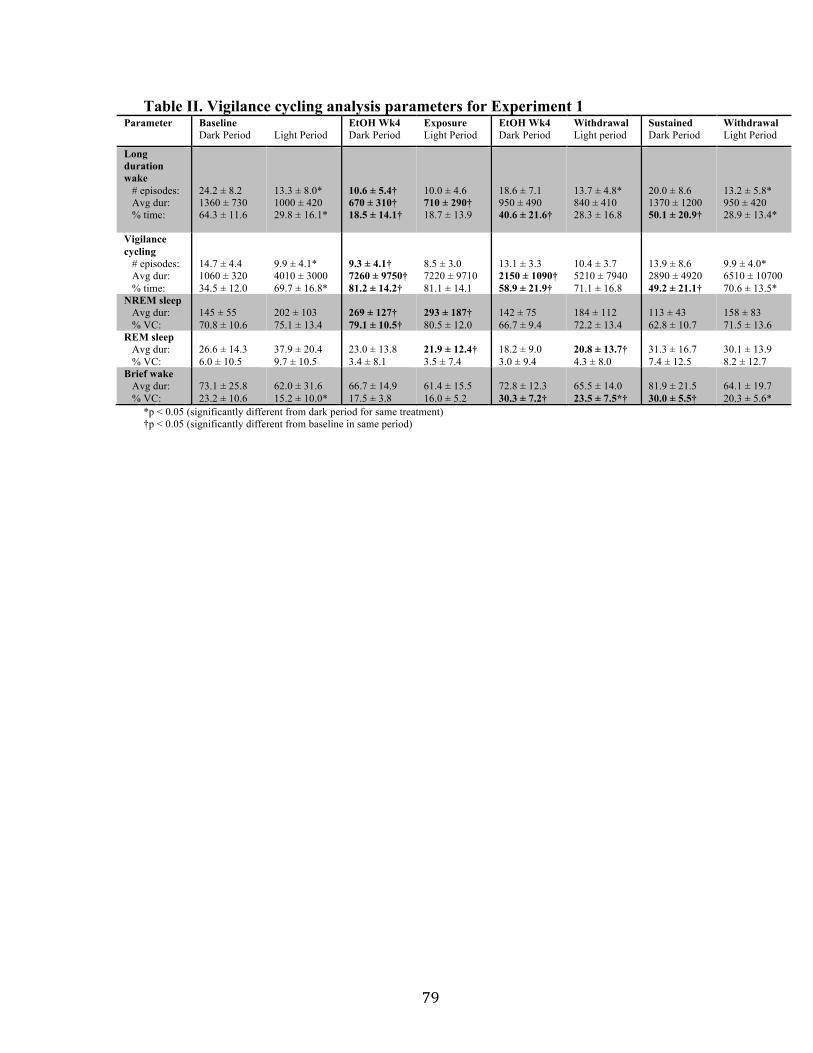
79
Table II. Vigilance cycling analysis parameters for Experiment 1 Parameter Baseline
Dark Period Light Period
EtOH Wk4 Dark Period
Exposure Light Period
EtOH Wk4 Dark Period
Withdrawal Light period
Sustained Dark Period
Withdrawal Light Period
Long duration wake # episodes: Avg dur: % time:
24.2 ± 8.2 1360 ± 730 64.3 ± 11.6
13.3 ± 8.0* 1000 ± 420 29.8 ± 16.1*
10.6 ± 5.4† 670 ± 310† 18.5 ± 14.1†
10.0 ± 4.6 710 ± 290† 18.7 ± 13.9
18.6 ± 7.1 950 ± 490 40.6 ± 21.6†
13.7 ± 4.8* 840 ± 410 28.3 ± 16.8
20.0 ± 8.6 1370 ± 1200 50.1 ± 20.9†
13.2 ± 5.8* 950 ± 420 28.9 ± 13.4*
Vigilance cycling # episodes: Avg dur: % time:
14.7 ± 4.4 1060 ± 320 34.5 ± 12.0
9.9 ± 4.1* 4010 ± 3000 69.7 ± 16.8*
9.3 ± 4.1† 7260 ± 9750† 81.2 ± 14.2†
8.5 ± 3.0 7220 ± 9710 81.1 ± 14.1
13.1 ± 3.3 2150 ± 1090† 58.9 ± 21.9†
10.4 ± 3.7 5210 ± 7940 71.1 ± 16.8
13.9 ± 8.6 2890 ± 4920 49.2 ± 21.1†
9.9 ± 4.0* 6510 ± 10700 70.6 ± 13.5*
NREM sleep Avg dur: % VC:
145 ± 55 70.8 ± 10.6
202 ± 103 75.1 ± 13.4
269 ± 127† 79.1 ± 10.5†
293 ± 187† 80.5 ± 12.0
142 ± 75 66.7 ± 9.4
184 ± 112 72.2 ± 13.4
113 ± 43 62.8 ± 10.7
158 ± 83 71.5 ± 13.6
REM sleep Avg dur: % VC:
26.6 ± 14.3 6.0 ± 10.5
37.9 ± 20.4 9.7 ± 10.5
23.0 ± 13.8 3.4 ± 8.1
21.9 ± 12.4† 3.5 ± 7.4
18.2 ± 9.0 3.0 ± 9.4
20.8 ± 13.7† 4.3 ± 8.0
31.3 ± 16.7 7.4 ± 12.5
30.1 ± 13.9 8.2 ± 12.7
Brief wake Avg dur: % VC:
73.1 ± 25.8 23.2 ± 10.6
62.0 ± 31.6 15.2 ± 10.0*
66.7 ± 14.9 17.5 ± 3.8
61.4 ± 15.5 16.0 ± 5.2
72.8 ± 12.3 30.3 ± 7.2†
65.5 ± 14.0 23.5 ± 7.5*†
81.9 ± 21.5 30.0 ± 5.5†
64.1 ± 19.7 20.3 ± 5.6*
*p < 0.05 (significantly different from dark period for same treatment) †p < 0.05 (significantly different from baseline in same period)

80
Figure 8. CIE effects on LDW for Experiment 1. Percent time spent in periods long-
duration wakening during the dark and light periods of baseline, the first and fourth
weeks of CIE exposure (Exp 1 & 4, respectively), the early withdrawal phase of both
weeks (WD 1 & 4, respectively) and sustained withdrawal (WD Week). LDW was
significantly decreased in both the dark and light periods during Exp 1 & 4. LDW was
remained significantly decreased during the dark period of WD 1 & 4. * p < 0.05

81
CIE exposure attenuates diurnal rhythms and decouples NREM from activity and
temperature
To examine the relationship between the increase in NREM sleep during ethanol
exposure and possible alterations in activity and body temperature, we performed cosinor
rhythmometry (Nelson et al., 1979) on data from baseline, Exp 4, WD 4, and sustained
withdrawal for both the ETX and saline groups. As no significant main effect of ETX
treatment was observed for any of the 9 parameters, the two groups were combined for
statistical analysis. The results of this analysis are summarized in Table III.
Of note, we observed significant effects of CIE treatment on the midline-
estimating statistic of rhythm (MESOR) and amplitude of the diurnal rhythm of NREM,
activity, and temperature (p < 0.05 for all measures). Each of these measures was
significantly attenuated during EtOH Exp 4 (p < 0.05, as compared to baseline for all
measures). While the MESOR of NREM was partially reversed during WD 4 (p > 0.05,
as compared to baseline), the MESOR of activity and the amplitude of both measures
remained significantly attenuated (p < 0.05, as compared to baseline for each measure).
Temperature MESOR and activity MESOR and amplitude remained attenuated during
sustained withdrawal (p < 0.05 for each measure).
A significant effect of CIE treatment on acrophase was observed for activity (F3,36
= 5.09, p < 0.01) and temperature (F3,36 = 12.40, p < 0.001), but not NREM (F3,36 = 1.71,
p > 0.05). The acrophase of both activity and temperature were similarly shifted in Exp 4
from 4.24 ± 2.06hrs and 3.78 ± 2.12hrs, respectively, to 7.37 ± 0.75hrs and 7.25 ±
0.59hrs, respectively (p < 0.05, as compared to baseline for both measures). Both values
returned to baseline during WD 4 (p > 0.05 for both).

82
Table III. Cosinor analysis of diurnal rhythms for Experiment 1 Parameter
Baseline EtOH Exp 4 EtOH WD 4 Sustained Withdrawal
Activity (ct/min) MESOR: Amplitude: Phase (hrs):
391±125 313±134
4.24±2.06
153±55* 101±51*
7.37±0.75*
236±78* 107±83*
5.51±2.74
286±61* 160±66*
4.41±1.99 NREM (% time) MESOR: Amplitude: Phase (hrs):
40.1±12.4 22.4±8.2 17.3±0.5
69.4±12.2* 13.4±4.7* 16.7±1.0
50.1±13.9 11.3±7.5* 17.1±1.4
41.5±15.6 16.0±4.5 17.5±0.4
Temperature (°C) MESOR: Amplitude: Phase (hrs):
34.8±0.3
0.71±0.21 3.78±2.12
33.3±0.6* 0.50±0.15
7.25±0.59*
33.6±0.6*
0.30±0.12* 3.97±1.88
34.2±0.4* 0.51±0.14 3.38±1.37
*p < 0.05 (significantly different from baseline)
83
Some effects of CIE exposure are partially reversed during the early withdrawal phase
The prominent sedating effect observed during CIE exposure was partially reversed in the
early withdrawal phase. During the two-day subacute withdrawal period following the
first administration week, the percent time spent in NREM sleep exhibited a partial
reversion to baseline (Fig. 6A). Specifically, the %NREM in the light period of both the
first and fourth subacute withdrawal periods (WD 1 and WD 4, respectively) was not
significantly different than that observed in the baseline week (p > 0.05 for both periods).
With respect to sleep architecture, the number and duration of LDW episodes and the
number of VC episodes during the dark period of WD 4 were also found not to be
significantly different from baseline (Table II, p > 0.05). Furthermore, the duration (both
periods) and the percent of VC spent in NREM (dark period) returned to their baseline
levels, as well (p > 0.05 for all).
Some effects of CIE exposure remained during the early withdrawal phase. The
duration of (Table II) and percent time spent in VC during WD 4 (Fig. 6B) remained
significantly greater than baseline for the dark period (p < 0.05 for both) despite a trend
towards a decrease from EtOH Exp 4 (p = 0.067). The reciprocal effect on percent time
spent in LDW also remained during this time (p < 0.05). Furthermore, there was a
continued effect of REM episode suppression during WD 4 (p < 0.05).
Increase in BW during sustained withdrawal from CIE is partially reversed by
ethosuximide
There was a significant main effect of ethanol on BW during the first and fourth weeks of
CIE administration (F4,90 = 9.77, p < 0.001). In the dark period, ethanol significantly

84
increased the percent time spent in BW during the Exp 1 and Exp 4 (Fig. 9A, p < 0.05 for
both). This effect persisted into both WD 1 and WD 4 (p < 0.05 for both). While BW in
the light period was not significantly increased by EtOH exposure (Fig. 9A; Exp 1: p >
0.05, Exp 4: p > 0.05), there were significant increases in BW during the light period of
both WD 1 and WD 4 (p < 0.05 for both). The significant main effect of CIE treatment
on BW was also observed during sustained withdrawal (Fig. 9B,C), during which 5
animals received saline treatment and 5 animals received ETX treatment (F1,16 = 5.55, p
< 0.05 as compared to baseline for the dark period; F1,16 = 11.92, p < 0.01 as compared to
baseline for light period). In the saline group, BW was increased from 5.9 ± 2.5% to 14.7
± 2.5% in the dark period (p < 0.05) and from 8.9 ± 1.5% to 15.9 ± 1.5% in the light
period (p < 0.05). However, in the ETX group, BW during both the dark and light periods
was not significantly different from baseline (p > 0.05 for both).

85
Figure 9. ETX partially reverses withdrawal-mediated sleep fragmentation in the
light period. (A) Percentage of time spent in periods of brief wakening (BW) during the
dark and light periods of baseline, the first and fourth weeks of CIE exposure (Exp 1 & 4,
respectively) and early withdrawal (WD 1 & 4, respectively). Grey shading indicates
ethanol exposure. BW was significantly increased during the dark period of Exp & WD
during both weeks of CIE treatment (A). BW was significantly increased in the light
period of WD only. Grey shading indicated ethanol exposure. (B) Comparison of
percentage of time spent in BW during the dark period between mice receiving saline and
ethosuximide (ETX) during baseline and sustained withdrawal. BW remains significantly
elevated during sustained withdrawal in the saline group only. (C) Comparison of % time
in BW during the light period between the saline and ETX groups during baseline and
sustained withdrawal. BW remains significantly elevated during sustained withdrawal in
the saline group only. * p < 0.05
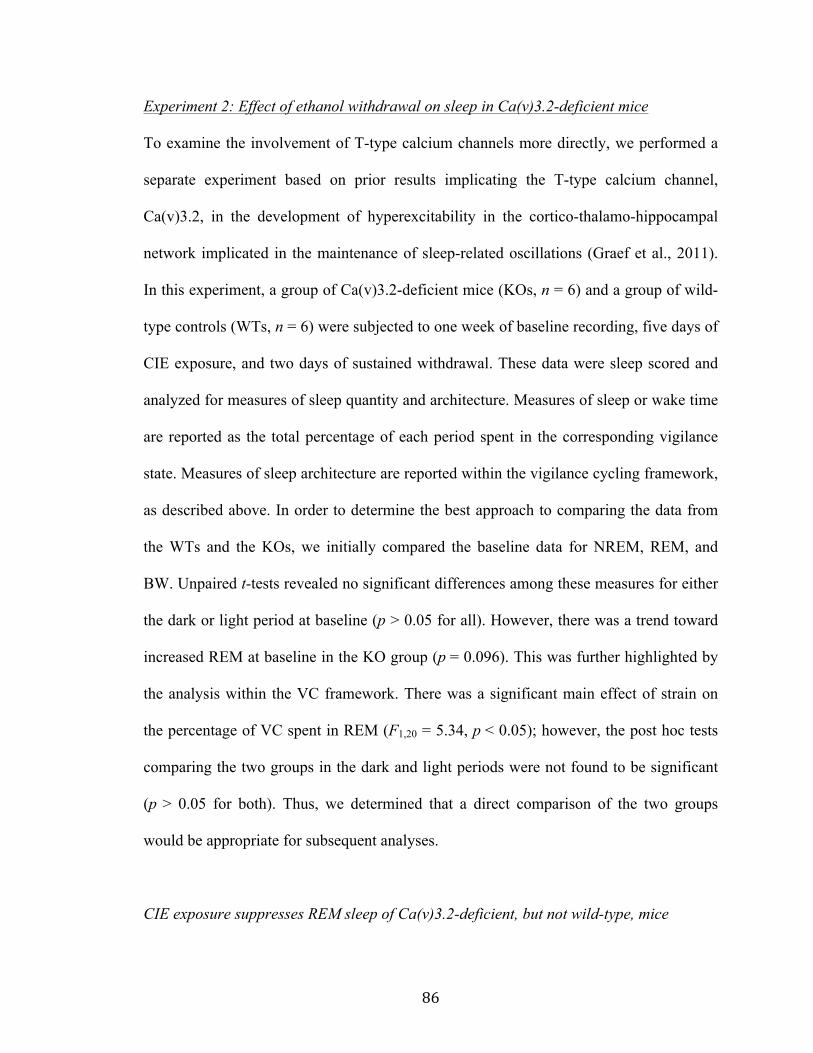
86
Experiment 2: Effect of ethanol withdrawal on sleep in Ca(v)3.2-deficient mice
To examine the involvement of T-type calcium channels more directly, we performed a
separate experiment based on prior results implicating the T-type calcium channel,
Ca(v)3.2, in the development of hyperexcitability in the cortico-thalamo-hippocampal
network implicated in the maintenance of sleep-related oscillations (Graef et al., 2011).
In this experiment, a group of Ca(v)3.2-deficient mice (KOs, n = 6) and a group of wild-
type controls (WTs, n = 6) were subjected to one week of baseline recording, five days of
CIE exposure, and two days of sustained withdrawal. These data were sleep scored and
analyzed for measures of sleep quantity and architecture. Measures of sleep or wake time
are reported as the total percentage of each period spent in the corresponding vigilance
state. Measures of sleep architecture are reported within the vigilance cycling framework,
as described above. In order to determine the best approach to comparing the data from
the WTs and the KOs, we initially compared the baseline data for NREM, REM, and
BW. Unpaired t-tests revealed no significant differences among these measures for either
the dark or light period at baseline (p > 0.05 for all). However, there was a trend toward
increased REM at baseline in the KO group (p = 0.096). This was further highlighted by
the analysis within the VC framework. There was a significant main effect of strain on
the percentage of VC spent in REM (F1,20 = 5.34, p < 0.05); however, the post hoc tests
comparing the two groups in the dark and light periods were not found to be significant
(p > 0.05 for both). Thus, we determined that a direct comparison of the two groups
would be appropriate for subsequent analyses.
CIE exposure suppresses REM sleep of Ca(v)3.2-deficient, but not wild-type, mice

87
There was a significant main effect of CIE treatment on percent time spent in NREM
sleep in both the dark period (F2,30 = 15.82, p < 0.001) and the light period (F2,30 = 6.09, p
< 0.01). WT mice exhibited increased NREM from 35.5 ± 16.5% to 61.6 ± 11.6% of the
dark period (p < 0.05) during EtOH exposure days (Exp; Fig. 10A,B). However, the
increase from 55.4 ± 10.3% to 67.7 ± 9.3% of the light period was not found to be
significant (p > 0.05). KO mice exhibited increased NREM from 30.3 ± 2.8% to 57.3 ±
5.0% of the dark period (p < 0.05) and from 55.5 ± 5.1% to 66.7 ± 5.1% of the light
period (p < 0.05) during Exp. Reciprocal changes were observed in percent time spent in
LDW (Fig. 12). Furthermore, there were significant main effects of both CIE treatment
(F2,30 = 3.38, p < 0.05) and strain (F1,30 = 6.31, p < 0.05) on percent time spent in REM
sleep in the light period (Fig. 11A,B). Post hoc tests demonstrated decreased REM from
4.55 ± 0.8% to 1.78 ± 0.8% in the KO group during Exp (p < 0.05); whereas, all other
differences were not found to be significant (p > 0.05 for all). No significant main effect
of CIE treatment on BW was observed (Fig. 13).
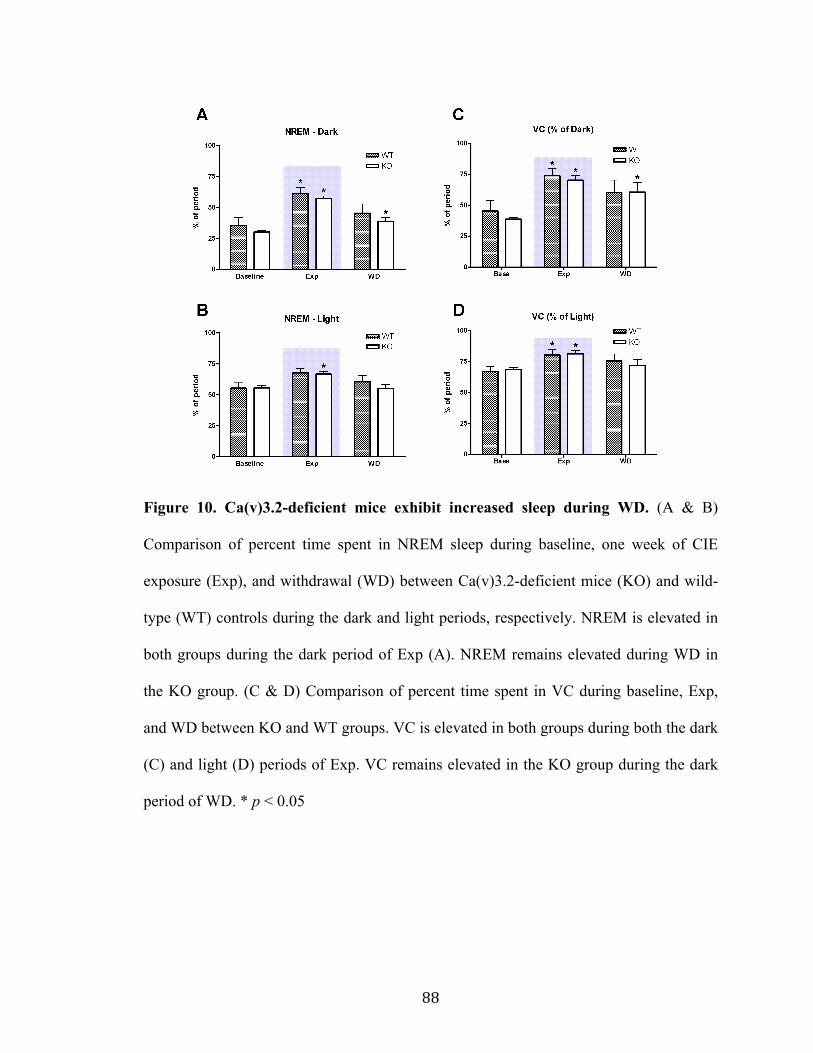
88
Figure 10. Ca(v)3.2-deficient mice exhibit increased sleep during WD. (A & B)
Comparison of percent time spent in NREM sleep during baseline, one week of CIE
exposure (Exp), and withdrawal (WD) between Ca(v)3.2-deficient mice (KO) and wild-
type (WT) controls during the dark and light periods, respectively. NREM is elevated in
both groups during the dark period of Exp (A). NREM remains elevated during WD in
the KO group. (C & D) Comparison of percent time spent in VC during baseline, Exp,
and WD between KO and WT groups. VC is elevated in both groups during both the dark
(C) and light (D) periods of Exp. VC remains elevated in the KO group during the dark
period of WD. * p < 0.05
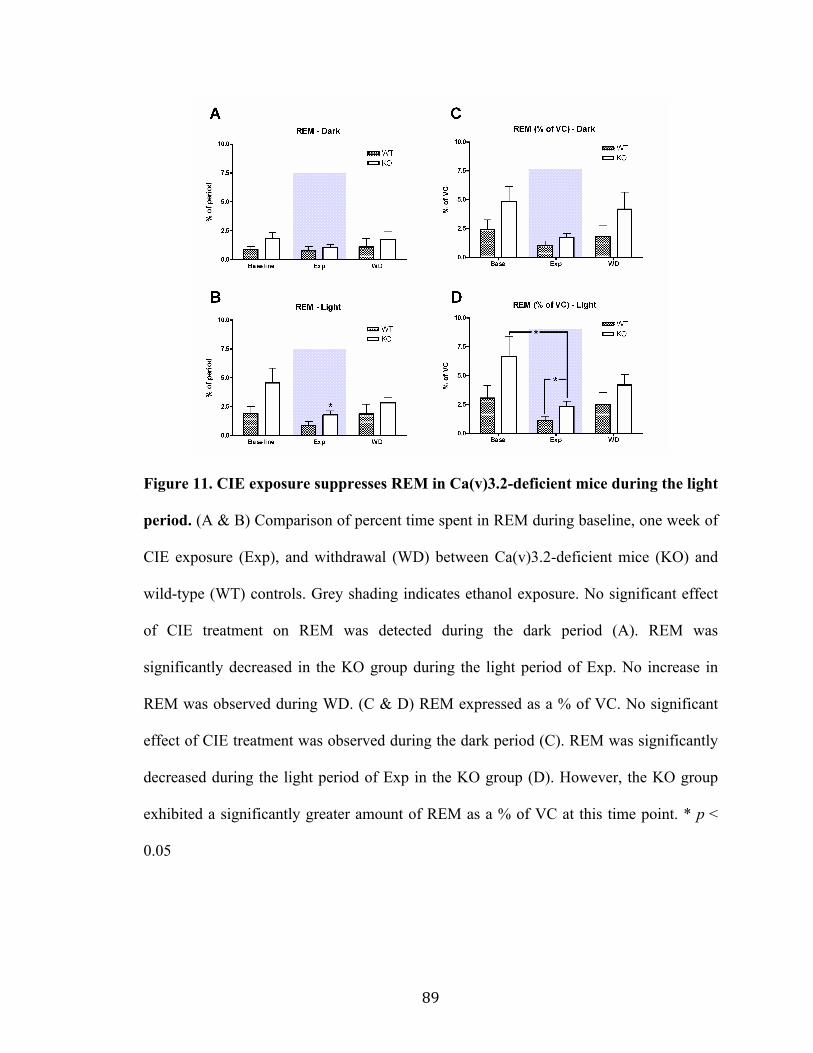
89
Figure 11. CIE exposure suppresses REM in Ca(v)3.2-deficient mice during the light
period. (A & B) Comparison of percent time spent in REM during baseline, one week of
CIE exposure (Exp), and withdrawal (WD) between Ca(v)3.2-deficient mice (KO) and
wild-type (WT) controls. Grey shading indicates ethanol exposure. No significant effect
of CIE treatment on REM was detected during the dark period (A). REM was
significantly decreased in the KO group during the light period of Exp. No increase in
REM was observed during WD. (C & D) REM expressed as a % of VC. No significant
effect of CIE treatment was observed during the dark period (C). REM was significantly
decreased during the light period of Exp in the KO group (D). However, the KO group
exhibited a significantly greater amount of REM as a % of VC at this time point. * p <
0.05
90
Figure 12. CIE effects on LDW for Experiment 2. Percent time spent in periods of
long-duration wakening during the dark (A) and light (B) periods of baseline, one week
of CIE exposure (Exp) and withdrawal (WD). LDW was significantly decreased in both
groups during the dark and light periods of Exp. LDW remained significantly decreased
during the dark period of WD in the KO group only. * p < 0.05
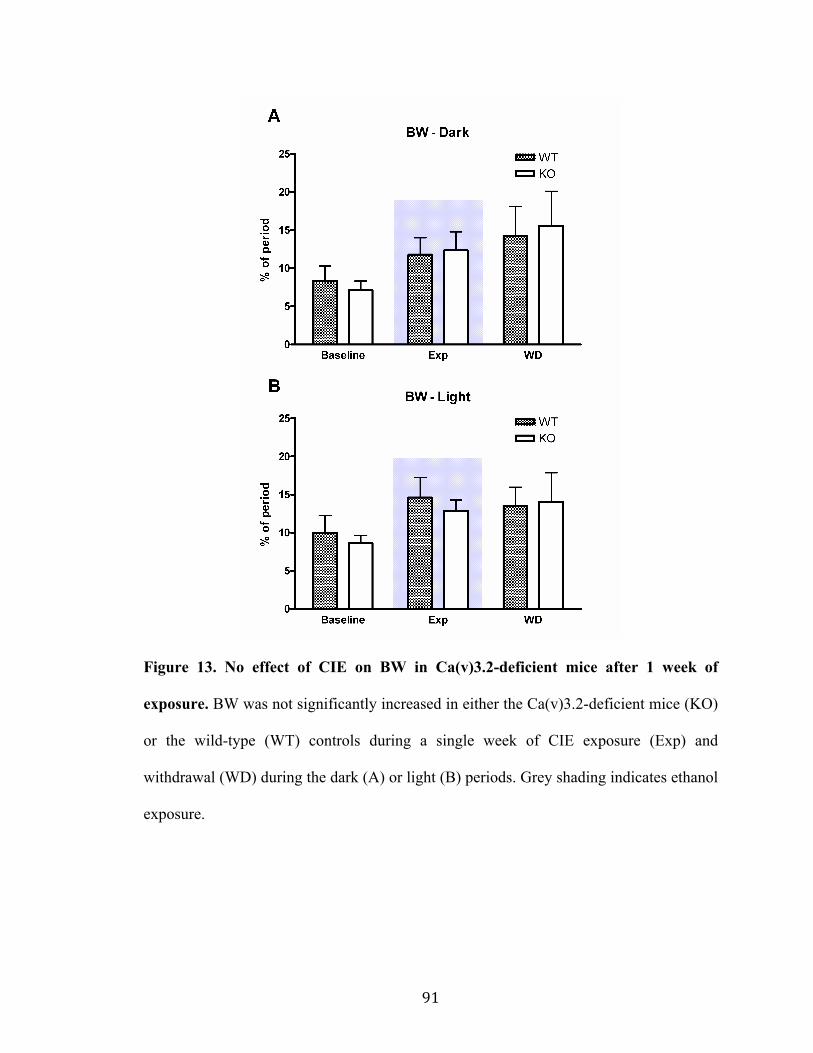
91
Figure 13. No effect of CIE on BW in Ca(v)3.2-deficient mice after 1 week of
exposure. BW was not significantly increased in either the Ca(v)3.2-deficient mice (KO)
or the wild-type (WT) controls during a single week of CIE exposure (Exp) and
withdrawal (WD) during the dark (A) or light (B) periods. Grey shading indicates ethanol
exposure.
92
Corresponding effects on sleep architecture were observed in the VC analysis,
summarized in Table IV. There were significant main effects of CIE treatment on percent
time in VC (Fig. 10C,D) during both the dark period (F2,30 = 9.48, p < 0.001) and the
light period (F2,30 = 5.00, p < 0.05). Percent time in VC was increased in both groups
during both the dark (p < 0.05 for both groups) and light periods (p < 0.05 for both). We
found a significant main effect of CIE treatment on percent of VC spent in REM during
the light period (F2,30 = 4.51, p < 0.05) with significant main effects of strain during both
the dark (F1,30 = 5.36, p < 0.05) and light periods (F1,30 = 6.44, p < 0.05). Post hoc tests
revealed decreased REM in the KO group (p < 0.05), but greater REM in the KO group
(p < 0.05, as compared to WT), during the light period of EtOH Exp (Fig. 11C,D).
NREM sleep remains increased in Ca(v)3.2-deficient mice during the withdrawal dark
period
Post hoc tests revealed the persistence of increased percent time spent in NREM during
the dark period of subacute withdrawal (WD) in the KO group (Fig. 10A, p < 0.05),
whereas the saline group returned to baseline (p > 0.05). This effect was also observed in
the percent time spent in VC during the dark period of WD (Fig. 10C; p < 0.05 for the
KO group, p > 0.05 for WT). No other significant effects were observed during WD.

93
Table IVa. Vigilance cycling analysis parameters for Experiment 2, dark period Parameter Baseline
Wild-type Ca(v)3.2 KO
EtOH Wk 1 Wild-type
Exposure Ca(v)3.2 KO
EtOH Wk 1 Wild-type
Withdrawal Ca(v)3.2 KO
Long duration wake # episodes: Avg dur: % time:
12.8 ± 2.6 2220 ± 1400 54.1 ± 20.9
16.0 ± 4.5 1840 ± 680 60.7 ± 3.2
11.6 ± 5.0 900 ± 280* 25.8 ± 14.0*
12.4 ± 1.5* 1010 ± 380* 29.3 ± 9.1*
18.3 ± 1.8 1050 ± 410 44.0 ± 18.7
14.2 ± 4.2 1340 ± 860 38.8 ± 19.0*
Vigilance cycling # episodes: Avg dur: % time:
10.9 ± 2.7 1920 ± 900 45.5 ± 20.9
12.4 ± 2.4 1380 ± 200 38.8 ± 3.1
10.1 ± 4.1 6480 ± 7950 73.8 ± 14.2*
10.7 ± 1.0 3620 ± 1600* 70.3 ± 9.2*
15.0 ± 1.3 1650 ± 550 55.2 ± 18.9
11.8 ± 3.5 2410 ± 1040* 60.7 ± 19.2*
NREM sleep Avg dur: % VC:
175 ± 87 78.6 ± 6.0
141 ± 36 77.7 ± 6.3
273 ± 160 82.5 ± 7.1
190 ± 50 81.1 ± 5.7
261 ± 217 76.7 ± 14.5
125 ± 41 72.8 ± 10.7
REM sleep Avg dur: % VC:
22.6 ± 8.3 2.4 ± 2.1
22.0 ± 9.3 4.8 ± 3.2
16.4 ± 4.6 1.0 ± 1.0
17.1 ± 5.1 1.7 ± 0.8
20.0 ± 7.9 2.1 ± 2.4
20.2 ± 6.9 4.2 ± 3.6
Brief wake Avg dur: % VC:
49.7 ± 10.1 19.0 ± 5.6
48.9 ± 13.1 17.5 ± 5.9
56.6 ± 15.2 16.5 ± 6.5
50.6 ± 11.0 17.2 ± 6.3
66.2 ± 11.4 21.2 ± 12.4
52.0 ± 11.3 23.0 ± 10.4
*p < 0.05 (significantly different from baseline for group) Table IVb. VC parameters for Experiment 2, light period
Parameter Baseline Wild-type
Ca(v)3.2 KO
EtOH Wk 1 Wild-type
Exposure Ca(v)3.2 KO
EtOH Wk 1 Wild-type
Withdrawal Ca(v)3.2 KO
Long duration wake # episodes: Avg dur: % time:
10.5 ± 1.8 1390 ± 480 32.7 ± 9.0
10.3 ± 2.7 1360 ± 360 31.3 ± 4.4
9.3 ± 4.9 890 ± 230* 19.3 ± 10.7*
9.9 ± 2.6 780 ± 240* 18.6 ± 6.8*
12.8 ± 3.2 990 ± 150* 28.4 ± 7.3
10.3 ± 2.0 1130 ± 420 27.9 ± 12.1
Vigilance cycling # episodes: Avg dur: % time:
9.2 ± 1.8 3350 ± 870 67.1 ± 9.1
9.1 ± 1.5 3280 ± 470 68.6 ± 4.3
8.1 ± 3.8 8570 ± 9840 80.3 ± 11.0*
8.6 ± 2.0 5060 ± 2980 81.2 ± 6.9*
10.1 ± 1.7 3170 ± 740 71.1 ± 7.4
9.2 ± 1.5 3510 ± 1370 71.9 ± 12.1
NREM sleep Avg dur: % VC:
241 ± 187 82.2 ± 7.8
150 ± 45 80.8 ± 5.2
293 ± 183 84.0 ± 6.6
192 ± 57 82.1 ± 2.9
247 ± 177 81.0 ± 10.2
128 ± 40 77.2 ± 9.4
REM sleep Avg dur: % VC:
22.6 ± 10.4 3.1 ± 2.7
23.3 ± 11.1 6.6 ± 4.4
16.4 ± 4.1 1.1 ± 1.0
16.8 ± 4.6 2.3 ± 1.1*†
19.9 ± 7.1 2.9 ± 2.6
20.2 ± 7.7 4.2 ± 2.2
Brief wake Avg dur: % VC:
44.2 ± 12.0 14.8 ± 7.8
40.1 ± 6.2 12.6 ± 3.8
52.2 ± 17.6 14.9 ± 5.8
47.9 ± 7.4 15.6 ± 3.3
53.6 ± 17.0 16.1 ± 8.0
42.1 ± 12.0 18.6 ± 9.3
*p < 0.05 (significantly different from baseline for group) †p < 0.05 (significantly different from wild-type in same treatment period)
94
Discussion
In the present study, we demonstrated a prominent sedating effect of chronic, intermittent
ethanol (CIE) administration in mice, as reflected by changes in sleep time, sleep
architecture, and behavioral/physiological diurnal rhythms. We observed that recovery
from these alterations in sleep homeostasis was gradual and, in some cases, incomplete
after withdrawal. Furthermore, we demonstrated differential effects of ethosuximide
treatment and genetic inhibition of Ca(v)3.2 expression on recovery from CIE exposure.
These results implicate a complex relationship between the effects of CIE treatment on T-
type calcium channels and sleep homeostasis.
Our analysis fills in two important gaps with respect to previous studies of sleep
in the CIE paradigm. The first is that we have been able to characterize sleep during the
administration process, which provides important information for interpreting changes in
sleep during withdrawal. A previous study found significant decreases in total sleep time
after 4 days of CIE administration when compared to a group of air-exposed controls;
however, the values in the treatment group were not significantly different from baseline
and sleep was not recorded during exposure (Veatch, 2006). Second, our analysis is the
first attempt to examine the effects of pharmacologic and genetic interventions in this
model of alcohol-related sleep disruption.
As shown in Figure 6, we observed a progressive increase in vigilance cycling
(VC) during the first week of CIE administration that was predominantly a result of
increased NREM sleep time. We did not observe any significant fragmentation of VC by
LDW as a result of chronic EtOH exposure, as was observed in a previous study in rats
that employed a chronic liquid-diet method of EtOH administration (Mukherjee &

95
Simasko, 2009). This could be attributed to important differences in administration
methods or species differences. In the CIE paradigm, consumption of EtOH is passive, as
it is vaporized and pumped into the chamber where the animals are housed. This resulted
in significant attenuation of daily activity revealed by cosinor rhythmometry. In the
forced drinking paradigm, however, consumption of EtOH is an active process that
requires the animal to be awake enough to drink from a bottle. Thus, the increase in
activity required to drink EtOH may be sufficient to fragment VC with episodes of LDW
and, thus, may mask the sedative effect.
In the present study, there was no evidence to suggest a development of tolerance
to the sedative effect of EtOH, despite previous reports of tolerance to other behavioral
effects of ethanol in the CIE paradigm (Becker & Baros, 2006). NREM sleep time during
the fourth week of CIE administration in Experiment 1 was not significantly different
from that observed in the first week. While this discrepancy is difficult to interpret, it
may imply that by bypassing active consumption, passive models of EtOH administration
lack the development of motivational processes in the brain to overcome the sedative
effects and provide sufficient alertness to drink. As an addendum to this interpretation, it
should be mentioned that the CIE model has been demonstrated to increase EtOH
preference in mice, suggesting the development of dependence in this treatment paradigm
(Becker & Lopez, 2004). Therefore, the likelihood is low that the absence of tolerance to
the sedative effects of EtOH is attributable to a lack of chemical dependence. A final
possibility is that absorption of inhaled EtOH in the lungs circumvents first-pass
metabolism by the liver, increasing the opportunity for absorption into other tissues, such
as the brain, prior to initial metabolism by alcohol dehydrogenase.
96
Another important effect of CIE exposure in Experiment 1 was the suppression of
REM sleep identified through the vigilance cycling analysis. REM sleep was significantly
suppressed during the fourth week of CIE exposure in the light period (a.k.a. the inactive
phase in rodents), when considered as a percentage of the average vigilance cycle. This
result is consistent with studies in other models of chronic alcohol exposure (Mendelson
et al., 1978; Kubota et al., 2002); however, this is the first report of this phenomenon in
the CIE paradigm. A sufficient amount of REM sleep is thought to play an important role
in the restorative aspect of sleep (Endo et al., 1998). In this context, despite increase
quantity of sleep during CIE exposure, the decreased quality of sleep could account for
the increased sleep pressure reflected in continued elevation of VC during the dark period
of sustained withdrawal in Experiment 1. Interestingly, mice did not demonstrate the
phenomenon of increased REM known as “REM rebound”, sometimes described in
humans following alcohol withdrawal (Gillin et al., 1994). However, this phenomenon is
inconsistent in human studies of alcohol withdrawal, raising the question of its
importance in the pathology of alcohol withdrawal-related insomnia (Brower, 2001).
Many of the sedative effects of CIE administration demonstrated partial reversion
towards baseline during the early withdrawal phase. By the WD Week, few effects
persisted. As mentioned above, there was a residual increase in VC during the dark
period of sustained withdrawal. However, the most prominent effect of successive
withdrawals was an increase in brief wake (BW) that persisted through sustained
withdrawal in the saline group. Interestingly, ETX administration appeared to partially
reverse this increase (Fig. 9C). An increase in BW during the light period, in the absence
of any significant increase in VC, implies that sleep is fragmented in the saline group

97
during sustained withdrawal as compared to baseline (Grandner, Hale, Moore, & Patel,
2010; Lo et al., 2004). A previous study in our lab identified increases in the delta and
theta power of NREM and REM sleep spectra of this same cohort of mice treated with
ETX (see Chapter 2). Taking these findings together, it appears that ETX may act to
increase the intensity of sleep, thus stabilizing sleep states after withdrawal from ethanol.
As was discussed at length in Chapter 2, ethosuximide has been shown to inhibit
T-type calcium current (Gomora et al., 2001; Huguenard, 1996; Todorovic & Lingle,
1998), though there is some debate as to the specificity of its action (Leresche et al.,
1998; Crunelli & Leresche, 2002). To more specifically investigate the role of T-type
calcium channels in alcohol-related sleep disruption, we compared the response of
Ca(v)3.2-deficient (KO) mice to the CIE paradigm to that of wild-type (WT) controls.
Our choice of strain was based upon previous findings in our lab implicating
hyperexcitability of Ca(v)3.2 channels in the midline thalamus after multiple withdrawals
from CIE (Graef et al., 2011). Initially, we observed significant suppression of REM
sleep in KO mice during the first week of exposure that was not seen in the WT mice of
either experiment at this time point. Furthermore, while KO mice experienced the
sedative effects of CIE exposure to a similar degree as WTs, they appeared to be slower
in recovering from these effects as demonstrated by a persistent increase in NREM sleep
and VC during the dark period of the early withdrawal phase. Multiple studies have
implicated increased sleep time and/or intensity during the dark period as an adaptive
response to alterations in normal sleep homeostasis during the light period (Leemburg et
al., 2010; Mukherjee & Simasko, 2009; Porkka-Heiskanen & Kalinchuk, 2011). Hence,
while the KO mice may be more susceptible to REM suppression during CIE exposure,

98
the increase in sleep during the early withdrawal phase may actually indicate improved
recovery of normal sleep homeostasis. Again, it should be noted that the KO mice did not
exhibit increased REM during WD or REM rebound.
The present study identifies several important differences between ETX treatment
and genetic inhibition of a specific T channel isoform, Ca(v)3.2: (1) Whereas, ETX did
not appear to have a significant effect on NREM sleep or VC, Ca(v)3.2 KO may alter
recovery during withdrawal; (2) Ca(v)3.2 KO may alter the REM response to EtOH
exposure; and (3) while ETX may reduce sleep fragmentation during sustained WD,
Ca(v)3.2 KO does not appear to have an effect on sleep fragmentation during exposure or
subacute WD. However, caution must be taken when interpreting these differential
effects for a number of reasons. First, the Ca(v)3.2-deficient mice were only subjected to
one week of CIE exposure and withdrawal and their genetic deficiency was present
throughout exposure; whereas, ETX-treated mice were subjected to four weeks of CIE
exposure and withdrawal and only received ETX during sustained WD. Second, ETX is a
blocker of all three T-type channel isoforms, and the contribution of these multiple
isoforms to normal sleep is not completely characterized. Third, genetically modified
mice are subject to developmental compensation, potentially affecting the other T
channel isoforms or other physiologic processes in the brain. Future studies should
examine the effects of temporally and/or regionally selective knock-down of Ca(v)3.2
specific to the forebrain in order to more precisely examine its role in WD. In our studies
of wild-type mice, Ca(v)3.2 was implicated in withdrawal-related effects. In addition,
acute administration of ethanol has recently been shown to selectively target the Ca(v)3.2
T channel isoform (Shan, Hammarback, & Godwin, unpublished results). Thus, acute

99
activation of Ca(v)3.2 may be a necessary condition for withdrawal-related effects, and
its absence during ethanol exposure may affect the state of the system after withdrawal.
Despite these concerns, both the group of mice receiving ETX during sustained
withdrawal and the Ca(v)3.2-deficient mice demonstrated signs of increased sleep
stability and/or intensity after withdrawal from CIE, potentially indicating increased
quality of sleep. These effects further highlight the primacy of T-type calcium channels in
sleep homeostasis. Future studies will be required to determine the potential of ETX as a
therapeutic agent and/or T-type calcium channels as a therapeutic target in this and other
models of chronic alcohol exposure.

100
References
Becker, H C. (1994). Positive relationship between the number of prior ethanol withdrawal episodes and the severity of subsequent withdrawal seizures. Psychopharmacology, 116(1), 26-32.
Becker, H C, & Hale, R. L. (1993). Repeated episodes of ethanol withdrawal potentiate the severity of subsequent withdrawal seizures: an animal model of alcohol withdrawal “kindling”. Alcoholism: Clinical & Experimental Research, 17(1), 94-8.
Becker, Howard C, & Baros, A. M. (2006). Effect of duration and pattern of chronic ethanol exposure on tolerance to the discriminative stimulus effects of ethanol in C57BL/6J mice. Journal of Pharmacology & Experimental Therapeutics, 319(2), 871-8. doi:10.1124/jpet.106.108795
Becker, Howard C., & Lopez, M. F. (2004). Increased Ethanol Drinking After Repeated Chronic Ethanol Exposure and Withdrawal Experience in C57BL/6 Mice. Alcoholism: Clinical & Experimental Research, 28(12), 1829-1838. doi:10.1097/01.ALC.0000149977.95306.3A
Brower, K J, Aldrich, M. S., & Hall, J. M. (1998). Polysomnographic and subjective sleep predictors of alcoholic relapse. Alcoholism: Clinical & Experimental Research, 22(8), 1864-71.
Brower, K.J. (2001). Alcohol’s effects on sleep in alcoholics. Alcohol Research & Health, 25(2), 110. NIH Public Access.
Brower, Kirk J, & Perron, B. E. (2010). Prevalence and correlates of withdrawal-related insomnia among adults with alcohol dependence: results from a national survey. American Journal on Addictions, 19(3), 238-44. doi:10.1111/j.1521-0391.2010.00035.x
Cohn, T. J., Foster, J. H., & Peters, T. J. (2003). Sequential studies of sleep disturbance and quality of life in abstaining alcoholics. Addiction Biology, 8(4), 455-62. doi:10.1080/13556210310001646439
Ehlers, C. L., & Slawecki, C. J. (2000). Effects of chronic ethanol exposure on sleep in rats. Alcohol, 20(2), 173-9.
Fadda, F., & Rossetti, Z. L. (1998). Chronic ethanol consumption: from neuroadaptation to neurodegeneration. Progress in Neurobiology, 56(4), 385-431.
Gillin, J. C., Smith, T. L., Irwin, M., Butters, N., Demodena, A., & Schuckit, M. (1994). Increased pressure for rapid eye movement sleep at time of hospital admission
101
predicts relapse in nondepressed patients with primary alcoholism at 3-month follow-up. Archives of General Psychiatry, 51(3), 189-97.
Goldstein, D. B. (1972). An animal model for testing effects of drugs on alcohol withdrawal reactions. Journal of Pharmacology & Experimental Therapeutics, 183(1), 14-22.
Gomora, J. C., Daud, A. N., Weiergräber, M., & Perez-Reyes, E. (2001). Block of cloned human T-type calcium channels by succinimide antiepileptic drugs. Molecular Pharmacology, 60(5), 1121-32.
Graef, J. D., Huitt, T. W., Nordskog, B. K., Hammarback, J. H., & Godwin, D. W. (2011). Disrupted thalamic T-type Ca2+ channel expression and function during ethanol exposure and withdrawal. Journal of Neurophysiology, 105(2), 528-40. doi:10.1152/jn.00424.2010
Grandner, M. A., Hale, L., Moore, M., & Patel, N. P. (2010). Mortality associated with short sleep duration: The evidence, the possible mechanisms, and the future. Sleep Medicine Reviews, 14(3), 191-203. Elsevier Ltd. doi:10.1016/j.smrv.2009.07.006
Huguenard, J. R. (1996). Low-threshold calcium currents in central nervous system neurons. Annual Review of Physiology, 58, 329-48. doi:10.1146/annurev.ph.58.030196.001553
Kubota, T., De, A., Brown, R. a, Simasko, S. M., & Krueger, J. M. (2002). Diurnal effects of acute and chronic administration of ethanol on sleep in rats. Alcoholism: Clinical & Experimental Research, 26(8), 1153-61. doi:10.1097/01.ALC.0000024292.05785.03
Leemburg, S., Vyazovskiy, V. V., Olcese, U., Bassetti, C. L., Tononi, G., & Cirelli, C. (2010). Sleep homeostasis in the rat is preserved during chronic sleep restriction. Proceedings of the National Academy of Sciences U S A, 107(36), 15939-44. doi:10.1073/pnas.1002570107
Llinás, R R, Ribary, U., Jeanmonod, D., Kronberg, E., & Mitra, P. P. (1999). Thalamocortical dysrhythmia: A neurological and neuropsychiatric syndrome characterized by magnetoencephalography. Proceedings of the National Academy of Sciences U S A, 96(26), 15222-7.
Llinás, Rodolfo R, & Steriade, M. (2006). Bursting of thalamic neurons and states of vigilance. Journal of Neurophysiology, 95(6), 3297-308. doi:10.1152/jn.00166.2006
Lo, C.-C., Chou, T., Penzel, T., Scammell, T. E., Strecker, R. E., Stanley, H. E., & Ivanov, P. C. (2004). Common scale-invariant patterns of sleep-wake transitions across mammalian species. Proceedings of the National Academy of Sciences U S A, 101(50), 17545-8. doi:10.1073/pnas.0408242101
102
Mukherjee, S., & Simasko, S. M. (2009). Chronic alcohol treatment in rats alters sleep by fragmenting periods of vigilance cycling in the light period with extended wakenings. Behavioural Brain Research, 198(1), 113-24. doi:10.1016/j.bbr.2008.10.026
Nelson, W., Tong, Y. L., Lee, J. K., & Halberg, F. (1979). Methods for cosinor-rhythmometry. Chronobiologia, 6(4), 305-23.
Overstreet, D. H., Knapp, D. J., & Breese, G. R. (2002). Accentuated decrease in social interaction in rats subjected to repeated ethanol withdrawals. Alcoholism: Clinical & Experimental Research, 26(8), 1259-68. doi:10.1097/01.ALC.0000023983.10615.D7
Porjesz, B., & Begleiter, H. (2003). Alcoholism and human electrophysiology. Alcohol Research & Health, 27(2), 153-60.
Porjesz, B., & Rangaswamy, M. (2007). Neurophysiological endophenotypes, CNS disinhibition, and risk for alcohol dependence and related disorders. Scientific World Journal, 7, 131-41. doi:10.1100/tsw.2007.203
Porkka-Heiskanen, T., & Kalinchuk, A. V. (2011). Adenosine, energy metabolism and sleep homeostasis. Sleep Medicine Reviews, 15(2), 123-35. doi:10.1016/j.smrv.2010.06.005
Rangaswamy, M., Porjesz, B., Chorlian, D. B., Choi, K., Jones, K. A., Wang, K., Rohrbaugh, J., et al. (2003). Theta power in the EEG of alcoholics. Alcoholism: Clinical & Experimental Research, 27(4), 607-15. doi:10.1097/01.ALC.0000060523.95470.8F
Sarnthein, J., & Jeanmonod, D. (2007). High thalamocortical theta coherence in patients with Parkinson’s disease. Journal of Neuroscience, 27(1), 124-31. doi:10.1523/JNEUROSCI.2411-06.2007
Sarnthein, J., & Jeanmonod, D. (2008). High thalamocortical theta coherence in patients with neurogenic pain. NeuroImage, 39(4), 1910-7. doi:10.1016/j.neuroimage.2007.10.019
Simasko, S. M., & Mukherjee, S. (2009). Novel analysis of sleep patterns in rats separates periods of vigilance cycling from long-duration wake events. Behavioural Brain Research, 196(2), 228-36. doi:10.1016/j.bbr.2008.09.003
Steriade, M. (2005). Sleep, epilepsy and thalamic reticular inhibitory neurons. Trends in Neurosciences, 28(6), 317-24. doi:10.1016/j.tins.2005.03.007
103
Todorovic, S. M., & Lingle, C. J. (1998). Pharmacological properties of T-type Ca2+ current in adult rat sensory neurons: effects of anticonvulsant and anesthetic agents. Journal of Neurophysiology, 79(1), 240-52.
Veatch, L M, & Gonzalez, L. P. (1996). Repeated ethanol withdrawal produces site-dependent increases in EEG spiking. Alcoholism: Clinical & Experimental Research, 20(2), 262-7.
Veatch, Lynn M. (2006). Disruptions in sleep time and sleep architecture in a mouse model of repeated ethanol withdrawal. Alcoholism: Clinical & Experimental Research, 30(7), 1214-22. doi:10.1111/j.1530-0277.2006.00134.x
Veatch, Lynn M, & Becker, H. C. (2002). Electrographic and behavioral indices of ethanol withdrawal sensitization. Brain Research, 946(2), 272-82.

104
CHAPTER 4
MECHANISMS OF SLEEP, SLEEP-RELATED OSCILLATIONS, AND ALCOHOL
WITHDRAWAL-RELATED INSOMNIA
105
Introduction
The oscillatory properties of the thalamus have been the subject of intense
research since the late 1930s, but the role of the thalamus in waking and sleeping
processes has long been regarded as a simple relay of sensory information to the primary
sensory cortices, active during waking and inactive during sleep. The active contribution
of the thalamus to sensory processing has been recently reviewed in great detail
(Sherman & Guillery, 2002). In this Chapter, we will focus on the mechanisms by which
the thalamus generates and maintains sleep-related oscillations in the brain and the
proposed functions of these oscillations in the maintenance of sleep. This discussion
carries significant implications for the results presented in Chapters 2 & 3.
To facilitate a discussion of the thalamocortical processes that act to maintain the
neurobehavioral coordination of sleep, we begin with a brief overview of the other
mechanisms in the central nervous system (CNS) which contribute to the generation and
maintenance of the sleep state in the brain, previously reviewed in great detail elsewhere
(España & Scammell, 2011; Pace-Schott & Hobson, 2002). Subsequently, we discuss the
identification of the various rhythms that characterize the electroencephalographic (EEG)
profile of the sleeping brain and the role the thalamus is believed to play in the generation
and maintenance of these rhythms. We then incorporate the effects of chronic alcohol
exposure and withdrawal on sleep and sleep-related oscillations, presented in Chapters 2
& 3. Finally, we conclude with a discussion of the potential mechanisms by which
ethosuximide appears to ameliorate these pathological alterations and the implications of
these results for future research into the mechanisms and treatment of alcohol
withdrawal-related insomnia (AWI).

106
The Neurobiology of Sleep
Generally speaking, there are several ongoing processes in the brain that regulate
sleep. These processes govern sleep-wake transitions, sleep timing, and sleep
homeostasis and have previously been reviewed in detail elsewhere (Pace-Schott &
Hobson, 2002). A schematic of the brain regions involved in these processes is presented
in Figure 1.
Throughout the day, exposure to natural light sets the phase of the central
circadian clock via signals transmitted from the retina to the suprachiasmatic nucleus
(SCN) of the hypothalamus. The period of this clock is set by the positive and negative
feedback cycles generated by the “clock” genes to be approximately 24 hours, controlling
the output of SCN neurons such that SCN firing peaks near the middle of the day
(Gillette & Tischkau, 1999). These neurons exert an inhibitory effect on the ventrolateral
preoptic (VLPO) nucleus of the anterior hypothalamus, which, in turn, exerts an
inhibitory effect on the wake-promoting aminergic nuclei of the brainstem, the locus
coeruleus and the dorsal raphe nucleus. Thus, when the output of the SCN decreases, the
VLPO is disinhibited and increases its input onto these nuclei. Furthermore, a subset of
neurons in the VLPO exerts an inhibitory effect on the histaminergic tuberomamillary
nucleus (TMN) of the posterior hypothalamus, which projects inhibitory feedback onto
the VLPO (Saper, Chou, & Scammell, 2001).

107
Figure 14. A schematic of the brain regions involved in the regulation of sleep-wake
cycles. Reproduced from Pace-Schott & Hobson (2002).

108
The anterior VLPO and the posterior TMN form the sleep- and wake-promoting
regions of the hypothalamus, respectively. Through mutual inhibition, this network
manifests a bistability that can transition the CNS into the sleeping or waking state,
depending on other homeostatic mechanisms. Adenosine is a proposed sleep-promoter
(or somnogen) that may act to tip this balance towards sleep in concert with the circadian
influences described above. Adenosine accumulated in the basal forebrain during
wakefulness is believed to inhibit GABAergic neurons in the basal forebrain that project
to the VLPO, thus, disinhibiting the VLPO (Strecker et al., 2000). This release of the
VLPO results in inhibition of the wake-promoting regions of the TMN and brainstem,
initiating NREM sleep.
The ultradian alternation of rapid eye movement (REM) and non-REM (NREM)
states during sleep is primarily controlled by interactions between the pontine cholinergic
and aminergic systems, as described by the reciprocal-interaction model (Hobson,
McCarley, & Wyzinski, 1975). According to this model, the REM-off cells of the pontine
aminergic system are tonically activated during waking, inhibiting the REM-on cells of
the pontine cholinergic system. The activity of the REM-off cells wanes during NREM
sleep, resulting in increased activity of the REM-on cells, eventually initiating a REM
cycle. During REM sleep, activation of cells in the mesopontine junction results in
activation of the brainstem reticular formation (BRF). As activity in the BRF builds, it
reactivates the REM-off cells, completing the cycle.
To this point, we have given an overview of the complex interactions in the
brainstem, hypothalamus, and basal forebrain that mediate sleep-wake transitions in the

109
CNS. These brain regions play an important role in the initiation of the NREM sleep,
which is then maintained by the coordinated activity of thalamocortical oscillations.
Thalamocortical Oscillations & the Maintenance of NREM Sleep
NREM sleep is partitioned into four stages of increasing depth of sleep, based on
EEG characteristics of cortical activity. The depth of sleep is defined by the transition
from the low amplitude, high frequency activity of the waking brain to the high
amplitude, low frequency (or slow wave) activity of the sleeping brain (see Pace-Schott
& Hobson, 2002, for review). Slow wave activity (SWA) predominates in Stages III and
IV of NREM, collectively referred to as slow wave sleep (SWS). Stage II NREM is
characterized by the appearance of three coordinated thalamocortical oscillations: the
slow (< 1 Hz) oscillation, the K-complex, and the sleep spindle. As the frequency of the
slow oscillation increases during sleep, the appearance of spindles and K-complexes
gradually transitions into delta waves (0.5-4 Hz).
The slow oscillation was initially described by Steriade and colleagues in a series
of three papers published in 1993 (Steriade et al., 1993; Steriade, Nuñez, & Amzica,
1993a, 1993b). It was initially identified in cortical pyramidal neurons of anesthetized
cats (Steriade et al., 1993; Steriade, Nuñez, & Amzica, 1993b) as a 0.2-0.9 Hz alternation
between states of membrane hyperpolarization with low action potential firing (called the
“down” state) and depolarization with high rates of action potential firing (called the “up”
state). The third paper (Steriade, Nuñez, & Amzica, 1993a) described similar oscillations
in thalamocortical relay neurons and neurons of the thalamic reticular nucleus (TRN) that
were temporally correlated with the oscillations in cortex. The authors of this initial series

110
found that sleep spindles were clustered in the up states while delta waves were clustered
in the down states. When the connections between the thalamus and cortex were severed,
the slow oscillation persisted in the cortex, leading the authors to hypothesize that the
slow oscillation was cortically generated (Steriade, Nuñez, & Amzica, 1993a). For over a
decade, this view was widely accepted (Amzica & Steriade, 2002; Yuste et al., 2005);
however, the role of the thalamus in the generation of the slow oscillation has recently
been reexamined.
In their recent comprehensive review of the literature, Crunelli and Hughes (2010)
present a compelling case for the central role of the thalamus in the generation of the
slow oscillation. The slow oscillation has been extensively studied in anesthetized
animals, but has also been identified and studied in the natural NREM sleep of both
animals and humans. Studies have shown that the K-complex of Stage II sleep represents
the transition from the down state to the up state and that spindles occur most frequently
during the early phase of the up state, often preceded by a K-complex (Amzica &
Steriade, 2002). The frequency of the slow oscillation increases as sleep deepens,
resulting in a transition from the predominance of sleep spindles and K-complexes in
Stage II to the delta waves of SWS (Crunelli & Hughes, 2010). This increase in
frequency is consistent with findings in the thalamus, where increasing frequency of slow
oscillations was observed with greater degrees of hyperpolarization (Blethyn et al., 2006;
Hughes et al., 2002; Zhu et al., 2006); whereas, a similar study in cortex found decreased
frequency of slow oscillations (Timofeev et al., 2000). Furthermore, T-type calcium
channel-mediated burst firing often precedes the up state by 20-50 ms (Contreras &
Steriade, 1995; Ushimaru, Ueta, & Kawaguchi, 2012) and such bursts from the thalamus
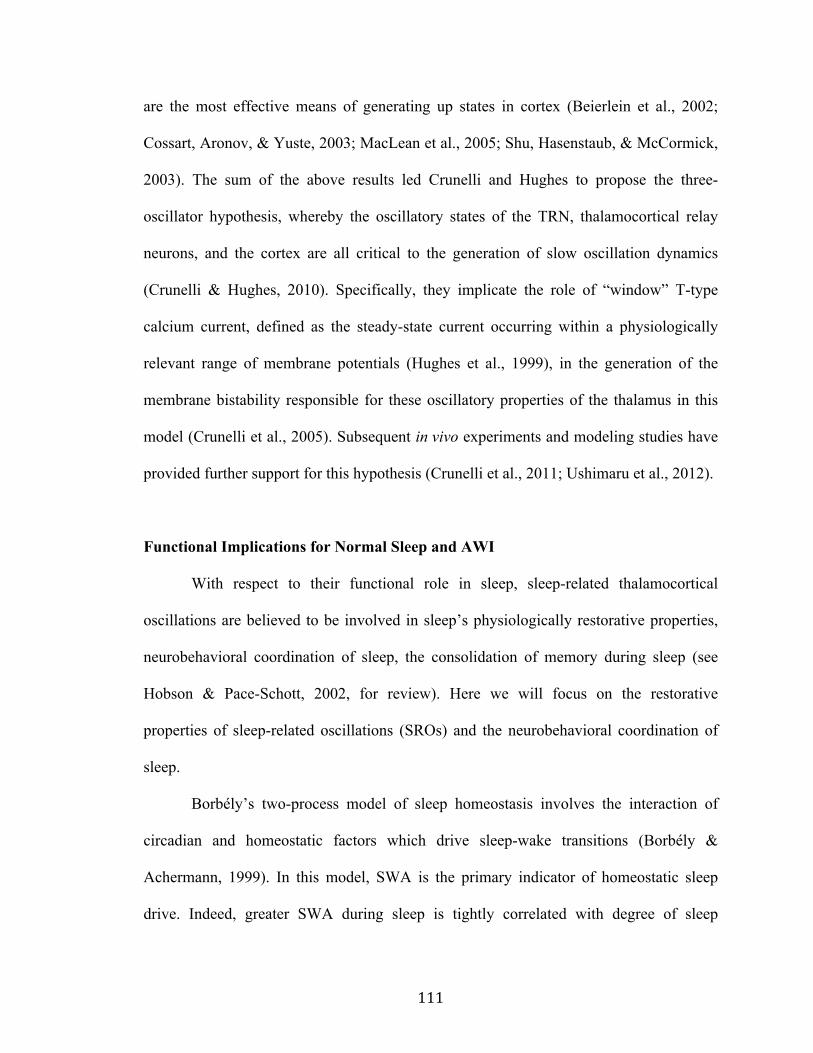
111
are the most effective means of generating up states in cortex (Beierlein et al., 2002;
Cossart, Aronov, & Yuste, 2003; MacLean et al., 2005; Shu, Hasenstaub, & McCormick,
2003). The sum of the above results led Crunelli and Hughes to propose the three-
oscillator hypothesis, whereby the oscillatory states of the TRN, thalamocortical relay
neurons, and the cortex are all critical to the generation of slow oscillation dynamics
(Crunelli & Hughes, 2010). Specifically, they implicate the role of “window” T-type
calcium current, defined as the steady-state current occurring within a physiologically
relevant range of membrane potentials (Hughes et al., 1999), in the generation of the
membrane bistability responsible for these oscillatory properties of the thalamus in this
model (Crunelli et al., 2005). Subsequent in vivo experiments and modeling studies have
provided further support for this hypothesis (Crunelli et al., 2011; Ushimaru et al., 2012).
Functional Implications for Normal Sleep and AWI
With respect to their functional role in sleep, sleep-related thalamocortical
oscillations are believed to be involved in sleep’s physiologically restorative properties,
neurobehavioral coordination of sleep, the consolidation of memory during sleep (see
Hobson & Pace-Schott, 2002, for review). Here we will focus on the restorative
properties of sleep-related oscillations (SROs) and the neurobehavioral coordination of
sleep.
Borbély’s two-process model of sleep homeostasis involves the interaction of
circadian and homeostatic factors which drive sleep-wake transitions (Borbély &
Achermann, 1999). In this model, SWA is the primary indicator of homeostatic sleep
drive. Indeed, greater SWA during sleep is tightly correlated with degree of sleep

112
deprivation (Borbély, 2001). This effect is particularly pronounced in the frontal cortex,
possibly indicating a greater need for restorative sleep in the areas controlling executive
function and working memory (Finelli, Borbély, & Achermann, 2001). The waking
correlate of SWA is theta (5-8 Hz) activity, which tends to rise with increasing time spent
awake (Aeschbach et al., 2001; Finelli et al., 2000).
In chronic primary insomnia, individuals demonstrate lower theta power during
waking hours (Wolynczyk-Gmaj & Szelenberger, 2011) and lower SWA during sleep
(Merica, Blois, & Gaillard, 1998), suggesting dysfunction in sleep homeostatic
mechanisms. In contrast, chronic alcoholics demonstrate increased theta power during
waking hours (Rangaswamy et al., 2003) and decreased SWA during sleep (Brower et al.,
2011), suggesting dysfunction in the generating mechanisms of SWA.
In Chapter 2, we presented results demonstrating alterations in the diurnal rhythm
of theta power with in mice undergoing withdrawal from chronic intermittent ethanol
(CIE) exposure. In the saline group, there was an elevation in the midline-estimating
statistic of rhythm (MESOR) and a decrease in the amplitude of the theta rhythm. This
decrease in the amount of variation in theta power, in combination with the increase in
MESOR, suggests that mice undergoing withdrawal may experience less restorative
sleep, thus, generating increased sleep pressure. However, in the group receiving
ethosuximide (ETX), these rhythms were restored to baseline. Furthermore, mice
receiving ETX demonstrated increased delta and theta power during NREM sleep than
saline-treated controls. Taken together, these results suggest that ETX acts to reverse
ethanol-mediated disruptions in sleep homeostatic mechanisms.

113
The other important mechanism of SROs is the neurobehavioral coordination of
sleep required for the maintenance of NREM. The K-complex, representing the down-up
state transition of the slow oscillation, has been implicated as a form of microarousal,
whereby the down state of the slow oscillation buffers the cortex from complete arousal
in response to sensory stimuli (Halász et al., 2004). Furthermore, sleep spindles may be
involved in blunting brain responses to external stimuli. A recent study compared EEG
and functional MRI (fMRI) responses to auditory stimuli between awake subjects and
subjects in NREM sleep (Dang-Vu et al., 2011). FMRI responses to stimuli presented
during sleep spindles were significantly blunted, consistent with previous studies of
evoked potentials (Cote, Epps, & Campbell, 2000; Elton et al., 1997). The authors
speculated that this was likely due to the nonlinear distortion of inputs (Sherman &
Guillery, 2002) to bursting thalamocortical neurons during spindles. Stimuli presented
outside of spindles often triggered a K-complex in the EEG with fMRI responses
demonstrating activity resembling that observed during spontaneous and induced slow
oscillations (Dang-Vu et al., 2008; Massimini et al., 2007). Given the role of
thalamocortical oscillatory mechanisms in the generation of cortical up states and sleep
spindles, it appears that both the down and up states of the slow oscillation are effectively
buffered by the oscillatory properties of the thalamus during NREM sleep.
In Chapter 3, we presented results demonstrating fragmentation of sleep by brief
wakening (BW) in mice undergoing withdrawal from CIE exposure. Given the lack of
any observable increase in REM sleep during withdrawal and the mechanisms that
maintain the ultradian alternation between NREM and REM once sleep has been
initiated, it seems that the most likely cause of fragmentation is a failure to maintain
114
NREM. Administration of ETX during withdrawal reduced this fragmentation of sleep
with BW to levels not significantly different from baseline. Taken together with the
results of Chapter 2, we surmise that ETX acts to decrease fragmentation of sleep by
stabilizing SROs during NREM.
Potential Mechanisms of ETX Action in AWI
In Chapter 2, we discussed the controversy surrounding the mechanism of action
of ETX in detail. We revisit this discussion here to incorporate the results of Chapters 2
& 3. The pharmacologic mechanism of ETX action in the brain has been the subject of
controversy over the last two decades (Huguenard, 2002). Early studies into its
mechanism revealed partial inhibition of T-type calcium current in thalamocortical relay
neurons (Coulter, Huguenard, & Prince, 1989a; Coulter, Huguenard, & Prince, 1989b). A
subsequent study in rat sensory neurons found that ETX preferentially inhibited low-
threshold T current over high-threshold L-type calcium current (Kostyuk et al., 1992).
Whereas, a later study failed to observe an effect of ETX on T current in cat and rat
thalamocortical neurons at similar concentrations; instead, implicating an effect on the
persistent sodium current (Leresche et al., 1998). More recent studies have identified
effects on calcium-dependent potassium currents (Crunelli & Leresche, 2002), G protein-
mediated inwardly-rectifying potassium currents (Kobayashi et al., 2009), and GABA
release probability at the synapse (Greenhill et al., 2012). However, it should be noted
that the concentration of ETX administered in the last three studies was significantly
higher than the therapeutically relevant range (Huguenard, 2002). Furthermore, recent

115
evidence confirmed partial blockade of the “window” T current (~ 30%) within this
relevant range (Gomora et al., 2001).
A previous study in our lab demonstrated a progressive depolarizing shift in the
inactivation of T current in midline thalamic neurons of mice undergoing multiple
withdrawals from CIE exposure (Graef et al., 2011). This shift resulted in a net increase
in the predicted “window” current of approximately 30% and was correlated with the
alterations in delta and theta power presented in Chapter 2, which were reversed by ETX.
We hypothesize that the increase in “window” current destabilizes SROs in the midline
thalamus and that the partial blockade of “window” current afforded by ETX stabilizes
these oscillations. To that effect, we carried out a computational study in a simple four-
cell model of thalamocortical spindles and delta waves (Destexhe et al., 1996). The half-
inactivation potential of the model T current was increased from -88 mV to -84 mV in
model thalamocortical neurons to simulate the observed effects of withdrawal from CIE
when the model was tuned to simulate sleep spindles (Figure 2) and delta waves (Figure
3).

116
Figure 15. Effects of depolarizing shift in half-inactivation of T-type calcium current
on a model of thalamocortical spindles. (A) 2-sec simulation demonstrating increased
frequency of bursts. (B) 60-sec simulation demonstrating decreased inter-spindle period
with increased “window” T current.
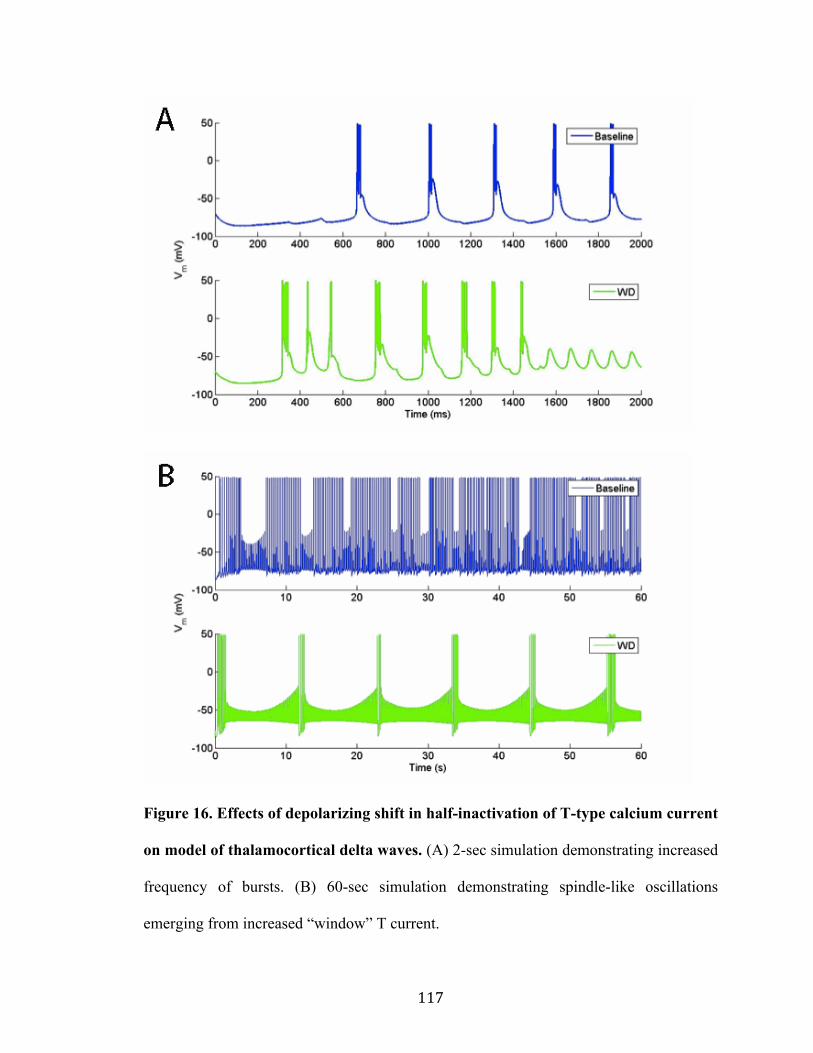
117
Figure 16. Effects of depolarizing shift in half-inactivation of T-type calcium current
on model of thalamocortical delta waves. (A) 2-sec simulation demonstrating increased
frequency of bursts. (B) 60-sec simulation demonstrating spindle-like oscillations
emerging from increased “window” T current.
118
In the simulation of thalamocortical spindle oscillations, there was a significant
increase in the frequency of bursts (Figure 2A), resulting in a decrease in the inter-spindle
period (Figure 2B). A similar increase in burst frequency was observed in the simulation
of thalamocortical delta waves (Figure 3A); however, this increase appeared to
destabilize the delta waves, resulting in a spindle-like oscillation (Figure 3B). The three-
oscillator hypothesis, described above, proposes that the transition in the slow oscillation
from lower frequencies in lighter stages of NREM sleep (where K-complexes and
spindles are the dominant features of the EEG) to deeper stages of NREM (where delta
waves are the dominant features) is driven by the intrinsic oscillatory properties of the
thalamus, particularly the “window” T current (Crunelli & Hughes, 2010). Taking this
view together with the results of our simulation, we hypothesize that excessive “window”
T current mediates the destabilization of delta waves observed in Chapter 2, which we
believe underlies the sleep disruptions observed in Chapter 3. Conveniently, the
estimated percentage increase in “window” current in this model of alcohol withdrawal is
precisely the percentage that ETX is believed to inhibit.
Conclusion: A Path to Translation
In this Chapter, we have presented a case for excessive T-type calcium current as
a novel therapeutic target in AWI. Furthermore, we demonstrated the efficacy of ETX, an
FDA-approved antiepileptic drug with a minimal side-effect profile, in reversing
withdrawal-mediated alterations in SROs and fragmentation of sleep. For these results to
be translated to clinical studies, important steps need to be taken to replicate these results
and ensure their validity.

119
First, the results demonstrating the ETX-mediated decrease in sleep fragmentation
during withdrawal should be replicated in other models of alcohol withdrawal. The CIE
vapor administration paradigm effectively models both alcohol dependence (Becker &
Lopez, 2004) and the kindling-like effects of multiple withdrawals from ethanol (Becker,
1994). This paradigm also provides an excellent means of controlling for blood-ethanol
concentration (BEC) in mice and rats, ensuring consistency and replicability of results.
However, the passive nature of ethanol consumption fails to capture some of the
behavioral aspects of chronic alcohol abuse. This, in turn, may have significant effects on
the sleep behavior of animals during chronic ethanol consumption, as they are not
required to awaken and actively seek out a source of ethanol to maintain a desired BEC.
Thus, subsequent research should seek to replicate the study presented in Chapter 3 in
active models of chronic alcohol consumption. As sleep fragmentation has also been
demonstrated in rats to whom alcohol was chronically administered in their diet
(Mukherjee & Simasko, 2009), this would seem a logical place to start.
Second, it will likely be necessary to replicate these results in higher organisms,
such as nonhuman primates. While humans and rodents share common features within a
sleep cycle (Lo et al., 2004), rodents are inherently polyphasic sleepers. As such, it is
possible that polyphasic sleep may mask some features of AWI that are inconsistent
between rodents and humans. Though nonhuman primates do sleep more than humans
throughout the day, the increased degree of evolutionary homology may provide a more
accurate assessment of the therapeutic potential of ETX in human AWI.
Finally, while our arguments presented in this Chapter are logically sound and
well founded in the literature, there are gaps in experimental data that will need to be
120
filled in order to support our view that ETX stabilizes NREM sleep through inhibition of
excess “window” T current. Subsequent research should focus on the use of intracellular
and extracellular recordings in vivo to solidify this view in the following areas: (1)
clarification of the effect of increased “window” T current on the oscillatory properties of
thalamocortical neurons, (2) examination of effects of ethanol on T-type calcium channel
function in the TRN, and (3) verification of ETX-mediated stabilization of
thalamocortical oscillations after withdrawal from ethanol.
121
References
Aeschbach, D., Postolache, T. T., Sher, L., Matthews, J. R., Jackson, M. A., & Wehr, T. A. (2001). Evidence from the waking electroencephalogram that short sleepers live under higher homeostatic sleep pressure than long sleepers. Neuroscience, 102(3), 493-502.
Amzica, Florin, & Steriade, M. (2002). The functional significance of K-complexes. Sleep Medicine Reviews, 6(2), 139-49.
Becker, H C. (1994). Positive relationship between the number of prior ethanol withdrawal episodes and the severity of subsequent withdrawal seizures. Psychopharmacology, 116(1), 26-32.
Becker, Howard C., & Lopez, M. F. (2004). Increased Ethanol Drinking After Repeated Chronic Ethanol Exposure and Withdrawal Experience in C57BL/6 Mice. Alcoholism: Clinical & Experimental Research, 28(12), 1829-1838. doi:10.1097/01.ALC.0000149977.95306.3A
Beierlein, M., Fall, C. P., Rinzel, J., & Yuste, R. (2002). Thalamocortical bursts trigger recurrent activity in neocortical networks: layer 4 as a frequency-dependent gate. Journal of Neuroscience, 22(22), 9885-94.
Blethyn, Kate L, Hughes, S. W., Tóth, T. I., Cope, D. W., & Crunelli, V. (2006). Neuronal basis of the slow (<1 Hz) oscillation in neurons of the nucleus reticularis thalami in vitro. The Journal of neuroscience : the official journal of the Society for Neuroscience, 26(9), 2474-86. doi:10.1523/JNEUROSCI.3607-05.2006
Borbély, A. A. (2001). From slow waves to sleep homeostasis: new perspectives. Archives Italiennes de Biologie, 139(1-2), 53-61.
Borbély, A. A., & Achermann, P. (1999). Sleep homeostasis and models of sleep regulation. Journal of Biological Rhythms, 14(6), 557-68.
Brower, K. J., Hoffmann, R., Conroy, D. A., Arnedt, J. T., & Armitage, R. (2011). Sleep homeostasis in alcohol-dependent, depressed and healthy control men. European Archives of Psychiatry & Clinical Neuroscience, 261(8), 559-66. doi:10.1007/s00406-011-0195-5
Contreras, D., & Steriade, M. (1995). Cellular basis of EEG slow rhythms: a study of dynamic corticothalamic relationships. Journal of Neuroscience, 15(1 Pt 2), 604-22.
Cossart, R., Aronov, D., & Yuste, R. (2003). Attractor dynamics of network UP states in the neocortex. Nature, 423(6937), 283-8. doi:10.1038/nature01614
122
Cote, K. A., Epps, T. M., & Campbell, K. B. (2000). The role of the spindle in human information processing of high-intensity stimuli during sleep. Journal of Sleep Research, 9(1), 19-26.
Coulter, D. A., Huguenard, J. R., & Prince, D. A. (1989). Characterization of ethosuximide reduction of low-threshold calcium current in thalamic neurons. Annals of Neurology, 25(6), 582-93. doi:10.1002/ana.410250610
Coulter, D., Huguenard, J., & Prince, D. (1989). Specific petit mal anticonvulsants reduce calcium currents in thalamic neurons. Neuroscience Letters, 98, 74-78.
Crunelli, Vincenzo, & Hughes, S. W. (2010). The slow (<1 Hz) rhythm of non-REM sleep: a dialogue between three cardinal oscillators. Nature Neuroscience, 13(1), 9-17. Nature Publishing Group. doi:10.1038/nn.2445
Crunelli, Vincenzo, & Leresche, N. (2002). Block of Thalamic T-Type Ca(2+) Channels by Ethosuximide Is Not the Whole Story. Epilepsy Currents, 2(2), 53-56. doi:10.1046/j.1535-7597.2002.00024.x
Crunelli, Vincenzo, Errington, A. C., Hughes, S. W., & Tóth, T. I. (2011). The thalamic low-threshold Ca2+ potential: a key determinant of the local and global dynamics of the slow (<1 Hz) sleep oscillation in thalamocortical networks. Philosophical Transactions of the Royal Society of London, Series A, Mathematical, Physical, and Engineering Sciences, 369(1952), 3820-39. doi:10.1098/rsta.2011.0126
Crunelli, Vincenzo, Tóth, T. I., Cope, D. W., Blethyn, K., & Hughes, S. W. (2005). The “window” T-type calcium current in brain dynamics of different behavioural states. Journal of Physiology, 562(Pt 1), 121-9. doi:10.1113/jphysiol.2004.076273
Dang-Vu, T.T., Bonjean, M., Schabus, M., Boly, M., Darsaud, A., Desseilles, M., Degueldre, C., et al. (2011). Interplay between spontaneous and induced brain activity during human non-rapid eye movement sleep. Proceedings of the National Academy of Sciences U S A, 108(37), 15438–15443. National Acad Sciences. doi:10.1073/pnas.1112503108/-/DCSupplemental.www.pnas.org/cgi/doi/10.1073/pnas.1112503108
Dang-Vu, Thien Thanh, Schabus, M., Desseilles, M., Albouy, G., Boly, M., Darsaud, A., Gais, S., et al. (2008). Spontaneous neural activity during human slow wave sleep. Proceedings of the National Academy of Sciences of the United States of America, 105(39), 15160-5. doi:10.1073/pnas.0801819105
Destexhe, A., Bal, T., McCormick, D. A., & Sejnowski, T. J. (1996). Ionic mechanisms underlying synchronized oscillations and propagating waves in a model of ferret thalamic slices. Journal of Neurophysiology, 76(3), 2049-70.

123
Elton, M., Winter, O., Heslenfeld, D., Loewy, D., Campbell, K., & Kok, A. (1997). Event-related potentials to tones in the absence and presence of sleep spindles. Journal of Sleep Research, 6(2), 78-83.
España, R. A., & Scammell, T. E. (2011). Sleep neurobiology from a clinical perspective. Sleep, 34(7), 845-58. doi:10.5665/SLEEP.1112
Finelli, L. A., Baumann, H., Borbély, A. A., & Achermann, P. (2000). Dual electroencephalogram markers of human sleep homeostasis: correlation between theta activity in waking and slow-wave activity in sleep. Neuroscience, 101(3), 523-9.
Finelli, L. A., Borbély, A. A., & Achermann, P. (2001). Functional topography of the human nonREM sleep electroencephalogram. European Journal of Neuroscience, 13(12), 2282-90.
Gillette, M. U., & Tischkau, S. A. (1999). Suprachiasmatic nucleus: the brain’s circadian clock. Recent Progress in Hormone Research, 54, 33-58.
Gomora, J. C., Daud, A. N., Weiergräber, M., & Perez-Reyes, E. (2001). Block of cloned human T-type calcium channels by succinimide antiepileptic drugs. Molecular Pharmacology, 60(5), 1121-32.
Graef, J. D., Huitt, T. W., Nordskog, B. K., Hammarback, J. H., & Godwin, D. W. (2011). Disrupted thalamic T-type Ca2+ channel expression and function during ethanol exposure and withdrawal. Journal of Neurophysiology, 105(2), 528-40. doi:10.1152/jn.00424.2010
Greenhill, S. D., Morgan, N. H., Massey, P. V., Woodhall, G. L., & Jones, R. S. G. (2012). Ethosuximide modifies network excitability in the rat entorhinal cortex via an increase in GABA release. Neuropharmacology, 62(2), 807-14. Elsevier Ltd. doi:10.1016/j.neuropharm.2011.09.006
Halász, P., Terzano, M., Parrino, L., & Bódizs, R. (2004). The nature of arousal in sleep. Journal of Sleep Research, 13(1), 1-23.
Hobson, J A, McCarley, R. W., & Wyzinski, P. W. (1975). Sleep cycle oscillation: reciprocal discharge by two brainstem neuronal groups. Science, 189(4196), 55-8.
Hobson, J Allan, & Pace-Schott, E. F. (2002). The cognitive neuroscience of sleep: neuronal systems, consciousness and learning. Nature Reviews Neuroscience, 3(9), 679-93. doi:10.1038/nrn915
Hughes, S W, Cope, D. W., Tóth, T. I., Williams, S. R., & Crunelli, V. (1999). All thalamocortical neurones possess a T-type Ca2+ “window” current that enables the
124
expression of bistability-mediated activities. Journal of Physiology, 517 (Pt 3), 805-15.
Hughes, Stuart W, Cope, D. W., Blethyn, K. L., & Crunelli, V. (2002). Cellular mechanisms of the slow (<1 Hz) oscillation in thalamocortical neurons in vitro. Neuron, 33(6), 947-58.
Huguenard, J. (2002). Block of T-type Ca2+ channels is an important action of succinimide antiabsence drugs. Epilepsy Currents, 2(2), 49-52.
Kobayashi, T., Hirai, H., Iino, M., Fuse, I., Mitsumura, K., Washiyama, K., Kasai, S., et al. (2009). Inhibitory effects of the antiepileptic drug ethosuximide on G protein-activated inwardly rectifying K+ channels. Neuropharmacology, 56(2), 499-506. doi:10.1016/j.neuropharm.2008.10.003
Kostyuk, P., Molokanova, E., Pronchuk, N., Savchenko, A., & Verkhratsky, A. (1992). Different action of ethosuximide on low-and high-threshold calcium currents in rat sensory neurons. Neuroscience, 51(4), 755-758.
Leresche, N, Parri, H. R., Erdemli, G., Guyon, A., Turner, J. P., Williams, S. R., Asprodini, E., et al. (1998). On the action of the anti-absence drug ethosuximide in the rat and cat thalamus. Journal of Neuroscience, 18(13), 4842-53.
Lo, C.-C., Chou, T., Penzel, T., Scammell, T. E., Strecker, R. E., Stanley, H. E., & Ivanov, P. C. (2004). Common scale-invariant patterns of sleep-wake transitions across mammalian species. Proceedings of the National Academy of Sciences U S A, 101(50), 17545-8. doi:10.1073/pnas.0408242101
MacLean, J. N., Watson, B. O., Aaron, G. B., & Yuste, R. (2005). Internal dynamics determine the cortical response to thalamic stimulation. Neuron, 48(5), 811-23. doi:10.1016/j.neuron.2005.09.035
Massimini, M., Ferrarelli, F., Esser, S. K., Riedner, B. A., Huber, R., Murphy, M., Peterson, M. J., et al. (2007). Triggering sleep slow waves by transcranial magnetic stimulation. Proceedings of the National Academy of Sciences U S A, 104(20), 8496-501. doi:10.1073/pnas.0702495104
Merica, H., Blois, R., & Gaillard, J. M. (1998). Spectral characteristics of sleep EEG in chronic insomnia. European Journal of Neuroscience, 10(5), 1826-34.
Mukherjee, S., & Simasko, S. M. (2009). Chronic alcohol treatment in rats alters sleep by fragmenting periods of vigilance cycling in the light period with extended wakenings. Behavioural Brain Research, 198(1), 113-24. doi:10.1016/j.bbr.2008.10.026
125
Pace-Schott, E. F., & Hobson, J. A. (2002). The neurobiology of sleep: genetics, cellular physiology and subcortical networks. Nature Reviews Neuroscience, 3(8), 591-605. doi:10.1038/nrn895
Rangaswamy, M., Porjesz, B., Chorlian, D. B., Choi, K., Jones, K. A., Wang, K., Rohrbaugh, J., et al. (2003). Theta power in the EEG of alcoholics. Alcoholism: Clinical & Experimental Research, 27(4), 607-15. doi:10.1097/01.ALC.0000060523.95470.8F
Saper, C. B., Chou, T. C., & Scammell, T. E. (2001). The sleep switch: hypothalamic control of sleep and wakefulness. Trends in Neurosciences, 24(12), 726-31.
Sherman, S. M., & Guillery, R. W. (2002). The role of the thalamus in the flow of information to the cortex. Philosophical Transactions of the Royal Society of London, Series B, Biological Sciences, 357(1428), 1695-708. doi:10.1098/rstb.2002.1161
Shu, Y., Hasenstaub, A., & McCormick, D. A. (2003). Turning on and off recurrent balanced cortical activity. Nature, 423(6937), 288-93. doi:10.1038/nature01616
Steriade, M, Contreras, D., Curró Dossi, R., & Nuñez, A. (1993). The slow (< 1 Hz) oscillation in reticular thalamic and thalamocortical neurons: scenario of sleep rhythm generation in interacting thalamic and neocortical networks. Journal of Neuroscience, 13(8), 3284-99.
Steriade, M, Nuñez, A., & Amzica, F. (1993a). Intracellular analysis of relations between the slow (< 1 Hz) neocortical oscillation and other sleep rhythms of the electroencephalogram. Journal of Neuroscience, 13(8), 3266-83.
Steriade, M, Nuñez, A., & Amzica, F. (1993b). A novel slow (< 1 Hz) oscillation of neocortical neurons in vivo: depolarizing and hyperpolarizing components. Journal of Neuroscience, 13(8), 3252-65.
Strecker, R E, Morairty, S., Thakkar, M. M., Porkka-Heiskanen, T., Basheer, R., Dauphin, L. J., Rainnie, D. G., et al. (2000). Adenosinergic modulation of basal forebrain and preoptic/anterior hypothalamic neuronal activity in the control of behavioral state. Behavioural Brain Research, 115(2), 183-204.
Timofeev, I., Grenier, F., Bazhenov, M., Sejnowski, T. J., & Steriade, M. (2000). Origin of slow cortical oscillations in deafferented cortical slabs. Cerebral Cortex, 10(12), 1185-99.
Ushimaru, M., Ueta, Y., & Kawaguchi, Y. (2012). Differentiated participation of thalamocortical subnetworks in slow/spindle waves and desynchronization. Journal of Neuroscience, 32(5), 1730-1746. doi:10.1523/JNEUROSCI.4883-11.2012
126
Wolynczyk-Gmaj, D., & Szelenberger, W. (2011). Waking EEG in primary insomnia. Acta Neurobiologiae Experimentalis, 71(3), 387-92.
Yuste, R., MacLean, J. N., Smith, J., & Lansner, A. (2005). The cortex as a central pattern generator. Nature Reviews Neuroscience, 6(6), 477-83. doi:10.1038/nrn1686
Zhu, L., Blethyn, K. L., Cope, D. W., Tsomaia, V., Crunelli, V., & Hughes, S. W. (2006). Nucleus- and species-specific properties of the slow (<1 Hz) sleep oscillation in thalamocortical neurons. Neuroscience, 141(2), 621-36. doi:10.1016/j.neuroscience.2006.04.069

127
CURRICULUM VITAE
Walter F. Wiggins Education
• Wake Forest University; Winston-Salem, NC PhD in Neuroscience, May 2012 Advisor: Dwayne W. Godwin, PhD Graduate GPA: 4.0 out of 4.0 MD, expected May 2014 Preclinical (MS1-2) Class Rank: 17 out of 119 USMLE Step 1: 247/99
• Davidson College; Davidson, NC BS in Mathematics, Cum Laude, Minor in Chemistry, May 2007
Honors/Awards/Fellowships
• Ruth L. Kirschstein National Research Service Award for Predoctoral MD/PhD Students (F30) Funding Agency: NIAAA/NIH Project Title: The effect of alcohol withdrawal on molecular and behavioral circadian rhythms Dates: September 2010 – present
• NIH Intramural Fellowship, Medical Student Research Program Funding Source: WFUSM Dept. of Surgery Dates: June 2008 – August 2008 Faculty Sponsor: Dwayne Godwin, PhD, Dept. of Neurobiology & Anatomy Amount: $4000
Memberships
• American College of Surgeons (Student Member) • American Medical Association – Student Section • North Carolina Medical Society – Student Section • Society for Neuroscience • Western North Carolina Chapter of the Society for Neuroscience
Current Positions
• Longitudinal Editor, USMLERx Step 1 Qmax MedIQ Learning, LLC; Elizabethtown, KY Dates: November 2011 – present
• Contributing Editor, USMLERx/First Aid Web Team MedIQ Learning, LLC; Elizabethtown, KY Dates: November 2011 – present

128
Original Journal Articles 1. Wiggins WF, Huitt TW, Graef JD, Godwin DW. Differential effects of
ethosuximide treatment and genetic suppression of a T-type Ca2+ channel subtype on altered sleep homeostasis in response to chronic intermittent ethanol. In preparation.
2. Plate JF, Wiggins WF, Haubruck P, Scott AT, Tuohy CJ, Saul KR, Stitzel JD, Mannava S. Aging influences the in vivo biomechanical properties of the rat gastrocnemius-achilles muscle-tendon unit. Submitted.
3. Wiggins WF, Graef JD, Huitt TW, Godwin DW. Ethosuximide reduces alcohol withdrawal-mediated disruptions in sleep-related EEG patterns. Submitted.
4. Haubruck P, Mannava S, Plate JF, Callahan MF, Saul KR, Wiggins WF, Schmidmaier G, Tuohy CJ, Smith TL. Botulinum neurotoxin A injections influence neural mechanisms during stretching of the gastrocnemius muscle-tendon unit. Submitted.
5. Mannava S, Wiggins WF, Saul KR, Stitzel JD, Smith BP, Koman LA, Smith TL, Tuohy CJ (2011). Contributions of neural tone to in vivo passive muscle-tendon unit biomechanical properties in a rat rotator cuff animal model. Ann Biomed Eng. 39(7):1914-24.
6. Mannava S, Callahan MF, Trach SM, Wiggins WF, Smith BP, Koman LA, Smith TL, Tuohy CJ (2011). Chemical denervation with Botulinum neurotoxin A improves the surgical manipulation of the muscle-tendon unit: an experimental study in an animal model. J Hand Surg Am. 36(2):222-31.
7. Graef JD, Nordskog BK, Wiggins WF, Godwin DW (2009). An acquired channelopathy involving thalamic T-type Ca2+ channels following status epilepticus. J Neurosci. 29(14):4430-41.
Book Chapters
1. Godwin DW, Wiggins WF, Hayasaka S, Laurienti PJ, Stapleton JR (2011). Overcoming obstacles to creativity in geographically-fragmented environments: lessons from small world networks. In L. Book & D. Phillips (Eds.) Creativity and Entrepreneurship: Changing Currents in Education and Public Life. Edward Elgar Press. Forthcoming.
2. Wiggins WF & Paluzzi J (2011). Endocrine. In T. Le et al. (Eds.), First Aid for the Basic Sciences: Organ Systems, 2nd Ed., New York: McGraw Hill Medical.
Presentations
1. Wiggins WF, Klorig DC, Godwin DW. A biophysically-plausible model of ChR2 implemented in the NEURON simulation environment. WNCSfN Annual Research Day, 2011. Poster.
2. Smith TL, Haubruck P, Saul KR, Wiggins WF, Stitzel JD, Smith BP, Tuohy CJ, Mannava S. In vivo biomechanics of neural mechanisms influencing stretching of the muscle-tendon unit. Biomedical Engineering Society Annual Conference, 2011. Symposium.
3. Wiggins WF, Huitt TW, Graef JD, Godwin DW. The effect of T-type calcium channel inhibition on ethanol withdrawal-related sleep disruption. WNCSfN Annual Research Day, 2010. Poster.
129
4. Mannava S, Wiggins WF*, Callahan MF, Smith TL, Koman LA, Tuohy CJ. Innovations in tendon surgery: the neural contribution to surgical manipulation fo the muscle-tendon unit. North Carolina Orthopaedic Association Annual Meeting, 2010. Symposium. *Presenting author
5. “Neurodynamics: Chaos in the Brain” Date: October 15, 2009 Location: Davidson College Brief Description: An hour-long lecture presented to the Mathematics Department about the use of chaos theory and tools from dynamical systems in the study of neural networks, highlighting examples from my graduate research.
6. Godwin DW, Wiggins WF, Hayasaka S, Laurienti P, Stapleton-Kotloski JR. Overcoming creative obstacles in geographically-fragmented environments: lessons from small world networks. WFU 1st Annual Creativity Symposium, 2009. Minisymposium.
7. Wiggins WF, O’Donovan CA, Wilson TW, Godwin DW. Imaging Childhood Absence Epilepsy with Magnetoencephalography. WFUSM Medical Student Research Day, 2008.
8. “Medical School Life” Date: February 12, 2008 Location: Davidson College Brief Description: Panel discussion of medical school life with 3 other WFUSM medical students who are also Davidson alumni.
Abstracts
1. Plate JF, Haubruck P, Wiggins WF, Li Z, Stitzel JD, Smith TL, Tuohy CJ, Mannava S. Age-related changes influence the in vivo biomechanical properties of the rat gastrocnemius-achilles muscle-tendon unit. Orthopaedic Research Society Annual Meeting, 2012.
2. Mannava S, Wiggins WF, Callahan MF, Stitzel J, Koman LA, Tuohy CJ, Smith TL. Neurological influences and modulation of skeletal muscle tone. Society for Neuroscience Annual Meeting, 2010.
3. Mannava S, Wiggins WF, Stitzel J, Callahan MF, Smith TL, Koman LA, Tuohy CJ. Contributions of neural tone to muscle-tendon unit stress-relaxation properties. Biomedical Engineering Society Annual Conference, 2010.
4. Mannava S, Wiggins WF, Tuohy CJ, Koman LA, Poehling GG, Smith TL. Insights from a Simple Spring: Reconsidering Rotator Cuff Surgery. Eastern Orthopaedic Association Annual Meeting, 2010.
5. Huitt TW, Stapleton-Kotloski JR, O’Donovan CA, Wiggins WF, Wilson TW, Godwin DW. Imaging childhood absence epilespy with magnetoencephalography. Society for Neuroscience Annual Meeting, 2008.
6. Stapleton-Kotloski JR, Huitt TW, O’Donovan CA, Wiggins WF, Wilson TW, Godwin DW. Imaging childhood absence epilespy with magnetoencephalography. American Epilepsy Society Annual Meeting, 2008.

130
Activities • Student Representative, Neuroscience Program Recruitment Committee
Wake Forest University Graduate School of Arts & Sciences Dates: January 2011 – March 2012
• Web Communications Chair, Brain Awareness Council Executive Committee Wake Forest University Graduate School of Arts & Sciences Dates: January 2009 – present
• President, MD/PhD Student Association Wake Forest University School of Medicine Dates: June 2010 – June 2011
• Team Retention Chair, Winston-Salem Relay for Life American Cancer Society – Relay for Life Dates: October 2008 – January 2010
• WFUSM Ultrasounds Medical Student Male A Capella Group Dates: November 2007 – present
• Student Volunteer, DEAC Student-Run Free Clinic Wake Forest University School of Medicine Dates: September 2008 – present
• Student Member, Brain Awareness Council Wake Forest University School of Medicine Dates: September 2008 – present
• Medical Volunteer, Special Olympics of North Carolina Basketball & Cheerleading Competition 2009, 2010 Dates: March 7, 2009; March 6, 2010
• Medical Volunteer, Ardmore/Knollwood Peru Mission 2011 Chimbote, Peru Dates: May 2011
• Student Volunteer, “Share the Health” Student-run Health Fair Wake Forest University School of Medicine Dates: January 2008, January 2009, January 2010