eu beef farms report 2012 - european...
TRANSCRIPT

EU beef farms report 2012
based on FADN data

Europe Direct is a service to help you find answers to your questions about the European Union.
Freephone number (*): 00 800 6 7 8 9 10 11
(*) Certain mobile phone operators do not allow access to 00 800 numbers or these calls may be billed.
More information on the European Union is available on the Internet (http://europa.eu).
Cataloguing data can be found at the end of this publication.
© European Union, 2013. Reproduction is authorised, provided the source is acknowledged as ‘European Commission — EU FADN’, save where otherwise stated. Where prior permission must be obtained for reproduction, such permission shall cancel the above-mentioned general permission and shall clearly indicate any restrictions on use. When data/information are adapted or modified by the user, this shall be explicitly stated at a suitably prominent place in the work.
© cover photo: Rachele Rossi
The text of this publication is for information purposes only and is not legally binding.

Commission européenne, B-1049 Bruxelles / Europese Commissie, B-1049 Brussel — Belgium. Telephone: (32-2) 299 11 11.
EUROPEAN COMMISSION DIRECTORATE-GENERAL FOR AGRICULTURE AND RURAL DEVELOPMENT Directorate L. Economic analysis, perspectives and evaluations L.3. Microeconomic analysis of EU agricultural holdings
Brussels, May 2013
Unit L3 D(2013)
EU BEEF FARMS REPORT - 2012 -
Summary:
This report provides an overview of the production costs, margins and incomes of farms specialising in beef production from 2000 to 2009. In addition, it gives estimations of gross margins for 2010 and 2011. The analysis is based on the latest available data from the Farm Accountancy Data Network (FADN). Farms are classified into three groups on the basis of the beef production system practised. ‘Breeders’ are farmers with suckler cows not fattening their calves, ‘breeders & fatteners’ fatten the calves born on their farms, and ‘fatteners’ purchase young male animals and then finish fattening them. In 2009, the sample farms of specialist beef producers represented 44 % of the EU-27 cattle population. The results for the EU as a whole are dominated by EU-15 farms that make up between 88.1 % and 92.6 % of the total number of farms in the types of production analysed here. EU-10 farms complement the picture; there are only a few farms from EU-2.
Figure 1: Gross margin per EU group, type of production, 2009
Gross margins for 2009 are generally not high but, apart from EU-10, are positive for breeders and for breeders & fatteners (Figure 1). Coupled payments (CP), which have been relatively stable since 2006, helped improve the situation given that underlying margins (without CP) were low for another year (see Figure 2).

EU beef farms report 2012
2
Figure 2: Gross Margin, EU-All, type of production, 2006-2011
Gross margins for fatteners are lower than for breeders & fatteners and for breeders expressed in terms of the number of males fattened and sold per year. This is an outcome of the specific nature of this type of beef production where the turnover of animals is much greater than for breeders and for breeders & fatteners, hence the margins
per animal can be lower. However, when various indicators of income per annual work unit are taken into account, fatteners generate the highest incomes (Figure 3).
Figure 3: Income indicators per EU group, type of production, 2009
The EU-10 indicators are lower than those for EU-15 both in terms of margins and incomes, which can be explained in part by the smaller number of cows/cattle per farm, lower prices for beef and lower technical and labour efficiency.
Figure 4: Structural indicators per EU group, type of production, 2009
Figure 4 shows that fattening is a more intensive production type than the other two systems. Fatteners have less agricultural land, have similar labour resources but sell about three times more animals than breeders and breeders & fatteners. Stocking density for fatteners is about twice that of breeders or of breeders & fatteners.

EU beef farms report 2012
3
Three graphs in Figure 5 show that in EU-15 countries (which dominate the results for the EU as a whole and for which we have continuity of data), output went up over the period 2000-2008 but income did not necessarily do so. Only for fatteners is income growth roughly in line with output growth. This is a consequence of a general increase in production costs. The remarkable drop in remuneration of family labour seen in 2009 can to a large extent be explained by exceptionally high estimates of capital costs that year.
Figure 5 Income indicators, EU-15, type of production, 2000-2009
During the period under review, the main costs of beef production grew much faster than output; feed costs increased by between 45 % (fatteners) and 74 % (breeders) and animal purchase costs rose between 16 % and 39 %. In the same period output went up by between 6 and 21 % (see Figure 9 on page 8). When considering developments over time, it should be kept in mind that important policy changes were made during this period. The main change was the decoupling of direct payments between 2004 and 2006. Complementary national direct payments were also decoupled in some new Member States in 2007, negatively affecting the level of gross margins, although not necessarily farm incomes.
The analysis is based on data in the EU Farm Accountancy Data Network (FADN) database. FADN brings together the results of sample surveys held each year and focuses on accountancy data from farms. The data are fairly comprehensive in terms of covering farming activities, but costs of production are recorded only as an aggregate per farm. For the calculation of margins, it was thus necessary to allocate costs to particular products.

EU beef farms report 2012
4
Box 1: The Farm Accountancy Data Network (FADN) FADN1 is a European system of sample surveys held each year to collect structural and accountancy data on farms. The aim is to monitor the income and business activities of agricultural holdings and to evaluate the impacts of the Common Agricultural Policy (CAP).
The FADN surveys only include farms that exceed a minimum economic size (threshold) so as to cover the most relevant part of the agricultural activity of each EU Member State. This threshold is set at 90 % of the standard gross margin and 90 % of the utilised agricultural area covered in the Farm Structure Survey (FSS, Eurostat). For 2007, the sample consisted of over 78 000 holdings in the EU-27, representing 5.4 million farms or 39 % of a total of some 14 million farms included in the FSS.
The survey is intended to provide representative data in three dimensions: by region, economic size and type of farming. FADN is the only harmonised source of micro-economic data, which means that the accounting principles are the same for all EU Member States.
The most recent FADN data available for this report are for the 2009 accounting year; this is because of the time needed to collect, check and correct the data of all EU Member States.
The next edition of this report, using FADN data up to 2010, is scheduled for later this year.
Disclaimer: This publication does not necessarily reflect the official opinion of the European Union. Neither the European Union institutions and bodies nor any person acting on their behalf may be held responsible for the use which may be made of the information contained therein. Contact: DG Agriculture & Rural Development, Microeconomic analyses of EU agricultural holdings E-mail: [email protected] Internet: http://ec.europa.eu/agriculture/rica/index.cfm Copyright: © European Communities, 2013. Reproduction is authorised, provided the source is acknowledged as ‘European Commission — EU FADN’, save where otherwise stated. Where prior permission must be obtained for the reproduction, such permission shall cancel the above mentioned general permission and shall clearly indicate any restrictions on use. When data/information are adapted or modified by the user, this shall be explicitly stated at a suitably prominent place in the work.
1 For more information on FADN, see http://ec.europa.eu/agriculture/rica/index.cfm.

EU beef farms report 2012
5
Contents
1. INTRODUCTION .................................................................................................... 6
2. BREEDERS’ MARGINS AND INCOMES............................................................ 10
3. BREEDERS & FATTENERS’ MARGINS AND INCOMES ................................ 16
4. FATTENERS’ MARGINS AND INCOMES ......................................................... 21
5. BEEF PRODUCERS AND OTHER SECTORS OF AGRICULTURE .................. 26
6. CONCLUSIONS ..................................................................................................... 27
ANNEX I — METHODOLOGY .................................................................................... 28
METHOD ....................................................................................................................... 28
THE MODEL ................................................................................................................. 30
ANNEX II — BASIC DATA AND INDICATORS ....................................................... 34
ANNEX III COMPARING TYPES OF PRODUCTION AND EU GROUPS ............... 41
ANNEX IV DETAILED DATA ON BREEDERS ......................................................... 45
ANNEX IVA BREEDERS BY MEMBER STATES ..................................................... 51
ANNEX V DETAILED DATA ON BREEDERS & FATTENERS ............................... 69
ANNEX VA BREEDERS & FATTENERS BY MEMBER STATES ............................ 76
ANNEX VI DETAILED DATA ON FATTENERS ....................................................... 92
ANNEX VIA FATTENERS BY MEMBER STATES ................................................... 99
ANNEX VII NOMENCLATURE TABLE ................................................................... 110

EU beef farms report 2012
6
1. INTRODUCTION
The study aims to estimate margins in beef production and provide indicators of the income of farms geared to beef production in EU Member States. Gross, net, and net economic margins are calculated and presented in the tables. The text mainly discusses gross margins. Farm net value added, farm net income and remuneration of family labour are presented as indicators of income. The analysis covers the accounting years from 2000 to 2009. Gross margins have also been estimated for 2010 and 2011. The calculations are based on data collected in the EU FADN database.
Situation in the beef sector in the period under review
During the period under review, European beef producers included in the FADN survey experienced cyclical changes in beef prices. The length of the cycle differed depending on the type of producer, with breeders experiencing the longest cycle and breeders & fatteners the shortest (Figure 6).
Figure 6: Output per animal, EU-15, type of production, 2006-20112
The overall increase in output value per animal3 which can be treated as a proxy for prices4 was moderate — 21 % for fatteners and 6 % for breeders and breeders & fatteners in nominal terms. At the same time, inflation as expressed by the harmonised index of consumer prices (HICP) increased by 30.5 % in the EU-27. According to Eurostat, the price of cattle
went up by 35 % but this calculation is based on aggregate prices and not values per animal as reported in FADN. In addition, farm-gate prices are not always equal to prices reported at the point of sale so the latter price may be higher. Nevertheless, particularly from 2007 onwards, the Eurostat index changes broadly reflect the changes seen in the FADN. The occasional differences could be attributed to the fact that the FADN data is based on analysis of a sample of specialised farms only and to differences in the methods of obtaining price data in Eurostat and in FADN.
2 Figure 6 presents data from 2006 because table 'N' (purchases and sales of animals) was not correctly filled
in by some Member States which might have an effect on the estimates of prices. 3 In €/cow for breeders, in €/cattle sold for breeders & fatteners and fatteners. 4 FADN does not provide prices for beef output.

EU beef farms report 2012
7
Figure 7: Output per animal and number of animals per farm, 2000-2009
Figure 7 shows an apparent fall in output value per animal in 2006-2009, which was associated with lower farm prices and higher production per farm. For each type of production, the average number of cattle on farms and the average number of cattle sold increased in the period under review.5 The exceptions are fatteners who sold fewer cattle in 2009 than in the previous year and breeders & fatteners in 2006-2007.
In the analysis of beef production, feed and animal purchases are the most significant costs. Figure 8 shows that, on average in EU-15, they make up 49 % of the total costs for breeders, 61 % for breeders & fatteners and 85 % for fatteners but in EU-10 countries it is lower (37 %, 50 %, and 78% respectively). Thus, any changes in these two variables affect fatteners more than breeders and EU-15 beef producers more than those in EU-10 countries. Breeders and, to a lesser extent, breeders & fatteners are more sensitive to changes in feed prices than fatteners, which are the most sensitive to changes in animal prices.
5 This may be an outcome of changes in production structures themselves but may also reflect the fact that
specialist beef producers enter or develop trading activities by serving small beef producers or/and non-specialised producers to market their output.

EU beef farms report 2012
8
Figure 8: Feed and animal purchases’ share of total costs, EU-15, type of production, 2000-2011
Feed costs increased much more than inflation and were different depending on the type of production; breeders and breeders & fatteners experienced feed cost increases of up to 74% while fatteners were faced with a 45 % increase. Animal purchase costs rose between 16 % and 39 % (Figure 9). Overall, the input prices of the main cost components went up much faster than output for each group of beef producers.
Figure 9: Feed and animal purchase costs, EU-15, type of production, 2000-2011

EU beef farms report 2012
9
Box 2: Summary of the method used to estimate costs of production The FADN database contains information about output and subsidies per product, but as far as costs are concerned, it only provides information for the farm as a whole. Hence, the direct contribution of each enterprise to farm income is not available, which means that the production costs by product have to be estimated. The unit in the European Commission working on the FADN has built several models to estimate costs and margins for the different products: arable crops, milk and beef, and permanent crops. These models allocate farm costs to a particular product using different ratios. The Annex gives details of the model used in this analysis to estimate beef production costs and margins.
From 2008, imputed costs for unpaid family factors are estimated (e.g. own capital costs). The aim is to enable a comparison to be made between Member States with different structures in terms of main production factors. The methodology for estimating the opportunity costs of those factors is explained in Annex I — Methodology.
The output, operating costs and gross margins (over operating costs) for 2010 and 2011 are estimated on the basis of beef price, yield and input price indices. Structures and subsidies in beef production are assumed to have remained unchanged. These and the increased volatility of prices observed on beef market in recent years imply that the resulting estimates are approximate. The sources of the indices used are the following: for beef prices—Eurostat and the European Commission Directorate-General for Agriculture (DG AGRI); for inputs— Eurostat databases (agricultural prices and price indices).

EU beef farms report 2012
10
2. BREEDERS’ MARGINS AND INCOMES
2008 and 2009 were some of the worst years for breeders and estimates of the margins for 2010 and 2011 are not optimistic. Output went up and overall cost levels increased but what is typical for the 2000 to 2011 period is that costs that are specifically and directly linked to beef production went up less than non-specific costs (by 55 % and 64 % respectively). Although it is estimated that specific costs have risen by a further 8% since 2009, the long-term trend appears to be that the proportion of machinery, building, energy and other costs in specialised beef producers’ total operating costs is growing.
In the period 2000-2009 a group of between 1011 and 1399 sample farms were selected to calculate these margins. They represented the 66020–76390 farms in the EU-27 specialised in cattle breeding.
In 2009 these farms held on average 72 livestock units (LU), of which 98 % were beef cattle. The specialisation rate6 was 81 %; family labour dominated at 91 % (see Annex II — Basic data and indicators, Table 1 on page 34). Between 2000 and 2009 the highest number of breeder farms was to be found in France, Spain and Ireland with 59, 55 and 25 average suckler cows per farm respectively in 2009. Although there are fewer breeding farms in Germany and the UK, they have the largest number of suckler cows (97 and 67 respectively) and the highest output per farm (see Table 4 on page 37 and Table 17 on page 51). The average number of suckler cows in EU-27 in 2009 was 47 which is fairly representative of the period between 2007 and 2009. The most labour-intensive type of production is carried out in Slovenia, Poland and Latvia where there are respectively 5, 10 and 12 suckler cows per 1 annual work unit (AWU). The least labour was used in France and the UK (52 and 48 suckler cows per annual work unit). Interestingly, in Denmark one AWU serves 37 suckler cows but there is less than one person employed per beef breeding farm.
Figure 10: Output, costs and margins, EU-All, Breeders, 2000-2011
According to estimates, average output grew for the last three years and reached a little more than EUR 900 per suckler cow in 2011. A similar pattern was observed between 2004 and 2006 but operating costs did not increase much which resulted in higher margins than those estimated for 2009-2011. Underlying margins have been very low since 2008 and it is only when coupled payments are taken into account that margins seem
to be reasonable. Even then, they are only roughly half the margins recorded between 2002 and 2005 (Figure 10).
6 The specialisation rate is calculated as the percentage of beef output in total output.

EU beef farms report 2012
11
Figure 11: Output, costs and margins, EU groups, Breeders, 2009
Results from breeders in the EU-27 as a whole are dominated by those in the EU-15 (92.6 % of the represented farms), whose margins were higher than average and much higher than the EU-10 margins (Figure 11). The latter group have significantly lower than average production costs but their output is only a little over half the average output. In 2009 the EU-10 sample was dominated by four countries (Slovenia, Poland, the Czech Republic and Latvia) which made up 76 % of the represented farms. Except for Slovenia (where annual beef consumption is 20kg per
head) beef consumption in these countries is low, ranging between one quarter and about half the EU average. Although breeders are not directly connected with the consumer market, downward price movements are passed on to them and translate into low young cattle prices (58 % of the EU-27 average if Slovenia is excluded). This, in turn, largely explains the low output of beef in EU-10 countries.
Figure 12: Output and costs, EU-All, Breeders
Operating costs7 of producing cattle for breeding are estimated to have increased by nearly 40 % between 2000 and 2009; specific costs increased by 32 % and non-specific costs by 50 %. Total economic costs8 increased by 23 %. Depreciation was responsible for the biggest cost increase (56 %) while imputed
family factors went down by 4 %, which suggests that labour is becoming more efficient, thus lowering the costs of the family’s own input (Figure 12). 7 Operating costs in Figure 12 refer to specific costs plus non-specific costs (marked by yellow triangle). 8 Total economic costs include all components shown in Figure 12

EU beef farms report 2012
12
Figure 13: Output and costs, EU groups, Breeders, 2009
When groups of countries within the EU are compared, it is worth noting that the level of specific costs in EU-15 countries is nearly twice that of EU-10 countries. Not only is output in EU-10 countries lower but so too are input prices including labour, feed, energy and water. In addition, the specialisation rate is lower, meaning that there are not so many ‘pure’ breeders in EU-10
countries and that a considerable proportion of this type of production is part of mixed and other types of production where costs can be lower than for the ‘regular’ breeding process. In contrast, imputed family factors are 21 % higher in EU-10 countries than in the EU-15. This is mainly due to much higher capital costs (67 %).9 Other cost elements are comparable.
Figure 14: Gross Margins, per Member State, Breeders, 2009
The way in which margins have evolved across the Member States shows that more breeders are generating negative margins than was the case in 2008. In 18 Member States the FADN sample was sufficient to represent results for breeders. As shown in Figure 14, the average margin differs widely. The highest values were recorded for Italy (one of a few cases where
margins have improved), Belgium and Spain and the lowest values were found in Denmark, Finland (without coupled payments) and the Czech Republic. Negative margins without coupled payments were recorded in 10 Member States, four more than in 2008. In 2009 the sample increased from 15 to 18 Member States and two ‘newcomers’ (Latvia and Greece) featured negative margins. Margins in Slovenia, Ireland and Germany moved from positive to negative and in the UK moved from negative margins to break-even and slightly above (including coupled payments). Direct payments in Austria, Latvia and Finland compensated
9 See Annex I — Methodology for further explanation. The ‘real interest rate’ applied to calculate unpaid
costs of own capital corresponds roughly to the difference between the long-term interest rate and inflation. Contrary to the pre-2009 years, in most Members States and notably in EU-10, inflation came down and came close to zero in 2009, so the real interest rate went up considerably causing unpaid costs of own capital to rise abruptly. It is worth noting that unpaid costs of own capital are estimates, and should be interpreted with caution.

EU beef farms report 2012
13
negative margins so breeders in these countries enjoyed positive margins if coupled payments are included.
For most Member States, the common feature behind this development was an increase in non-specific costs.10 For example in Germany, where margins turned from positive to negative, a substantial increase in the cost of buildings and machinery maintenance (27 % in 2008/2009) together with an increase in the cost of contract work (36 %) put up non-specific costs by 11 %. Despite substantial falls in specific costs (down 13 %), and because non-specific costs make up 70 %11 of total costs, gross margins turned negative.
The unusually high estimated cost of capital in 2009 has significantly affected estimates of incomes as some costs elements are evaluated as opportunity costs (Figure 15).
Figure 15: Income indicators, EU-All, Breeders, 2000-2009
Margins fell from 2006 onwards and had a negative impact on incomes. From that year onwards, the farm net value added (FNVA) per annual work unit (AWU) went on a downward trend; the 2009 value is 18 % lower than in 2006 despite a 5 % rise in output and a 13 % increase in subsidies in
the form of decoupled and other payments.12 The drop in the FNVA was primarily caused by a substantial increase in intermediate consumption (21 %). The net value of subsidies went from being almost equal to the value of the FNVA to more than 130 % its value.
For the same period, there was a considerable drop in the estimated value of the remuneration of family labour (RFL). There were some limitations to this coefficient in 2009, however, as the estimate relies heavily on the real interest rate. The cost of capital, which had been relatively stable between 2000 and 2008, rose sharply in 2009 and caused a fall in RFL. However, this was a temporary situation in 2009 and, as real interest rates were lower in the following years, it can be expected that when estimates of beef production costs related to capital are produced, they will show a recovery.
10 Non-specific costs consist of: machinery and building maintenance, energy (fuel, electricity), contract work,
taxes and other direct input (including water and farm building insurance). 11 In 2008 it was 5 % less. 12 Including a 1 % increase in environmental subsidies.

EU beef farms report 2012
14
Figure 16 Income indicators, EU groups, breeders, 2000-2009
Figure 16 shows that not only are margins lower in EU-10 countries than in EU-15 countries, but incomes are lower too. This can be explained in part by the smaller number of cows per farm, lower prices for beef and lower technical and labour efficiency (as indicated on page 10).
Figure 17: Income indicators, per Member State, Breeders, 2009 (positive incomes)
In order to make the results more visible, the income indicators for 2009 presented in Figure 17 and are divided into two groups of Member States — those where remuneration of family labour is positive and those where it is negative. As is the case with margins, incomes vary between Member States and reflect not only the diversity of the breeding sector but also the impact of the wider macroeconomic and fiscal conditions on the sector.
Figure 18: Income indicators, per Member State, Breeders, 2009 (negative incomes)
For the reasons explained above, two thirds of Member States experienced a drop in Farm Net Value Added (FNVA)13 in 2009 compared to the previous year. In some countries (e.g. Denmark and Luxemburg — see Figure 18) the situation was temporarily worsened by investment decisions taken before or during this time which effectively drove up indebtedness and thus debt service costs. The relaxation of monetary policy in the following years should have
13 Amount left for remuneration of the fixed factors of production (work, land and capital), whether external or
family factors.

EU beef farms report 2012
15
improved the situation. Denmark stands out in this general picture as Danish breeders’ income indicators are permanently and substantially negative. There are reasons behind the Danish situation: (i) fiscal incentives allowing losses from a household activity to be deducted from household’s general income, lowering the effective rate of taxation, thus increasing actual income; (ii) the average real interest rate and other financial charges are usually high; (iii) the financial instruments chosen to finance modernisation trigger high financial charges; and (iv) the value of farm assets (especially land) is growing and farmers believe that it will grow in the future.

EU beef farms report 2012
16
3. BREEDERS & FATTENERS’ MARGINS AND INCOMES
As was the case for breeders, 2009 was one of the worst years for breeders & fatteners; margin estimates for 2010 and 2011 are not optimistic and suggest that the situation worsened in 2010 with a slight recovery in 2011. Output increased and the overall level of costs increased but what was typical for the period of 2000 to 2010 was that specific costs directly linked to beef production increased less than non-specific costs; only in 2011 did specific costs accelerate much faster than non-specific costs, mainly due to higher feed costs.
In the period of 2000-2009, a group of between 1 420 and 1 735 sample farms were selected to calculate these margins. They represented between 77 670 and 95 910 farms in the EU-27 specialised in breeding cattle.
In 2009 these farms held on average 67 livestock units (LU), of which 96 % were beef cattle. The specialisation rate was 79 %, meaning that 79% of the output came from beef. Family labour dominated, at 91 % of the total employment (Table 2, page 35). Between 2000 and 2009 the highest number of breeding & fattening farms was to be found in Spain, the UK and France with, 53, 123 and 105 beef livestock units on average per farm respectively in 2009. Although there are fewer breeding & fattening farms in Belgium, here too they have a high headcount (110) and the highest output per farm, mainly due to the high price of Belgian Blue carcasses (see Table 4 on page 37).
The average number of suckler cows in EU-27 in 2009 was 35, which is fairly representative of the period between 2008 and 2009. As is the case for breeders, the most labour-intensive type of production is carried out in Slovenia and Poland where one annual work unit (AWU) is necessary to produce 4 and 7 finished cattle respectively. The lowest use of labour was in Denmark where one labour unit serves 93 cattle. Denmark is, however, a special case with less than one person employed per farm. Sweden, the second-least labour intensive Member State can produce 42 finished cattle per AWU.
Figure 19: Output, costs and margins, EU-All, Breeders & Fatteners, 2000-2011
According to estimates, average output grew for the last three years and reached nearly EUR 1 400 per animal sold in 2011. A similar pattern was observed between 2004 and 2006 but the margins were higher. Since 2010, underlying gross margins have been at an historically low level and it is only when coupled payments are taken into account that
margins seem to be reasonable. Even then, they are less half the margins recorded between 2000 and 2004 (Figure 19).

EU beef farms report 2012
17
Figure 20 Output, costs and margins, EU groups, Breeders & Fatteners, 2009
Results from breeders & fatteners in the EU-27 as a whole are dominated by those in the EU-15 (88.1 % of the represented sample), whose margins were slightly higher than average and much higher than the EU-10 margins (Figure 20). The latter group face significantly lower than average production costs but their output is less than two thirds of the average EU
output. In 2009 the EU-10 sample was dominated by three countries (Poland, Slovenia and the Czech Republic) which made up 65 % of the EU-10 represented farms. For reasons similar to those for breeders, low consumer prices for beef in EU-10 countries translate into lower cattle prices (62 % of the EU-27 average). This in turn largely explains the low output of beef in the EU-10.
Figure 21: Output and costs, EU-All, Breeders & Fatteners
Operating costs of producing finished cattle from own animals are estimated to have increased by nearly 23 %, between 2000 and 2009, mainly due to higher feed and energy costs (representing 52 % and 16 % of the total increase in operating costs respectively). Total economic costs increased by 17 %. Depreciation was responsible for the
biggest cost increase (19 %) while imputed family factors went up by only 9 % (Figure 21). However, it is worth noting that both operational and economic costs were at fairly similar levels between 2006 and 2009.

EU beef farms report 2012
18
Figure 22: Output and costs, EU groups, Breeders & Fatteners
When groups of countries within the EU are compared, we see the same story as with breeders, but values differ. Specific costs in EU-15 countries are 70% higher than those in EU-10 countries; imputed family factors are 21 % higher in EU-10 than in EU-15 countries due to higher family labour and capital costs (23 % and 17 %). This
is apparently a reflection of the lower labour productivity in EU-10 as one labour force unit is, at best, able to produce only half the number of finished animals that those in EU-15 countries produce. Farmers in EU-10 Member States have also faced higher depreciation costs (39 %) because they invested in the modernisation of their farms. Other cost elements are comparable.
Figure 23: Gross Margins, per Member State, Breeders & Fatteners, 2009
The way in which margins have evolved between the Member States shows that, in 2009, more breeders & fatteners generated negative margins than in 2008. In 16 Member States the FADN sample was sufficient to represent results for breeders & fatteners. As shown in Figure 23, the average margin differs widely. The highest values were recorded for Italy, Belgium (one of a few cases
where margins have improved) and Spain; the lowest values were found in Finland (without coupled payments), the Czech Republic and Sweden. Negative margins without coupled payments were recorded in 8 Member States, two more than in 2008. In 2009 the sample increased from 13 to 16 Member States and two ‘newcomers’ to the sample (Austria and Denmark) featured negative margins. Margins in Ireland and Portugal moved from positive to negative and in the UK from negative to positive. Direct payments in Austria, Portugal and Finland compensated negative margins so breeders & fatteners in these countries enjoyed positive margins if coupled payments are included.
In most Member States, specific production costs increased considerably less than non-specific costs; a common feature behind this development is a general rise in basic input costs (fuel, electricity) and capital-linked costs (insurance). For example, in Ireland, where margins moved from positive to negative in 2008/2009, there was a substantial increase (55 %) in the

EU beef farms report 2012
19
cost of direct inputs including water and insurance of buildings and other goods. Although in nominal terms these are not high-cost items, they grow in importance over the years.
Figure 24: Income indicators, EU-All, Breeders& Fatteners, 2000-2009
Margins fell from 2004 onwards and had a negative impact on incomes, which began to fall as from 2006 (Figure 24). The farm net value added (FNVA) per annual work unit (AWU) in 2009 was 8 % lower than in 2006 despite a 5 %
rise in output and 1 % increase in subsidies in the form of decoupled and other payments. The drop in the FNVA was primarily caused by a substantial increase in intermediate consumption (13 %). The net value of subsidies went from being almost equal to the value of the FNVA to 7 % above the FNVA.
For the same period, there was a drop of more than one third in the estimated value of the remuneration of family labour (RFL).14 Between 2000 and 2009, breeders & fatteners in the EU as a whole15 managed to increase their apparent labour productivity16 by 5 %. The figure for breeders & fatteners in EU-15 countries was 17 %. Between 2004 and 2009, there was a drop in the efficiency of breeders & fatteners in EU-10 Member States.
Based on margin estimates, which are at a historically low level due to higher feed, animal purchase and energy costs, the income prospects for 2010 and 2011 do not look optimistic. Once the data are available it will need to be seen if and how coupled and decoupled payments compensated for this effect.
Figure 25: Income indicators, EU groups, Breeders & Fatteners, 2009
Figure 25 shows that not only are margins lower in EU-10 countries than in EU-15, but incomes are lower too. The explanation is much the same as that for breeders set out on page Error! Bookmark not defined. — lower technical and much lower labour efficiency where one annual work unit in EU-10 countries produces only a fraction of what is produced in the EU-15 (see text on
14 The same reservation and explanation applies here as for breeders (page 13). 15 2000-2003: EU-15; 2004-2006: EU-25; from 2007: EU27.

EU beef farms report 2012
20
labour intensity on page 16).
Figure 26: Income indicators, per Member State, Breeders & Fatteners, 2009 (positive incomes)
In order to make the results more visible, the, income indicators for 2009 presented in Figure 26 are divided in two groups of Member States — those whose remuneration of family labour is positive and those where it is negative. As is the case with margins, incomes vary between Member States and reflect not only the diversity of the
breeding & fattening sector but also the impact of the wider macroeconomic and fiscal conditions on the sector.
Figure 27 Income indicators, MS, B&F, 2009 (negative incomes)
In 2009, all but five Member States (Belgium, Germany, Luxembourg, Portugal and the UK) experienced a drop in Farm Net Value Added (FNVA) from the previous year. The reasons for this development are similar to those described in section 2 (page13) on breeders.

EU beef farms report 2012
21
4. FATTENERS’ MARGINS AND INCOMES
Fatteners appear to have survived the 2009 crisis better than breeders or breeders & fatteners. They succeeded in maintaining reasonable gross margins, considering the harsh macroeconomic conditions. However, since 2008, the way in which these margins have evolved is not favourable and the 2010 and 2011 estimates suggest a significant further deterioration of the situation. As was the case for breeders and breeders & fatteners, specific costs fell by 6 % in 2008-2009 while non-specific costs rose by 7 %. This is typical for the period beginning in 2000. Estimates for 2010 and 2011 suggest that the situation has reversed, with specific costs growing faster than non-specific costs mainly due to high feed and animal purchase costs.
In the period between 2000 and 2009, a group of between 272 and 468 sample farms were selected to calculate these margins. They represented between 14 980 and 23 090 farms in the EU-27 specialised in fattening young male cattle.
In 2009 these farms held on average 69 livestock units (LU), of which 95 % were beef cattle. The specialisation rate was 79 %. Family labour dominated, at 90 % (Table 3, page 36). Between 2000 and 2009 the highest number of fattening farms was to be found in Ireland, Spain, Italy and Germany with 49, 40, 152 and 80 beef livestock units respectively in 2009. These numbers cannot be directly compared with breeders & fatteners because the animals are usually kept for a shorter period and therefore fatteners sell many more animals during the year than breeders & fatteners. This is confirmed by the value of output which can be more than 20 times that of other types of production (see, for example, Italy Table 4 on page 37). The most labour-intensive type of production is carried out in Poland and Slovenia, with 12 and 16 cattle respectively sold per AWU. The lowest use of labour was in Denmark and Italy — one AWU per 263 cattle sold in Denmark and one per 135 in Italy.
Figure 28: Output, costs and margins, EU-All, Fatteners, 2000-2011
Between 2008 and 2009, according to the estimates presented in Figure 28, output and operating costs declined but costs fell at a slower pace, reducing the gross margin. Output began to recover in 2010 and 2011 and should have reached nearly EUR 1 300 per animal but operating costs increased more quickly,
drastically squeezing margins. Based on an observation of the time series, it seems that there is a cyclical 3-year pattern of output and cost growth (2001-2003, 2004-2006 and 2009-2011). After each cycle costs fall but output stays at a similar level. If this is a long-term pattern, gross margins in 2012 should have increased.
Coupled payments up to 2004 were much higher than in the period thereafter which allowed fatteners to enjoy quite good margins. Since 2006, coupled payments have been at or around EUR 40 per animal sold. Although this nominal value is not high, it represents more than half the gross margin. Given fatteners’ high level of turnover, such payments may positively contribute to beef fatteners’ economic situation.

EU beef farms report 2012
22
Figure 29: Output, costs and margins, EU groups, Fatteners, 2009
Results from fatteners in the EU-27 as a whole are dominated by those in the EU-15 (89 % of the represented sample) whose margins were slightly higher than average and approximately twice the EU-10 margins (Figure 29). The latter group have lower production costs but also lower output (65 % of the average).The only two countries presented in this section (Poland and Slovenia) represent 43 % of the whole EU-10 sample for 2009.17 For reasons similar to those for breeders, low consumer prices for beef in EU-10 countries translate into lower
cattle prices (68 % of the EU-27 average).
Figure 30: Output and costs, EU-All, EU groups, Fatteners
Beef fattening is characterised by intensive purchasing of animals (58 % of total operating costs on average). Along with feed costs, animal purchases constitute 85 % of total operating costs. Fatteners benefit from economies of scale in the sense that the proportion of non-specific costs in total operating costs is low (15 %). Similarly, specific costs make up
62 % of the total economic costs, twice the equivalent level for breeders or breeders & fatteners.
17 The remaining 57 % are spread between countries where the sample is too low to be presented in this report.
They are, however, used to calculate EU-27 and EU-10 averages. These are the Czech Republic, Hungary, Lithuania and Latvia.
EU beef farms report 2012
23
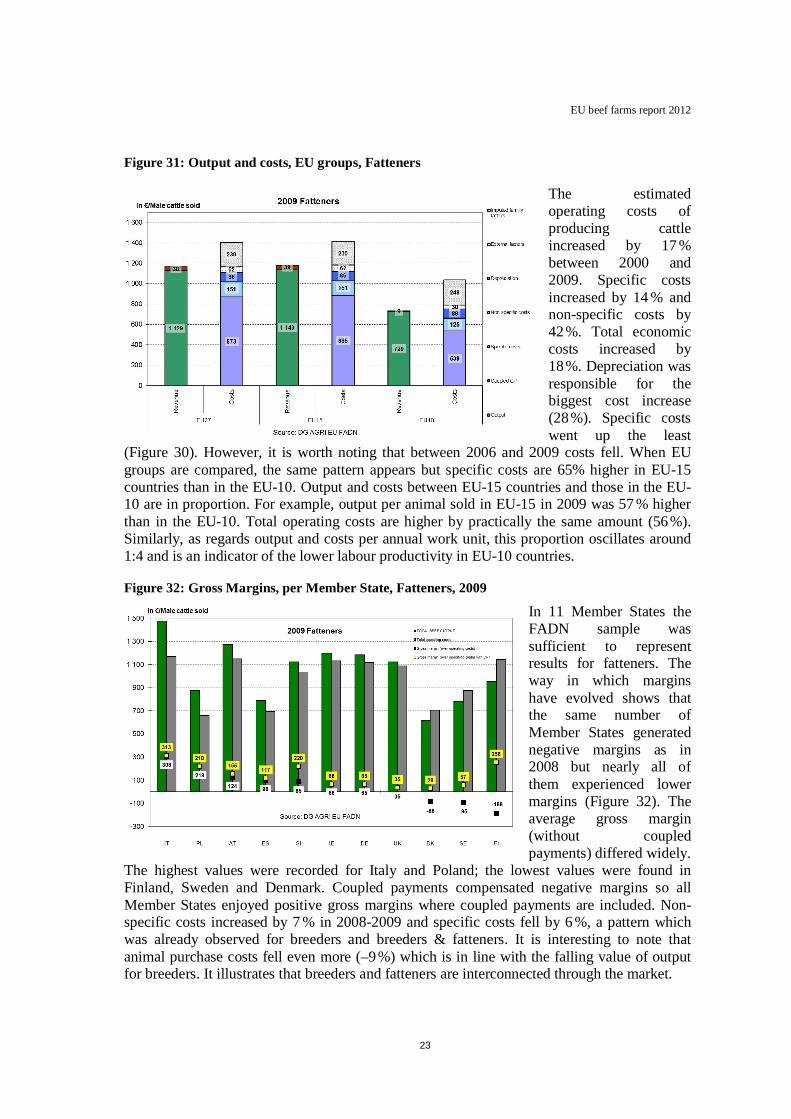
Figure 31: Output and costs, EU groups, Fatteners
The estimated operating costs of producing cattle increased by 17 % between 2000 and 2009. Specific costs increased by 14 % and non-specific costs by 42 %. Total economic costs increased by 18 %. Depreciation was responsible for the biggest cost increase (28 %). Specific costs went up the least
(Figure 30). However, it is worth noting that between 2006 and 2009 costs fell. When EU groups are compared, the same pattern appears but specific costs are 65% higher in EU-15 countries than in the EU-10. Output and costs between EU-15 countries and those in the EU-10 are in proportion. For example, output per animal sold in EU-15 in 2009 was 57 % higher than in the EU-10. Total operating costs are higher by practically the same amount (56 %). Similarly, as regards output and costs per annual work unit, this proportion oscillates around 1:4 and is an indicator of the lower labour productivity in EU-10 countries.
Figure 32: Gross Margins, per Member State, Fatteners, 2009
In 11 Member States the FADN sample was sufficient to represent results for fatteners. The way in which margins have evolved shows that the same number of Member States generated negative margins as in 2008 but nearly all of them experienced lower margins (Figure 32). The average gross margin (without coupled payments) differed widely.
The highest values were recorded for Italy and Poland; the lowest values were found in Finland, Sweden and Denmark. Coupled payments compensated negative margins so all Member States enjoyed positive gross margins where coupled payments are included. Non-specific costs increased by 7 % in 2008-2009 and specific costs fell by 6 %, a pattern which was already observed for breeders and breeders & fatteners. It is interesting to note that animal purchase costs fell even more (–9 %) which is in line with the falling value of output for breeders. It illustrates that breeders and fatteners are interconnected through the market.

EU beef farms report 2012
24
Figure 33: Relationship between Breeders and Fatteners 2000-2011, EU-All
Figure 33 shows that the interconnection between breeders and fatteners is rather strong with a clear and well-explained regression line (high R2) and the relationship is basically in a 1:1 proportion.
This means that an increase in the value of breeders’ output results in roughly the same increase in the value of fatteners’ animal purchases.
Figure 34: Income indicators, EU-All, Fatteners, 2000-2009
Margins fell from 2008 onwards and had a negative impact on income levels, which also fell. The farm net value added (FNVA) per annual work unit (AWU) in 2009 was 4 % lower than in 2008. This is mainly a consequence of the 8 % fall in output. Subsidies increased by 13 % and allowed fatteners to maintain
a reasonable income. The net value of subsidies has grown from 72 % of the FNVA to 85 %, close to the average value for the period between 2000 and 2009.
For the same period 2008-2009, estimates of the remuneration of family labour dropped by more than one third. Between 2000 and 2009, fatteners in the EU as a whole18 managed to increase their labour productivity by more than 13 %. In EU-15 countries, this improvement was greater, at 26 %.
Based on margin estimates, which are at an historically low level due to higher feed, animal purchase and energy costs, income prospects for 2010 and 2011 do not look optimistic.
18 2000-2003: EU-15; 2004-2006: EU-25; from 2007: EU27.

EU beef farms report 2012
25
Figure 35: Income indicators, EU groups, Fatteners, 2009
Figure 35 shows that FNVA in EU-10 countries is only 23 % of the EU-27 average. The corresponding figure for farm net income is 29 % and for the remuneration of family labour 27 %. This pattern can be explained in the same manner as in the case of breeders and breeders & fatteners on page 19: lower technical and much lower labour efficiency whereby one annual work unit in EU-10
countries produces only a fraction of what is produced in the EU-15 (see text on labour intensity on page 16).
Figure 36: Income indicators, per Member State, Fatteners, 2009
The income indicators for 2009 presented in Figure 36 show a very wide range of values. Italy is the top-performing country in beef fattening with results that are more than twice as high as those in Spain, the second in the ‘ranking’. Large Italian farms, with the
highest output per farm (Table 4 on page 37) benefit from economies of scale and favourable natural conditions to fatten beef. They are able to generate high farm net value added (FNVA), achieve high farm net income (FNI) and remuneration of family labour. Fatteners in Denmark, despite generating the second highest FNVA per labour unit, arrive at a negative FNI. This is because of high external costs; interest paid by fatteners in Denmark amounted to 27 % of the total output per annual work unit in 2009 while the average amount of interest paid by fatteners in the EU as a whole in 2009 was 3.3 % of the total output. In addition Danish fatteners incur high labour costs. Although Danish farms quite often employ less than one full-time person, the cost of wages is double the European average.

EU beef farms report 2012
26
5. BEEF PRODUCERS AND OTHER SECTORS OF AGRICULTURE
This section briefly presents income indicators for beef producers including specialist breeders, breeders & fatteners and fatteners in comparison with other agricultural activity (Figure 37). In 2009, incomes fell in the vast majority of agricultural occupations and were largely an outcome of externalities, namely input and output market conditions and, particularly, high capital costs.
Between 2007 and 2009, group 6 — other grazing livestock producers — generated income that was below average in terms of farm net value added per annual work unit. The average income of type 6 farmers is lower than beef specialised producers, because it includes sheep, goats and other grazing livestock that have less potential to generate high incomes. Consequently specialist beef breeders and breeders & fatteners performed somewhat better than this group but were still below average as compared to the rest of agriculture.
Fatteners have the highest income per annual work unit (see Table 5, on page 39) and, apart from group 7 — granivores19 — the highest rate of farm net value added growth (see Table 6 on page 40). Although fatteners have one of the highest specific cost levels, they performed relatively well during the crisis year. However, this is partly due to the nature of this type of production, with relatively low use of labour per output unit. Beef production in general benefits from the highest net balance of subsidies and taxes of all agricultural sectors. This contributed to fatteners’ good result and helped breeders and breeders & fatteners to survive.
Figure 37 Income indicators in European agriculture 2007-2009
19 Granivores includes pig and poultry producers for whom 2009 was a very good year.

Commission européenne, B-1049 Bruxelles / Europese Commissie, B-1049 Brussel — Belgium. Telephone: (32-2) 299 11 11.
6. CONCLUSIONS
In 2009, specialist beef producers’ margins were very low but positive in most cases. After 2006, which had been a good year for beef producers, the situation deteriorated and in 2008 became critical for breeders and breeders & fatteners; fatteners were less affected. Coupled payments, which have been relatively stable since 2006, improved beef producers’ margins to some extent.
The income situation deteriorated in 2009 for all types of production. Although margin estimates for 2010 and 2011 do not look optimistic, they will have to be verified with new FADN data. The analysis suggests that farmers are increasing their labour efficiency and, over time, reducing their direct costs, the largest category of costs. There is thus some scope for moderate optimism that, based on margin estimates, 2010 and 2011 incomes may be better than estimated in this report.
Gross margins and income indicators in EU-10 countries are lower than those for the EU-15 because of the lower number of cows/cattle per farm, lower prices for beef and lower technical and labour efficiency.
Output increased between 2000 and 2009 but a general rise in production costs and, most noticeably, exceptionally high capital costs in 2009 outweighed this positive development. In addition, significant policy changes (the decoupling of direct payments in 2004-2006 and of complementary national direct payments in some new Member States in 2007) had a negative effect on gross margins.
When compared to other agricultural activities, specialist beef producers’ income gives a mixed picture. In 2007-2009, breeders and breeders & fatteners performed slightly below average but fatteners had the highest income per annual work unit and one of the highest rates of growth. Of the eight groups of agricultural activities, (TF8), the highest subsidies go to specialist beef producers. These subsidies have helped breeders and breeders & fatteners to survive and contributed to the good results achieved by fatteners.
Input and output costs were not the only influence on the beef sector in the years under review. General macroeconomic conditions, including the economic crisis of 2009, also had a noticeable impact on agricultural development. One of the largest cost increases was for capital-linked items, primarily through higher interest rates. This factor caused a fall in incomes as the cost of capital increased considerably.

EU beef farms report 2012
28
ANNEX I — METHODOLOGY
METHOD
General introduction to FADN
The Farm Accountancy Data Network (FADN) is a European system of sample surveys that take place each year and collect structural and accountancy data relating to farms; their aim is to monitor the income and business activities of agricultural holdings and to evaluate the impacts of the Common Agricultural Policy (CAP).
The scope of the FADN20 survey covers only those farms exceeding a minimum economic size (threshold) so as to cover the most relevant part of the agricultural activity of each EU Member State, i.e. at least 90 % of the total Standard Gross Margin21 (SGM) covered in the Farm Structure Survey (FSS, EUROSTAT) performed in 2007. For this year, the sample consists of approximately 81 000 holdings in the EU-27, which represents 5.1 million farms (37 %) of a total of nearly 14 million farms included in the FSS.
The applicable rules are aimed at providing representative data along three dimensions: region, economic size and type of farming. FADN is the only harmonised source of micro-economic data, which means that the accounting principles are the same in all EU Member States.
The most recent FADN data available for this report are for the 2009 accounting year;22 this is because of the time needed to collect and compile the data of all the EU Member States.
The model for estimating beef production costs and margins
The FADN database contains information about output, specific costs and subsidies per product, but as far as non-specific costs are concerned it only provides information relating to the farm as a whole. Hence, the direct contribution of each enterprise to the farm income is not available. This means that the production costs by product have to be estimated. The EU FADN unit has built several models to estimate costs and margins for the various products: arable crops, milk and beef, pigmeat and permanent crops. These models allocate farm costs to a particular product using different ratios.
20 For more information on FADN: http://ec.europa.eu/agriculture/rica/index.cfm. 21 The Standard Gross Margin (SGM) is the difference between the standardised monetary value of gross
production and the standardised monetary value of certain special costs. This difference is calculated for the various crop and animal characteristics (per hectare or per animal), at the level of the survey district for each Member State and given in €. By multiplying the areas or the number of animals by the corresponding SGM and then adding the products together, the total SGM of the holding is obtained. By adding the total SGM of all holdings of a Member State, the total Member State SGM is obtained. The concept of SGM is used for the determination of the economic size and the type of farming in FADN and in the Farm Structure Survey (FSS) organised by EUROSTAT.
22 Some information is still provisional for Spain and Greece 2007. Moreover it should be noted that Malta 2004 is missing and that Dutch 2000 data are estimates based on 1999 data.

EU beef farms report 2012
29
Opportunity costs for unpaid family factors
Imputed costs for unpaid family factors have been estimated. The aim is to enable a comparison to be made between Member States with different structures in terms of labour (share of family and paid labour), land (rented/owned) and capital.
Definitions of margins The gross margin (over operating costs)23 is generally used when making comparisons with alternative types of production for which it can be assumed that factor costs are identical (labour, land and capital costs still have to be paid whichever type of production is chosen). The net margin (before own factors) is calculated as the gross margin minus depreciation and external factors (wages, rent, interest paid). The net economic margin (after own factors) allows assessment of the residual revenue obtained from the production after remuneration of all production factors, including own land costs, own capital costs and family labour (imputed family factors).
The FADN does not gather data on the weight of the animals. Therefore only the costs and margins per head can be analysed. It should be taken into account that these head counts could be for animals of different breeds, weights and age categories.
Estimates for 2010 and 2011
The output, operating costs and gross margin (over operating costs) for 2011 and 2012 are estimated on the basis of beef price indices and input price indices. It is assumed that structures and beef production remain unchanged.
Income indicators
Income indicators of specialised beef farms are derived at the level of the whole farm. Therefore they incorporate the results of other activities that may be carried out on the farm. The following income indicators are studied in this report:
– Farm Net Value Added (FNVA) equals total output (total production value), plus direct payments minus intermediate consumption and depreciation. It represents the amount available to remunerate all fixed production factors (land, labour and capital), either owned by the farm or external. It is relatively comparable between Member States, but it gives only a partial picture of the farms’ results as not all costs are covered.
– Farm Net Income (FNI) equals FNVA minus external factors, plus the balance of subsidies and taxes on investment. It is the amount available to remunerate family factors (labour, land and capital).
– Remuneration of Family Labour (RFL) is calculated only for family farms.24 It equals FNI minus the opportunity cost for own capital. It represents the amount available to remunerate family labour. It can be used to compare income levels between different
23 Gross margin = beef revenues minus specific costs (such as feed and veterinary costs,) and other operating
costs (maintenance of machinery, energy, contract work, taxes on land and buildings, etc.). 24 For the purpose of this report, ‘family farms’ are defined as farms employing an unpaid labour force, which
usually corresponds to family labour.

EU beef farms report 2012
30
activities in agriculture, given that period under review is characterised by shared macroeconomic parameters.
These indicators are expressed per Annual Work Unit (AWU) for FNVA and FNI, or per Family Work Unit (FWU) for RFL, to take account of the differences in the labour force remunerated on the holding. All income indicators are calculated before deduction of income taxes and expressed in euro at its current value unless otherwise stated.
THE MODEL
Specific costs
Home-grown forage
One feature of FADN accounts is that they assign no value to the production of fodder areas in some countries (generally those in the north of the EU).25
In order to take into account the differences in data-gathering and to facilitate comparison between Member States, fodder production consumed on the farm is valued as equal to the cost of the inputs used to cultivate the fodder area.
The share of fodder crops in specific crop costs (seeds, fertilisers and crop protection) is estimated from the share of fodder area in the total area. As not all types of fodder crop benefit from the same inputs (e.g. there is no crop protection on temporary grassland), the area taken into account — both the forage part and the total area — depends on the input. This cost item is known as ‘specific forage costs’.
Livestock replacement/animal purchase costs
Since the FADN survey was conducted for 2000, the farm return has included a table giving details of the number and value of bovine animals sold and purchased. Nevertheless, in the first year following its introduction, this table was not completed by Ireland, Italy, Finland and Sweden. In the case of Greece, this table is missing for both 2000 and 2001. In Italy, from 2001 to 2005 only the total number and value of bovine animals were available. Therefore, the replacement costs of livestock in these MS are estimated from the total purchase value of bovine animals.
Method of allocating costs
Costs have to be estimated because FADN accounts, like many others, are not based on analytical accounts. This means that costs are not recorded separately for the various enterprises on the holding. The specific costs of crop products and animals are recorded separately (not by product, but by group of products) and all the other costs are recorded for the entire holding only.
It is therefore necessary to lay down rules for allocating the different costs recorded at farm level to each enterprise.
Costs are allocated to beef production on the basis of three criteria (see the table below):
25 This stems mainly from the difficulty of estimating forage production and value. Therefore, based on the
principle that forage production is just an input for animal production and that not recording it — neither on the crop output side, nor on the animal costs side — does not affect income, no effort is made to estimate it. In other countries, generally those where fodder production is more expensive, a value is allocated to production from the fodder areas. Even though this difference should not affect margins, it leads to biases when comparing costs between Member States.

EU beef farms report 2012
31
1. the proportion of livestock units (LU): for the livestock-specific costs (mainly feed);
2. the proportion of area: for the costs of forage produced on the farm; 3. the proportion of output and coupled direct payments (DP): for the other costs.
‘Beef cattle’ means all cattle except dairy cows and a share of total breeding heifers and young females equal to the proportion of suckler cows in the total number of cows (dairy cows, cull dairy cows and other cows).
COST ITEM ALLOCATION KEYS FOR BEEF PRODUCTION
Purchased feed for grazing livestock (concentrates and coarse fodder)
% of beef livestock units in the total grazing livestock units
Crops produced on the farm used for feed % of beef livestock units in the total livestock units
On-farm use of forage crops = ‘specific forage costs’
% of beef livestock units in the total grazing livestock units
Seed % of the total utilised agricultural area (UAA) under fodder crops and temporary grass — after exclusion of fallow land, areas leased to others, meadows and rough grazing
Fertilisers % of the total UAA under fodder crops, temporary grass and meadows — after exclusion of fallow land, areas leased to others and rough grazing
Crop protection % of the total UAA under fodder crops — after exclusion of fallow land, temporary grass, areas leased to others, meadows and rough grazing
Animal purchases
cattle under one year and male cattle
all females over one year
100 %
% of suckler cow livestock units in the total cow livestock units
Other specific livestock costs (e.g. veterinary costs)
% of beef livestock units in the total livestock units
All other costs (non-specific costs) % of beef output and DP in the total output and coupled DP
As ‘output and coupled DP’ is used to construct the scale, certain precautions must be taken to avoid problems with the estimates:
- output and coupled DP on beef and total production should be positive;
- beef output and DP should not be greater than total output and coupled DP.
Farms that do not meet these conditions are excluded from the sample.
EU beef farms report 2012
32
Margin and cost indicators
Coverage of costs
– Operating costs include:
– specific costs: purchased feed, home-grown feed, animals purchased and other specific livestock costs (such as veterinary costs);
– non-specific operating costs: maintenance of machinery and buildings, power (fuels and electricity), contract work, taxes and other dues, taxes on land and buildings, insurance for farm buildings and other direct costs.
Water can be considered as specific (for maize) or non-specific (for milk) depending on the product concerned.
– Depreciation
– External factors include:
– wages
– rent
– interest
– Imputed unpaid family factors include:
– family labour cost
– own capital cost (own land cost + estimated cost for own capital except land minus interest paid)
Own capital cost
– Own land cost: estimated on the basis of the rent that farm owners would have to pay if they had to rent the land they are using.
This is estimated as the owned area multiplied by the rent paid per hectare on the same farm or, if there is no rented land on the farm, by the average rent paid per hectare in the same region and for the same type of farming.26
– Cost of own capital (except land): the cost of own capital (permanent crops, buildings, machinery and equipment, forest land, livestock and crop stocks) is estimated at its ‘opportunity cost’, i.e. how much farmers could earn if they were to deposit the equivalent of the capital value in a bank.
26 If there are not enough farms (fewer than 20) in a given region for a given type of farming, the national rent per hectare for that type of farming is used (TF8). The TF8 classification is a standard grouping developed by the unit responsible for FADN within the Commission and consist of (1) Fieldcrops (2) Horticulture (3) Wine (4) Other permanent crops (5) Milk (6) Other grazing livestock, (7) Granivores, (8) Mixed. More information on standard grouping (including TF8) can be found here: http://ec.europa.eu/agriculture/rica/diffusion_en.cfm#sg

EU beef farms report 2012
33
The interest paid on the capital is not known, as this information is optional in the FADN farm returns. Nevertheless, to take into account the actual interest rate paid by a farm, a ‘weighted’ interest rate is calculated as the weighted average of this interest rate for debts, and the long-term (LT) interest rate, taken from the Global Insight database, for net worth. If the ‘weighted’ interest rate is lower than the LT interest rate (which means that the calculated rate of interest paid is lower than the LT interest rate), the LT interest rate is used instead of the ‘weighted’ interest rate.
Own capital value (excluding land and land improvement) is estimated as the average value of the assets (closing plus opening valuation divided by 2) multiplied by the real interest rate.27 The figure is adjusted by subtracting the inflation rate28 from the nominal interest rate. Where the inflation rate is higher than the interest rate, the real interest rate may be negative, leading to a negative cost of capital, which will add to profits (i.e. it is more profitable to invest in farm assets than to put the money in the bank). The total circulating capital is not valued because of the unreliability of this variable in some Member States. Nevertheless, the value of crop stocks is taken into account.
To calculate unpaid capital costs, we avoid double counting by deducting the interest paid from the sum of the own land cost and the cost for own capital except land:
Own capital costs = own land cost + estimated cost for own capital except land - interest paid
All margins are displayed with or without coupled payments. The decoupled payments are not attributed to products by definition. They are taken into account when studying income indicators.
Gross margin (over operating costs): Output – operating costs
Net margin (before own factors): Output – operating costs – depreciation – external factors
Net economic margin (after own factors): Output – total input (including imputed unpaid family factor costs)
27 Any increase in the value of assets is excluded from income calculations. For example, land appreciates in
value over time, which is one of the reasons why investors invest in land. This gain is not included in the income, so it would not be consistent to include it in the cost of capital. In addition, in the FADN, assets are valued at replacement value. Depreciation is based on this replacement value and therefore already takes any increase in prices (inflation) into account. Consequently, including the inflation part of interest in the cost of capital would constitute double counting.
28 The inflation rate is based on the Eurostat annual average rate of change in the Harmonised Indices of Consumer Prices (HICPs) — available from 1997. Inflation rates based on price indices for GDP and gross fixed capital consumption have been tested, but they are very high and tend to yield very high negative costs for capital, mainly in the EU-10. An inflation rate based on price indices for gross fixed capital consumption has been tested, as this seemed to be more closely related to assets. However, this rate has tended to fluctuate widely over the years in certain Member States. In addition, land is one of the main assets and does not depreciate. It follows that the inflation rate for gross fixed capital consumption must not be more closely linked to the change in the price of agricultural assets than to the consumer price indices.

Commission européenne, B-1049 Bruxelles / Europese Commissie, B-1049 Brussel — Belgium. Telephone: (32-2) 299 11 11.
ANNEX II — BASIC DATA AND INDICATORS
Table 1 Basic structural data, Breeders, Member States, 2009
Farms repres.
Sample farms
Av. Labour
in AWU
Family labour
%
Beef specia-lisation
% output
Average UAA —
ha
Forage crops — ha
of which
% perm. grass.
Stocking density
— LU/ha
Av. number
of suckler cows head
No of suckler cows per
AWU
Total beef cattle LU
Total LU on
the farm
Cattle < 1 year sold — head
Cattle 1-2
years sold — head
Cattle sold (incl.
fem. < 1 year)
— head
Selling price male cattle
— €/head
Cattle < 1 year + male1-2
year sold/ cow
Total cattle sold head
Total cattle sales €
Selling price cattle €/head
EU27 87 480 1 735 1.3 91 % 81 % 76 65 69 % 1.0 47 35 70 72 20 4.9 27 865 0.6 40 37 251 930
EU15 79 560 1 583 1.3 93 % 82 % 78 68 68 % 1.1 49 38 74 76 21 5.2 29 878 0.6 43 40 167 945
EU10 6 490 149 1.7 82 % 70 % 62 52 79 % 0.5 21 12 29 30 8 2.1 11 463 0.5 17 8 362 489
BE 3 310 112 1.4 99 % 84 % 59 48 78 % 2.0 55 38 97 97 19 7.4 28 1 157 0.5 53 68 838 1 311
CZ 760 51 2.7 53 % 70 % 179 159 98 % 0.5 54 20 72 74 29 1.4 31 431 0.6 47 22 423 475
DE 1 030 56 2.2 62 % 80 % 164 150 90 % 1.0 97 43 144 151 45 12.7 60 663 0.6 78 53 963 688
DK 1 140 25 0.7 98 % 68 % 37 24 31 % 1.6 24 37 38 38 12 1.3 14 885 0.6 21 18 036 861
EL 2 130 20 1.5 86 % 82 % 17 15 95 % 1.8 46 32 49 50 11 6.7 18 968 0.4 21 20 167 946
ES 8 620 189 1.3 93 % 84 % 91 78 89 % 0.8 55 42 71 73 31 4.0 38 819 0.7 44 35 461 807
FR 38 810 635 1.3 95 % 82 % 94 81 63 % 1.2 59 45 93 95 25 5.0 34 913 0.6 51 51 267 1 000
IE 7 050 68 1.1 97 % 85 % 43 42 97 % 0.9 25 22 36 39 9 3.2 14 627 0.6 26 18 156 701
IT 7 550 127 1.3 91 % 72 % 46 42 40 % 0.8 26 20 32 32 11 3.1 15 980 0.6 22 21 779 1 011
LU 120 26 1.2 97 % 75 % 72 59 81 % 1.4 54 45 85 85 25 4.9 30 906 0.6 51 47 499 930
LV 730 22 1.6 83 % 70 % 81 74 62 % 0.4 20 12 28 29 7 2.7 10 414 0.5 15 6 619 441
AT 1 100 26 1.4 96 % 69 % 52 48 92 % 0.6 24 17 32 33 14 2.1 16 868 0.7 21 18 169 874
PL 1 410 19 1.4 98 % 74 % 32 21 76 % 1.0 14 10 20 22 4 3.2 7 527 0.5 12 6 188 524
PT 3 850 157 1.4 87 % 79 % 59 37 49 % 0.6 23 16 27 28 11 0.8 15 507 0.7 18 8 854 502
FI 750 22 1.4 81 % 80 % 77 52 3 % 1.0 39 28 52 52 24 3.6 28 864 0.7 42 33 977 809
SE 870 33 1.1 93 % 71 % 86 72 41 % 0.8 35 32 59 59 12 8.5 21 671 0.6 38 27 159 716
SI 2 030 24 1.6 100 % 75 % 14 13 95 % 0.7 8 5 11 12 2 0.8 3 589 0.4 5 2 605 561
UK 2 620 83 1.4 89 % 79 % 101 94 81 % 1.2 67 48 105 112 10 25.5 38 840 0.6 66 54 170 820

EU beef farms report 2012
35
Table 2 Basic structural data, Breeders & Fatteners, Member States, 2009
Farms repres.
Sample farms
Av. Labour
in AWU
Family labour -
%
Beef specia- lisation
% output
Average UAA -
ha
Forage crops -
ha
of which
% perm. grass.
Stocking density -
LU/ha
Av. number
of suckler cow s head
No of suckler cow s per
AWU
Total beef cattle
LU
Total LU on
the farm
Cattle < 1 year sold - head
Cattle 1-2
years sold - head
Cattle sold (incl. fem. <
1 year) - head
Selling price male
cattle - €/head
Cattle < 1 year + male
1-2 year sold /
Total cattle sold head
Total cattle
sales €
Selling price cattle €/head
EU27 71 020 1 399 1.4 91% 79% 68 58 77% 1.1 35 26 64 67 15 13 36 897 1.0 49 45 342 921
EU15 62 580 1 223 1.3 92% 79% 72 62 78% 1.1 38 29 70 73 16 14 38 925 1.0 53 50 165 945
EU10 7 630 174 1.6 95% 70% 38 31 68% 0.7 11 7 21 22 4 6 12 576 1.0 15 8 642 567
BE 1 430 40 1.5 97% 77% 54 40 71% 2.8 51 34 110 115 7 36 53 1 859 1.0 83 148 438 1 795
CZ 620 39 1.9 80% 79% 104 95 98% 0.5 32 16 50 51 20 9 29 585 0.9 39 22 911 586
DK 650 19 0.9 74% 72% 57 34 24% 2.1 20 22 71 74 69 13 86 755 4.3 97 75 906 780
DE 1 860 76 1.6 81% 76% 89 78 89% 1.2 43 27 89 91 10 27 39 983 0.9 58 53 136 922
ES 12 080 207 1.2 93% 83% 83 72 94% 0.7 45 37 53 55 32 10 48 752 1.1 58 45 307 775
FR 10 290 182 1.5 92% 80% 95 80 64% 1.3 55 38 105 107 20 18 47 1 087 0.9 68 77 313 1 137
IE 15 720 152 1.2 96% 85% 50 48 95% 1.3 27 23 57 62 7 6 23 793 0.8 36 27 973 781
IT 7 230 117 1.4 93% 71% 34 28 41% 1.0 17 12 29 29 10 8 21 1 205 1.3 25 30 701 1 223
LU 100 22 1.2 92% 73% 72 55 77% 1.7 46 39 92 93 8 24 35 1 183 0.8 56 59 800 1 075
AT 680 18 1.3 100% 65% 35 31 79% 0.9 18 13 30 31 10 7 19 956 1.1 24 21 793 927
PL 2 280 32 1.7 98% 65% 26 17 70% 1.1 9 5 19 21 2 9 12 603 1.3 16 8 860 559
PT 3 060 105 1.6 86% 84% 96 74 70% 0.6 37 23 50 51 31 4 44 497 1.2 50 24 447 490
SE 1 410 64 1.2 89% 74% 103 87 40% 0.9 31 25 78 79 13 33 53 730 1.7 69 49 729 723
SI 2 050 58 1.5 99% 71% 13 12 91% 0.9 6 4 12 12 3 2 6 612 1.0 8 4 580 605
UK 6 060 191 1.5 85% 76% 115 101 78% 1.3 53 36 123 130 4 35 58 980 1.1 88 85 099 970

EU beef farms report 2012
36
Table 3 Basic structural data, Fatteners, Member States, 2009
FattenersFarms
representedSample farms
Av. Labour in
AWU
Family labour -
%
Beef specialisation - % output
Average UAA - ha
Forage crops -
ha
of which % permanent grassland
Stocking density -
LU/ha
Total beef
cattle - LU
Total LU on
the farm
Cattle (male &
female) < 1 year sold -
head
Male cattle 1-2
years sold - head
Male cattle sold (incl. fem. < 1 year) - head
Selling price male
cattle - €/head
Total cattle sold - head
Total cattle
sales - €
Selling price
cattle - €/head
EU27 20 190 468 1.3 90% 79% 47 29 57% 2.2 66 69 25 73 113 1 088 118 127 727 1 085
EU15 17 910 408 1.3 91% 80% 49 31 58% 2.1 70 74 28 78 122 1 101 128 140 309 1 098
EU10 2 150 58 1.5 92% 74% 25 12 31% 2.3 28 30 1 34 36 739 37 27 181 735
AT 1 140 34 1.1 99% 71% 30 15 40% 2.3 37 38 0 52 53 1 228 53 65 305 1 224
DE 3 250 105 1.3 95% 72% 48 27 29% 3.0 80 85 5 106 113 1 175 115 134 548 1 170
DK 350 15 1.1 76% 77% 75 27 24% 3.9 108 131 278 16 294 594 303 183 573 606
ES 3 530 47 1.1 96% 85% 40 24 80% 1.2 40 42 96 24 122 804 123 98 844 805
FI 1 230 28 1.3 86% 88% 62 34 0% 2.0 67 69 6 81 87 907 90 80 589 900
IE 4 100 39 1.1 95% 87% 43 41 96% 1.3 49 52 1 16 72 980 88 86 331 984
IT 1 750 66 2.1 82% 84% 51 21 11% 5.1 152 157 10 258 284 1 463 290 424 965 1 464
PL 800 25 1.8 99% 66% 23 8 49% 2.8 22 26 0 19 22 764 23 17 151 747
SE 800 22 1.3 95% 70% 92 56 40% 1.4 82 83 1 64 89 777 93 71 106 764
SI 120 17 1.8 95% 72% 22 14 64% 1.7 24 25 0 27 29 1 108 30 33 238 1 099
UK 870 24 1.5 83% 68% 95 55 70% 2.1 116 119 16 138 168 1 051 170 177 917 1 047

Commission européenne, B-1049 Bruxelles / Europese Commissie, B-1049 Brussel — Belgium. Telephone: (32-2) 299 11 11.
Table 4 Basic structural data, type of production, Member States, 2000-2009 (1st part) Breeders Breeders & Fatteners Fatteners
YEAR
No of
farms
repr.
Farms
in the
sample
Labour
Input -
Avg
UAA -
Avg
Livestock
Units -
Avg
Beef
Sales +
Stock
Change -
Avg
No of
farms
repr.
Farms
in the
sample
Labour
Input -
Avg
UAA -
Avg
Livestock
Units -
Avg
Beef
Sales +
Stock
Change -
Avg
No of
farms
repr.
Farms
in the
sample
Labour
Input -
Avg
UAA -
Avg
Livestock
Units -
Avg
Beef
Sales +
Stock
Change -
Avg
2000 3 960 85 1.4 49 100 64 028 1 030 27 1.5 49 111 101 103 . . . . . .
2001 3 390 79 1.4 48 99 48 720 1 440 34 1.4 48 108 75 978 . . . . . .
2002 3 190 84 1.4 51 97 53 391 1 240 38 1.5 56 132 114 267 . . . . . .
2003 3 440 91 1.3 53 94 65 725 1 040 35 1.6 65 152 159 439 . . . . . .
BE 2004 2 990 91 1.4 51 91 60 832 1 630 38 1.5 55 118 137 766 . . . . . .
2005 2 950 87 1.4 52 89 56 419 1 540 39 1.5 62 128 130 422 . . . . . .
2006 2 740 89 1.4 58 101 70 444 1 430 34 1.6 62 134 169 630 . . . . . .
2007 2 840 85 1.4 55 96 63 407 1 390 34 1.5 57 128 149 447 . . . . . .
2008 2 980 94 1.4 58 98 61 328 1 390 39 1.5 56 120 131 493 . . . . . .
2009 3 310 112 1.4 59 97 69 992 1 430 40 1.5 54 115 141 389 . . . . . .
2004 390 27 2.4 154 62 12 966 610 36 2.3 134 57 17 053 . . . . . .
2005 620 41 2.7 185 64 20 172 240 19 2.2 136 69 34 289 . . . . . .
CZ 2006 680 44 3.5 233 88 28 212 720 28 1.7 95 42 18 170 . . . . . .
2007 660 31 2.5 161 70 23 021 550 26 1.7 97 50 20 539 . . . . . .
2008 630 40 2.6 175 72 23 437 610 35 2.1 118 58 23 173 . . . . . .
2009 760 51 2.7 179 74 24 502 620 39 1.9 104 51 21 597 . . . . . .
2001 1 370 22 0.7 26 37 17 063 . . . . . . . . . . . .
2002 1 330 25 0.7 31 36 18 436 660 16 0.8 49 64 64 345 . . . . . .
2003 1 110 18 0.6 27 29 15 118 . . . . . . . . . . . .
2004 1 320 23 0.7 36 39 18 691 . . . . . . 540 15 1.1 69 67 97 830
DK 2005 1 570 21 0.6 24 35 19 521 . . . . . . 870 18 0.8 40 51 78 461
2006 1 170 17 0.6 29 36 30 948 . . . . . . 790 18 0.8 36 42 61 889
2007 770 15 0.6 26 35 19 852 . . . . . . . . . . . .
2008 1 020 20 0.6 30 41 20 302 600 15 0.7 42 56 69 490 480 15 0.9 52 73 132 521
2009 1 140 25 0.7 37 38 19 253 650 19 0.9 57 74 74 856 350 15 1.1 75 131 181 356
2000 470 18 3.1 201 193 78 227 850 22 1.9 91 115 62 340 2 000 37 1.5 56 106 125 525
2001 710 27 2.7 173 171 62 521 930 22 1.8 74 118 64 540 2 850 54 1.5 51 107 115 732
2002 930 35 2.1 140 128 40 933 1 050 33 1.8 67 106 62 881 2 090 58 1.5 54 98 120 374
2003 860 39 2.1 142 127 41 429 1 160 28 1.6 80 96 53 007 2 270 52 1.5 52 100 108 536
2004 1 190 52 2.0 139 115 44 420 1 400 41 1.6 73 84 58 841 2 870 72 1.5 54 95 121 649
DE 2005 1 050 48 2.1 158 128 53 769 1 380 46 1.7 90 100 65 133 2 390 80 1.4 55 90 134 256
2006 1 180 62 2.1 151 131 51 573 1 230 43 1.7 99 110 78 374 2 430 85 1.5 51 93 131 928
2007 960 54 2.2 168 155 65 231 1 350 48 1.5 85 90 53 035 1 990 78 1.4 55 102 155 524
2008 1 010 52 2.2 146 129 54 558 1 660 67 1.6 83 89 54 227 3 090 104 1.4 56 98 154 640
2009 1 030 56 2.2 164 151 59 374 1 860 76 1.6 89 91 56 036 3 250 105 1.3 48 85 133 600
2000 1 860 15 1.2 4 30 13 241 . . . . . . . . . . . .
EL 2004 2 080 17 1.4 5 40 15 662 . . . . . . . . . . . .
2008 2 000 19 1.2 10 37 16 134 . . . . . . . . . . . .
2009 2 130 20 1.5 17 50 17 574 . . . . . . . . . . . .
2000 20 060 253 1.3 48 29 15 356 10 930 132 1.2 67 39 22 888 3 770 31 1.2 45 36 92 788
2001 19 070 275 1.3 54 34 14 993 10 260 154 1.2 53 34 19 520 3 540 39 1.1 53 33 86 292
2002 15 950 233 1.3 75 40 19 883 18 540 148 1.2 27 25 17 522 2 040 41 1.2 49 49 133 071
2003 13 940 276 1.3 66 51 34 771 11 730 156 1.3 60 42 28 951 4 640 53 1.1 27 33 106 732
2004 20 380 265 1.3 56 43 25 121 12 670 170 1.2 61 42 28 184 3 590 44 1.4 39 65 200 881
ES 2005 21 480 344 1.3 59 49 30 715 12 770 153 1.1 41 30 23 176 5 040 49 1.1 27 44 107 082
2006 25 890 281 1.3 47 37 25 382 15 340 102 1.2 28 32 34 422 3 790 34 1.1 41 31 82 291
2007 17 910 323 1.4 65 53 40 075 16 300 128 1.1 31 25 21 010 7 340 46 1.3 30 20 62 768
2008 10 000 193 1.2 71 53 29 285 8 400 172 1.2 92 61 52 579 3 450 44 1.7 38 39 95 062
2009 8 620 189 1.3 91 73 38 732 12 080 207 1.2 83 55 41 570 3 530 47 1.1 40 42 96 835
2000 28 680 415 1.4 82 81 44 097 16 280 250 1.4 76 93 53 273 . . . . . .
2001 27 980 391 1.3 79 79 37 919 17 100 270 1.4 82 101 51 541 . . . . . .
2002 28 830 471 1.4 89 90 47 385 15 360 232 1.4 81 96 54 231 . . . . . .
2003 29 750 473 1.4 89 90 48 434 13 260 209 1.4 83 99 60 821 . . . . . .
2004 28 950 490 1.4 89 89 49 967 13 080 211 1.4 87 97 64 312 . . . . . .
FR 2005 32 020 529 1.3 88 88 54 320 12 060 229 1.5 92 102 74 485 . . . . . .
2006 35 550 552 1.3 93 91 55 941 14 110 223 1.4 89 98 77 912 . . . . . .
2007 33 570 555 1.3 93 94 55 811 11 470 195 1.4 100 108 82 912 . . . . . .
2008 36 260 591 1.3 93 95 54 614 10 940 188 1.5 93 104 75 256 . . . . . .
2009 38 810 635 1.3 94 95 53 531 10 290 182 1.5 95 107 74 448 . . . . . .
HU 2006 820 17 1.7 53 41 10 347 . . . . . . . . . . . .
2000 20 130 119 1.0 29 27 11 964 17 910 133 1.1 35 46 21 319 3 070 25 1.0 35 51 59 806
2001 16 190 92 1.0 30 27 9 797 21 060 149 1.1 33 41 16 783 3 640 26 0.9 27 36 31 749
2002 12 080 90 1.0 34 32 12 235 17 540 149 1.1 40 47 19 941 3 200 29 0.9 36 49 46 674
2003 14 420 108 1.0 32 31 11 964 21 370 178 1.1 39 47 18 778 3 980 34 0.8 32 44 38 307
2004 10 540 98 1.0 37 33 13 624 19 660 172 1.1 38 48 22 293 5 570 41 0.9 29 40 38 573
IE 2005 9 850 83 1.0 33 36 16 382 19 060 170 1.1 42 52 25 201 4 850 39 0.9 28 38 38 250
2006 8 130 78 1.0 43 38 17 762 17 740 170 1.1 45 53 27 182 5 040 45 0.9 32 41 39 655
2007 9 410 96 1.0 45 39 16 523 19 820 196 1.1 45 52 25 068 5 550 53 1.0 46 49 72 654
2008 9 400 97 1.1 48 45 21 976 18 190 184 1.1 47 55 31 217 5 040 48 1.0 36 42 61 189
2009 7 050 68 1.1 43 39 16 996 15 720 152 1.2 50 62 27 249 4 100 39 1.1 43 52 86 082
2000 9 190 297 1.3 30 25 14 145 5 050 149 1.6 25 31 26 983 2 320 77 1.7 17 61 133 581
2001 6 690 218 1.3 32 25 14 606 6 850 262 1.5 28 33 29 300 2 390 57 1.4 18 74 153 292
2002 5 440 189 1.3 38 33 18 508 6 190 259 1.5 31 33 28 400 2 410 74 1.7 29 119 296 398
2003 5 090 169 1.4 47 38 21 244 5 910 175 1.5 35 36 38 554 2 520 61 1.9 32 133 367 706
2004 6 960 172 1.4 40 34 18 123 7 970 200 1.4 37 34 30 821 3 680 66 1.7 32 144 378 488
IT 2005 7 870 188 1.3 38 32 21 105 6 840 203 1.5 31 31 35 148 3 250 85 1.7 29 124 363 587
2006 7 310 194 1.4 39 39 27 940 6 540 181 1.3 27 31 35 100 3 020 88 1.9 52 158 474 353
2007 7 220 187 1.4 42 33 24 034 5 390 165 1.5 29 32 33 006 3 030 96 1.6 37 135 425 675
2008 6 310 117 1.4 53 41 28 939 5 380 104 1.5 31 33 29 864 1 990 68 2.1 55 177 619 112
2009 7 550 127 1.3 46 32 22 207 7 230 117 1.4 34 29 30 066 1 750 66 2.1 51 157 419 406

EU beef farms report 2012
38
Table 4 Basic structural data, type of production, Member States, 2000-2009 (2nd part)
Breeders Breeders & Fatteners Fatteners
YEAR
No of
farms
repr.
Farms
in the
sample
Labour
Input -
Avg
UAA -
Avg
Livestock
Units -
Avg
Beef
Sales +
Stock
Change -
Avg
No of
farms
repr.
Farms
in the
sample
Labour
Input -
Avg
UAA -
Avg
Livestock
Units -
Avg
Beef
Sales +
Stock
Change -
Avg
No of
farms
repr.
Farms
in the
sample
Labour
Input -
Avg
UAA -
Avg
Livestock
Units -
Avg
Beef
Sales +
Stock
Change -
Avg
2000 160 24 1.3 64 80 39 289 . . . . . . . . . . . .
2001 190 32 1.2 60 76 32 327 80 16 1.4 79 115 84 445 . . . . . .
2002 170 40 1.2 66 82 34 918 100 24 1.3 69 97 57 176 . . . . . .
2003 170 36 1.2 71 77 40 087 110 25 1.3 72 95 58 496 . . . . . .
2004 170 38 1.2 68 78 40 706 80 21 1.2 81 99 66 035 . . . . . .
LU 2005 170 21 1.1 72 72 39 875 120 20 0.8 65 79 59 162 . . . . . .
2006 180 22 1.0 61 59 35 339 80 18 1.2 87 117 89 746 . . . . . .
2007 130 25 1.1 71 76 45 129 80 19 1.0 75 103 75 833 . . . . . .
2008 150 23 1.1 58 69 35 090 90 19 1.0 66 87 55 369 . . . . . .
2009 120 26 1.2 72 85 45 973 100 22 1.2 72 93 56 453 . . . . . .
LV 2009 730 22 1.6 81 29 8 089 . . . . . . . . . . . .
2002 720 15 1.4 45 33 15 339 . . . . . . 690 17 1.5 26 31 49 441
2003 . . . . . . . . . . . . . . . . . .
2004 . . . . . . . . . . . . 790 20 1.1 25 34 45 169
AT 2005 . . . . . . . . . . . . 1 030 25 1.1 27 31 47 401
2006 810 18 1.5 65 34 18 976 . . . . . . 900 22 1.1 27 34 56 752
2007 950 20 1.5 41 31 17 779 . . . . . . 1 000 26 1.2 25 34 51 608
2008 . . . . . . 730 19 1.4 45 32 24 038 1 020 28 1.1 27 33 64 050
2009 1 100 26 1.4 52 33 20 608 680 18 1.3 35 31 23 277 1 140 34 1.1 30 38 67 039
PL 2009 1 410 19 1.4 32 22 7 822 2 280 32 1.7 26 21 8 795 800 25 1.8 23 26 18 861
2000 3 320 91 1.3 56 27 9 098 3 260 41 1.8 33 14 9 424 . . . . . .
2001 4 100 105 1.3 65 27 9 018 2 810 58 1.5 36 19 12 508 . . . . . .
2002 4 270 98 1.4 56 23 11 166 3 120 61 1.4 39 23 16 250 . . . . . .
2003 3 870 86 1.4 41 19 7 842 3 790 74 1.5 59 23 12 372 . . . . . .
2004 3 560 106 1.3 52 26 9 711 2 270 58 1.3 60 30 16 230 . . . . . .
PT 2005 2 700 97 1.5 77 33 11 004 2 910 85 1.4 68 31 11 364 . . . . . .
2006 4 010 143 1.4 75 34 12 184 2 150 74 1.5 72 39 17 518 . . . . . .
2007 4 400 171 1.4 78 33 12 037 1 320 61 1.6 79 35 16 553 . . . . . .
2008 3 540 140 1.6 86 43 13 595 2 010 90 1.3 48 25 11 593 . . . . . .
2009 3 850 157 1.4 59 28 12 141 3 060 105 1.6 96 51 19 442 . . . . . .
2000 . . . . . . . . . . . . 1 600 27 1.4 44 42 44 106
2001 . . . . . . . . . . . . 2 130 29 1.5 45 46 46 693
2002 . . . . . . . . . . . . 1 430 24 1.6 53 61 64 497
2003 . . . . . . . . . . . . 1 060 22 1.6 56 66 68 703
2004 . . . . . . . . . . . . 1 090 21 1.4 50 62 59 844
FI 2005 . . . . . . . . . . . . 1 020 24 1.4 61 75 74 683
2006 . . . . . . 520 15 1.4 56 39 27 036 1 070 26 1.5 68 74 79 905
2007 600 15 1.3 56 39 22 322 600 15 1.7 73 54 38 643 1 010 30 1.9 73 86 93 506
2008 750 20 1.3 65 56 25 577 . . . . . . 840 25 1.5 62 71 82 646
2009 750 22 1.4 77 52 33 975 550 15 1.6 69 57 37 167 1 230 28 1.3 62 69 83 168
2000 990 24 1.0 85 55 24 960 1 390 33 1.2 66 51 26 137 . . . . . .
2001 . . . . . . 2 420 47 1.1 71 46 25 120 . . . . . .
2002 1 000 23 1.0 75 41 17 228 1 650 45 1.3 81 56 33 157 . . . . . .
2003 920 25 1.0 79 46 17 911 1 740 50 1.2 77 53 29 936 . . . . . .
2004 640 20 1.2 121 67 28 152 1 180 33 1.4 111 69 43 217 . . . . . .
SE 2005 520 16 1.1 84 61 31 372 990 31 1.3 114 72 48 411 . . . . . .
2006 1 350 44 1.2 84 53 29 271 950 40 1.3 103 70 48 079 650 17 1.3 109 71 67 680
2007 840 31 1.0 86 59 30 588 960 35 1.3 113 75 58 217 580 15 1.2 102 72 68 842
2008 800 33 1.0 95 63 36 945 1 270 47 1.2 90 70 58 279 590 17 1.3 95 75 79 651
2009 870 33 1.1 86 59 30 221 1 410 64 1.2 103 79 49 016 800 22 1.3 92 83 69 483
2004 . . . . . . 3 520 30 1.6 17 12 5 902 . . . . . .
2005 2 040 17 2.0 12 12 3 553 2 600 40 1.7 12 13 5 678 . . . . . .
SI 2006 1 240 17 1.7 17 13 3 369 3 450 61 1.7 13 12 6 112 . . . . . .
2007 1 120 19 1.6 15 14 5 049 2 720 41 1.4 15 12 7 293 . . . . . .
2008 . . . . . . 2 790 52 1.4 14 13 6 102 120 15 1.7 23 29 38 350
2009 2 030 24 1.6 14 12 3 247 2 050 58 1.5 13 12 5 658 120 17 1.8 22 25 32 813
2000 2 310 52 1.6 89 113 42 122 10 300 179 1.4 70 91 45 379 2 610 27 1.0 45 67 80 506
2001 1 620 34 1.5 103 112 49 380 7 450 160 1.5 86 108 58 126 1 570 23 1.3 70 76 95 917
2002 2 180 61 1.4 123 125 61 690 6 940 172 1.5 96 110 63 225 1 020 22 1.5 90 94 127 901
2003 2 030 64 1.3 99 112 46 213 7 850 212 1.4 87 111 61 760 980 26 1.2 84 103 112 882
2004 2 220 63 1.4 102 112 49 305 8 040 229 1.5 95 120 66 646 1 340 26 1.3 86 94 115 317
UK 2005 1 990 59 1.5 111 117 48 515 7 450 212 1.5 95 120 64 198 800 21 1.3 90 111 132 596
2006 1 370 47 1.5 109 112 64 855 6 880 216 1.4 99 124 71 357 520 16 1.3 78 113 143 660
2007 1 630 57 1.4 106 123 52 667 5 940 180 1.4 90 115 77 285 . . . . . .
2008 2 260 70 1.4 107 110 58 361 5 720 188 1.4 95 120 77 427 920 23 1.6 94 113 177 773
2009 2 620 83 1.4 101 112 55 914 6 060 191 1.5 115 130 85 664 870 24 1.5 95 119 188 461

EU beef farms report 2012
39
Table 5 Comparison of the basic indicators across agriculture, TF8 typology, EU-27, 2007-2009
TF8 Year (1) Fieldcrops (2) Horticulture (3) Wine
(4) Other
permanent crops (5) Milk
(6) Other grazing
livestock Breeders
Breeders &
Fatteners Fatteners (7) Granivores (8) Mixed
Total Utilised Agricultural Area-ha (SE025) 2007 41.5 4.8 13.8 8.5 37.3 49.4 72.4 55.1 40.8 19.4 29.6
Total livestock units-LU (SE080) 5.1 0.3 0.3 0.5 52.3 48.6 67.1 58.8 59.0 204.1 32.1
Stocking density-LU/ha (SE120) 0.9 1.1 0.9 0.6 1.7 1.0 1.0 1.1 1.8 1.1 1.2
Forage crops-ha (SE071) 4.2 0.4 0.6 0.6 29.7 43.7 63.4 49.2 29.2 3.4 11.8
Grazing livestock-LU (SE120N) 2.6 0.2 0.3 0.2 49.9 43.9 64.7 56.1 55.0 1.8 14.6
Total output-EURO (SE131) 53 387 143 573 73 726 29 539 97 297 47 272 47 157 44 328 76 146 187 954 49 700
Total intermediate consumption-EURO (SE275) 28 565 72 898 24 398 9 480 57 295 31 893 27 379 34 344 58 698 136 888 33 131
Total specific costs-EURO (SE281) 15 355 36 382 8 619 4 745 35 730 20 260 19 985 33 211 113 095 113 132 21 915
Total external factors-EURO (SE365) 9 256 30 228 15 462 5 074 10 925 5 400 7 041 5 769 6 630 17 642 6 580
Interest paid-EURO (SE380) 1 430 3 640 1 415 253 3 872 1 273 1 785 1 819 2 282 5 408 1 446
Balance subsidies & taxes on investments-EURO (SE405) 40 52- 301 42- 234- 133 545 307 185- 263- 20
Balance current subsidies & taxes-EURO (SE600) 11 730 1 351 2 483 2 531 15 966 16 164 24 952 22 310 27 533 7 351 8 920
Farm Net Value Added / AWU-EURO (SE425) 17 855 18 351 22 935 14 160 22 482 14 196 18 147 17 833 26 262 21 108 10 406
Total Utilised Agricultural Area-ha (SE025) 2008 43.0 4.9 14.4 8.9 38.5 53.2 76.7 64.2 46.8 18.3 30.1
Total livestock units-LU (SE080) 4.9 0.4 0.3 0.5 54.7 52.1 72.0 65.7 69.8 213.7 32.7
Stocking density-LU/ha (SE120) 0.9 1.1 0.8 0.6 1.7 1.0 1.0 1.1 2.1 1.0 1.2
Forage crops-ha (SE071) 4.6 0.4 0.6 0.6 30.8 46.9 67.0 56.0 31.0 3.4 12.0
Grazing livestock-LU (SE120N) 2.7 0.2 0.2 0.2 52.2 47.0 69.8 62.9 66.3 1.8 14.9
Total output-EURO (SE131) 54 133 154 402 78 793 30 622 101 496 50 791 49 510 52 254 99 023 186 629 50 958
Total intermediate consumption-EURO (SE275) 32 577 78 944 26 343 10 432 65 016 35 920 32 269 43 476 73 495 139 874 36 621
Total specific costs-EURO (SE281) 17 981 38 996 9 134 5 447 41 708 23 431 20 847 38 965 119 128 116 685 24 393
Total external factors-EURO (SE365) 9 801 34 404 16 654 5 817 12 073 5 943 8 433 6 548 9 637 17 400 7 307
Interest paid-EURO (SE380) 1 738 4 594 1 347 284 4 678 1 449 2 412 1 999 3 174 6 745 1 856
Balance subsidies & taxes on investments-EURO (SE405) 70 64 221 39- 77- 315 842 720 234 181 109
Balance current subsidies & taxes-EURO (SE600) 12 640 1 469 2 011 3 247 16 341 17 454 27 992 24 493 30 192 7 006 9 440
Farm Net Value Added / AWU-EURO (SE425) 18 099 19 176 24 413 14 478 21 648 15 293 16 326 17 275 29 794 21 137 10 324
Total Utilised Agricultural Area-ha (SE025) 2009 42.9 5.2 13.9 9.3 39.8 51.2 75.9 55.1 40.8 20.5 30.1
Total livestock units-LU (SE080) 4.8 0.3 0.3 0.5 57.1 50.4 71.6 67.0 69.0 213.7 32.5
Stocking density-LU/ha (SE120) 0.9 1.1 0.9 0.4 1.7 1.0 1.0 1.1 2.2 0.9 1.2
Forage crops-ha (SE071) 4.6 0.4 0.6 0.7 32.0 45.3 65.4 58.3 28.8 3.7 12.2
Grazing livestock-LU (SE120N) 2.5 0.2 0.2 0.2 54.5 45.4 69.0 62.9 66.3 1.8 15.2
Total output-EURO (SE131) 45 315 159 688 70 505 27 810 89 093 46 140 47 767 52 254 99 023 193 673 44 722
Total intermediate consumption-EURO (SE275) 30 428 84 567 24 853 10 109 61 660 32 882 30 734 43 476 73 495 135 934 32 825
Total specific costs-EURO (SE281) 17 161 42 727 8 507 5 209 38 705 21 120 20 266 36 783 102 826 110 198 21 571
Total external factors-EURO (SE365) 9 307 37 047 15 932 5 849 11 566 5 624 8 004 6 548 9 637 17 239 6 900
Interest paid-EURO (SE380) 1 571 4 817 1 202 257 4 136 1 287 2 271 1 999 3 174 6 100 1 607
Balance subsidies & taxes on investments-EURO (SE405) 186 185 275 19 662 750 1 217 720 234 347 252
Balance current subsidies & taxes-EURO (SE600) 12 790 1 831 2 038 3 248 16 809 16 897 27 984 24 493 30 192 7 598 9 493
Farm Net Value Added / AWU-EURO (SE425) 13 352 17 815 21 138 12 561 16 257 14 344 15 577 17 275 29 794 26 084 8 562

EU beef farms report 2012
40
Table 6 Change of basic indicators across agriculture, 2007=100 %, TF8 typology, EU-27, 2007-2009
TF8 Year (1) Fieldcrops (2) Horticulture (3) Wine
(4) Other
permanent crops (5) Milk
(6) Other grazing
livestock Breeders
Breeders &
Fatteners Fatteners (7) Granivores (8) Mixed
Total Utilised Agricultural Area-ha (SE025) 2008 104% 103% 105% 105% 103% 108% 106% 117% 115% 94% 102%
Total livestock units-LU (SE080) 96% 143% 82% 96% 105% 107% 107% 112% 118% 105% 102%
Stocking density-LU/ha (SE120) 98% 102% 92% 102% 101% 99% 103% 98% 114% 90% 101%
Forage crops-ha (SE071) 108% 106% 109% 100% 104% 107% 106% 114% 106% 100% 102%
Grazing livestock-LU (SE120N) 104% 125% 88% 100% 105% 107% 108% 112% 121% 99% 102%
Total output-EURO (SE131) 101% 108% 107% 104% 104% 107% 105% 118% 130% 99% 103%
Total intermediate consumption-EURO (SE275) 114% 108% 108% 110% 113% 113% 118% 127% 125% 102% 111%
Total specific costs-EURO (SE281) 117% 107% 106% 115% 117% 116% 104% 117% 105% 103% 111%
Total external factors-EURO (SE365) 106% 114% 108% 115% 111% 110% 120% 114% 145% 99% 111%
Interest paid-EURO (SE380) 122% 126% 95% 112% 121% 114% 135% 110% 139% 125% 128%
Balance subsidies & taxes on investments-EURO (SE405) 175% -123% 73% 93% 33% 237% 154% 234% -126% -69% 545%
Balance current subsidies & taxes-EURO (SE600) 108% 109% 81% 128% 102% 108% 112% 110% 110% 95% 106%
Farm Net Value Added / AWU-EURO (SE425) 101% 104% 106% 102% 96% 108% 90% 97% 113% 100% 99%
Total Utilised Agricultural Area-ha (SE025) 2009 103% 109% 101% 109% 107% 104% 105% 100% 100% 106% 102%
Total livestock units-LU (SE080) 95% 110% 91% 96% 109% 104% 107% 114% 117% 105% 101%
Stocking density-LU/ha (SE120) 95% 101% 100% 76% 101% 99% 105% 95% 117% 85% 101%
Forage crops-ha (SE071) 109% 123% 105% 123% 108% 104% 103% 118% 99% 110% 103%
Grazing livestock-LU (SE120N) 99% 113% 92% 105% 109% 103% 107% 112% 121% 102% 104%
Total output-EURO (SE131) 85% 111% 96% 94% 92% 98% 101% 118% 130% 103% 90%
Total intermediate consumption-EURO (SE275) 107% 116% 102% 107% 108% 103% 112% 127% 125% 99% 99%
Total specific costs-EURO (SE281) 112% 117% 99% 110% 108% 104% 101% 111% 91% 97% 98%
Total external factors-EURO (SE365) 101% 123% 103% 115% 106% 104% 114% 114% 145% 98% 105%
Interest paid-EURO (SE380) 110% 132% 85% 102% 107% 101% 127% 110% 139% 113% 111%
Balance subsidies & taxes on investments-EURO (SE405) 465% -356% 91% -45% -283% 564% 223% 234% -126% -132% 1260%
Balance current subsidies & taxes-EURO (SE600) 109% 136% 82% 128% 105% 105% 112% 110% 110% 103% 106%
Farm Net Value Added / AWU-EURO (SE425) 75% 97% 92% 89% 72% 101% 86% 97% 113% 124% 82%

EU beef farms report 2012
41
ANNEX III COMPARING TYPES OF PRODUCTION AND EU GROUPS
Table 7 Comparison of data, production type, EU-27, 2009
in €/Cow in €/Cattle sold in €/Cattle sold
2009 Breeders Breeders & Fatteners Fatteners
STRUCTURAL INFORMATION EU All EU15 EU10 EU All EU15 EU10 EU Al l EU15 EU10
Farms represented 87 480 79 560 6 490 71 020 62 580 7 630 20 190 17 910 2 150
Sample farms 1 735 1 583 149 1 399 1 223 174 468 408 58
Av. Labour in AWU 1.34 1.30 1.70 1.38 1.33 1.59 1.32 1.29 1.48
Family labour - % 91% 93% 82% 91% 92% 95% 90% 91% 92%
Beef specialisation - % output 81% 82% 70% 79% 79% 70% 79% 80% 74%Average UAA - ha 75.9 78.2 62.3 68.0 72.4 37.7 46.6 49.4 24.6
Forage crops - ha 65.4 67.6 51.5 58.3 62.3 30.5 28.8 30.9 12.2
of which % permanent grassland 69% 68% 79% 77% 78% 68% 57% 58% 31%
Stocking density - LU/ha 1.0 1.1 0.5 1.1 1.1 0.7 2.2 2.1 2.3
Av. num ber of suckler cows - head 46.80 49.14 20.77 35.48 38.08 11.30 0.10 0.09 0.16
Number of suckler cow s per AWU 34.93 37.80 12.22 25.71 28.63 7.11 0.08 0.07 0.11
Total beef cattle - LU 70 74 29 64 70 21 66 70 28
Total LU on the farm 72 76 30 67 73 22 69 74 30
Cattle (male & female) < 1 year sold - head 20 21 8 15 16 4 25 28 1
Male cattle 1-2 years sold - head 5 5 2 13 14 6 73 78 34
Male cattle sold (incl. fem. < 1 year) - head 27 29 11 36 38 12 113 122 36
Selling price male cattle - €/head 865 878 463 897 925 576 1 088 1 101 739
Cattle < 1 year + male 1-2 year sold / cow 0.6 0.6 0.5 1.0 1.0 1.0 1 127.4 1 360.0 227.2
Total cattle sold - head 40 43 17 49 53 15 118 128 37
Total cattle sales - € 37 251 40 167 8 362 45 342 50 165 8 642 127 727 140 309 27 181Selling price cattle - €/head 930 945 489 921 945 567 1 085 1 098 735
2009 EU All EU15 EU10 EU All EU15 EU10 EU All EU15 EU10
TOTAL BEEF OUTPUT 832 854 456 1 222 1 261 780 1 129 1 143 729
TOTAL BEEF COUPLED DP 172 176 103 131 136 89 38 39 9
of which suckler cow premium 155.2 161.0 43.9 101.5 106.4 32.6 0.0 0.0 0.0
of which special male premium 1 1 6 7 7 23 17 17 9
of which slaughter premium 6 6 1 8 9 2 5 6 0
of which extensification premium 1 1 0 0 0 0 0 0 0of which other DP (incl. National DP) 9 7 52 14 13 31 15 16 0
Feed 296 302 168 418 429 290 275 273 280
of which purchased feed 178 183 59 277 286 109 204 203 174
of which home-grown feed 118 119 109 141 143 182 71 70 106
Animal purchase 65 67 34 247 257 122 567 580 248
Other specific costs 72 74 43 82 85 42 32 32 11
Specific costs 433 443 245 747 772 455 873 885 539Machinery and building upkeep 86 87 92 91 92 128 35 35 30
Energy (fuel, electricity) 58 57 118 71 70 140 36 35 54
Contract w ork 63.6 64.9 48.0 79.5 82.7 41.2 34.9 35.6 18.5
Taxes (exc. milk levy) 13 13 10 12 13 11 6 6 3
Other direct inputs (incl. w ater, insurance on farm buildings) 111 113 77 104 107 73 39 40 20
Non specific costs 331 335 345 358 365 394 151 151 125
Total operating costs 764 778 590 1 105 1 137 849 1 024 1 037 664
Gross margin 67 76 -135 117 124 -69 104 107 65
Gross margin with CP 239 252 -32 248 260 19 142 145 73
* CP: coupled payments
Depreciation 238 241 226 218 220 306 86 86 89
Wages 25 23 78 40 39 41 15 14 18
Rent 74 76 36 71 74 39 27 28 15
Interest 39 40 24 42 44 24 20 20 5External factors 138 140 138 153 157 104 62 62 38
Net margin (before own factors) -309 -305 -498 -255 -253 -479 -44 -41 -63
Net margin (before own factors) with CP* -137 -128 -395 -123 -117 -390 -6 -3 -54
* CP: coupled payments
Family labour costs 370 373 384 494 501 614 155 155 165
Ow n capital unpaid cost 144 142 237 211 214 251 75 74 83
Imputed fam ily factors 514 515 621 705 715 865 230 230 248
Total economic costs 1 654 1 673 1 575 2 182 2 229 2 123 1 403 1 414 1 039
Net economic margin (after own factors) -822 -820 -1 119 -960 -968 -1 344 -274 -271 -310
Net economic margin (after own factors) with CP* -651 -643 -1 017 -829 -832 -1 255 -236 -232 -302
ASSETS in €/Cow in €/Male cattle sold (nom inal) in €/Male cattle sold (nominal)
2009 EU All EU15 EU10 EU All EU15 EU10 EU All EU15 EU10
Fixed assets 6 638 6 616 9 424 13 004 13 336 11 826 4 993 5 066 3 232Current assets 1 741 1 764 1 439 2 149 2 210 1 811 1 295 1 301 922Total assets 8 380 8 379 10 862 15 153 15 546 13 638 6 287 6 367 4 153
INCOME per AWU in €/AWU
2009 EU All EU15 EU10 EU All EU15 EU10 EU All EU15 EU10
Total output 35 647 39 050 11 958 36 485 41 307 10 072 64 871 72 027 18 159
Intermediate consumptions 30 734 33 334 13 181 30 310 34 109 10 024 51 083 56 453 15 329
Balance of subsidies and taxes 20 883 22 243 13 211 17 716 19 696 7 960 24 301 26 894 6 657
of w hich LFA/AWU 2 364 2 425 2 386 1 633 1 699 1 542 1 453 1 627 352
of w hich environmental/AWU 2 565 2 539 3 452 2 145 2 283 1 665 1 757 1 973 368
Gross Farm Income (GFI) 25 796 27 959 11 988 23 892 26 894 8 008 38 089 42 468 9 487
Depreciation 10 220 11 158 3 799 7 287 8 122 3 099 9 529 10 541 2 975Farm Net Value Added (FNVA) 15 577 16 801 8 190 16 605 18 772 4 909 28 560 31 927 6 512
Wages 1 130 1 125 1 377 1 334 1 479 362 1 674 1 758 493
Rent 3 149 3 499 615 2 333 2 692 360 3 041 3 434 510
Interest 1 695 1 877 406 1 393 1 604 247 2 084 2 378 185
External factors 5 973 6 502 2 398 5 061 5 775 970 6 799 7 570 1 188
Balance of subsidies and taxes on investment 908 924 986 1 016 1 096 690 232 125 1 040Farm net incom e (FNI) 10 512 11 224 6 777 12 560 14 093 4 629 21 993 24 481 6 364
Family labour costs 15 855 17 252 6 232 16 075 17 976 6 408 17 048 18 856 5 833
Ow n capital unpaid cost 6 088 6 461 3 877 6 755 7 555 2 574 8 163 9 023 2 628
Imputed family factors 21 943 23 713 10 110 22 830 25 531 8 982 25 210 27 879 8 462
Family farms only in EUR/FWU (nominal) in EUR/FWU (nominal) in EUR/FWU (nominal)
Ow n capital unpaid cost 6 656 6 947 4 693 7 473 8 238 2 722 9 015 9 839 2 863Remuneration of Family Labour (RFL) 4 829 5 067 3 139 6 374 7 094 2 081 15 308 16 854 4 069

EU beef farms report 2012
42
Table 8 Operating costs and their main components, EU 15, type of production, 2000-2011
Breeders 2000 2001 2002 2003 2004 2005 2006 2007 2008 2009 2010e 2011e
Share of cost category in Total costs
Specific costs 60% 59% 58% 61% 60% 59% 58% 60% 57% 57% 57% 59%
Feed 38% 40% 39% 39% 40% 39% 39% 41% 39% 39% 40% 42%
Animal purchase 11% 7% 10% 13% 12% 11% 10% 11% 8% 9% 8% 8%
Non specific costs 40% 41% 42% 39% 40% 41% 42% 40% 43% 43% 43% 41%
Statistics Min Max Avegare Median Variation
Specific costs 57% 61% 59% 59% 0.02%
Feed 38% 42% 40% 39% 0.01%
Animal purchase 7% 13% 10% 10% 0.03%
Non specific costs 39% 43% 41% 41% 0.02%
Breeders & Fatteners 2000 2001 2002 2003 2004 2005 2006 2007 2008 2009 2010e 2011e
Share of cost category in Total costs
Specific costs 69% 67% 68% 70% 70% 68% 70% 68% 69% 68% 68% 70%
Feed 35% 36% 35% 36% 36% 34% 33% 36% 40% 38% 39% 41%
Animal purchase 25% 22% 25% 26% 26% 26% 30% 25% 22% 23% 22% 22%
Non specific costs 31% 33% 32% 30% 30% 32% 30% 32% 31% 32% 32% 30%
Statistics Min Max Avegare Median Variation
Specific costs 67% 70% 69% 68% 0.01%
Feed 33% 41% 37% 36% 0.05%
Animal purchase 22% 30% 24% 25% 0.05%
Non specific costs 30% 33% 31% 32% 0.01%
Fatteners 2000 2001 2002 2003 2004 2005 2006 2007 2008 2009 2010e 2011e
Share of cost category in Total costs
Specific costs 88% 86% 88% 90% 90% 89% 89% 89% 87% 85% 86% 87%
Feed 28% 29% 28% 29% 25% 27% 24% 26% 26% 26% 27% 28%
Animal purchase 56% 54% 56% 59% 63% 59% 62% 61% 58% 56% 56% 56%
Non specific costs 12% 14% 12% 10% 10% 11% 11% 11% 13% 15% 14% 13%
Statistics Min Max Avegare Median Variation
Specific costs 85% 90% 88% 88% 0.03%
Feed 24% 29% 27% 27% 0.02%
Animal purchase 54% 63% 58% 57% 0.07%
Non specific costs 10% 15% 12% 12% 0.03%
Share of feed in total costs EU-15 2000 2001 2002 2003 2004 2005 2006 2007 2008 2009 2010e 2011e
Breeders 38% 40% 39% 39% 40% 39% 39% 41% 39% 39% 40% 42%
Breeders & Fatteners 35% 36% 35% 36% 36% 34% 33% 36% 40% 38% 39% 41%
Fatteners 28% 29% 28% 29% 25% 27% 24% 26% 26% 26% 27% 28%
Share of animal purchase in total costs EU-15 2000 2001 2002 2003 2004 2005 2006 2007 2008 2009 2010e 2011e
Breeders 11% 7% 10% 13% 12% 11% 10% 11% 8% 9% 8% 8%
Breeders & Fatteners 25% 22% 25% 26% 26% 26% 30% 25% 22% 23% 22% 22%
Fatteners 56% 54% 56% 59% 63% 59% 62% 61% 58% 56% 56% 56%

EU beef farms report 2012
43
Table 9 Operating costs and their main components, EU 10, type of production, 2000-2011
Breeders 2004 2005 2006 2007 2008 2009 2010e 2011e
Share of cost category in Total costs
Specific costs 29% 38% 37% 40% 45% 42% 44% 46%
Feed 10% 22% 21% 23% 30% 28% 31% 35%
Animal purchase 10% 7% 8% 10% 7% 6% 6% 6%
Non specific costs 71% 62% 63% 60% 55% 58% 56% 54%
Statistics Min Max Avegare Median Variation
Specific costs 29% 46% 40% 41% 0.28%
Feed 10% 35% 25% 26% 0.54%
Animal purchase 6% 10% 7% 7% 0.03%
Non specific costs 54% 71% 60% 59% 0.28%
Breeders & Fatteners 2004 2005 2006 2007 2008 2009 2010e 2011e
Share of cost category in Total costs 2004 2005 2006 2007 2008 2009 2010e 2011e
Specific costs 49% 53% 54% 51% 46% 54% 56% 58%
Feed 17% 28% 23% 21% 30% 34% 37% 40%
Animal purchase 20% 19% 26% 21% 10% 14% 14% 14%
Non specific costs 51% 47% 46% 49% 54% 46% 44% 42%
Statistics Min Max Avegare Median Variation
Specific costs 46% 58% 52% 53% 0.12%
Feed 17% 40% 29% 29% 0.58%
Animal purchase 10% 26% 17% 17% 0.25%
Non specific costs 42% 54% 48% 47% 0.12%
Fatteners 2004 2005 2006 2007 2008 2009 2010e 2011e
Share of cost category in Total costs 2004 2005 2006 2007 2008 2009 2010e 2011e
Specific costs 67% 74% 76% 80% 80% 81% 82% 83%
Feed 45% 32% 41% 41% 40% 42% 45% 47%
Animal purchase 18% 38% 34% 37% 37% 37% 35% 34%
Non specific costs 33% 26% 24% 20% 20% 19% 18% 17%
Statistics Min Max Avegare Median Variation
Specific costs 67% 83% 78% 80% 0.25%
Feed 32% 47% 42% 42% 0.18%
Animal purchase 18% 38% 34% 36% 0.38%
Non specific costs 17% 33% 22% 20% 0.25%
Share of feed in total costs EU-10 2004 2005 2006 2007 2008 2009 2010e 2011e
Breeders 10% 22% 21% 23% 30% 28% 31% 35%
Breeders & Fatteners 17% 28% 23% 21% 30% 34% 37% 40%
Fatteners 45% 32% 41% 41% 40% 42% 45% 47%
Share of animal purchase in total costs EU-10 2004 2005 2006 2007 2008 2009 2010e 2011e
Breeders 10% 7% 8% 10% 7% 6% 6% 6%
Breeders & Fatteners 20% 19% 26% 21% 10% 14% 14% 14%
Fatteners 18% 38% 34% 37% 37% 37% 35% 34%

EU beef farms report 2012
44
Table 10 Gross Margin, EU groups, type of production, 2000-2011
Gross marginEU-All in €/cow for B, in €/cattle sold for B&F and FGross margin EU-All 2000 2001 2002 2003 2004 2005 2006 2007 2008 2009 2010e 2011e
Breeders 198 124 169 141 121 178 176 137 61 67 40 46
Breeders with CP 477 429 525 500 467 450 354 303 241 239 211 218
Breeders & Fatteners 175 146 136 125 126 163 180 153 115 117 74 88
Breeders & Fatteners with CP 525 559 574 571 575 378 307 279 253 248 205 219
Fatteners 71 17 59 25 108 81 101 94 148 104 37 31
Fatteners w ith CP 211 212 256 235 283 156 139 131 176 142 74 69* CP: coupled payments e: estimate
EU-15 in €/cow for B, in €/cattle sold for B&F and FGross margin EU-15 2000 2001 2002 2003 2004 2005 2006 2007 2008 2009 2010e 2011e
Breeders 198 124 169 141 123 183 187 142 67 76 49 56
Breeders with CP 477 429 525 500 470 456 366 311 249 252 225 232
Breeders & Fatteners 175 146 136 125 133 165 188 157 125 124 82 96
Breeders & Fatteners with CP 525 559 574 571 591 379 312 285 265 260 218 232
Fatteners 71 17 59 25 109 80 101 96 153 107 40 34
Fatteners w ith CP 211 212 256 235 284 155 138 133 182 145 79 73* CP: coupled payments e: estimate
EU-10 in €/cow for B, in €/cattle sold for B&F and FGross margin EU-10 2004 2005 2006 2007 2008 2009 2010e 2011e
Breeders -78 -22 -182 -95 -145 -135 -175 -184
Breeders with CP 168 153 -23 -33 -54 -32 -72 -81
Breeders & Fatteners -71 49 -80 40 -128 -69 -131 -136
Breeders & Fatteners with CP 114 316 139 102 -20 19 -42 -47
Fatteners -34 201 160 80 210 65 -17 -13
Fatteners w ith CP 172 332 286 134 242 73 -3 1
* CP: coupled payments e: estimate
Table 11 Income, EU groups, type of production, 2000-2011
INCOME per AWU
EU-All in €/AWU (nominal)Breeders EU-All 2000 2001 2002 2003 2004 2005 2006 2007 2008 2009
Farm Net Value Added 13 816 14 170 18 947 19 242 16 045 18 818 18 980 18 147 16 326 15 577Farm net income 10 281 10 812 14 869 14 612 11 649 14 403 14 528 13 262 10 576 10 512Remuneration of Family Labour 7 135 7 704 11 837 12 629 9 021 11 888 12 554 10 051 9 399 4 829
Breeders & Fatteners EU-All 2000 2001 2002 2003 2004 2005 2006 2007 2008 2009Farm Net Value Added 13 514 15 815 16 940 18 028 17 475 17 942 17 992 17 833 17 275 16 605
Farm net income 9 471 11 441 12 808 13 796 13 436 13 652 13 405 13 532 12 893 12 560Remuneration of Family Labour 4 737 7 082 9 065 9 928 9 322 10 288 10 097 9 674 10 646 6 374
Fatteners EU-All 2000 2001 2002 2003 2004 2005 2006 2007 2008 2009
Farm Net Value Added 18 652 19 988 26 719 25 224 30 835 26 892 29 713 26 262 29 794 28 560Farm net income 13 354 14 157 20 026 18 803 24 852 21 639 22 793 21 020 23 125 21 993Remuneration of Family Labour 8 641 9 918 15 498 15 626 21 910 18 973 19 764 17 829 23 379 15 308
EU-15 in €/AWU (nominal)Breeders EU-15 2000 2001 2002 2003 2004 2005 2006 2007 2008 2009Farm Net Value Added (FNVA) 13 816 14 170 18 947 19 242 16 702 19 685 19 898 18 676 16 782 16 801Farm net income (FNI) 10 281 10 812 14 869 14 612 12 088 15 061 15 310 13 651 10 799 11 224
Remuneration of Family Labour (RFL) 7 135 7 704 11 837 12 629 9 285 12 331 13 073 10 138 9 455 5 067
Breeders & Fatteners EU-15 2000 2001 2002 2003 2004 2005 2006 2007 2008 2009
Farm Net Value Added (FNVA) 13 514 15 815 16 940 18 028 18 865 18 915 19 443 18 875 18 835 18 772Farm net income (FNI) 9 471 11 441 12 808 13 796 14 453 14 367 14 473 14 211 13 951 14 093Remuneration of Family Labour (RFL) 4 737 7 082 9 065 9 928 9 914 10 871 10 890 9 992 11 237 7 094
Fatteners EU-15 2000 2001 2002 2003 2004 2005 2006 2007 2008 2009Farm Net Value Added (FNVA) 18 652 19 988 26 719 25 224 32 436 27 418 30 378 26 918 32 263 31 927
Farm net income (FNI) 13 354 14 157 20 026 18 803 26 106 22 036 23 087 21 596 25 223 24 481Remuneration of Family Labour (RFL) 8 641 9 918 15 498 15 626 22 970 19 463 19 972 18 209 24 117 16 854
EU-10
Breeders EU-10 2004 2005 2006 2007 2008 2009
Farm Net Value Added (FNVA) 4 220 6 299 7 507 10 904 9 627 8 190Farm net income (FNI) 3 846 4 895 4 723 7 946 7 201 6 777Remuneration of Family Labour (RFL) 3 545 4 768 3 753 9 249 8 495 3 139
Breeders & Fatteners EU-10 2004 2005 2006 2007 2008 2009Farm Net Value Added (FNVA) 2 818 4 128 4 122 7 183 6 478 4 909
Farm net income (FNI) 2 725 3 493 3 192 6 738 5 723 4 629Remuneration of Family Labour (RFL) 2 380 2 453 2 316 6 378 6 533 2 081
Fatteners EU-10 2004 2005 2006 2007 2008 2009Farm Net Value Added (FNVA) 2 498 7 063 6 060 3 498 6 680 6 512Farm net income (FNI) 2 664 6 439 12 991 2 817 6 685 6 364Remuneration of Family Labour (RFL) 2 138 5 278 12 092 2 020 6 691 4 069

EU beef farms report 2012
45
ANNEX IV DETAILED DATA ON BREEDERS
Table 12 Breeders, EU-all, 2000-2011-EU-AllSTRUCTURAL INFORMATION
Breeders 2000 2001 2002 2003 2004 2005 2006 2007 2008 20092009/ 2000
Farms represented 93 120 85 070 77 670 78 510 85 980 89 880 95 910 86 800 81 490 87 480 -6%
Sample farms 1 420 1 320 1 384 1 427 1 502 1 618 1 675 1 730 1 589 1 735
Av. Labour in AWU 1.28 1.25 1.30 1.29 1.32 1.31 1.32 1.33 1.32 1.34 5%
Family labour - % 95% 96% 95% 94% 92% 92% 92% 92% 90% 91% -4%
Beef specialisation - % output 83% 81% 81% 83% 82% 83% 83% 83% 81% 81% -1%
Average UAA - ha 53.9 56.4 69.2 65.2 63.0 65.5 68.4 72.4 76.7 75.9 41%
Forage crops - ha 47.7 49.9 61.6 57.9 55.8 56.1 58.6 63.4 67.0 65.4 37%
of which % permanent grassland 77% 76% 78% 72% 72% 71% 72% 72% 72% 69% -10%
Stocking density - LU/ha 1.0 1.0 0.9 1.0 1.0 1.0 1.0 1.0 1.0 1.0 5%
Av. number of suckler cows - head 35.5 36.1 41.5 42.9 40.8 43.1 42.3 46.5 47.4 46.8 32%
Number of suckler cow s per AWU 27.7 28.9 32.0 33.2 30.9 32.9 32.0 35.0 35.9 34.9 26%
Total beef cattle - LU 49 51 60 61 58 60 60 65 70 70 42%
Total LU on the farm 51 52 62 63 60 62 62 67 72 72 41%
Cattle (male & female) < 1 year sold - head 12 15 18 18 16 19 19 21 20 20 66%
Male cattle 1-2 years sold - head 3 4 4 4 4 4 3 3 5 5 56%
Male cattle sold (incl. fem. < 1 year) - head 18 22 25 26 24 26 25 27 27 27 52%
Selling price male cattle - €/head 746 626 726 767 761 800 888 871 843 865 16%
Cattle < 1 year + male 1-2 year sold / cow 0.5 0.6 0.6 0.6 0.6 0.6 0.6 0.6 0.6 0.6 15%
Total cattle sold - head 25 30 36 40 36 37 36 39 40 40 61%
Total cattle sales - € 20 380 21 123 27 596 32 428 29 184 32 335 34 033 36 898 36 686 37 251 83%
Selling price cattle - €/head 817 698 765 817 822 864 944 937 918 930 14%
OUTPUT AND COSTS in €/Cow
Breeders 2000 2001 2002 2003 2004 2005 2006 2007 2008 2009 2009/ 2000 2010e 2011e 2010 /2009 2011 /2009
TOTAL BEEF OUTPUT 746 658 746 798 792 840 879 855 841 832 11% 842 917 1% 10%
TOTAL BEEF COUPLED DP 279 305 356 360 346 271 178 166 179 172 -38% 172 172 0% 0%
of which suckler cow premium 179 198 219 218 206 160 160 153 159 155 -13% 155.2 155.2 0% 0%
of which special male premium 34 38 47 43 41 31 1 1 1 1 -97% 1 1 0% 0%
of which slaughter premium 8 15 25 26 27 22 7 7 7 6 -25% 6 6 0% 0%
of which extensification premium 43 47 51 52 51 35 1 1 1 1 -98% 1 1 0% 0%
of which other DP (incl. National DP) 14 7 14 21 21 23 10 5 12 9 -41% 9 9 0% 0%
Feed 211 216 224 258 266 258 274 290 304 296 40% 321 366 8% 24%
of which purchased feed 123 127 134 165 174 166 176 190 189 178 45% 207 234 16% 32%
of which home-grown feed 88 89 90 93 93 92 98 100 115 118 34% 113 132 -4% 12%
Animal purchase 58 38 56 83 79 74 71 77 61 65 13% 64 67 -2% 3%
Other specific costs 59 60 56 58 58 58 60 63 74 72 22% 74 75 2% 5%
Specific costs 328 314 336 399 403 390 405 430 440 433 32% 458 509 6% 17%Machinery and building upkeep 61 60 66 72 75 72 81 76 85 86 41% 88 91 3% 5%
Energy (fuel, electricity) 39 39 34 39 44 49 55 52 69 58 50% 68 78 16% 34%
Contract w ork 44 42 45 46 48 50 51 52 63 64 46% 63.8 65.7 0% 3%
Taxes (exc. milk levy) 9 10 10 10 11 11 12 11 12 13 36% 13 13 2% 4%Other direct inputs (incl. w ater, insurance on farm buildings)
68 69 87 91 90 90 100 98 111 11164%
111 114 0% 3%
Non specific costs 221 220 241 258 268 272 298 289 340 331 50% 344 362 4% 9%
Total operating costs 548 534 577 657 671 662 703 718 780 764 39% 802 871 5% 14%
Gross margin (over operating costs) 198 124 169 141 121 178 176 137 61 67 -66% 40 46 -41% -31%Gross margin (over operating costs) w ith CP* 477 429 525 500 467 450 354 303 241 239 -50% 211 218 0 0
* CP: coupled payments e: estimate
Depreciation 152 145 157 166 178 184 204 206 233 238 56%
Wages 22 16 17 25 29 26 23 27 29 25 17%
Rent 54 55 62 65 64 63 71 66 74 74 36%
Interest 34 32 31 32 31 30 31 32 41 39 14%
External factors 110 103 110 122 124 119 125 125 144 138 26%
Net margin (before own factors) -64 -124 -98 -147 -180 -125 -153 -194 -315 -309 380%
Net margin (before own factors) w ith CP* 214 181 258 213 165 147 25 -27 -136 -137 -164%
* CP: coupled payments
Family labour costs 427 407 354 364 391 363 392 364 363 370 -13%
Ow n capital unpaid cost 108 99 97 76 97 86 71 89 39 144 33%
Imputed family factors 535 507 451 440 488 449 463 453 402 514 -4%
Total economic costs 1 345 1 288 1 295 1 385 1 460 1 414 1 496 1 502 1 558 1 654 23%
Net economic margin (after ow n factors) -599 -630 -549 -587 -668 -573 -616 -647 -717 -822 37%
Net economic margin (after ow n factors) w ith CP* -320 -325 -193 -228 -322 -302 -438 -480 -537 -651 103%
ASSETS in €/Cow
Breeders 2000 2001 2002 2003 2004 2005 2006 2007 2008 2009 2009/ 2000
Fixed assets 5 291 5 056 5 134 5 073 5 827 5 945 6 095 6 320 7 026 6 638 25%
Current assets 1 303 1 326 1 409 1 352 1 419 1 626 1 968 1 840 1 749 1 741 34%
Total assets 6 593 6 382 6 543 6 425 7 246 7 571 8 063 8 159 8 775 8 380 27%
INCOME per AWU in €/AWU (nominal)
Breeders 2000 2001 2002 2003 2004 2005 2006 2007 2008 2009 2009/ 2000
Total output 24 511 23 472 28 717 30 413 28 939 32 042 33 920 35 456 37 508 35 647 45%
Intermediate consumptions 16 982 18 040 20 913 23 575 23 006 23 942 25 460 27 379 32 269 30 734 81%
Balance of subsidies and taxes 11 458 14 003 17 407 19 171 16 829 18 083 18 460 18 761 21 206 20 883 82%
of w hich LFA/AWU 1 021 1 631 1 854 1 891 1 851 1 951 1 970 2 114 2 414 2 364 131%
of w hich environmental/AWU 1 317 1 341 1 749 2 209 1 933 2 120 2 296 2 125 2 534 2 565 95%
Gross Farm Income (GFI) 18 988 19 435 25 210 26 009 22 761 26 183 26 920 26 838 26 445 25 796 36%
Depreciation 5 171 5 265 6 264 6 768 6 716 7 365 7 940 8 691 10 118 10 220 98%
Farm Net Value Added (FNVA) 13 816 14 170 18 947 19 242 16 045 18 818 18 980 18 147 16 326 15 577 13%
Wages 750 608 734 1 017 1 133 1 079 944 1 168 1 340 1 130 51%
Rent 1 833 1 958 2 435 2 613 2 393 2 514 2 738 2 785 3 222 3 149 72%
Interest 1 155 1 159 1 257 1 318 1 172 1 210 1 211 1 342 1 827 1 695 47%
External factors 3 738 3 725 4 426 4 948 4 699 4 803 4 893 5 294 6 389 5 973 60%
Balance of subsidies and taxes on investment 203 367 348 318 303 388 441 410 638 908 348%
Farm net income (FNI) 10 281 10 812 14 869 14 612 11 649 14 403 14 528 13 262 10 576 10 512 2%
Family labour costs 14 153 14 313 13 816 14 403 14 504 14 312 15 105 15 371 15 956 15 855 12%
Ow n capital unpaid cost 3 531 3 443 3 727 2 969 3 496 3 291 2 761 3 703 1 716 6 088 72%
Imputed family factors 17 683 17 756 17 542 17 373 18 000 17 603 17 866 19 073 17 672 21 943 24%
Family farms only in EUR/FWU (nominal)
Ow n capital unpaid cost 3 713 3 613 3 960 3 178 3 781 3 555 2 979 4 025 1 891 6 656 79%

EU beef farms report 2012
46
Table 13 Breeders, EU-15, 2000-2011
EU-15STRUCTURAL INFORMATION
Breeders 2000 2001 2002 2003 2004 2005 2006 2007 2008 20092009/ 2000
Farms represented 93 120 85 070 77 670 78 510 83 480 85 960 91 670 83 390 77 140 79 560 -15%
Sample farms 1 420 1 320 1 384 1 427 1 455 1 533 1 570 1 648 1 485 1 583
Av. Labour in AWU 1.28 1.25 1.30 1.29 1.29 1.28 1.28 1.31 1.30 1.30 2%
Family labour - % 95% 96% 95% 94% 93% 93% 95% 93% 92% 93% -2%
Beef specialisation - % output 83% 81% 81% 83% 82% 83% 83% 83% 82% 82% -1%
Average UAA - ha 53.9 56.4 69.2 65.2 63.6 65.7 67.9 72.6 77.3 78.2 45%
Forage crops - ha 47.7 49.9 61.6 57.9 56.3 56.1 57.9 63.5 67.5 67.6 41%
of which % permanent grassland 77% 76% 78% 72% 71% 71% 71% 71% 71% 68% -11%
Stocking density - LU/ha 1.0 1.0 0.9 1.0 1.0 1.1 1.0 1.0 1.0 1.1 8%
Av. number of suckler cows - head 35.5 36.1 41.5 42.9 41.6 44.1 42.9 47.3 48.8 49.1 38%
Number of suckler cow s per AWU 27.7 28.9 32.0 33.2 32.2 34.5 33.5 36.1 37.5 37.8 36%
Total beef cattle - LU 49 51 60 61 59 62 61 67 72 74 50%
Total LU on the farm 51 52 62 63 61 63 63 68 74 76 49%
Cattle (male & female) < 1 year sold - head 12 15 18 18 17 19 20 22 20 21 77%
Male cattle 1-2 years sold - head 3 4 4 4 4 4 3 3 5 5 64%
Male cattle sold (incl. fem. < 1 year) - head 18 22 25 26 25 27 26 28 28 29 61%
Sell ing price male cattle - €/head 746 626 726 767 764 806 899 878 852 878 18%
Cattle < 1 year + male 1-2 year sold / cow 0.5 0.6 0.6 0.6 0.6 0.6 0.6 0.6 0.6 0.6 17%
Total cattle sold - head 25 30 36 40 36 39 37 40 41 43 70%
Total cattle sales - € 20 380 21 123 27 596 32 428 29 924 33 520 35 189 38 054 38 279 40 167 97%
Selling price cattle - €/head 817 698 765 817 826 869 954 943 928 945 16%
OUTPUT AND COSTS in €/Cow
Breeders 2000 2001 2002 2003 2004 2005 2006 2007 2008 2009 2009/ 2000 2010e 2011e 2010 /2009 2011 /2009
TOTAL BEEF OUTPUT 746 658 746 798 796 848 894 864 851 854 14% 864 940 1% 10%
TOTAL BEEF COUPLED DP 279 305 356 360 347 273 179 169 182 176 -37% 176 176 0% 0%
of which suckler cow premium 179 198 219 218 207 162 164 156 163 161 -10% 161.0 161.0 0% 0%
of which special male premium 34 38 47 43 42 32 1 1 1 1 -97% 1 1 0% 0%
of which slaughter premium 8 15 25 26 27 22 7 7 7 6 -22% 6 6 0% 0%
of which extensification premium 43 47 51 52 51 36 1 1 1 1 -98% 1 1 0% 0%
of which other DP (incl. National DP) 14 7 14 21 20 22 6 5 10 7 -50% 7 7 0% 0%
Feed 211 216 224 258 269 261 278 294 307 302 44% 327 373 8% 23%
of which purchased feed 123 127 134 165 175 168 179 192 192 183 49% 213 240 16% 31%
of which home-grown feed 88 89 90 93 93 93 99 101 116 119 36% 114 132 -4% 11%
Animal purchase 58 38 56 83 79 75 72 77 62 67 16% 66 69 -2% 3%
Other specif ic costs 59 60 56 58 58 58 61 63 75 74 25% 76 77 3% 5%
Specific costs 328 314 336 399 406 394 411 434 444 443 35% 468 519 6% 17%
Machinery and building upkeep 61 60 66 72 74 71 80 76 85 87 42% 89 91 3% 5%
Energy (fuel, electricity) 39 39 34 39 43 48 53 51 68 57 46% 66 76 17% 34%
Contract w ork 44 42 45 46 48 51 51 52 63 65 49% 65.1 67.1 0% 3%
Taxes (exc. milk levy) 9 10 10 10 11 11 12 11 12 13 39% 13 14 2% 4%Other direct inputs (incl. w ater, insurance on farm buildings)
68 69 87 91 90 91 100 98 112 11367%
113 117 0% 3%
Non specific costs 221 220 241 258 267 271 296 288 340 335 52% 347 365 4% 9%
Total operating costs 548 534 577 657 673 666 707 723 784 778 42% 815 884 5% 14%
Gross m argin (over operating costs) 198 124 169 141 123 183 187 142 67 76 -62% 49 56 -36% -26%Gross m argin (over operating costs) with CP* 477 429 525 500 470 456 366 311 249 252 -47% 225 232 0 0
* CP: coupled payments e: estimate
Depreciation 152 145 157 166 178 184 207 207 234 241 58%
Wages 22 16 17 25 29 25 20 26 26 23 9%
Rent 54 55 62 65 64 63 72 67 75 76 40%
Interest 34 32 31 32 31 31 31 32 42 40 17%
External factors 110 103 110 122 124 119 123 125 143 140 27%
Net m argin (before own factors) -64 -124 -98 -147 -179 -121 -143 -190 -310 -305 374%
Net m argin (before own factors) with CP* 214 181 258 213 168 152 35 -21 -128 -128 -160%
* CP: coupled payments
Family labour costs 427 407 354 364 390 364 397 368 365 373 -13%
Ow n capital unpaid cost 108 99 97 76 97 86 72 91 41 142 32%
Imputed family factors 535 507 451 440 487 450 469 459 405 515 -4%
Total economic costs 1 345 1 288 1 295 1 385 1 462 1 419 1 506 1 513 1 566 1 673 24%
Net economic m argin (after own factors) -599 -630 -549 -587 -666 -570 -612 -649 -715 -820 37%
Net economic m argin (after own factors) with CP* -320 -325 -193 -228 -319 -297 -433 -480 -534 -643 101%
ASSETS in €/Cow
Breeders 2000 2001 2002 2003 2004 2005 2006 2007 2008 2009 2009/ 2000
Fixed assets 5 291 5 056 5 134 5 073 5 771 5 906 6 120 6 365 7 081 6 616 25%
Current assets 1 303 1 326 1 409 1 352 1 428 1 640 1 994 1 860 1 759 1 764 35%
Total assets 6 593 6 382 6 543 6 425 7 199 7 546 8 114 8 225 8 840 8 379 27%
INCOME per AWU in €/AWU (nominal)
Breeders 2000 2001 2002 2003 2004 2005 2006 2007 2008 2009 2009/ 2000
Total output 24 511 23 472 28 717 30 413 30 230 33 636 35 802 36 724 39 271 39 050 59%
Intermediate consumptions 16 982 18 040 20 913 23 575 23 968 25 025 26 515 28 151 33 553 33 334 96%
Balance of subsidies and taxes 11 458 14 003 17 407 19 171 17 443 18 784 19 003 19 122 21 643 22 243 94%
of w hich LFA/AWU 1 021 1 631 1 854 1 891 1 857 1 908 1 890 2 049 2 355 2 425 137%
of w hich environmental/AWU 1 317 1 341 1 749 2 209 1 988 2 139 2 213 2 046 2 424 2 539 93%
Gross Farm Incom e (GFI) 18 988 19 435 25 210 26 009 23 706 27 395 28 291 27 694 27 361 27 959 47%
Depreciation 5 171 5 265 6 264 6 768 7 003 7 709 8 393 9 019 10 578 11 158 116%
Farm Net Value Added (FNVA) 13 816 14 170 18 947 19 242 16 702 19 685 19 898 18 676 16 782 16 801 22%
Wages 750 608 734 1 017 1 172 1 065 860 1 133 1 282 1 125 50%
Rent 1 833 1 958 2 435 2 613 2 513 2 662 2 912 2 916 3 416 3 499 91%
Interest 1 155 1 159 1 257 1 318 1 224 1 278 1 268 1 396 1 931 1 877 63%
External factors 3 738 3 725 4 426 4 948 4 910 5 006 5 040 5 446 6 628 6 502 74%
Balance of subsidies and taxes on investment 203 367 348 318 296 382 452 421 645 924 356%
Farm net income (FNI) 10 281 10 812 14 869 14 612 12 088 15 061 15 310 13 651 10 799 11 224 9%
Family labour costs 14 153 14 313 13 816 14 403 15 043 14 977 15 958 15 983 16 679 17 252 22%
Ow n capital unpaid cost 3 531 3 443 3 727 2 969 3 645 3 443 2 896 3 897 1 867 6 461 83%
Imputed family factors 17 683 17 756 17 542 17 373 18 688 18 421 18 854 19 880 18 545 23 713 34%
Fam ily farm s only in EUR/FWU (nominal)
Ow n capital unpaid cost 3 713 3 613 3 960 3 178 3 921 3 691 3 066 4 179 2 037 6 947 87%
Remuneration of Fam ily Labour (RFL) 7 135 7 704 11 837 12 629 9 285 12 331 13 073 10 138 9 455 5 067 -29%
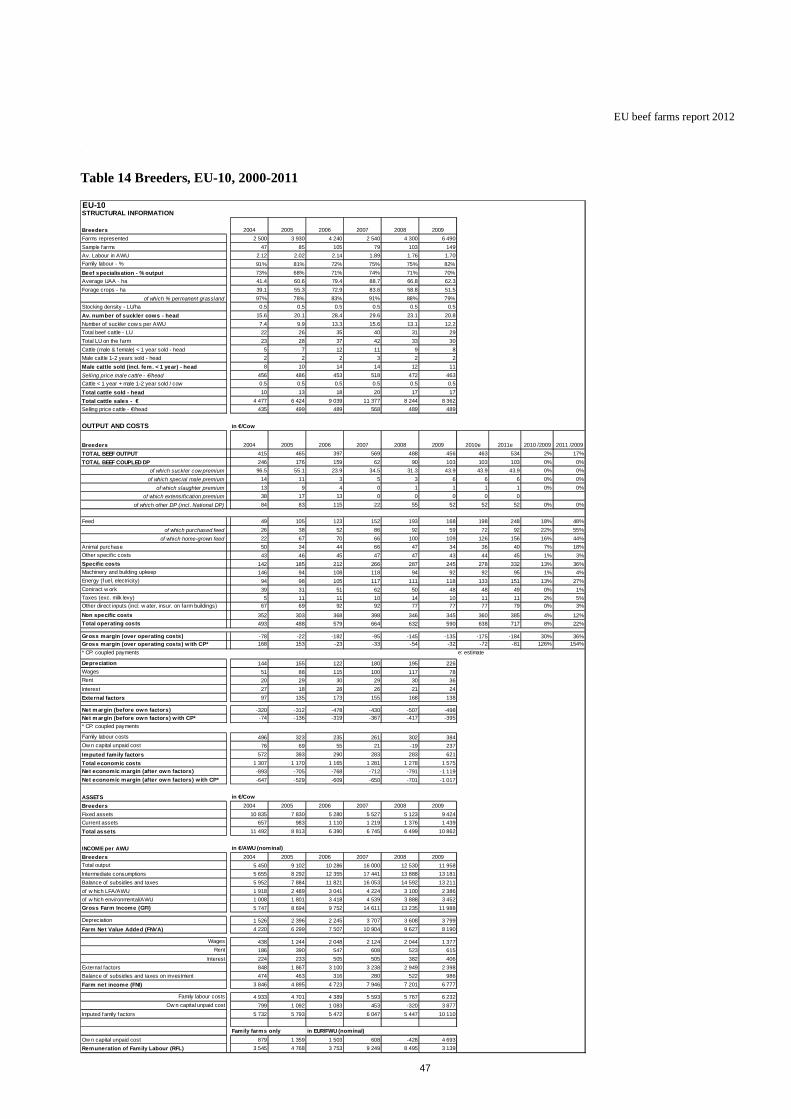
EU beef farms report 2012
47
Table 14 Breeders, EU-10, 2000-2011
EU-10STRUCTURAL INFORMATION
Breeders 2004 2005 2006 2007 2008 2009
Farms represented 2 500 3 930 4 240 2 540 4 300 6 490
Sample farms 47 85 105 79 103 149
Av. Labour in AWU 2.12 2.02 2.14 1.89 1.76 1.70
Family labour - % 91% 81% 72% 75% 75% 82%
Beef specialisation - % output 73% 68% 71% 74% 71% 70%
Average UAA - ha 41.4 60.6 79.4 88.7 66.8 62.3
Forage crops - ha 39.1 55.3 72.9 83.6 58.8 51.5
of which % permanent grassland 97% 78% 83% 91% 88% 79%
Stocking density - LU/ha 0.5 0.5 0.5 0.5 0.5 0.5
Av. number of suckler cows - head 15.6 20.1 28.4 29.6 23.1 20.8
Number of suckler cow s per AWU 7.4 9.9 13.3 15.6 13.1 12.2
Total beef cattle - LU 22 26 35 40 31 29
Total LU on the farm 23 28 37 42 33 30
Cattle (male & female) < 1 year sold - head 5 7 12 11 9 8
Male cattle 1-2 years sold - head 2 2 2 3 2 2
Male cattle sold (incl. fem. < 1 year) - head 8 10 14 14 12 11
Selling price male cattle - €/head 456 486 453 518 472 463
Cattle < 1 year + male 1-2 year sold / cow 0.5 0.5 0.5 0.5 0.5 0.5
Total cattle sold - head 10 13 18 20 17 17
Total cattle sales - € 4 477 6 424 9 039 11 377 8 244 8 362
Selling price cattle - €/head 435 499 489 568 489 489
OUTPUT AND COSTS in €/Cow
Breeders 2004 2005 2006 2007 2008 2009 2010e 2011e 2010 /2009 2011 /2009
TOTAL BEEF OUTPUT 415 465 397 569 488 456 463 534 2% 17%
TOTAL BEEF COUPLED DP 246 176 159 62 90 103 103 103 0% 0%
of which suckler cow premium 96.5 55.1 23.9 34.5 31.3 43.9 43.9 43.9 0% 0%
of which special male premium 14 11 3 5 3 6 6 6 0% 0%
of which slaughter premium 13 9 4 0 1 1 1 1 0% 0%
of which extensification premium 38 17 13 0 0 0 0 0
of which other DP (incl. National DP) 84 83 115 22 55 52 52 52 0% 0%
Feed 49 105 123 152 193 168 198 248 18% 48%
of which purchased feed 26 38 52 86 92 59 72 92 22% 55%
of which home-grown feed 22 67 70 66 100 109 126 156 16% 44%
Animal purchase 50 34 44 66 47 34 36 40 7% 18%
Other specific costs 43 46 45 47 47 43 44 45 1% 3%
Specific costs 142 185 212 266 287 245 278 332 13% 36%Machinery and building upkeep 146 94 108 118 94 92 92 95 1% 4%
Energy (fuel, electricity) 94 98 105 117 111 118 133 151 13% 27%
Contract w ork 39 31 51 62 50 48 48 49 0% 1%Taxes (exc. milk levy) 5 11 11 10 14 10 11 11 2% 5%Other direct inputs (incl. w ater, insur. on farm buildings) 67 69 92 92 77 77 77 79 0% 3%
Non specific costs 352 303 368 398 346 345 360 385 4% 12%
Total operating costs 493 488 579 664 632 590 638 717 8% 22%
Gross margin (over operating costs) -78 -22 -182 -95 -145 -135 -175 -184 30% 36%Gross margin (over operating costs) w ith CP* 168 153 -23 -33 -54 -32 -72 -81 126% 154%
* CP: coupled payments e: estimate
Depreciation 144 155 122 180 195 226
Wages 51 88 115 100 117 78Rent 20 29 30 29 30 36
Interest 27 18 28 26 21 24
External factors 97 135 173 155 168 138
Net m argin (before own factors) -320 -312 -478 -430 -507 -498Net m argin (before own factors) w ith CP* -74 -136 -319 -367 -417 -395
* CP: coupled payments
Family labour costs 496 323 235 261 302 384Ow n capital unpaid cost 76 69 55 21 -19 237
Imputed family factors 572 393 290 283 283 621
Total economic costs 1 307 1 170 1 165 1 281 1 278 1 575
Net economic margin (after own factors) -893 -705 -768 -712 -791 -1 119
Net economic margin (after own factors) w ith CP* -647 -529 -609 -650 -701 -1 017
ASSETS in €/Cow
Breeders 2004 2005 2006 2007 2008 2009
Fixed assets 10 835 7 830 5 280 5 527 5 123 9 424
Current assets 657 983 1 110 1 219 1 376 1 439
Total assets 11 492 8 813 6 390 6 745 6 499 10 862
INCOME per AWU in €/AWU (nominal)
Breeders 2004 2005 2006 2007 2008 2009
Total output 5 450 9 102 10 286 16 000 12 530 11 958
Intermediate consumptions 5 655 8 292 12 355 17 441 13 888 13 181
Balance of subsidies and taxes 5 952 7 884 11 821 16 053 14 592 13 211
of w hich LFA/AWU 1 918 2 489 3 041 4 224 3 100 2 386
of w hich environmental/AWU 1 008 1 801 3 418 4 539 3 888 3 452
Gross Farm Income (GFI) 5 747 8 694 9 752 14 611 13 235 11 988
Depreciation 1 526 2 396 2 245 3 707 3 608 3 799
Farm Net Value Added (FNVA) 4 220 6 299 7 507 10 904 9 627 8 190
Wages 438 1 244 2 048 2 124 2 044 1 377Rent 186 390 547 608 523 615
Interest 224 233 505 505 382 406
External factors 848 1 867 3 100 3 238 2 949 2 398
Balance of subsidies and taxes on investment 474 463 316 280 522 986
Farm net income (FNI) 3 846 4 895 4 723 7 946 7 201 6 777
Family labour costs 4 933 4 701 4 389 5 593 5 767 6 232
Ow n capital unpaid cost 799 1 092 1 083 453 -320 3 877
Imputed family factors 5 732 5 793 5 472 6 047 5 447 10 110
Family farms only in EUR/FWU (nominal)
Ow n capital unpaid cost 879 1 359 1 503 608 -428 4 693
Remuneration of Family Labour (RFL) 3 545 4 768 3 753 9 249 8 495 3 139

EU beef farms report 2012
48
Table 15 Breeders, EU group, 2009 2009STRUCTURAL INFORMATION
Breeders EU All EU15 EU10Farms represented 87 480 79 560 6 490
Sample farms 1 735 1 583 149
Av. Labour in AWU 1.34 1.30 1.70
Family labour - % 91% 93% 82%
Beef specialisation - % output 81% 82% 70%
Average UAA - ha 75.9 78.2 62.3
Forage crops - ha 65.4 67.6 51.5
of which % permanent grassland 69% 68% 79%
Stocking density - LU/ha 1.0 1.1 0.5
Av. number of suckler cows - head 46.8 49.1 20.8
Number of suckler cow s per AWU 34.9 37.8 12.2
Total beef cattle - LU 70 74 29
Total LU on the farm 72 76 30
Cattle (male & female) < 1 year sold - head 20 21 8
Male cattle 1-2 years sold - head 5 5 2
Male cattle sold (incl. fem. < 1 year) - head 27 29 11
Selling price male cattle - €/head 865 878 463
Cattle < 1 year + male 1-2 year sold / cow 0.6 0.6 0.5
Total cattle sold - head 40 43 17
Total cattle sales - € 37 251 40 167 8 362
Selling price cattle - €/head 930 945 489
OUTPUT AND COSTS in €/Cow
Breeders EU All EU15 EU10EU15/EU27 EU10/EU27 EU10/EU15
TOTAL BEEF OUTPUT 832 854 456 103% 55% 53%
TOTAL BEEF COUPLED DP 172 176 103 103% 60% 58%
of which suckler cow premium 155 161 44 104% 28% 27%
of which special male premium 1 1 6 86% 557% 651%
of which slaughter premium 6 6 1 104% 18% 18%
of which extensification premium 1 1 0
of which other DP (incl. National DP) 9 7 52 -2 -5 -6
Feed 296 302 168 102% 57% 56%
of which purchased feed 178 183 59 103% 33% 32%
of which home-grown feed 118 119 109 101% 92% 91%
Animal purchase 65 67 34 103% 52% 51%
Other specif ic costs 72 74 43 103% 60% 59%
Specific costs 433 443 245 102% 57% 55%
Machinery and building upkeep 86 87 92 101% 107% 105%
Energy (fuel, electricity) 58 57 118 97% 203% 208%Contract w ork 64 65 48 102% 75% 74%
Taxes (exc. milk levy) 13 13 10 102% 82% 81%Other direct inputs (incl. w ater, insurance on farm buildings) 111 113 77 102% 69% 68%
Non specific costs 331 335 345 101% 104% 103%
Total operating costs 764 778 590 102% 77% 76%
Gross margin (over operating costs) 67 76 -135 112% -199% -177%Gross margin (over operating costs) w ith CP* 239 252 -32 105% -13% -13%* CP: coupled payments
Depreciation 238 241 226
Wages 25 23 78Rent 74 76 36
Interest 39 40 24
External factors 138 140 138
Net margin (before own factors) -309 -305 -498Net margin (before own factors) w ith CP* -137 -128 -395
* CP: coupled payments
Family labour costs 370 373 384
Ow n capital unpaid cost 144 142 237
Imputed family factors 514 515 621
Total economic costs 1 654 1 673 1 575
Net economic margin (after own factors) -822 -820 -1 119
Net economic margin (after own factors) w ith CP* -651 -643 -1 017
ASSETS in €/Cow
Breeders EU All EU15 EU10
Fixed assets 6 638 6 616 9 424
Current assets 1 741 1 764 1 439
Total assets 8 380 8 379 10 862
INCOME per AWU in €/AWU (nominal)
Breeders EU All EU15 EU10
Total output 35 647 39 050 11 958
Intermediate consumptions 30 734 33 334 13 181
Balance of subsidies and taxes 20 883 22 243 13 211
of w hich LFA/AWU 2 364 2 425 2 386
of w hich environmental/AWU 2 565 2 539 3 452
Gross Farm Income (GFI) 25 796 27 959 11 988
Depreciation 10 220 11 158 3 799
Farm Net Value Added (FNVA) 15 577 16 801 8 190
Wages 1 130 1 125 1 377
Rent 3 149 3 499 615
Interest 1 695 1 877 406
External factors 5 973 6 502 2 398
Balance of subsidies and taxes on investment 908 924 986
Farm net income (FNI) 10 512 11 224 6 777
Family labour costs 15 855 17 252 6 232
Ow n capital unpaid cost 6 088 6 461 3 877
Imputed family factors 21 943 23 713 10 110
Family farms only in EUR/FWU (nominal)
Ow n capital unpaid cost 6 656 6 947 4 693
Remuneration of Family Labour (RFL) 4 829 5 067 3 139

EU beef farms report 2012
49
Table 16 Breeders, Member States, 2009 2009
STRUCTURAL INFORMATION
Breeders AT BE CZ DE DK EL ES FI FR IE IT LU LV PL PT SE SI UKFarms represented 1 100 3 310 760 1 030 1 140 2 130 8 620 750 38 810 7 050 7 550 120 730 1 410 3 850 870 2 030 2 620
Sample farms 26 112 51 56 25 20 189 22 635 68 127 26 22 19 157 33 24 83
Av. Labour in AWU 1.40 1.44 2.70 2.23 0.66 1.45 1.29 1.40 1.30 1.12 1.29 1.19 1.62 1.44 1.39 1.11 1.56 1.41
Family labour - % 96% 99% 53% 62% 98% 86% 93% 81% 95% 97% 91% 97% 83% 98% 87% 93% 100% 89%
Beef specialisation - % output 69% 84% 70% 80% 68% 82% 84% 80% 82% 85% 72% 75% 70% 74% 79% 71% 75% 79%
Average UAA - ha 52.2 59.4 179.3 163.8 36.7 17.5 90.6 77.5 93.6 43.3 46.4 72.5 80.9 32.0 59.1 86.4 13.8 100.6
Forage crops - ha 47.8 48.5 158.7 150.1 23.5 15.2 78.0 52.0 81.2 41.9 42.0 58.7 74.4 21.4 37.5 71.6 13.3 93.8
of which % permanent grassland 92% 78% 98% 90% 31% 95% 89% 3% 63% 97% 40% 81% 62% 76% 49% 41% 95% 81%
Stocking density - LU/ha 0.6 2.0 0.5 1.0 1.6 1.8 0.8 1.0 1.2 0.9 0.8 1.4 0.4 1.0 0.6 0.8 0.7 1.2
Av. number of suckler cows - head 24.3 54.6 53.7 96.6 24.2 46.4 54.6 39.4 59.1 25.1 25.8 53.8 19.7 13.9 22.5 35.3 7.5 67.5
Number of suckler cow s per AWU 17.3 37.9 19.9 43.3 36.6 32.0 42.3 28.2 45.5 22.4 20.0 45.2 12.1 9.6 16.2 31.8 4.8 47.9
Total beef cattle - LU 32 97 72 144 38 49 71 52 93 36 32 85 28 20 27 59 11 105
Total LU on the farm 33 97 74 151 38 50 73 52 95 39 32 85 29 22 28 59 12 112
Cattle (male & female) < 1 year sold - head 14 19 29 45 12 11 31 24 25 9 11 25 7 4 11 12 2 10
Male cattle 1-2 years sold - head 2 7 1 13 1 7 4 4 5 3 3 5 3 3 1 9 1 26
Male cattle sold (incl. fem. < 1 year) - head 16 28 31 60 14 18 38 28 34 14 15 30 10 7 15 21 3 38
Selling price male cattle - €/head 868 1 157 431 663 885 968 819 864 913 627 980 906 414 527 507 671 589 840
Cattle < 1 year + male 1-2 year sold / cow 0.7 0.5 0.6 0.6 0.6 0.4 0.7 0.7 0.6 0.6 0.6 0.6 0.5 0.5 0.7 0.6 0.4 0.6
Total cattle sold - head 21 53 47 78 21 21 44 42 51 26 22 51 15 12 18 38 5 66
Total cattle sales - € 18 169 68 838 22 423 53 963 18 036 20 167 35 461 33 977 51 267 18 156 21 779 47 499 6 619 6 188 8 854 27 159 2 605 54 170
Selling price cattle - €/head 874 1 311 475 688 861 946 807 809 1 000 701 1 011 930 441 524 502 716 561 820
OUTPUT AND COSTS in €/Cow
Breeders AT BE CZ DE DK EL ES FI FR IE IT LU LV PL PT SE SI UK
TOTAL BEEF OUTPUT 849 1 281 456 614 797 379 710 862 906 678 861 854 411 564 540 857 431 829
TOTAL BEEF COUPLED DP 269 232 116 0 49 28 184 459 219 25 11 0 342 0 249 35 16 23
of which suckler cow premium 250 232 0 0 0 0 170 0 210 0 0 0 255 0 210 0 0 0
of which special male premium 0 0 0 0 49 0 0 12 0 0 0 0 0 0 9 34 16 0
of which slaughter premium 18 0 0 0 0 0 9 0 8 0 0 0 11 0 12 0 0 0
of which extensification premium 0 0 0 0 0 0 4 0 0 0 0 0 0 0 9 0 0 0
of which other DP (incl. National DP) 0 0 116 0 0 28 1 447 0 25 11 0 76 0 8 1 0 23
Feed 130 413 149 140 460 323 311 284 310 283 213 235 179 195 187 312 55 327
of which purchased feed 93 249 69 74 250 284 290 87 168 173 121 87 54 14 97 146 35 179
of which home-grown feed 38 164 80 65 210 39 21 197 142 109 93 148 125 181 90 166 20 148
Animal purchase 133 114 52 15 39 3 96 59 57 81 51 64 15 34 108 103 30 85Other specific costs 102 183 66 45 105 23 35 113 76 84 43 110 32 21 21 110 34 105Specific costs 365 710 266 200 604 349 443 455 443 448 308 410 226 249 317 525 119 517
Machinery and building upkeep 133 74 126 114 197 40 27 279 101 108 7 114 46 52 41 148 195 89Energy (fuel, electricity) 91 56 145 100 50 15 34 161 57 63 52 71 147 86 56 172 181 67Contract w ork 83 112 90 89 216 35 12 116 75 77 14 96 19 13 17 97 48 54
Taxes (exc. milk levy) 15 18 14 18 41 1 7 4 15 4 13 12 10 15 1 2 2 7Other direct inputs (incl. w ater, insurance on farm buildings) 203 61 156 146 175 21 21 273 148 75 28 115 39 37 28 181 49 96Non specific costs 526 320 531 467 679 111 101 834 397 328 115 408 261 204 142 600 474 312Total operating costs 891 1 030 797 667 1 283 460 544 1 289 840 776 422 818 487 454 459 1 125 593 829
Gross margin (over operating costs) -41 252 -341 -52 -486 -82 166 -427 65 -98 438 36 -75 110 80 -268 -162 0Gross margin (over operating costs) with CP* 227 484 -225 -52 -438 -53 350 32 284 -73 449 36 266 110 329 -233 -146 23* CP: coupled payments

EU beef farms report 2012
50
Table 16 Breeders, Member States, 2009 (cont.)
AT BE CZ DE DK EL ES FI FR IE IT LU LV PL PT SE SI UK
Depreciation 472 214 222 176 281 63 57 653 294 168 225 441 237 193 121 263 514 198
Wages 17 5 174 169 12 12 26 132 14 15 45 12 37 8 48 46 0 35
Rent 34 102 72 95 84 9 22 100 98 40 39 94 8 9 20 73 8 41
Interest 58 89 32 72 444 2 5 58 44 37 2 52 39 14 1 73 11 26
External factors 109 196 278 336 540 23 53 290 156 92 86 158 84 31 69 192 19 102
Net margin (before own factors) -622 -159 -841 -564 -1 307 -167 56 -1 370 -385 -358 128 -563 -396 -115 -110 -724 -694 -300Net margin (before own factors) with CP* -353 73 -725 -564 -1 258 -139 240 -911 -166 -333 138 -563 -55 -115 139 -688 -679 -277* CP: coupled payments
Family labour costs 617 493 218 235 705 183 297 606 324 735 702 382 300 415 325 677 1 311 344
Ow n capital unpaid cost 504 145 150 38 62 78 124 287 117 482 229 269 180 134 125 73 878 97
Imputed family factors 1 121 638 368 273 767 261 421 893 441 1 217 931 650 480 550 449 750 2 189 442
Total economic costs 2 593 2 078 1 665 1 452 2 871 807 1 075 3 125 1 731 2 253 1 664 2 067 1 288 1 228 1 099 2 331 3 315 1 570Net economic margin (after own factors) -1 743 -796 -1 209 -837 -2 074 -428 -365 -2 263 -826 -1 575 -803 -1 213 -876 -664 -559 -1 474 -2 883 -742Net economic margin (after own factors) with CP* -1 474 -564 -1 093 -837 -2 025 -400 -181 -1 804 -607 -1 550 -793 -1 213 -535 -664 -310 -1 439 -2 868 -719
ASSETS in €/Cow
Breeders AT BE CZ DE DK EL ES FI FR IE IT LU LV PL PT SE SI UK
Fixed assets 16 860 6 851 5 627 4 414 33 383 2 448 5 653 11 360 4 151 24 912 10 776 12 621 3 297 11 427 4 015 9 524 39 582 13 789
Current assets 2 984 1 398 1 436 1 144 2 308 361 2 754 2 042 1 722 1 132 2 024 2 275 2 304 1 031 1 070 3 326 1 025 1 181
Total assets 19 844 8 250 7 063 5 558 35 691 2 810 8 407 13 402 5 872 26 044 12 799 14 896 5 601 12 458 5 085 12 850 40 607 14 971
INCOME per AWU in €/AWU (nominal)
Breeders AT BE CZ DE DK EL ES FI FR IE IT LU LV PL PT SE SI UK
Total output 19 712 54 989 19 864 34 582 61 536 15 758 35 396 32 601 47 418 18 653 27 510 48 414 13 581 7 700 11 664 49 470 6 055 56 273
Intermediate consumptions 17 458 40 344 27 391 36 109 81 360 16 639 24 005 45 081 41 730 20 892 13 352 44 868 12 896 6 684 8 693 58 734 6 989 52 330
Balance of subsidies and taxes 23 925 23 651 33 903 32 775 23 508 19 827 16 369 61 261 26 431 17 297 8 727 33 586 14 381 6 815 9 604 30 520 4 468 28 640
of w hich LFA/AWU 4 606 978 7 267 2 725 0 3 116 1 017 15 412 2 824 2 347 1 220 7 408 1 570 843 1 590 2 863 1 397 2 822
of w hich environmental/AWU 7 884 1 856 10 114 7 354 3 035 2 920 303 17 615 2 606 3 514 819 7 230 4 491 1 859 577 10 542 1 332 2 512Gross Farm Income (GFI) 26 179 38 295 26 376 31 248 3 684 18 946 27 760 48 781 32 119 15 058 22 884 37 132 15 066 7 831 12 575 21 256 3 534 32 584
Depreciation 11 828 9 635 6 249 9 447 14 823 2 344 2 895 23 352 16 156 4 387 6 231 27 036 3 796 2 522 2 577 11 579 3 171 11 633
Farm Net Value Added (FNVA) 14 351 28 660 20 127 21 801 -11 140 16 602 24 865 25 429 15 964 10 671 16 653 10 096 11 270 5 310 9 999 9 677 363 20 950
Wages 450 252 5 010 8 699 750 425 1 365 4 380 827 378 1 302 847 687 85 1 037 2 165 1 2 080
Rent 823 4 678 1 877 4 857 4 666 392 1 170 3 405 5 372 1 055 1 038 5 578 131 114 397 3 218 50 2 472
Interest 1 475 4 000 858 3 786 24 012 71 238 2 017 2 423 996 43 3 115 641 175 11 3 114 71 1 623
External factors 2 749 8 930 7 745 17 342 29 428 888 2 773 9 802 8 622 2 430 2 383 9 540 1 459 374 1 444 8 497 121 6 175
Balance of subsidies and taxes on investment 2 709 39 818 -95 0 0 -47 1 195 911 4 282 26 3 916 2 081 -114 14 0 -637 2 731
Farm net income (FNI) 14 311 19 769 13 200 4 364 -40 568 15 713 22 046 16 822 8 252 12 524 14 296 4 472 11 892 4 822 8 568 1 180 -395 17 507
Family labour costs 15 153 22 042 5 885 12 700 37 581 7 225 14 936 21 411 17 714 18 662 19 043 22 977 5 218 5 443 6 761 29 011 7 861 20 697
Ow n capital unpaid cost 12 527 6 318 4 152 2 067 2 660 2 928 6 369 10 458 6 294 12 419 6 003 16 304 3 011 1 688 2 659 3 466 5 321 5 725
Imputed family factors 27 680 28 360 10 037 14 767 40 241 10 153 21 305 31 868 24 009 31 082 25 047 39 281 8 228 7 131 9 420 32 478 13 182 26 422
Family farms only in EUR/FWU (nominal)
Ow n capital unpaid cost 13 004 6 414 7 851 3 335 2 708 3 431 6 808 12 763 6 633 12 719 6 637 16 747 3 636 1 724 3 050 3 760 5 338 6 394
Remuneration of Family Labour (RFL) 1 852 13 653 14 558 4 406 -44 011 14 980 16 154 7 767 2 063 107 9 168 -12 153 9 831 3 201 6 775 -2 480 -5 735 13 157

EU beef farms report 2012
51
ANNEX IVA BREEDERS BY MEMBER STATES
Table 17 Breeders, Member States, 2010, 2011 estimates 2010OUTPUT AND COSTS in €/Cow
Breeders 2010eAT BE CZ DE DK EL ES FI FR IE IT LU LV PL PT SE SI UK
TOTAL BEEF OUTPUT 861 1 256 470 623 852 378 767 838 912 676 843 859 414 586 532 1 036 398 944
TOTAL BEEF COUPLED DP 269 232 116 0 49 28 184 459 219 25 11 0 342 0 249 35 16 23
of which suckler cow premium 250 232 0 0 0 0 170 0 210 0 0 0 255 0 210 0 0 0
of which special male premium 0 0 0 0 49 0 0 12 0 0 0 0 0 0 9 34 16 0
of which slaughter premium 18 0 0 0 0 0 9 0 8 0 0 0 11 0 12 0 0 0
of which extensification premium 0 0 0 0 0 0 4 0 0 0 0 0 0 0 9 0 0 0
of which other DP (incl. National DP) 0 0 116 0 0 28 1 447 0 25 11 0 76 0 8 1 0 23
Feed 147 476 169 153 486 359 352 304 331 288 232 259 224 232 201 343 62 428
of which purchased feed 111 298 82 90 283 316 332 99 197 190 135 104 69 17 111 176 42 267
of which home-grown feed 36 177 87 64 203 43 20 206 134 98 98 155 155 215 90 166 20 161
Animal purchase 142 121 55 21 41 3 90 62 54 86 51 69 16 36 115 110 32 100
Other specific costs 105 189 64 46 106 24 35 112 77 84 44 110 32 21 22 112 35 121
Specific costs 394 786 288 220 634 386 478 479 462 459 327 437 272 289 338 564 129 648Machinery and building upkeep 140 84 127 117 202 41 27 290 104 107 8 117 42 53 41 152 197 99
Energy (fuel, electricity) 101 67 161 107 56 20 41 189 68 73 55 85 163 92 64 184 213 86
Contract w ork 89 115 89 89 224 36 12 117 74 78 14 99 17 14 17 99 48 59
Taxes (exc. milk levy) 16 18 14 18 42 1 7 5 16 4 14 13 10 16 1 2 2 7Other direct inputs (incl. w ater, insurance on farm buildings) 219 63 155 146 181 21 22 278 147 75 29 119 35 38 27 185 49 106
Non specific costs 564 347 546 477 705 119 110 879 408 338 119 432 267 213 150 622 509 357
Total operating costs 959 1 133 834 697 1 339 505 588 1 358 871 796 446 869 539 502 488 1 186 637 1 005
Gross margin (over operating costs) -97 123 -363 -74 -488 -127 179 -520 42 -120 397 -10 -125 85 44 -150 -240 -61Gross margin (over operating costs) w ith CP* 172 355 -247 -74 -439 -98 363 -61 261 -95 408 -10 217 85 293 -115 -224 -38* CP: coupled payments
2011OUTPUT AND COSTS in €/Cow
Breeders 2011e AT BE CZ DE DK EL ES FI FR IE IT LU LV PL PT SE SI UKTOTAL BEEF OUTPUT 963 1 340 518 723 972 386 842 884 985 804 906 909 478 710 550 1 175 454 944
TOTAL BEEF COUPLED DP 269 232 116 0 49 28 184 459 219 25 11 0 342 0 249 35 16 23
of which suckler cow premium 250 232 0 0 0 0 170 0 210 0 0 0 255 0 210 0 0 0
of which special male premium 0 0 0 0 49 0 0 12 0 0 0 0 0 0 9 34 16 0
of which slaughter premium 18 0 0 0 0 0 9 0 8 0 0 0 11 0 12 0 0 0
of which extensification premium 0 0 0 0 0 0 4 0 0 0 0 0 0 0 9 0 0 0
of which other DP (incl. National DP) 0 0 116 0 0 28 1 447 0 25 11 0 76 0 8 1 0 23
Feed 174 586 232 181 572 376 424 361 369 317 246 324 278 284 241 406 84 428
of which purchased feed 133 375 114 107 330 331 400 115 215 199 142 130 85 21 135 212 59 267
of which home-grown feed 42 211 117 74 242 44 24 246 154 118 104 194 193 262 106 194 26 161
Animal purchase 157 134 61 24 46 4 89 69 54 133 47 76 18 40 127 121 35 100Other specific costs 107 194 66 46 108 25 35 112 79 84 45 109 32 21 21 113 36 121
Specific costs 438 914 358 250 726 404 548 542 502 535 338 509 328 345 390 640 155 648
Machinery and building upkeep 144 87 130 121 207 41 27 298 107 106 8 124 45 57 41 156 199 99
Energy (fuel, electricity) 115 82 177 120 67 23 49 244 77 84 62 96 189 102 74 201 245 86
Contract w ork 89 117 91 90 236 36 14 120 77 78 15 104 18 16 17 104 48 59
Taxes (exc. milk levy) 16 19 14 19 44 1 8 5 16 4 14 13 10 16 1 2 2 7Other direct inputs (incl. w ater, insurance on farm buildings) 219 64 157 148 191 21 24 284 152 76 30 126 36 43 27 194 49 106
Non specific costs 583 369 569 498 744 122 122 951 428 349 129 463 298 234 160 657 543 357
Total operating costs 1 021 1 283 927 748 1 470 526 670 1 493 930 883 467 972 626 579 550 1 297 697 1 005
Gross margin (over operating costs) -58 57 -409 -25 -498 -140 172 -609 55 -79 439 -64 -149 132 0 -122 -243 -61Gross margin (over operating costs) w ith CP* 210 289 -293 -25 -449 -112 356 -150 273 -53 450 -64 193 132 250 -87 -228 -38* CP: coupled payments
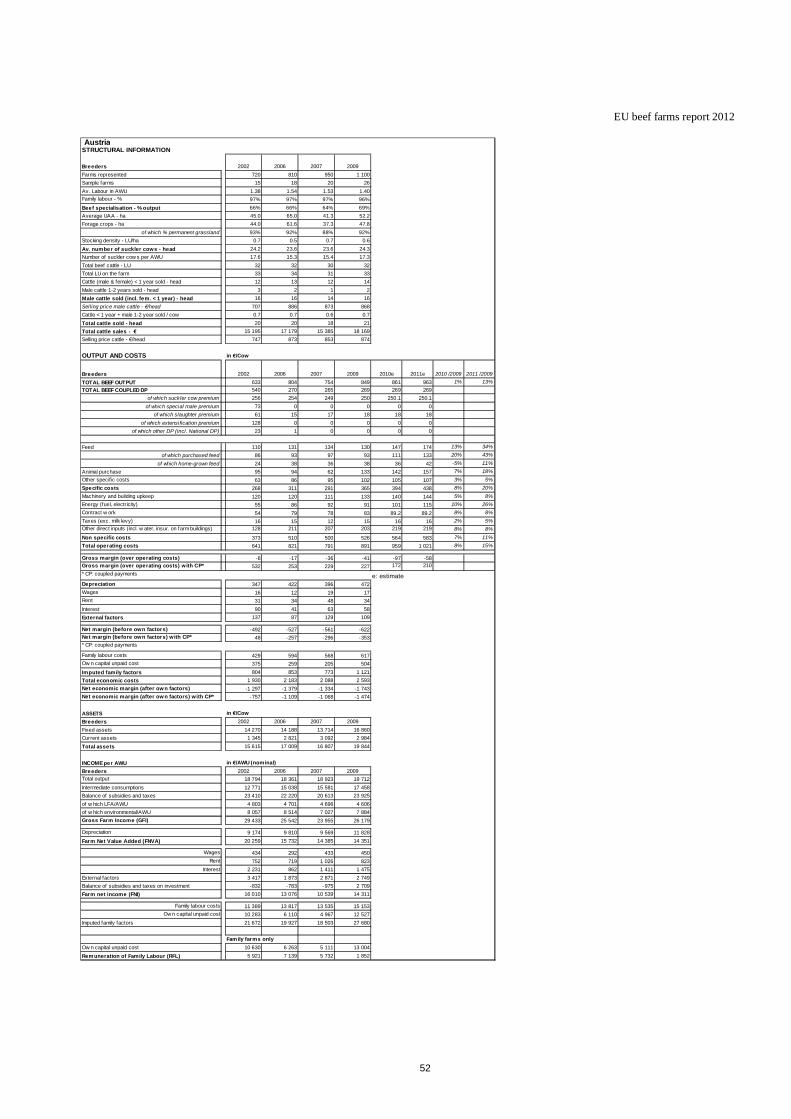
EU beef farms report 2012
52
AustriaSTRUCTURAL INFORMATION
Breeders 2002 2006 2007 2009
Farms represented 720 810 950 1 100
Sample farms 15 18 20 26
Av. Labour in AWU 1.38 1.54 1.53 1.40Family labour - % 97% 97% 97% 96%
Beef specialisation - % output 66% 66% 64% 69%
Average UAA - ha 45.0 65.0 41.3 52.2
Forage crops - ha 44.0 61.6 37.3 47.8
of which % permanent grassland 93% 92% 88% 92%
Stocking density - LU/ha 0.7 0.5 0.7 0.6
Av. number of suckler cows - head 24.2 23.6 23.6 24.3
Number of suckler cow s per AWU 17.6 15.3 15.4 17.3
Total beef cattle - LU 32 32 30 32
Total LU on the farm 33 34 31 33
Cattle (male & female) < 1 year sold - head 12 13 12 14
Male cattle 1-2 years sold - head 3 2 1 2
Male cattle sold (incl. fem. < 1 year) - head 16 16 14 16
Selling price male cattle - €/head 707 886 873 868
Cattle < 1 year + male 1-2 year sold / cow 0.7 0.7 0.6 0.7
Total cattle sold - head 20 20 18 21
Total cattle sales - € 15 195 17 179 15 385 18 169
Selling price cattle - €/head 747 873 853 874
OUTPUT AND COSTS in €/Cow
Breeders 2002 2006 2007 2009 2010e 2011e 2010 /2009 2011 /2009
TOTAL BEEF OUTPUT 633 804 754 849 861 963 1% 13%
TOTAL BEEF COUPLED DP 540 270 265 269 269 269 0% 0%
of which suckler cow premium 256 254 249 250 250.1 250.1 0% 0%
of which special male premium 73 0 0 0 0 0
of which slaughter premium 61 15 17 18 18 18 0% 0%
of which extensification premium 128 0 0 0 0 0
of which other DP (incl. National DP) 23 1 0 0 0 0 0% 0%
Feed 110 131 134 130 147 174 13% 34%
of which purchased feed 86 93 97 93 111 133 20% 43%
of which home-grown feed 24 38 36 38 36 42 -5% 11%
Animal purchase 95 94 62 133 142 157 7% 18%
Other specific costs 63 86 95 102 105 107 3% 5%
Specific costs 268 311 291 365 394 438 8% 20%
Machinery and building upkeep 120 120 111 133 140 144 5% 8%
Energy (fuel, electricity) 55 86 92 91 101 115 10% 26%
Contract w ork 54 79 78 83 89.2 89.2 8% 8%
Taxes (exc. milk levy) 16 15 12 15 16 16 2% 5%Other direct inputs (incl. w ater, insur. on farm buildings) 128 211 207 203 219 219 8% 8%
Non specific costs 373 510 500 526 564 583 7% 11%
Total operating costs 641 821 791 891 959 1 021 8% 15%
Gross margin (over operating costs) -8 -17 -36 -41 -97 -58Gross margin (over operating costs) with CP* 532 253 229 227 172 210
* CP: coupled payments e: estimateDepreciation 347 422 396 472
Wages 16 12 19 17Rent 31 34 48 34
Interest 90 41 63 58
External factors 137 87 129 109
Net margin (before own factors) -492 -527 -561 -622Net margin (before own factors) with CP* 48 -257 -296 -353* CP: coupled payments
Family labour costs 429 594 568 617Ow n capital unpaid cost 375 259 205 504
Imputed family factors 804 853 773 1 121
Total economic costs 1 930 2 183 2 088 2 593
Net economic margin (after ow n factors) -1 297 -1 379 -1 334 -1 743
Net economic margin (after ow n factors) with CP* -757 -1 109 -1 068 -1 474
ASSETS in €/Cow
Breeders 2002 2006 2007 2009
Fixed assets 14 270 14 188 13 714 16 860
Current assets 1 345 2 821 3 092 2 984
Total assets 15 615 17 009 16 807 19 844
INCOME per AWU in €/AWU (nominal)
Breeders 2002 2006 2007 2009Total output 18 794 18 361 18 923 19 712
Intermediate consumptions 12 771 15 038 15 581 17 458
Balance of subsidies and taxes 23 410 22 220 20 613 23 925
of w hich LFA/AWU 4 803 4 701 4 696 4 606
of w hich environmental/AWU 8 057 8 514 7 027 7 884
Gross Farm Income (GFI) 29 433 25 542 23 955 26 179
Depreciation 9 174 9 810 9 569 11 828
Farm Net Value Added (FNVA) 20 259 15 732 14 385 14 351
Wages 434 292 433 450
Rent 752 719 1 026 823
Interest 2 231 862 1 411 1 475
External factors 3 417 1 873 2 871 2 749
Balance of subsidies and taxes on investment -832 -783 -975 2 709
Farm net income (FNI) 16 010 13 076 10 539 14 311
Family labour costs 11 389 13 817 13 535 15 153Ow n capital unpaid cost 10 283 6 110 4 967 12 527
Imputed family factors 21 672 19 927 18 503 27 680
Fam ily farms only
Ow n capital unpaid cost 10 630 6 263 5 111 13 004
Rem uneration of Family Labour (RFL) 5 921 7 139 5 732 1 852

EU beef farms report 2012
53
BelgiumSTRUCTURAL INFORMATION
Breeders 2000 2001 2002 2003 2004 2005 2006 2007 2008 20092009/ 2000
Farms represented 3 960 3 390 3 190 3 440 2 990 2 950 2 740 2 840 2 980 3 310 -16%
Sample farms 85 79 84 91 91 87 89 85 94 112
Av. Labour in AWU 1.39 1.36 1.37 1.33 1.38 1.35 1.36 1.38 1.42 1.44 4%
Family labour - % 99% 99% 99% 99% 99% 100% 99% 99% 97% 99% 0%
Beef specialisation - % output 89% 89% 89% 87% 85% 87% 87% 87% 86% 84% -6%
Average UAA - ha 48.6 47.5 50.8 53.5 50.8 52.0 58.0 54.9 58.1 59.4 22%
Forage crops - ha 43.7 43.3 45.8 47.1 44.1 43.8 51.0 49.2 50.7 48.5 11%
of which % permanent grassland 84% 83% 84% 83% 80% 81% 81% 77% 80% 78% -8%
Stocking density - LU/ha 2.3 2.3 2.1 2.0 2.0 2.0 2.0 1.9 1.9 2.0 -12%
Av. number of suckler cow s - head 59.4 57.7 55.2 54.1 51.7 52.2 59.0 55.0 55.6 54.6 -8%
Number of suckler cow s per AWU 42.7 42.4 40.3 40.7 37.4 38.7 43.4 39.8 39.2 37.9 -11%
Total beef cattle - LU 100 98 96 93 90 89 100 96 98 97 -3%
Total LU on the farm 100 99 97 94 91 89 101 96 98 97 -3%
Cattle (male & female) < 1 year sold - head 19 18 20 20 17 19 21 19 18 19 2%
Male cattle 1-2 years sold - head 10 9 9 6 8 6 7 6 7 7 -26%
Male cattle sold (incl. fem. < 1 year) - head 30 28 31 28 26 26 29 26 26 28 -6%
Selling price male cattle - €/head 1 120 935 962 1 174 1 206 1 084 1 121 1 069 1 085 1 157 3%
Cattle < 1 year + male 1-2 year sold / cow 0.5 0.5 0.6 0.5 0.5 0.5 0.5 0.5 0.5 0.5 2%
Total cattle sold - head 53 53 56 50 47 46 52 48 50 53 -1%
Total cattle sales - € 61 351 51 733 55 393 60 060 59 178 53 786 64 524 57 713 61 001 68 838 12%
Selling price cattle - €/head 1 156 976 981 1 206 1 265 1 176 1 236 1 196 1 211 1 311 13%
OUTPUT AND COSTS in €/Cow
Breeders 2000 2001 2002 2003 2004 2005 2006 2007 2008 2009 2009/ 2000 2010e 2011e 2010 /2009 2011 /2009
TOTAL BEEF OUTPUT 1 079 845 967 1 214 1 177 1 080 1 193 1 154 1 103 1 281 19% 1 256 1 340 -2% 5%
TOTAL BEEF COUPLED DP 284 349 439 438 432 222 234 224 235 232 -18% 232 232 0% 0%
of which suckler cow premium 195 217 262 261 254 222 234 224 235 232 19% 231.9 231.9 0% 0%
of which special male premium 51 62 70 72 74 0 0 0 0 0 -100% 0 0
of which slaughter premium 4 8 17 11 11 0 0 0 0 0 -100% 0 0
of which extensification premium 10 11 15 16 17 0 0 0 0 0 -100% 0 0
of which other DP (incl. National DP) 24 50 76 78 77 0 0 0 0 0 -100% 0 0
Feed 305 317 329 341 358 330 338 354 445 413 35% 476 586 15% 42%
of which purchased feed 211 222 220 228 239 204 217 226 290 249 18% 298 375 20% 50%
of which home-grown feed 94 96 109 114 120 126 120 128 156 164 74% 177 211 8% 29%
Animal purchase 69 57 79 95 83 74 111 105 64 114 65% 121 134 7% 18%
Other specific costs 135 127 129 138 153 156 169 172 184 183 36% 189 194 4% 6%
Specific costs 509 501 537 574 594 560 618 630 693 710 40% 786 914 11% 29%
Machinery and building upkeep 46 46 62 60 69 62 64 63 68 74 61% 84 87 13% 17%
Energy (fuel, electricity) 27 28 28 30 34 44 46 51 65 56 108% 67 82 22% 48%
Contract w ork 56 58 63 63 78 76 78 82 105 112 99% 114.6 117.2 3% 5%
Taxes (exc. milk levy) 13 11 11 13 12 12 13 14 18 18 39% 18 19 2% 6%Other direct inputs (incl. w ater, insur. on farm buildings) 39 40 47 50 51 52 54 55 59 61 55% 63 64 3% 5%
Non specific costs 181 184 212 217 245 246 255 265 316 320 77% 347 369 8% 15%
Total operating costs 689 685 749 791 839 806 873 896 1 008 1 030 49% 1 133 1 283 10% 25%
Gross margin (over operating costs) 389 160 219 423 339 274 320 258 95 252 -35% 123 57 -51% -77%Gross margin (over operating costs) w ith CP* 673 509 658 861 771 497 555 482 329 484 -28% 355 289 -27% -40%* CP: coupled payments e: estimateDepreciation 143 142 158 169 172 188 198 210 215 214 50%
Wages 3 3 3 1 4 1 4 4 11 5 57%
Rent 62 67 72 69 80 81 80 88 91 102 63%
Interest 84 85 94 95 87 88 97 86 98 89 7%
External factors 149 154 169 166 171 169 181 178 200 196 32%
Net margin (before own factors) 97 -136 -108 88 -5 -83 -59 -130 -321 -159 -263%Net margin (before own factors) with CP* 381 213 331 526 428 139 175 95 -86 73 -81%* CP: coupled payments
Family labour costs 413 421 480 497 497 485 418 454 489 493 19%
Ow n capital unpaid cost 62 51 90 70 56 7 28 78 -48 145 134%
Imputed family factors 475 472 571 567 553 492 446 532 441 638 34%
Total economic costs 1 456 1 453 1 646 1 693 1 735 1 655 1 698 1 816 1 865 2 078 43%
Net economic margin (after ow n factors) -377 -608 -679 -479 -557 -575 -504 -662 -762 -796 111%
Net economic margin (after ow n factors) w ith CP* -94 -258 -239 -41 -125 -353 -270 -438 -527 -564 503%
ASSETS in €/Cow
Breeders 2000 2001 2002 2003 2004 2005 2006 2007 2008 2009 2009/ 2000
Fixed assets 4 407 4 200 4 960 5 083 5 254 5 506 5 865 6 206 6 614 6 851 55%
Current assets 1 193 1 123 1 209 1 298 1 315 1 249 1 286 1 365 1 332 1 398 17%
Total assets 5 601 5 323 6 168 6 381 6 569 6 756 7 151 7 571 7 946 8 250 47%
INCOME per AWU in €/AWU (nominal)
Breeders 2000 2001 2002 2003 2004 2005 2006 2007 2008 2009 2009/ 2000Total output 48 981 38 474 40 806 53 105 49 421 46 294 55 173 49 464 49 019 54 989 12%
Intermediate consumptions 28 380 28 564 29 057 31 125 32 090 31 758 36 145 34 722 41 054 40 344 42%
Balance of subsidies and taxes 15 973 23 249 21 917 23 032 20 885 20 097 24 246 21 542 24 020 23 651 48%
of w hich LFA/AWU 889 865 921 960 771 851 947 849 1 030 978 10%
of w hich environmental/AWU 82 183 429 648 472 810 1 792 1 801 2 179 1 856 2157%
Gross Farm Income (GFI) 36 575 33 158 33 666 45 011 38 215 34 633 43 275 36 285 31 985 38 295 5%
Depreciation 6 759 6 717 7 111 7 771 7 499 8 359 9 742 9 606 9 703 9 635 43%
Farm Net Value Added (FNVA) 29 816 26 441 26 555 37 241 30 717 26 274 33 532 26 679 22 281 28 660 -4%
Wages 174 146 152 69 209 44 209 172 514 252 45%
Rent 3 096 3 203 3 251 3 304 3 551 3 737 4 121 4 159 4 212 4 678 51%
Interest 3 964 4 036 4 213 4 461 3 807 3 859 4 715 3 836 4 403 4 000 1%
External factors 7 234 7 386 7 616 7 834 7 567 7 640 9 045 8 168 9 129 8 930 23%
Balance of subsidies and taxes on investment -963 -322 149 -963 -760 -90 -638 -249 63 39 -104%
Farm net income (FNI) 21 619 18 733 19 088 28 444 22 390 18 544 23 850 18 262 13 215 19 769 -9%
Family labour costs 19 432 19 901 21 435 22 875 21 929 21 508 20 594 20 871 22 000 22 042 13%
Ow n capital unpaid cost 2 840 2 330 3 975 3 071 2 294 269 1 324 3 486 -2 165 6 318 122%
Imputed family factors 22 272 22 230 25 411 25 946 24 223 21 777 21 918 24 356 19 835 28 360 27%
Family farms only in EUR/FWU (nominal)
Ow n capital unpaid cost 2 883 2 354 4 013 3 075 2 314 270 1 344 3 510 -2 223 6 414 122%
Remuneration of Family Labour (RFL) 19 061 16 577 15 254 25 408 20 267 18 387 22 853 14 877 15 792 13 653 -28%

EU beef farms report 2012
54
Czech RepublicSTRUCTURAL INFORMATION
Breeders 2004 2005 2006 2007 2008 2009
Farms represented 390 620 680 660 630 760
Sample farms 27 41 44 31 40 51
Av. Labour in AWU 2.42 2.70 3.53 2.47 2.57 2.70
Family labour - % 58% 49% 36% 57% 53% 53%
Beef specialisation - % output 79% 74% 70% 70% 74% 70%
Average UAA - ha 153.8 184.9 233.2 160.8 175.3 179.3
Forage crops - ha 149.8 176.7 221.0 154.6 160.8 158.7
of which % permanent grassland 100% 96% 95% 99% 97% 98%
Stocking density - LU/ha 0.4 0.4 0.4 0.4 0.4 0.5
Av. number of suckler cow s - head 46.6 47.5 67.8 49.9 52.6 53.7
Number of suckler cow s per AWU 19.3 17.6 19.2 20.2 20.5 19.9
Total beef cattle - LU 60 62 85 67 71 72
Total LU on the farm 62 64 88 70 72 74
Cattle (male & female) < 1 year sold - head 21 23 41 24 25 29
Male cattle 1-2 years sold - head 4 2 3 3 3 1
Male cattle sold (incl. fem. < 1 year) - head 25 25 43 28 29 31
Selling price male cattle - €/head 390 502 475 478 463 431
Cattle < 1 year + male 1-2 year sold / cow 0.5 0.5 0.6 0.6 0.6 0.6
Total cattle sold - head 33 31 56 40 41 47
Total cattle sales - € 12 431 16 110 27 437 20 652 20 957 22 423
Selling price cattle - €/head 381 513 490 517 511 475
OUTPUT AND COSTS in €/Cow
Breeders 2004 2005 2006 2007 2008 2009 2010e 2011e 2010 /2009 2011 /2009
TOTAL BEEF OUTPUT 278 425 416 461 446 456 470 518 3% 14%
TOTAL BEEF COUPLED DP 133 95 131 1 105 116 116 116 0% 0%
of which suckler cow premium 0 0 0 0 0 0 0.0 0.0
of which special male premium 0 0 0 0 0 0 0 0
of which slaughter premium 0 0 0 0 0 0 0 0
of which extensification premium 0 0 0 0 0 0 0 0
of which other DP (incl. National DP) 133 95 131 1 105 116 116 116 0% 0%
Feed 37 66 113 143 147 149 169 232 13% 56%
of which purchased feed 21 31 44 108 69 69 82 114 19% 67%
of which home-grown feed 16 36 69 35 78 80 87 117 8% 46%
Animal purchase 6 44 43 58 20 52 55 61 7% 18%
Other specific costs 30 40 55 56 55 66 64 66 -2% 0%
Specific costs 73 151 210 256 222 266 288 358 8% 35%
Machinery and building upkeep 52 101 159 159 131 126 127 130 0% 3%
Energy (fuel, electricity) 112 130 143 132 149 145 161 177 11% 22%
Contract w ork 56 47 81 98 98 90 89.2 90.5 -1% 1%
Taxes (exc. milk levy) 9 18 15 13 21 14 14 14 1% 3%Other direct inputs (incl. w ater, insur. on farm buildings) 63 81 123 133 137 156 155 157 -1% 1%
Non specific costs 292 377 520 537 536 531 546 569 3% 7%
Total operating costs 366 528 731 793 759 797 834 927 5% 16%
Gross margin (over operating costs) -87 -103 -315 -331 -313 -341 -363 -409Gross margin (over operating costs) with CP* 46 -9 -184 -330 -208 -225 -247 -293
* CP: coupled payments e: estimateDepreciation 79 129 128 169 202 222
Wages 95 163 205 135 217 174Rent 27 45 37 32 47 72
Interest 40 17 29 31 23 32
External factors 162 225 270 197 287 278
Net margin (before ow n factors) -329 -458 -712 -698 -801 -841Net margin (before ow n factors) with CP* -196 -363 -581 -697 -696 -725* CP: coupled payments
Family labour costs 178 172 124 215 222 218Ow n capital unpaid cost 39 49 32 22 -35 150
Imputed family factors 218 221 156 237 186 368
Total economic costs 824 1 103 1 284 1 397 1 433 1 665
Net economic margin (after ow n factors) -546 -678 -868 -935 -988 -1 209
Net economic margin (after ow n factors) w ith CP* -413 -584 -737 -934 -883 -1 093
ASSETS in €/Cow
Breeders 2004 2005 2006 2007 2008 2009
Fixed assets 2 926 3 808 4 205 3 713 5 105 5 627
Current assets 536 1 182 1 437 1 147 1 336 1 436
Total assets 3 462 4 990 5 642 4 859 6 441 7 063
INCOME per AWU in €/AWU (nominal)
Breeders 2004 2005 2006 2007 2008 2009
Total output 12 861 15 943 17 119 18 890 20 415 19 864
Intermediate consumptions 14 037 17 698 23 944 27 312 26 924 27 391
Balance of subsidies and taxes 13 740 17 236 25 587 24 695 35 817 33 903
of w hich LFA/AWU 6 002 7 907 8 012 8 056 8 502 7 267
of w hich environmental/AWU 272 2 587 8 346 6 702 10 858 10 114
Gross Farm Income (GFI) 12 563 15 481 18 762 16 274 29 308 26 376
Depreciation 1 830 3 116 3 350 4 497 5 415 6 249
Farm Net Value Added (FNVA) 10 733 12 365 15 412 11 777 23 893 20 127
Wages 2 031 4 104 5 527 4 078 5 606 5 010Rent 604 1 086 1 001 907 1 287 1 877
Interest 846 425 787 776 591 858
External factors 3 481 5 616 7 315 5 761 7 484 7 745
Balance of subsidies and taxes on investment 0 42 32 0 527 818
Farm net income (FNI) 7 252 6 790 8 129 6 016 16 937 13 200
Family labour costs 4 383 4 074 3 267 5 808 6 131 5 885Ow n capital unpaid cost 978 1 163 793 605 -919 4 152
Imputed family factors 5 362 5 237 4 059 6 413 5 212 10 037
Family farms only in EUR/FWU (nominal)
Ow n capital unpaid cost 1 700 2 399 2 194 1 050 -1 725 7 851
Remuneration of Family Labour (RFL) 10 900 9 210 10 927 12 504 25 449 14 558
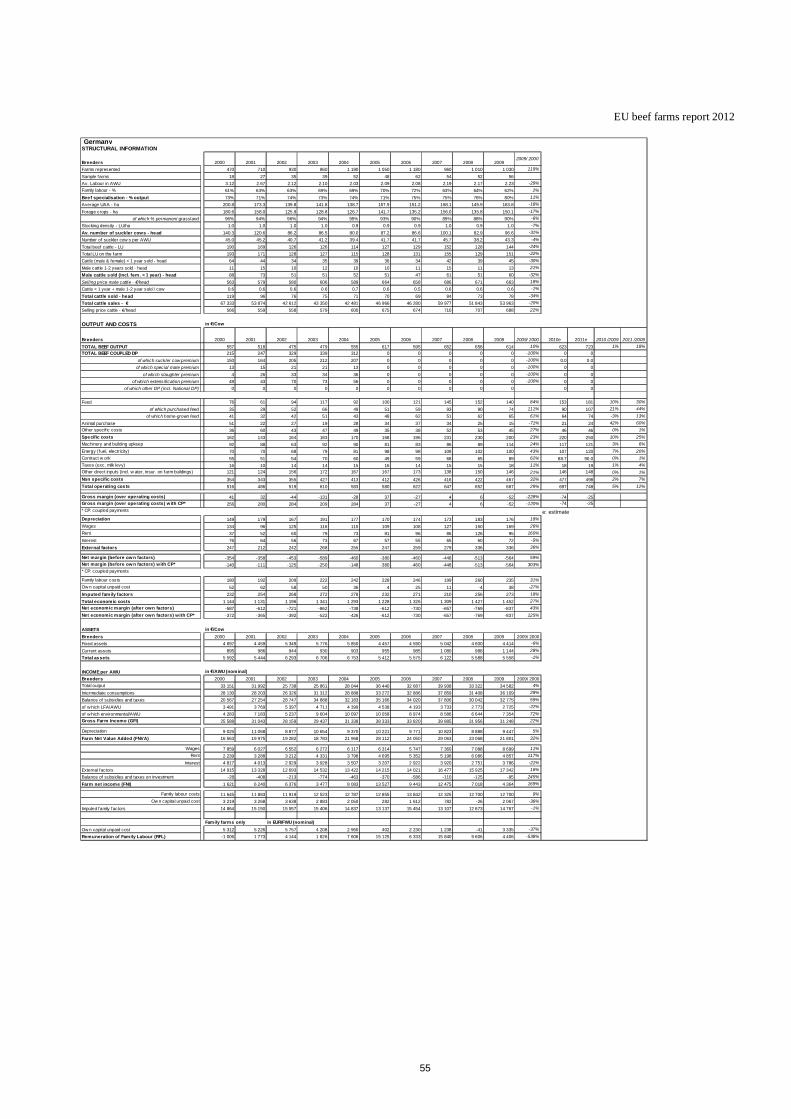
EU beef farms report 2012
55
GermanySTRUCTURAL INFORMATION
Breeders 2000 2001 2002 2003 2004 2005 2006 2007 2008 20092009/ 2000
Farms represented 470 710 930 860 1 190 1 050 1 180 960 1 010 1 030 119%
Sample farms 18 27 35 39 52 48 62 54 52 56
Av. Labour in AWU 3.12 2.67 2.12 2.10 2.03 2.09 2.08 2.19 2.17 2.23 -29%
Family labour - % 61% 63% 63% 69% 69% 70% 72% 63% 64% 62% 2%
Beef specialisation - % output 73% 71% 74% 73% 74% 71% 75% 75% 76% 80% 11%
Average UAA - ha 200.8 173.3 139.8 141.8 138.7 157.9 151.2 168.1 145.9 163.8 -18%
Forage crops - ha 180.6 158.0 125.9 128.8 126.7 141.7 135.2 156.0 135.8 150.1 -17%
of which % permanent grassland 96% 94% 96% 94% 95% 93% 90% 89% 88% 90% -6%
Stocking density - LU/ha 1.0 1.0 1.0 1.0 0.9 0.9 0.9 1.0 0.9 1.0 -7%
Av. number of suckler cows - head 140.3 120.6 86.2 86.5 80.0 87.2 86.6 100.1 82.9 96.6 -31%
Number of suckler cow s per AWU 45.0 45.2 40.7 41.2 39.4 41.7 41.7 45.7 38.2 43.3 -4%
Total beef cattle - LU 190 169 126 126 114 127 129 152 128 144 -24%
Total LU on the farm 193 171 128 127 115 128 131 155 129 151 -22%
Cattle (male & female) < 1 year sold - head 64 44 34 35 39 36 34 42 39 45 -30%
Male cattle 1-2 years sold - head 11 15 10 12 10 10 11 15 11 13 21%
Male cattle sold (incl. fem. < 1 year) - head 88 73 51 51 52 51 47 61 51 60 -32%
Selling price male cattle - €/head 563 579 580 606 589 664 658 686 671 663 18%
Cattle < 1 year + male 1-2 year sold / cow 0.6 0.6 0.6 0.6 0.7 0.6 0.5 0.6 0.6 0.6 -1%
Total cattle sold - head 119 96 76 75 71 70 69 84 73 78 -34%
Total cattle sales - € 67 333 53 874 42 612 43 350 42 481 46 966 46 280 59 977 51 843 53 963 -20%
Selling price cattle - €/head 566 559 558 579 600 675 674 710 707 688 22%
OUTPUT AND COSTS in €/Cow
Breeders 2000 2001 2002 2003 2004 2005 2006 2007 2008 2009 2009/ 2000 2010e 2011e 2010 /2009 2011 /2009
TOTAL BEEF OUTPUT 557 518 475 479 555 617 595 652 658 614 10% 623 723 1% 18%
TOTAL BEEF COUPLED DP 215 247 329 339 312 0 0 0 0 0 -100% 0 0
of which suckler cow premium 150 164 205 212 207 0 0 0 0 0 -100% 0.0 0.0
of which special male premium 13 15 21 21 13 0 0 0 0 0 -100% 0 0
of which slaughter premium 4 26 33 34 36 0 0 0 0 0 -100% 0 0
of which extensification premium 49 43 70 73 56 0 0 0 0 0 -100% 0 0
of which other DP (incl. National DP) 0 0 0 0 0 0 0 0 0 0 #DIV/0! 0 0
Feed 76 61 94 117 92 100 121 145 152 140 84% 153 181 10% 30%
of which purchased feed 35 29 52 66 49 51 59 93 90 74 111% 90 107 21% 44%
of which home-grown feed 41 32 42 51 43 48 62 51 62 65 61% 64 74 -3% 13%
Animal purchase 51 22 27 19 28 34 37 34 25 15 -71% 21 24 42% 60%
Other specif ic costs 36 60 43 47 49 35 38 52 53 45 27% 46 46 0% 1%
Specific costs 162 143 164 183 170 168 196 231 230 200 23% 220 250 10% 25%
Machinery and building upkeep 92 88 63 92 90 81 83 86 89 114 24% 117 121 3% 6%
Energy (fuel, electricity) 70 70 68 79 81 98 98 108 102 100 43% 107 120 7% 20%
Contract w ork 55 51 54 70 60 49 59 68 65 89 62% 88.7 90.0 0% 1%
Taxes (exc. milk levy) 16 10 14 14 15 16 14 15 15 18 11% 18 19 1% 4%
Other direct inputs (incl. w ater, insur. on farm buildings) 121 124 156 172 167 167 173 138 150 146 21% 146 148 0% 1%
Non specific costs 354 343 355 427 413 412 426 416 422 467 32% 477 498 2% 7%
Total operating costs 516 486 519 610 583 580 622 647 652 667 29% 697 748 5% 12%
Gross margin (over operating costs) 41 32 -44 -131 -28 37 -27 4 6 -52 -228% -74 -25Gross margin (over operating costs) with CP* 256 280 284 209 284 37 -27 4 6 -52 -120% -74 -25
* CP: coupled payments e: estimateDepreciation 149 179 167 191 177 170 174 173 183 176 18%
Wages 134 96 125 116 115 109 108 127 150 169 26%
Rent 37 52 60 79 73 81 96 86 126 95 160%
Interest 76 64 56 73 67 57 55 65 60 72 -5%
External factors 247 212 242 268 255 247 259 279 336 336 36%
Net margin (before ow n factors) -354 -358 -453 -589 -460 -380 -460 -448 -513 -564 59%
Net margin (before ow n factors) with CP* -140 -111 -125 -250 -148 -380 -460 -448 -513 -564 303%* CP: coupled payments
Family labour costs 180 192 209 222 242 228 246 199 260 235 31%
Ow n capital unpaid cost 52 62 58 50 36 4 25 11 -4 38 -27%
Imputed family factors 232 254 268 272 278 232 271 210 256 273 18%
Total economic costs 1 144 1 131 1 196 1 341 1 293 1 228 1 326 1 309 1 427 1 452 27%
Net economic margin (after own factors) -587 -612 -721 -862 -738 -612 -730 -657 -769 -837 43%
Net economic margin (after own factors) with CP* -372 -365 -392 -522 -426 -612 -730 -657 -769 -837 125%
ASSETS in €/Cow
Breeders 2000 2001 2002 2003 2004 2005 2006 2007 2008 2009 2009/ 2000
Fixed assets 4 697 4 459 5 349 5 776 5 850 4 457 4 590 5 042 4 600 4 414 -6%
Current assets 895 986 944 930 903 955 985 1 080 988 1 144 28%
Total assets 5 592 5 444 6 293 6 706 6 753 5 412 5 575 6 122 5 588 5 558 -1%
INCOME per AWU in €/AWU (nominal)
Breeders 2000 2001 2002 2003 2004 2005 2006 2007 2008 2009 2009/ 2000
Total output 33 151 31 992 25 738 25 861 28 044 36 440 32 687 39 938 33 322 34 582 4%
Intermediate consumptions 28 130 28 203 26 326 31 312 28 888 33 272 32 886 37 859 31 408 36 109 28%
Balance of subsidies and taxes 20 567 27 254 28 747 34 888 32 183 35 166 34 020 37 806 30 042 32 775 59%
of w hich LFA/AWU 3 491 3 769 5 397 4 711 4 399 4 538 4 193 3 733 2 773 2 725 -22%
of w hich environmental/AWU 4 283 7 183 5 237 9 604 10 097 10 058 8 974 8 586 6 644 7 354 72%
Gross Farm Income (GFI) 25 588 31 043 28 159 29 437 31 338 38 333 33 820 39 885 31 956 31 248 22%
Depreciation 9 025 11 068 8 877 10 654 9 370 10 221 9 771 10 823 8 888 9 447 5%
Farm Net Value Added (FNVA) 16 563 19 975 19 282 18 783 21 968 28 112 24 050 29 063 23 068 21 801 32%
Wages 7 859 6 027 6 552 6 272 6 117 6 314 5 747 7 360 7 088 8 699 11%
Rent 2 239 3 288 3 212 4 331 3 798 4 695 5 352 5 198 6 086 4 857 117%
Interest 4 817 4 013 2 929 3 928 3 507 3 207 2 922 3 920 2 751 3 786 -21%
External factors 14 915 13 328 12 693 14 532 13 422 14 215 14 021 16 477 15 925 17 342 16%
Balance of subsidies and taxes on investment -28 -408 -213 -774 -463 -370 -586 -110 -125 -95 245%
Farm net income (FNI) 1 621 6 240 6 376 3 477 8 083 13 527 9 443 12 475 7 018 4 364 169%
Family labour costs 11 645 11 883 11 919 12 523 12 787 12 855 13 842 12 325 12 700 12 700 9%
Ow n capital unpaid cost 3 219 3 268 3 638 2 883 2 050 282 1 612 782 -26 2 067 -36%
Imputed family factors 14 864 15 150 15 557 15 406 14 837 13 137 15 454 13 107 12 673 14 767 -1%
Family farms only in EUR/FWU (nominal)
Ow n capital unpaid cost 5 312 5 226 5 757 4 208 2 960 402 2 230 1 238 -41 3 335 -37%
Remuneration of Family Labour (RFL) -1 006 1 773 4 144 1 826 7 606 15 125 6 333 15 840 9 606 4 406 -538%

EU beef farms report 2012
56
DenmarkSTRUCTURAL INFORMATION
Breeders 2001 2002 2003 2004 2005 2006 2007 2008 2009
Farms represented 1 370 1 330 1 110 1 320 1 570 1 170 770 1 020 1 140
Sample farms 22 25 18 23 21 17 15 20 25
Av. Labour in AWU 0.65 0.72 0.62 0.65 0.57 0.63 0.62 0.63 0.66
Family labour - % 100% 99% 100% 100% 100% 100% 97% 98% 98%
Beef specialisation - % output 71% 66% 66% 79% 77% 72% 63% 63% 68%
Average UAA - ha 26.4 31.4 27.1 35.7 24.0 29.4 25.6 30.0 36.7
Forage crops - ha 19.1 20.4 17.7 28.4 15.7 18.8 17.7 18.9 23.5
of which % permanent grassland 60% 60% 46% 56% 50% 38% 25% 34% 31%
Stocking density - LU/ha 1.9 1.7 1.6 1.4 2.2 1.9 2.0 2.1 1.6
Av. number of suckler cow s - head 24.0 22.3 19.1 25.5 24.0 21.8 22.8 25.5 24.2
Number of suckler cow s per AWU 36.9 31.0 30.8 39.2 42.1 34.6 36.7 40.5 36.6
Total beef cattle - LU 37 34 29 38 35 36 35 40 38
Total LU on the farm 37 36 29 39 35 36 35 41 38
Cattle (male & female) < 1 year sold - head 0 0 0 1 0 0 13 0 12
Male cattle 1-2 years sold - head 12 13 11 13 10 10 0 8 1
Male cattle sold (incl. fem. < 1 year) - head 13 13 11 14 10 10 13 9 14
Selling price male cattle - €/head 681 688 658 747 910 1 160 1 098 1 068 885
Cattle < 1 year + male 1-2 year sold / cow 0.5 0.6 0.6 0.6 0.4 0.5 0.6 0.4 0.6
Total cattle sold - head 27 24 24 29 22 26 16 20 21
Total cattle sales - € 16 949 15 941 14 830 20 268 19 285 28 322 17 864 19 768 18 036
Selling price cattle - €/head 623 663 611 692 891 1 077 1 083 985 861
OUTPUT AND COSTS in €/Cow
Breeders 2001 2002 2003 2004 2005 2006 2007 2008 2009 2010e 2011e 2010 /2009 2011 /2009
TOTAL BEEF OUTPUT 712 827 791 734 813 1 422 871 795 797 852 972 7% 22%
TOTAL BEEF COUPLED DP 398 425 451 509 49 66 42 40 49 49 49 0% 0%
of which suckler cow premium 213 218 230 243 0 0 0 0 0 0.0 0.0
of which special male premium 80 95 86 106 49 66 42 40 49 49 49 0% 0%
of which slaughter premium 50 71 71 82 0 0 0 0 0 0 0
of which extensification premium 44 25 48 60 0 0 0 0 0 0 0
of which other DP (incl. National DP) 11 17 17 18 0 0 0 0 0 0 0
Feed 437 360 345 390 392 634 458 606 460 486 572 6% 24%
of which purchased feed 259 171 142 272 256 465 251 363 250 283 330 13% 32%
of which home-grown feed 177 188 203 117 135 169 207 243 210 203 242 -3% 16%
Animal purchase 169 148 179 31 37 132 63 18 39 41 46 7% 18%
Other specific costs 88 77 79 71 69 127 136 99 105 106 108 1% 3%
Specific costs 694 585 603 492 498 894 657 723 604 634 726 5% 20%
Machinery and building upkeep 132 149 160 144 154 222 125 135 197 202 207 2% 5%
Energy (fuel, electricity) 35 30 45 33 39 65 43 47 50 56 67 12% 33%
Contract w ork 100 94 123 124 208 178 139 197 216 223.8 235.8 4% 9%
Taxes (exc. milk levy) 22 29 36 25 27 36 33 30 41 42 44 2% 5%
Other direct inputs (incl. w ater, insur. on farm buildings) 94 119 130 126 158 158 133 137 175 181 191 4% 9%
Non specific costs 382 421 495 451 587 659 473 547 679 705 744 4% 10%
Total operating costs 1 076 1 005 1 098 943 1 085 1 552 1 130 1 270 1 283 1 339 1 470 4% 15%
Gross margin (over operating costs) -364 -178 -308 -209 -272 -131 -258 -474 -486 -488 -498Gross margin (over operating costs) w ith CP* 34 247 144 300 -222 -65 -216 -434 -438 -439 -449
* CP: coupled payments e: estimateDepreciation 126 160 176 160 197 257 187 176 281Wages 3 13 3 6 0 2 23 11 12
Rent 38 52 54 59 42 45 34 37 84
Interest 162 250 291 232 299 270 236 374 444
External factors 203 314 348 298 341 317 293 422 540
Net margin (before ow n factors) -694 -653 -831 -667 -810 -705 -738 -1 073 -1 307Net margin (before ow n factors) w ith CP* -296 -228 -380 -158 -761 -639 -696 -1 033 -1 258* CP: coupled payments
Family labour costs 560 603 624 598 619 729 589 589 705
Ow n capital unpaid cost 139 166 131 214 188 393 143 5 62
Imputed fam ily factors 698 770 755 812 807 1 122 732 594 767
Total economic costs 2 104 2 250 2 377 2 213 2 430 3 248 2 341 2 462 2 871
Net economic margin (after own factors) -1 392 -1 423 -1 586 -1 479 -1 617 -1 826 -1 470 -1 667 -2 074
Net economic margin (after own factors) with CP* -994 -997 -1 135 -970 -1 568 -1 761 -1 428 -1 626 -2 025
ASSETS in €/Cow
Breeders 2001 2002 2003 2004 2005 2006 2007 2008 2009
Fixed assets 6 985 10 718 10 973 9 631 12 057 21 511 20 193 31 657 33 383
Current assets 1 833 1 912 2 225 2 180 2 428 2 598 2 720 2 544 2 308
Total assets 8 818 12 630 13 198 11 812 14 485 24 109 22 913 34 201 35 691
INCOME per AWU in €/AWU (nom inal)
Breeders 2001 2002 2003 2004 2005 2006 2007 2008 2009
Total output 29 801 33 739 30 259 35 591 43 249 75 461 68 020 71 049 61 536
Intermediate consumptions 42 237 37 060 37 682 43 402 52 870 72 674 71 107 87 339 81 360
Balance of subsidies and taxes 19 905 17 850 18 078 24 331 23 735 21 718 21 258 19 834 23 508
of w hich LFA/AWU 159 277 0 0 0 0 0 0 0
of w hich environmental/AWU 1 983 749 404 1 069 1 524 1 375 1 628 1 538 3 035
Gross Farm Income (GFI) 7 468 14 529 10 654 16 520 14 114 24 505 18 170 3 544 3 684
Depreciation 6 995 7 745 7 960 8 297 10 497 12 954 11 447 11 252 14 823
Farm Net Value Added (FNVA) 473 6 783 2 694 8 223 3 617 11 552 6 723 -7 709 -11 140
Wages 121 479 114 262 0 102 1 200 632 750
Rent 1 860 2 307 2 641 2 796 2 311 2 125 2 264 2 347 4 666
Interest 9 279 11 953 13 496 12 480 15 873 12 351 13 983 25 035 24 012
External factors 11 261 14 739 16 251 15 537 18 184 14 577 17 448 28 013 29 428
Balance of subsidies and taxes on investment 0 78 18 157 0 97 99 55 0
Farm net income (FNI) -10 787 -7 878 -13 539 -7 158 -14 568 -2 928 -10 626 -35 668 -40 568
Family labour costs 29 305 28 791 28 839 30 876 33 260 34 741 34 769 36 487 37 581
Ow n capital unpaid cost 7 632 7 718 5 878 11 184 10 007 18 995 8 650 -29 2 660
Imputed family factors 36 937 36 509 34 717 42 060 43 267 53 736 43 419 36 458 40 241
Family farms only in EUR/FWU (nominal)
Ow n capital unpaid cost 7 624 7 925 5 899 11 229 9 928 19 190 8 894 -30 2 708
Remuneration of Family Labour (RFL) -18 399 -16 014 -19 485 -18 416 -24 383 -22 150 -19 819 -36 180 -44 011

EU beef farms report 2012
57
GreeceSTRUCTURAL INFORMATION
Breeders 2000 2004 2008 20092009/ 2000
Farms represented 1 860 2 080 2 000 2 130 15%
Sample farms 15 17 19 20
Av. Labour in AWU 1.23 1.44 1.17 1.45 18%
Family labour - % 87% 78% 89% 86% -2%
Beef specialisation - % output 78% 79% 86% 82% 4%
Average UAA - ha 4.0 5.0 10.2 17.5 337%
Forage crops - ha 1.0 1.0 7.6 15.2 1357%
of which % permanent grassland 6% 5% 71% 95% 1558%
Stocking density - LU/ha 16.9 18.6 3.4 1.8 -89%
Av. number of suckler cows - head 25.9 31.7 32.7 46.4 80%
Number of suckler cow s per AWU 21.0 22.0 28.0 32.0 52%
Total beef cattle - LU 30 40 36 49 62%
Total LU on the farm 30 40 37 50 64%
Cattle (male & female) < 1 year sold - head 0 13 12 11 #DIV/0!
Male cattle 1-2 years sold - head 0 3 1 7 #DIV/0!
Male cattle sold (incl. fem. < 1 year) - head 3 16 15 18 574%
Selling price male cattle - €/head 0 723 890 968 #DIV/0!
Cattle < 1 year + male 1-2 year sold / cow 0.1 0.5 0.5 0.4 275%
Total cattle sold - head 3 19 17 21 688%
Total cattle sales - € 0 13 700 14 724 20 167 #DIV/0!
Selling price cattle - €/head 0 714 869 946 #DIV/0!
OUTPUT AND COSTS in €/Cow
Breeders 2000 2004 2008 2009 2009/ 2000 2010e 2011e 2010 /2009 2011 /2009
TOTAL BEEF OUTPUT 512 495 493 379 -26% 378 386 0% 2%
TOTAL BEEF COUPLED DP 310 427 23 28 -91% 28 28 0% 0%
of which suckler cow premium 212 199 0 0 -100% 0.0 0.0
of which special male premium 19 93 0 0 -100% 0 0
of which slaughter premium 80 47 0 0 -100% 0 0
of which extensification premium 0 68 0 0 #DIV/0! 0 0
of which other DP (incl. National DP) 0 21 23 28 7319639% 28 28 0% 0%
Feed 227 368 321 323 42% 359 376 11% 16%
of which purchased feed 193 320 265 284 47% 316 331 11% 17%
of which home-grown feed 34 49 56 39 14% 43 44 9% 14%
Animal purchase 2 15 35 3 54% 3 4 7% 18%
Other specific costs 18 23 20 23 28% 24 25 5% 8%
Specific costs 247 406 377 349 41% 386 404 11% 16%
Machinery and building upkeep 12 25 26 40 229% 41 41 3% 3%
Energy (fuel, electricity) 14 14 34 15 11% 20 23 27% 52%
Contract w ork 23 27 30 35 54% 35.9 35.7 3% 3%
Taxes (exc. milk levy) 1 1 1 1 -7% 1 1 5% 8%Other direct inputs (incl. w ater, insur. on farm buildings) 9 13 13 21 139% 21 21 3% 3%
Non specific costs 58 80 104 111 92% 119 122 7% 10%
Total operating costs 305 486 481 460 51% 505 526 10% 14%
Gross margin (over operating costs) 207 8 12 -82 -139% -127 -140Gross margin (over operating costs) w ith CP* 517 436 35 -53 -110% -98 -112
* CP: coupled payments e: estimateDepreciation 37 87 109 63 72%
Wages 18 38 16 12 -34%
Rent 6 12 20 9 41%
Interest 3 2 6 2 -29%
External factors 27 52 43 23 -16%
Net margin (before ow n factors) 143 -131 -140 -167 -217%
Net margin (before ow n factors) with CP* 453 296 -117 -139 -131%* CP: coupled payments
Family labour costs 170 161 203 183 8%
Ow n capital unpaid cost 47 28 18 78 65%
Imputed family factors 217 189 221 261 20%
Total economic costs 586 815 854 807 38%
Net economic margin (after own factors) -74 -320 -361 -428 479%
Net economic margin (after own factors) w ith CP* 236 107 -338 -400 -270%
ASSETS in €/Cow
Breeders 2000 2004 2008 2009 2009/ 2000
Fixed assets 1 549 2 356 2 245 2 448 58%
Current assets 339 463 413 361 7%
Total assets 1 888 2 819 2 658 2 810 49%
INCOME per AWU in €/AWU (nominal)
Breeders 2000 2004 2008 2009 2009/ 2000Total output 15 279 14 955 17 505 15 758 3%
Intermediate consumptions 8 054 12 491 16 161 16 639 107%
Balance of subsidies and taxes 7 452 12 589 14 668 19 827 166%
of w hich LFA/AWU 0 1 440 2 880 3 116 #DIV/0!
of w hich environmental/AWU 0 0 968 2 920 #DIV/0!
Gross Farm Income (GFI) 14 677 15 053 16 012 18 946 29%
Depreciation 1 015 2 728 3 664 2 344 131%
Farm Net Value Added (FNVA) 13 662 12 325 12 348 16 602 22%
Wages 519 1 001 523 425 -18%
Rent 206 386 673 392 91%
Interest 65 49 264 71 9%
External factors 790 1 436 1 460 888 12%
Balance of subsidies and taxes on investment 0 0 0 0 #DIV/0!
Farm net income (FNI) 12 872 10 889 10 888 15 713 22%
Family labour costs 4 500 4 524 6 803 7 225 61%
Ow n capital unpaid cost 1 261 858 600 2 928 132%
Imputed family factors 5 762 5 382 7 404 10 153 76%
Family farms only
Ow n capital unpaid cost 1 461 1 102 678 3 431 135%
Remuneration of Family Labour (RFL) 13 449 12 887 11 614 14 980 11%

EU beef farms report 2012
58
SpainSTRUCTURAL INFORMATION
Breeders 2000 2001 2002 2003 2004 2005 2006 2007 2008 20092009/ 2000
Farms represented 20 060 19 070 15 950 13 940 20 380 21 480 25 890 17 910 10 000 8 620 -57%
Sample farms 253 275 233 276 265 344 281 323 193 189
Av. Labour in AWU 1.34 1.31 1.26 1.30 1.29 1.29 1.25 1.36 1.20 1.29 -4%
Family labour - % 98% 98% 98% 92% 95% 95% 98% 94% 88% 93% -5%
Beef specialisation - % output 88% 90% 89% 90% 86% 88% 86% 85% 77% 84% -5%
Average UAA - ha 47.8 53.7 75.3 65.7 55.7 59.4 47.0 65.1 70.6 90.6 90%
Forage crops - ha 42.6 50.8 72.4 62.4 51.8 49.8 41.3 57.8 62.3 78.0 83%
of which % permanent grassland 94% 92% 95% 93% 90% 93% 94% 92% 88% 89% -5%
Stocking density - LU/ha 0.5 0.6 0.5 0.7 0.8 0.9 0.8 0.8 0.7 0.8 55%
Av. number of suckler cows - head 25.5 29.9 33.8 43.5 36.5 44.1 32.7 49.0 43.6 54.6 114%
Number of suckler cow s per AWU 19.0 22.8 26.8 33.5 28.3 34.2 26.1 36.0 36.4 42.3 123%
Total beef cattle - LU 28 34 39 50 42 48 36 52 50 71 153%
Total LU on the farm 29 34 40 51 43 49 37 53 53 73 155%
Cattle (male & female) < 1 year sold - head 14 17 20 24 18 27 20 30 25 31 125%
Male cattle 1-2 years sold - head 1 0 0 0 0 0 0 0 4 4 533%
Male cattle sold (incl. fem. < 1 year) - head 18 21 21 30 23 31 23 32 30 38 113%
Selling price male cattle - €/head 659 573 761 781 788 801 880 916 801 819 24%
Cattle < 1 year + male 1-2 year sold / cow 0.7 0.7 0.6 0.7 0.6 0.7 0.7 0.7 0.7 0.7 -1%
Total cattle sold - head 20 24 27 44 32 39 26 42 34 44 114%
Total cattle sales - € 13 689 13 756 18 387 34 777 24 727 30 084 22 367 37 820 26 708 35 461 159%
Selling price cattle - €/head 668 580 693 791 767 776 845 904 785 807 21%
OUTPUT AND COSTS in €/Cow
Breeders 2000 2001 2002 2003 2004 2005 2006 2007 2008 2009 2009/ 2000 2010e 2011e 2010 /2009 2011 /2009
TOTAL BEEF OUTPUT 603 501 588 799 689 697 777 818 671 710 18% 767 842 8% 19%
TOTAL BEEF COUPLED DP 228 241 267 297 247 252 173 146 195 184 -19% 184 184 0% 0%
of which suckler cow premium 165 172 178 172 125 137 143 128 174 170 3% 169.8 169.8 0% 0%
of which special male premium 6 15 5 7 9 5 0 0 0 0 -99% 0 0 0% 0%
of which slaughter premium 20 18 45 45 46 44 11 14 11 9 -52% 9 9 0% 0%
of which extensification premium 35 30 31 42 31 15 4 1 5 4 -89% 4 4 0% 0%
of which other DP (incl. National DP) 2 6 8 31 36 50 16 3 6 1 -66% 1 1 0% 0%
Feed 216 208 194 275 239 248 287 321 317 311 44% 352 424 13% 36%
of which purchased feed 184 170 173 258 212 227 270 301 282 290 58% 332 400 14% 38%
of which home-grown feed 32 39 21 16 27 21 17 20 35 21 -34% 20 24 -5% 11%
Animal purchase 56 21 36 161 127 84 70 122 60 96 73% 90 89 -6% -8%
Other specif ic costs 28 33 25 30 38 29 32 32 37 35 23% 35 35 0% 0%
Specific costs 301 262 255 465 403 362 389 475 414 443 47% 478 548 8% 24%
Machinery and building upkeep 11 17 12 20 22 12 25 21 30 27 137% 27 27 1% 2%
Energy (fuel, electricity) 22 25 19 37 39 26 30 28 42 34 52% 41 49 20% 42%
Contract w ork 8 7 8 7 10 8 9 8 13 12 48% 12.4 13.6 7% 17%
Taxes (exc. milk levy) 4 7 6 4 5 5 7 4 5 7 79% 7 8 2% 5%
Other direct inputs (incl. w ater, insur. on farm buildings) 11 14 17 20 23 18 25 18 24 21 91% 22 24 7% 17%
Non specific costs 57 71 62 88 99 70 95 79 114 101 78% 110 122 9% 21%
Total operating costs 357 333 317 552 502 431 485 554 528 544 52% 588 670 8% 23%
Gross margin (over operating costs) 246 168 271 246 186 266 292 264 143 166 -32% 179 172 8% 4%
Gross margin (over operating costs) with CP* 474 409 538 543 433 518 466 410 338 350 -26% 363 356 4% 2%
* CP: coupled payments e: estimateDepreciation 56 52 43 47 45 36 50 47 66 57 2%
Wages 8 10 5 47 43 26 9 36 43 26 221%
Rent 25 21 25 29 25 21 41 23 39 22 -11%
Interest 6 7 4 8 6 3 4 4 6 5 -17%
External factors 39 39 34 84 74 50 54 63 88 53 37%
Net margin (before ow n factors) 151 77 194 114 67 180 188 153 -10 56 -63%
Net margin (before ow n factors) with CP* 380 319 461 411 315 431 361 300 185 240 -37%* CP: coupled payments
Family labour costs 457 411 388 307 390 299 488 358 304 297 -35%
Ow n capital unpaid cost 85 94 105 57 136 147 70 72 43 124 46%
Imputed family factors 542 505 493 364 527 446 558 430 346 421 -22%
Total economic costs 994 929 888 1 048 1 148 963 1 147 1 094 1 028 1 075 8%
Net economic margin (after own factors) -391 -428 -299 -250 -459 -266 -370 -276 -357 -365 -7%
Net economic margin (after own factors) with CP* -162 -186 -32 47 -212 -14 -197 -130 -162 -181 11%
ASSETS in €/Cow
Breeders 2000 2001 2002 2003 2004 2005 2006 2007 2008 2009 2009/ 2000
Fixed assets 3 903 3 498 4 164 3 631 4 946 4 417 4 644 3 882 6 329 5 653 45%
Current assets 1 718 1 613 1 504 1 207 1 510 1 864 3 392 2 721 2 960 2 754 60%
Total assets 5 621 5 111 5 668 4 837 6 456 6 281 8 036 6 603 9 289 8 407 50%
INCOME per AWU in €/AWU (nominal)
Breeders 2000 2001 2002 2003 2004 2005 2006 2007 2008 2009 2009/ 2000
Total output 14 626 15 714 19 766 27 209 22 965 26 378 24 950 32 632 35 140 35 396 142%
Intermediate consumptions 8 683 10 566 10 744 16 987 15 457 15 189 14 563 19 330 23 940 24 005 176%
Balance of subsidies and taxes 4 648 5 760 7 681 10 465 8 447 10 824 8 585 11 402 14 457 16 369 252%
of w hich LFA/AWU 193 340 403 422 686 452 671 642 810 1 017 427%
of w hich environmental/AWU 44 100 107 282 66 69 129 217 139 303 582%
Gross Farm Income (GFI) 10 591 10 909 16 703 20 687 15 955 22 013 18 972 24 704 25 656 27 760 162%
Depreciation 1 207 1 335 1 290 1 723 1 436 1 374 1 467 1 845 3 078 2 895 140%
Farm Net Value Added (FNVA) 9 384 9 573 15 413 18 964 14 520 20 639 17 504 22 859 22 578 24 865 165%
Wages 189 233 141 1 643 1 276 933 244 1 335 2 269 1 365 622%
Rent 510 544 731 1 081 817 798 1 224 949 1 701 1 170 129%
Interest 118 203 121 277 168 124 118 169 280 238 101%
External factors 817 980 993 3 001 2 262 1 854 1 586 2 453 4 249 2 773 239%
Balance of subsidies and taxes on investment 229 316 -82 -78 -9 54 100 -165 -271 -47 -120%
Farm net income (FNI) 8 796 8 909 14 338 15 884 12 249 18 840 16 017 20 241 18 058 22 046 151%
Family labour costs 9 745 10 212 11 651 11 379 12 558 11 501 14 247 14 287 14 114 14 936 53%
Ow n capital unpaid cost 1 798 2 415 3 131 2 139 4 199 5 570 2 033 2 846 2 014 6 369 254%
Imputed family factors 11 543 12 626 14 782 13 518 16 757 17 071 16 279 17 133 16 129 21 305 85%
Family farms only in EUR/FWU (nominal)
Ow n capital unpaid cost 1 837 2 470 3 194 2 328 4 446 5 822 2 063 3 026 2 293 6 808 271%
Remuneration of Family Labour (RFL) 7 147 6 644 11 433 15 795 9 358 13 610 14 194 17 228 15 907 16 154 126%

EU beef farms report 2012
59
FinlandSTRUCTURAL INFORMATION
Breeders 2007 2008 2009
Farms represented 600 750 750
Sample farms 15 20 22
Av. Labour in AWU 1.25 1.32 1.40
Family labour - % 94% 92% 81%
Beef specialisation - % output 70% 83% 80%
Average UAA - ha 56.5 64.6 77.5
Forage crops - ha 44.9 51.3 52.0
of which % permanent grassland 4% 2% 3%
Stocking density - LU/ha 0.8 1.1 1.0
Av. number of suckler cows - head 28.5 40.5 39.4
Number of suckler cow s per AWU 22.8 30.7 28.2
Total beef cattle - LU 39 55 52
Total LU on the farm 39 56 52
Cattle (male & female) < 1 year sold - head 12 12 24
Male cattle 1-2 years sold - head 5 5 4
Male cattle sold (incl. fem. < 1 year) - head 18 18 28
Selling price male cattle - €/head 763 805 864
Cattle < 1 year + male 1-2 year sold / cow 0.6 0.4 0.7
Total cattle sold - head 26 30 42
Total cattle sales - € 19 563 23 772 33 977
Selling price cattle - €/head 755 799 809
OUTPUT AND COSTS in €/Cow
Breeders 2007 2008 2009 2010e 2011e 2010 /2009 2011 /2009
TOTAL BEEF OUTPUT 784 631 862 838 884 -3% 3%
TOTAL BEEF COUPLED DP 490 575 459 459 459 0% 0%
of which suckler cow premium 0 0 0 0.0 0.0
of which special male premium 30 25 12 12 12 0% 0%
of which slaughter premium 0 0 0 0 0
of which extensification premium 0 0 0 0 0
of which other DP (incl. National DP) 460 550 447 447 447 0% 0%
Feed 318 267 284 304 361 7% 27%
of which purchased feed 136 122 87 99 115 13% 32%
of which home-grown feed 182 146 197 206 246 5% 25%
Animal purchase 88 57 59 62 69 7% 18%
Other specific costs 113 94 113 112 112 -1% -1%
Specific costs 519 419 455 479 542 5% 19%
Machinery and building upkeep 230 255 279 290 298 4% 7%
Energy (fuel, electricity) 166 173 161 189 244 17% 52%
Contract w ork 96 249 116 117.4 120.1 2% 4%
Taxes (exc. milk levy) 4 4 4 5 5 2% 5%Other direct inputs (incl. w ater, insur. on farm buildings) 217 284 273 278 284 2% 4%
Non specific costs 712 966 834 879 951 5% 14%
Total operating costs 1 232 1 385 1 289 1 358 1 493 5% 16%
Gross margin (over operating costs) -447 -754 -427 -520 -609Gross margin (over operating costs) with CP* 43 -179 32 -61 -150
* CP: coupled payments e: estimateDepreciation 667 594 653
Wages 47 52 132
Rent 77 128 100
Interest 95 98 58
External factors 219 278 290
Net margin (before ow n factors) -1 333 -1 626 -1 370Net margin (before ow n factors) w ith CP* -843 -1 052 -911* CP: coupled payments
Family labour costs 583 663 606
Ow n capital unpaid cost 175 100 287
Imputed family factors 758 763 893
Total economic costs 2 876 3 020 3 125
Net economic margin (after own factors) -2 091 -2 389 -2 263
Net economic margin (after own factors) with CP* -1 601 -1 814 -1 804
ASSETS in €/Cow
Breeders 2007 2008 2009
Fixed assets 11 129 9 599 11 360
Current assets 1 966 2 247 2 042
Total assets 13 095 11 846 13 402
INCOME per AWU in €/AWU (nominal)
Breeders 2007 2008 2009
Total output 28 401 27 150 32 601
Intermediate consumptions 35 887 49 424 45 081
Balance of subsidies and taxes 47 192 60 464 61 261
of w hich LFA/AWU 12 277 14 011 15 412
of w hich environmental/AWU 11 602 14 948 17 615
Gross Farm Income (GFI) 39 706 38 191 48 781
Depreciation 21 754 22 303 23 352
Farm Net Value Added (FNVA) 17 952 15 888 25 429
Wages 1 325 2 071 4 380
Rent 2 566 4 520 3 405
Interest 2 845 3 371 2 017
External factors 6 736 9 962 9 802
Balance of subsidies and taxes on investment 1 272 1 011 1 195
Farm net income (FNI) 12 487 6 937 16 822
Family labour costs 18 974 24 469 21 411
Ow n capital unpaid cost 5 795 4 041 10 458
Imputed family factors 24 769 28 510 31 868
Family farms only in EUR/FWU (nominal)
Ow n capital unpaid cost 6 143 4 369 12 763
Remuneration of Family Labour (RFL) 7 093 3 131 7 767
HungarySTRUCTURAL INFORMATION
Breeders 2006
Farms represented 820
Sample farms 17
Av. Labour in AWU 1.66
Family labour - % 68%
Beef specialisation - % output 77%
Average UAA - ha 53.4
Forage crops - ha 44.1
of which % permanent grassland 77%
Stocking density - LU/ha 0.9
Av. number of suckler cow s - head 36.8
Number of suckler cow s per AWU 22.2
Total beef cattle - LU 40
Total LU on the farm 41
Cattle (male & female) < 1 year sold - head 13
Male cattle 1-2 years sold - head 1
Male cattle sold (incl. fem. < 1 year) - head 14
Selling price male cattle - €/head 396
Cattle < 1 year + male 1-2 year sold / cow 0.4
Total cattle sold - head 16
Total cattle sales - € 7 274
Selling price cattle - €/head 460
OUTPUT AND COSTS in €/Cow
Breeders 2006
TOTAL BEEF OUTPUT 281
TOTAL BEEF COUPLED DP 168
of which suckler cow premium 0
of which special male premium 5
of which slaughter premium 0
of which extensification premium 23
of which other DP (incl. National DP) 140
Feed 136
of which purchased feed 87
of which home-grown feed 50
Animal purchase 48
Other specific costs 41
Specific costs 226
Machinery and building upkeep 38
Energy (fuel, electricity) 58
Contract w ork 15
Taxes (exc. milk levy) 9Other direct inputs (incl. w ater, insur. on farm buildings) 59
Non specific costs 178
Total operating costs 404
Gross margin (over operating costs) -123Gross margin (over operating costs) w ith CP* 45* CP: coupled payments
Depreciation 54
Wages 60
Rent 34
Interest 46
External factors 140
Net margin (before own factors) -317Net margin (before own factors) with CP* -150* CP: coupled payments
Family labour costs 162
Ow n capital unpaid cost 30
Imputed family factors 192
Total economic costs 791
Net economic margin (after ow n factors) -509
Net economic margin (after ow n factors) with CP* -342
ASSETS in €/Cow
Breeders 2006
Fixed assets 2 543
Current assets 729
Total assets 3 272
INCOME per AWU /AWU (nominal)
Breeders 2006
Total output 11 853
Intermediate consumptions 14 013
Balance of subsidies and taxes 8 605
of w hich LFA/AWU 0
of w hich environmental/AWU 1 198
Gross Farm Income (GFI) 6 444
Depreciation 1 685
Farm Net Value Added (FNVA) 4 759
Wages 1 593
Rent 1 004
Interest 1 350
External factors 3 947
Balance of subsidies and taxes on investment -99
Farm net income (FNI) 713
Family labour costs 4 800
Ow n capital unpaid cost 854
Imputed family factors 5 654
Family farms only
Ow n capital unpaid cost 1 254
Remuneration of Family Labour (RFL) -26

EU beef farms report 2012
60
FranceSTRUCTURAL INFORMATION
Breeders 2000 2001 2002 2003 2004 2005 2006 2007 2008 20092009/ 2000
Farms represented 28 680 27 980 28 830 29 750 28 950 32 020 35 550 33 570 36 260 38 810 35%
Sample farms 415 391 471 473 490 529 552 555 591 635
Av. Labour in AWU 1.37 1.32 1.40 1.38 1.35 1.33 1.31 1.32 1.31 1.30 -5%
Family labour - % 94% 95% 94% 94% 95% 93% 94% 95% 94% 95% 0%
Beef specialisation - % output 81% 79% 80% 82% 82% 83% 84% 84% 83% 82% 2%
Average UAA - ha 82.4 79.4 89.1 89.2 88.6 88.0 93.2 93.4 93.3 93.6 14%
Forage crops - ha 72.9 70.3 78.6 78.6 77.9 76.4 80.2 83.0 81.9 81.2 11%
of which % permanent grassland 66% 63% 66% 65% 64% 64% 65% 64% 66% 63% -4%
Stocking density - LU/ha 1.1 1.1 1.1 1.1 1.1 1.1 1.1 1.1 1.1 1.2 6%
Av. number of suckler cows - head 52.7 50.9 57.0 56.7 55.9 55.4 57.0 59.1 59.1 59.1 12%
Number of suckler cow s per AWU 38.5 38.6 40.7 41.1 41.4 41.6 43.5 44.8 45.1 45.5 18%
Total beef cattle - LU 79 77 88 87 86 86 89 92 93 93 18%
Total LU on the farm 81 79 90 90 89 88 91 94 95 95 17%
Cattle (male & female) < 1 year sold - head 23 23 26 27 26 24 26 27 25 25 9%
Male cattle 1-2 years sold - head 5 5 5 5 5 5 4 4 5 5 6%
Male cattle sold (incl. fem. < 1 year) - head 32 31 35 35 34 34 34 35 33 34 7%
Selling price male cattle - €/head 815 691 800 845 847 918 955 906 897 913 12%
Cattle < 1 year + male 1-2 year sold / cow 0.6 0.6 0.6 0.6 0.6 0.6 0.6 0.6 0.6 0.6 -5%
Total cattle sold - head 47 44 52 54 51 50 50 50 50 51 10%
Total cattle sales - € 41 709 35 427 44 720 49 165 48 126 50 904 52 393 51 390 50 037 51 267 23%
Selling price cattle - €/head 892 797 863 912 939 1 019 1 055 1 020 1 006 1 000 12%
OUTPUT AND COSTS in €/Cow
Breeders 2000 2001 2002 2003 2004 2005 2006 2007 2008 2009 2009/ 2000 2010e 2011e 2010 /2009 2011 /2009
TOTAL BEEF OUTPUT 837 745 832 854 894 981 981 945 924 906 8% 912 985 1% 9%
TOTAL BEEF COUPLED DP 288 331 375 381 382 384 233 230 228 219 -24% 219 219 0% 0%
of which suckler cow premium 184 214 230 234 237 231 226 222 219 210 14% 210.4 210.4 0% 0%
of which special male premium 44 48 59 57 55 59 0 0 0 0 -100% 0 0
of which slaughter premium 5 14 21 23 22 22 8 8 9 8 64% 8 8 0% 0%
of which extensification premium 53 52 53 55 60 64 0 0 0 0 -100% 0 0
of which other DP (incl. National DP) 1 4 12 12 9 9 0 0 0 0 -100% 0 0 0% 0%
Feed 212 218 227 269 296 276 286 304 317 310 47% 331 369 7% 19%
of which purchased feed 98 104 115 149 167 148 152 163 182 168 71% 197 215 17% 27%
of which home-grown feed 113 114 112 120 129 128 133 141 135 142 25% 134 154 -5% 9%
Animal purchase 52 34 52 62 67 75 64 61 56 57 11% 54 54 -5% -6%
Other specif ic costs 62 65 55 61 61 65 66 70 78 76 23% 77 79 2% 5%
Specific costs 325 316 334 392 423 416 416 435 451 443 37% 462 502 4% 13%
Machinery and building upkeep 74 68 80 89 98 100 104 101 100 101 38% 104 107 2% 5%
Energy (fuel, electricity) 48 47 35 39 44 55 60 58 73 57 20% 68 77 19% 35%
Contract w ork 47 48 53 55 62 69 67 69 72 75 59% 74.2 76.6 -1% 2%
Taxes (exc. milk levy) 12 12 13 14 15 15 15 16 15 15 27% 16 16 2% 4%
Other direct inputs (incl. w ater, insur. on farm buildings) 106 104 128 136 137 144 149 152 156 148 40% 147 152 -1% 2%
Non specific costs 287 279 309 333 355 382 395 396 416 397 38% 408 428 3% 8%
Total operating costs 611 595 644 725 778 798 810 831 867 840 37% 871 930 4% 11%
Gross margin (over operating costs) 226 150 188 128 116 183 171 114 57 65 -71% 42 55 -36% -16%
Gross margin (over operating costs) with CP* 514 481 563 510 498 566 404 344 284 284 -45% 261 273 -8% -4%
* CP: coupled payments e: estimateDepreciation 195 186 198 214 245 264 280 287 285 294 51%
Wages 20 14 14 16 14 20 17 17 16 14 -27%
Rent 77 78 83 86 92 95 97 97 96 98 28%
Interest 38 35 34 34 36 38 37 39 44 44 16%
External factors 134 127 131 136 143 153 151 152 157 156 16%
Net margin (before ow n factors) -103 -164 -141 -221 -272 -235 -260 -326 -385 -385 273%
Net margin (before ow n factors) with CP* 185 167 234 160 110 149 -27 -96 -157 -166 -190%* CP: coupled payments
Family labour costs 386 359 276 303 320 322 324 318 315 324 -16%
Ow n capital unpaid cost 93 79 75 55 51 46 57 84 24 117 25%
Imputed family factors 480 438 351 358 371 368 381 403 339 441 -8%
Total economic costs 1 420 1 347 1 323 1 433 1 537 1 583 1 622 1 673 1 648 1 731 22%
Net economic margin (after own factors) -583 -602 -491 -579 -643 -602 -641 -728 -724 -826 42%
Net economic margin (after own factors) with CP* -295 -270 -117 -198 -261 -219 -408 -498 -497 -607 106%
ASSETS in €/Cow
Breeders 2000 2001 2002 2003 2004 2005 2006 2007 2008 2009 2009/ 2000
Fixed assets 3 371 3 319 3 460 3 531 3 727 3 825 3 974 3 996 4 187 4 151 23%
Current assets 1 532 1 536 1 630 1 638 1 689 1 719 1 742 1 723 1 752 1 722 12%
Total assets 4 903 4 855 5 090 5 169 5 416 5 544 5 716 5 719 5 939 5 872 20%
INCOME per AWU in €/AWU (nominal)
Breeders 2000 2001 2002 2003 2004 2005 2006 2007 2008 2009 2009/ 2000
Total output 36 740 33 731 39 286 39 611 41 231 44 904 48 394 47 964 47 734 47 418 29%
Intermediate consumptions 25 594 26 096 29 003 32 047 34 241 35 023 37 780 39 233 42 441 41 730 63%
Balance of subsidies and taxes 17 458 21 375 24 108 27 055 25 485 25 844 27 437 25 733 26 147 26 431 51%
of w hich LFA/AWU 2 135 2 535 2 361 2 378 2 647 2 758 2 698 2 931 2 873 2 824 32%
of w hich environmental/AWU 1 504 1 807 2 253 3 089 2 929 3 068 2 890 2 420 2 405 2 606 73%
Gross Farm Income (GFI) 28 604 29 010 34 391 34 619 32 474 35 725 38 051 34 464 31 440 32 119 12%
Depreciation 9 168 9 018 10 022 10 695 12 297 13 165 14 438 15 133 15 285 16 156 76%
Farm Net Value Added (FNVA) 19 437 19 992 24 369 23 925 20 177 22 560 23 613 19 331 16 156 15 964 -18%
Wages 899 713 724 815 772 1 023 953 950 924 827 -8%
Rent 3 634 3 797 4 195 4 338 4 603 4 753 4 994 5 125 5 191 5 372 48%
Interest 1 761 1 708 1 739 1 731 1 829 1 913 1 952 2 057 2 399 2 423 38%
External factors 6 294 6 218 6 659 6 884 7 205 7 689 7 899 8 131 8 514 8 622 37%
Balance of subsidies and taxes on investment 504 591 724 919 968 974 1 235 962 1 199 911 81%
Farm net income (FNI) 13 646 14 365 18 435 17 960 13 940 15 845 16 949 12 161 8 840 8 252 -40%
Family labour costs 17 927 17 285 13 890 14 855 15 797 15 789 16 573 16 737 16 874 17 714 -1%
Ow n capital unpaid cost 4 282 3 754 3 686 2 645 2 484 2 234 2 860 4 382 1 265 6 294 47%
Imputed family factors 22 208 21 039 17 577 17 499 18 281 18 023 19 433 21 118 18 139 24 009 8%
Family farms only in EUR/FWU (nominal)
Ow n capital unpaid cost 4 542 3 934 3 921 2 821 2 627 2 396 3 051 4 628 1 346 6 633 46%
Remuneration of Family Labour (RFL) 9 935 11 121 15 688 16 338 12 114 14 596 15 027 8 217 8 062 2 063 -79%

EU beef farms report 2012
61
IrelandSTRUCTURAL INFORMATION
Breeders 2000 2001 2002 2003 2004 2005 2006 2007 2008 20092009/ 2000
Farms represented 20 130 16 190 12 080 14 420 10 540 9 850 8 130 9 410 9 400 7 050 -65%
Sample farms 119 92 90 108 98 83 78 96 97 68
Av. Labour in AWU 1.03 0.97 1.01 0.99 1.03 0.99 0.98 1.04 1.14 1.12 9%
Family labour - % 98% 98% 97% 97% 96% 96% 95% 97% 97% 97% -1%
Beef specialisation - % output 92% 90% 91% 92% 90% 89% 82% 85% 87% 85% -7%
Average UAA - ha 29.1 30.0 34.4 31.9 37.4 32.9 43.0 45.3 48.0 43.3 49%
Forage crops - ha 29.0 30.0 34.1 31.6 36.9 32.3 42.1 44.8 47.4 41.9 45%
of which % permanent grassland 98% 99% 98% 98% 96% 96% 97% 97% 97% 97% -1%
Stocking density - LU/ha 0.9 0.9 0.9 1.0 0.9 1.1 0.9 0.9 0.9 0.9 -1%
Av. number of suckler cows - head 19.7 18.7 21.5 21.7 21.8 22.9 23.4 25.5 29.4 25.1 27%
Number of suckler cow s per AWU 19.1 19.3 21.3 21.9 21.2 23.1 23.9 24.5 25.8 22.4 17%
Total beef cattle - LU 26 26 30 30 31 35 36 37 43 36 40%
Total LU on the farm 27 27 32 31 33 36 38 39 45 39 42%
Cattle (male & female) < 1 year sold - head 0 7 8 8 8 8 9 10 10 9 #DIV/0!
Male cattle 1-2 years sold - head 0 3 3 3 3 2 3 4 5 3 #DIV/0!
Male cattle sold (incl. fem. < 1 year) - head 2 11 13 12 11 12 13 14 16 14 764%
Selling price male cattle - €/head 0 552 546 556 586 607 646 609 715 627 #DIV/0!
Cattle < 1 year + male 1-2 year sold / cow 0.1 0.6 0.6 0.6 0.5 0.5 0.6 0.6 0.6 0.6 579%
Total cattle sold - head 2 17 20 20 20 22 24 25 27 26 1508%
Total cattle sales - € 0 9 152 11 185 11 071 12 021 14 262 16 845 16 291 20 385 18 156 #DIV/0!
Selling price cattle - €/head 0 545 559 549 599 643 700 661 752 701 #DIV/0!
OUTPUT AND COSTS in €/Cow
Breeders 2000 2001 2002 2003 2004 2005 2006 2007 2008 2009 2009/ 2000 2010e 2011e 2010 /2009 2011 /2009
TOTAL BEEF OUTPUT 607 523 569 551 624 715 758 648 748 678 12% 676 804 0% 19%
TOTAL BEEF COUPLED DP 357 312 341 339 362 0 0 0 43 25 -93% 25 25 0% 0%
of which suckler cow premium 185 208 229 216 225 0 0 0 0 0 -100% 0.0 0.0
of which special male premium 24 26 29 21 31 0 0 0 0 0 -100% 0 0
of which slaughter premium 4 4 7 10 12 0 0 0 0 0 -100% 0 0
of which extensification premium 53 73 70 78 81 0 0 0 0 0 -100% 0 0
of which other DP (incl. National DP) 91 0 6 13 13 0 0 0 43 25 -72% 25 25 0% 0%
Feed 147 153 166 174 167 191 216 208 249 283 92% 288 317 2% 12%
of which purchased feed 85 88 102 98 97 102 111 123 140 173 105% 190 199 10% 15%
of which home-grown feed 63 65 64 77 70 89 105 85 109 109 74% 98 118 -10% 8%
Animal purchase 98 37 56 63 69 116 124 86 88 81 -17% 86 133 6% 64%
Other specif ic costs 63 70 81 65 65 73 77 81 80 84 33% 84 84 0% 0%
Specific costs 308 259 303 302 301 381 418 376 417 448 45% 459 535 2% 19%
Machinery and building upkeep 93 99 95 92 92 106 121 106 100 108 17% 107 106 -1% -2%
Energy (fuel, electricity) 25 29 28 29 29 37 39 43 56 63 150% 73 84 16% 33%
Contract w ork 73 70 64 61 64 76 78 73 76 77 5% 78.0 78.4 1% 1%
Taxes (exc. milk levy) 4 2 2 3 3 4 4 3 4 4 -1% 4 4 -2% -1%
Other direct inputs (incl. w ater, insur. on farm buildings) 30 35 33 32 34 32 36 44 51 75 148% 75 76 1% 1%
Non specific costs 225 235 223 217 223 254 278 269 286 328 45% 338 349 3% 6%
Total operating costs 534 494 525 519 524 635 696 645 703 776 45% 796 883 3% 14%
Gross margin (over operating costs) 73 30 44 33 101 81 62 3 45 -98 -235% -120 -79Gross margin (over operating costs) with CP* 430 342 385 371 463 81 62 3 87 -73 -117% -95 -53
* CP: coupled payments e: estimateDepreciation 104 104 107 97 188 171 204 200 243 168 62%
Wages 9 10 12 11 17 26 23 14 16 15 57%
Rent 44 40 43 49 53 31 37 32 33 40 -8%
Interest 20 20 18 19 16 18 24 32 36 37 81%
External factors 73 69 73 78 85 74 84 78 85 92 25%
Net margin (before ow n factors) -104 -144 -135 -143 -172 -165 -226 -274 -284 -358 245%
Net margin (before ow n factors) with CP* 253 168 206 195 190 -165 -226 -274 -241 -333 -232%* CP: coupled payments
Family labour costs 557 625 590 622 671 657 643 657 692 735 32%
Ow n capital unpaid cost 205 229 193 209 236 206 214 214 209 482 135%
Imputed family factors 762 853 784 832 907 863 857 871 901 1 217 60%
Total economic costs 1 473 1 521 1 488 1 526 1 703 1 743 1 842 1 794 1 932 2 253 53%
Net economic margin (after own factors) -866 -997 -919 -975 -1 079 -1 028 -1 084 -1 145 -1 185 -1 575 82%
Net economic margin (after own factors) with CP* -510 -686 -578 -636 -717 -1 028 -1 084 -1 145 -1 142 -1 550 204%
ASSETS in €/Cow
Breeders 2000 2001 2002 2003 2004 2005 2006 2007 2008 2009 2009/ 2000
Fixed assets 10 602 11 363 12 648 12 698 15 697 21 166 29 961 29 126 27 050 24 912 135%
Current assets 643 714 781 777 791 994 1 042 938 1 086 1 132 76%
Total assets 11 245 12 077 13 429 13 475 16 488 22 160 31 003 30 064 28 137 26 044 132%
INCOME per AWU in €/AWU (nominal)
Breeders 2000 2001 2002 2003 2004 2005 2006 2007 2008 2009 2009/ 2000
Total output 11 066 10 970 12 573 12 162 13 597 15 653 18 447 16 115 22 837 18 653 69%
Intermediate consumptions 9 062 9 690 11 099 10 902 10 807 13 552 15 986 15 540 20 912 20 892 131%
Balance of subsidies and taxes 9 116 10 094 12 474 11 737 13 573 14 941 18 847 17 890 19 559 17 297 90%
of w hich LFA/AWU 0 2 153 2 641 2 478 2 419 2 302 2 781 2 724 2 699 2 347 #DIV/0!
of w hich environmental/AWU 2 135 1 885 2 391 1 793 2 575 2 758 3 989 3 618 3 768 3 514 65%
Gross Farm Income (GFI) 11 120 11 374 13 949 12 997 16 362 17 041 21 308 18 464 21 485 15 058 35%
Depreciation 2 150 2 217 2 510 2 333 4 483 4 468 5 979 5 711 7 166 4 387 104%
Farm Net Value Added (FNVA) 8 970 9 157 11 439 10 665 11 879 12 573 15 329 12 754 14 319 10 671 19%
Wages 191 213 334 295 462 656 757 411 493 378 98%
Rent 929 853 982 1 147 1 219 783 1 109 952 938 1 055 14%
Interest 434 446 420 452 395 457 740 944 1 100 996 130%
External factors 1 554 1 512 1 736 1 895 2 076 1 897 2 605 2 308 2 531 2 430 56%
Balance of subsidies and taxes on investment 82 244 371 -25 -332 -553 -705 603 730 4 282 5119%
Farm net income (FNI) 7 499 7 889 10 074 8 745 9 471 10 124 12 019 11 049 12 518 12 524 67%
Family labour costs 11 578 13 345 13 748 14 716 15 708 16 998 18 451 18 738 20 351 18 662 61%
Ow n capital unpaid cost 4 237 4 884 4 522 5 003 5 608 5 411 6 242 6 097 6 239 12 419 193%
Imputed family factors 15 815 18 228 18 271 19 719 21 316 22 410 24 693 24 835 26 589 31 082 97%
Family farms only in EUR/FWU (nominal)
Ow n capital unpaid cost 4 336 4 962 4 658 5 132 5 834 5 626 6 538 6 274 6 417 12 719 193%
Remuneration of Family Labour (RFL) 3 338 3 053 5 718 3 840 4 019 4 899 6 050 5 096 6 459 107 -97%

EU beef farms report 2012
62
ItalySTRUCTURAL INFORMATION
Breeders 2000 2001 2002 2003 2004 2005 2006 2007 2008 20092009/ 2000
Farms represented 9 190 6 690 5 440 5 090 6 960 7 870 7 310 7 220 6 310 7 550 -18%
Sample farms 297 218 189 169 172 188 194 187 117 127
Av. Labour in AWU 1.32 1.25 1.34 1.42 1.41 1.32 1.44 1.39 1.41 1.29 -2%
Family labour - % 97% 96% 92% 93% 86% 92% 93% 90% 87% 91% -6%
Beef specialisation - % output 71% 69% 68% 73% 71% 70% 72% 70% 72% 72% 1%
Average UAA - ha 29.9 31.9 37.7 46.8 39.5 37.9 39.1 42.1 53.1 46.4 55%
Forage crops - ha 25.9 27.9 32.8 40.7 35.1 32.0 34.8 37.8 47.9 42.0 62%
of which % permanent grassland 74% 71% 82% 23% 20% 11% 25% 34% 57% 40% -46%
Stocking density - LU/ha 0.9 0.8 0.9 0.9 0.9 1.0 1.1 0.9 0.8 0.8 -13%
Av. number of suckler cows - head 20.2 20.9 26.1 29.7 28.7 25.1 33.7 27.6 32.7 25.8 28%
Number of suckler cow s per AWU 15.3 16.7 19.5 20.9 20.4 19.0 23.4 19.8 23.2 20.0 31%
Total beef cattle - LU 24 25 33 36 34 32 38 33 41 32 31%
Total LU on the farm 25 25 33 38 34 32 39 33 41 32 29%
Cattle (male & female) < 1 year sold - head n.a. n.a. n.a. n.a. n.a. n.a. 13 7 16 11 #VALUE!
Male cattle 1-2 years sold - head n.a. n.a. n.a. n.a. n.a. n.a. 4 6 2 3 #VALUE!
Male cattle sold (incl. fem. < 1 year) - head 2 11 13 15 16 14 19 15 21 15 570%
Selling price male cattle - €/head 0 0 0 0 0 0 909 952 888 980 #DIV/0!
Cattle < 1 year + male 1-2 year sold / cow 0.1 0.5 0.5 0.5 0.6 0.6 0.6 0.5 0.6 0.6 424%
Total cattle sold - head 2 11 13 15 16 14 26 23 27 22 846%
Total cattle sales - € 0 12 682 17 052 19 741 17 425 18 815 23 786 23 742 25 443 21 779 #DIV/0!
Selling price cattle - €/head n.a. 1 167 1 337 1 330 1 103 1 333 924 1 017 935 1 011 #DIV/0!
OUTPUT AND COSTS in €/Cow
Breeders 2000 2001 2002 2003 2004 2005 2006 2007 2008 2009 2009/ 2000 2010e 2011e 2010 /2009 2011 /2009
TOTAL BEEF OUTPUT 701 698 709 715 631 842 828 871 886 861 23% 843 906 -2% 5%
TOTAL BEEF COUPLED DP 166 192 226 248 238 17 15 18 14 11 -94% 11 11 0% 0%
of which suckler cow premium 149 166 187 183 184 0 0 0 0 0 -100% 0.0 0.0
of which special male premium 15 22 29 35 19 0 0 0 0 0 -100% 0 0
of which slaughter premium 1 2 6 13 11 0 0 0 0 0 -100% 0 0
of which extensification premium 1 1 4 17 17 0 0 0 0 0 -100% 0 0
of which other DP (incl. National DP) 0 1 0 0 8 17 15 18 14 11 50468% 11 11 0% 0%
Feed 261 255 295 264 298 293 287 276 246 213 -18% 232 246 9% 15%
of which purchased feed 147 149 187 176 221 189 200 193 176 121 -18% 135 142 12% 17%
of which home-grown feed 114 106 107 88 78 104 87 83 70 93 -19% 98 104 5% 12%
Animal purchase 31 22 17 14 18 13 26 70 100 51 64% 51 47 -2% -8%
Other specif ic costs 25 21 18 19 17 20 18 25 36 43 74% 44 45 2% 4%
Specific costs 317 298 330 298 333 326 331 371 382 308 -3% 327 338 6% 10%
Machinery and building upkeep 24 27 21 24 22 24 20 20 14 7 -69% 8 8 3% 6%
Energy (fuel, electricity) 39 39 33 42 47 56 45 48 50 52 33% 55 62 6% 20%
Contract w ork 14 16 19 14 18 17 13 20 9 14 1% 14.5 15.0 3% 6%
Taxes (exc. milk levy) 9 8 8 7 8 9 8 8 24 13 55% 14 14 2% 5%
Other direct inputs (incl. w ater, insur. on farm buildings) 25 23 18 20 23 31 23 26 19 28 13% 29 30 3% 6%
Non specific costs 110 112 99 107 118 138 108 122 116 115 4% 119 129 4% 12%
Total operating costs 427 411 429 405 452 465 440 493 498 422 -1% 446 467 6% 10%
Gross margin (over operating costs) 275 287 280 310 180 377 388 379 388 438 60% 397 439 -9% 0%
Gross margin (over operating costs) with CP* 441 479 505 559 418 394 404 397 402 449 2% 408 450 -9% 0%
* CP: coupled payments e: estimateDepreciation 155 148 130 136 119 158 113 123 169 225 45%
Wages 26 25 26 36 76 43 26 43 49 45 72%
Rent 33 29 40 51 37 48 30 44 35 39 17%
Interest 7 4 1 0 8 1 2 2 0 2 -76%
External factors 66 59 67 87 121 91 58 89 84 86 29%
Net margin (before ow n factors) 53 80 83 87 -61 128 218 166 135 128 140%
Net margin (before ow n factors) with CP* 219 272 309 335 177 145 233 184 149 138 -37%* CP: coupled payments
Family labour costs 723 647 579 593 545 656 518 561 527 702 -3%
Ow n capital unpaid cost 135 133 98 86 105 95 81 109 77 229 70%
Imputed family factors 858 780 677 679 650 751 599 670 605 931 8%
Total economic costs 1 506 1 398 1 303 1 308 1 342 1 465 1 209 1 375 1 356 1 664 10%
Net economic margin (after own factors) -805 -700 -594 -592 -711 -623 -381 -504 -470 -803 0%
Net economic margin (after own factors) with CP* -639 -508 -368 -344 -472 -606 -366 -485 -456 -793 24%
ASSETS in €/Cow
Breeders 2000 2001 2002 2003 2004 2005 2006 2007 2008 2009 2009/ 2000
Fixed assets 11 906 12 177 9 113 7 291 8 089 10 964 8 186 9 167 8 431 10 776 -9%
Current assets 915 856 1 008 769 615 2 139 1 644 1 662 1 301 2 024 121%
Total assets 12 821 13 033 10 121 8 060 8 704 13 104 9 830 10 830 9 731 12 799 0%
INCOME per AWU in €/AWU (nominal)
Breeders 2000 2001 2002 2003 2004 2005 2006 2007 2008 2009 2009/ 2000
Total output 19 812 22 143 27 081 28 729 25 672 29 089 32 760 29 083 30 726 27 510 39%
Intermediate consumptions 12 206 12 891 15 732 17 873 17 511 16 616 18 159 15 998 15 297 13 352 9%
Balance of subsidies and taxes 4 368 5 409 6 994 8 634 7 498 7 852 7 766 6 857 6 390 8 727 100%
of w hich LFA/AWU 0 241 414 462 369 629 488 267 869 1 220 #DIV/0!
of w hich environmental/AWU 1 055 829 546 711 633 1 251 924 701 698 819 -22%
Gross Farm Income (GFI) 11 974 14 660 18 343 19 490 15 659 20 325 22 366 19 941 21 819 22 884 91%
Depreciation 3 320 3 675 3 629 3 987 3 513 4 375 3 840 3 610 5 524 6 231 88%
Farm Net Value Added (FNVA) 8 654 10 986 14 714 15 503 12 146 15 950 18 526 16 331 16 295 16 653 92%
Wages 580 614 840 1 128 2 308 1 269 850 1 200 1 516 1 302 124%
Rent 711 719 1 154 1 425 1 068 1 357 1 011 1 199 1 152 1 038 46%
Interest 141 116 32 10 185 22 66 56 10 43 -69%
External factors 1 433 1 450 2 026 2 562 3 561 2 647 1 927 2 455 2 678 2 383 66%
Balance of subsidies and taxes on investment 3 108 125 -158 35 186 50 0 -4 26 914%
Farm net income (FNI) 7 224 9 644 12 813 12 783 8 620 13 488 16 649 13 876 13 613 14 296 98%
Family labour costs 15 551 16 077 16 311 17 071 15 376 17 714 17 535 16 410 17 027 19 043 22%
Ow n capital unpaid cost 2 858 3 204 2 686 2 545 3 089 2 609 2 674 3 144 2 578 6 003 110%
Imputed family factors 18 410 19 281 18 997 19 615 18 465 20 323 20 209 19 554 19 605 25 047 36%
Family farms only in EUR/FWU (nominal)
Ow n capital unpaid cost 2 946 3 330 2 916 2 742 3 575 2 822 2 865 3 509 2 958 6 637 125%
Remuneration of Family Labour (RFL) 4 723 6 760 10 991 11 032 6 399 11 767 14 973 11 979 12 663 9 168 94%

EU beef farms report 2012
63
LuxembourgSTRUCTURAL INFORMATION
Breeders 2000 2001 2002 2003 2004 2005 2006 2007 2008 20092009/ 2000
Farms represented 160 190 170 170 170 170 180 130 150 120 -25%
Sample farms 24 32 40 36 38 21 22 25 23 26
Av. Labour in AWU 1.31 1.18 1.19 1.15 1.17 1.13 1.00 1.09 1.09 1.19 -9%
Family labour - % 94% 95% 92% 92% 95% 100% 97% 99% 99% 97% 3%
Beef specialisation - % output 71% 71% 71% 73% 74% 76% 73% 72% 73% 75% 6%
Average UAA - ha 63.7 60.3 66.0 71.2 68.0 71.9 61.4 70.9 57.7 72.5 14%
Forage crops - ha 49.4 47.8 52.8 57.4 55.6 60.7 48.1 58.1 48.2 58.7 19%
of which % permanent grassland 76% 74% 75% 77% 78% 79% 79% 79% 81% 81% 6%
Stocking density - LU/ha 1.6 1.6 1.5 1.3 1.4 1.2 1.2 1.3 1.4 1.4 -10%
Av. number of suckler cows - head 50.4 48.5 49.8 49.6 48.6 46.0 37.2 49.1 44.9 53.8 7%
Number of suckler cow s per AWU 38.5 41.1 41.9 43.1 41.5 40.7 37.2 45.0 41.2 45.2 18%
Total beef cattle - LU 79 75 77 76 76 72 59 76 69 85 7%
Total LU on the farm 80 76 82 77 78 72 59 76 69 85 5%
Cattle (male & female) < 1 year sold - head 22 19 22 26 23 21 18 26 24 25 12%
Male cattle 1-2 years sold - head 6 5 5 4 4 5 2 3 3 5 -12%
Male cattle sold (incl. fem. < 1 year) - head 28 25 28 31 27 27 20 30 27 30 8%
Selling price male cattle - €/head 846 826 794 859 881 900 1 015 898 815 906 7%
Cattle < 1 year + male 1-2 year sold / cow 0.6 0.5 0.6 0.6 0.6 0.6 0.6 0.6 0.6 0.6 1%
Total cattle sold - head 42 36 48 44 44 44 34 45 41 51 22%
Total cattle sales - € 35 712 28 845 37 179 37 775 38 832 39 118 34 098 42 884 35 093 47 499 33%
Selling price cattle - €/head 850 797 778 857 879 887 1 015 953 863 930 9%
OUTPUT AND COSTS in €/Cow
Breeders 2000 2001 2002 2003 2004 2005 2006 2007 2008 2009 2009/ 2000 2010e 2011e 2010 /2009 2011 /2009
TOTAL BEEF OUTPUT 779 667 701 809 838 867 951 919 782 854 10% 859 909 1% 6%
TOTAL BEEF COUPLED DP 290 338 386 392 361 2 0 0 0 0 -100% 0 0
of which suckler cow premium 234 242 271 275 247 0 0 0 0 0 -100% 0.0 0.0
of which special male premium 16 25 30 26 37 0 0 0 0 0 -100% 0 0
of which slaughter premium 15 27 44 47 44 2 0 0 0 0 -100% 0 0
of which extensification premium 24 44 40 44 33 0 0 0 0 0 -100% 0 0
of which other DP (incl. National DP) 0 0 0 0 0 0 0 0 0 0 -100% 0 0
Feed 201 216 212 224 244 190 236 217 228 235 17% 259 324 10% 38%
of which purchased feed 74 82 80 78 96 70 91 101 93 87 18% 104 130 20% 50%
of which home-grown feed 128 134 132 146 147 120 145 117 134 148 16% 155 194 5% 31%
Animal purchase 58 29 54 56 92 74 98 64 78 64 11% 69 76 7% 18%
Other specif ic costs 81 79 91 74 84 89 113 106 94 110 36% 110 109 0% -1%
Specific costs 340 324 356 354 420 353 446 388 399 410 20% 437 509 7% 24%
Machinery and building upkeep 78 74 90 92 110 104 118 128 106 114 46% 117 124 3% 10%
Energy (fuel, electricity) 41 48 46 47 59 85 85 69 80 71 72% 85 96 19% 34%
Contract w ork 52 48 68 64 74 74 71 75 69 96 85% 98.6 104.3 3% 9%
Taxes (exc. milk levy) 8 7 9 10 10 12 13 12 13 12 59% 13 13 3% 7%
Other direct inputs (incl. w ater, insur. on farm buildings) 74 83 95 105 111 125 135 116 105 115 56% 119 126 3% 9%
Non specific costs 252 261 308 318 365 400 422 400 373 408 62% 432 463 6% 13%
Total operating costs 593 585 664 672 784 753 868 788 772 818 38% 869 972 6% 19%
Gross margin (over operating costs) 186 82 36 137 54 114 82 132 10 36 -81% -10 -64Gross margin (over operating costs) with CP* 476 419 422 529 415 116 82 132 10 36 -92% -10 -64
* CP: coupled payments e: estimateDepreciation 264 302 302 349 344 519 470 450 386 441 67%
Wages 18 14 25 16 9 0 11 5 4 12 -35%
Rent 66 64 82 89 86 95 96 93 69 94 42%
Interest 47 67 49 45 52 47 45 57 64 52 12%
External factors 131 145 157 150 147 142 153 155 136 158 21%
Net margin (before ow n factors) -209 -365 -423 -363 -437 -547 -541 -474 -513 -563 169%
Net margin (before ow n factors) with CP* 81 -28 -37 29 -76 -545 -541 -474 -513 -563 -798%* CP: coupled payments
Family labour costs 272 272 285 275 300 341 370 332 380 382 40%
Ow n capital unpaid cost 96 116 140 83 16 -18 88 131 46 269 181%
Imputed family factors 367 388 426 358 315 323 458 463 426 650 77%
Total economic costs 1 356 1 420 1 549 1 529 1 591 1 737 1 950 1 856 1 720 2 067 52%
Net economic margin (after own factors) -577 -754 -848 -721 -752 -870 -999 -937 -939 -1 213 110%
Net economic margin (after own factors) with CP* -287 -416 -463 -329 -391 -868 -999 -937 -939 -1 213 323%
ASSETS in €/Cow
Breeders 2000 2001 2002 2003 2004 2005 2006 2007 2008 2009 2009/ 2000
Fixed assets 9 407 10 133 9 617 11 436 11 260 14 952 14 744 12 825 12 966 12 621 34%
Current assets 1 650 1 707 1 803 2 256 2 404 2 753 2 536 2 309 1 648 2 275 38%
Total assets 11 056 11 841 11 420 13 692 13 664 17 705 17 280 15 134 14 613 14 896 35%
INCOME per AWU in €/AWU (nominal)
Breeders 2000 2001 2002 2003 2004 2005 2006 2007 2008 2009 2009/ 2000
Total output 40 240 39 300 41 113 46 810 43 332 42 339 66 548 54 708 40 182 48 414 20%
Intermediate consumptions 27 689 30 860 35 751 34 802 37 543 35 134 61 061 43 567 38 056 44 868 62%
Balance of subsidies and taxes 26 922 32 305 35 113 40 206 33 966 37 783 34 348 37 356 28 948 33 586 25%
of w hich LFA/AWU 5 883 6 196 6 634 7 226 7 360 8 328 6 689 8 243 6 407 7 408 26%
of w hich environmental/AWU 4 073 5 079 5 407 7 649 7 504 8 459 8 363 8 080 6 096 7 230 78%
Gross Farm Income (GFI) 39 473 40 745 40 475 52 215 39 754 44 988 39 834 48 497 31 074 37 132 -6%
Depreciation 14 409 17 942 18 138 21 212 19 578 28 558 24 465 28 978 22 194 27 036 88%
Farm Net Value Added (FNVA) 25 063 22 803 22 336 31 003 20 177 16 430 15 369 19 518 8 880 10 096 -60%
Wages 931 770 1 331 942 668 0 713 327 226 847 -9%
Rent 3 631 3 588 4 687 5 177 4 813 5 172 4 780 5 601 3 789 5 578 54%
Interest 2 472 3 938 2 892 2 726 2 927 2 692 2 271 3 630 3 509 3 115 26%
External factors 7 035 8 296 8 910 8 845 8 408 7 864 7 763 9 559 7 523 9 540 36%
Balance of subsidies and taxes on investment -547 -791 -338 -1 488 -1 747 677 1 591 5 146 851 3 916 -817%
Farm net income (FNI) 17 482 13 716 13 089 20 670 10 021 9 242 9 197 15 106 2 209 4 472 -74%
Family labour costs 15 056 15 710 16 691 16 224 17 102 18 484 19 025 20 237 21 818 22 977 53%
Ow n capital unpaid cost 5 030 6 702 8 298 4 946 885 -1 007 4 693 8 242 2 747 16 304 224%
Imputed family factors 20 086 22 412 24 990 21 170 17 986 17 477 23 718 28 479 24 565 39 281 96%
Family farms only in EUR/FWU (nominal)
Ow n capital unpaid cost 5 383 7 043 8 933 5 356 934 -1 007 4 808 8 326 2 769 16 747 211%
Remuneration of Family Labour (RFL) 13 324 7 371 5 156 17 027 9 646 10 244 4 614 6 933 -543 -12 153 -191%

EU beef farms report 2012
64
LatviaSTRUCTURAL INFORMATION
Breeders 2009
Farms represented 730
Sample farms 22
Av. Labour in AWU 1.62Family labour - % 83%
Beef specialisation - % output 70%
Average UAA - ha 80.9
Forage crops - ha 74.4
of which % permanent grassland 62%
Stocking density - LU/ha 0.4
Av. number of suckler cows - head 19.7
Number of suckler cow s per AWU 12.1
Total beef cattle - LU 28
Total LU on the farm 29
Cattle (male & female) < 1 year sold - head 7
Male cattle 1-2 years sold - head 3
Male cattle sold (incl. fem. < 1 year) - head 10
Selling price male cattle - €/head 414
Cattle < 1 year + male 1-2 year sold / cow 0.5
Total cattle sold - head 15
Total cattle sales - € 6 619
Selling price cattle - €/head 441
OUTPUT AND COSTS in €/Cow
Breeders 2009 2010e 2011e 2010 /2009 2011 /2009
TOTAL BEEF OUTPUT 411 414 478 1% 16%
TOTAL BEEF COUPLED DP 342 342 342 0% 0%
of which suckler cow premium 255 255.1 255.1 0% 0%
of which special male premium 0 0 0
of which slaughter premium 11 11 11 0% 0%
of which extensification premium 0 0 0
of which other DP (incl. National DP) 76 76 76 0% 0%
Feed 179 224 278 25% 55%
of which purchased feed 54 69 85 27% 57%
of which home-grown feed 125 155 193 24% 54%
Animal purchase 15 16 18 7% 18%
Other specif ic costs 32 32 32 0% 2%
Specific costs 226 272 328 20% 45%
Machinery and building upkeep 46 42 45 -7% -1%
Energy (fuel, electricity) 147 163 189 11% 29%
Contract w ork 19 17.3 17.9 -11% -8%
Taxes (exc. milk levy) 10 10 10 -1% 3%
Other direct inputs (incl. w ater, insur. on farm buildings) 39 35 36 -11% -8%
Non specific costs 261 267 298 2% 14%
Total operating costs 487 539 626 11% 29%
Gross margin (over operating costs) -75 -125 -149Gross margin (over operating costs) w ith CP* 266 217 193
* CP: coupled payments e: estimateDepreciation 237
Wages 37Rent 8
Interest 39
External factors 84
Net margin (before own factors) -396Net margin (before own factors) w ith CP* -55* CP: coupled payments
Family labour costs 300Ow n capital unpaid cost 180
Imputed family factors 480
Total economic costs 1 288Net economic margin (after own factors) -876
Net economic margin (after own factors) w ith CP* -535
ASSETS in €/Cow
Breeders 2009
Fixed assets 3 297
Current assets 2 304
Total assets 5 601
INCOME per AWU in €/AWU (nominal)
Breeders 2009
Total output 13 581
Intermediate consumptions 12 896
Balance of subsidies and taxes 14 381
of w hich LFA/AWU 1 570
of w hich environmental/AWU 4 491Gross Farm Income (GFI) 15 066
Depreciation 3 796
Farm Net Value Added (FNVA) 11 270
Wages 687Rent 131
Interest 641
External factors 1 459
Balance of subsidies and taxes on investment 2 081
Farm net income (FNI) 11 892
Family labour costs 5 218Ow n capital unpaid cost 3 011
Imputed family factors 8 228
Family farms in EUR/FWU (nominal)
Ow n capital unpaid cost 3 636
Remuneration of Family Labour (RFL) 9 831
PolandSTRUCTURAL INFORMATION
Breeders 2009
Farms represented 1 410
Sample farms 19
Av. Labour in AWU 1.44Family labour - % 98%
Beef specialisation - % output 74%
Average UAA - ha 32.0
Forage crops - ha 21.4
of which % permanent grassland 76%
Stocking density - LU/ha 1.0
Av. number of suckler cows - head 13.9
Number of suckler cow s per AWU 9.6
Total beef cattle - LU 20
Total LU on the farm 22
Cattle (male & female) < 1 year sold - head 4
Male cattle 1-2 years sold - head 3
Male cattle sold (incl. fem. < 1 year) - head 7
Selling price male cattle - €/head 527
Cattle < 1 year + male 1-2 year sold / cow 0.5
Total cattle sold - head 12
Total cattle sales - € 6 188
Selling price cattle - €/head 524
OUTPUT AND COSTS in €/Cow
Breeders 2009 2010e 2011e 2010 /2009 2011 /2009
TOTAL BEEF OUTPUT 564 586 710 4% 26%
TOTAL BEEF COUPLED DP 0 0 0
of which suckler cow premium 0 0.0 0.0
of which special male premium 0 0 0
of which slaughter premium 0 0 0
of which extensification premium 0 0 0
of which other DP (incl. National DP) 0 0 0
Feed 195 232 284 19% 45%
of which purchased feed 14 17 21 27% 57%
of which home-grown feed 181 215 262 18% 45%
Animal purchase 34 36 40 7% 18%
Other specif ic costs 21 21 21 2% 4%
Specific costs 249 289 345 16% 38%
Machinery and building upkeep 52 53 57 2% 9%
Energy (fuel, electricity) 86 92 102 7% 18%
Contract w ork 13 13.7 15.5 2% 16%
Taxes (exc. milk levy) 15 16 16 3% 7%
Other direct inputs (incl. w ater, insur. on farm buildings) 37 38 43 2% 16%
Non specific costs 204 213 234 4% 14%
Total operating costs 454 502 579 10% 27%
Gross margin (over operating costs) 110 85 132 -23% 20%Gross margin (over operating costs) w ith CP* 110 85 132 -23% 20%
* CP: coupled payments e: estimateDepreciation 193Wages 8Rent 9
Interest 14
External factors 31
Net margin (before own factors) -115Net margin (before own factors) w ith CP* -115* CP: coupled payments
Family labour costs 415
Ow n capital unpaid cost 134
Imputed family factors 550
Total economic costs 1 228
Net economic margin (after own factors) -664Net economic margin (after own factors) w ith CP* -664
ASSETS in €/Cow
Breeders 2009
Fixed assets 11 427
Current assets 1 031
Total assets 12 458
INCOME per AWU in €/AWU (nominal)
Breeders 2009Total output 7 700
Intermediate consumptions 6 684
Balance of subsidies and taxes 6 815
of w hich LFA/AWU 843
of w hich environmental/AWU 1 859Gross Farm Income (GFI) 7 831
Depreciation 2 522
Farm Net Value Added (FNVA) 5 310
Wages 85
Rent 114
Interest 175
External factors 374
Balance of subsidies and taxes on investment -114
Farm net income (FNI) 4 822
Family labour costs 5 443Ow n capital unpaid cost 1 688
Imputed family factors 7 131
Family farms in EUR/FWU (nominal)
Ow n capital unpaid cost 1 724
Remuneration of Family Labour (RFL) 3 201

EU beef farms report 2012
65
PortugalSTRUCTURAL INFORMATION
Breeders 2000 2001 2002 2003 2004 2005 2006 2007 2008 20092009/ 2000
Farms represented 3 320 4 100 4 270 3 870 3 560 2 700 4 010 4 400 3 540 3 850 16%
Sample farms 91 105 98 86 106 97 143 171 140 157
Av. Labour in AWU 1.30 1.33 1.36 1.40 1.32 1.50 1.42 1.41 1.57 1.39 7%
Family labour - % 91% 92% 93% 94% 87% 85% 85% 90% 87% 87% -4%
Beef specialisation - % output 80% 74% 78% 74% 77% 81% 82% 70% 79% 79% -2%
Average UAA - ha 55.8 65.1 56.2 41.4 51.7 76.9 74.9 77.5 85.8 59.1 6%
Forage crops - ha 30.1 28.8 29.4 17.1 26.0 41.8 35.3 38.0 51.6 37.5 24%
of which % permanent grassland 65% 66% 67% 58% 50% 48% 40% 51% 50% 49% -24%
Stocking density - LU/ha 0.5 0.5 0.5 0.5 0.5 0.5 0.5 0.4 0.5 0.6 4%
Av. number of suckler cows - head 22.6 22.9 19.4 16.1 20.5 26.8 28.0 27.0 34.3 22.5 0%
Number of suckler cow s per AWU 17.4 17.2 14.2 11.5 15.5 17.8 19.7 19.1 21.9 16.2 -7%
Total beef cattle - LU 26 27 23 19 25 32 34 32 42 27 4%
Total LU on the farm 27 27 23 19 26 33 34 33 43 28 3%
Cattle (male & female) < 1 year sold - head 10 11 10 8 10 14 14 12 20 11 15%
Male cattle 1-2 years sold - head 1 1 1 0 1 1 1 1 1 1 3%
Male cattle sold (incl. fem. < 1 year) - head 13 13 12 9 13 17 16 15 24 15 16%
Selling price male cattle - €/head 511 502 493 547 519 463 489 523 477 507 -1%
Cattle < 1 year + male 1-2 year sold / cow 0.6 0.6 0.6 0.6 0.6 0.7 0.6 0.5 0.7 0.7 16%
Total cattle sold - head 16 16 14 12 15 19 20 17 29 18 13%
Total cattle sales - € 7 923 7 863 6 740 6 624 7 770 8 827 10 094 9 454 13 670 8 854 12%
Selling price cattle - €/head 510 495 487 571 516 457 499 544 479 502 -1%
OUTPUT AND COSTS in €/Cow
Breeders 2000 2001 2002 2003 2004 2005 2006 2007 2008 2009 2009/ 2000 2010e 2011e 2010 /2009 2011 /2009
TOTAL BEEF OUTPUT 402 394 576 487 474 411 436 446 396 540 34% 532 550 -1% 2%
TOTAL BEEF COUPLED DP 275 304 320 328 318 230 224 196 223 249 -9% 249 249 0% 0%
of which suckler cow premium 154 176 178 183 175 196 212 175 203 210 36% 210.3 210.3 0% 0%
of which special male premium 27 27 35 24 31 6 3 5 5 9 -66% 9 9 0% 0%
of which slaughter premium 3 9 13 14 15 7 5 5 7 12 283% 12 12 0% 0%
of which extensification premium 88 88 88 85 80 7 3 8 4 9 -89% 9 9 0% 0%
of which other DP (incl. National DP) 1 4 7 23 16 14 1 3 3 8 441% 8 8 0% 0%
Feed 136 146 169 151 189 216 142 163 173 187 38% 201 241 8% 29%
of which purchased feed 83 83 88 68 107 131 84 85 96 97 16% 111 135 15% 39%
of which home-grown feed 52 63 81 83 81 84 58 79 76 90 72% 90 106 0% 18%
Animal purchase 36 42 111 86 43 48 86 46 16 108 198% 115 127 7% 18%
Other specif ic costs 23 19 26 31 28 38 24 25 31 21 -5% 22 21 0% -1%
Specific costs 195 208 306 268 259 301 253 234 220 317 63% 338 390 7% 23%
Machinery and building upkeep 41 36 44 49 37 34 35 39 42 41 -1% 41 41 0% 0%
Energy (fuel, electricity) 33 28 44 36 47 45 52 47 61 56 71% 64 74 15% 32%
Contract w ork 22 20 22 24 20 27 22 12 22 17 -24% 16.8 16.7 -1% -2%
Taxes (exc. milk levy) 3 2 1 1 3 5 16 5 6 1 -47% 1 1 1% 5%
Other direct inputs (incl. w ater, insur. on farm buildings) 26 21 27 25 27 15 23 20 15 28 7% 27 27 -1% -2%
Non specific costs 125 107 139 135 134 126 147 122 146 142 14% 150 160 5% 12%
Total operating costs 319 315 445 403 393 427 399 356 366 459 44% 488 550 6% 20%
Gross margin (over operating costs) 83 79 131 84 80 -16 37 90 30 80 -3% 44 0 -46% -99%
Gross margin (over operating costs) with CP* 358 382 451 412 398 214 261 286 253 329 -8% 293 250 -11% -24%
* CP: coupled payments e: estimateDepreciation 120 115 137 157 132 128 142 107 120 121 1%
Wages 31 23 27 27 49 26 35 26 34 48 54%
Rent 18 20 23 20 17 14 17 17 14 20 8%
Interest 9 8 6 4 3 10 12 15 29 1 -94%
External factors 59 50 57 51 69 50 64 58 76 69 17%
Net margin (before ow n factors) -96 -86 -63 -123 -121 -194 -169 -75 -166 -110 14%
Net margin (before ow n factors) with CP* 178 218 257 205 197 36 55 122 57 139 -22%* CP: coupled payments
Family labour costs 263 258 363 427 331 257 226 252 227 325 23%
Ow n capital unpaid cost 70 30 65 40 61 39 28 39 28 125 79%
Imputed family factors 333 288 428 468 392 296 255 291 255 449 35%
Total economic costs 832 768 1 068 1 078 986 901 860 811 817 1 099 32%
Net economic margin (after own factors) -429 -374 -491 -591 -512 -490 -424 -365 -421 -559 30%
Net economic margin (after own factors) with CP* -155 -71 -171 -263 -194 -260 -200 -169 -198 -310 100%
ASSETS in €/Cow
Breeders 2000 2001 2002 2003 2004 2005 2006 2007 2008 2009 2009/ 2000
Fixed assets 3 204 4 455 4 882 4 347 3 873 5 281 2 656 3 290 4 181 4 015 25%
Current assets 540 493 559 610 623 587 645 1 496 1 507 1 070 98%
Total assets 3 744 4 948 5 441 4 956 4 496 5 868 3 301 4 786 5 688 5 085 36%
INCOME per AWU in €/AWU (nominal)
Breeders 2000 2001 2002 2003 2004 2005 2006 2007 2008 2009 2009/ 2000
Total output 9 333 9 535 10 266 8 196 10 871 10 304 10 853 13 710 13 582 11 664 25%
Intermediate consumptions 7 534 7 111 7 606 6 294 8 283 9 460 8 505 8 760 10 685 8 693 15%
Balance of subsidies and taxes 7 611 8 265 7 733 6 606 8 126 9 997 9 859 9 542 11 154 9 604 26%
of w hich LFA/AWU 807 970 1 148 922 1 231 1 147 1 069 988 1 024 1 590 97%
of w hich environmental/AWU 1 091 488 973 1 155 968 1 234 1 072 659 773 577 -47%
Gross Farm Income (GFI) 9 411 10 689 10 393 8 508 10 714 10 841 12 207 14 492 14 050 12 575 34%
Depreciation 2 607 2 721 2 579 2 502 2 794 2 785 3 404 2 863 3 204 2 577 -1%
Farm Net Value Added (FNVA) 6 804 7 968 7 814 6 006 7 921 8 056 8 803 11 628 10 846 9 999 47%
Wages 657 604 528 402 1 048 690 1 020 791 1 009 1 037 58%
Rent 383 432 442 306 343 301 399 428 378 397 3%
Interest 184 156 115 57 70 248 262 435 718 11 -94%
External factors 1 224 1 193 1 085 766 1 461 1 239 1 681 1 654 2 105 1 444 18%
Balance of subsidies and taxes on investment 184 522 303 303 380 648 116 255 406 14 -92%
Farm net income (FNI) 5 763 7 298 7 032 5 544 6 839 7 465 7 238 10 230 9 147 8 568 49%
Family labour costs 5 821 6 169 6 945 7 015 6 928 5 621 5 674 6 558 6 341 6 761 16%
Ow n capital unpaid cost 1 540 757 1 167 623 1 210 865 716 955 851 2 659 73%
Imputed family factors 7 361 6 926 8 111 7 639 8 138 6 486 6 391 7 513 7 191 9 420 28%
Family farms only in EUR/FWU (nominal)
Ow n capital unpaid cost 1 706 821 1 248 662 1 387 1 013 839 1 054 981 3 050 79%
Remuneration of Family Labour (RFL) 4 678 7 094 6 274 5 227 6 451 7 724 7 642 10 241 9 563 6 775 45%
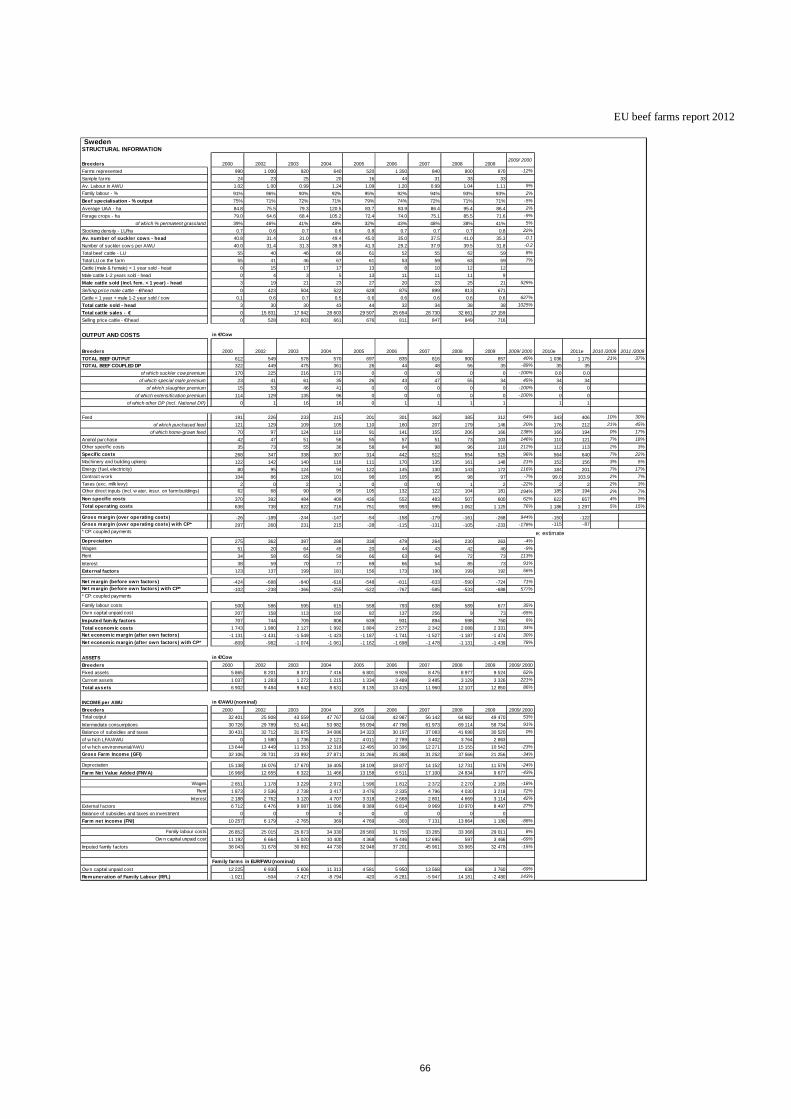
EU beef farms report 2012
66
SwedenSTRUCTURAL INFORMATION
Breeders 2000 2002 2003 2004 2005 2006 2007 2008 20092009/ 2000
Farms represented 990 1 000 920 640 520 1 350 840 800 870 -12%
Sample farms 24 23 25 20 16 44 31 33 33
Av. Labour in AWU 1.02 1.00 0.99 1.24 1.09 1.20 0.99 1.04 1.11 9%
Family labour - % 91% 96% 90% 92% 95% 92% 94% 93% 93% 2%
Beef specialisation - % output 75% 71% 72% 71% 79% 74% 72% 71% 71% -5%
Average UAA - ha 84.8 75.5 79.3 120.5 83.7 83.9 86.4 95.4 86.4 2%
Forage crops - ha 79.0 64.6 68.4 105.2 72.4 74.0 75.1 85.5 71.6 -9%
of which % permanent grassland 39% 46% 41% 48% 32% 43% 48% 38% 41% 5%
Stocking density - LU/ha 0.7 0.6 0.7 0.6 0.8 0.7 0.7 0.7 0.8 22%
Av. number of suckler cows - head 40.8 31.4 31.0 49.4 45.0 35.0 37.5 41.0 35.3 -0.1
Number of suckler cow s per AWU 40.0 31.4 31.3 39.9 41.3 29.2 37.9 39.5 31.8 -0.2
Total beef cattle - LU 55 40 46 66 61 52 55 62 59 8%
Total LU on the farm 55 41 46 67 61 53 59 63 59 7%
Cattle (male & female) < 1 year sold - head 0 15 17 17 13 8 10 12 12 #DIV/0!
Male cattle 1-2 years sold - head 0 4 3 5 13 11 11 11 9 #DIV/0!
Male cattle sold (incl. fem . < 1 year) - head 3 19 21 23 27 20 23 25 21 529%
Selling price male cattle - €/head 0 423 504 522 628 875 899 813 671 #DIV/0!
Cattle < 1 year + male 1-2 year sold / cow 0.1 0.6 0.7 0.5 0.6 0.6 0.6 0.6 0.6 627%
Total cattle sold - head 3 30 30 43 44 32 34 38 38 1025%
Total cattle sales - € 0 15 831 17 942 28 603 29 507 25 654 28 730 32 661 27 159 #DIV/0!
Selling price cattle - €/head 0 528 603 661 676 811 847 849 716 #DIV/0!
OUTPUT AND COSTS in €/Cow
Breeders 2000 2002 2003 2004 2005 2006 2007 2008 2009 2009/ 2000 2010e 2011e 2010 /2009 2011 /2009
TOTAL BEEF OUTPUT 612 549 578 570 697 835 816 900 857 40% 1 036 1 175 21% 37%
TOTAL BEEF COUPLED DP 322 449 475 361 26 44 48 56 35 -89% 35 35 0% 0%
of which suckler cow premium 170 225 216 173 0 0 0 0 0 -100% 0.0 0.0
of which special male premium 23 41 61 35 26 43 47 55 34 45% 34 34 0% 0%
of which slaughter premium 15 53 46 41 0 0 0 0 0 -100% 0 0
of which extensification premium 114 129 135 96 0 0 0 0 0 -100% 0 0
of which other DP (incl. National DP) 0 1 16 16 0 1 1 1 1 #DIV/0! 1 1 0% 0%
Feed 191 226 233 215 201 301 362 385 312 64% 343 406 10% 30%
of which purchased feed 121 129 109 105 110 160 207 179 146 20% 176 212 21% 45%
of which home-grown feed 70 97 124 110 91 141 155 206 166 138% 166 194 0% 17%
Animal purchase 42 47 51 56 55 57 51 73 103 146% 110 121 7% 18%
Other specific costs 35 73 55 36 58 84 98 96 110 212% 112 113 2% 3%
Specific costs 268 347 338 307 314 442 512 554 525 96% 564 640 7% 22%
Machinery and building upkeep 122 142 140 118 111 170 135 161 148 21% 152 156 3% 5%
Energy (fuel, electricity) 80 95 124 94 122 145 130 143 172 116% 184 201 7% 17%
Contract w ork 104 86 128 101 98 105 95 98 97 -7% 99.0 103.9 2% 7%
Taxes (exc. milk levy) 2 0 2 1 0 0 0 1 2 -22% 2 2 2% 3%Other direct inputs (incl. w ater, insur. on farm buildings) 62 68 90 95 105 132 122 104 181 194% 185 194 2% 7%
Non specific costs 370 392 484 409 436 552 483 507 600 62% 622 657 4% 9%
Total operating costs 638 738 822 716 751 993 995 1 062 1 125 76% 1 186 1 297 5% 15%
Gross margin (over operating costs) -26 -189 -244 -147 -54 -158 -179 -161 -268 944% -150 -122Gross margin (over operating costs) w ith CP* 297 260 231 215 -28 -115 -131 -105 -233 -178% -115 -87
* CP: coupled payments e: estimateDepreciation 275 362 397 288 338 479 264 230 263 -4%
Wages 51 20 64 45 20 44 43 42 46 -9%
Rent 34 58 65 59 66 63 94 72 73 113%
Interest 38 59 70 77 69 66 54 85 73 91%
External factors 123 137 199 181 156 173 190 199 192 56%
Net margin (before own factors) -424 -688 -840 -616 -548 -811 -633 -590 -724 71%Net margin (before own factors) with CP* -102 -238 -366 -255 -522 -767 -585 -533 -688 577%* CP: coupled payments
Family labour costs 500 586 595 615 558 793 638 589 677 35%
Ow n capital unpaid cost 207 158 113 192 82 137 256 9 73 -65%
Imputed fam ily factors 707 744 709 806 639 931 894 598 750 6%
Total economic costs 1 743 1 980 2 127 1 992 1 884 2 577 2 342 2 088 2 331 34%
Net economic margin (after own factors) -1 131 -1 431 -1 549 -1 423 -1 187 -1 741 -1 527 -1 187 -1 474 30%
Net economic margin (after own factors) with CP* -809 -982 -1 074 -1 061 -1 162 -1 698 -1 478 -1 131 -1 439 78%
ASSETS in €/Cow
Breeders 2000 2002 2003 2004 2005 2006 2007 2008 2009 2009/ 2000
Fixed assets 5 865 8 201 8 371 7 416 6 801 9 926 8 475 8 977 9 524 62%
Current assets 1 037 1 283 1 272 1 215 1 334 3 489 3 485 3 129 3 326 221%
Total assets 6 902 9 484 9 642 8 631 8 135 13 415 11 960 12 107 12 850 86%
INCOME per AWU in €/AWU (nominal)
Breeders 2000 2002 2003 2004 2005 2006 2007 2008 2009 2009/ 2000Total output 32 401 25 808 43 559 47 767 52 038 42 987 56 142 64 982 49 470 53%
Intermediate consumptions 30 726 29 789 51 441 53 982 55 094 47 796 61 973 69 114 58 734 91%
Balance of subsidies and taxes 30 431 32 712 31 875 34 086 34 323 30 197 37 083 41 698 30 520 0%
of w hich LFA/AWU 0 1 580 1 736 2 121 4 011 2 789 3 402 3 764 2 863 #DIV/0!
of w hich environmental/AWU 13 644 13 449 11 353 12 318 12 495 10 396 12 271 15 155 10 542 -23%
Gross Farm Income (GFI) 32 106 28 731 23 992 27 871 31 266 25 388 31 252 37 566 21 256 -34%
Depreciation 15 138 16 076 17 670 16 405 18 109 18 877 14 152 12 731 11 579 -24%
Farm Net Value Added (FNVA) 16 968 12 655 6 322 11 466 13 158 6 511 17 100 24 834 9 677 -43%
Wages 2 651 1 178 3 229 2 972 1 596 1 812 2 372 2 270 2 165 -18%
Rent 1 873 2 536 2 738 3 417 3 476 2 335 4 796 4 030 3 218 72%
Interest 2 188 2 762 3 120 4 707 3 318 2 668 2 801 4 669 3 114 42%
External factors 6 712 6 476 9 087 11 096 8 389 6 814 9 969 10 970 8 497 27%
Balance of subsidies and taxes on investment 0 0 0 0 0 0 0 0 0 #DIV/0!
Farm net income (FNI) 10 257 6 179 -2 765 369 4 769 -303 7 131 13 864 1 180 -88%
Family labour costs 26 852 25 015 25 873 34 330 28 580 31 755 33 265 33 368 29 011 8%
Ow n capital unpaid cost 11 192 6 664 5 020 10 400 4 368 5 446 12 695 597 3 466 -69%
Imputed family factors 38 043 31 678 30 892 44 730 32 948 37 201 45 961 33 965 32 478 -15%
Family farms in EUR/FWU (nominal)
Ow n capital unpaid cost 12 225 6 930 5 606 11 313 4 581 5 950 13 568 638 3 760 -69%
Remuneration of Family Labour (RFL) -1 021 -504 -7 427 -8 794 420 -6 281 -5 947 14 181 -2 480 143%

EU beef farms report 2012
67
SloveniaSTRUCTURAL INFORMATION
Breeders 2005 2006 2007 2009
Farms represented 2 040 1 240 1 120 2 030
Sample farms 17 17 19 24
Av. Labour in AWU 2.04 1.69 1.59 1.56Family labour - % 100% 99% 99% 100%
Beef specialisation - % output 62% 72% 75% 75%
Average UAA - ha 12.3 16.7 14.6 13.8
Forage crops - ha 10.6 16.3 13.5 13.3
of which % permanent grassland 87% 96% 92% 95%
Stocking density - LU/ha 0.9 0.7 0.8 0.7
Av. number of suckler cows - head 8.6 9.1 8.6 7.5
Number of suckler cow s per AWU 4.2 5.4 5.4 4.8
Total beef cattle - LU 11 12 12 11
Total LU on the farm 12 13 14 12
Cattle (male & female) < 1 year sold - head 2 3 3 2
Male cattle 1-2 years sold - head 1 1 1 1
Male cattle sold (incl. fem. < 1 year) - head 5 5 4 3
Selling price male cattle - €/head 441 447 662 589
Cattle < 1 year + male 1-2 year sold / cow 0.6 0.6 0.5 0.4
Total cattle sold - head 6 7 5 5
Total cattle sales - € 2 567 3 182 3 254 2 605
Selling price cattle - €/head 445 457 695 561
OUTPUT AND COSTS in €/Cow
Breeders 2005 2006 2007 2009 2010e 2011e 2010 /2009 2011 /2009
TOTAL BEEF OUTPUT 414 372 588 431 398 454 -8% 5%
TOTAL BEEF COUPLED DP 392 368 14 16 16 16 0% 0%
of which suckler cow premium 227.8 228.5 0.0 0.0 0.0 0.0
of which special male premium 46 23 14 16 16 16 0% 0%
of which slaughter premium 41 34 0 0 0 0
of which extensification premium 77 82 0 0 0 0
of which other DP (incl. National DP) 0 0 0 0 0 0
Feed 93 85 57 55 62 84 13% 53%
of which purchased feed 29 49 17 35 42 59 19% 67%
of which home-grown feed 65 36 40 20 20 26 2% 30%
Animal purchase 34 38 28 30 32 35 7% 18%
Other specif ic costs 19 46 56 34 35 36 2% 4%
Specific costs 146 170 141 119 129 155 8% 30%
Machinery and building upkeep 137 141 196 195 197 199 1% 2%
Energy (fuel, electricity) 76 89 126 181 213 245 18% 36%
Contract w ork 8.6 7.5 15.3 47.9 48.0 47.8 0% 0%
Taxes (exc. milk levy) 2 0 0 2 2 2 2% 4%
Other direct inputs (incl. w ater, insur. on farm buildings) 27 29 61 49 49 49 0% 0%
Non specific costs 251 268 399 474 509 543 7% 14%
Total operating costs 397 437 540 593 637 697 7% 18%
Gross margin (over operating costs) 17 -65 49 -162 -240 -243Gross margin (over operating costs) w ith CP* 409 303 63 -146 -224 -228
* CP: coupled payments e: estimateDepreciation 299 310 346 514
Wages 3 5 2 0
Rent 9 15 14 8Interest 6 3 2 11
External factors 17 22 18 19
Net margin (before own factors) -299 -397 -315 -694Net margin (before own factors) w ith CP* 93 -29 -301 -679
* CP: coupled payments
Family labour costs 907 798 894 1 311
Ow n capital unpaid cost 142 125 127 878
Imputed family factors 1 049 923 1 021 2 189
Total economic costs 1 763 1 692 1 925 3 315
Net economic margin (after own factors) -1 348 -1 320 -1 337 -2 883
Net economic margin (after own factors) w ith CP* -957 -952 -1 322 -2 868
ASSETS in €/Cow
Breeders 2005 2006 2007 2009
Fixed assets 33 601 29 999 43 697 103 784
Current assets 762 644 2 225 2 687
Total assets 34 364 30 642 45 922 106 470
INCOME per AWU in €/AWU (nominal)
Breeders 2005 2006 2007 2009Total output 3 456 3 129 6 689 6 055
Intermediate consumptions 2 287 2 795 6 600 6 989
Balance of subsidies and taxes 3 539 3 684 5 518 4 468
of w hich LFA/AWU 843 1 633 1 425 1 397
of w hich environmental/AWU 1 220 194 1 912 1 332
Gross Farm Income (GFI) 4 708 4 017 5 608 3 534
Depreciation 2 079 2 178 2 563 3 171
Farm Net Value Added (FNVA) 2 630 1 839 3 044 363
Wages 22 48 14 1
Rent 60 102 99 50
Interest 37 22 14 71
External factors 119 172 127 121
Balance of subsidies and taxes on investment 77 -320 -284 -637
Farm net income (FNI) 2 588 1 348 2 634 -395
Family labour costs 5 569 5 790 6 733 7 861Ow n capital unpaid cost 971 886 910 5 321
Imputed family factors 6 540 6 676 7 643 13 182
Family farms only in EUR/FWU (nominal)
Ow n capital unpaid cost 976 894 914 5 338
Remuneration of Family Labour (RFL) 1 625 466 1 732 -5 735

EU beef farms report 2012
68
United KingdomSTRUCTURAL INFORMATION
Breeders 2000 2001 2002 2003 2004 2005 2006 2007 2008 20092009/ 2000
Farms represented 2 310 1 620 2 180 2 030 2 220 1 990 1 370 1 630 2 260 2 620 13%
Sample farms 52 34 61 64 63 59 47 57 70 83
Av. Labour in AWU 1.61 1.45 1.43 1.33 1.44 1.48 1.46 1.38 1.38 1.41 -12%
Family labour - % 75% 88% 85% 86% 91% 92% 86% 87% 86% 89% 19%
Beef specialisation - % output 76% 77% 77% 77% 78% 77% 76% 75% 76% 79% 4%
Average UAA - ha 88.9 103.1 122.9 98.5 101.9 111.4 108.6 106.1 107.0 100.6 13%
Forage crops - ha 81.4 92.2 109.4 91.5 91.8 101.2 92.1 96.7 95.5 93.8 15%
of which % permanent grassland 72% 70% 79% 70% 77% 75% 74% 78% 79% 81% 13%
Stocking density - LU/ha 1.4 1.2 1.1 1.2 1.2 1.1 1.2 1.3 1.1 1.2 -13%
Av. number of suckler cows - head 72.2 70.3 76.1 69.0 69.6 73.0 70.7 74.0 65.6 67.5 -7%
Number of suckler cow s per AWU 44.9 48.5 53.2 51.9 48.3 49.3 48.5 53.6 47.5 47.9 7%
Total beef cattle - LU 104 103 115 104 103 107 106 113 101 105 0%
Total LU on the farm 113 112 125 112 112 117 112 123 110 112 0%
Cattle (male & female) < 1 year sold - head 4 6 7 12 5 9 6 10 11 10 142%
Male cattle 1-2 years sold - head 38 32 38 33 34 29 32 23 22 26 -32%
Male cattle sold (incl. fem. < 1 year) - head 46 42 48 46 43 42 44 42 37 38 -16%
Selling price male cattle - €/head 654 704 709 664 752 689 784 796 821 840 28%
Cattle < 1 year + male 1-2 year sold / cow 0.6 0.6 0.6 0.7 0.6 0.6 0.6 0.6 0.6 0.6 -10%
Total cattle sold - head 61 63 67 63 61 70 77 71 69 66 8%
Total cattle sales - € 39 265 47 168 47 202 41 167 45 033 47 753 62 106 51 926 55 203 54 170 38%
Selling price cattle - €/head 643 747 705 655 733 687 804 728 802 820 28%
OUTPUT AND COSTS in €/Cow
Breeders 2000 2001 2002 2003 2004 2005 2006 2007 2008 2009 2009/ 2000 2010e 2011e 2010 /2009 2011 /2009
TOTAL BEEF OUTPUT 583 702 811 670 709 664 917 712 890 829 42% 825 944 0% 14%
TOTAL BEEF COUPLED DP 305 354 459 323 399 23 18 26 22 23 -92% 23 23 0% 0%
of which suckler cow premium 189.9 189.9 239.8 212.4 239.8 0.0 0.0 0.0 0.0 0.0 -100% 0.0 0.0
of which special male premium 66 64 74 48 68 0 0 0 0 0 -100% 0 0
of which slaughter premium 8 15 25 20 26 0 0 0 0 0 -100% 0 0
of which extensification premium 36 79 103 32 53 0 0 0 0 0 -100% 0 0
of which other DP (incl. National DP) 5 7 17 11 12 23 18 26 22 23 331% 23 23 0% 0%
Feed 239 282 266 241 260 265 300 303 330 327 37% 352 428 8% 31%
of which purchased feed 134 144 143 122 144 140 163 169 179 179 34% 222 267 24% 49%
of which home-grown feed 105 138 123 119 116 125 137 135 151 148 42% 131 161 -12% 8%
Animal purchase 52 77 125 100 107 71 209 79 113 85 63% 90 100 7% 18%
Other specif ic costs 91 96 103 88 96 103 131 95 111 105 15% 119 121 14% 15%
Specific costs 382 455 494 429 463 439 639 477 554 517 35% 561 648 9% 25%
Machinery and building upkeep 73 81 85 82 81 85 111 84 96 89 21% 94 99 5% 12%
Energy (fuel, electricity) 45 45 42 38 48 60 72 61 80 67 47% 76 86 14% 29%
Contract w ork 45.6 47.4 44.0 44.9 45.4 46.2 51.3 49.4 57.7 53.9 18% 57.3 59.1 6% 10%
Taxes (exc. milk levy) 10 12 10 11 11 10 8 8 8 7 -34% 7 7 3% 8%
Other direct inputs (incl. w ater, insur. on farm buildings) 78 72 82 79 102 93 112 102 100 96 24% 102 106 6% 10%
Non specific costs 251 258 263 255 287 295 353 304 341 312 24% 336 357 8% 14%
Total operating costs 633 713 757 684 750 734 992 781 895 829 31% 897 1 005 8% 21%
Gross margin (over operating costs) -50 -11 54 -14 -41 -70 -76 -69 -4 0 -99% -73 -61Gross margin (over operating costs) with CP* 255 343 513 309 358 -47 -58 -43 17 23 -91% -49 -38
* CP: coupled payments e: estimateDepreciation 187 175 169 157 161 171 204 188 172 198 6%
Wages 82 47 53 40 35 31 49 41 50 35 -57%
Rent 32 42 46 38 55 58 60 40 44 41 28%
Interest 49 37 29 34 29 39 36 43 42 26 -47%
External factors 163 126 128 113 119 128 144 124 135 102 -38%
Net margin (before ow n factors) -400 -312 -243 -284 -321 -369 -425 -381 -311 -300 -25%
Net margin (before ow n factors) with CP* -95 42 216 39 78 -346 -407 -355 -289 -277 191%* CP: coupled payments
Family labour costs 304 328 325 297 372 370 371 353 339 344 13%
Ow n capital unpaid cost 125 140 125 88 173 90 113 100 49 97 -22%
Imputed family factors 429 468 450 386 545 461 484 453 388 442 3%
Total economic costs 1 413 1 482 1 505 1 340 1 575 1 494 1 825 1 546 1 590 1 570 11%
Net economic margin (after own factors) -830 -780 -694 -670 -866 -830 -908 -834 -699 -742 -11%
Net economic margin (after own factors) with CP* -525 -426 -234 -347 -467 -807 -891 -808 -678 -719 37%
ASSETS in €/Cow
Breeders 2000 2001 2002 2003 2004 2005 2006 2007 2008 2009 2009/ 2000
Fixed assets 13 270 13 732 11 730 10 569 15 106 15 206 17 096 22 877 21 968 24 327 83%
Current assets 1 412 1 480 1 893 1 485 1 807 1 908 1 917 2 211 2 281 2 084 48%
Total assets 14 682 15 212 13 623 12 055 16 912 17 115 19 014 25 088 24 250 26 411 80%
INCOME per AWU in €/AWU (nominal)
Breeders 2000 2001 2002 2003 2004 2005 2006 2007 2008 2009 2009/ 2000
Total output 33 249 41 665 50 717 41 652 39 772 39 432 47 492 47 233 58 543 56 273 69%
Intermediate consumptions 32 090 38 090 42 497 37 430 37 502 40 217 47 950 46 623 55 423 52 330 63%
Balance of subsidies and taxes 21 376 25 911 35 569 25 248 29 037 30 429 30 108 32 979 29 467 28 640 34%
of w hich LFA/AWU 3 670 4 690 4 725 4 257 3 979 4 012 2 447 3 753 2 821 2 822 -23%
of w hich environmental/AWU 1 732 801 1 489 1 590 2 294 1 749 3 897 3 460 4 352 2 512 45%
Gross Farm Income (GFI) 22 536 29 487 43 789 29 470 31 308 29 644 29 650 33 590 32 587 32 584 45%
Depreciation 10 751 10 856 11 439 10 145 9 669 10 920 12 454 12 941 10 543 11 633 8%
Farm Net Value Added (FNVA) 11 784 18 631 32 350 19 325 21 639 18 723 17 196 20 648 22 044 20 950 78%
Wages 4 937 2 830 3 778 2 902 2 291 1 983 3 377 3 017 3 085 2 080 -58%
Rent 1 869 2 706 3 369 2 583 3 308 3 796 4 010 2 802 2 833 2 472 32%
Interest 2 928 2 312 2 054 2 419 1 867 2 527 2 275 2 977 2 740 1 623 -45%
External factors 9 735 7 848 9 201 7 904 7 466 8 307 9 663 8 796 8 658 6 175 -37%
Balance of subsidies and taxes on investment 433 928 464 799 210 362 493 350 207 2 731 531%
Farm net income (FNI) 2 482 11 711 23 613 12 221 14 383 10 779 8 027 12 202 13 593 17 507 605%
Family labour costs 17 145 20 082 21 929 19 332 22 219 23 276 22 228 23 998 20 526 20 697 21%
Ow n capital unpaid cost 7 058 8 554 8 871 5 504 10 248 5 612 7 042 7 110 2 794 5 725 -19%
Imputed family factors 24 202 28 636 30 800 24 836 32 468 28 889 29 270 31 107 23 319 26 422 9%
Family farms only in EUR/FWU (nominal)
Ow n capital unpaid cost 9 398 9 803 10 339 6 407 11 289 6 093 8 237 8 227 3 251 6 394 -32%
Remuneration of Family Labour (RFL) -6 093 3 617 17 183 7 820 4 555 5 610 1 152 5 893 12 568 13 157 -316%

EU beef farms report 2012
69
ANNEX V DETAILED DATA ON BREEDERS & FATTENERS
Table 18 Breeders & Fatteners, EU-all, 2000-2011
EU-AllSTRUCTURAL INFORMATION
Breeders & Fatteners2000 2001 2002 2003 2004 2005 2006 2007 2008 2009
2009/ 2000
Farms represented 70 220 72 700 76 390 71 370 75 740 72 500 75 310 73 000 66 020 71 020 1%
Sample farms 1 011 1 204 1 204 1 176 1 299 1 309 1 266 1 221 1 304 1 399
Av. Labour in AWU 1.29 1.28 1.27 1.29 1.32 1.31 1.30 1.27 1.33 1.38 7%
Family labour - % 95% 95% 94% 95% 94% 94% 93% 94% 92% 91% -4%
Beef specialisation - % output 79% 78% 78% 80% 80% 79% 80% 78% 79% 79% 0%
Average UAA - ha 54.7 54.6 49.7 58.0 58.8 56.8 54.5 55.1 64.2 68.0 24%
Forage crops - ha 47.9 46.7 42.3 49.7 50.7 48.4 46.8 49.2 56.0 58.3 22%
of which % permanent grassland 76% 74% 74% 77% 75% 75% 74% 77% 79% 77% 2%
Stocking density - LU/ha 1.2 1.2 1.3 1.2 1.1 1.2 1.2 1.1 1.1 1.1 -13%
Av. number of suckler cows - head 31.55 32.69 30.02 32.50 32.71 31.66 32.47 30.43 34.81 35.48 12%
Number of suckler cow s per AWU 24.46 25.54 23.64 25.19 24.78 24.17 24.98 23.96 26.17 25.71 5%
Total beef cattle - LU 59 60 54 60 59 59 59 57 63 64 9%
Total LU on the farm 62 62 57 63 61 61 61 59 66 67 9%
Cattle (male & female) < 1 year sold - head 11 12 13 14 12 12 14 14 15 15 30%
Male cattle 1-2 years sold - head 10 12 11 12 11 12 13 11 13 13 33%
Male cattle sold (incl. fem. < 1 year) - head 32 32 33 35 35 34 35 32 35 36 12%
Selling price male cattle - €/head 604 674 733 750 764 801 937 927 960 897 49%
Cattle < 1 year + male 1-2 year sold / cow 1.0 1.0 1.1 1.1 1.1 1.1 1.1 1.1 1.0 1.0 0%
Total cattle sold - head 40 43 43 46 45 44 48 43 47 49 24%
Total cattle sales - € 26 373 30 656 32 042 35 085 35 679 36 371 45 569 41 088 46 041 45 342 72%
Selling price cattle - €/head 664 720 751 766 791 829 948 945 973 921 39%
OUTPUT AND COSTS in €/Male cattle sold (nominal)
Breeders & Fatteners 2000 2001 2002 2003 2004 2005 2006 2007 2008 2009 2009/ 2000 2010e 2011e 2010 /2009 2011 /2009
TOTAL BEEF OUTPUT 1 076 1 028 1 021 1 061 1 099 1 192 1 330 1 281 1 315 1 222 14% 1 244 1 384 2% 13%
TOTAL BEEF COUPLED DP 350 412 438 445 449 215 127 125 138 131 -63% 131 131 0% 0%
of which suckler cow premium 172.1 197.5 197.1 199.0 205.8 108.8 99.0 100.0 105.8 101.5 -41% 101.5 101.5 0% 0%
of which special male premium 93 98 101 102 95 37 7 6 8 7 -92% 7 7 0% 0%
of which slaughter premium 18 33 53 59 59 23 10 10 9 8 -54% 8 8 0% 0%
of which extensification premium 48 69 70 65 62 23 2 1 0 0 -99% 0 0 0% 0%
of which other DP (incl. National DP) 19 14 18 21 27 22 9 8 15 14 -29% 14 14 0% 0%
Feed 313 321 311 337 349 349 383 400 481 418 33% 458 532 10% 27%
of which purchased feed 188 196 199 222 230 221 255 263 339 277 47% 321 371 16% 34%
of which home-grown feed 125 126 112 114 119 128 128 137 142 141 13% 137 161 -3% 14%
Animal purchase 229 193 221 242 252 267 341 280 258 247 8% 253 285 2% 15%Other specif ic costs 77 77 70 72 74 77 78 83 85 82 7% 85 86 4% 5%
Specific costs 619 592 602 651 676 693 801 764 823 747 21% 796 903 7% 21%Machinery and building upkeep 84 87 80 81 83 97 101 103 100 91 9% 93 96 2% 5%
Energy (fuel, electricity) 48 51 44 44 51 63 67 69 82 71 49% 81 93 14% 31%
Contract w ork 64.0 62.1 59.4 61.7 64.4 68.4 68.2 78.8 83.4 79.5 24% 80.9 83.4 2% 5%
Taxes (exc. milk levy) 11 11 11 11 12 12 11 12 12 12 16% 13 13 2% 4%Other direct inputs (incl. w ater, insurance on farm buildings)
76 79 88 87 88 95 102 102 99 10436%
105 109 2% 5%
Non specific costs 282 290 283 284 298 336 349 364 377 358 27% 374 394 4% 10%Total operating costs 901 881 885 935 973 1 029 1 151 1 128 1 200 1 105 23% 1 170 1 297 6% 17%
Gross margin (over operating costs) 175 146 136 125 126 163 180 153 115 117 -33% 74 88 -37% -25%Gross margin (over operating costs) with CP* 525 559 574 571 575 378 307 279 253 248 -53% 205 219 0 0
* CP: coupled payments e: estimate
Depreciation 183 195 173 175 194 207 229 239 235 218 19%
Wages 24 25 25 23 24 29 35 29 32 40 67%
Rent 68 72 68 69 67 71 67 67 70 71 5%
Interest 42 40 37 33 30 34 40 45 45 42 1%
External factors 134 137 130 125 121 134 142 141 147 153 15%
Net margin (before ow n factors) -142 -185 -167 -175 -189 -179 -192 -227 -267 -255 80%
Net margin (before ow n factors) with CP* 208 228 271 271 260 36 -65 -101 -129 -123 -159%
* CP: coupled payments
Family labour costs 481 486 447 450 471 502 490 536 525 494 3%
Ow n capital unpaid cost 164 152 133 132 144 124 113 142 93 211 29%
Imputed family factors 645 639 580 582 615 626 603 678 618 705 9%
Total economic costs 1 863 1 851 1 769 1 817 1 903 1 996 2 125 2 186 2 201 2 182 17%
Net economic margin (after own factors) -787 -823 -748 -756 -804 -804 -795 -905 -885 -960 22%
Net economic margin (after own factors) with CP* -437 -411 -310 -311 -355 -589 -668 -780 -747 -829 90%
ASSETS in €/Male cattle sold (nominal)
Breeders & Fatteners 2000 2001 2002 2003 2004 2005 2006 2007 2008 2009 2009/ 2000
Fixed assets 7 786 8 049 8 029 8 787 9 197 11 449 12 198 15 127 13 980 13 004 67%
Current assets 1 777 1 824 1 725 1 735 1 757 1 934 2 144 2 431 2 320 2 149 21%
Total assets 9 563 9 873 9 754 10 522 10 954 13 382 14 341 17 557 16 299 15 153 58%
INCOME per AWU in €/AWU (nominal)
Breeders & Fatteners 2000 2001 2002 2003 2004 2005 2006 2007 2008 2009 2009/ 2000
Total output 27 606 28 402 28 537 30 350 30 730 31 532 34 802 34 904 39 289 36 485 32%
Intermediate consumptions 20 761 22 079 21 892 23 882 24 389 24 768 26 825 27 043 32 689 30 310 46%
Balance of subsidies and taxes 12 450 15 814 16 057 17 665 17 660 17 921 17 604 17 567 18 416 17 716 42%
of w hich LFA/AWU 877 1 511 1 387 1 553 1 619 1 637 1 718 1 768 1 745 1 633 86%
of w hich environmental/AWU 980 1 175 1 238 1 495 1 683 1 964 2 121 2 258 2 521 2 145 119%
Gross Farm Income (GFI) 19 295 22 136 22 703 24 133 24 001 24 685 25 581 25 428 25 016 23 892 24%
Depreciation 5 781 6 321 5 762 6 105 6 526 6 743 7 589 7 596 7 741 7 287 26%
Farm Net Value Added (FNVA) 13 514 15 815 16 940 18 028 17 475 17 942 17 992 17 833 17 275 16 605 23%
Wages 788 835 864 827 871 970 1 159 971 1 103 1 334 69%
Rent 2 136 2 359 2 266 2 390 2 235 2 312 2 268 2 138 2 317 2 333 9%
Interest 1 342 1 330 1 233 1 175 1 016 1 115 1 350 1 432 1 503 1 393 4%
External factors 4 266 4 524 4 363 4 391 4 122 4 397 4 776 4 542 4 924 5 061 19%
Balance of subsidies and taxes on investment 223 150 230 159 83 107 189 242 541 1 016 355%
Farm net income (FNI) 9 471 11 441 12 808 13 796 13 436 13 652 13 405 13 532 12 893 12 560 33%
Family labour costs 14 881 15 386 14 445 15 205 15 503 16 104 16 269 16 881 17 221 16 075 8%
Ow n capital unpaid cost 4 979 4 763 4 247 4 395 4 715 3 897 3 711 4 461 2 968 6 755 36%
Imputed family factors 19 860 20 149 18 692 19 599 20 217 20 001 19 980 21 342 20 189 22 830 15%
Family farms only in EUR/FWU (nominal)
Ow n capital unpaid cost 5 246 5 049 4 487 4 641 5 028 4 130 3 973 4 764 3 193 7 473 42%
Remuneration of Family Labour (RFL) 4 737 7 082 9 065 9 928 9 322 10 288 10 097 9 674 10 646 6 374 35%

EU beef farms report 2012
70
Table 19 Breeders & Fatteners, EU-15, 2000-2011 EU-15STRUCTURAL INFORMATION
Breeders & Fatteners2000 2001 2002 2003 2004 2005 2006 2007 2008 2009
2009/ 2000
Farms represented 70 220 72 700 76 390 71 370 70 800 68 740 69 830 67 730 59 090 62 580 -11%
Sample farms 1 011 1 204 1 204 1 176 1 218 1 232 1 149 1 112 1 160 1 223
Av. Labour in AWU 1.29 1.28 1.27 1.29 1.29 1.29 1.27 1.25 1.30 1.33 3%
Family labour - % 95% 95% 94% 95% 95% 94% 93% 94% 93% 92% -3%
Beef specialisation - % output 79% 78% 78% 80% 80% 80% 80% 78% 79% 79% 0%
Average UAA - ha 54.7 54.6 49.7 58.0 60.1 58.3 56.0 55.9 66.3 72.4 32%
Forage crops - ha 47.9 46.7 42.3 49.7 51.9 49.6 48.1 50.0 57.7 62.3 30%
of which % permanent grassland 76% 74% 74% 77% 75% 75% 73% 76% 79% 78% 3%
Stocking density - LU/ha 1.2 1.2 1.3 1.2 1.2 1.2 1.3 1.2 1.2 1.1 -11%
Av. number of suckler cows - head 31.55 32.69 30.02 32.50 34.11 32.82 34.24 31.76 37.27 38.08 21%
Number of suckler cow s per AWU 24.46 25.54 23.64 25.19 26.44 25.44 26.96 25.41 28.67 28.63 17%
Total beef cattle - LU 59 60 54 60 62 61 62 59 68 70 18%
Total LU on the farm 62 62 57 63 64 64 65 61 70 73 18%
Cattle (male & female) < 1 year sold - head 11 12 13 14 12 12 14 14 16 16 43%
Male cattle 1-2 years sold - head 10 12 11 12 12 12 14 11 13 14 41%
Male cattle sold (incl. fem. < 1 year) - head 32 32 33 35 36 35 36 33 37 38 20%
Selling price male cattle - €/head 604 674 733 750 776 806 951 943 979 925 53%
Cattle < 1 year + male 1-2 year sold / cow 1.0 1.0 1.1 1.1 1.1 1.1 1.1 1.0 1.0 1.0 0%
Total cattle sold - head 40 43 43 46 47 46 50 45 51 53 34%
Total cattle sales - € 26 373 30 656 32 042 35 085 37 543 37 961 48 413 43 534 50 310 50 165 90%
Selling price cattle - €/head 664 720 751 766 802 833 960 959 991 945 42%
OUTPUT AND COSTS in €/Male cattle sold
Breeders & Fatteners 2000 2001 2002 2003 2004 2005 2006 2007 2008 2009 2009/ 2000 2010e 2011e 2010 /2009 2011 /2009
TOTAL BEEF OUTPUT 1 076 1 028 1 021 1 061 1 120 1 200 1 353 1 299 1 339 1 261 17% 1 284 1 427 2% 13%
TOTAL BEEF COUPLED DP 350 412 438 445 458 214 124 128 140 136 -61% 136 136 0% 0%
of which suckler cow premium 172.1 197.5 197.1 199.0 210.7 108.9 100.1 102.8 109.0 106.4 -38% 106.4 106.4 0% 0%
of which special male premium 93 98 101 102 98 37 7 6 7 7 -92% 7 7 0% 0%
of which slaughter premium 18 33 53 59 60 23 10 10 10 9 -51% 9 9 0% 0%
of which extensification premium 48 69 70 65 64 23 0 1 0 0 -99% 0 0 0% 0%
of which other DP (incl. National DP) 19 14 18 21 26 22 7 8 14 13 -30% 13 13 0% 0%
Feed 313 321 311 337 358 352 390 409 489 429 37% 469 544 9% 27%
of which purchased feed 188 196 199 222 236 224 261 270 347 286 52% 332 383 16% 34%
of which home-grown feed 125 126 112 114 122 128 129 139 143 143 14% 138 160 -4% 12%
Animal purchase 229 193 221 242 257 270 346 285 265 257 13% 263 297 2% 15%
Other specif ic costs 77 77 70 72 74 78 79 84 86 85 11% 88 90 4% 5%Specific costs 619 592 602 651 689 700 815 778 840 772 25% 821 930 6% 20%
Machinery and building upkeep 84 87 80 81 82 96 100 101 98 92 10% 94 97 2% 5%
Energy (fuel, electricity) 48 51 44 44 50 62 66 67 79 70 47% 80 92 14% 31%
Contract w ork 64.0 62.1 59.4 61.7 64.6 69.0 69.3 79.8 84.6 82.7 29% 84.2 86.8 2% 5%
Taxes (exc. milk levy) 11 11 11 11 12 12 12 12 12 13 19% 13 13 2% 4%Other direct inputs (incl. w ater, insurance on farm buildings)
76 79 88 87 89 96 104 104 100 10741%
109 112 2% 5%
Non specific costs 282 290 283 284 298 336 350 364 374 365 29% 381 401 4% 10%
Total operating costs 901 881 885 935 987 1 035 1 165 1 142 1 214 1 137 26% 1 202 1 331 6% 17%
Gross margin (over operating costs) 175 146 136 125 133 165 188 157 125 124 -29% 82 96 -34% -23%Gross margin (over operating costs) with CP* 525 559 574 571 591 379 312 285 265 260 -50% 218 232 0 0
* CP: coupled payments e: estimate
Depreciation 183 195 173 175 194 206 230 241 235 220 20%
Wages 24 25 25 23 24 29 35 28 31 39 65%
Rent 68 72 68 69 69 72 69 69 71 74 9%
Interest 42 40 37 33 30 34 40 46 46 44 4%
External factors 134 137 130 125 123 135 145 143 149 157 18%
Net margin (before ow n factors) -142 -185 -167 -175 -184 -176 -187 -226 -259 -253 78%Net margin (before ow n factors) with CP* 208 228 271 271 274 38 -63 -98 -119 -117 -156%
* CP: coupled payments
Family labour costs 481 486 447 450 477 501 493 542 525 501 4%
Ow n capital unpaid cost 164 152 133 132 147 124 114 146 99 214 31%
Imputed family factors 645 639 580 582 625 625 606 688 624 715 11%
Total economic costs 1 863 1 851 1 769 1 817 1 928 2 001 2 146 2 213 2 221 2 229 20%
Net economic margin (after own factors) -787 -823 -748 -756 -808 -801 -793 -914 -883 -968 23%
Net economic margin (after own factors) with CP* -437 -411 -310 -311 -350 -587 -669 -786 -742 -832 91%
ASSETS in €/Male cattle sold (nominal)
Breeders & Fatteners 2000 2001 2002 2003 2004 2005 2006 2007 2008 2009 2009/ 2000
Fixed assets 7 786 8 049 8 029 8 787 9 125 11 418 12 327 15 380 14 226 13 336 71%
Current assets 1 777 1 824 1 725 1 735 1 793 1 947 2 184 2 463 2 346 2 210 24%
Total assets 9 563 9 873 9 754 10 522 10 918 13 365 14 511 17 843 16 572 15 546 63%
INCOME per AWU in €/AWU (nominal)
Breeders & Fatteners 2000 2001 2002 2003 2004 2005 2006 2007 2008 2009 2009/ 2000Total output 27 606 28 402 28 537 30 350 32 960 33 262 37 607 36 945 43 241 41 307 50%
Intermediate consumptions 20 761 22 079 21 892 23 882 25 986 26 107 28 787 28 454 35 624 34 109 64%
Balance of subsidies and taxes 12 450 15 814 16 057 17 665 18 763 18 790 18 732 18 434 19 673 19 696 58%
of w hich LFA/AWU 877 1 511 1 387 1 553 1 594 1 642 1 709 1 761 1 739 1 699 94%
of w hich environmental/AWU 980 1 175 1 238 1 495 1 728 2 000 2 183 2 278 2 532 2 283 133%
Gross Farm Income (GFI) 19 295 22 136 22 703 24 133 25 737 25 945 27 552 26 925 27 289 26 894 39%
Depreciation 5 781 6 321 5 762 6 105 6 871 7 030 8 109 8 050 8 454 8 122 40%
Farm Net Value Added (FNVA) 13 514 15 815 16 940 18 028 18 865 18 915 19 443 18 875 18 835 18 772 39%
Wages 788 835 864 827 898 1 021 1 240 1 000 1 153 1 479 88%
Rent 2 136 2 359 2 266 2 390 2 426 2 464 2 486 2 313 2 603 2 692 26%
Interest 1 342 1 330 1 233 1 175 1 101 1 184 1 471 1 544 1 683 1 604 20%
External factors 4 266 4 524 4 363 4 391 4 425 4 669 5 196 4 857 5 439 5 775 35%
Balance of subsidies and taxes on investment 223 150 230 159 13 121 227 193 555 1 096 391%
Farm net income (FNI) 9 471 11 441 12 808 13 796 14 453 14 367 14 473 14 211 13 951 14 093 49%
Family labour costs 14 881 15 386 14 445 15 205 16 556 16 865 17 397 17 940 18 797 17 976 21%
Ow n capital unpaid cost 4 979 4 763 4 247 4 395 5 076 4 103 3 986 4 820 3 464 7 555 52%
Imputed family factors 19 860 20 149 18 692 19 599 21 632 20 968 21 383 22 760 22 261 25 531 29%
Family farms only in EUR/FWU (nominal)
Ow n capital unpaid cost 5 246 5 049 4 487 4 641 5 366 4 362 4 259 5 130 3 712 8 238 57%
Remuneration of Family Labour (RFL) 4 737 7 082 9 065 9 928 9 914 10 871 10 890 9 992 11 237 7 094 50%

EU beef farms report 2012
71
Table 20 Breeders & Fatteners, EU-10, 2000-2011 EU-10STRUCTURAL INFORMATION
Breeders & Fatteners2004 2005 2006 2007 2008 2009
2009/ 2004
Farms represented 4 940 3 760 5 480 5 070 6 440 7 630 54%
Sample farms 81 77 117 106 140 174 115%
Av. Labour in AWU 1.73 1.72 1.65 1.47 1.54 1.59 -8%
Family labour - % 86% 96% 93% 93% 93% 95% 10%
Beef specialisation - % output 73% 72% 72% 69% 73% 70% -4%
Average UAA - ha 41.1 30.4 36.2 42.4 42.1 37.7 -8%
Forage crops - ha 34.1 26.7 31.2 37.7 36.8 30.5 -10%
of which % permanent grassland 92% 71% 88% 79% 75% 68% -26%
Stocking density - LU/ha 0.5 0.7 0.6 0.6 0.6 0.7 31%
Av. number of suckler cows - head 12.65 10.31 9.84 12.99 12.49 11.30 -11%
Number of suckler cow s per AWU 7.31 5.99 5.96 8.84 8.11 7.11 -3%
Total beef cattle - LU 20 19 19 22 22 21 3%
Total LU on the farm 21 21 20 24 23 22 3%
Cattle (male & female) < 1 year sold - head 11 3 8 11 6 4 -64%
Male cattle 1-2 years sold - head 4 6 5 4 5 6 77%
Male cattle sold (incl. fem. < 1 year) - head 18 12 16 16 13 12 -37%
Selling price male cattle - €/head 444 553 522 514 572 576 30%
Cattle < 1 year + male 1-2 year sold / cow 1.5 1.1 1.6 1.3 1.0 1.0 -30%
Total cattle sold - head 21 13 18 19 16 15 -26%
Total cattle sales - € 8 972 7 288 9 366 9 749 9 070 8 642 -4%
Selling price cattle - €/head 437 546 525 518 572 567 30%
OUTPUT AND COSTS in €/Male cattle sold (nominal)
Breeders & Fatteners 2004 2005 2006 2007 2008 2009 2009/ 2004 2010e 2011e 2010 /2009 2011 /2009
TOTAL BEEF OUTPUT 512 732 658 793 825 780 52% 802 929 3% 19%
TOTAL BEEF COUPLED DP 186 267 219 63 108 89 -52% 89 89 0% 0%
of which suckler cow premium 68.9 100.2 68.1 26.2 38.7 32.6 -53% 32.6 32.6 0% 0%
of which special male premium 21 39 33 14 23 23 11% 23 23 0% 0%
of which slaughter premium 20 32 28 1 2 2 -92% 2 2 0% 0%
of which extensification premium 24 40 35 0 0 0 -100% 0 0
of which other DP (incl. National DP) 51 55 56 21 44 31 -39% 31 31 0% 0%
Feed 100 192 168 160 288 290 190% 346 429 19% 48%
of which purchased feed 52 89 68 73 139 109 108% 133 167 23% 54%
of which home-grown feed 48 103 100 86 149 182 279% 213 262 17% 44%
Animal purchase 115 132 195 155 93 122 6% 130 144 7% 18%
Other specif ic costs 70 34 37 69 59 42 -39% 43 44 0% 3%Specific costs 285 358 400 384 440 455 59% 519 616 14% 35%
Machinery and building upkeep 109 130 141 138 179 128 18% 130 135 1% 5%
Energy (fuel, electricity) 66 106 109 117 174 140 111% 157 179 12% 28%Contract w ork 57.9 37.2 37.6 52.9 66.6 41.2 -29% 41.6 43.7 1% 6%
Taxes (exc. milk levy) 6 7 7 10 11 11 80% 12 12 2% 5%Other direct inputs (incl. w ater, insurance on farm buildings)
58 44 42 51 82 7325%
74 78 1% 7%
Non specific costs 298 324 337 369 513 394 32% 414 448 5% 14%
Total operating costs 583 682 737 753 953 849 46% 933 1 065 10% 25%
Gross margin (over operating costs) -71 49 -80 40 -128 -69 -3% -131 -136Gross margin (over operating costs) with CP* 114 316 139 102 -20 19 -83% -42 -47
* CP: coupled payments e: estimate
Depreciation 194 292 204 198 277 306 57%
Wages 39 25 30 49 54 41 4%
Rent 16 19 14 21 28 39 140%
Interest 8 15 13 18 25 24 222%
External factors 63 60 57 88 106 104 66%
Net margin (before own factors) -328 -302 -341 -247 -512 -479 46%
Net margin (before own factors) with CP* -143 -36 -122 -184 -404 -390 173%
* CP: coupled payments
Family labour costs 296 569 427 385 619 614 108%
Ow n capital unpaid cost 59 107 84 48 -46 251 322%
Imputed family factors 355 676 511 432 574 865 144%
Total economic costs 1 195 1 710 1 510 1 472 1 910 2 123 78%
Net economic margin (after ow n factors) -683 -978 -852 -679 -1 086 -1 344 97%
Net economic margin (after ow n factors) with CP* -498 -711 -633 -616 -977 -1 255 152%
ASSETS
Breeders & Fatteners 2004 2005 2006 2007 2008 2009 2009/ 2004
Fixed assets 11 214 13 136 8 403 8 413 9 640 11 826 5%
Current assets 757 1 186 958 1 564 1 888 1 811 139%
Total assets 11 971 14 322 9 360 9 977 11 528 13 638 14%
INCOME per AWU
Breeders & Fatteners 2004 2005 2006 2007 2008 2009 2009/ 2004
Total output 7 263 7 001 7 987 14 260 12 246 10 072 39%
Intermediate consumptions 7 607 5 775 8 108 12 996 12 892 10 024 32%
Balance of subsidies and taxes 6 079 5 539 6 885 8 932 10 138 7 960 31%
of w hich LFA/AWU 1 898 1 525 1 841 1 984 1 982 1 542 -19%
of w hich environmental/AWU 1 229 1 426 1 551 2 206 2 707 1 665 35%
Gross Farm Income (GFI) 5 735 6 766 6 764 10 196 9 492 8 008 40%
Depreciation 2 918 2 637 2 643 3 013 3 013 3 099 6%
Farm Net Value Added (FNVA) 2 818 4 128 4 122 7 183 6 478 4 909 74%
Wages 593 237 383 671 679 362 -39%
Rent 214 172 176 309 301 360 68%
Interest 117 144 192 282 271 247 112%
External factors 924 553 751 1 262 1 251 970 5%
Balance of subsidies and taxes on investment 831 -83 -178 817 496 690 -17%
Farm net income (FNI) 2 725 3 493 3 192 6 738 5 723 4 629 70%
Family labour costs 4 422 5 253 5 528 6 076 6 709 6 408 45%
Ow n capital unpaid cost 914 974 1 088 766 -462 2 574 182%
Imputed family factors 5 336 6 227 6 616 6 842 6 247 8 982 68%
Ow n capital unpaid cost 1 060 1 014 1 163 831 -500 2 722 157%
Remuneration of Fam ily Labour (RFL) 2 380 2 453 2 316 6 378 6 533 2 081 -13%

EU beef farms report 2012
72
Table 21 Breeders & Fatteners, EU group, 2009 2009STRUCTURAL INFORMATION
Breeders & FattenersEU27 EU15 EU10
Farms represented 71 020 62 580 7 630
Sample farms 1 399 1 223 174
Av. Labour in AWU 1.38 1.33 1.59
Family labour - % 91% 92% 95%
Beef specialisation - % output 79% 79% 70%
Average UAA - ha 68.0 72.4 37.7
Forage crops - ha 58.3 62.3 30.5
of which % permanent grassland 77% 78% 68%
Stocking density - LU/ha 1.1 1.1 0.7
Av. number of suckler cow s - head 35.48 38.08 11.30
Number of suckler cow s per AWU 25.71 28.63 7.11
Total beef cattle - LU 64 70 21
Total LU on the farm 67 73 22
Cattle (male & female) < 1 year sold - head 15 16 4
Male cattle 1-2 years sold - head 13 14 6
Male cattle sold (incl. fem. < 1 year) - head 36 38 12
Selling price male cattle - €/head 897 925 576
Cattle < 1 year + male 1-2 year sold / cow 1.0 1.0 1.0
Total cattle sold - head 49 53 15
Total cattle sales - € 45 342 50 165 8 642
Selling price cattle - €/head 921 945 567
OUTPUT AND COSTS in €/Male cattle sold (nominal)
Breeders & Fatteners EU27 EU15 EU10EU15/EU27 EU10/EU27 EU10/EU15
TOTAL BEEF OUTPUT 1 222 1 261 780 103% 64% 62%
TOTAL BEEF COUPLED DP 131 136 89 104% 68% 65%
of which suckler cow premium 101.5 106.4 32.6 105% 32% 31%
of which special male premium 7 7 23 95% 312% 329%
of which slaughter premium 8 9 2 105% 21% 20%
of which extensification premium 0 0 0
of which other DP (incl. National DP) 14 13 31 98% 228% 234%
Feed 418 429 290 103% 69% 68%
of which purchased feed 277 286 109 104% 39% 38%
of which home-grown feed 141 143 182 101% 128% 127%
Animal purchase 247 257 122 104% 49% 47%
Other specific costs 82 85 42 104% 52% 50%
Specific costs 747 772 455 103% 61% 59%Machinery and building upkeep 91 92 128 101% 140% 139%
Energy (fuel, electricity) 71 70 140 98% 197% 200%
Contract w ork 79.5 82.7 41.2 104% 52% 50%
Taxes (exc. milk levy) 12 13 11 103% 93% 91%Other direct inputs (incl. w ater, insurance on farm buildings) 104 107 73 103% 71% 68%
Non specific costs 358 365 394 102% 110% 108%
Total operating costs 1 105 1 137 849 103% 77% 75%
Gross margin (over operating costs) 117 124 -69 106% -59% -56%Gross margin (over operating costs) w ith CP* 248 260 19 105% 8% 7%* CP: coupled payments
Depreciation 218 220 306
Wages 40 39 41
Rent 71 74 39
Interest 42 44 24
External factors 153 157 104
Net margin (before own factors) -255 -253 -479Net margin (before own factors) w ith CP* -123 -117 -390
* CP: coupled payments
Family labour costs 494 501 614Ow n capital unpaid cost 211 214 251
Imputed family factors 705 715 865
Total economic costs 2 182 2 229 2 123
Net economic margin (after ow n factors) -960 -968 -1 344
Net economic margin (after ow n factors) w ith CP* -829 -832 -1 255
ASSETS
Breeders & Fatteners EU27 EU15 EU10
Fixed assets 13 004 13 336 11 826
Current assets 2 149 2 210 1 811
Total assets 15 153 15 546 13 638
INCOME per AWU
Breeders & Fatteners EU27 EU15 EU10
Total output 36 485 41 307 10 072
Intermediate consumptions 30 310 34 109 10 024
Balance of subsidies and taxes 17 716 19 696 7 960
of w hich LFA/AWU 1 633 1 699 1 542
of w hich environmental/AWU 2 145 2 283 1 665
Gross Farm Income (GFI) 23 892 26 894 8 008
Depreciation 7 287 8 122 3 099
Farm Net Value Added (FNVA) 16 605 18 772 4 909
Wages 1 334 1 479 362
Rent 2 333 2 692 360
Interest 1 393 1 604 247
External factors 5 061 5 775 970
Balance of subsidies and taxes on investment 1 016 1 096 690
Farm net income (FNI) 12 560 14 093 4 629
Family labour costs 16 075 17 976 6 408
Ow n capital unpaid cost 6 755 7 555 2 574
Imputed family factors 22 830 25 531 8 982
Family farms only in EUR/FWU (nominal)
Ow n capital unpaid cost 7 473 8 238 2 722
Remuneration of Family Labour (RFL) 6 374 7 094 2 081

EU beef farms report 2012
73
Table 22 Breeders & Fatteners, Member States, 2009 2009
STRUCTURAL INFORMATION
Breeders & Fatteners AT BE CZ DK DE ES FR IE IT LU PL
Farms represented 680 1 430 620 650 1 860 12 080 10 290 15 720 7 230 100 2 280
Sample farms 18 40 39 19 76 207 182 152 117 22 32
Av. Labour in AWU 1.3 1.5 1.9 0.9 1.6 1.2 1.5 1.2 1.4 1.2 1.7
Family labour - % 100% 97% 80% 74% 81% 93% 92% 96% 93% 92% 98%
Beef specialisation - % output 65% 77% 79% 72% 76% 83% 80% 85% 71% 73% 65%
Average UAA - ha 35 54 104 57 89 83 95 50 34 72 26
Forage crops - ha 31 40 95 34 78 72 80 48 28 55 17
of which % permanent grassland 1 1 1 0 1 1 1 1 0 1 1
Stocking density - LU/ha 0.9 2.8 0.5 2.1 1.2 0.7 1.3 1.3 1.0 1.7 1.1
Av. number of suckler cow s - head 18 51 32 20 43 45 55 27 17 46 9
Number of suckler cow s per AWU 13 34 16 22 27 37 38 23 12 39 5
Total beef cattle - LU 30 110 50 71 89 53 105 57 29 92 19
Total LU on the farm 31 115 51 74 91 55 107 62 29 93 21
Cattle (male & female) < 1 year sold - head 10 7 20 69 10 32 20 7 10 8 2
Male cattle 1-2 years sold - head 7 36 9 13 27 10 18 6 8 24 9
Male cattle sold (incl. fem. < 1 year) - head 19 53 29 86 39 48 47 23 21 35 12
Selling price male cattle - €/head 956 1 859 585 755 983 752 1 087 793 1 205 1 183 603
Cattle < 1 year + male 1-2 year sold / cow 1 1 1 4 1 1 1 1 1 1 1
Total cattle sold - head 24 83 39 97 58 58 68 36 25 56 16
Total cattle sales - € 21 793 148 438 22 911 75 906 53 136 45 307 77 313 27 973 30 701 59 800 8 860
Selling price cattle - €/head 927 1 795 586 780 922 775 1 137 781 1 223 1 075 559
OUTPUT AND COSTS in €/Male cattle sold (nom inal)
Breeders & Fatteners AT BE CZ DK DE ES FR IE IT LU PL
TOTAL BEEF OUTPUT 1 235 2 672 745 872 1 439 860 1 576 1 203 1 403 1 628 758
TOTAL BEEF COUPLED DP 268 208 129 120 0 167 276 31 11 0 0
of which suckler cow premium 230 208 0 0 0 152 254 0 0 0 0
of which special male premium 0 0 0 120 0 0 0 0 0 0 0
of which slaughter premium 36 0 0 0 0 10 22 0 0 0 0
of which extensification premium 0 0 0 0 0 0 0 0 0 0 0
of which other DP (incl. National DP) 2 0 129 0 0 4 0 31 11 0 0
Feed 235 818 231 410 328 376 518 451 307 510 262
of which purchased feed 112 622 115 320 170 360 306 269 138 179 45
of which home-grown feed 123 195 115 90 158 16 213 182 168 330 217
Animal purchase 277 776 98 226 240 133 256 242 153 274 117
Other specific costs 82 217 87 64 85 34 92 110 84 138 14
Specific costs 594 1 810 415 699 653 543 866 804 544 921 393
Machinery and building upkeep 141 84 173 105 157 18 147 128 13 154 68
Energy (fuel, electricity) 130 62 209 39 187 24 80 85 86 125 81
Contract w ork 119 162 69 90 145 28 134 116 24 121 38
Taxes (exc. milk levy) 16 28 15 22 27 5 26 6 20 21 13
Other direct inputs (incl. w ater, insurance on farm buildings) 245 67 141 86 224 33 217 101 42 228 27
Non specific costs 652 403 606 341 741 108 603 435 185 648 227
Total operating costs 1 245 2 213 1 021 1 041 1 394 651 1 469 1 239 729 1 570 620
Gross margin (over operating costs) -10 459 -276 -169 44 209 107 -37 674 59 138Gross margin (over operating costs) w ith CP* 258 668 -147 -50 44 375 382 -6 686 59 138* CP: coupled payments

EU beef farms report 2012
74
Table 22 Breeders & Fatteners, Member States, 2009 (cont.) AT BE CZ DK DE ES FR IE IT LU PL PT FI SE SI UK
Depreciation 498 316 296 174 393 40 387 205 305 653 217 87 1 043 203 628 224
Wages 2 11 124 84 118 24 34 31 42 42 9 33 118 63 16 61
Rent 27 131 111 38 142 31 137 82 45 114 9 13 201 49 20 62
Interest 67 119 46 240 66 2 64 42 0 79 13 58 230 70 16 29
External factors 95 261 281 362 325 57 235 156 88 234 31 103 549 182 52 152
Net margin (before own factors) -604 -118 -853 -706 -674 111 -516 -397 282 -828 -110 -237 -2 341 -609 -745 -277Net margin (before own factors) with CP* -336 90 -724 -586 -674 278 -240 -366 293 -828 -110 -13 -1 452 -501 -686 -263* CP: coupled payments
Family labour costs 725 507 457 214 454 354 435 876 909 546 481 203 1 314 501 1 284 399
Ow n capital unpaid cost 531 150 138 18 204 119 154 659 238 512 109 54 285 49 528 127
Im puted family factors 1 256 657 595 231 659 473 589 1 535 1 147 1 058 589 257 1 600 551 1 812 526
Total economic costs 3 095 3 448 2 193 1 809 2 772 1 222 2 680 3 135 2 269 3 514 1 457 939 5 588 2 090 3 438 2 280
Net economic margin (after own factors) -1 860 -775 -1 448 -937 -1 333 -362 -1 105 -1 932 -866 -1 886 -700 -494 -3 940 -1 160 -2 558 -803
Net economic margin (after own factors) with CP* -1 592 -567 -1 319 -817 -1 333 -195 -829 -1 901 -855 -1 886 -700 -270 -3 051 -1 051 -2 498 -788
ASSETS
Breeders & Fatteners AT BE CZ DK DE ES FR IE IT LU PL PT FI SE SI UK
Fixed assets 17 546 8 082 5 102 13 539 12 718 3 668 5 212 39 704 15 048 21 436 14 423 3 979 19 717 7 072 29 741 18 845
Current assets 2 541 2 482 1 685 1 461 2 192 2 269 2 697 2 247 2 136 4 731 1 569 747 3 737 2 766 1 761 1 853
Total assets 20 087 10 564 6 787 15 000 14 910 5 937 7 909 41 951 17 184 26 168 15 992 4 727 23 454 9 838 31 502 20 698
INCOME per AWU
Breeders & Fatteners AT BE CZ DK DE ES FR IE IT LU PL PT FI SE SI UK
Total output 22 441 90 617 19 091 110 821 38 532 39 181 54 539 26 175 31 857 55 831 7 449 14 588 30 672 59 684 9 018 64 856
Intermediate consumptions 19 008 61 971 22 913 121 233 35 760 26 079 47 066 26 479 15 255 51 630 5 765 14 058 40 398 68 792 9 182 55 894
Balance of subsidies and taxes 17 069 25 255 27 315 40 808 25 866 16 201 25 085 18 540 5 725 36 069 4 350 12 779 46 902 35 873 5 359 28 619
of w hich LFA/AWU 2 728 290 6 653 0 3 149 1 129 2 178 1 882 391 6 851 793 1 112 9 922 4 085 1 353 1 768
of w hich environmental/AWU 4 730 2 249 6 599 5 328 5 571 538 1 975 2 655 641 6 500 797 753 12 681 11 440 1 474 3 452
Gross Farm Income (GFI) 20 501 53 901 23 493 30 397 28 637 29 302 32 557 18 236 22 327 40 270 6 035 13 309 37 176 26 765 5 194 37 581
Depreciation 10 599 14 597 5 564 22 181 12 458 1 866 15 791 4 698 6 812 26 386 2 328 2 841 18 644 11 643 3 701 11 340
Farm Net Value Added (FNVA) 9 902 39 304 17 929 8 216 16 179 27 437 16 766 13 538 15 515 13 884 3 707 10 468 18 532 15 122 1 493 26 241
Wages 40 540 2 098 10 815 3 561 1 136 1 387 771 967 1 940 75 1 034 2 194 3 398 115 3 267
Rent 539 6 168 1 919 5 151 4 471 1 506 5 591 1 848 961 4 739 74 411 3 679 2 764 118 3 157
Interest 1 496 5 239 835 30 878 1 987 114 2 633 994 9 3 206 126 1 842 3 575 3 941 92 1 464
External factors 2 075 11 947 4 852 46 844 10 019 2 756 9 610 3 614 1 938 9 884 275 3 287 9 448 10 103 325 7 887
Balance of subsidies and taxes on investment -757 -49 233 22 -1 561 -88 225 3 802 87 1 537 14 392 835 0 477 2 319
Farm net income (FNI) 7 070 27 307 13 310 -38 605 4 599 24 593 7 381 13 726 13 665 5 536 3 446 7 573 9 918 5 019 1 645 20 673
Family labour costs 15 328 23 336 8 982 28 067 14 665 16 621 17 454 19 568 19 926 21 860 5 056 6 821 23 219 28 895 7 810 19 767
Ow n capital unpaid cost 11 541 6 915 2 646 2 802 6 570 5 601 6 063 14 919 5 332 19 993 1 200 1 858 5 328 2 986 3 187 6 223
Imputed family factors 26 869 30 251 11 628 30 869 21 235 22 221 23 517 34 487 25 258 41 852 6 256 8 679 28 547 31 882 10 997 25 990
Fam ily farm s only in EUR/FWU (nominal)
Ow n capital unpaid cost 11 534 7 109 3 294 3 784 8 170 5 957 6 553 15 618 5 744 21 587 1 222 2 158 5 886 3 380 3 224 7 332
Remuneration of Family Labour (RFL) -4 468 20 963 11 902 -55 914 -3 240 20 138 1 425 -1 248 8 977 -15 609 2 359 6 638 5 072 2 300 -1 560 17 026

EU beef farms report 2012
75
Table 23 Breeders & Fatteners, Member States, 2010, 2011 estimates 2010OUTPUT AND COSTS in €/Male cattle sold (nominal)
Breeders & Fatteners 2010eAT BE CZ DK DE ES FR IE IT LU PL PT FI SE SI UK
TOTAL BEEF OUTPUT 1 252 2 631 769 1 456 921 926 1 615 1 587 1 211 1 372 1 634 788 438 1 129 874 1 472
TOTAL BEEF COUPLED DP 268 208 129 0 120 167 889 276 31 11 0 0 225 108 59 14
of which suckler cow premium 230 208 0 0 0 152 0 254 0 0 0 0 187 0 0 0
of which special male premium 0 0 0 0 120 0 86 0 0 0 0 0 10 107 59 0
of which slaughter premium 36 0 0 0 0 10 0 22 0 0 0 0 12 0 0 0
of which extensification premium 0 0 0 0 0 0 0 0 0 0 0 0 8 0 0 0
of which other DP (incl. National DP) 2 0 129 0 0 4 803 0 31 11 0 0 8 1 0 14
Feed 253 958 267 363 449 427 691 558 459 330 568 316 243 361 165 481
of which purchased feed 134 745 138 205 362 412 254 357 295 154 215 57 129 214 79 290
of which home-grown feed 119 213 129 158 87 15 437 201 164 176 353 258 114 148 87 191
Animal purchase 295 827 104 342 240 125 150 242 256 151 292 125 86 275 172 464
Other specif ic costs 85 225 85 86 65 34 128 94 110 86 138 14 35 70 70 143Specific costs 633 2 009 456 790 753 586 968 893 825 567 997 455 365 706 407 1 088
Machinery and building upkeep 149 94 174 161 107 18 550 151 126 13 158 69 46 152 303 118
Energy (fuel, electricity) 143 75 233 200 43 28 274 95 98 92 150 87 57 132 189 95
Contract w ork 128 167 68 145 94 30 260 132 117 24 124 39 19 93 41 83
Taxes (exc. milk levy) 16 28 15 28 22 6 18 26 6 20 21 13 1 3 5 8Other direct inputs (incl. w ater, insurance on farm buildings) 264 69 139 225 89 35 462 215 102 43 235 27 23 141 59 113Non specific costs 700 434 628 759 356 117 1 564 619 449 193 688 235 146 521 598 416Total operating costs 1 334 2 443 1 084 1 549 1 109 703 2 532 1 512 1 274 760 1 685 689 511 1 227 1 005 1 504
Gross margin (over operating costs) -82 188 -315 -93 -188 224 -918 75 -63 613 -51 99 -73 -98 -131 -32Gross margin (over operating costs) with CP* 186 396 -186 -93 -69 391 -29 350 -33 624 -51 99 152 10 -72 -18* CP: coupled payments
2011OUTPUT AND COSTS in €/Male cattle sold (nominal)
Breeders & Fatteners 2011e AT BE CZ DK DE ES FR IE IT LU PL PT FI SE SI UKTOTAL BEEF OUTPUT 1 397 2 810 846 1 687 1 040 1 018 1 736 1 716 1 440 1 458 1 730 955 453 1 280 992 1 682
TOTAL BEEF COUPLED DP 268 208 129 0 120 167 889 276 31 11 0 0 225 108 59 14
of which suckler cow premium 230 208 0 0 0 152 0 254 0 0 0 0 187 0 0 0
of which special male premium 0 0 0 0 120 0 86 0 0 0 0 0 10 107 59 0
of which slaughter premium 36 0 0 0 0 10 0 22 0 0 0 0 12 0 0 0
of which extensification premium 0 0 0 0 0 0 0 0 0 0 0 0 8 0 0 0
of which other DP (incl. National DP) 2 0 129 0 0 4 803 0 31 11 0 0 8 1 0 14
Feed 298 1 182 368 428 523 515 834 619 506 351 706 386 289 429 221 582
of which purchased feed 160 936 192 244 421 497 296 390 310 162 270 71 156 256 110 349
of which home-grown feed 138 246 175 184 102 18 538 230 196 188 436 315 133 173 112 233
Animal purchase 326 912 115 383 265 123 166 240 397 142 322 138 95 303 190 512
Other specif ic costs 86 230 87 86 65 34 128 96 110 87 137 15 35 71 71 145Specific costs 710 2 324 569 897 854 672 1 127 956 1 013 580 1 165 538 420 804 483 1 239
Machinery and building upkeep 153 98 178 166 110 18 564 155 125 14 168 74 46 156 305 125
Energy (fuel, electricity) 163 92 256 225 51 34 353 108 113 104 168 96 66 143 218 107Contract w ork 128 171 69 147 99 33 266 137 118 25 131 44 19 98 41 85
Taxes (exc. milk levy) 17 29 15 28 23 6 18 27 6 21 22 13 1 3 5 8Other direct inputs (incl. w ater, insurance on farm buildings) 264 70 141 228 94 38 473 222 102 45 249 31 23 148 59 116Non specific costs 726 460 659 795 377 128 1 674 648 464 208 738 258 155 548 629 442Total operating costs 1 436 2 784 1 229 1 692 1 231 800 2 802 1 603 1 477 788 1 903 796 574 1 351 1 111 1 681
Gross margin (over operating costs) -39 26 -382 -5 -191 217 -1 066 113 -36 671 -173 159 -121 -71 -120 1Gross margin (over operating costs) with CP* 229 235 -253 -5 -71 384 -177 388 -5 682 -173 159 103 37 -61 15* CP: coupled payments

EU beef farms report 2012
76
ANNEX VA BREEDERS & FATTENERS BY MEMBER STATES AustriaSTRUCTURAL INFORMATION
Breeders & Fatteners 2008 2009
Farms represented 730 680
Sample farms 19 18
Av. Labour in AWU 1.44 1.34
Family labour - % 95% 100%
Beef specialisation - % output 63% 65%
Average UAA - ha 45.3 35.0
Forage crops - ha 41.0 30.8
of which % permanent grassland 84% 79%
Stocking density - LU/ha 0.7 0.9
Av. number of suckler cow s - head 17.76 17.59
Number of suckler cow s per AWU 12.33 13.13
Total beef cattle - LU 31 30
Total LU on the farm 32 31
Cattle (male & female) < 1 year sold - head 15 10
Male cattle 1-2 years sold - head 6 7
Male cattle sold (incl. fem. < 1 year) - head 24 19
Selling price male cattle - €/head 895 956
Cattle < 1 year + male 1-2 year sold / cow 1.4 1.1
Total cattle sold - head 33 24
Total cattle sales - € 28 910 21 793
Selling price cattle - €/head 882 927
OUTPUT AND COSTS
Breeders & Fatteners 2008 2009 2010e 2011e 2010 /2009 2011 /2009
TOTAL BEEF OUTPUT 997 1 235 1 252 1 397 1% 13%
TOTAL BEEF COUPLED DP 219 268 268 268 0% 0%
of which suckler cow premium 184.7 230.3 230.3 230.3 0% 0%
of which special male premium 0 0 0 0
of which slaughter premium 32 36 36 36 0% 0%
of which extensification premium 0 0 0 0
of which other DP (incl. National DP) 1 2 2 2 0% 0%
Feed 174 235 253 298 8% 27%
of which purchased feed 91 112 134 160 20% 43%
of which home-grown feed 83 123 119 138 -3% 12%
Animal purchase 204 277 295 326 7% 18%
Other specif ic costs 82 82 85 86 3% 5%
Specific costs 461 594 633 710 7% 20%
Machinery and building upkeep 113 141 149 153 5% 8%
Energy (fuel, electricity) 102 130 143 163 10% 26%
Contract w ork 89.2 119.2 128.4 128.4 8% 8%
Taxes (exc. milk levy) 15 16 16 17 2% 5%Other direct inputs (incl. w ater, insurance on farm buildings)
193 245 264 2648% 8%
Non specific costs 512 652 700 726 8% 11%
Total operating costs 973 1 245 1 334 1 436 7% 15%
Gross margin (over operating costs) 24 -10 -82 -39 707% 282%
Gross margin (over operating costs) w ith CP* 243 258 186 229 -28% -11%
* CP: coupled payments e: estimateDepreciation 376 498
Wages 19 2Rent 25 27
Interest 64 67
External factors 108 95
Net margin (before ow n factors) -460 -604Net margin (before ow n factors) w ith CP* -241 -336
* CP: coupled payments
Family labour costs 557 725
Ow n capital unpaid cost 208 531
Imputed family factors 765 1 256
Total economic costs 2 221 3 095
Net economic margin (after ow n factors) -1 225 -1 860
Net economic margin (after ow n factors) w ith CP* -1 006 -1 592
ASSETS
Breeders & Fatteners 2008 2009
Fixed assets 14 062 17 546
Current assets 2 478 2 541
Total assets 16 540 20 087
INCOME per AWU
Breeders & Fatteners 2008 2009Total output 23 274 22 441
Intermediate consumptions 18 166 19 008
Balance of subsidies and taxes 17 203 17 069
of w hich LFA/AWU 2 995 2 728
of w hich environmental/AWU 4 123 4 730
Gross Farm Income (GFI) 22 312 20 501
Depreciation 9 872 10 599
Farm Net Value Added (FNVA) 12 440 9 902
Wages 449 40Rent 668 539
Interest 1 620 1 496
External factors 2 738 2 075
Balance of subsidies and taxes on investment -1 133 -757
Farm net income (FNI) 8 569 7 070
Family labour costs 14 655 15 328
Ow n capital unpaid cost 5 190 11 541
Imputed family factors 19 845 26 869
Ow n capital unpaid cost 5 451 11 534
Remuneration of Family Labour (RFL) 3 549 -4 468

EU beef farms report 2012
77
BelgiumSTRUCTURAL INFORMATION
Breeders & Fatteners 2000 2001 2002 2003 2004 2005 2006 2007 2008 20092009/ 2000
Farms represented 1 030 1 440 1 240 1 040 1 630 1 540 1 430 1 390 1 390 1 430 39%
Sample farms 27 34 38 35 38 39 34 34 39 40
Av. Labour in AWU 1.53 1.42 1.53 1.55 1.47 1.47 1.56 1.45 1.49 1.48 -3%
Family labour - % 93% 94% 93% 94% 97% 97% 98% 98% 99% 97% 4%
Beef specialisation - % output 79% 81% 76% 77% 77% 75% 76% 75% 73% 77% -2%
Average UAA - ha 49.1 48.4 55.7 64.6 55.5 62.1 62.3 57.1 55.7 54.2 11%
Forage crops - ha 35.8 39.0 40.5 46.1 39.4 43.6 40.8 40.1 38.7 39.5 10%
of which % permanent grassland 69% 75% 76% 76% 65% 70% 71% 71% 62% 71% 4%
Stocking density - LU/ha 3.1 2.8 3.1 3.1 2.9 2.8 3.1 3.0 2.9 2.8 -9%
Av. number of suckler cows - head 53.79 53.54 59.75 69.59 54.28 58.90 57.32 56.86 51.75 51.00 -5%
Number of suckler cow s per AWU 35.16 37.70 39.05 44.90 36.93 40.07 36.74 39.21 34.73 34.46 -2%
Total beef cattle - LU 109 108 124 142 114 123 126 121 113 110 0%
Total LU on the farm 111 108 132 152 118 128 134 128 120 115 4%
Cattle (male & female) < 1 year sold - head 15 16 19 7 4 8 4 2 3 7 -56%
Male cattle 1-2 years sold - head 25 22 38 43 35 35 38 37 35 36 44%
Male cattle sold (incl. fem. < 1 year) - head 50 43 63 59 53 51 53 47 46 53 7%
Selling price male cattle - €/head 1 312 1 205 1 252 1 744 1 741 1 647 2 001 1 945 1 892 1 859 42%
Cattle < 1 year + male 1-2 year sold / cow 0.9 0.8 1.1 0.8 1.0 0.9 0.9 0.8 0.9 1.0 12%
Total cattle sold - head 72 72 98 98 78 79 85 76 74 83 15%
Total cattle sales - € 95 399 87 331 121 460 159 265 133 039 127 490 160 872 141 613 136 535 148 438 56%
Selling price cattle - €/head 1 330 1 209 1 245 1 619 1 710 1 622 1 903 1 865 1 855 1 795 35%
OUTPUT AND COSTS in €/Male cattle sold
Breeders & Fatteners 2000 2001 2002 2003 2004 2005 2006 2007 2008 2009 2009/ 2000 2010e 2011e 2010 /2009 2011 /2009
TOTAL BEEF OUTPUT 2 036 1 763 1 810 2 706 2 614 2 535 3 210 3 212 2 856 2 672 31% 2 631 2 810 -2% 5%
TOTAL BEEF COUPLED DP 306 487 469 585 552 280 257 278 261 208 -32% 208 208 0% 0%
of which suckler cow premium 168.9 234.3 212.5 263.2 251.0 279.9 257.3 278.2 261.0 208.3 23% 208.3 208.3 0% 0%
of which special male premium 75 122 104 119 113 0 0 0 0 0 -100% 0 0
of which slaughter premium 25 51 77 95 92 0 0 0 0 0 -100% 0 0
of which extensification premium 17 25 14 18 5 0 0 0 0 0 -100% 0 0
of which other DP (incl. National DP) 21 55 62 90 92 0 0 0 0 0 -100% 0 0
Feed 513 664 670 800 787 761 899 1 107 1 174 818 59% 958 1 182 17% 45%
of which purchased feed 351 498 527 630 604 562 698 866 927 622 77% 745 936 20% 50%
of which home-grown feed 162 166 143 170 183 199 201 241 247 195 20% 213 246 9% 26%
Animal purchase 562 360 524 757 836 787 1 019 885 776 776 38% 827 912 7% 18%
Other specif ic costs 138 151 145 189 200 201 238 284 239 217 58% 225 230 4% 6%
Specific costs 1 213 1 176 1 338 1 746 1 823 1 749 2 157 2 277 2 189 1 810 49% 2 009 2 324 11% 28%
Machinery and building upkeep 69 90 65 74 81 96 119 110 96 84 20% 94 98 13% 17%
Energy (fuel, electricity) 47 49 35 41 52 66 83 80 93 62 31% 75 92 21% 48%
Contract w ork 94.1 91.3 89.8 122.9 141.0 141.9 150.7 151.3 194.7 162.4 73% 167.0 170.7 3% 5%
Taxes (exc. milk levy) 15 21 15 20 26 26 21 29 25 28 86% 28 29 2% 6%Other direct inputs (incl. w ater, insurance on farm buildings)
42 49 36 44 51 68 69 77 72 6759%
69 703% 5%
Non specific costs 268 300 242 302 350 398 442 447 480 403 50% 434 460 8% 14%
Total operating costs 1 481 1 476 1 580 2 048 2 173 2 147 2 599 2 724 2 669 2 213 49% 2 443 2 784 10% 26%
Gross margin (over operating costs) 556 287 230 659 441 388 611 489 187 459 -17% 188 26 -59% -94%Gross margin (over operating costs) with CP* 862 774 699 1 244 993 667 868 767 448 668 -23% 396 235 -41% -65%
* CP: coupled payments e: estimateDepreciation 189 196 159 201 227 237 263 320 337 316 67%
Wages 20 26 19 22 12 13 8 6 3 11 -45%
Rent 102 121 114 126 118 136 158 161 171 131 28%
Interest 145 130 91 108 88 93 97 121 118 119 -18%
External factors 267 277 223 255 219 242 262 288 291 261 -2%
Net margin (before ow n factors) 99 -187 -152 202 -4 -91 85 -119 -442 -118 -220%
Net margin (before ow n factors) with CP* 405 300 317 788 548 189 343 159 -181 90 -78%
* CP: coupled payments
Family labour costs 462 547 391 465 510 504 549 577 598 507 10%
Ow n capital unpaid cost 45 64 85 83 77 18 31 83 -83 150 236%
Imputed family factors 507 612 476 548 587 522 579 659 514 657 30%
Total economic costs 2 444 2 561 2 438 3 052 3 205 3 148 3 704 3 991 3 812 3 448 41%
Net economic margin (after own factors) -408 -798 -628 -346 -591 -613 -494 -779 -956 -775 90%
Net economic margin (after own factors) with CP* -102 -312 -159 240 -39 -333 -237 -500 -695 -567 457%
ASSETS in €/Male cattle sold (nominal)
Breeders & Fatteners 2000 2001 2002 2003 2004 2005 2006 2007 2008 2009 2009/ 2000
Fixed assets 5 437 5 739 4 623 5 910 6 493 6 799 7 088 8 577 8 132 8 082 49%
Current assets 2 097 2 091 1 911 2 681 2 551 2 630 3 082 3 265 2 888 2 482 18%
Total assets 7 534 7 830 6 535 8 590 9 044 9 429 10 169 11 843 11 021 10 564 40%
INCOME per AWU in €/AWU (nominal)
Breeders & Fatteners 2000 2001 2002 2003 2004 2005 2006 2007 2008 2009 2009/ 2000
Total output 60 533 53 666 72 699 100 377 85 681 83 639 99 976 102 642 91 461 90 617 50%
Intermediate consumptions 35 539 37 777 52 699 59 434 57 883 58 416 66 371 71 487 73 777 61 971 74%
Balance of subsidies and taxes 15 369 23 418 25 843 28 460 24 980 26 801 28 086 26 114 25 939 25 255 64%
of w hich LFA/AWU 212 451 325 312 157 194 167 174 118 290 37%
of w hich environmental/AWU 629 821 729 558 1 712 1 705 1 382 1 941 2 149 2 249 257%
Gross Farm Income (GFI) 40 362 39 308 45 843 69 403 52 777 52 024 61 692 57 269 43 623 53 901 34%
Depreciation 7 623 7 098 8 316 10 025 10 439 10 695 11 785 13 463 14 395 14 597 91%
Farm Net Value Added (FNVA) 32 739 32 210 37 527 59 378 42 339 41 329 49 907 43 806 29 228 39 304 20%
Wages 891 1 012 1 001 1 249 725 744 412 379 120 540 -39%
Rent 4 245 4 660 6 085 6 323 5 651 6 293 7 079 6 911 7 265 6 168 45%
Interest 5 858 4 759 4 695 5 224 3 981 4 133 4 317 5 054 4 871 5 239 -11%
External factors 10 995 10 430 11 781 12 795 10 357 11 171 11 807 12 344 12 256 11 947 9%
Balance of subsidies and taxes on investment -823 -1 295 -565 -1 537 -636 -146 -1 211 -1 038 -575 -49 -94%
Farm net income (FNI) 20 921 20 485 25 181 45 046 31 346 30 012 36 889 30 424 16 396 27 307 31%
Family labour costs 18 770 19 764 20 907 23 041 23 708 23 076 24 153 24 413 24 868 23 336 24%
Ow n capital unpaid cost 1 716 2 254 4 504 4 150 3 598 855 1 356 3 515 -3 458 6 915 303%
Imputed family factors 20 486 22 017 25 412 27 191 27 306 23 931 25 509 27 928 21 410 30 251 48%
Family farms only in EUR/FWU (nominal)
Ow n capital unpaid cost 1 836 2 402 4 825 4 419 3 718 882 1 386 3 584 -3 481 7 109 287%
Remuneration of Family Labour (RFL) 20 551 19 433 22 147 43 553 28 675 30 087 36 333 27 437 19 988 20 963 2%

EU beef farms report 2012
78
Czech RepublicSTRUCTURAL INFORMATION
Breeders & Fatteners 2004 2005 2006 2007 2008 20092009/ 2004
Farms represented 610 240 720 550 610 620 2%
Sample farms 36 19 28 26 35 39 8%
Av. Labour in AWU 2.30 2.17 1.71 1.74 2.07 1.94 -16%
Family labour - % 64% 73% 78% 80% 77% 80% 26%
Beef specialisation - % output 68% 80% 75% 77% 74% 79% 17%
Average UAA - ha 133.8 136.3 95.4 97.4 118.0 103.8 -22%
Forage crops - ha 123.7 126.3 88.4 89.0 111.1 95.0 -23%
of which % permanent grassland 98% 98% 96% 94% 97% 98% 0%
Stocking density - LU/ha 0.5 0.5 0.5 0.6 0.5 0.5 15%
Av. number of suckler cow s - head 37.52 37.34 21.92 30.61 36.83 31.60 -16%
Number of suckler cow s per AWU 16.31 17.21 12.82 17.59 17.79 16.29 0%
Total beef cattle - LU 56 68 41 50 55 50 -11%
Total LU on the farm 57 69 42 50 58 51 -11%
Cattle (male & female) < 1 year sold - head 22 15 13 14 21 20 -12%
Male cattle 1-2 years sold - head 9 19 12 9 8 9 -8%
Male cattle sold (incl. fem. < 1 year) - head 32 35 26 24 29 29 -9%
Selling price male cattle - €/head 429 632 586 589 580 585 36%
Cattle < 1 year + male 1-2 year sold / cow 0.8 0.9 1.2 0.8 0.8 0.9 9%
Total cattle sold - head 43 44 32 29 39 39 -9%
Total cattle sales - € 17 932 27 216 19 067 17 325 23 104 22 911 28%
Selling price cattle - €/head 417 616 595 588 590 586 40%
OUTPUT AND COSTS in €/Male cattle sold
Breeders & Fatteners 2004 2005 2006 2007 2008 2009 2009/ 2004 2010e 2011e 2010 /2009 2011 /2009
TOTAL BEEF OUTPUT 538 990 696 852 790 745 38% 769 846 3% 14%
TOTAL BEEF COUPLED DP 187 126 148 1 149 129 -31% 129 129 0% 0%
of which suckler cow premium 0.0 0.0 0.0 0.0 0.0 0.0 #DIV/0! 0.0 0.0
of which special male premium 0 0 0 0 0 0 #DIV/0! 0 0
of which slaughter premium 0 0 0 0 0 0 #DIV/0! 0 0
of which extensification premium 0 0 0 0 0 0 #DIV/0! 0 0
of which other DP (incl. National DP) 187 126 148 1 149 129 -31% 129 129 0% 0%
Feed 119 197 170 229 320 231 93% 267 368 16% 60%
of which purchased feed 39 106 95 86 200 115 194% 138 192 19% 67%
of which home-grown feed 80 90 76 143 119 115 44% 129 175 12% 52%
Animal purchase 72 249 144 35 49 98 35% 104 115 7% 18%
Other specific costs 45 47 44 72 83 87 91% 85 87 -2% 0%
Specific costs 237 492 359 336 451 415 75% 456 569 10% 37%
Machinery and building upkeep 96 130 172 170 243 173 81% 174 178 0% 3%
Energy (fuel, electricity) 113 170 182 202 218 209 84% 233 256 11% 22%
Contract w ork 73.0 85.4 46.8 90.9 98.7 68.7 -6% 68.1 69.1 -1% 1%
Taxes (exc. milk levy) 11 23 22 32 27 15 37% 15 15 1% 3%Other direct inputs (incl. w ater, insurance on farm buildings)
181 77 114 143 148 141-22%
139 141-1% 1%
Non specific costs 474 485 537 638 734 606 28% 628 659 4% 9%
Total operating costs 711 977 896 974 1 186 1 021 44% 1 084 1 229 6% 20%
Gross margin (over operating costs) -172 13 -200 -122 -395 -276 60% -315 -382 14% 39%
Gross margin (over operating costs) with CP* 15 139 -52 -121 -246 -147 -1094% -186 -253 26% 72%* CP: coupled payments e: estimateDepreciation 83 265 221 348 284 296 258%
Wages 91 101 75 121 144 124 36%
Rent 31 72 35 49 61 111 261%
Interest 9 39 27 42 42 46 438%
External factors 130 213 138 212 246 281 116%
Net margin (before own factors) -385 -464 -558 -682 -925 -853 121%
Net margin (before own factors) w ith CP* -198 -338 -410 -681 -776 -724 265%* CP: coupled payments
Family labour costs 277 332 356 442 513 457 65%
Ow n capital unpaid cost 57 65 59 70 -75 138 142%
Imputed family factors 334 397 415 512 439 595 78%
Total economic costs 1 258 1 851 1 669 2 046 2 154 2 193 74%
Net economic margin (after ow n factors) -719 -861 -973 -1 194 -1 364 -1 448 101%
Net economic margin (after ow n factors) with CP* -532 -735 -825 -1 193 -1 215 -1 319 148%
ASSETS in €/Male cattle sold (nominal)
Breeders & Fatteners 2004 2005 2006 2007 2008 2009 2009/ 2004
Fixed assets 3 642 5 345 5 099 7 233 5 894 5 102 40%
Current assets 1 333 1 825 1 476 2 023 2 203 1 685 26%
Total assets 4 976 7 170 6 575 9 256 8 097 6 787 36%
INCOME per AWU in €/AWU (nominal)
Breeders & Fatteners 2004 2005 2006 2007 2008 2009 2009/ 2004Total output 15 412 21 727 17 337 21 717 21 395 19 091 24%
Intermediate consumptions 18 119 20 745 20 551 22 262 26 646 22 913 26%
Balance of subsidies and taxes 12 124 14 895 19 605 20 632 31 782 27 315 125%
of w hich LFA/AWU 5 345 5 617 5 951 6 129 7 144 6 653 24%
of w hich environmental/AWU 823 2 448 5 936 5 685 9 985 6 599 702%
Gross Farm Income (GFI) 9 417 15 877 16 391 20 088 26 530 23 493 149%
Depreciation 1 556 5 216 4 676 6 083 5 077 5 564 258%
Farm Net Value Added (FNVA) 7 861 10 661 11 715 14 005 21 453 17 929 128%
Wages 2 177 2 189 1 627 1 787 3 402 2 098 -4%
Rent 586 1 560 712 860 1 113 1 919 227%
Interest 195 899 652 706 791 835 327%
External factors 2 959 4 647 2 991 3 353 5 306 4 852 64%
Balance of subsidies and taxes on investment 0 1 040 0 468 0 233 #DIV/0!
Farm net income (FNI) 4 902 7 053 8 724 11 120 16 147 13 310 172%
Family labour costs 4 968 6 428 7 154 8 187 9 052 8 982 81%
Ow n capital unpaid cost 1 014 1 247 1 182 1 302 -1 435 2 646 161%
Imputed family factors 5 982 7 675 8 336 9 488 7 617 11 628 94%
Family farms only in EUR/FWU (nominal)
Ow n capital unpaid cost 1 586 1 718 1 529 1 634 -1 871 3 294 108%
Remuneration of Family Labour (RFL) 6 045 5 169 9 762 13 987 21 285 11 902 97%

EU beef farms report 2012
79
GermanySTRUCTURAL INFORMATION
Breeders & Fatteners 2000 2001 2002 2003 2004 2005 2006 2007 2008 20092009/ 2000
Farms represented 850 930 1 050 1 160 1 400 1 380 1 230 1 350 1 660 1 860 119%
Sample farms 22 22 33 28 41 46 43 48 67 76
Av. Labour in AWU 1.86 1.75 1.75 1.59 1.62 1.69 1.74 1.54 1.56 1.61 -13%
Family labour - % 83% 90% 80% 92% 92% 79% 74% 85% 82% 81% -3%
Beef specialisation - % output 72% 68% 67% 70% 70% 72% 69% 74% 75% 76% 6%
Average UAA - ha 91.1 74.2 66.8 79.6 73.3 90.3 99.2 85.3 83.2 88.7 -3%
Forage crops - ha 78.4 61.0 52.1 66.0 63.2 79.4 84.7 77.3 70.8 77.8 -1%
of which % permanent grassland 86% 86% 85% 85% 86% 85% 88% 91% 86% 89% 3%
Stocking density - LU/ha 1.4 1.7 1.6 1.4 1.3 1.2 1.2 1.2 1.2 1.2 -20%
Av. number of suckler cows - head 59.09 43.70 53.18 43.22 35.18 47.84 46.84 43.99 43.73 43.34 -27%
Number of suckler cow s per AWU 31.77 24.97 30.39 27.18 21.72 28.31 26.92 28.56 28.03 26.92 -15%
Total beef cattle - LU 113 104 102 94 82 97 103 89 88 89 -21%
Total LU on the farm 115 118 106 96 84 100 110 90 89 91 -21%
Cattle (male & female) < 1 year sold - head 22 12 24 15 14 16 20 15 12 10 -55%
Male cattle 1-2 years sold - head 27 38 37 37 41 35 36 27 27 27 1%
Male cattle sold (incl. fem. < 1 year) - head 60 63 64 55 57 54 61 45 42 39 -35%
Selling price male cattle - €/head 745 875 798 813 897 904 964 917 979 983 32%
Cattle < 1 year + male 1-2 year sold / cow 1.0 1.4 1.2 1.3 1.6 1.1 1.3 1.0 1.0 0.9 -12%
Total cattle sold - head 78 80 79 68 69 69 77 59 57 58 -26%
Total cattle sales - € 57 224 65 579 60 290 53 182 58 963 59 632 71 956 52 679 53 531 53 136 -7%
Selling price cattle - €/head 735 824 762 782 861 869 929 889 936 922 25%
OUTPUT AND COSTS in €/Male cattle sold
Breeders & Fatteners 2000 2001 2002 2003 2004 2005 2006 2007 2008 2009 2009/ 2000 2010e 2011e 2010 /2009 2011 /2009
TOTAL BEEF OUTPUT 1 037 1 032 978 964 1 035 1 212 1 292 1 186 1 285 1 439 39% 1 456 1 687 1% 17%
TOTAL BEEF COUPLED DP 274 315 284 376 369 0 0 0 0 0 -100% 0 0
of which suckler cow premium 143.9 108.2 113.4 168.2 130.9 0.0 0.0 0.0 0.0 0.0 -100% 0.0 0.0
of which special male premium 117 134 92 103 138 0 0 0 0 0 -100% 0 0
of which slaughter premium 11 65 64 79 84 0 0 0 0 0 -100% 0 0
of which extensification premium 1 7 15 26 16 0 0 0 0 0 -100% 0 0
of which other DP (incl. National DP) 0 0 0 0 0 0 0 0 0 0 -100% 0 0
Feed 171 220 219 265 199 230 266 274 332 328 92% 363 428 11% 31%
of which purchased feed 60 110 112 152 120 120 141 144 145 170 184% 205 244 21% 44%
of which home-grown feed 111 110 107 113 79 110 125 130 187 158 43% 158 184 0% 16%
Animal purchase 273 326 291 227 336 269 327 214 167 240 -12% 342 383 42% 60%
Other specif ic costs 82 46 47 45 47 62 62 60 72 85 3% 86 86 0% 0%
Specific costs 526 592 556 537 582 561 655 548 571 653 24% 790 897 21% 37%
Machinery and building upkeep 68 93 107 87 96 116 107 138 134 157 132% 161 166 3% 6%
Energy (fuel, electricity) 70 80 88 92 86 109 112 153 178 187 167% 200 225 7% 20%
Contract w ork 30.8 50.7 66.5 77.3 66.7 92.1 90.4 112.1 114.6 145.1 371% 145.2 147.3 0% 2%
Taxes (exc. milk levy) 19 18 12 21 22 23 23 21 24 27 48% 28 28 1% 4%Other direct inputs (incl. w ater, insurance on farm buildings)
104 114 145 120 126 183 169 202 217 224115%
225 2280% 1%
Non specific costs 291 356 420 397 396 522 501 627 667 741 154% 759 795 2% 7%
Total operating costs 817 948 976 934 978 1 083 1 156 1 175 1 238 1 394 71% 1 549 1 692 11% 21%
Gross margin (over operating costs) 220 84 2 29 57 129 137 11 47 44 -80% -93 -5 -310% -111%Gross margin (over operating costs) with CP* 494 400 286 406 426 129 137 11 47 44 -91% -93 -5 -310% -111%
* CP: coupled payments e: estimateDepreciation 212 212 231 223 174 222 231 291 337 393 85%
Wages 67 40 63 40 30 79 105 67 104 118 75%
Rent 114 119 77 125 97 94 94 134 126 142 25%
Interest 46 46 73 34 50 49 66 71 62 66 44%
External factors 227 205 213 200 177 222 265 273 292 325 44%
Net margin (before ow n factors) -219 -333 -442 -393 -295 -315 -360 -553 -583 -674 208%
Net margin (before ow n factors) with CP* 55 -18 -158 -17 74 -315 -360 -553 -583 -674 -1328%
* CP: coupled payments
Family labour costs 310 309 259 334 317 327 268 403 417 454 47%
Ow n capital unpaid cost 133 161 124 131 80 69 57 89 63 204 54%
Imputed family factors 442 471 383 465 397 395 324 492 480 659 49%
Total economic costs 1 698 1 836 1 803 1 822 1 727 1 922 1 977 2 230 2 347 2 772 63%
Net economic margin (after own factors) -661 -804 -825 -859 -692 -711 -685 -1 044 -1 062 -1 333 102%
Net economic margin (after own factors) with CP* -388 -489 -541 -482 -323 -711 -685 -1 044 -1 062 -1 333 244%
ASSETS in €/Male cattle sold (nominal)
Breeders & Fatteners 2000 2001 2002 2003 2004 2005 2006 2007 2008 2009 2009/ 2000
Fixed assets 8 624 9 819 9 096 8 302 9 232 10 436 8 429 10 243 10 892 12 718 47%
Current assets 1 674 1 617 1 477 1 543 1 434 1 609 1 552 1 683 1 853 2 192 31%
Total assets 10 298 11 436 10 573 9 844 10 667 12 045 9 981 11 926 12 745 14 910 45%
INCOME per AWU in €/AWU (nominal)
Breeders & Fatteners 2000 2001 2002 2003 2004 2005 2006 2007 2008 2009 2009/ 2000
Total output 35 389 38 681 37 499 36 593 34 005 41 217 50 302 38 845 42 776 38 532 9%
Intermediate consumptions 23 004 32 440 34 343 31 652 29 068 33 511 41 526 36 030 39 570 35 760 55%
Balance of subsidies and taxes 16 093 19 267 21 268 26 416 26 185 26 316 29 083 26 997 24 221 25 866 61%
of w hich LFA/AWU 1 444 1 757 1 966 2 626 2 454 2 282 2 479 2 707 2 593 3 149 118%
of w hich environmental/AWU 2 954 2 430 2 943 5 515 4 521 5 217 6 738 6 141 5 010 5 571 89%
Gross Farm Income (GFI) 28 478 25 507 24 424 31 357 31 122 34 023 37 859 29 812 27 427 28 637 1%
Depreciation 9 752 10 770 12 301 10 761 8 473 9 696 11 172 11 013 11 784 12 458 28%
Farm Net Value Added (FNVA) 18 726 14 738 12 122 20 596 22 649 24 327 26 687 18 800 15 643 16 179 -14%
Wages 2 696 2 121 2 924 1 817 1 550 3 602 5 126 2 634 3 761 3 561 32%
Rent 5 033 6 326 4 467 6 211 4 695 4 143 4 720 5 009 4 376 4 471 -11%
Interest 2 110 2 293 3 813 1 593 2 625 1 985 3 430 2 537 2 162 1 987 -6%
External factors 9 839 10 740 11 204 9 622 8 870 9 730 13 276 10 180 10 298 10 019 2%
Balance of subsidies and taxes on investment -1 934 -814 -372 -736 -743 -529 -634 -497 -676 -1 561 -19%
Farm net income (FNI) 6 953 3 184 546 10 239 13 036 14 068 12 777 8 122 4 669 4 599 -34%
Family labour costs 14 197 15 566 14 339 16 278 15 464 13 750 13 067 15 228 14 970 14 665 3%
Ow n capital unpaid cost 5 585 7 979 6 734 6 331 3 640 3 028 2 589 3 546 2 263 6 570 18%
Imputed family factors 19 782 23 545 21 073 22 608 19 104 16 778 15 656 18 774 17 233 21 235 7%
Family farms only in EUR/FWU (nominal)
Ow n capital unpaid cost 6 712 8 883 8 421 6 819 3 969 3 825 3 497 4 171 2 756 8 170 22%
Remuneration of Family Labour (RFL) 1 644 -5 276 -7 709 4 279 10 201 12 141 13 987 5 241 3 214 -3 240 -297%

EU beef farms report 2012
80
DenmarkSTRUCTURAL INFORMATION
Breeders & Fatteners 2002 2008 2009
Farms represented 660 600 650
Sample farms 16 15 19
Av. Labour in AWU 0.76 0.74 0.92Family labour - % 92% 85% 74%
Beef specialisation - % output 73% 74% 72%
Average UAA - ha 48.9 42.2 57.0
Forage crops - ha 29.1 29.4 33.6
of which % permanent grassland 77% 17% 24%
Stocking density - LU/ha 2.1 1.9 2.1
Av. number of suckler cows - head 25.04 17.48 19.92
Number of suckler cow s per AWU 32.95 23.62 21.65
Total beef cattle - LU 62 55 71
Total LU on the farm 64 56 74
Cattle (male & female) < 1 year sold - head 1 10 69
Male cattle 1-2 years sold - head 88 69 13
Male cattle sold (incl. fem. < 1 year) - head 88 86 86
Selling price male cattle - €/head 518 688 755
Cattle < 1 year + male 1-2 year sold / cow 3.5 4.9 4.3
Total cattle sold - head 102 96 97
Total cattle sales - € 52 171 67 648 75 906
Selling price cattle - €/head 513 707 780
OUTPUT AND COSTS in €/Male cattle sold (nominal)
Breeders & Fatteners 2002 2008 2009 2010e 2011e 2010 /2009 2011 /2009
TOTAL BEEF OUTPUT 729 809 872 921 1 040 6% 19%
TOTAL BEEF COUPLED DP 420 104 120 120 120 0% 0%
of which suckler cow premium 71.0 0.0 0.0 0.0 0.0
of which special male premium 163 104 120 120 120 0% 0%
of which slaughter premium 75 0 0 0 0
of which extensification premium 79 0 0 0 0
of which other DP (incl. National DP) 32 0 0 0 0
Feed 319 416 410 449 523 9% 28%
of which purchased feed 277 347 320 362 421 13% 32%
of which home-grown feed 42 69 90 87 102 -4% 13%
Animal purchase 442 180 226 240 265 7% 18%
Other specif ic costs 41 85 64 65 65 1% 3%
Specific costs 801 680 699 753 854 8% 22%
Machinery and building upkeep 72 54 105 107 110 2% 5%
Energy (fuel, electricity) 17 27 39 43 51 12% 33%
Contract w ork 37.6 73.3 90.5 93.9 99.0 4% 9%
Taxes (exc. milk levy) 10 14 22 22 23 2% 5%
Other direct inputs (incl. w ater, insurance on farm buildings)
49 57 86 89 944% 9%
Non specific costs 186 225 341 356 377 4% 10%
Total operating costs 987 905 1 041 1 109 1 231 7% 18%
Gross margin (over operating costs) -258 -95 -169 -188 -191 11% 13%
Gross margin (over operating costs) w ith CP* 161 8 -50 -69 -71 39% 44%* CP: coupled payments e: estimateDepreciation 96 88 174
Wages 11 40 84
Rent 21 43 38
Interest 132 220 240
External factors 164 304 362
Net margin (before own factors) -518 -487 -706Net margin (before own factors) w ith CP* -99 -383 -586
* CP: coupled payments
Family labour costs 192 199 214
Ow n capital unpaid cost 30 -79 18
Imputed family factors 222 120 231
Total economic costs 1 469 1 416 1 809
Net economic margin (after own factors) -740 -607 -937
Net economic margin (after own factors) w ith CP* -320 -503 -817
ASSETS in €/Male cattle sold (nominal)
Breeders & Fatteners 2002 2008 2009
Fixed assets 3 839 10 232 13 539
Current assets 978 1 046 1 461
Total assets 4 817 11 278 15 000
INCOME per AWU in €/AWU (nominal)
Breeders & Fatteners 2002 2008 2009Total output 55 145 125 661 110 821
Intermediate consumptions 76 131 121 746 121 233
Balance of subsidies and taxes 56 958 38 327 40 808
of w hich LFA/AWU 0 0 0
of w hich environmental/AWU 1 380 2 822 5 328
Gross Farm Income (GFI) 35 973 42 242 30 397
Depreciation 15 867 14 227 22 181
Farm Net Value Added (FNVA) 20 105 28 015 8 216
Wages 1 780 6 455 10 815
Rent 3 382 6 963 5 151
Interest 20 068 35 772 30 878
External factors 25 230 49 190 46 844
Balance of subsidies and taxes on investment 57 39 22
Farm net income (FNI) -5 068 -21 136 -38 605
Family labour costs 31 409 32 138 28 067
Ow n capital unpaid cost 6 417 -12 995 2 802
Imputed family factors 37 826 19 143 30 869
Family farms only
Ow n capital unpaid cost 6 993 -15 354 3 784
Remuneration of Family Labour (RFL) -12 516 -9 620 -55 914

EU beef farms report 2012
81
SpainSTRUCTURAL INFORMATION
Breeders & Fatteners 2000 2001 2002 2003 2004 2005 2006 2007 2008 20092009/ 2000
Farms represented 10 930 10 260 18 540 11 730 12 670 12 770 15 340 16 300 8 400 12 080 11%
Sample farms 132 154 148 156 170 153 102 128 172 207
Av. Labour in AWU 1.22 1.20 1.15 1.30 1.23 1.12 1.16 1.07 1.23 1.21 -1%
Family labour - % 96% 97% 97% 97% 99% 96% 92% 97% 97% 93% -3%
Beef specialisation - % output 85% 86% 82% 87% 87% 85% 84% 79% 82% 83% -2%
Average UAA - ha 67.3 52.8 26.6 59.6 60.6 40.6 27.6 31.5 92.4 83.2 24%
Forage crops - ha 62.8 42.8 23.6 53.0 53.5 37.7 24.4 30.6 78.9 71.8 14%
of which % permanent grassland 93% 93% 86% 96% 92% 94% 91% 94% 98% 94% 1%
Stocking density - LU/ha 0.5 0.6 0.9 0.6 0.6 0.6 1.2 0.7 0.7 0.7 23%
Av. number of suckler cows - head 32.36 29.51 20.80 35.52 36.06 23.88 27.96 20.08 54.88 44.56 38%
Number of suckler cow s per AWU 26.52 24.59 18.09 27.32 29.32 21.32 24.10 18.77 44.62 36.83 39%
Total beef cattle - LU 39 34 25 41 41 28 31 24 60 53 38%
Total LU on the farm 39 34 25 42 42 30 32 25 61 55 41%
Cattle (male & female) < 1 year sold - head 30 28 18 34 29 22 23 23 53 32 8%
Male cattle 1-2 years sold - head 1 1 1 1 1 0 1 0 5 10 1617%
Male cattle sold (incl. fem. < 1 year) - head 36 32 25 39 36 26 29 25 59 48 35%
Selling price male cattle - €/head 577 563 718 756 764 770 793 802 872 752 30%
Cattle < 1 year + male 1-2 year sold / cow 1.1 1.1 1.2 1.1 1.0 1.1 1.0 1.2 1.1 1.1 -2%
Total cattle sold - head 39 34 28 42 38 29 43 28 64 58 52%
Total cattle sales - € 22 266 19 436 19 256 31 061 29 106 22 520 34 327 21 988 54 859 45 307 103%
Selling price cattle - €/head 578 566 694 739 758 772 795 783 864 775 34%
OUTPUT AND COSTS in €/Male cattle sold (nominal)
Breeders & Fatteners 2000 2001 2002 2003 2004 2005 2006 2007 2008 2009 2009/ 2000 2010e 2011e 2010 /2009 2011 /2009
TOTAL BEEF OUTPUT 638 607 704 743 774 886 1 190 855 898 860 35% 926 1 018 8% 18%
TOTAL BEEF COUPLED DP 207 274 247 327 334 320 124 153 166 167 -19% 167 167 0% 0%
of which suckler cow premium 138.6 160.1 124.5 181.9 184.2 151.3 98.2 131.0 152.8 151.9 10% 151.9 151.9 0% 0%
of which special male premium 7 18 17 17 10 15 0 0 0 0 -100% 0 0
of which slaughter premium 25 23 47 66 66 63 20 20 13 10 -59% 10 10 0% 0%
of which extensification premium 33 49 42 41 33 21 2 1 0 0 -100% 0 0
of which other DP (incl. National DP) 3 23 16 22 41 69 4 0 1 4 79% 4 4 0% 0%
Feed 256 237 221 260 335 288 349 277 521 376 47% 427 515 14% 37%
of which purchased feed 224 211 190 245 305 259 332 241 510 360 61% 412 497 14% 38%
of which home-grown feed 31 26 31 15 30 29 18 35 11 16 -49% 15 18 -6% 10%
Animal purchase 88 57 78 50 44 138 357 108 94 133 52% 125 123 -6% -8%
Other specif ic costs 23 34 33 40 42 34 36 39 33 34 44% 34 34 0% 0%
Specific costs 367 329 331 350 421 459 743 424 648 543 48% 586 672 8% 24%
Machinery and building upkeep 15 18 17 16 14 35 29 27 23 18 20% 18 18 1% 1%
Energy (fuel, electricity) 15 21 25 23 21 40 38 31 31 24 54% 28 34 20% 42%
Contract w ork 11.5 8.4 6.9 8.5 10.2 10.0 7.5 14.2 12.2 28.3 145% 30.2 33.0 7% 17%
Taxes (exc. milk levy) 3 7 9 4 5 4 6 4 4 5 65% 6 6 2% 5%Other direct inputs (incl. w ater, insurance on farm buildings)
14 14 20 21 21 23 28 22 20 33134%
35 387% 17%
Non specific costs 59 69 78 73 71 113 108 99 91 108 83% 117 128 8% 19%
Total operating costs 426 398 409 423 492 571 851 523 738 651 53% 703 800 8% 23%
Gross margin (over operating costs) 212 209 295 319 282 315 339 332 160 209 -2% 224 217 7% 4%Gross margin (over operating costs) with CP* 419 483 542 646 616 635 463 485 326 375 -10% 391 384 4% 2%
* CP: coupled payments e: estimateDepreciation 61 54 53 45 35 60 61 47 34 40 -34%
Wages 17 14 10 11 3 22 56 13 14 24 45%
Rent 21 21 15 21 16 55 26 22 28 31 48%
Interest 5 7 5 4 2 4 5 6 3 2 -56%
External factors 43 43 31 36 22 81 87 40 46 57 33%
Net margin (before ow n factors) 109 113 211 238 225 173 191 245 80 111 2%
Net margin (before ow n factors) with CP* 315 387 459 565 559 493 315 398 246 278 -12%
* CP: coupled payments
Family labour costs 294 362 418 323 371 437 383 557 274 354 20%
Ow n capital unpaid cost 89 88 69 81 68 99 53 70 42 119 34%
Imputed family factors 383 450 487 405 439 536 436 627 315 473 23%
Total economic costs 913 945 980 909 988 1 250 1 434 1 237 1 133 1 222 34%
Net economic margin (after own factors) -275 -338 -276 -166 -214 -364 -244 -382 -235 -362 32%
Net economic margin (after own factors) with CP* -68 -64 -29 161 120 -44 -120 -229 -69 -195 186%
ASSETS in €/Male cattle sold (nominal)
Breeders & Fatteners 2000 2001 2002 2003 2004 2005 2006 2007 2008 2009 2009/ 2000
Fixed assets 3 331 3 617 5 025 4 699 4 889 4 930 4 583 4 581 3 410 3 668 10%
Current assets 1 403 1 777 1 673 1 746 2 014 1 842 2 381 3 742 2 850 2 269 62%
Total assets 4 734 5 393 6 698 6 445 6 903 6 771 6 964 8 323 6 260 5 937 25%
INCOME per AWU in €/AWU (nominal)
Breeders & Fatteners 2000 2001 2002 2003 2004 2005 2006 2007 2008 2009 2009/ 2000
Total output 21 661 19 639 19 150 26 296 27 946 23 368 27 310 25 491 51 646 39 181 81%
Intermediate consumptions 12 972 11 836 10 030 14 130 16 819 13 944 15 778 13 861 36 583 26 079 101%
Balance of subsidies and taxes 6 742 8 230 5 863 10 619 11 155 9 271 5 392 7 842 14 781 16 201 140%
of w hich LFA/AWU 98 436 250 453 419 582 344 608 650 1 129 1048%
of w hich environmental/AWU 79 12 88 42 25 110 214 41 95 538 581%
Gross Farm Income (GFI) 15 430 16 032 14 984 22 785 22 282 18 695 16 924 19 473 29 844 29 302 90%
Depreciation 2 153 1 653 1 352 1 600 1 159 1 718 1 700 1 319 1 835 1 866 -13%
Farm Net Value Added (FNVA) 13 277 14 379 13 632 21 185 21 123 16 977 15 224 18 153 28 009 27 437 107%
Wages 620 496 299 355 113 576 1 422 353 727 1 136 83%
Rent 685 640 415 724 547 1 486 907 650 1 628 1 506 120%
Interest 180 228 130 142 75 118 140 145 174 114 -36%
External factors 1 485 1 365 843 1 221 736 2 179 2 470 1 148 2 529 2 756 86%
Balance of subsidies and taxes on investment 387 7 -51 39 -35 -18 33 -60 48 -88 -123%
Farm net income (FNI) 12 179 13 022 12 738 20 003 20 352 14 780 12 786 16 945 25 528 24 593 102%
Family labour costs 10 128 10 744 10 602 11 118 12 377 12 009 11 978 15 632 15 689 16 621 64%
Ow n capital unpaid cost 3 138 2 743 1 844 2 701 2 258 2 491 1 585 2 075 2 374 5 601 78%
Imputed family factors 13 266 13 487 12 447 13 819 14 635 14 500 13 562 17 707 18 062 22 221 68%
Family farms only in EUR/FWU (nominal)
Ow n capital unpaid cost 3 277 2 830 1 878 2 789 2 287 2 584 1 721 2 127 2 457 5 957 82%
Remuneration of Family Labour (RFL) 9 441 10 606 11 090 17 862 18 328 12 751 10 556 15 245 23 918 20 138 113%
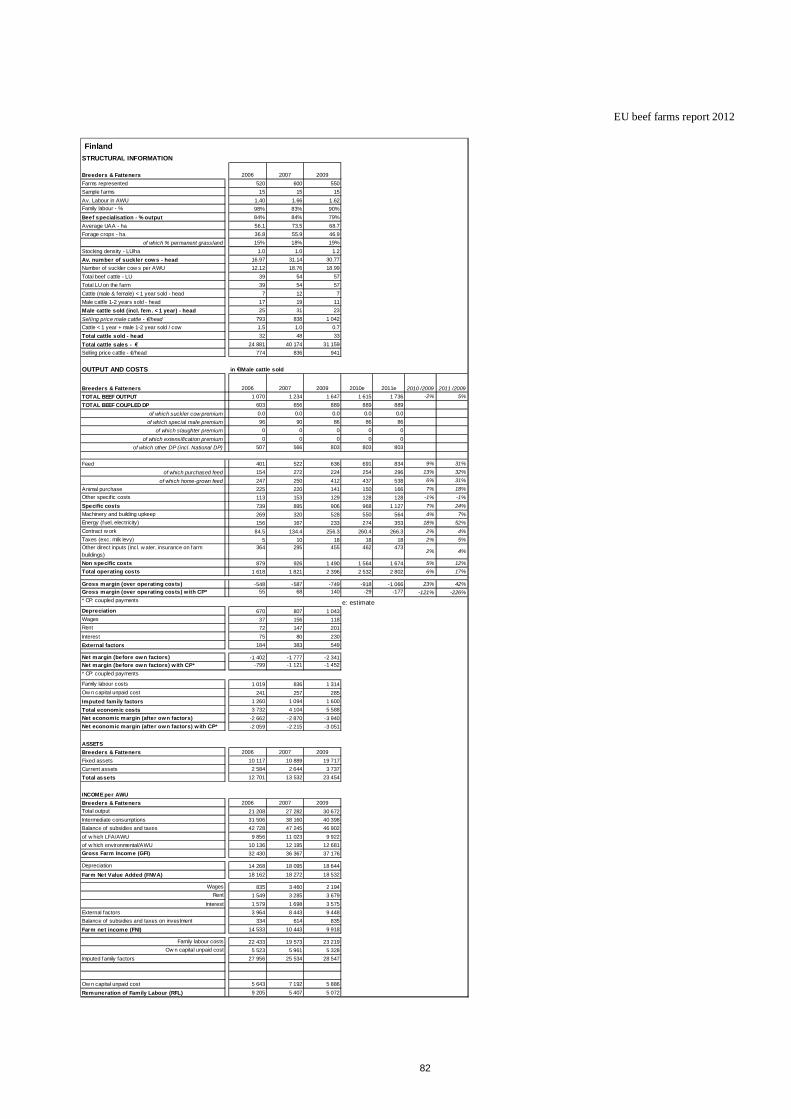
EU beef farms report 2012
82
FinlandSTRUCTURAL INFORMATION
Breeders & Fatteners 2006 2007 2009
Farms represented 520 600 550
Sample farms 15 15 15
Av. Labour in AWU 1.40 1.66 1.62Family labour - % 98% 83% 90%
Beef specialisation - % output 84% 84% 79%
Average UAA - ha 56.1 73.5 68.7
Forage crops - ha 36.8 55.9 46.9
of which % permanent grassland 15% 18% 19%
Stocking density - LU/ha 1.0 1.0 1.2
Av. number of suckler cow s - head 16.97 31.14 30.77
Number of suckler cow s per AWU 12.12 18.76 18.99
Total beef cattle - LU 39 54 57
Total LU on the farm 39 54 57
Cattle (male & female) < 1 year sold - head 7 12 7
Male cattle 1-2 years sold - head 17 19 11
Male cattle sold (incl. fem. < 1 year) - head 25 31 23
Selling price male cattle - €/head 793 838 1 042
Cattle < 1 year + male 1-2 year sold / cow 1.5 1.0 0.7
Total cattle sold - head 32 48 33
Total cattle sales - € 24 881 40 174 31 159
Selling price cattle - €/head 774 836 941
OUTPUT AND COSTS in €/Male cattle sold
Breeders & Fatteners 2006 2007 2009 2010e 2011e 2010 /2009 2011 /2009
TOTAL BEEF OUTPUT 1 070 1 234 1 647 1 615 1 736 -2% 5%
TOTAL BEEF COUPLED DP 603 656 889 889 889 0% 0%
of which suckler cow premium 0.0 0.0 0.0 0.0 0.0
of which special male premium 96 90 86 86 86 0% 0%
of which slaughter premium 0 0 0 0 0
of which extensification premium 0 0 0 0 0
of which other DP (incl. National DP) 507 566 803 803 803 0% 0%
Feed 401 522 636 691 834 9% 31%
of which purchased feed 154 272 224 254 296 13% 32%
of which home-grown feed 247 250 412 437 538 6% 31%
Animal purchase 225 220 141 150 166 7% 18%
Other specific costs 113 153 129 128 128 -1% -1%
Specific costs 739 895 906 968 1 127 7% 24%
Machinery and building upkeep 269 320 528 550 564 4% 7%
Energy (fuel, electricity) 156 167 233 274 353 18% 52%
Contract w ork 84.5 134.4 256.3 260.4 266.3 2% 4%
Taxes (exc. milk levy) 5 10 18 18 18 2% 5%Other direct inputs (incl. w ater, insurance on farm buildings)
364 295 455 462 4732% 4%
Non specific costs 879 926 1 490 1 564 1 674 5% 12%
Total operating costs 1 618 1 821 2 396 2 532 2 802 6% 17%
Gross margin (over operating costs) -548 -587 -749 -918 -1 066 23% 42%Gross margin (over operating costs) w ith CP* 55 68 140 -29 -177 -121% -226%* CP: coupled payments e: estimateDepreciation 670 807 1 043Wages 37 156 118Rent 72 147 201
Interest 75 80 230
External factors 184 383 549
Net margin (before ow n factors) -1 402 -1 777 -2 341Net margin (before ow n factors) w ith CP* -799 -1 121 -1 452
* CP: coupled payments
Family labour costs 1 019 836 1 314
Ow n capital unpaid cost 241 257 285
Imputed family factors 1 260 1 094 1 600
Total economic costs 3 732 4 104 5 588
Net economic margin (after ow n factors) -2 662 -2 870 -3 940
Net economic margin (after ow n factors) w ith CP* -2 059 -2 215 -3 051
ASSETS
Breeders & Fatteners 2006 2007 2009
Fixed assets 10 117 10 889 19 717
Current assets 2 584 2 644 3 737
Total assets 12 701 13 532 23 454
INCOME per AWU
Breeders & Fatteners 2006 2007 2009
Total output 21 208 27 282 30 672
Intermediate consumptions 31 506 38 160 40 398
Balance of subsidies and taxes 42 728 47 245 46 902
of w hich LFA/AWU 9 856 11 023 9 922
of w hich environmental/AWU 10 136 12 195 12 681
Gross Farm Income (GFI) 32 430 36 367 37 176
Depreciation 14 268 18 095 18 644
Farm Net Value Added (FNVA) 18 162 18 272 18 532
Wages 835 3 460 2 194Rent 1 549 3 285 3 679
Interest 1 579 1 698 3 575
External factors 3 964 8 443 9 448
Balance of subsidies and taxes on investment 334 614 835
Farm net income (FNI) 14 533 10 443 9 918
Family labour costs 22 433 19 573 23 219Ow n capital unpaid cost 5 523 5 961 5 328
Imputed family factors 27 956 25 534 28 547
Ow n capital unpaid cost 5 643 7 192 5 886
Remuneration of Family Labour (RFL) 9 205 5 407 5 072

EU beef farms report 2012
83
FranceSTRUCTURAL INFORMATION
Breeders & Fatteners 2000 2001 2002 2003 2004 2005 2006 2007 2008 20092009/ 2000
Farms represented 16 280 17 100 15 360 13 260 13 080 12 060 14 110 11 470 10 940 10 290 -37%
Sample farms 250 270 232 209 211 229 223 195 188 182
Av. Labour in AWU 1.35 1.35 1.38 1.41 1.37 1.45 1.41 1.44 1.48 1.45 7%
Family labour - % 96% 96% 94% 94% 94% 93% 94% 94% 93% 92% -3%
Beef specialisation - % output 79% 77% 78% 79% 80% 81% 83% 81% 82% 80% 1%
Average UAA - ha 76.4 81.9 80.5 82.6 86.7 92.2 89.2 99.7 92.9 95.0 24%
Forage crops - ha 64.0 69.2 68.0 68.7 73.9 76.6 74.7 85.2 79.6 79.5 24%
of which % permanent grassland 59% 60% 61% 63% 65% 65% 60% 63% 62% 64% 8%
Stocking density - LU/ha 1.4 1.4 1.4 1.4 1.3 1.3 1.3 1.2 1.3 1.3 -7%
Av. number of suckler cows - head 48.63 53.93 49.74 52.05 51.18 54.80 53.11 57.02 55.91 54.91 13%
Number of suckler cow s per AWU 36.02 39.95 36.04 36.91 37.36 37.79 37.67 39.60 37.78 37.87 5%
Total beef cattle - LU 90 98 93 97 95 101 97 106 103 105 16%
Total LU on the farm 93 101 96 99 97 102 98 108 104 107 14%
Cattle (male & female) < 1 year sold - head 16 18 20 23 20 23 24 24 22 20 28%
Male cattle 1-2 years sold - head 18 18 16 17 16 19 15 16 17 18 2%
Male cattle sold (incl. fem. < 1 year) - head 37 40 41 45 44 48 48 50 50 47 27%
Selling price male cattle - €/head 953 821 897 967 951 1 039 1 084 1 049 1 042 1 087 14%
Cattle < 1 year + male 1-2 year sold / cow 0.8 0.7 0.8 0.9 0.9 0.9 0.9 0.9 0.9 0.9 13%
Total cattle sold - head 53 57 61 64 64 68 66 71 67 68 28%
Total cattle sales - € 53 018 51 241 56 701 63 699 64 711 73 858 76 279 81 139 73 731 77 313 46%
Selling price cattle - €/head 1 001 901 931 999 1 011 1 094 1 148 1 138 1 107 1 137 14%
OUTPUT AND COSTS in €/Male cattle sold (nominal)
Breeders & Fatteners 2000 2001 2002 2003 2004 2005 2006 2007 2008 2009 2009/ 2000 2010e 2011e 2010 /2009 2011 /2009
TOTAL BEEF OUTPUT 1 437 1 275 1 317 1 360 1 468 1 537 1 612 1 644 1 508 1 576 10% 1 587 1 716 1% 9%
TOTAL BEEF COUPLED DP 426 491 534 515 536 522 275 286 279 276 -35% 276 276 0% 0%
of which suckler cow premium 245.0 278.8 287.3 272.2 287.8 266.4 255.5 263.7 255.3 253.7 4% 253.7 253.7 0% 0%
of which special male premium 105 106 116 117 117 121 0 0 0 0 -100% 0 0
of which slaughter premium 16 35 54 52 55 49 20 23 24 22 36% 22 22 0% 0%
of which extensification premium 57 64 58 56 60 70 0 0 0 0 -100% 0 0
of which other DP (incl. National DP) 3 7 18 18 16 16 0 0 0 0 -100% 0 0 0% 0%
Feed 377 368 360 400 437 412 442 490 526 518 38% 558 619 8% 19%
of which purchased feed 184 188 190 224 250 230 260 297 341 306 66% 357 390 17% 27%
of which home-grown feed 193 180 169 177 187 182 181 193 185 213 10% 201 230 -5% 8%
Animal purchase 173 118 176 206 276 288 314 327 239 256 48% 242 240 -5% -6%
Other specif ic costs 99 94 77 81 78 85 80 86 92 92 -7% 94 96 2% 5%
Specific costs 648 580 613 687 791 784 836 904 857 866 34% 893 956 3% 10%
Machinery and building upkeep 106 101 105 115 127 130 136 129 126 147 39% 151 155 2% 5%
Energy (fuel, electricity) 65 64 48 51 62 70 76 74 93 80 22% 95 108 19% 35%
Contract w ork 86.8 79.2 88.2 92.5 99.0 97.7 105.5 116.2 121.3 133.5 54% 132.5 136.7 -1% 2%
Taxes (exc. milk levy) 20 19 19 21 23 22 20 22 21 26 26% 26 27 2% 4%Other direct inputs (incl. w ater, insurance on farm buildings)
140 144 190 193 192 183 194 191 187 21755%
215 222-1% 2%
Non specific costs 418 407 450 474 502 502 532 533 549 603 44% 619 648 3% 7%
Total operating costs 1 067 987 1 063 1 161 1 294 1 286 1 368 1 436 1 406 1 469 38% 1 512 1 603 3% 9%
Gross margin (over operating costs) 370 288 254 200 174 251 244 208 102 107 -71% 75 113 -30% 6%Gross margin (over operating costs) with CP* 796 779 789 715 711 772 519 495 382 382 -52% 350 388 -8% 2%
* CP: coupled payments e: estimateDepreciation 256 278 268 289 317 317 342 358 338 387 51%
Wages 15 15 21 22 21 24 23 24 25 34 119%
Rent 125 118 123 118 122 128 126 120 120 137 10%
Interest 55 58 56 53 48 51 54 62 56 64 18%
External factors 195 191 200 194 192 204 203 207 200 235 21%
Net margin (before ow n factors) -81 -181 -214 -283 -335 -270 -301 -356 -436 -516 535%
Net margin (before ow n factors) with CP* 345 310 321 232 201 251 -25 -70 -157 -240 -170%
* CP: coupled payments
Family labour costs 535 466 380 384 405 389 404 391 414 435 -19%
Ow n capital unpaid cost 135 115 100 65 65 50 72 97 38 154 14%
Imputed family factors 670 581 479 449 470 439 476 488 453 589 -12%
Total economic costs 2 188 2 037 2 010 2 092 2 273 2 246 2 388 2 489 2 396 2 680 22%
Net economic margin (after own factors) -751 -761 -693 -732 -805 -709 -776 -844 -888 -1 105 47%
Net economic margin (after own factors) with CP* -326 -270 -159 -217 -269 -188 -501 -558 -609 -829 155%
ASSETS in €/Male cattle sold (nominal)
Breeders & Fatteners 2000 2001 2002 2003 2004 2005 2006 2007 2008 2009 2009/ 2000
Fixed assets 4 665 4 731 4 558 4 588 4 649 4 658 4 703 4 883 4 829 5 212 12%
Current assets 2 621 2 607 2 604 2 475 2 615 2 649 2 582 2 740 2 535 2 697 3%
Total assets 7 286 7 338 7 161 7 064 7 264 7 307 7 285 7 623 7 365 7 909 9%
INCOME per AWU in €/AWU (nominal)
Breeders & Fatteners 2000 2001 2002 2003 2004 2005 2006 2007 2008 2009 2009/ 2000
Total output 43 094 42 956 43 323 45 906 47 217 50 732 53 870 58 272 53 191 54 539 27%
Intermediate consumptions 30 004 32 102 32 554 36 525 38 369 39 396 41 612 45 209 45 858 47 066 57%
Balance of subsidies and taxes 17 579 23 903 23 974 26 128 26 271 27 088 26 595 27 216 24 757 25 085 43%
of w hich LFA/AWU 1 360 1 728 1 596 1 769 2 181 2 182 2 393 2 322 2 067 2 178 60%
of w hich environmental/AWU 1 025 1 120 1 557 1 992 2 248 2 342 1 998 2 199 2 016 1 975 93%
Gross Farm Income (GFI) 30 669 34 757 34 743 35 510 35 119 38 424 38 854 40 280 32 090 32 557 6%
Depreciation 8 851 10 770 10 274 11 476 12 577 13 118 14 113 15 501 13 816 15 791 78%
Farm Net Value Added (FNVA) 21 818 23 987 24 469 24 035 22 541 25 306 24 741 24 779 18 274 16 766 -23%
Wages 596 683 884 909 874 1 101 991 1 103 1 072 1 387 133%
Rent 4 369 4 639 4 713 4 745 4 859 5 279 5 242 5 189 5 004 5 591 28%
Interest 1 917 2 249 2 174 2 203 1 950 2 148 2 246 2 651 2 283 2 633 37%
External factors 6 882 7 571 7 771 7 857 7 683 8 529 8 480 8 943 8 360 9 610 40%
Balance of subsidies and taxes on investment 514 468 928 1 108 568 1 013 1 274 1 309 951 225 -56%
Farm net income (FNI) 15 450 16 884 17 626 17 286 15 426 17 790 17 534 17 144 10 865 7 381 -52%
Family labour costs 18 035 17 724 14 088 15 029 15 844 15 807 16 338 16 822 16 988 17 454 -3%
Ow n capital unpaid cost 4 556 4 319 3 611 2 401 2 444 1 962 2 838 4 132 1 456 6 063 33%
Imputed family factors 22 591 22 043 17 699 17 430 18 288 17 769 19 176 20 954 18 444 23 517 4%
Family farms only in EUR/FWU (nominal)
Ow n capital unpaid cost 4 759 4 505 3 844 2 567 2 598 2 109 3 028 4 401 1 560 6 553 38%
Remuneration of Family Labour (RFL) 11 382 13 106 14 918 15 917 13 795 17 020 15 681 13 862 10 081 1 425 -87%

EU beef farms report 2012
84
IrelandSTRUCTURAL INFORMATION
Breeders & Fatteners 2000 2001 2002 2003 2004 2005 2006 2007 2008 20092009/ 2000
Farms represented 17 910 21 060 17 540 21 370 19 660 19 060 17 740 19 820 18 190 15 720 -12%
Sample farms 133 149 149 178 172 170 170 196 184 152
Av. Labour in AWU 1.11 1.08 1.11 1.10 1.11 1.11 1.11 1.10 1.11 1.17 5%
Family labour - % 96% 96% 96% 97% 98% 98% 97% 97% 96% 96% -1%
Beef specialisation - % output 87% 84% 85% 86% 85% 84% 84% 84% 84% 85% -3%
Average UAA - ha 34.7 33.5 40.1 38.9 38.1 41.8 45.4 45.1 46.5 50.2 45%
Forage crops - ha 33.8 32.6 38.8 37.8 37.0 40.7 44.3 44.2 45.0 47.8 41%
of which % permanent grassland 97% 96% 96% 96% 96% 96% 95% 97% 97% 95% -1%
Stocking density - LU/ha 1.3 1.2 1.2 1.2 1.3 1.3 1.2 1.2 1.2 1.3 -5%
Av. number of suckler cows - head 17.33 16.97 19.75 19.77 20.32 21.15 22.26 22.69 22.83 27.18 57%
Number of suckler cow s per AWU 15.61 15.71 17.79 17.97 18.31 19.05 20.05 20.63 20.57 23.23 49%
Total beef cattle - LU 43 38 43 44 44 48 50 49 51 57 34%
Total LU on the farm 46 41 47 47 48 52 53 52 55 62 35%
Cattle (male & female) < 1 year sold - head 0 3 5 4 5 5 6 5 5 7 #DIV/0!
Male cattle 1-2 years sold - head 0 5 5 6 6 6 6 6 5 6 #DIV/0!
Male cattle sold (incl. fem. < 1 year) - head 18 19 21 20 21 23 22 21 21 23 23%
Selling price male cattle - €/head 0 705 689 669 744 739 780 792 920 793 #DIV/0!
Cattle < 1 year + male 1-2 year sold / cow 1.1 1.1 1.1 1.0 1.0 1.1 1.0 0.9 0.9 0.8 -22%
Total cattle sold - head 18 27 30 30 32 34 35 33 34 36 95%
Total cattle sales - € 0 17 938 19 779 18 975 22 356 24 337 26 742 25 688 30 826 27 973 #DIV/0!
Selling price cattle - €/head 0 670 656 635 708 716 763 771 906 781 #DIV/0!
OUTPUT AND COSTS in €/Male cattle sold (nominal)
Breeders & Fatteners 2000 2001 2002 2003 2004 2005 2006 2007 2008 2009 2009/ 2000 2010e 2011e 2010 /2009 2011 /2009
TOTAL BEEF OUTPUT 1 158 882 953 920 1 049 1 090 1 232 1 202 1 494 1 203 4% 1 211 1 440 1% 20%
TOTAL BEEF COUPLED DP 500 441 540 572 560 0 0 0 36 31 -94% 31 31 0% 0%
of which suckler cow premium 156.2 175.4 212.9 215.6 210.2 0.0 0.0 0.0 0.0 0.0 -100% 0.0 0.0
of which special male premium 169 131 158 163 159 0 0 0 0 0 -100% 0 0
of which slaughter premium 19 22 42 57 57 0 0 0 0 0 -100% 0 0
of which extensification premium 77 113 120 122 119 0 0 0 0 0 -100% 0 0
of which other DP (incl. National DP) 79 0 6 14 15 0 0 0 36 31 -61% 31 31 0% 0%
Feed 264 244 260 274 276 281 341 341 432 451 71% 459 506 2% 12%
of which purchased feed 153 138 155 156 166 165 207 206 263 269 76% 295 310 10% 15%
of which home-grown feed 111 106 105 118 110 116 134 135 169 182 65% 164 196 -10% 8%
Animal purchase 399 276 289 301 326 350 347 296 413 242 -39% 256 397 6% 64%
Other specif ic costs 86 84 90 84 81 80 87 94 108 110 28% 110 110 0% 0%
Specific costs 749 604 640 658 684 711 775 731 953 804 7% 825 1 013 3% 26%
Machinery and building upkeep 130 119 113 115 105 123 133 133 152 128 -2% 126 125 -1% -2%
Energy (fuel, electricity) 35 39 37 35 39 46 56 60 74 85 144% 98 113 16% 33%
Contract w ork 111.5 100.4 94.8 92.4 95.4 88.6 96.3 114.3 122.0 116.2 4% 117.1 117.8 1% 1%
Taxes (exc. milk levy) 3 4 3 4 5 5 4 5 5 6 96% 6 6 -2% -1%Other direct inputs (incl. w ater, insurance on farm buildings)
42 43 42 42 43 40 48 62 65 101142%
102 1021% 1%
Non specific costs 321 305 291 288 287 302 338 374 418 435 36% 449 464 3% 6%
Total operating costs 1 070 908 931 947 971 1 013 1 113 1 105 1 371 1 239 16% 1 274 1 477 3% 19%
Gross margin (over operating costs) 88 -26 22 -27 78 77 120 96 123 -37 -142% -63 -36 73% -1%Gross margin (over operating costs) with CP* 588 415 562 545 637 77 120 96 158 -6 -101% -33 -5 460% -6%
* CP: coupled payments e: estimateDepreciation 129 128 133 120 201 177 257 277 324 205 59%
Wages 16 16 20 14 13 12 22 21 28 31 93%
Rent 50 51 61 60 57 47 47 53 57 82 64%
Interest 28 25 24 23 26 29 37 34 55 42 48%
External factors 95 92 104 97 96 87 106 108 140 156 64%
Net margin (before ow n factors) -136 -247 -215 -243 -219 -187 -243 -289 -341 -397 191%
Net margin (before ow n factors) with CP* 364 194 325 328 340 -187 -243 -289 -305 -366 -201%
* CP: coupled payments
Family labour costs 645 663 654 741 766 764 859 866 964 876 36%
Ow n capital unpaid cost 307 305 273 272 324 252 267 322 328 659 115%
Imputed family factors 952 968 927 1 012 1 090 1 016 1 127 1 188 1 292 1 535 61%
Total economic costs 2 246 2 096 2 095 2 176 2 358 2 293 2 602 2 679 3 127 3 135 40%
Net economic margin (after own factors) -1 088 -1 215 -1 142 -1 256 -1 309 -1 203 -1 369 -1 477 -1 633 -1 932 78%
Net economic margin (after own factors) with CP* -588 -773 -602 -684 -750 -1 203 -1 369 -1 477 -1 597 -1 901 223%
ASSETS in €/Male cattle sold (nominal)
Breeders & Fatteners 2000 2001 2002 2003 2004 2005 2006 2007 2008 2009 2009/ 2000
Fixed assets 17 226 17 157 18 658 20 679 21 812 27 479 38 786 44 354 44 024 39 704 130%
Current assets 1 689 1 446 1 475 1 572 1 577 1 579 1 796 1 841 2 213 2 247 33%
Total assets 18 914 18 603 20 134 22 251 23 389 29 058 40 581 46 195 46 236 41 951 122%
INCOME per AWU in €/AWU (nominal)
Breeders & Fatteners 2000 2001 2002 2003 2004 2005 2006 2007 2008 2009 2009/ 2000
Total output 15 223 13 941 15 918 14 413 17 227 18 303 20 869 20 539 27 942 26 175 72%
Intermediate consumptions 12 749 12 916 14 064 13 729 14 075 15 870 17 326 17 444 24 491 26 479 108%
Balance of subsidies and taxes 10 085 11 090 14 282 14 831 16 105 17 424 18 525 17 885 18 760 18 540 84%
of w hich LFA/AWU 0 1 773 2 204 2 086 2 077 2 007 2 468 2 212 2 259 1 882 #DIV/0!
of w hich environmental/AWU 1 275 1 214 1 248 1 526 2 090 2 879 3 622 3 351 3 397 2 655 108%
Gross Farm Income (GFI) 12 559 12 115 16 136 15 515 19 257 19 857 22 069 20 980 22 210 18 236 45%
Depreciation 2 503 2 678 2 932 2 570 4 491 4 336 5 937 6 181 7 174 4 698 88%
Farm Net Value Added (FNVA) 10 056 9 436 13 204 12 945 14 766 15 520 16 132 14 799 15 037 13 538 35%
Wages 317 354 434 334 327 302 557 500 669 771 144%
Rent 985 1 097 1 347 1 272 1 291 1 154 1 092 1 174 1 251 1 848 88%
Interest 570 556 530 495 588 707 892 747 1 206 994 74%
External factors 1 872 2 007 2 311 2 101 2 206 2 164 2 541 2 421 3 126 3 614 93%
Balance of subsidies and taxes on investment 264 104 269 -278 -557 -374 -549 -333 1 048 3 802 1341%
Farm net income (FNI) 8 448 7 533 11 162 10 566 12 003 12 982 13 042 12 044 12 958 13 726 62%
Family labour costs 12 160 13 503 14 217 15 588 16 740 18 483 19 916 19 144 21 108 19 568 61%
Ow n capital unpaid cost 5 890 6 363 5 974 5 792 7 246 6 187 6 257 7 227 7 346 14 919 153%
Imputed family factors 18 050 19 866 20 191 21 379 23 986 24 670 26 173 26 372 28 454 34 487 91%
Family farms only in EUR/FWU (nominal)
Ow n capital unpaid cost 6 103 6 584 6 206 5 927 7 408 6 272 6 443 7 438 7 580 15 618 156%
Remuneration of Family Labour (RFL) 2 651 1 212 5 389 4 886 4 863 6 889 6 987 4 957 5 791 -1 248 -147%

EU beef farms report 2012
85
ItalySTRUCTURAL INFORMATION
Breeders & Fatteners 2000 2001 2002 2003 2004 2005 2006 2007 2008 20092009/ 2000
Farms represented 5 050 6 850 6 190 5 910 7 970 6 840 6 540 5 390 5 380 7 230 43%
Sample farms 149 262 259 175 200 203 181 165 104 117
Av. Labour in AWU 1.57 1.47 1.51 1.47 1.43 1.50 1.33 1.49 1.49 1.40 -11%
Family labour - % 98% 97% 95% 93% 93% 96% 97% 93% 91% 93% -5%
Beef specialisation - % output 71% 74% 70% 73% 73% 73% 73% 68% 70% 71% 0%
Average UAA - ha 25.4 28.3 30.9 35.2 36.6 31.0 26.9 29.4 30.6 34.4 35%
Forage crops - ha 19.4 22.5 23.8 27.7 29.7 22.6 20.4 22.9 23.5 27.6 42%
of which % permanent grassland 55% 69% 68% 22% 12% 12% 9% 11% 40% 41% -25%
Stocking density - LU/ha 1.5 1.3 1.3 1.2 1.1 1.3 1.4 1.3 1.3 1.0 -34%
Av. number of suckler cows - head 17.99 21.01 20.59 21.61 22.29 20.55 17.23 20.00 19.45 16.77 -7%
Number of suckler cow s per AWU 11.46 14.29 13.64 14.70 15.59 13.70 12.95 13.42 13.05 11.98 5%
Total beef cattle - LU 31 32 32 35 33 30 29 31 32 29 -8%
Total LU on the farm 31 33 33 36 34 31 31 32 33 29 -8%
Cattle (male & female) < 1 year sold - head 0 0 0 0 0 0 5 7 9 10 #DIV/0!
Male cattle 1-2 years sold - head 0 0 0 0 0 0 13 11 7 8 #DIV/0!
Male cattle sold (incl. fem. < 1 year) - head 17 21 22 25 25 24 21 22 22 21 26%
Selling price male cattle - €/head 0 0 0 0 0 0 1 458 1 291 1 158 1 205 #DIV/0!
Cattle < 1 year + male 1-2 year sold / cow 0.9 1.0 1.1 1.2 1.1 1.1 1.2 1.1 1.1 1.3 36%
Total cattle sold - head 17 21 22 25 25 24 25 27 29 25 48%
Total cattle sales - € 0 0 0 0 0 0 35 667 34 853 32 848 30 701 #DIV/0!
Selling price cattle - €/head 0 0 0 0 0 0 1 444 1 287 1 140 1 223 #DIV/0!
OUTPUT AND COSTS in €/Male cattle sold (nominal)
Breeders & Fatteners 2000 2001 2002 2003 2004 2005 2006 2007 2008 2009 2009/ 2000 2010e 2011e 2010 /2009 2011 /2009
TOTAL BEEF OUTPUT 1 591 1 373 1 275 1 524 1 251 1 493 1 698 1 480 1 359 1 403 -12% 1 372 1 458 -2% 4%
TOTAL BEEF COUPLED DP 278 297 274 277 247 21 18 22 21 11 -96% 11 11 0% 0%
of which suckler cow premium 184.1 187.3 174.0 157.0 162.9 0.0 0.0 0.0 0.0 0.0 -100% 0.0 0.0
of which special male premium 77 67 69 60 44 0 0 0 0 0 -100% 0 0
of which slaughter premium 9 20 22 44 28 0 0 0 0 0 -100% 0 0
of which extensification premium 1 3 7 11 9 0 0 0 0 0 -100% 0 0
of which other DP (incl. National DP) 7 20 1 5 4 21 18 22 21 11 50% 11 11 0% 0%
Feed 529 418 411 510 426 447 455 395 360 307 -42% 330 351 8% 14%
of which purchased feed 324 290 253 365 291 305 301 240 165 138 -57% 154 162 12% 17%
of which home-grown feed 205 127 158 145 135 142 154 155 196 168 -18% 176 188 5% 12%
Animal purchase 269 234 152 411 234 247 448 220 149 153 -43% 151 142 -2% -8%
Other specif ic costs 42 37 29 34 32 38 53 30 52 84 101% 86 87 2% 4%
Specific costs 839 688 592 955 693 732 956 645 561 544 -35% 567 580 4% 7%
Machinery and building upkeep 52 33 36 33 28 28 40 33 23 13 -75% 13 14 3% 6%
Energy (fuel, electricity) 65 54 57 54 60 74 89 85 97 86 33% 92 104 6% 20%
Contract w ork 21.3 15.2 21.8 17.1 19.4 23.8 19.2 18.2 17.4 23.6 11% 24.2 25.1 3% 6%
Taxes (exc. milk levy) 17 10 11 13 13 14 13 12 25 20 17% 20 21 2% 5%Other direct inputs (incl. w ater, insurance on farm buildings)
34 28 29 33 27 37 50 46 34 4224%
43 453% 6%
Non specific costs 189 140 155 150 147 178 212 195 197 185 -2% 193 208 4% 12%
Total operating costs 1 029 828 747 1 104 840 910 1 167 839 758 729 -29% 760 788 4% 8%
Gross margin (over operating costs) 562 545 528 420 411 583 530 641 601 674 20% 613 671 -9% -1%Gross margin (over operating costs) with CP* 840 841 802 697 659 604 549 663 622 686 -18% 624 682 -9% -1%
* CP: coupled payments e: estimateDepreciation 222 197 190 221 207 196 258 249 220 305 37%
Wages 20 31 39 42 41 24 20 45 53 42 114%
Rent 43 46 36 48 44 41 52 44 46 45 6%
Interest 8 5 2 5 2 3 2 3 4 0 -94%
External factors 70 82 78 95 87 68 75 92 103 88 26%
Net margin (before ow n factors) 270 266 260 103 117 319 198 300 278 282 4%
Net margin (before ow n factors) with CP* 548 562 534 381 365 341 216 321 299 293 -47%
* CP: coupled payments
Family labour costs 1 009 764 784 676 727 865 875 816 909 909 -10%
Ow n capital unpaid cost 179 151 138 123 144 112 146 171 93 238 33%
Imputed family factors 1 188 914 922 799 871 977 1 021 987 1 003 1 147 -3%
Total economic costs 2 509 2 022 1 936 2 220 2 005 2 150 2 521 2 167 2 083 2 269 -10%
Net economic margin (after own factors) -918 -649 -662 -696 -754 -657 -823 -687 -724 -866 -6%
Net economic margin (after own factors) with CP* -640 -352 -388 -419 -506 -636 -805 -665 -703 -855 33%
ASSETS in €/Male cattle sold (nominal)
Breeders & Fatteners 2000 2001 2002 2003 2004 2005 2006 2007 2008 2009 2009/ 2000
Fixed assets 13 439 12 081 12 005 11 965 11 360 14 525 15 163 15 954 11 578 15 048 12%
Current assets 2 244 1 739 1 582 1 250 1 070 2 429 2 990 2 672 2 045 2 136 -5%
Total assets 15 683 13 820 13 586 13 214 12 430 16 954 18 153 18 626 13 623 17 184 10%
INCOME per AWU in €/AWU (nominal)
Breeders & Fatteners 2000 2001 2002 2003 2004 2005 2006 2007 2008 2009 2009/ 2000
Total output 25 318 29 024 30 036 32 337 30 218 32 111 32 406 33 343 29 830 31 857 26%
Intermediate consumptions 14 689 16 363 16 575 19 524 18 459 17 466 18 755 16 773 14 831 15 255 4%
Balance of subsidies and taxes 4 495 6 801 6 189 7 678 6 883 6 101 6 736 7 023 5 831 5 725 27%
of w hich LFA/AWU 0 140 202 302 280 240 233 265 254 391 #DIV/0!
of w hich environmental/AWU 543 593 483 448 427 505 492 558 260 641 18%
Gross Farm Income (GFI) 15 124 19 462 19 650 20 492 18 642 20 747 20 387 23 592 20 830 22 327 48%
Depreciation 3 554 4 151 4 170 5 489 5 056 4 395 5 794 5 445 4 636 6 812 92%
Farm Net Value Added (FNVA) 11 570 15 311 15 480 15 004 13 586 16 352 14 593 18 148 16 194 15 515 34%
Wages 274 562 817 1 031 924 534 488 947 1 196 967 253%
Rent 687 917 767 1 160 1 041 894 1 155 963 991 961 40%
Interest 116 112 51 109 33 58 42 64 79 9 -92%
External factors 1 077 1 591 1 635 2 301 1 998 1 486 1 685 1 974 2 265 1 938 80%
Balance of subsidies and taxes on investment 0 116 31 20 0 63 234 13 -16 87 #DIV/0!
Farm net income (FNI) 10 493 13 836 13 876 12 723 11 588 14 929 13 142 16 187 13 913 13 665 30%
Family labour costs 15 893 16 286 17 150 16 897 17 561 19 154 19 566 17 487 19 018 19 926 25%
Ow n capital unpaid cost 2 775 3 109 2 970 3 134 3 524 2 535 3 295 3 708 1 994 5 332 92%
Imputed family factors 18 667 19 395 20 121 20 032 21 085 21 689 22 861 21 195 21 012 25 258 35%
Family farms only in EUR/FWU (nominal)
Ow n capital unpaid cost 2 816 3 206 3 152 3 401 3 763 2 640 3 384 3 984 2 178 5 744 104%
Remuneration of Family Labour (RFL) 7 834 11 060 11 758 10 403 8 611 12 906 10 112 13 405 13 017 8 977 15%

EU beef farms report 2012
86
LuxembourgSTRUCTURAL INFORMATION
Breeders & Fatteners 2001 2002 2003 2004 2005 2006 2007 2008 2009
Farms represented 80 100 110 80 120 80 80 90 100
Sample farms 16 24 25 21 20 18 19 19 22
Av. Labour in AWU 1.38 1.26 1.34 1.20 0.82 1.22 0.98 1.03 1.17
Family labour - % 86% 94% 89% 87% 99% 96% 100% 100% 92%
Beef specialisation - % output 74% 74% 72% 73% 73% 75% 73% 68% 73%
Average UAA - ha 78.9 68.8 71.6 81.0 64.6 87.0 74.8 66.3 71.5
Forage crops - ha 61.9 52.8 58.6 63.8 50.6 67.6 58.3 51.7 55.4
of which % permanent grassland 69% 78% 77% 76% 81% 80% 77% 83% 77%
Stocking density - LU/ha 1.9 1.8 1.5 1.5 1.5 1.7 1.8 1.7 1.7
Av. number of suckler cow s - head 48.34 43.65 41.62 44.52 38.74 56.32 48.23 44.07 45.62
Number of suckler cow s per AWU 35.03 34.64 31.06 37.10 47.24 46.16 49.21 42.79 38.99
Total beef cattle - LU 114 94 91 98 78 116 102 86 92
Total LU on the farm 115 97 95 99 79 117 103 87 93
Cattle (male & female) < 1 year sold - head 2 7 5 11 8 10 5 12 8
Male cattle 1-2 years sold - head 51 28 28 30 26 40 34 23 24
Male cattle sold (incl. fem. < 1 year) - head 59 38 37 46 36 52 42 36 35
Selling price male cattle - €/head 1 125 1 040 1 144 1 079 1 158 1 271 1 283 1 136 1 183
Cattle < 1 year + male 1-2 year sold / cow 1.2 0.9 0.9 1.0 0.9 0.9 0.9 0.8 0.8
Total cattle sold - head 76 62 57 66 55 71 60 53 56
Total cattle sales - € 80 761 58 256 59 706 66 134 59 471 84 580 72 832 56 894 59 800
Selling price cattle - €/head 1 064 936 1 048 998 1 079 1 199 1 204 1 073 1 075
OUTPUT AND COSTS in €/Male cattle sold (nominal)
Breeders & Fatteners 2001 2002 2003 2004 2005 2006 2007 2008 2009 2010e 2011e 2010 /2009 2011 /2009
TOTAL BEEF OUTPUT 1 433 1 520 1 579 1 448 1 640 1 741 1 787 1 520 1 628 1 634 1 730 0% 6%
TOTAL BEEF COUPLED DP 408 612 627 615 5 0 0 0 0 0 0
of which suckler cow premium 192.6 293.9 261.0 291.2 0.0 0.0 0.0 0.0 0.0 0.0 0.0
of which special male premium 118 169 173 155 0 0 0 0 0 0 0
of which slaughter premium 85 122 161 138 5 0 0 0 0 0 0
of which extensification premium 13 27 32 31 0 0 0 0 0 0 0
of which other DP (incl. National DP) 0 0 0 0 0 0 0 0 0 0 0
Feed 364 449 436 397 365 413 445 418 510 568 706 11% 39%
of which purchased feed 195 236 218 185 176 212 232 202 179 215 270 20% 50%
of which home-grown feed 170 212 218 213 189 201 213 216 330 353 436 7% 32%
Animal purchase 528 441 427 392 500 483 495 259 274 292 322 7% 18%
Other specific costs 84 112 122 92 98 122 127 167 138 138 137 0% -1%
Specific costs 975 1 002 985 881 964 1 018 1 066 844 921 997 1 165 8% 26%
Machinery and building upkeep 108 129 147 140 123 127 129 191 154 158 168 3% 10%
Energy (fuel, electricity) 64 61 71 75 84 94 87 122 125 150 168 19% 34%
Contract w ork 107.8 122.0 102.9 106.0 113.6 102.3 107.2 96.3 120.5 124.2 131.4 3% 9%
Taxes (exc. milk levy) 8 13 14 16 14 12 16 17 21 21 22 3% 7%
Other direct inputs (incl. w ater, insurance on farm buildings)
99 142 171 163 127 134 126 153 228 235 2493% 9%
Non specific costs 387 466 506 499 462 470 465 578 648 688 738 6% 14%
Total operating costs 1 362 1 468 1 492 1 381 1 426 1 488 1 531 1 422 1 570 1 685 1 903 7% 21%
Gross margin (over operating costs) 70 53 87 68 214 253 256 98 59 -51 -173 -187% -395%
Gross margin (over operating costs) w ith CP* 479 664 714 683 219 253 256 98 59 -51 -173 -187% -395%
* CP: coupled payments e: estimateDepreciation 315 418 490 518 488 466 550 631 653
Wages 29 25 37 34 5 16 0 0 42
Rent 73 97 117 102 88 108 103 92 114
Interest 59 63 53 74 60 56 100 116 79
External factors 161 186 207 210 154 180 203 209 234
Net margin (before ow n factors) -406 -551 -610 -660 -428 -392 -497 -741 -828Net margin (before ow n factors) w ith CP* 3 61 18 -45 -422 -392 -497 -741 -828
* CP: coupled payments
Family labour costs 249 406 401 310 311 327 343 403 546
Ow n capital unpaid cost 151 260 134 46 -7 126 219 104 512
Imputed fam ily factors 401 666 534 356 303 454 563 507 1 058
Total economic costs 2 239 2 738 2 723 2 464 2 371 2 587 2 846 2 769 3 514
Net economic margin (after own factors) -806 -1 217 -1 144 -1 016 -731 -846 -1 059 -1 248 -1 886
Net economic margin (after own factors) with CP* -398 -606 -517 -401 -726 -846 -1 059 -1 248 -1 886
ASSETS in €/Male cattle sold (nominal)
Breeders & Fatteners 2001 2002 2003 2004 2005 2006 2007 2008 2009
Fixed assets 10 258 15 577 15 355 16 436 17 518 17 388 19 422 21 033 21 436
Current assets 2 990 3 821 4 177 3 434 3 632 3 342 3 448 4 285 4 731
Total assets 13 249 19 398 19 532 19 870 21 150 20 730 22 870 25 318 26 168
INCOME per AWU in €/AWU (nom inal)
Breeders & Fatteners 2001 2002 2003 2004 2005 2006 2007 2008 2009
Total output 54 017 45 898 47 514 59 060 68 313 97 180 78 390 66 436 55 831
Intermediate consumptions 45 934 40 715 39 095 48 909 53 835 80 699 59 690 58 085 51 630
Balance of subsidies and taxes 41 005 36 974 38 704 46 866 43 052 42 593 42 175 36 461 36 069
of w hich LFA/AWU 6 864 6 242 5 883 8 567 8 076 8 386 8 480 7 974 6 851
of w hich environmental/AWU 5 602 5 793 7 024 7 573 7 376 7 053 5 758 5 988 6 500
Gross Farm Income (GFI) 49 088 42 157 47 123 57 017 57 530 59 075 60 876 44 812 40 270
Depreciation 18 528 17 297 19 252 27 375 29 569 26 555 33 607 34 717 26 386
Farm Net Value Added (FNVA) 30 560 24 860 27 871 29 642 27 961 32 520 27 269 10 095 13 884
Wages 2 096 1 132 1 773 2 151 361 1 144 0 0 1 940
Rent 4 248 4 013 4 660 5 313 5 238 6 220 6 113 4 776 4 739
Interest 3 737 2 461 2 074 4 138 3 743 3 102 6 054 6 304 3 206
External factors 10 081 7 606 8 507 11 603 9 343 10 466 12 167 11 079 9 884
Balance of subsidies and taxes on investment -1 265 -1 039 1 216 2 577 2 372 250 2 488 9 556 1 537
Farm net income (FNI) 19 214 16 216 20 580 20 616 20 990 22 303 17 590 8 573 5 536
Family labour costs 14 126 16 834 15 588 15 742 18 259 18 627 20 483 21 927 21 860
Ow n capital unpaid cost 8 429 10 396 4 883 2 086 -298 7 154 12 994 5 343 19 993
Imputed family factors 22 556 27 230 20 471 17 828 17 960 25 781 33 477 27 271 41 852
Family farms only in EUR/FWU (nominal)
Ow n capital unpaid cost 9 850 11 095 5 503 2 392 -302 7 486 12 967 5 358 21 587
Remuneration of Family Labour (RFL) 12 603 6 211 17 692 21 253 21 540 15 852 4 587 3 238 -15 609

EU beef farms report 2012
87
PolandSTRUCTURAL INFORMATION
Breeders & Fatteners 2009
Farms represented 2 280
Sample farms 32
Av. Labour in AWU 1.69Family labour - % 98%
Beef specialisation - % output 65%
Average UAA - ha 26.1
Forage crops - ha 17.0
of which % permanent grassland 70%
Stocking density - LU/ha 1.1
Av. number of suckler cows - head 9.01
Number of suckler cow s per AWU 5.33
Total beef cattle - LU 19
Total LU on the farm 21
Cattle (male & female) < 1 year sold - head 2
Male cattle 1-2 years sold - head 9
Male cattle sold (incl. fem. < 1 year) - head 12
Selling price male cattle - €/head 603
Cattle < 1 year + male 1-2 year sold / cow 1.3
Total cattle sold - head 16
Total cattle sales - € 8 860
Selling price cattle - €/head 559
OUTPUT AND COSTS in €/Male cattle sold
Breeders & Fatteners 2009 2010e 2011e 2010 /2009 2011 /2009
TOTAL BEEF OUTPUT 758 788 955 4% 26%
TOTAL BEEF COUPLED DP 0 0 0
of which suckler cow premium 0.0 0.0 0.0
of which special male premium 0 0 0
of which slaughter premium 0 0 0
of which extensification premium 0 0 0
of which other DP (incl. National DP) 0 0 0
Feed 262 316 386 20% 47%
of which purchased feed 45 57 71 27% 57%
of which home-grown feed 217 258 315 19% 45%
Animal purchase 117 125 138 7% 18%
Other specif ic costs 14 14 15 2% 4%
Specific costs 393 455 538 16% 37%
Machinery and building upkeep 68 69 74 2% 9%
Energy (fuel, electricity) 81 87 96 7% 18%
Contract w ork 37.9 38.6 43.8 2% 16%
Taxes (exc. milk levy) 13 13 13 3% 7%
Other direct inputs (incl. w ater, insurance on farm buildings)
27 27 312% 16%
Non specific costs 227 235 258 4% 14%
Total operating costs 620 689 796 11% 28%
Gross margin (over operating costs) 138 99 159 -29% 15%
Gross margin (over operating costs) w ith CP* 138 99 159 -29% 15%* CP: coupled payments e: estimateDepreciation 217
Wages 9
Rent 9
Interest 13
External factors 31
Net margin (before own factors) -110Net margin (before own factors) w ith CP* -110
* CP: coupled payments
Family labour costs 481
Ow n capital unpaid cost 109
Imputed family factors 589
Total economic costs 1 457
Net economic margin (after own factors) -700
Net economic margin (after own factors) w ith CP* -700
ASSETS in €/Male cattle sold (nominal)
Breeders & Fatteners 2009
Fixed assets 14 423
Current assets 1 569
Total assets 15 992
INCOME per AWU in €/AWU (nominal)
Breeders & Fatteners 2009Total output 7 449
Intermediate consumptions 5 765
Balance of subsidies and taxes 4 350
of w hich LFA/AWU 793
of w hich environmental/AWU 797
Gross Farm Income (GFI) 6 035
Depreciation 2 328
Farm Net Value Added (FNVA) 3 707
Wages 75
Rent 74
Interest 126
External factors 275
Balance of subsidies and taxes on investment 14
Farm net income (FNI) 3 446
Family labour costs 5 056
Ow n capital unpaid cost 1 200
Imputed family factors 6 256
Family farms in EUR/FWU (nominal)
Ow n capital unpaid cost 1 222
Remuneration of Family Labour (RFL) 2 359

EU beef farms report 2012
88
PortugalSTRUCTURAL INFORMATION
Breeders & Fatteners 2000 2001 2002 2003 2004 2005 2006 2007 2008 20092009/ 2000
Farms represented 3 260 2 810 3 120 3 790 2 270 2 910 2 150 1 320 2 010 3 060 -6%
Sample farms 41 58 61 74 58 85 74 61 90 105
Av. Labour in AWU 1.82 1.47 1.43 1.51 1.28 1.43 1.50 1.63 1.31 1.61 -12%
Family labour - % 97% 97% 92% 97% 91% 92% 89% 85% 97% 86% -11%
Beef specialisation - % output 70% 82% 81% 84% 82% 84% 78% 88% 82% 84% 21%
Average UAA - ha 33.0 35.9 38.5 59.5 59.7 68.3 72.1 79.3 48.2 96.1 191%
Forage crops - ha 17.9 22.9 17.1 34.6 35.0 32.7 44.0 50.9 32.9 73.9 314%
of which % permanent grassland 72% 78% 54% 75% 74% 44% 48% 31% 58% 70% -3%
Stocking density - LU/ha 0.5 0.6 0.7 0.4 0.5 0.5 0.6 0.4 0.6 0.6 22%
Av. number of suckler cows - head 9.63 12.97 14.30 16.06 21.77 21.72 28.35 25.63 17.46 37.08 285%
Number of suckler cow s per AWU 5.29 8.82 10.00 10.64 17.01 15.19 18.90 15.72 13.33 23.03 335%
Total beef cattle - LU 13 19 23 23 29 30 38 33 25 50 277%
Total LU on the farm 14 19 23 23 30 31 39 35 25 51 275%
Cattle (male & female) < 1 year sold - head 8 11 10 12 24 20 26 22 14 31 307%
Male cattle 1-2 years sold - head 2 4 5 3 3 3 2 2 2 4 143%
Male cattle sold (incl. fem. < 1 year) - head 12 18 21 21 28 26 33 30 20 44 277%
Selling price male cattle - €/head 575 585 710 596 582 435 513 505 522 497 -14%
Cattle < 1 year + male 1-2 year sold / cow 1.2 1.4 1.5 1.3 1.3 1.2 1.2 1.2 1.2 1.2 -2%
Total cattle sold - head 13 22 24 25 30 30 36 33 24 50 274%
Total cattle sales - € 8 314 13 854 16 286 14 555 17 330 13 859 19 246 17 059 12 798 24 447 194%
Selling price cattle - €/head 624 633 675 589 581 455 532 519 529 490 -21%
OUTPUT AND COSTS in €/Male cattle sold (nominal)
Breeders & Fatteners 2000 2001 2002 2003 2004 2005 2006 2007 2008 2009 2009/ 2000 2010e 2011e 2010 /2009 2011 /2009
TOTAL BEEF OUTPUT 814 697 773 601 571 433 536 549 568 445 -45% 438 453 -1% 2%
TOTAL BEEF COUPLED DP 235 272 291 283 321 191 219 195 232 225 -4% 225 225 0% 0%
of which suckler cow premium 115.8 140.9 127.2 123.1 159.4 165.2 183.9 150.8 169.9 186.7 61% 186.7 186.7 0% 0%
of which special male premium 45 32 52 55 42 10 9 18 26 10 -77% 10 10 0% 0%
of which slaughter premium 4 15 38 27 21 8 9 9 13 12 205% 12 12 0% 0%
of which extensification premium 69 73 65 71 84 7 5 15 22 8 -89% 8 8 0% 0%
of which other DP (incl. National DP) 1 12 10 7 14 0 12 2 0 8 445% 8 8 0% 0%
Feed 189 182 257 232 228 235 233 161 207 237 25% 243 289 3% 22%
of which purchased feed 83 106 192 152 126 173 110 80 115 112 35% 129 156 15% 39%
of which home-grown feed 106 77 65 80 103 61 123 82 93 124 18% 114 133 -8% 7%
Animal purchase 254 235 222 147 88 46 77 70 90 81 -68% 86 95 7% 18%
Other specif ic costs 25 26 33 33 31 39 38 27 29 35 40% 35 35 0% -1%
Specific costs 468 444 513 413 347 320 348 258 326 353 -25% 365 420 3% 19%
Machinery and building upkeep 30 33 34 33 52 46 32 42 32 46 54% 46 46 0% 0%
Energy (fuel, electricity) 26 36 35 47 46 46 51 49 56 50 90% 57 66 15% 32%
Contract w ork 33.0 13.1 25.7 28.3 22.1 27.3 16.3 7.3 17.4 19.2 -42% 19.1 18.9 -1% -2%
Taxes (exc. milk levy) 1 0 1 1 0 2 3 1 9 1 1% 1 1 1% 5%Other direct inputs (incl. w ater, insurance on farm buildings)
21 24 27 28 18 25 18 18 19 2413%
23 23-1% -2%
Non specific costs 110 107 122 137 138 146 121 116 133 139 26% 146 155 5% 11%
Total operating costs 578 551 634 550 485 466 469 375 460 492 -15% 511 574 4% 17%
Gross margin (over operating costs) 235 146 138 51 87 -33 66 175 108 -48 -120% -73 -121 53% 155%Gross margin (over operating costs) with CP* 470 419 430 335 408 158 285 370 340 177 -62% 152 103 -14% -42%
* CP: coupled payments e: estimateDepreciation 142 122 118 105 112 129 119 105 115 87 -39%
Wages 23 13 34 15 21 23 25 44 12 33 42%
Rent 24 15 26 19 22 20 15 16 21 13 -48%
Interest 2 10 16 10 3 5 21 8 1 58 2506%
External factors 50 38 76 44 47 48 61 68 35 103 107%
Net margin (before ow n factors) 44 -14 -55 -98 -72 -211 -114 2 -41 -237 -644%
Net margin (before ow n factors) with CP* 278 259 236 185 249 -20 105 197 190 -13 -105%
* CP: coupled payments
Family labour costs 571 371 325 375 232 243 196 255 366 203 -64%
Ow n capital unpaid cost 113 35 30 83 34 49 19 54 65 54 -52%
Imputed family factors 684 406 355 458 265 292 216 309 430 257 -62%
Total economic costs 1 454 1 116 1 183 1 158 909 936 865 857 1 039 939 -35%
Net economic margin (after own factors) -640 -419 -410 -557 -338 -503 -329 -307 -472 -494 -23%
Net economic margin (after own factors) with CP* -406 -147 -119 -274 -16 -312 -111 -112 -240 -270 -33%
ASSETS in €/Male cattle sold (nominal)
Breeders & Fatteners 2000 2001 2002 2003 2004 2005 2006 2007 2008 2009 2009/ 2000
Fixed assets 5 214 2 866 2 725 3 276 2 294 2 987 4 334 8 900 3 933 3 979 -24%
Current assets 639 413 595 651 644 456 882 593 712 747 17%
Total assets 5 853 3 280 3 320 3 927 2 938 3 443 5 216 9 493 4 645 4 727 -19%
INCOME per AWU in €/AWU (nominal)
Breeders & Fatteners 2000 2001 2002 2003 2004 2005 2006 2007 2008 2009 2009/ 2000
Total output 6 155 8 118 11 400 8 929 15 477 10 313 16 169 11 651 10 920 14 588 137%
Intermediate consumptions 3 460 5 412 7 939 7 524 11 986 9 972 11 554 7 503 7 820 14 058 306%
Balance of subsidies and taxes 2 743 4 802 6 768 6 131 10 100 8 062 10 953 9 781 7 886 12 779 366%
of w hich LFA/AWU 422 790 913 882 1 005 1 108 1 013 968 1 181 1 112 164%
of w hich environmental/AWU 444 323 985 1 009 1 056 1 242 871 956 1 073 753 70%
Gross Farm Income (GFI) 5 437 7 508 10 229 7 535 13 591 8 403 15 568 13 929 10 986 13 309 145%
Depreciation 1 392 1 906 2 168 1 713 3 169 2 843 3 289 2 283 2 182 2 841 104%
Farm Net Value Added (FNVA) 4 045 5 602 8 060 5 823 10 422 5 560 12 280 11 647 8 803 10 468 159%
Wages 243 212 588 223 582 514 720 873 233 1 034 326%
Rent 208 219 478 304 596 444 391 330 377 411 98%
Interest 22 138 263 162 69 101 563 156 24 1 842 8142%
External factors 473 569 1 329 689 1 247 1 058 1 674 1 358 634 3 287 595%
Balance of subsidies and taxes on investment 46 -32 89 335 160 55 -14 -4 -17 392 745%
Farm net income (FNI) 3 618 5 000 6 820 5 468 9 335 4 556 10 592 10 284 8 152 7 573 109%
Family labour costs 5 829 6 138 6 692 6 761 7 046 5 906 5 708 5 926 7 124 6 821 17%
Ow n capital unpaid cost 1 077 536 594 1 259 972 1 112 543 1 171 1 254 1 858 72%
Imputed family factors 6 906 6 673 7 286 8 020 8 018 7 018 6 251 7 097 8 378 8 679 26%
Family farms only in EUR/FWU (nominal)
Ow n capital unpaid cost 1 116 556 641 1 295 1 063 1 220 611 1 383 1 298 2 158 93%
Remuneration of Family Labour (RFL) 2 633 4 632 6 720 4 326 9 142 3 777 11 301 10 762 7 139 6 638 152%

EU beef farms report 2012
89
SwedenSTRUCTURAL INFORMATION
Breeders & Fatteners 2000 2001 2002 2003 2004 2005 2006 2007 2008 20092009/ 2000
Farms represented 1 390 2 420 1 650 1 740 1 180 990 950 960 1 270 1 410 1%
Sample farms 33 47 45 50 33 31 40 35 47 64
Av. Labour in AWU 1.15 1.09 1.27 1.17 1.35 1.33 1.26 1.28 1.21 1.24 8%
Family labour - % 96% 95% 96% 99% 93% 92% 89% 92% 97% 89% -7%
Beef specialisation - % output 71% 73% 74% 74% 71% 74% 70% 70% 75% 74% 5%
Average UAA - ha 66.1 71.0 81.2 77.5 110.9 114.5 102.6 112.5 90.4 103.2 56%
Forage crops - ha 51.9 59.4 66.1 66.0 90.4 96.2 89.7 96.4 78.2 87.3 68%
of which % permanent grassland 35% 38% 37% 40% 41% 43% 35% 43% 36% 40% 15%
Stocking density - LU/ha 0.9 0.7 0.8 0.8 0.7 0.7 0.8 0.8 0.9 0.9 -7%
Av. number of suckler cows - head 24.47 25.42 29.94 28.18 36.68 38.35 33.15 35.83 29.70 31.23 28%
Number of suckler cow s per AWU 21.28 23.32 23.57 24.09 27.17 28.83 26.31 27.99 24.55 25.19 18%
Total beef cattle - LU 49 45 55 52 68 70 70 73 69 78 58%
Total LU on the farm 51 46 56 53 69 72 70 75 70 79 56%
Cattle (male & female) < 1 year sold - head 0 30 28 25 24 24 15 16 11 13 #DIV/0!
Male cattle 1-2 years sold - head 0 15 12 9 22 29 29 32 37 33 #DIV/0!
Male cattle sold (incl. fem. < 1 year) - head 15 48 44 38 52 58 49 55 53 53 246%
Selling price male cattle - €/head 0 357 569 551 563 639 781 870 916 730 #DIV/0!
Cattle < 1 year + male 1-2 year sold / cow 0.6 1.9 1.5 1.4 1.4 1.5 1.5 1.5 1.8 1.7 171%
Total cattle sold - head 15 61 54 48 73 71 64 69 66 69 351%
Total cattle sales - € 0 24 686 33 938 28 273 44 123 46 569 47 813 56 316 59 083 49 729 #DIV/0!
Selling price cattle - €/head 0 406 628 594 604 655 744 821 889 723 #DIV/0!
OUTPUT AND COSTS in €/Male cattle sold (nominal)
Breeders & Fatteners 2000 2001 2002 2003 2004 2005 2006 2007 2008 2009 2009/ 2000 2010e 2011e 2010 /2009 2011 /2009
TOTAL BEEF OUTPUT 1 714 520 756 785 828 841 975 1 058 1 090 930 -46% 1 129 1 280 21% 38%
TOTAL BEEF COUPLED DP 773 269 472 436 513 64 109 108 119 108 -86% 108 108 0% 0%
of which suckler cow premium 242.5 95.3 137.9 137.6 146.6 0.0 0.0 0.0 0.0 0.0 -100% 0.0 0.0
of which special male premium 196 62 126 105 128 64 108 106 118 107 -46% 107 107 0% 0%
of which slaughter premium 65 35 88 63 79 0 0 0 0 0 -100% 0 0
of which extensification premium 269 76 120 110 132 0 0 0 0 0 -100% 0 0
of which other DP (incl. National DP) 0 1 1 20 28 0 1 2 1 1 224598% 1 1 0% 0%
Feed 680 178 327 305 326 280 287 344 408 325 -52% 361 429 11% 32%
of which purchased feed 417 102 215 170 191 160 158 184 224 176 -58% 214 256 21% 45%
of which home-grown feed 263 76 113 135 135 121 129 160 184 149 -44% 148 173 -1% 16%
Animal purchase 177 81 115 153 129 159 202 278 267 258 46% 275 303 7% 18%
Other specif ic costs 91 28 51 61 91 68 73 53 58 69 -24% 70 71 2% 3%
Specific costs 948 287 493 519 546 507 562 675 734 652 -31% 706 804 8% 23%
Machinery and building upkeep 309 102 123 117 148 124 139 127 138 148 -52% 152 156 3% 5%
Energy (fuel, electricity) 201 74 103 111 118 121 123 119 130 123 -39% 132 143 7% 17%
Contract w ork 125.1 60.7 84.0 90.2 88.3 87.7 86.4 89.3 88.9 91.6 -27% 93.5 98.2 2% 7%
Taxes (exc. milk levy) 1 1 1 0 0 1 2 2 1 3 194% 3 3 2% 3%Other direct inputs (incl. w ater, insurance on farm buildings)
122 44 57 71 97 92 106 109 99 13813%
141 1482% 7%
Non specific costs 759 282 368 390 451 426 456 447 457 503 -34% 521 548 4% 9%
Total operating costs 1 707 569 861 909 997 933 1 018 1 121 1 191 1 155 -32% 1 227 1 351 6% 17%
Gross margin (over operating costs) 7 -48 -105 -124 -169 -93 -43 -63 -101 -225 -3140% -98 -71 -56% -68%Gross margin (over operating costs) with CP* 781 221 367 312 344 -28 66 45 18 -116 -115% 10 37 -109% -132%
* CP: coupled payments e: estimateDepreciation 922 291 348 402 320 264 357 277 195 203 -78%
Wages 63 23 19 6 34 29 49 33 17 63 0%
Rent 79 25 48 49 70 56 55 57 47 49 -38%
Interest 184 33 60 61 54 49 81 81 86 70 -62%
External factors 326 82 127 117 159 133 185 171 149 182 -44%
Net margin (before ow n factors) -1 241 -421 -581 -642 -648 -490 -585 -511 -445 -609 -51%
Net margin (before ow n factors) with CP* -468 -152 -109 -206 -135 -426 -476 -403 -326 -501 7%
* CP: coupled payments
Family labour costs 1 578 447 634 681 620 577 593 559 621 501 -68%
Ow n capital unpaid cost 443 87 109 100 117 119 35 46 -6 49 -89%
Imputed family factors 2 020 535 743 781 737 696 628 605 615 551 -73%
Total economic costs 4 975 1 476 2 080 2 208 2 213 2 027 2 188 2 173 2 150 2 090 -58%
Net economic margin (after own factors) -3 261 -956 -1 324 -1 424 -1 385 -1 186 -1 213 -1 115 -1 060 -1 160 -64%
Net economic margin (after own factors) with CP* -2 488 -687 -851 -988 -872 -1 122 -1 104 -1 008 -941 -1 051 -58%
ASSETS in €/Male cattle sold (nominal)
Breeders & Fatteners 2000 2001 2002 2003 2004 2005 2006 2007 2008 2009 2009/ 2000
Fixed assets 18 017 5 405 6 263 6 824 5 718 6 893 7 030 6 961 6 265 7 072 -61%
Current assets 2 968 998 1 338 1 471 1 307 1 396 3 243 3 326 2 672 2 766 -7%
Total assets 20 986 6 403 7 601 8 295 7 025 8 289 10 272 10 287 8 937 9 838 -53%
INCOME per AWU in €/Male cattle sold (nominal)
Breeders & Fatteners 2000 2001 2002 2003 2004 2005 2006 2007 2008 2009 2009/ 2000
Total output 28 482 30 757 35 280 43 342 57 555 58 265 62 672 68 534 63 796 59 684 110%
Intermediate consumptions 27 399 31 072 35 902 46 183 61 391 61 185 60 658 67 330 64 715 68 792 151%
Balance of subsidies and taxes 24 836 27 856 32 113 28 396 38 619 36 507 41 046 39 510 38 361 35 873 44%
of w hich LFA/AWU 0 1 774 2 390 2 564 2 121 2 237 2 972 3 417 4 333 4 085 #DIV/0!
of w hich environmental/AWU 8 451 11 019 10 118 8 642 11 465 11 492 13 708 12 424 11 285 11 440 35%
Gross Farm Income (GFI) 25 920 27 541 31 492 25 555 34 783 33 587 43 060 40 713 37 442 26 765 3%
Depreciation 17 555 17 724 15 984 17 910 17 254 15 896 19 530 16 223 11 375 11 643 -34%
Farm Net Value Added (FNVA) 8 365 9 817 15 508 7 646 17 529 17 691 23 530 24 490 26 067 15 122 81%
Wages 1 202 1 366 1 060 321 2 084 1 812 2 935 2 028 1 001 3 398 183%
Rent 1 443 1 516 2 163 2 314 3 705 3 193 3 056 3 566 2 720 2 764 92%
Interest 3 277 2 044 2 957 2 703 2 966 2 836 4 266 4 818 4 821 3 941 20%
External factors 5 922 4 925 6 180 5 338 8 755 7 841 10 257 10 413 8 543 10 103 71%
Balance of subsidies and taxes on investment 0 184 0 0 0 0 0 0 0 0 #DIV/0!
Farm net income (FNI) 2 443 5 075 9 328 2 307 8 774 9 850 13 273 14 077 17 524 5 019 105%
Family labour costs 29 973 27 072 29 609 29 972 33 571 33 709 32 085 33 901 36 011 28 895 -4%
Ow n capital unpaid cost 8 447 5 231 5 080 4 690 6 797 7 150 1 921 2 587 -217 2 986 -65%
Imputed family factors 38 420 32 303 34 689 34 661 40 368 40 859 34 006 36 488 35 794 31 882 -17%
Family farms only in EUR/FWU (nominal)
Ow n capital unpaid cost 8 868 5 516 5 320 4 754 7 342 7 720 2 173 2 807 -224 3 380 -62%
Remuneration of Family Labour (RFL) -6 303 -164 4 448 -2 415 2 136 2 916 12 782 12 464 18 338 2 300 -136%

EU beef farms report 2012
90
SloveniaSTRUCTURAL INFORMATION
Breeders & Fatteners 2004 2005 2006 2007 2008 20092009/ 2004
Farms represented 3 520 2 600 3 450 2 720 2 790 2 050 -42%
Sample farms 30 40 61 41 52 58 93%
Av. Labour in AWU 1.58 1.74 1.65 1.38 1.37 1.50 -5%
Family labour - % 99% 99% 99% 99% 99% 99% -1%
Beef specialisation - % output 73% 74% 73% 62% 70% 71% -4%
Average UAA - ha 16.6 12.3 13.1 15.3 14.2 13.1 -21%
Forage crops - ha 15.6 11.4 12.1 14.6 13.0 12.1 -22%
of which % permanent grassland 93% 92% 86% 89% 89% 91% -2%
Stocking density - LU/ha 0.6 0.9 0.9 0.7 0.9 0.9 37%
Av. number of suckler cow s - head 7.31 6.26 6.62 7.16 6.72 6.18 -15%
Number of suckler cow s per AWU 4.63 3.60 4.01 5.19 4.91 4.12 -11%
Total beef cattle - LU 12 11 12 11 12 12 -1%
Total LU on the farm 12 13 12 12 13 12 0%
Cattle (male & female) < 1 year sold - head 3 2 4 9 5 3 3%
Male cattle 1-2 years sold - head 2 3 3 1 2 2 -19%
Male cattle sold (incl. fem. < 1 year) - head 11 9 9 11 8 6 -39%
Selling price male cattle - €/head 451 536 576 470 596 612 36%
Cattle < 1 year + male 1-2 year sold / cow 1.4 1.4 1.4 1.6 1.2 1.0 -28%
Total cattle sold - head 11 10 11 13 10 8 -31%
Total cattle sales - € 4 946 5 206 6 020 5 976 5 837 4 580 -7%
Selling price cattle - €/head 450 530 567 476 573 605 35%
OUTPUT AND COSTS in €/Male cattle sold
Breeders & Fatteners 2004 2005 2006 2007 2008 2009 2009/ 2004 2010e 2011e 2010 /2009 2011 /2009
TOTAL BEEF OUTPUT 560 636 655 648 742 881 57% 874 992 -1% 13%
TOTAL BEEF COUPLED DP 312 367 412 16 43 59 -81% 59 59 0% 0%
of which suckler cow premium 155.0 161.1 167.6 0.0 0.0 0.0 -100% 0.0 0.0
of which special male premium 52 71 85 16 43 59 15% 59 59 0% 0%
of which slaughter premium 47 58 70 0 0 0 -100% 0 0
of which extensification premium 58 77 89 0 0 0 -100% 0 0
of which other DP (incl. National DP) 0 0 0 0 0 0 -100% 0 0
Feed 102 132 169 81 150 149 46% 165 221 11% 48%
of which purchased feed 56 65 76 49 55 66 17% 79 110 19% 67%
of which home-grown feed 46 67 93 32 95 84 82% 87 112 4% 34%
Animal purchase 139 112 144 128 106 162 16% 172 190 7% 18%
Other specif ic costs 44 34 45 87 57 68 55% 70 71 2% 4%
Specific costs 286 278 358 296 314 380 33% 407 483 7% 27%
Machinery and building upkeep 198 172 236 229 316 299 51% 303 305 1% 2%
Energy (fuel, electricity) 71 88 112 123 194 161 127% 189 218 18% 36%
Contract w ork 32.6 23.4 45.3 76.0 76.6 41.4 27% 41.5 41.3 0% 0%
Taxes (exc. milk levy) 4 1 1 0 2 5 44% 5 5 2% 4%
Other direct inputs (incl. w ater, insurance on farm buildings)
25 24 27 32 51 59131%
59 590% 0%
Non specific costs 331 309 422 460 639 565 71% 598 629 6% 11%
Total operating costs 616 587 780 757 954 945 53% 1 005 1 111 6% 18%
Gross margin (over operating costs) -57 49 -125 -109 -212 -64 14% -131 -120 103% 86%
Gross margin (over operating costs) w ith CP* 255 417 287 -92 -168 -5 -102% -72 -61 1284% 1070%* CP: coupled payments e: estimateDepreciation 395 389 319 199 415 628 59%
Wages 4 5 7 3 7 16 316%
Rent 6 7 8 11 15 20 264%
Interest 3 3 8 5 9 16 375%
External factors 13 15 23 20 30 52 309%
Net margin (before ow n factors) -464 -355 -467 -328 -657 -745 60%
Net margin (before ow n factors) w ith CP* -152 13 -55 -311 -613 -686 350%
* CP: coupled payments
Family labour costs 530 787 755 553 770 1 284 142%
Ow n capital unpaid cost 124 169 147 78 -32 528 327%
Imputed family factors 653 956 901 631 738 1 812 177%
Total economic costs 1 678 1 947 2 023 1 607 2 136 3 438 105%
Net economic margin (after ow n factors) -1 118 -1 311 -1 368 -959 -1 394 -2 558 129%
Net economic margin (after ow n factors) with CP* -806 -944 -957 -942 -1 351 -2 498 210%
ASSETS in €/Male cattle sold (nominal)
Breeders & Fatteners 2004 2005 2006 2007 2008 2009 2009/ 2004
Fixed assets 24 215 20 968 16 894 13 833 20 279 29 741 23%
Current assets 497 600 536 734 1 241 1 761 254%
Total assets 24 712 21 567 17 430 14 567 21 519 31 502 27%
INCOME per AWU in €/Male cattle sold (nominal)
Breeders & Fatteners 2004 2005 2006 2007 2008 2009 2009/ 2004Total output 4 466 4 147 4 619 10 945 9 852 9 018 102%
Intermediate consumptions 4 278 3 179 4 790 12 174 11 139 9 182 115%
Balance of subsidies and taxes 4 539 4 257 3 938 4 597 5 518 5 359 18%
of w hich LFA/AWU 1 107 1 213 1 245 1 622 1 395 1 353 22%
of w hich environmental/AWU 1 267 1 150 420 1 078 1 800 1 474 16%
Gross Farm Income (GFI) 4 727 5 224 3 766 3 368 4 231 5 194 10%
Depreciation 3 731 2 608 2 397 2 310 3 368 3 701 -1%
Farm Net Value Added (FNVA) 996 2 616 1 369 1 058 863 1 493 50%
Wages 34 31 55 40 53 115 238%
Rent 44 47 62 119 118 118 171%
Interest 31 22 69 73 64 92 201%
External factors 108 100 186 233 235 325 200%
Balance of subsidies and taxes on investment 1 208 -152 -257 516 -372 477 -61%
Farm net income (FNI) 2 096 2 364 926 1 341 257 1 645 -22%
Family labour costs 4 977 5 360 5 790 6 506 6 311 7 810 57%
Ow n capital unpaid cost 1 190 1 148 1 103 966 -248 3 187 168%
Imputed family factors 6 167 6 508 6 893 7 472 6 062 10 997 78%
Family farms only in EUR/FWU (nominal)
Ow n capital unpaid cost 1 200 1 159 1 115 973 -252 3 224 169%
Remuneration of Family Labour (RFL) 914 1 228 -179 378 511 -1 560 -271%

EU beef farms report 2012
91
United KingdomSTRUCTURAL INFORMATION
Breeders & Fatteners 2000 2001 2002 2003 2004 2005 2006 2007 2008 20092009/ 2000
Farms represented 10 300 7 450 6 940 7 850 8 040 7 450 6 880 5 940 5 720 6 060 -41%
Sample farms 179 160 172 212 229 212 216 180 188 191
Av. Labour in AWU 1.37 1.50 1.49 1.42 1.46 1.46 1.44 1.40 1.40 1.49 9%
Family labour - % 89% 86% 87% 89% 87% 87% 88% 89% 87% 85% -4%
Beef specialisation - % output 77% 77% 76% 77% 78% 76% 76% 75% 76% 76% -2%
Average UAA - ha 69.5 85.8 96.1 87.3 95.0 95.3 98.8 90.4 95.5 115.1 66%
Forage crops - ha 62.5 75.0 82.8 76.2 82.8 82.3 86.8 80.8 83.5 101.5 62%
of which % permanent grassland 74% 70% 75% 75% 78% 76% 78% 79% 79% 78% 5%
Stocking density - LU/ha 1.5 1.4 1.3 1.4 1.4 1.4 1.4 1.4 1.4 1.3 -12%
Av. number of suckler cows - head 42.36 51.37 47.94 47.56 52.68 53.00 55.12 49.36 51.14 53.49 26%
Number of suckler cow s per AWU 30.92 34.25 32.17 33.49 36.08 36.30 38.28 35.26 36.53 35.90 16%
Total beef cattle - LU 86 101 103 104 113 112 115 108 112 123 44%
Total LU on the farm 91 108 110 111 120 120 124 115 120 130 43%
Cattle (male & female) < 1 year sold - head 4 4 4 4 4 5 5 5 5 4 4%
Male cattle 1-2 years sold - head 31 32 39 38 39 38 44 36 36 35 11%
Male cattle sold (incl. fem. < 1 year) - head 49 55 65 64 70 66 65 64 53 58 17%
Selling price male cattle - €/head 717 734 743 725 789 806 868 915 975 980 37%
Cattle < 1 year + male 1-2 year sold / cow 1.2 1.1 1.4 1.3 1.3 1.2 1.2 1.3 1.0 1.1 -7%
Total cattle sold - head 67 76 84 83 88 85 85 86 79 88 31%
Total cattle sales - € 47 456 56 982 62 481 59 707 67 905 67 104 72 805 76 285 74 531 85 099 79%
Selling price cattle - €/head 709 752 742 723 771 792 855 887 939 970 37%
OUTPUT AND COSTS in €/Male cattle sold
Breeders & Fatteners 2000 2001 2002 2003 2004 2005 2006 2007 2008 2009 2009/ 2000 2010e 2011e 2010 /2009 2011 /2009
TOTAL BEEF OUTPUT 917 1 050 966 963 953 975 1 092 1 209 1 470 1 477 61% 1 472 1 682 0% 14%
TOTAL BEEF COUPLED DP 336 446 480 423 452 12 13 11 11 14 -96% 14 14 0% 0%
of which suckler cow premium 156.7 178.0 179.7 162.6 189.5 0.0 0.0 0.0 0.0 0.0 -100% 0.0 0.0
of which special male premium 111 121 121 118 110 0 0 0 0 0 -100% 0 0
of which slaughter premium 14 38 62 59 65 0 0 0 0 0 -100% 0 0
of which extensification premium 49 97 101 71 73 0 0 0 0 0 -100% 0 0
of which other DP (incl. National DP) 5 11 17 12 15 12 13 11 11 14 186% 14 14 0% 0%
Feed 287 343 288 301 301 316 332 381 441 431 50% 481 582 12% 35%
of which purchased feed 160 189 163 175 173 176 181 215 245 234 46% 290 349 24% 49%
of which home-grown feed 127 154 125 125 127 140 151 167 196 197 55% 191 233 -3% 18%
Animal purchase 257 295 338 326 313 255 291 374 379 435 70% 464 512 7% 18%
Other specif ic costs 103 108 101 94 92 98 107 111 126 126 22% 143 145 14% 15%
Specific costs 647 746 727 721 706 669 730 867 946 992 53% 1 088 1 239 10% 25%
Machinery and building upkeep 92 103 90 83 83 91 101 97 111 112 21% 118 125 6% 12%
Energy (fuel, electricity) 55 54 47 45 52 65 68 77 98 83 51% 95 107 14% 29%
Contract w ork 60.9 61.4 53.0 49.1 51.7 51.5 57.1 62.0 82.7 77.6 27% 82.5 85.1 6% 10%
Taxes (exc. milk levy) 10 11 9 9 10 10 8 8 9 8 -21% 8 8 3% 8%Other direct inputs (incl. w ater, insurance on farm buildings)
88 91 87 91 98 105 111 106 111 10621%
113 1166% 10%
Non specific costs 306 320 286 278 295 322 346 350 411 386 26% 416 442 8% 14%
Total operating costs 953 1 066 1 013 999 1 001 992 1 076 1 217 1 357 1 379 45% 1 504 1 681 9% 22%
Gross margin (over operating costs) -36 -16 -47 -36 -49 -16 16 -8 113 99 -373% -32 1 -133% -99%Gross margin (over operating costs) with CP* 300 430 433 387 404 -4 30 3 124 113 -62% -18 15 -116% -86%
* CP: coupled payments e: estimateDepreciation 212 209 171 167 168 184 203 204 224 224 5%
Wages 43 53 47 38 45 50 50 44 57 61 41%
Rent 64 77 73 69 68 45 53 51 64 62 -3%
Interest 48 43 36 32 32 30 37 40 41 29 -39%
External factors 155 173 156 140 145 125 139 135 163 152 -2%
Net margin (before ow n factors) -404 -398 -374 -343 -361 -325 -326 -346 -274 -277 -31%
Net margin (before ow n factors) with CP* -68 47 107 81 91 -313 -313 -335 -263 -263 285%
* CP: coupled payments
Family labour costs 422 419 359 346 358 377 382 405 430 399 -5%
Ow n capital unpaid cost 202 181 177 163 198 155 140 164 119 127 -37%
Imputed family factors 624 601 536 508 556 532 522 569 550 526 -16%
Total economic costs 1 945 2 049 1 876 1 814 1 870 1 832 1 940 2 124 2 294 2 280 17%
Net economic margin (after own factors) -1 028 -999 -910 -851 -917 -857 -848 -916 -824 -803 -22%
Net economic margin (after own factors) with CP* -692 -553 -430 -428 -465 -844 -835 -905 -813 -788 14%
ASSETS in €/Male cattle sold (nominal)
Breeders & Fatteners 2000 2001 2002 2003 2004 2005 2006 2007 2008 2009 2009/ 2000
Fixed assets 8 976 8 794 7 966 8 109 8 160 11 201 11 659 16 472 18 309 18 845 110%
Current assets 1 385 1 345 1 252 1 282 1 255 1 504 1 576 1 511 1 808 1 853 34%
Total assets 10 360 10 139 9 218 9 392 9 416 12 705 13 235 17 983 20 117 20 698 100%
INCOME per AWU in €/AWU (nominal)
Breeders & Fatteners 2000 2001 2002 2003 2004 2005 2006 2007 2008 2009 2009/ 2000
Total output 32 120 38 582 39 861 40 637 42 654 44 286 49 051 52 031 64 180 64 856 102%
Intermediate consumptions 30 467 35 032 37 619 37 512 41 095 41 858 44 223 47 100 55 205 55 894 83%
Balance of subsidies and taxes 17 918 22 942 28 372 25 306 29 107 28 943 29 585 27 644 27 166 28 619 60%
of w hich LFA/AWU 2 596 3 073 2 638 2 255 2 494 2 362 2 008 2 160 1 548 1 768 -32%
of w hich environmental/AWU 452 443 1 128 773 1 335 1 247 2 537 2 797 3 488 3 452 663%
Gross Farm Income (GFI) 19 571 26 492 30 614 28 432 30 667 31 372 34 414 32 575 36 141 37 581 92%
Depreciation 9 633 9 571 9 543 9 584 10 036 10 787 11 917 12 035 10 785 11 340 18%
Farm Net Value Added (FNVA) 9 937 16 922 21 071 18 848 20 631 20 585 22 496 20 539 25 356 26 241 164%
Wages 2 121 2 590 2 675 2 261 2 884 2 988 2 935 2 822 2 780 3 267 54%
Rent 2 981 3 690 4 341 4 106 4 094 2 731 3 235 3 116 3 145 3 157 6%
Interest 2 265 2 123 2 177 1 946 1 991 1 780 2 203 2 438 1 965 1 464 -35%
External factors 7 367 8 404 9 192 8 313 8 968 7 499 8 372 8 376 7 890 7 887 7%
Balance of subsidies and taxes on investment 230 285 134 300 382 343 761 704 1 033 2 319 910%
Farm net income (FNI) 2 800 8 802 12 012 10 835 12 045 13 428 14 885 12 868 18 498 20 673 638%
Family labour costs 19 096 19 412 20 113 19 766 21 424 22 201 22 487 23 603 20 584 19 767 4%
Ow n capital unpaid cost 9 056 8 241 9 584 9 295 11 681 9 005 8 192 9 521 5 702 6 223 -31%
Imputed family factors 28 152 27 653 29 696 29 061 33 105 31 206 30 679 33 124 26 285 25 990 -8%
Family farms only in EUR/FWU (nominal)
Ow n capital unpaid cost 10 229 9 567 10 995 10 421 13 398 10 343 9 397 10 817 6 563 7 332 -28%
Remuneration of Family Labour (RFL) -7 037 652 2 786 1 727 417 5 081 7 677 3 803 14 731 17 026 -342%

EU beef farms report 2012
92
ANNEX VI DETAILED DATA ON FATTENERS
Table 24 Fatteners, EU-all, 2000-2011 EU-27
STRUCTURAL INFORMATION
Fatteners 2000 2001 2002 2003 2004 2005 2006 2007 2008 20092009/ 2000
Farms represented 17 860 18 660 14 980 17 750 22 490 21 080 20 030 23 090 19 420 20 190 13%
Sample farms 272 276 311 305 353 391 392 407 423 468
Av. Labour in AWU 1.26 1.24 1.36 1.26 1.33 1.20 1.27 1.30 1.41 1.32 5%
Family labour - % 93% 94% 91% 90% 88% 92% 89% 92% 87% 90% -3%
Beef specialisation - % output 76% 75% 78% 80% 81% 82% 79% 79% 80% 79% 5%
Average UAA - ha 39.7 41.4 45.4 38.8 39.7 37.5 44.6 40.8 46.8 46.6 17%
Forage crops - ha 24.1 24.4 28.6 26.9 28.0 24.1 29.4 29.2 31.0 28.8 19%
of which % permanent grassland 58% 56% 57% 61% 60% 61% 55% 66% 63% 57% -2%
Stocking density - LU/ha 2.0 1.8 2.3 2.2 2.4 2.4 2.2 1.8 2.1 2.2 10%
Total beef cattle - LU 55 53 67 63 69 61 61 55 65 66 19%
Total LU on the farm 58 58 71 66 72 64 67 59 70 69 19%
Cattle (male & female) < 1 year sold - head 25 25 31 35 39 33 21 26 23 25 -2%
Male cattle 1-2 years sold - head 35 45 46 39 38 36 74 59 86 73 109%
Male cattle sold (incl. fem. < 1 year) - head 95 96 124 118 133 116 108 105 123 113 18%
Selling price male cattle - €/head 592 653 555 550 542 566 1 133 1 121 1 182 1 088 84%
Total cattle sold - head 100 99 125 120 136 118 120 114 128 118 18%
Total cattle sales - € 60 593 65 594 70 122 66 737 75 022 67 600 136 618 128 014 151 595 127 727 111%
Selling price cattle - €/head 609 662 559 556 551 571 1 142 1 121 1 184 1 085 78%
OUTPUT AND COSTS in €/Male cattle sold (nominal)
Fatteners 2000 2001 2002 2003 2004 2005 2006 2007 2008 2009 2009/ 20002010e 2011e 2010 /2009 2011 /2009
TOTAL BEEF OUTPUT 945 878 973 1 046 1 046 1 087 1 246 1 207 1 219 1 129 19% 1 147 1 273 2% 13%
TOTAL BEEF COUPLED DP 140 194 197 210 176 75 37 37 28 38 -73% 37 37 -2% -2%
of which suckler cow premium 0.3 0.0 0.1 0.2 0.1 0.2 0.0 0.0 0.0 0.0 -89% 0 0 -51% -51%
of which special male premium 89 102 99 95 84 29 13 14 12 17 -81% 14 14 -19% -19%
of which slaughter premium 24 49 56 64 57 22 6 7 5 5 -78% 7 7 41% 41%
of which extensification premium 8 15 16 16 15 1 0 0 0 0 -100% 0 0
of which other DP (incl . National DP) 19 28 26 35 20 22 19 16 11 15 -19% 16 16 2% 2%
Feed 247 252 259 295 240 273 274 288 281 275 11% 310 359 13% 30%
of which purchased feed 192 196 206 249 198 226 213 231 210 204 6% 236 273 16% 34%
of which home-grown feed 55 55 53 46 41 47 61 57 71 71 29% 75 86 5% 21%
Animal purchase 492 466 516 601 588 596 713 672 620 567 15% 610 684 8% 21%
Other specif ic costs 28 26 26 24 20 29 28 30 29 32 13% 32 33 3% 4%
Specific costs 767 744 801 920 847 898 1 014 990 930 873 14% 952 1 075 9% 23%
Machinery and building upkeep 30 31 30 25 22 26 31 30 33 35 15% 36 37 2% 5%
Energy (fuel, electricity) 21 24 23 21 20 26 33 31 38 36 72% 40 46 11% 28%
Contract w ork 25.5 26.0 24.3 25.2 22.2 22.0 27.1 25.8 29.7 34.9 37% 36 37 2% 5%
Taxes (exc. milk levy) 4 6 5 5 4 5 6 5 7 6 50% 6 6 2% 4%
Other direct inputs (incl. w ater, insurance on farm buildings) 26 30 31 24 23 28 34 32 34 39 53% 40 41 2% 5%
Non specific costs 106 117 113 101 90 108 131 123 141 151 42% 158 167 4% 10%
Total operating costs 874 861 914 1 021 938 1 006 1 145 1 113 1 072 1 024 17% 1 110 1 242 8% 21%
Gross margin (over operating costs) 71 17 59 25 108 81 101 94 148 104 47% 37 31 -65% -70%
Gross margin (over operating costs) with CP* 211 212 256 235 283 156 139 131 176 142 -33% 74 69 -48% -52%
* CP: coupled payments e: estimate
Depreciation 67 69 71 56 56 65 81 79 88 86 28%
Wages 11 9 16 15 17 13 19 13 17 15 37%
Rent 21 23 24 23 19 19 27 20 24 27 30%
Interest 18 21 15 13 10 13 14 16 19 20 8%
External factors 50 53 55 52 47 45 60 48 60 62 24%
Net margin (before own factors) -47 -105 -67 -83 5 -29 -40 -33 0 -44 -6%
Net margin (before own factors) with CP* 93 89 130 127 181 46 -3 4 28 -6 -107%
* CP: coupled payments
Family labour costs 143 148 132 131 115 132 149 156 165 155 8%
Ow n capital unpaid cost 50 43 47 36 41 32 47 46 26 75 50%
Imputed family factors 193 191 180 168 156 164 195 202 191 230 19%
Total economic costs 1 185 1 174 1 220 1 297 1 196 1 279 1 482 1 442 1 411 1 403 18%
Net economic margin (after own factors) -240 -296 -247 -251 -151 -192 -235 -235 -192 -274 14%
Net economic margin (after own factors) with CP* -100 -102 -50 -40 25 -117 -198 -198 -164 -236 136%
ASSETS in €/Male cattle sold (nominal)
Fatteners 2000 2001 2002 2003 2004 2005 2006 2007 2008 2009 2009/ 2000
Fixed assets 3 463 3 421 3 403 2 878 2 983 3 865 5 874 5 510 5 128 4 993 44%
Current assets 1 394 1 045 975 973 894 1 129 1 447 1 580 1 214 1 295 -7%
Total assets 4 858 4 466 4 379 3 851 3 877 4 994 7 321 7 090 6 342 6 287 29%
INCOME per AWU in €/AWU (nominal)
Fatteners 2000 2001 2002 2003 2004 2005 2006 2007 2008 2009 2009/ 2000
Total output 46 601 45 075 55 870 54 809 58 509 60 421 63 484 58 574 70 229 64 871 39%
Intermediate consumptions 36 175 38 742 45 546 47 781 43 907 49 000 49 931 45 153 52 124 51 083 41%
Balance of subsidies and taxes 15 198 21 061 24 961 25 151 23 576 23 688 25 418 21 179 21 413 24 301 60%
of w hich LFA/AWU 738 1 131 1 252 961 852 1 297 1 413 1 245 1 109 1 453 97%
of w hich environmental/AWU 1 071 1 198 1 448 1 122 1 220 1 627 1 607 1 439 1 524 1 757 64%
Gross Farm Income (GFI) 25 624 27 394 35 285 32 179 38 177 35 109 38 971 34 600 39 518 38 089 49%
Depreciation 6 972 7 405 8 566 6 955 7 342 8 217 9 258 8 338 9 723 9 529 37%
Farm Net Value Added (FNVA) 18 652 19 988 26 719 25 224 30 835 26 892 29 713 26 262 29 794 28 560 53%
Wages 1 090 928 1 768 1 653 1 930 1 538 2 056 1 257 1 780 1 674 54%
Rent 2 174 2 494 2 939 2 908 2 598 2 391 3 082 2 088 2 804 3 041 40%
Interest 1 865 2 217 1 827 1 632 1 405 1 723 1 667 1 755 2 251 2 084 12%
External factors 5 129 5 639 6 534 6 194 5 933 5 653 6 806 5 100 6 835 6 799 33%
Balance of subsidies and taxes on investment -169 -193 -159 -227 -49 400 -114 -142 166 232 -237%
Farm net income (FNI) 13 354 14 157 20 026 18 803 24 852 21 639 22 793 21 020 23 125 21 993 65%
Family labour costs 14 514 15 376 15 946 15 623 14 796 16 462 16 666 16 026 17 838 17 048 17%
Ow n capital unpaid cost 5 312 4 739 5 857 4 548 5 380 4 058 5 272 4 661 3 017 8 163 54%
Imputed family factors 19 825 20 116 21 803 20 171 20 175 20 520 21 938 20 688 20 855 25 210 27%
Family farms only in EUR/FWU (nominal)
Ow n capital unpaid cost 5 719 5 007 6 411 5 036 6 093 4 400 5 954 5 057 3 455 9 015 58%
Remuneration of Family Labour (RFL) 8 641 9 918 15 498 15 626 21 910 18 973 19 764 17 829 23 379 15 308 77%

EU beef farms report 2012
93
Table 25 Fatteners, EU-15, 2000-2011 EU-15
STRUCTURAL INFORMATION
Fatteners 2000 2001 2002 2003 2004 2005 2006 2007 2008 20092009/ 2000
Farms represented 17 860 18 660 14 980 17 750 21 610 20 500 19 650 22 660 18 010 17 910 0%
Sample farms 272 276 311 305 334 371 373 389 393 408
Av. Labour in AWU 1.26 1.24 1.36 1.26 1.31 1.20 1.26 1.29 1.40 1.29 2%
Family labour - % 93% 94% 91% 90% 89% 92% 89% 92% 91% 91% -1%
Beef specialisation - % output 76% 75% 78% 80% 82% 82% 79% 79% 80% 80% 5%
Average UAA - ha 39.7 41.4 45.4 38.8 40.1 37.8 44.8 41.1 47.8 49.4 25%
Forage crops - ha 24.1 24.4 28.6 26.9 28.0 24.4 29.6 29.4 31.4 30.9 28%
of which % permanent grassland 58% 56% 57% 61% 59% 61% 55% 66% 61% 58% 0%
Stocking density - LU/ha 2.0 1.8 2.3 2.2 2.5 2.4 2.2 1.8 2.2 2.1 10%
Total beef cattle - LU 55 53 67 63 71 62 61 55 68 70 28%
Total LU on the farm 58 58 71 66 74 66 68 59 74 74 27%
Cattle (male & female) < 1 year sold - head 25 25 31 35 41 34 22 27 25 28 10%
Male cattle 1-2 years sold - head 35 45 46 39 38 37 75 60 92 78 123%
Male cattle sold (incl. fem. < 1 year) - head 95 96 124 118 138 119 110 106 129 122 29%
Selling price male cattle - €/head 592 653 555 550 540 566 1 135 1 123 1 195 1 101 86%
Total cattle sold - head 100 99 125 120 141 121 121 115 135 128 28%
Total cattle sales - € 60 593 65 594 70 122 66 737 77 325 69 004 138 888 129 653 161 582 140 309 132%
Selling price cattle - €/head 609 662 559 556 550 570 1 143 1 123 1 197 1 098 80%
OUTPUT AND COSTS in €/Male cattle sold (nominal)
Fatteners 2000 2001 2002 2003 2004 2005 2006 2007 2008 2009 2009/ 20002010e 2011e 2010 /2009 2011 /2009
TOTAL BEEF OUTPUT 945 878 973 1 046 1 049 1 089 1 248 1 210 1 229 1 143 21% 1 162 1 289 2% 13%
TOTAL BEEF COUPLED DP 140 194 197 210 175 75 37 37 28 39 -72% 37 37 -4% -4%
of which suckler cow premium 0.3 0.0 0.1 0.2 0.0 0.2 0.0 0.0 0.0 0.0 -89% 0 0 -53% -53%
of which special male premium 89 102 99 95 83 29 13 14 12 17 -81% 14 14 -21% -21%
of which slaughter premium 24 49 56 64 57 22 5 8 5 6 -77% 8 8 37% 37%
of which extensification premium 8 15 16 16 15 1 0 0 0 0 -100% 0 0
of which other DP (incl . National DP) 19 28 26 35 20 22 19 16 12 16 -16% 16 16 -1% -1%
Feed 247 252 259 295 239 274 274 286 278 273 11% 307 355 12% 30%
of which purchased feed 192 196 206 249 198 227 214 229 207 203 6% 235 271 15% 33%
of which home-grown feed 55 55 53 46 41 47 60 57 71 70 27% 73 84 4% 20%
Animal purchase 492 466 516 601 591 598 715 675 627 580 18% 624 699 8% 21%
Other specif ic costs 28 26 26 24 20 29 28 30 30 32 15% 33 33 3% 4%
Specific costs 767 744 801 920 851 901 1 016 992 935 885 15% 964 1 088 9% 23%
Machinery and building upkeep 30 31 30 25 21 26 31 30 33 35 15% 36 37 3% 5%
Energy (fuel, electricity) 21 24 23 21 19 26 32 30 37 35 68% 39 45 11% 28%
Contract w ork 25.5 26.0 24.3 25.2 22.1 22.0 27.2 26.0 30.2 35.6 39% 36 37 2% 5%
Taxes (exc. milk levy) 4 6 5 5 4 5 6 5 7 6 50% 6 6 1% 4%
Other direct inputs (incl. w ater, insurance on farm buildings) 26 30 31 24 22 28 34 32 34 40 56% 41 42 2% 5%
Non specific costs 106 117 113 101 90 107 130 123 141 151 42% 158 167 4% 10%
Total operating costs 874 861 914 1 021 940 1 009 1 147 1 114 1 076 1 037 19% 1 122 1 255 8% 21%
Gross margin (over operating costs) 71 17 59 25 109 80 101 96 153 107 51% 40 34 -63% -68%
Gross margin (over operating costs) with CP* 211 212 256 235 284 155 138 133 182 145 -31% 79 73 -46% -50%
* CP: coupled payments e: estimate
Depreciation 67 69 71 56 55 64 81 79 88 86 27%
Wages 11 9 16 15 17 13 19 12 15 14 28%
Rent 21 23 24 23 19 19 27 20 24 28 32%
Interest 18 21 15 13 10 13 14 16 19 20 11%
External factors 50 53 55 52 47 45 60 48 59 62 24%
Net margin (before own factors) -47 -105 -67 -83 7 -29 -40 -31 7 -41 -12%
Net margin (before own factors) with CP* 93 89 130 127 183 46 -3 6 35 -3 -103%
* CP: coupled payments
Family labour costs 143 148 132 131 114 132 148 156 167 155 8%
Ow n capital unpaid cost 50 43 47 36 41 31 47 46 28 74 49%
Imputed family factors 193 191 180 168 155 163 195 203 194 230 19%
Total economic costs 1 185 1 174 1 220 1 297 1 196 1 281 1 483 1 443 1 417 1 414 19%
Net economic margin (after own factors) -240 -296 -247 -251 -148 -192 -235 -233 -188 -271 13%
Net economic margin (after own factors) with CP* -100 -102 -50 -40 28 -117 -198 -196 -159 -232 132%
ASSETS in €/Male cattle sold (nominal)
Fatteners 2000 2001 2002 2003 2004 2005 2006 2007 2008 2009 2009/ 2000
Fixed assets 3 463 3 421 3 403 2 878 2 938 3 860 5 874 5 533 5 198 5 066 46%
Current assets 1 394 1 045 975 973 892 1 129 1 446 1 583 1 214 1 301 -7%
Total assets 4 858 4 466 4 379 3 851 3 830 4 990 7 320 7 116 6 412 6 367 31%
INCOME per AWU in €/AWU (nominal)
Fatteners 2000 2001 2002 2003 2004 2005 2006 2007 2008 2009 2009/ 2000
Total output 46 601 45 075 55 870 54 809 61 150 61 614 64 801 59 568 74 952 72 027 55%
Intermediate consumptions 36 175 38 742 45 546 47 781 45 733 50 046 51 001 45 792 55 149 56 453 56%
Balance of subsidies and taxes 15 198 21 061 24 961 25 151 24 555 24 176 25 976 21 603 22 778 26 894 77%
of w hich LFA/AWU 738 1 131 1 252 961 842 1 313 1 436 1 270 1 185 1 627 120%
of w hich environmental/AWU 1 071 1 198 1 448 1 122 1 234 1 646 1 648 1 469 1 627 1 973 84%
Gross Farm Income (GFI) 25 624 27 394 35 285 32 179 39 971 35 745 39 776 35 379 42 581 42 468 66%
Depreciation 6 972 7 405 8 566 6 955 7 536 8 327 9 398 8 461 10 318 10 541 51%
Farm Net Value Added (FNVA) 18 652 19 988 26 719 25 224 32 436 27 418 30 378 26 918 32 263 31 927 71%
Wages 1 090 928 1 768 1 653 2 021 1 576 2 107 1 248 1 774 1 758 61%
Rent 2 174 2 494 2 939 2 908 2 734 2 447 3 164 2 140 3 016 3 434 58%
Interest 1 865 2 217 1 827 1 632 1 449 1 763 1 696 1 784 2 392 2 378 28%
External factors 5 129 5 639 6 534 6 194 6 204 5 787 6 966 5 172 7 183 7 570 48%
Balance of subsidies and taxes on investment -169 -193 -159 -227 -125 405 -325 -150 142 125 -174%
Farm net income (FNI) 13 354 14 157 20 026 18 803 26 106 22 036 23 087 21 596 25 223 24 481 83%
Family labour costs 14 514 15 376 15 946 15 623 15 390 16 755 17 015 16 351 19 119 18 856 30%
Ow n capital unpaid cost 5 312 4 739 5 857 4 548 5 642 4 127 5 371 4 773 3 323 9 023 70%
Imputed family factors 19 825 20 116 21 803 20 171 21 032 20 881 22 387 21 124 22 442 27 879 41%
Family farms only in EUR/FWU (nominal)
Ow n capital unpaid cost 5 719 5 007 6 411 5 036 6 372 4 506 6 063 5 165 3 662 9 839 72%
Remuneration of Family Labour (RFL) 8 641 9 918 15 498 15 626 22 970 19 463 19 972 18 209 24 117 16 854 95%

EU beef farms report 2012
94
Table 26 Fatteners, EU-10, 2000-2011 EU-10STRUCTURAL INFORMATION
Fatteners 2004 2005 2006 2007 2008 20092009/ 2004
Farms represented 880 590 380 370 570 2 150 144%
Sample farms 19 20 19 17 27 58
Av. Labour in AWU 1.80 1.44 1.67 1.74 1.81 1.48 -18%
Family labour - % 85% 96% 92% 99% 94% 92% 8%
Beef specialisation - % output 69% 69% 69% 66% 69% 74% 7%
Average UAA - ha 30.9 27.1 31.6 25.9 32.0 24.6 -21%
Forage crops - ha 28.0 14.7 19.2 16.2 18.9 12.2 -56%
of which % permanent grassland 93% 70% 35% 23% 73% 31% -67%
Stocking density - LU/ha 0.9 1.3 1.4 1.5 1.4 2.3 157%
Total beef cattle - LU 26 18 28 23 25 28 6%
Total LU on the farm 28 23 31 24 29 30 8%
Cattle (male & female) < 1 year sold - head 0.7 0.5 0.9 0.1 0.5 0.6 -21%
Male cattle 1-2 years sold - head 23 23 22 20 29 34 47%
Male cattle sold (incl. fem. < 1 year) - head 26 25 26 22 31 36 40%
Selling price male cattle - €/head 695 706 786 827 789 739 6%
Total cattle sold - head 26 27 26 23 32 37 41%
Total cattle sales - € 18 231 18 413 20 665 19 035 25 322 27 181 49%
Selling price cattle - €/head 694 687 781 813 781 735 6%
OUTPUT AND COSTS in €/Male cattle sold (nominal)
Fatteners 2004 2005 2006 2007 2008 2009 2009/ 20042010e 2011e 2010 /2009 2011 /2009
TOTAL BEEF OUTPUT 605 782 950 984 920 729 21% 736 840 1% 15%
TOTAL BEEF COUPLED DP 206 131 126 54 32 9 -96% 9 9 0% 0%
of which suckler cow premium 10.2 0.3 1.3 0.0 0.0 0.0 -100% 0 0
of which special male premium 93 53 63 54 28 9 -91% 9 9 0% 0%
of which slaughter premium 55 33 27 0 4 0 -100% 0 0
of which extensification premium 25 10 6 0 0 0 -100% 0 0
of which other DP (incl. National DP) 23 34 29 0 0 0 -100% 0 0
Feed 288 188 322 371 285 280 -3% 554 659 98% 136%
of which purchased feed 231 66 95 94 90 174 -25% 351 413 102% 138%
of which home-grown feed 57 122 227 277 195 106 84% 203 246 92% 133%
Animal purchase 116 219 268 338 266 248 114% 436 481 76% 94%
Other specif ic costs 23 22 11 14 16 11 -52% 19 19 70% 74%
Specific costs 427 429 602 724 567 539 26% 1 008 1 159 87% 115%
Machinery and building upkeep 85 56 53 46 41 30 -65% 50 52 68% 74%
Energy (fuel, electricity) 59 50 84 78 61 54 -9% 99 112 86% 109%
Contract w ork 39.3 18.1 18.6 21.8 17.0 18.5 -53% 31 32 68% 75%
Taxes (exc. milk levy) 2 4 4 5 3 3 121% 6 6 70% 76%
Other direct inputs (incl. w ater, insurance on farm buildings)
26 24 28 29 22 20 -23% 34 36 69% 79%
Non specific costs 211 152 188 180 144 125 -41% 220 238 76% 90%
Total operating costs 638 581 790 904 710 664 4% 1 229 1 398 85% 110%
Gross margin (over operating costs) -34 201 160 80 210 65 -292% -17 -13 -126% -121%
Gross margin (over operating costs) with CP* 172 332 286 134 242 73 -57% -3 1 -104% -99%
* CP: coupled payments e: estimate
Depreciation 210 146 207 217 165 89 -57%
Wages 19 7 10 2 11 18 -5%
Rent 10 14 7 8 17 15 49%
Interest 25 11 34 38 12 5 -78%
External factors 54 32 52 47 39 38 -29%
Net margin (before own factors) -297 23 -99 -185 5 -63 -79%
Net margin (before own factors) w ith CP* -91 154 27 -131 37 -54 -41%* CP: coupled payments
Family labour costs 224 199 193 249 223 165 -26%
Ow n capital unpaid cost 43 54 79 44 14 83 90%
Imputed family factors 267 253 272 292 237 248 -7%
Total economic costs 1 169 1 012 1 321 1 462 1 152 1 039 -11%
Net economic margin (after ow n factors) -564 -231 -371 -477 -232 -310 -45%
Net economic margin (after ow n factors) with CP* -358 -99 -245 -423 -200 -302 -16%
ASSETS in €/Male cattle sold (nominal)
Fatteners 2004 2005 2006 2007 2008 2009 2009/ 2004
Fixed assets 8 854 4 657 5 963 6 397 4 397 3 232 -63%
Current assets 1 209 1 034 1 537 1 575 1 278 922 -24%
Total assets 10 063 5 691 7 500 7 972 5 675 4 153 -59%
INCOME per AWU in €/AWU (nominal)
Fatteners 2004 2005 2006 2007 2008 2009 2009/ 2004
Total output 11 856 15 507 16 935 15 238 18 728 18 159 53%
Intermediate consumptions 11 703 10 290 12 012 12 229 13 219 15 329 31%
Balance of subsidies and taxes 6 306 5 489 5 611 4 636 5 068 6 657 6%
of w hich LFA/AWU 1 051 613 633 402 478 352 -67%
of w hich environmental/AWU 993 803 132 393 608 368 -63%
Gross Farm Income (GFI) 6 459 10 706 10 533 7 645 10 577 9 487 47%
Depreciation 3 961 3 643 4 474 4 147 3 897 2 975 -25%
Farm Net Value Added (FNVA) 2 498 7 063 6 060 3 498 6 680 6 512 161%
Wages 315 178 241 33 248 493 57%
Rent 195 360 157 147 386 510 162%
Interest 632 264 681 682 280 185 -71%
External factors 1 142 802 1 078 861 915 1 188 4%
Balance of subsidies and taxes on investment 1 307 179 8 010 180 920 1 040 -20%
Farm net income (FNI) 2 664 6 439 12 991 2 817 6 685 6 364 139%
Family labour costs 4 319 5 166 4 302 4 749 5 842 5 833 35%
Ow n capital unpaid cost 752 1 388 1 802 806 360 2 628 250%
Imputed family factors 5 071 6 554 6 104 5 555 6 202 8 462 67%
Family farms only in EUR/FWU (nominal)
Ow n capital unpaid cost 882 1 451 1 947 810 381 2 863 225%
Remuneration of Family Labour (RFL) 2 138 5 278 12 092 2 020 6 691 4 069 90%

EU beef farms report 2012
95
Table 27 Fatteners, EU group, 2009 2009
STRUCTURAL INFORMATION
Fatteners EU27 EU15 EU10Farms represented 20 190 17 910 2 150
Sample farms 468 408 58
Av. Labour in AWU 1.32 1.29 1.48
Family labour - % 90% 91% 92%
Beef specialisation - % output 79% 80% 74%
Average UAA - ha 46.6 49.4 24.6
Forage crops - ha 28.8 30.9 12.2
of which % permanent grassland 57% 58% 31%
Stocking density - LU/ha 2.2 2.1 2.3
Av. number of suckler cow s - head 0.10 0.09 0.16
Number of suckler cow s per AWU 0.08 0.07 0.11
Total beef cattle - LU 66 70 28
Total LU on the farm 69 74 30
Cattle (male & female) < 1 year sold - head 25 28 1
Male cattle 1-2 years sold - head 73 78 34
Male cattle sold (incl. fem. < 1 year) - head 113 122 36
Selling price male cattle - €/head 1 088 1 101 739
Cattle < 1 year + male 1-2 year sold / cow 1 127.4 1 360.0 227.2
Total cattle sold - head 118 128 37
Total cattle sales - € 127 727 140 309 27 181
Selling price cattle - €/head 1 085 1 098 735
OUTPUT AND COSTS in €/Male cattle sold (nominal)
Fatteners EU27 EU15 EU10EU15/EU27 EU10/EU27 EU10/EU15
TOTAL BEEF OUTPUT 1 129 1 143 729 101% 65% 64%
TOTAL BEEF COUPLED DP 38 39 9 103% 23% 23%
of which suckler cow premium 0.0 0.0 0.0 104% 0% 0%
of which special male premium 17 17 9 102% 52% 51%
of which slaughter premium 5 6 0 104% 0% 0%
of which extensification premium 0 0 0
of which other DP (incl. National DP) 15 16 0 104% 0% 0%
Feed 275 273 280 99% 102% 102%
of which purchased feed 204 203 174 100% 85% 86%
of which home-grown feed 71 70 106 98% 148% 151%
Animal purchase 567 580 248 102% 44% 43%
Other specif ic costs 32 32 11 102% 35% 34%
Specific costs 873 885 539 101% 62% 61%Machinery and building upkeep 35 35 30 100% 85% 85%
Energy (fuel, electricity) 36 35 54 97% 150% 154%
Contract w ork 34.9 35.6 18.5 102% 53% 52%
Taxes (exc. milk levy) 6 6 3 100% 55% 55%Other direct inputs (incl. w ater, insurance on farm buildings) 39 40 20 101% 52% 51%
Non specific costs 151 151 125 100% 83% 83%
Total operating costs 1 024 1 037 664 101% 65% 64%
Gross margin (over operating costs) 104 107 65 102% 62% 61%Gross margin (over operating costs) w ith CP* 142 145 73 102% 52% 51%* CP: coupled payments
Depreciation 86 86 89
Wages 15 14 18
Rent 27 28 15
Interest 20 20 5
External factors 62 62 38
Net margin (before own factors) -44 -41 -63Net margin (before own factors) with CP* -6 -3 -54
* CP: coupled payments
Family labour costs 155 155 165
Ow n capital unpaid cost 75 74 83
Imputed family factors 230 230 248
Total economic costs 1 403 1 414 1 039
Net economic margin (after own factors) -274 -271 -310
Net economic margin (after own factors) w ith CP* -236 -232 -302
ASSETS
Fatteners EU27 EU15 EU10
Fixed assets 4 993 5 066 3 232
Current assets 1 295 1 301 922
Total assets 6 287 6 367 4 153
INCOME per AWU
Fatteners EU27 EU15 EU10Total output 64 871 72 027 18 159
Intermediate consumptions 51 083 56 453 15 329
Balance of subsidies and taxes 24 301 26 894 6 657
of w hich LFA/AWU 1 453 1 627 352
of w hich environmental/AWU 1 757 1 973 368
Gross Farm Income (GFI) 38 089 42 468 9 487
Depreciation 9 529 10 541 2 975
Farm Net Value Added (FNVA) 28 560 31 927 6 512
Wages 1 674 1 758 493
Rent 3 041 3 434 510
Interest 2 084 2 378 185
External factors 6 799 7 570 1 188
Balance of subsidies and taxes on investment 232 125 1 040
Farm net income (FNI) 21 993 24 481 6 364
Family labour costs 17 048 18 856 5 833
Ow n capital unpaid cost 8 163 9 023 2 628
Imputed family factors 25 210 27 879 8 462
Selling price male cattle > 2 years - €/head 1 120.9 1 123.5 956.8
Selling price male cattle - €/head 1 088 1 101 739

EU beef farms report 2012
96
Table 28 Fatteners, Member States, 2009 2009
STRUCTURAL INFORMATION Fatteners AT DE DK ES FI IE IT PL SE SI UK
Farms represented 1 140 3 250 350 3 530 1 230 4 100 1 750 800 800 120 870
Sample farms 34 105 15 47 28 39 66 25 22 17 24
Av. Labour in AWU 1.1 1.3 1.1 1.1 1.3 1.1 2.1 1.8 1.3 1.8 1.5Family labour - % 99% 95% 76% 96% 86% 95% 82% 99% 95% 95% 83%
Beef specialisation - % output 71% 72% 77% 85% 88% 87% 84% 66% 70% 72% 68%
Average UAA - ha 30 48 75 40 62 43 51 23 92 22 95
Forage crops - ha 15 27 27 24 34 41 21 8 56 14 55
of which % permanent grassland 40% 29% 24% 80% 0% 96% 11% 49% 40% 64% 70%
Stocking density - LU/ha 2.3 3.0 3.9 1.2 2.0 1.3 5.1 2.8 1.4 1.7 2.1
Total beef cattle - LU 37 80 108 40 67 49 152 22 82 24 116
Total LU on the farm 38 85 131 42 69 52 157 26 83 25 119
Cattle (male & female) < 1 year sold - head 0 5 278 96 6 1 10 0 1 0 16
Male cattle 1-2 years sold - head 52 106 16 24 81 16 258 19 64 27 138
Male cattle sold (incl. fem. < 1 year) - head 53 113 294 122 87 72 284 22 89 29 168
Selling price male cattle - €/head 1 228 1 175 594 804 907 980 1 463 764 777 1 108 1 051
Total cattle sold - head 53 115 303 123 90 88 290 23 93 30 170
Total cattle sales - € 65 305 134 548 183 573 98 844 80 589 86 331 424 965 17 151 71 106 33 238 177 917
Selling price cattle - €/head 1 224 1 170 606 805 900 984 1 464 747 764 1 099 1 047
OUTPUT AND COSTS in €/Male cattlin €/Male cattle sold (nominal)
Fatteners AT DE DK ES FI IE IT PL SE SI UK
TOTAL BEEF OUTPUT 1 273 1 182 617 791 954 1 197 1 476 877 781 1 121 1 121
TOTAL BEEF COUPLED DP 31 0 116 19 443 0 5 0 152 136 0
of which suckler cow premium 1 0 0 0 0 0 0 0 0 0 0
of which special male premium 0 0 116 0 142 0 0 0 152 136 0
of which slaughter premium 30 0 0 18 0 0 0 0 0 0 0
of which extensification premium 0 0 0 0 0 0 0 0 0 0 0
of which other DP (incl. National DP) 0 0 0 0 301 0 5 0 0 0 0
Feed 273 292 335 297 362 192 234 319 350 329 279
of which purchased feed 160 188 282 289 244 133 171 81 168 120 169
of which home-grown feed 113 104 53 8 118 59 63 238 182 210 110
Animal purchase 574 556 168 315 379 753 813 177 230 482 609Other specific costs 30 24 32 24 26 40 37 9 28 16 61Specific costs 876 872 535 635 767 985 1 083 505 608 828 949Machinery and building upkeep 60 55 50 16 89 39 13 40 67 96 39Energy (fuel, electricity) 51 59 18 16 78 28 30 67 72 65 31Contract w ork 56 60 60 7 97 40 11 18 56 25 28Taxes (exc. milk levy) 11 8 8 2 4 2 12 8 0 2 2Other direct inputs (incl. w ater, insurance on farm buildings) 96 64 32 17 107 37 18 21 72 22 38Non specific costs 273 246 169 57 375 145 85 153 267 209 137Total operating costs 1 149 1 117 704 693 1 142 1 131 1 168 658 876 1 036 1 086
Gross margin (over operating costs) 124 65 -88 98 -188 66 308 218 -95 85 35Gross margin (over operating costs) w ith CP* 155 65 28 117 256 66 313 218 57 220 35* CP: coupled payments

EU beef farms report 2012
97
Table 28 Fatteners, Member States, 2009 (cont.) AT DE DK ES FI IE IT PL SE SI UK
Depreciation 228 107 70 31 277 80 59 128 138 351 84Wages 3 8 25 3 44 10 24 1 14 16 19
Rent 19 51 27 10 47 14 32 11 30 22 13
Interest 24 20 140 4 61 18 0 17 41 5 4
External factors 46 80 192 18 152 43 56 29 85 42 36
Net margin (before own factors) -150 -122 -350 50 -617 -57 192 61 -317 -309 -85Net margin (before own factors) w ith CP* -119 -122 -233 68 -174 -57 197 61 -165 -173 -85* CP: coupled payments
Family labour costs 227 140 93 128 281 245 114 273 306 342 117
Ow n capital unpaid cost 183 85 -6 32 53 203 56 70 50 211 48
Imputed family factors 410 225 87 159 334 448 170 343 357 554 165
Total economic costs 1 833 1 529 1 054 900 1 905 1 702 1 454 1 158 1 455 1 983 1 371
Net economic margin (after own factors) -560 -346 -437 -109 -951 -505 22 -282 -674 -862 -250
Net economic margin (after own factors) w ith CP* -529 -346 -321 -91 -507 -505 27 -282 -522 -727 -250
ASSETS
Fatteners AT DE DK ES FI IE IT PL SE SI UK
Fixed assets 6 077 5 471 5 842 1 218 3 347 13 237 3 472 7 777 4 167 9 823 7 020
Current assets 2 161 1 135 871 1 415 1 398 1 121 1 347 1 375 1 856 1 280 1 174
Total assets 8 238 6 606 6 713 2 633 4 745 14 358 4 819 9 152 6 023 11 102 8 194
INCOME per AWU
Fatteners AT DE DK ES FI IE IT PL SE SI UKTotal output 46 676 78 661 176 014 62 419 49 060 37 297 117 109 13 157 67 079 21 225 90 010
Intermediate consumptions 35 425 67 305 190 172 46 199 63 163 31 941 64 150 9 115 68 466 18 296 77 474
Balance of subsidies and taxes 22 701 25 901 72 472 17 528 65 883 25 801 20 392 3 299 32 819 10 116 27 380
of w hich LFA/AWU 1 544 308 0 650 13 658 1 739 120 283 1 690 790 41
of w hich environmental/AWU 3 357 607 1 122 171 7 920 3 209 53 278 5 935 1 778 3 027
Gross Farm Income (GFI) 33 952 37 257 58 315 33 748 51 780 31 157 73 351 7 341 31 432 13 044 39 917
Depreciation 15 206 13 325 23 744 3 987 21 993 6 324 9 885 2 278 12 889 7 583 14 155
Farm Net Value Added (FNVA) 18 746 23 932 34 571 29 761 29 788 24 834 63 466 5 063 18 544 5 462 25 761
Wages 169 1 044 8 766 448 3 379 944 3 859 24 1 193 363 3 619
Rent 1 338 6 507 9 346 1 499 3 694 1 063 5 132 199 3 000 529 2 566
Interest 1 643 2 321 46 854 494 4 825 1 287 42 276 3 613 98 643
External factors 3 150 9 871 64 965 2 441 11 898 3 294 9 034 499 7 806 990 6 828
Balance of subsidies and taxes on investment -900 -2 492 0 396 686 2 217 189 20 0 5 091 736
Farm net income (FNI) 14 696 11 569 -30 395 27 716 18 576 23 757 54 621 4 584 10 738 9 562 19 669
Family labour costs 15 364 16 944 32 189 16 682 22 383 19 086 19 535 4 944 30 414 7 463 19 360
Ow n capital unpaid cost 12 124 10 477 -515 4 085 4 168 15 955 9 084 1 267 5 655 4 550 8 196
Imputed family factors 27 487 27 421 31 675 20 768 26 550 35 041 28 619 6 211 36 069 12 013 27 556
Ow n capital unpaid cost 12 273 11 068 -678 4 220 4 859 16 876 11 052 1 274 5 939 4 797 9 816
Remuneration of Family Labour (RFL) 2 604 1 154 -39 368 24 410 16 801 8 252 55 401 3 336 5 337 5 285 13 741

EU beef farms report 2012
98
Table 29 Fatteners, Member States, 2010, 2011 estimates 2010OUTPUT AND COSTS in €/Male cattle sold (nominal)
Fatteners 2010eAT DE DK ES FI IE IT PL SE SI UK
TOTAL BEEF OUTPUT 1 290 1 205 648 865 932 1 199 1 451 910 950 1 114 1 115
TOTAL BEEF COUPLED DP 31 0 116 19 443 0 5 0 152 136 0
of which suckler cow premium 1 0 0 0 0 0 0 0 0 0 0
of which special male premium 0 0 116 0 142 0 0 0 152 136 0
of which slaughter premium 30 0 0 18 0 0 0 0 0 0 0
of which extensification premium 0 0 0 0 0 0 0 0 0 0 0
of which other DP (incl. National DP) 0 0 0 0 301 0 5 0 0 0 0
Feed 305 335 375 339 403 200 258 388 402 370 327
of which purchased feed 192 227 319 330 276 146 191 103 204 142 209
of which home-grown feed 113 109 56 9 127 54 67 286 198 227 118
Animal purchase 611 790 179 295 404 796 800 188 245 514 649Other specif ic costs 31 25 32 24 26 40 37 9 28 16 69Specific costs 947 1 150 586 658 833 1 036 1 095 586 675 900 1 045Machinery and building upkeep 63 57 52 16 93 39 14 41 69 97 41
Energy (fuel, electricity) 56 63 21 19 91 32 32 71 77 76 35Contract w ork 60 60 63 8 98 40 11 18 58 25 30Taxes (exc. milk levy) 11 8 8 2 4 2 12 8 0 2 2Other direct inputs (incl. w ater, insurance on farm buildings) 103 64 34 19 109 37 19 22 74 22 40Non specific costs 293 251 176 62 395 150 88 159 277 221 148Total operating costs 1 240 1 401 763 720 1 228 1 186 1 183 746 952 1 121 1 194
Gross margin (over operating costs) 50 -196 -114 145 -296 13 268 164 -3 -7 -78Gross margin (over operating costs) with CP* 81 -196 2 164 147 13 273 164 149 128 -78* CP: coupled payments
2011OUTPUT AND COSTS in €/Male cattle sold (nominal)
Fatteners 2011e AT DE DK ES FI IE IT PL SE SI UKTOTAL BEEF OUTPUT 1 435 1 401 731 946 984 1 427 1 533 1 108 1 075 1 251 1 270
TOTAL BEEF COUPLED DP 31 0 116 19 443 0 5 0 152 136 0
of which suckler cow premium 1 0 0 0 0 0 0 0 0 0 0
of which special male premium 0 0 116 0 142 0 0 0 152 136 0
of which slaughter premium 30 0 0 18 0 0 0 0 0 0 0
of which extensification premium 0 0 0 0 0 0 0 0 0 0 0
of which other DP (incl. National DP) 0 0 0 0 301 0 5 0 0 0 0
Feed 361 396 437 409 475 217 272 475 480 500 394
of which purchased feed 228 270 372 398 322 153 201 127 244 199 252
of which home-grown feed 133 126 65 10 153 64 71 349 236 301 143
Animal purchase 675 887 198 291 446 1 235 751 208 271 567 716
Other specif ic costs 31 25 33 24 26 40 38 10 29 17 70Specific costs 1 067 1 308 667 723 947 1 492 1 061 693 779 1 084 1 181
Machinery and building upkeep 65 58 53 16 95 38 14 43 71 97 44Energy (fuel, electricity) 64 71 24 22 118 37 36 79 83 88 39Contract w ork 60 61 66 8 100 40 12 21 60 25 31Taxes (exc. milk levy) 11 8 8 2 5 2 12 8 0 2 2Other direct inputs (incl. w ater, insurance on farm buildings) 103 65 35 20 111 37 19 25 77 22 41Non specific costs 303 263 187 68 429 155 94 175 292 234 158Total operating costs 1 370 1 571 854 792 1 376 1 647 1 155 868 1 071 1 318 1 339
Gross margin (over operating costs) 65 -170 -123 154 -392 -220 378 241 4 -67 -69Gross margin (over operating costs) with CP* 96 -170 -6 172 51 -220 383 241 156 69 -69* CP: coupled payments

Commission européenne, B-1049 Bruxelles / Europese Commissie, B-1049 Brussel — Belgium. Telephone: (32-2) 299 11 11.
ANNEX VIA FATTENERS BY MEMBER STATES
AustriaSTRUCTURAL INFORMATION
Fatteners 2002 2004 2005 2006 2007 2008 2009
Farms represented 690 790 1 030 900 1 000 1 020 1 140
Sample farms 17 20 25 22 26 28 34
Av. Labour in AWU 1.49 1.10 1.11 1.10 1.19 1.12 1.12
Family labour - % 99% 98% 99% 98% 100% 100% 99%
Beef specialisation - % output 66% 71% 67% 69% 64% 71% 71%
Average UAA - ha 26.5 24.7 26.9 27.0 25.3 27.3 29.7
Forage crops - ha 15.7 14.7 15.2 15.7 14.2 14.8 15.5
of which % permanent grassland 53% 39% 41% 42% 40% 43% 40%
Stocking density - LU/ha 1.9 2.1 1.9 2.0 2.2 2.1 2.3
Total beef cattle - LU 30 32 29 33 32 33 37
Total LU on the farm 31 34 31 34 34 33 38
Cattle (male & female) < 1 year sold - head 0 0 0 1 0 1 0
Male cattle 1-2 years sold - head 43 44 39 46 42 48 52
Male cattle sold (incl. fem. < 1 year) - head 43 45 40 47 42 50 53
Selling price male cattle - €/head 1 074 1 013 1 139 1 228 1 203 1 268 1 228
Total cattle sold - head 45 46 41 48 43 50 53
Total cattle sales - € 50 459 46 122 46 180 58 156 51 749 63 669 65 305
Selling price cattle - €/head 1 132 1 004 1 125 1 223 1 190 1 264 1 224
OUTPUT AND COSTS in €/Male cattle sold (nominal)
Fatteners 2002 2004 2005 2006 2007 2008 20092010e 2011e 2010 /2009 2011 /2009
TOTAL BEEF OUTPUT 1 138 1 015 1 197 1 207 1 228 1 283 1 273 1 290 1 435 1% 13%
TOTAL BEEF COUPLED DP 310 354 33 34 32 31 31 31 31 0% 0%
of which suckler cow premium 4.2 0.3 0.8 2.0 1.0 0.9 1.4 1 1 0% 0%
of which special male premium 212 256 0 0 0 0 0 0 0
of which slaughter premium 77 81 32 32 31 30 30 30 30 0% 0%
of which extensification premium 0 0 0 0 0 0 0 0 0
of which other DP (incl. National DP) 17 17 0 0 0 0 0 0 0
Feed 240 208 208 184 295 274 273 305 361 12% 32%
of which purchased feed 123 120 114 93 159 161 160 192 228 20% 43%
of which home-grown feed 118 88 94 91 136 113 113 113 133 0% 17%
Animal purchase 484 509 572 625 547 568 574 611 675 7% 18%
Other specific costs 23 23 21 19 28 21 30 31 31 3% 5%
Specific costs 748 740 801 828 871 863 876 947 1 067 8% 22%
Machinery and building upkeep 61 62 64 49 49 53 60 63 65 5% 8%
Energy (fuel, electricity) 41 44 49 52 50 57 51 56 64 10% 26%
Contract w ork 56.4 55.2 62.3 53.8 58.3 57.7 55.6 60 60 8% 8%
Taxes (exc. milk levy) 10 10 12 9 11 9 11 11 11 2% 5%
Other direct inputs (incl. w ater, insurance on farm buildings)
75 80 82 83 79 89 96 103 103 8% 8%
Non specific costs 243 252 269 247 247 265 273 293 303 7% 11%
Total operating costs 991 992 1 070 1 075 1 118 1 128 1 149 1 240 1 370 8% 19%
Gross margin (over operating costs) 147 23 127 132 111 154 124 50 65 -60% -48%
Gross margin (over operating costs) w ith CP* 457 377 160 166 143 186 155 81 96 -48% -38%
* CP: coupled payments e: estimate
Depreciation 191 171 201 214 198 200 228
Wages 8 7 2 6 0 1 3
Rent 26 20 22 16 13 19 19
Interest 6 17 27 17 15 21 24
External factors 40 45 50 39 28 40 46
Net margin (before ow n factors) -84 -193 -124 -121 -116 -86 -150Net margin (before ow n factors) with CP* 226 161 -90 -87 -83 -55 -119
* CP: coupled payments
Family labour costs 264 227 253 225 250 233 227
Ow n capital unpaid cost 169 100 75 110 122 78 183
Imputed family factors 433 327 328 335 371 311 410
Total economic costs 1 655 1 534 1 649 1 662 1 715 1 680 1 833
Net economic margin (after ow n factors) -517 -519 -451 -455 -487 -397 -560
Net economic margin (after ow n factors) with CP* -207 -165 -418 -421 -455 -366 -529
ASSETS in €/Male cattle sold (nominal)
Fatteners 2002 2004 2005 2006 2007 2008 2009
Fixed assets 6 362 4 768 5 788 5 500 6 597 5 805 6 077
Current assets 1 248 1 931 2 317 2 161 2 718 2 127 2 161
Total assets 7 610 6 699 8 105 7 661 9 315 7 932 8 238
INCOME per AWU in €/AWU (nominal)
Fatteners 2002 2004 2005 2006 2007 2008 2009
Total output 30 976 32 508 33 922 36 351 37 799 45 403 46 676
Intermediate consumptions 19 563 25 791 24 677 25 363 27 220 32 928 35 425
Balance of subsidies and taxes 18 038 21 674 20 353 23 844 18 255 20 989 22 701
of w hich LFA/AWU 1 252 1 064 1 317 1 365 1 228 1 529 1 544
of w hich environmental/AWU 3 908 3 549 3 974 4 774 2 820 2 869 3 357
Gross Farm Income (GFI) 29 452 28 391 29 598 34 833 28 834 33 464 33 952
Depreciation 8 471 9 589 10 758 12 919 10 789 12 572 15 206
Farm Net Value Added (FNVA) 20 981 18 803 18 840 21 914 18 045 20 893 18 746
Wages 321 421 121 391 30 34 169
Rent 1 143 1 204 1 241 978 770 1 207 1 338
Interest 285 909 1 441 936 813 1 350 1 643
External factors 1 748 2 535 2 803 2 304 1 613 2 591 3 150
Balance of subsidies and taxes on investment -868 -412 -1 382 -2 232 -2 997 -652 -900
Farm net income (FNI) 18 364 15 856 14 656 17 378 13 435 17 650 14 696
Family labour costs 11 571 12 785 13 522 13 574 13 647 14 889 15 364
Ow n capital unpaid cost 7 393 5 745 4 088 6 757 6 707 5 025 12 124
Imputed family factors 18 964 18 530 17 610 20 331 20 354 19 914 27 487
Family farms only in EUR/FWU (nominal)
Ow n capital unpaid cost 7 520 5 821 4 103 6 874 6 738 5 054 12 273
Remuneration of Family Labour (RFL) 11 160 10 244 10 606 10 805 6 759 12 698 2 604

EU beef farms report 2012
100
Germany
STRUCTURAL INFORMATION
Fatteners 2000 2001 2002 2003 2004 2005 2006 2007 2008 20092009/ 2000
Farms represented 2 000 2 850 2 090 2 270 2 870 2 390 2 430 1 990 3 090 3 250 63%
Sample farms 37 54 58 52 72 80 85 78 104 105
Av. Labour in AWU 1.47 1.52 1.46 1.46 1.50 1.38 1.47 1.44 1.35 1.28 -13%
Family labour - % 94% 97% 97% 99% 97% 98% 96% 95% 95% 95% 1%
Beef specialisation - % output 69% 66% 68% 67% 68% 71% 69% 68% 70% 72% 4%
Average UAA - ha 56.4 50.6 53.9 52.5 53.9 55.1 50.6 55.4 55.7 47.9 -15%
Forage crops - ha 35.2 29.1 32.3 33.5 30.8 30.2 28.0 32.1 31.8 27.0 -23%
of which % permanent grassland 33% 29% 34% 33% 31% 34% 29% 37% 31% 29% -11%
Stocking density - LU/ha 2.7 3.0 2.7 2.6 2.8 2.6 3.1 2.9 2.8 3.0 10%
Total beef cattle - LU 97 89 87 86 87 85 85 93 89 80 -17%
Total LU on the farm 106 107 98 100 95 90 93 102 98 85 -19%
Cattle (male & female) < 1 year sold - head 7 12 7 7 2 3 5 3 4 5 -26%
Male cattle 1-2 years sold - head 129 121 112 115 112 107 111 127 113 106 -17%
Male cattle sold (incl. fem. < 1 year) - head 138 133 121 124 118 112 116 130 119 113 -18%
Selling price male cattle - €/head 896 862 955 883 1 056 1 147 1 130 1 176 1 231 1 175 31%
Total cattle sold - head 138 134 123 125 119 113 121 134 122 115 -17%
Total cattle sales - € 123 963 115 124 116 562 110 330 125 133 128 817 135 044 156 149 149 228 134 548 9%
Selling price cattle - €/head 895 861 951 882 1 053 1 143 1 113 1 166 1 224 1 170 31%
OUTPUT AND COSTS in €/Male cattle sold (nominal)
Fatteners 2000 2001 2002 2003 2004 2005 2006 2007 2008 2009 2009/ 20002010e 2011e 2010 /2009 2011 /2009
TOTAL BEEF OUTPUT 909 873 995 878 1 034 1 203 1 137 1 192 1 296 1 182 30% 1 205 1 401 2% 18%
TOTAL BEEF COUPLED DP 167 208 237 229 251 0 0 0 0 0 -100% 0 0
of which suckler cow premium 0.0 0.0 0.1 0.0 0.0 0.0 0.0 0.0 0.0 0.0 #DIV/0! 0 0
of which special male premium 154 144 156 149 164 0 0 0 0 0 -100% 0 0
of which slaughter premium 14 64 80 79 87 0 0 0 0 0 -100% 0 0
of which extensification premium 0 0 1 1 0 0 0 0 0 0 #DIV/0! 0 0
of which other DP (incl. National DP) 0 0 0 0 0 0 0 0 0 0 -100% 0 0
Feed 259 252 252 257 258 264 281 325 344 292 12% 335 396 15% 36%
of which purchased feed 159 165 159 167 163 152 171 199 209 188 18% 227 270 21% 44%
of which home-grown feed 100 87 93 90 95 112 110 126 134 104 4% 109 126 4% 21%
Animal purchase 443 401 512 446 491 579 547 526 552 556 25% 790 887 42% 60%
Other specif ic costs 27 22 23 21 22 28 26 28 28 24 -9% 25 25 0% 1%
Specific costs 730 675 787 725 771 870 854 880 924 872 19% 1 150 1 308 32% 50%
Machinery and building upkeep 32 38 43 36 41 49 53 45 57 55 73% 57 58 3% 6%
Energy (fuel, electricity) 34 38 46 41 50 57 59 57 65 59 74% 63 71 7% 20%
Contract w ork 44.5 45.0 49.9 44.1 48.9 46.5 45.1 49.1 59.7 59.6 34% 60 61 0% 1%
Taxes (exc. milk levy) 6 7 8 8 8 9 8 8 9 8 31% 8 8 1% 4%
Other direct inputs (incl. w ater, insurance on farm buildings)
46 47 56 50 54 62 57 55 65 6439%
64 65 0% 2%
Non specific costs 162 175 203 178 201 224 222 214 255 246 51% 251 263 2% 7%
Total operating costs 892 850 990 903 972 1 094 1 076 1 094 1 180 1 117 25% 1 401 1 571 25% 41%
Gross margin (over operating costs) 17 23 5 -25 62 109 62 98 117 65 283% -196 -170 -401% -361%
Gross margin (over operating costs) with CP* 184 231 242 204 313 109 62 98 117 65 -65% -196 -170 -401% -361%
* CP: coupled payments e: estimate
Depreciation 89 79 84 75 84 101 93 93 108 107 21%
Wages 7 5 6 2 5 4 6 8 7 8 21%
Rent 51 48 55 55 67 56 46 51 58 51 1%
Interest 19 19 22 25 19 22 16 15 19 20 6%
External factors 77 72 82 83 92 82 68 75 85 80 4%
Net margin (before ow n factors) -149 -129 -161 -183 -114 -75 -99 -70 -76 -122 -18%
Net margin (before ow n factors) with CP* 19 79 76 46 137 -75 -99 -70 -76 -122 -746%* CP: coupled payments
Family labour costs 113 132 139 136 140 141 136 125 134 140 23%
Ow n capital unpaid cost 92 58 74 59 52 41 57 49 43 85 -8%
Imputed family factors 205 190 212 195 192 182 193 174 176 225 9%
Total economic costs 1 263 1 191 1 368 1 256 1 340 1 460 1 429 1 436 1 548 1 529 21%
Net economic margin (after own factors) -354 -318 -373 -378 -306 -257 -292 -244 -252 -346 -2%
Net economic margin (after own factors) with CP* -186 -111 -137 -148 -55 -257 -292 -244 -252 -346 86%
ASSETS in €/Male cattle sold (nominal)
Fatteners 2000 2001 2002 2003 2004 2005 2006 2007 2008 2009 2009/ 2000
Fixed assets 5 046 3 837 4 685 4 530 4 741 5 458 5 807 4 890 5 566 5 471 8%
Current assets 1 140 1 077 1 116 1 073 1 216 1 238 1 141 1 125 1 254 1 135 0%
Total assets 6 186 4 915 5 801 5 603 5 958 6 696 6 947 6 015 6 820 6 606 7%
INCOME per AWU in €/AWU (nominal)
Fatteners 2000 2001 2002 2003 2004 2005 2006 2007 2008 2009 2009/ 2000
Total output 66 883 66 284 61 421 58 215 65 623 71 583 69 054 90 106 96 628 78 661 18%
Intermediate consumptions 55 516 54 950 54 331 52 672 51 839 55 764 57 991 70 249 78 428 67 305 21%
Balance of subsidies and taxes 21 562 23 791 28 143 26 242 28 977 25 898 24 108 27 205 27 418 25 901 20%
of w hich LFA/AWU 361 329 349 281 323 427 348 283 250 308 -15%
of w hich environmental/AWU 894 558 800 714 886 1 191 847 767 670 607 -32%
Gross Farm Income (GFI) 32 929 35 124 35 232 31 786 42 761 41 717 35 170 47 062 45 618 37 257 13%
Depreciation 12 162 10 490 10 467 9 423 9 665 11 687 10 754 12 712 13 825 13 325 10%
Farm Net Value Added (FNVA) 20 768 24 634 24 766 22 363 33 096 30 030 24 416 34 350 31 793 23 932 15%
Wages 832 655 693 325 625 493 682 1 109 897 1 044 25%
Rent 6 856 6 278 6 528 6 982 7 752 6 362 5 225 6 573 7 467 6 507 -5%
Interest 2 541 2 429 2 567 2 990 2 120 2 416 1 814 2 024 2 380 2 321 -9%
External factors 10 229 9 363 9 788 10 297 10 497 9 271 7 721 9 705 10 744 9 871 -3%
Balance of subsidies and taxes on investment -552 -2 002 -960 -721 -1 091 -811 -1 568 -1 632 -1 552 -2 492 351%
Farm net income (FNI) 9 987 13 269 14 018 11 344 21 508 19 948 15 128 23 013 19 498 11 569 16%
Family labour costs 15 760 17 377 16 775 16 886 16 176 16 097 15 857 16 690 16 499 16 944 8%
Ow n capital unpaid cost 12 948 7 655 9 193 7 471 6 042 4 761 6 699 6 613 5 340 10 477 -19%
Imputed family factors 28 707 25 031 25 968 24 357 22 218 20 858 22 556 23 303 21 838 27 421 -4%
Family farms only in EUR/FWU (nominal)
Ow n capital unpaid cost 13 774 7 886 9 519 7 583 6 220 4 867 6 949 6 935 5 630 11 068 -20%
Remuneration of Family Labour (RFL) -3 150 5 785 4 996 3 932 15 920 15 524 8 745 17 201 14 928 1 154 -137%

EU beef farms report 2012
101
DenmarkSTRUCTURAL INFORMATION
Fatteners 2004 2005 2006 2008 2009
Farms represented 540 870 790 480 350
Sample farms 15 18 18 15 15
Av. Labour in AWU 1.10 0.84 0.75 0.89 1.12
Family labour - % 85% 81% 87% 83% 76%
Beef specialisation - % output 71% 72% 63% 72% 77%
Average UAA - ha 68.7 40.1 36.0 52.1 74.7
Forage crops - ha 19.0 13.0 7.7 10.1 27.3
of which % permanent grassland 59% 62% 49% 29% 24%
Stocking density - LU/ha 3.5 3.7 5.4 6.8 3.9
Total beef cattle - LU 66 44 35 59 108
Total LU on the farm 67 51 42 73 131
Cattle (male & female) < 1 year sold - head 0 0 10 114 278
Male cattle 1-2 years sold - head 226 132 64 54 16
Male cattle sold (incl. fem. < 1 year) - head 226 132 75 171 294
Selling price male cattle - €/head 451 528 608 670 594
Total cattle sold - head 230 139 95 181 303
Total cattle sales - € 104 168 75 353 63 385 123 628 183 573
Selling price cattle - €/head 453 542 667 684 606
OUTPUT AND COSTS in €/Male cattle sold (nominal)
Fatteners 2004 2005 2006 2008 20092010e 2011e 2010 /2009 2011 /2009
TOTAL BEEF OUTPUT 433 596 826 774 617 648 731 5% 19%
TOTAL BEEF COUPLED DP 373 122 121 115 116 116 116 0% 0%
of which suckler cow premium 0.0 0.0 0.0 0.0 0.0 0 0
of which special male premium 196 122 121 115 116 116 116 0% 0%
of which slaughter premium 76 0 0 0 0 0 0
of which extensification premium 66 0 0 0 0 0 0
of which other DP (incl. National DP) 34 0 0 0 0 0 0
Feed 276 280 347 453 335 375 437 12% 30%
of which purchased feed 232 226 295 397 282 319 372 13% 32%
of which home-grown feed 44 54 52 55 53 56 65 5% 23%
Animal purchase 171 207 338 189 168 179 198 7% 18%
Other specif ic costs 23 23 44 29 32 32 33 1% 3%
Specific costs 470 510 729 670 535 586 667 10% 25%
Machinery and building upkeep 35 54 60 49 50 52 53 2% 5%
Energy (fuel, electricity) 14 19 25 23 18 21 24 12% 33%
Contract w ork 31.1 45.3 53.9 55.8 60.5 63 66 4% 9%
Taxes (exc. milk levy) 7 9 10 8 8 8 8 2% 5%
Other direct inputs (incl. w ater, insurance on farm buildings)
25 39 53 39 32 34 35 4% 9%
Non specific costs 111 167 203 174 169 176 187 4% 10%
Total operating costs 581 676 933 845 704 763 854 8% 21%
Gross margin (over operating costs) -149 -81 -107 -70 -88 -114 -123 30% 39%
Gross margin (over operating costs) w ith CP* 224 41 15 44 28 2 -6 -94% -123%
* CP: coupled payments e: estimate
Depreciation 53 63 92 78 70Wages 14 33 36 18 25
Rent 26 11 24 27 27
Interest 67 75 122 199 140
External factors 107 119 182 243 192
Net margin (before own factors) -308 -263 -381 -391 -350Net margin (before own factors) w ith CP* 65 -141 -259 -277 -233
* CP: coupled payments
Family labour costs 104 120 186 123 93Ow n capital unpaid cost 58 56 82 -70 -6
Imputed family factors 162 177 268 53 87
Total economic costs 903 1 035 1 475 1 219 1 054
Net economic margin (after own factors) -470 -440 -649 -444 -437
Net economic margin (after own factors) w ith CP* -97 -318 -527 -330 -321
ASSETS in €/Male cattle sold (nominal)
Fatteners 2004 2005 2006 2008 2009
Fixed assets 2 719 3 771 9 268 7 205 5 842
Current assets 788 1 284 1 673 1 029 871
Total assets 3 508 5 054 10 941 8 235 6 713
INCOME per AWU in €/AWU (nominal)
Fatteners 2004 2005 2006 2008 2009Total output 90 661 90 934 88 810 175 891 176 014
Intermediate consumptions 102 070 93 404 88 960 169 524 190 172
Balance of subsidies and taxes 90 709 54 345 41 881 62 943 72 472
of w hich LFA/AWU 0 0 0 0 0
of w hich environmental/AWU 496 615 350 304 1 122
Gross Farm Income (GFI) 79 301 51 875 41 731 69 310 58 315
Depreciation 15 580 13 878 14 926 21 373 23 744
Farm Net Value Added (FNVA) 63 721 37 996 26 805 47 937 34 571
Wages 4 291 6 682 5 546 4 829 8 766Rent 7 618 2 236 3 718 7 226 9 346
Interest 20 139 17 161 19 859 52 532 46 854
External factors 32 048 26 079 29 123 64 587 64 965
Balance of subsidies and taxes on investment 656 202 304 0 0
Farm net income (FNI) 32 330 12 119 -2 014 -16 650 -30 395
Family labour costs 30 863 27 290 29 916 34 083 32 189Ow n capital unpaid cost 17 191 12 663 13 210 -17 622 -515
Imputed family factors 48 053 39 953 43 125 16 461 31 675
Family farms only in EUR/FWU (nominal)
Ow n capital unpaid cost 20 313 15 510 15 179 -21 106 -678
Remuneration of Family Labour (RFL) 17 889 -666 -17 493 1 164 -39 368

EU beef farms report 2012
102
Spain
STRUCTURAL INFORMATION
Fatteners 2000 2001 2002 2003 2004 2005 2006 2007 2008 20092009/ 2000
Farms represented 3 770 3 540 2 040 4 640 3 590 5 040 3 790 7 340 3 450 3 530 -6%
Sample farms 31 39 41 53 44 49 34 46 44 47
Av. Labour in AWU 1.15 1.05 1.19 1.10 1.39 1.08 1.14 1.32 1.72 1.12 -3%
Family labour - % 98% 94% 93% 91% 74% 93% 90% 98% 98% 96% -2%
Beef specialisation - % output 86% 87% 81% 88% 93% 92% 83% 85% 88% 85% -2%
Average UAA - ha 44.9 53.0 48.6 26.5 39.2 26.8 40.6 30.1 38.2 39.9 -11%
Forage crops - ha 19.0 24.6 20.0 18.2 28.6 17.5 27.7 20.4 25.1 23.5 24%
of which % permanent grassland 91% 89% 89% 95% 96% 92% 78% 87% 94% 80% -12%
Stocking density - LU/ha 0.8 0.7 1.9 1.1 1.8 1.6 0.9 0.7 1.4 1.2 62%
Total beef cattle - LU 34 32 47 32 64 40 27 19 32 40 18%
Total LU on the farm 36 33 49 33 65 44 31 20 39 42 16%
Cattle (male & female) < 1 year sold - head 116 121 216 128 239 135 104 65 104 96 -17%
Male cattle 1-2 years sold - head 0 0 0 0 0 0 1 0 3 24 #DIV/0!
Male cattle sold (incl. fem. < 1 year) - head 116 121 216 128 241 137 105 65 108 122 6%
Selling price male cattle - €/head 813 753 619 721 719 733 789 870 801 804 -1%
Total cattle sold - head 118 121 216 129 242 139 106 66 115 123 4%
Total cattle sales - € 95 370 91 398 133 605 92 790 174 307 101 746 84 458 57 135 99 917 98 844 4%
Selling price cattle - €/head 811 753 619 721 720 732 794 872 869 805 -1%
OUTPUT AND COSTS in €/Male cattle sold (nominal)
Fatteners 2000 2001 2002 2003 2004 2005 2006 2007 2008 2009 2009/ 20002010e 2011e 2010 /2009 2011 /2009
TOTAL BEEF OUTPUT 803 713 616 834 832 783 784 963 882 791 -2% 865 946 9% 20%
TOTAL BEEF COUPLED DP 90 140 96 153 113 127 25 29 22 19 -79% 19 19 0% 0%
of which suckler cow premium 1.3 0.0 0.0 0.0 0.0 0.7 0.0 0.0 0.0 0.0 -100% 0 0
of which special male premium 35 50 46 29 40 38 0 0 0 0 -100% 0 0
of which slaughter premium 47 68 37 58 54 63 21 28 22 18 -61% 18 18 0% 0%
of which extensification premium 1 7 3 1 1 1 0 0 0 0 -100% 0 0
of which other DP (incl. National DP) 5 15 10 65 19 25 4 0 1 0 -94% 0 0 0% 0%
Feed 280 255 241 286 230 298 289 372 359 297 6% 339 409 14% 38%
of which purchased feed 276 248 237 278 225 296 280 353 352 289 4% 330 398 14% 38%
of which home-grown feed 4 7 4 8 5 2 9 19 7 8 128% 9 10 4% 21%
Animal purchase 416 366 284 439 363 370 357 338 320 315 -24% 295 291 -6% -8%
Other specif ic costs 21 21 17 16 14 27 20 34 25 24 14% 24 24 0% 0%
Specific costs 717 642 542 740 607 695 666 744 704 635 -11% 658 723 4% 14%
Machinery and building upkeep 7 11 12 9 8 9 19 18 23 16 126% 16 16 1% 2%
Energy (fuel, electricity) 8 11 8 12 8 11 20 23 27 16 90% 19 22 20% 42%
Contract w ork 5.2 2.8 5.0 3.1 3.9 3.3 7.3 5.6 10.1 7.2 38% 8 8 7% 17%
Taxes (exc. milk levy) 1 1 1 1 0 1 2 2 1 2 62% 2 2 2% 5%
Other direct inputs (incl. w ater, insurance on farm buildings)
3 4 5 8 6 9 15 11 18 17411%
19 20 7% 17%
Non specific costs 25 29 31 33 26 33 63 60 79 57 132% 62 68 8% 19%
Total operating costs 741 672 573 774 633 728 729 804 784 693 -7% 720 792 4% 14%
Gross margin (over operating costs) 62 41 43 60 199 56 55 159 99 98 59% 145 154 48% 57%
Gross margin (over operating costs) with CP* 152 181 139 213 313 183 80 187 121 117 -23% 164 172 40% 48%
* CP: coupled payments e: estimate
Depreciation 15 16 19 14 13 20 33 58 90 31 111%
Wages 1 4 3 13 18 8 10 3 4 3 136%
Rent 12 15 12 7 3 4 15 8 8 10 -14%
Interest 5 8 4 4 2 3 5 8 7 4 -24%
External factors 19 27 19 24 24 15 31 19 20 18 -5%
Net margin (before ow n factors) 29 -1 5 22 163 21 -9 81 -11 50 74%
Net margin (before ow n factors) with CP* 118 138 101 174 276 148 16 110 12 68 -42%* CP: coupled payments
Family labour costs 83 87 44 98 51 90 115 205 267 128 53%
Ow n capital unpaid cost 9 9 8 5 4 3 6 15 4 32 238%
Imputed family factors 93 96 52 103 55 92 121 219 272 159 72%
Total economic costs 867 810 663 915 725 855 914 1 101 1 165 900 4%
Net economic margin (after own factors) -64 -98 -47 -81 108 -72 -130 -138 -282 -109 71%
Net economic margin (after own factors) with CP* 26 42 49 71 221 55 -105 -110 -260 -91 -451%
ASSETS in €/Male cattle sold (nominal)
Fatteners 2000 2001 2002 2003 2004 2005 2006 2007 2008 2009 2009/ 2000
Fixed assets 559 617 578 543 397 626 935 1 636 1 851 1 218 118%
Current assets 799 845 622 809 653 744 1 389 2 716 994 1 415 77%
Total assets 1 358 1 462 1 200 1 353 1 050 1 370 2 324 4 352 2 845 2 633 94%
INCOME per AWU in €/AWU (nominal)
Fatteners 2000 2001 2002 2003 2004 2005 2006 2007 2008 2009 2009/ 2000
Total output 46 811 48 240 74 618 54 071 87 642 57 904 48 973 37 161 38 851 62 419 33%
Intermediate consumptions 36 274 38 495 58 109 41 822 49 527 48 519 39 697 26 068 32 311 46 199 27%
Balance of subsidies and taxes 9 120 17 931 22 195 17 904 21 465 18 187 16 333 7 864 10 032 17 528 92%
of w hich LFA/AWU 115 526 310 109 145 250 548 167 111 650 465%
of w hich environmental/AWU 0 67 212 13 15 12 41 42 30 171 #DIV/0!
Gross Farm Income (GFI) 19 657 27 676 38 704 30 153 59 580 27 573 25 609 18 957 16 572 33 748 72%
Depreciation 1 799 2 147 4 552 2 001 2 523 2 840 3 836 3 668 5 957 3 987 122%
Farm Net Value Added (FNVA) 17 858 25 529 34 152 28 152 57 057 24 733 21 773 15 289 10 615 29 761 67%
Wages 224 623 817 1 698 3 293 1 035 1 329 171 310 448 100%
Rent 1 574 2 162 2 950 953 740 583 1 676 521 603 1 499 -5%
Interest 649 1 176 992 598 481 443 635 534 537 494 -24%
External factors 2 447 3 961 4 759 3 249 4 514 2 061 3 640 1 226 1 451 2 441 0%
Balance of subsidies and taxes on investment -245 -273 -59 -156 -47 18 402 -34 -22 396 -262%
Farm net income (FNI) 15 167 21 295 29 333 24 747 52 495 22 691 18 535 14 030 9 141 27 716 83%
Family labour costs 10 069 11 299 10 109 12 694 9 782 12 684 13 019 12 266 17 971 16 682 66%
Ow n capital unpaid cost 1 177 1 182 2 012 804 848 458 770 850 352 4 085 247%
Imputed family factors 11 245 12 481 12 121 13 498 10 631 13 142 13 789 13 116 18 324 20 768 85%
Family farms only in EUR/FWU (nominal)
Ow n capital unpaid cost 1 199 1 255 2 172 891 1 151 492 854 859 360 4 220 252%
Remuneration of Family Labour (RFL) 14 253 21 363 29 484 25 828 69 067 23 465 19 580 13 340 8 938 24 410 71%

EU beef farms report 2012
103
FinlandSTRUCTURAL INFORMATION
Fatteners 2000 2001 2002 2003 2004 2005 2006 2007 2008 20092009/ 2000
Farms represented 1 600 2 130 1 430 1 060 1 090 1 020 1 070 1 010 840 1 230 -23%
Sample farms 27 29 24 22 21 24 26 30 25 28
Av. Labour in AWU 1.35 1.47 1.64 1.56 1.42 1.41 1.48 1.86 1.45 1.27 -6%
Family labour - % 95% 97% 93% 93% 94% 95% 86% 84% 87% 86% -9%
Beef specialisation - % output 81% 84% 85% 83% 88% 86% 86% 84% 87% 88% 8%
Average UAA - ha 44.1 45.3 53.2 55.7 49.8 61.1 67.6 73.1 62.5 62.0 41%
Forage crops - ha 23.7 24.3 34.2 31.8 30.6 33.2 35.3 39.6 35.6 33.6 42%
of which % permanent grassland 0% 0% 0% 0% 0% 0% 10% 0% 0% 0% #DIV/0!
Stocking density - LU/ha 1.7 1.7 1.8 2.1 2.0 2.2 2.0 2.0 1.9 2.0 18%
Total beef cattle - LU 42 44 59 65 61 73 72 81 70 67 61%
Total LU on the farm 42 46 61 66 62 75 74 86 71 69 64%
Cattle (male & female) < 1 year sold - head 0 0 0 4 0 0 3 2 1 6 #DIV/0!
Male cattle 1-2 years sold - head 0 68 81 89 79 88 86 107 88 81 #DIV/0!
Male cattle sold (incl. fem. < 1 year) - head 47 68 81 93 80 89 89 109 90 87 87%
Selling price male cattle - €/head 0 639 718 714 740 774 834 866 931 907 #DIV/0!
Total cattle sold - head 47 69 85 95 82 94 96 117 93 90 92%
Total cattle sales - € 0 44 068 60 713 67 189 60 407 71 419 78 070 99 349 85 553 80 589 #DIV/0!
Selling price cattle - €/head 0 635 713 710 734 758 815 849 918 900 #DIV/0!
OUTPUT AND COSTS in €/Male cattle sold (nominal)
Fatteners 2000 2001 2002 2003 2004 2005 2006 2007 2008 2009 2009/ 20002010e 2011e 2010 /2009 2011 /2009
TOTAL BEEF OUTPUT 946 683 795 735 749 843 898 854 920 954 1% 932 984 -2% 3%
TOTAL BEEF COUPLED DP 637 531 644 556 664 659 461 440 439 443 -30% 443 443 0% 0%
of which suckler cow premium 0.0 0.0 0.0 0.0 0.0 1.0 0.0 0.0 0.0 0.0 #DIV/0! 0 0
of which special male premium 211 187 232 190 198 237 145 151 144 142 -33% 142 142 0% 0%
of which slaughter premium 36 51 81 74 81 78 0 0 0 0 -100% 0 0
of which extensification premium 26 19 31 17 16 21 0 0 0 0 -100% 0 0
of which other DP (incl. National DP) 364 274 300 274 369 322 316 288 295 301 -17% 301 301 0% 0%
Feed 447 331 461 445 381 404 425 405 486 362 -19% 403 475 11% 31%
of which purchased feed 306 234 362 348 278 292 282 284 326 244 -20% 276 322 13% 32%
of which home-grown feed 141 97 99 97 103 111 144 120 160 118 -17% 127 153 7% 30%
Animal purchase 223 176 210 223 302 351 292 321 286 379 70% 404 446 7% 18%
Other specific costs 18 17 30 23 15 31 28 34 30 26 44% 26 26 -1% -1%
Specific costs 687 524 701 690 698 786 745 760 802 767 12% 833 947 9% 23%
Machinery and building upkeep 110 72 84 73 80 83 77 79 83 89 -19% 93 95 4% 7%
Energy (fuel, electricity) 61 42 41 44 64 61 79 71 101 78 28% 91 118 18% 52%
Contract work 25.0 29.9 36.9 37.2 40.9 63.7 89.2 73.0 79.0 96.7 286% 98 100 2% 4%
Taxes (exc. milk levy) 0 0 0 3 3 3 4 4 4 4 #DIV/0! 4 5 2% 5%
Other direct inputs (incl. w ater, insurance on farm buildings)
101 87 94 84 95 101 98 89 101 1076%
109 111 2% 4%
Non specific costs 296 231 256 241 283 311 348 316 367 375 26% 395 429 5% 14%
Total operating costs 984 754 957 931 981 1 097 1 093 1 075 1 169 1 142 16% 1 228 1 376 8% 20%
Gross margin (over operating costs) -38 -71 -162 -196 -232 -254 -195 -221 -249 -188 395% -296 -392 58% 109%
Gross margin (over operating costs) w ith CP* 599 460 482 360 432 405 266 218 190 256 -57% 147 51 -42% -80%
* CP: coupled payments e: estimate
Depreciation 261 174 221 218 249 255 293 265 307 277 6%
Wages 19 9 14 14 10 9 32 28 30 44 132%
Rent 29 22 33 28 29 32 43 42 44 47 60%
Interest 56 48 38 39 48 54 56 50 57 61 9%
External factors 104 80 85 82 87 95 131 120 131 152 46%
Net margin (before own factors) -403 -325 -468 -495 -569 -604 -619 -606 -688 -617 53%
Net margin (before own factors) w ith CP* 234 206 177 61 96 54 -157 -166 -249 -174 -174%
* CP: coupled payments
Family labour costs 369 278 288 254 289 268 269 286 294 281 -24%
Ow n capital unpaid cost 62 31 59 48 76 60 58 62 12 53 -14%
Imputed family factors 431 309 347 302 365 328 326 349 306 334 -22%
Total economic costs 1 780 1 318 1 610 1 533 1 683 1 775 1 843 1 809 1 914 1 905 7%
Net economic margin (after own factors) -834 -634 -815 -798 -934 -932 -945 -954 -993 -951 14%
Net economic margin (after own factors) w ith CP* -197 -103 -170 -242 -269 -274 -484 -515 -555 -507 158%
ASSETS in €/Male cattle sold (nominal)
Fatteners 2000 2001 2002 2003 2004 2005 2006 2007 2008 2009 2009/ 2000
Fixed assets 3 610 2 425 2 671 2 579 2 682 3 045 3 556 3 332 3 545 3 347 -7%
Current assets 2 269 1 593 1 419 1 245 1 248 1 429 1 297 1 326 1 364 1 398 -38%
Total assets 5 879 4 018 4 089 3 824 3 929 4 473 4 853 4 659 4 909 4 745 -19%
INCOME per AWU in €/AWU (nominal)
Fatteners 2000 2001 2002 2003 2004 2005 2006 2007 2008 2009 2009/ 2000
Total output 31 311 28 597 34 740 38 108 30 801 38 744 46 333 42 372 48 636 49 060 57%
Intermediate consumptions 31 822 32 452 42 574 49 076 44 566 55 632 57 510 53 582 64 281 63 163 98%
Balance of subsidies and taxes 38 763 40 615 49 030 52 131 52 455 65 040 59 420 54 536 58 802 65 883 70%
of w hich LFA/AWU 6 506 5 533 6 459 7 075 7 158 12 681 12 355 11 170 12 198 13 658 110%
of w hich environmental/AWU 4 946 4 642 4 932 5 434 4 619 6 689 5 821 5 075 6 661 7 920 60%
Gross Farm Income (GFI) 38 253 36 761 41 196 41 163 38 690 48 152 48 242 43 326 43 156 51 780 35%
Depreciation 11 242 9 984 13 266 15 836 16 318 18 933 20 767 18 870 22 124 21 993 96%
Farm Net Value Added (FNVA) 27 011 26 777 27 929 25 327 22 372 29 218 27 475 24 456 21 032 29 788 10%
Wages 778 504 824 989 623 789 2 321 1 835 2 195 3 379 334%
Rent 1 294 1 288 1 945 2 088 1 890 2 380 3 186 3 049 3 228 3 694 185%
Interest 2 395 2 832 2 283 2 814 3 092 3 980 3 898 3 484 4 137 4 825 101%
External factors 4 467 4 624 5 052 5 892 5 605 7 149 9 405 8 367 9 560 11 898 166%
Balance of subsidies and taxes on investment 0 0 0 111 166 402 571 525 650 686
Farm net income (FNI) 22 543 22 153 22 877 19 546 16 933 22 471 18 642 16 613 12 122 18 576 -18%
Family labour costs 16 253 15 668 17 150 18 433 18 678 19 755 18 813 20 134 21 558 22 383 38%
Ow n capital unpaid cost 2 772 1 780 3 626 3 557 4 952 4 410 4 091 4 430 818 4 168 50%
Imputed family factors 19 025 17 448 20 776 21 990 23 630 24 165 22 904 24 563 22 376 26 550 40%
Family farms only in EUR/FWU (nominal)
Ow n capital unpaid cost 2 914 1 842 3 875 3 830 5 267 4 647 4 780 5 228 941 4 859 67%
Remuneration of Family Labour (RFL) 20 781 21 082 20 570 17 215 12 742 19 033 17 001 14 380 12 999 16 801 -19%

EU beef farms report 2012
104
Ireland
STRUCTURAL INFORMATION
Fatteners 2000 2001 2002 2003 2004 2005 2006 2007 2008 20092009/ 2000
Farms represented 3 070 3 640 3 200 3 980 5 570 4 850 5 040 5 550 5 040 4 100 34%
Sample farms 25 26 29 34 41 39 45 53 48 39
Av. Labour in AWU 0.96 0.87 0.93 0.84 0.87 0.87 0.93 0.98 1.01 1.10 15%
Family labour - % 89% 94% 94% 94% 94% 94% 96% 95% 96% 95% 7%
Beef specialisation - % output 82% 77% 82% 88% 87% 80% 80% 86% 85% 87% 6%
Average UAA - ha 34.8 27.0 36.0 31.8 29.3 28.1 32.2 45.8 35.9 42.8 23%
Forage crops - ha 32.5 25.4 33.8 31.2 27.9 26.9 30.8 44.7 34.3 40.8 26%
of which % permanent grassland 95% 92% 92% 94% 95% 95% 96% 97% 95% 96% 1%
Stocking density - LU/ha 1.6 1.4 1.4 1.4 1.4 1.4 1.3 1.1 1.2 1.3 -19%
Total beef cattle - LU 49 34 46 41 38 37 39 47 39 49 1%
Total LU on the farm 51 36 49 44 40 38 41 49 42 52 2%
Cattle (male & female) < 1 year sold - head n.a. 0 0 1 0 0 0 0 0 1 #DIV/0!
Male cattle 1-2 years sold - head n.a. 7 12 14 11 11 10 9 14 16 #DIV/0!
Male cattle sold (incl. fem. < 1 year) - head 59 39 54 51 47 42 43 63 51 72 22%
Selling price male cattle - €/head n.a. 774 767 713 815 838 894 977 1 036 980 #DIV/0!
Total cattle sold - head 59 40 56 54 48 43 46 76 56 88 48%
Total cattle sales - € n.a. 30 598 42 759 38 240 39 163 35 543 40 498 73 813 57 087 86 331 #DIV/0!
Selling price cattle - €/head n.a. 772 761 710 814 833 884 967 1 025 984 #DIV/0!
OUTPUT AND COSTS in €/Male cattle sold (nominal)
Fatteners 2000 2001 2002 2003 2004 2005 2006 2007 2008 2009 2009/ 20002010e 2011e 2010 /2009 2011 /2009
TOTAL BEEF OUTPUT 1 010 809 864 749 821 917 922 1 146 1 204 1 197 18% 1 199 1 427 0% 19%
TOTAL BEEF COUPLED DP 186 240 261 285 295 0 0 0 0 0 -100% 0 0
of which suckler cow premium 0.0 0.0 0.4 1.0 0.0 0.0 0.0 0.0 0.0 0.0 #DIV/0! 0 0
of which special male premium 134 154 165 167 160 0 0 0 0 0 -100% 0 0
of which slaughter premium 20 25 37 47 46 0 0 0 0 0 -100% 0 0
of which extensification premium 22 61 60 70 88 0 0 0 0 0 -100% 0 0
of which other DP (incl. National DP) 10 0 0 0 0 0 0 0 0 0 -100% 0 0
Feed 110 118 111 113 110 116 160 148 164 192 75% 200 217 4% 13%
of which purchased feed 58 62 64 68 69 63 97 105 93 133 128% 146 153 10% 15%
of which home-grown feed 51 56 47 45 41 52 63 43 71 59 15% 54 64 -9% 8%
Animal purchase 687 622 627 590 607 635 566 794 758 753 10% 796 1 235 6% 64%
Other specific costs 31 38 37 30 26 26 26 37 38 40 26% 40 40 0% 0%
Specific costs 828 778 774 734 743 776 752 979 961 985 19% 1 036 1 492 5% 51%
Machinery and building upkeep 54 62 47 44 38 45 51 47 54 39 -28% 39 38 -1% -2%
Energy (fuel, electricity) 14 17 17 15 16 20 25 21 28 28 96% 32 37 16% 33%
Contract w ork 37.3 45.0 32.5 36.5 38.3 36.0 38.9 30.6 43.6 39.9 7% 40 40 1% 1%
Taxes (exc. milk levy) 2 2 2 2 3 2 3 2 2 2 28% 2 2 -2% -1%
Other direct inputs (incl. w ater, insurance on farm buildings)
23 24 22 19 22 20 24 26 28 3762%
37 37 1% 1%
Non specific costs 130 151 121 117 116 123 142 127 156 145 12% 150 155 3% 6%
Total operating costs 958 929 896 851 859 899 894 1 107 1 117 1 131 18% 1 186 1 647 5% 46%
Gross margin (over operating costs) 52 -121 -32 -101 -38 18 28 39 87 66 27% 13 -220 -80% -434%
Gross margin (over operating costs) with CP* 238 119 230 184 257 18 28 39 87 66 -72% 13 -220 -80% -434%
* CP: coupled payments e: estimate
Depreciation 58 62 63 49 89 77 114 107 129 80 40%
Wages 31 12 9 10 13 14 12 12 16 10 -66%
Rent 15 10 21 21 19 12 24 11 15 14 -2%
Interest 12 15 10 6 10 13 12 16 17 18 56%
External factors 57 36 40 36 42 39 48 39 47 43 -25%
Net margin (before own factors) -62 -219 -135 -187 -169 -98 -134 -106 -89 -57 -8%Net margin (before own factors) with CP* 124 21 127 98 126 -98 -134 -106 -89 -57 -146%* CP: coupled payments
Family labour costs 146 228 206 213 266 303 357 264 355 245 68%
Own capital unpaid cost 77 95 83 83 108 88 90 115 103 203 163%
Imputed family factors 223 324 288 296 375 390 446 378 458 448 101%
Total economic costs 1 296 1 351 1 287 1 232 1 364 1 405 1 503 1 631 1 751 1 702 31%
Net economic margin (after own factors) -285 -542 -423 -483 -544 -488 -580 -485 -547 -505 77%
Net economic margin (after own factors) with CP* -100 -302 -162 -198 -249 -488 -580 -485 -547 -505 407%
ASSETS in €/Male cattle sold (nominal)
Fatteners 2000 2001 2002 2003 2004 2005 2006 2007 2008 2009 2009/ 2000
Fixed assets 6 249 7 532 7 100 6 781 8 159 13 411 20 025 18 076 17 002 13 237 112%
Current assets 954 1 054 1 045 973 985 1 110 1 185 1 074 1 246 1 121 18%
Total assets 7 203 8 586 8 145 7 754 9 143 14 521 21 210 19 150 18 248 14 358 99%
INCOME per AWU in €/AWU (nominal)
Fatteners 2000 2001 2002 2003 2004 2005 2006 2007 2008 2009 2009/ 2000Total output 25 806 13 377 19 047 13 002 14 825 16 997 20 478 26 522 29 632 37 297 45%
Intermediate consumptions 19 669 16 810 18 608 17 479 15 415 14 848 17 619 22 584 24 149 31 941 62%
Balance of subsidies and taxes 13 918 13 631 19 133 20 647 21 000 20 685 20 617 26 286 22 354 25 801 85%
of which LFA/AWU 0 1 224 1 747 1 955 1 626 1 664 1 713 1 868 1 803 1 739 #DIV/0!
of which environmental/AWU 1 628 926 1 290 1 623 2 601 2 747 2 820 3 803 3 303 3 209 97%
Gross Farm Income (GFI) 20 054 10 199 19 571 16 170 20 410 22 834 23 477 30 224 27 837 31 157 55%
Depreciation 4 355 3 558 4 386 3 411 5 495 4 564 6 631 7 996 7 678 6 324 45%
Farm Net Value Added (FNVA) 15 699 6 641 15 185 12 759 14 915 18 270 16 846 22 227 20 160 24 834 58%
Wages 2 006 663 664 688 787 850 768 987 989 944 -53%
Rent 953 523 1 395 1 434 1 119 697 1 328 775 852 1 063 12%
Interest 873 829 651 398 666 815 684 1 171 963 1 287 47%
External factors 3 831 2 015 2 710 2 521 2 572 2 362 2 780 2 933 2 804 3 294 -14%
Balance of subsidies and taxes on investment 0 798 4 -528 -652 2 520 -1 217 492 1 893 2 217 #DIV/0!
Farm net income (FNI) 11 868 5 425 12 480 9 710 11 691 18 428 12 850 19 787 19 248 23 757 100%
Family labour costs 10 616 13 003 13 935 14 492 16 143 17 594 19 830 19 542 21 084 19 086 80%
Own capital unpaid cost 5 896 5 618 5 844 5 705 6 589 5 160 5 069 8 450 6 174 15 955 171%
Imputed family factors 16 512 18 620 19 779 20 197 22 732 22 754 24 899 27 992 27 258 35 041 112%
Family farms only in EUR/FWU (nominal)
Own capital unpaid cost 6 666 6 017 6 238 6 043 6 958 5 434 5 304 8 931 6 492 16 876 153%
Remuneration of Family Labour (RFL) 7 411 -207 7 084 4 243 5 388 13 974 8 141 11 981 13 749 8 252 11%

EU beef farms report 2012
105
Italy
STRUCTURAL INFORMATION
Fatteners 2000 2001 2002 2003 2004 2005 2006 2007 2008 20092009/ 2000
Farms represented 2 320 2 390 2 410 2 520 3 680 3 250 3 020 3 030 1 990 1 750 -25%
Sample farms 77 57 74 61 66 85 88 96 68 66
Av. Labour in AWU 1.65 1.41 1.67 1.93 1.74 1.66 1.88 1.64 2.09 2.10 27%
Family labour - % 95% 98% 87% 84% 84% 87% 77% 80% 73% 82% -13%
Beef specialisation - % output 76% 76% 84% 84% 84% 85% 84% 83% 85% 84% 10%
Average UAA - ha 16.6 18.2 29.0 31.7 31.5 28.8 52.3 37.1 55.3 50.8 206%
Forage crops - ha 8.6 8.9 16.1 19.2 20.7 15.4 30.1 24.0 25.3 21.4 148%
of which % permanent grassland 16% 21% 52% 19% 6% 6% 5% 6% 8% 11% -33%
Stocking density - LU/ha 6.8 6.5 7.4 6.4 6.9 7.8 5.1 5.3 6.6 5.1 -25%
Total beef cattle - LU 60 72 114 129 139 121 138 125 171 152 155%
Total LU on the farm 61 74 119 133 144 124 158 135 177 157 157%
Cattle (male & female) < 1 year sold - head 0 0 0 0 0 0 4 15 5 10 #DIV/0!
Male cattle 1-2 years sold - head 0 0 0 0 0 0 259 234 408 258 #DIV/0!
Male cattle sold (incl. fem. < 1 year) - head 113 126 212 233 273 248 284 284 421 284 152%
Selling price male cattle - €/head n.a. n.a. n.a. n.a. n.a. n.a. 1 416 1 375 1 499 1 463 #DIV/0!
Total cattle sold - head 113 126 212 233 273 248 339 326 435 290 157%
Total cattle sales - € n.a. n.a. n.a. n.a. n.a. n.a. 477 684 444 969 648 864 424 965 #DIV/0!
Selling price cattle - €/head n.a. n.a. n.a. n.a. n.a. n.a. 1 410 1 365 1 492 1 464 #DIV/0!
OUTPUT AND COSTS in €/Male cattle sold (nominal)
Fatteners 2000 2001 2002 2003 2004 2005 2006 2007 2008 2009 2009/ 20002010e 2011e 2010 /2009 2011 /2009
TOTAL BEEF OUTPUT 1 182 1 217 1 400 1 576 1 387 1 467 1 671 1 500 1 471 1 476 25% 1 451 1 533 -2% 4%
TOTAL BEEF COUPLED DP 20 54 82 116 73 9 10 7 5 5 -75% 5 5 0% 0%
of which suckler cow premium 0.0 0.0 0.0 0.0 0.0 0.0 0.0 0.0 0.0 0.0 #DIV/0! 0 0
of which special male premium 18 28 26 51 26 0 0 0 0 0 -100% 0 0
of which slaughter premium 2 19 46 59 42 0 0 0 0 0 -100% 0 0
of which extensification premium 0 0 1 0 0 0 0 0 0 0 #DIV/0! 0 0
of which other DP (incl. National DP) 0 7 9 6 5 9 10 7 5 5 47204% 5 5 0% 0%
Feed 249 299 290 378 261 295 274 261 207 234 -6% 258 272 10% 16%
of which purchased feed 202 261 247 340 229 259 229 221 157 171 -15% 191 201 12% 17%
of which home-grown feed 47 39 43 38 32 36 45 40 50 63 34% 67 71 7% 14%
Animal purchase 616 699 773 958 862 893 1 076 963 849 813 32% 800 751 -2% -8%
Other specific costs 18 24 23 24 15 26 26 22 23 37 100% 37 38 2% 4%
Specific costs 883 1 022 1 087 1 360 1 138 1 215 1 376 1 247 1 079 1 083 23% 1 095 1 061 1% -2%
Machinery and building upkeep 12 11 12 13 9 11 10 13 11 13 15% 14 14 3% 5%
Energy (fuel, electricity) 21 19 21 19 14 23 24 23 25 30 46% 32 36 6% 20%
Contract w ork 9.1 10.4 7.8 21.2 14.1 10.2 9.9 9.9 6.4 11.1 22% 11 12 3% 6%
Taxes (exc. milk levy) 6 17 11 8 6 7 9 6 12 12 79% 12 12 2% 5%
Other direct inputs (incl. w ater, insurance on farm buildings)
13 15 25 13 11 18 22 23 16 1845%
19 19 3% 6%
Non specific costs 61 73 76 74 53 69 75 75 71 85 40% 88 94 4% 11%
Total operating costs 943 1 095 1 163 1 433 1 191 1 284 1 450 1 322 1 150 1 168 24% 1 183 1 155 1% -1%
Gross margin (over operating costs) 239 122 238 143 196 183 221 178 322 308 29% 268 378 -13% 23%
Gross margin (over operating costs) with CP* 259 175 319 259 269 192 231 185 327 313 21% 273 383 -13% 23%
* CP: coupled payments e: estimate
Depreciation 61 62 58 46 42 50 48 42 43 59 -2%
Wages 11 4 34 22 22 15 27 15 22 24 118%
Rent 11 10 15 22 15 17 26 16 18 32 191%
Interest 1 1 1 0 0 0 0 1 0 0 -79%
External factors 23 14 49 45 37 32 54 32 41 56 145%
Net margin (before own factors) 155 45 131 52 117 100 120 104 238 192 24%Net margin (before own factors) with CP* 175 99 212 168 190 110 129 111 243 197 13%* CP: coupled payments
Family labour costs 185 150 127 108 80 94 82 72 70 114 -39%
Own capital unpaid cost 47 50 43 29 36 26 44 36 19 56 17%
Imputed family factors 233 200 169 137 116 120 126 108 89 170 -27%
Total economic costs 1 260 1 371 1 439 1 661 1 386 1 486 1 678 1 503 1 322 1 454 15%
Net economic margin (after own factors) -78 -154 -39 -85 1 -19 -6 -3 149 22 -128%
Net economic margin (after own factors) with CP* -58 -101 43 31 74 -10 3 3 154 27 -147%
ASSETS in €/Male cattle sold (nominal)
Fatteners 2000 2001 2002 2003 2004 2005 2006 2007 2008 2009 2009/ 2000
Fixed assets 4 633 5 451 3 868 2 848 2 973 3 697 4 963 3 298 2 519 3 472 -25%
Current assets 3 501 1 046 1 030 898 816 1 272 1 557 1 360 1 195 1 347 -62%
Total assets 8 134 6 497 4 898 3 746 3 789 4 970 6 520 4 658 3 714 4 819 -41%
INCOME per AWU in €/AWU (nominal)
Fatteners 2000 2001 2002 2003 2004 2005 2006 2007 2008 2009 2009/ 2000Total output 52 528 62 646 98 672 91 046 100 635 103 831 124 885 127 304 163 669 117 109 123%
Intermediate consumptions 30 607 43 512 63 037 70 772 66 881 72 100 83 264 83 933 84 211 64 150 110%
Balance of subsidies and taxes 4 506 8 183 13 482 19 555 17 096 14 863 28 348 25 015 21 335 20 392 352%
of which LFA/AWU 0 12 40 3 53 15 151 14 71 120 #DIV/0!
of which environmental/AWU 340 408 221 112 63 96 70 67 342 53 -84%
Gross Farm Income (GFI) 26 428 27 317 49 117 39 829 50 850 46 594 69 969 68 386 100 793 73 351 178%
Depreciation 5 835 7 617 9 230 7 098 8 694 9 362 9 312 9 409 10 611 9 885 69%
Farm Net Value Added (FNVA) 20 592 19 701 39 887 32 731 42 156 37 232 60 656 58 977 90 182 63 466 208%
Wages 993 463 4 672 2 996 3 890 2 631 4 911 3 169 5 353 3 859 289%
Rent 1 020 1 205 2 211 3 345 2 847 3 069 5 162 3 476 4 774 5 132 403%
Interest 91 68 130 13 17 47 19 139 101 42 -53%
External factors 2 104 1 736 7 014 6 354 6 754 5 747 10 092 6 784 10 227 9 034 329%
Balance of subsidies and taxes on investment 25 0 248 -62 760 464 58 110 21 189 652%
Farm net income (FNI) 18 514 17 965 33 121 26 315 36 162 31 949 50 623 52 303 79 976 54 621 195%
Family labour costs 17 287 18 442 20 749 17 330 16 603 18 602 16 358 16 220 17 710 19 535 13%
Own capital unpaid cost 4 434 5 980 6 643 4 321 7 112 4 729 8 076 7 859 4 818 9 084 105%
Imputed family factors 21 720 24 422 27 392 21 652 23 715 23 331 24 434 24 079 22 529 28 619 32%
Family farms only in EUR/FWU (nominal)
Own capital unpaid cost 4 684 6 122 7 629 5 126 8 491 5 411 10 518 9 800 6 626 11 052 136%
Remuneration of Family Labour (RFL) 14 876 12 269 30 406 26 092 34 682 31 143 55 413 55 425 103 349 55 401 272%

EU beef farms report 2012
106
PolandSTRUCTURAL INFORMATION
Fatteners 2009
Farms represented 800
Sample farms 25
Av. Labour in AWU 1.81
Family labour - % 99%
Beef specialisation - % output 66%
Average UAA - ha 23.0
Forage crops - ha 8.3
of which % permanent grassland 49%
Stocking density - LU/ha 2.8
Total beef cattle - LU 22
Total LU on the farm 26
Cattle (male & female) < 1 year sold - head 0
Male cattle 1-2 years sold - head 19
Male cattle sold (incl. fem. < 1 year) - head 22
Selling price male cattle - €/head 764
Total cattle sold - head 23
Total cattle sales - € 17 151
Selling price cattle - €/head 747
OUTPUT AND COSTS in €/Male cattle sold (nominal)
Fatteners 20092010e 2011e 2010 /2009 2011 /2009
TOTAL BEEF OUTPUT 877 910 1108 4% 26%
TOTAL BEEF COUPLED DP 0 0 0
of which suckler cow premium 0.0 0 0
of which special male premium 0 0 0
of which slaughter premium 0 0 0
of which extensification premium 0 0 0
of which other DP (incl. National DP) 0 0 0
Feed 319 388 475 22% 49%
of which purchased feed 81 103 127 27% 57%
of which home-grown feed 238 286 349 20% 46%
Animal purchase 177 188 208 7% 18%
Other specif ic costs 9 9 10 2% 4%
Specific costs 505 586 693 16% 37%
Machinery and building upkeep 40 41 43 2% 8%
Energy (fuel, electricity) 67 71 79 7% 18%
Contract w ork 17.8 18 21 2% 16%
Taxes (exc. milk levy) 8 8 8 3% 7%
Other direct inputs (incl. w ater, insurance on farm buildings)
21 22 25 2% 16%
Non specific costs 153 159 175 4% 14%
Total operating costs 658 746 868 13% 32%
Gross margin (over operating costs) 218 164 241 -25% 10%
Gross margin (over operating costs) w ith CP* 218 164 241 -25% 10%
* CP: coupled payments e: estimate
Depreciation 128
Wages 1Rent 11
Interest 17
External factors 29
Net margin (before ow n factors) 61
Net margin (before ow n factors) w ith CP* 61
* CP: coupled payments
Family labour costs 273Ow n capital unpaid cost 70
Imputed family factors 343
Total economic costs 1 158
Net economic margin (after ow n factors) -282
Net economic margin (after ow n factors) w ith CP* -282
ASSETS in €/Male cattle sold (nominal)
Fatteners 2009
Fixed assets 7 777
Current assets 1 375
Total assets 9 152
INCOME per AWU in €/AWU (nominal)
Fatteners 2009
Total output 13 157
Intermediate consumptions 9 115
Balance of subsidies and taxes 3 299
of w hich LFA/AWU 283
of w hich environmental/AWU 278
Gross Farm Income (GFI) 7 341
Depreciation 2 278
Farm Net Value Added (FNVA) 5 063
Wages 24
Rent 199
Interest 276
External factors 499
Balance of subsidies and taxes on investment 20
Farm net income (FNI) 4 584
Family labour costs 4 944Ow n capital unpaid cost 1 267
Imputed family factors 6 211
Family farms in EUR/FWU (nominal)
Ow n capital unpaid cost 1 274
Remuneration of Family Labour (RFL) 3 336

EU beef farms report 2012
107
SwedenSTRUCTURAL INFORMATION
Fatteners 2006 2007 2008 2009
Farms represented 650 580 590 800
Sample farms 17 15 17 22
Av. Labour in AWU 1.28 1.23 1.31 1.33
Family labour - % 90% 92% 94% 95%
Beef specialisation - % output 72% 68% 67% 70%
Average UAA - ha 108.9 102.3 94.5 92.5
Forage crops - ha 79.9 72.0 67.3 56.0
of which % permanent grassland 48% 48% 43% 40%
Stocking density - LU/ha 0.8 1.0 1.1 1.4
Total beef cattle - LU 63 67 72 82
Total LU on the farm 71 72 75 83
Cattle (male & female) < 1 year sold - head 1 3 1 1
Male cattle 1-2 years sold - head 48 60 54 64
Male cattle sold (incl. fem. < 1 year) - head 67 82 82 89
Selling price male cattle - €/head 886 814 904 777
Total cattle sold - head 71 88 86 93
Total cattle sales - € 61 323 69 653 77 967 71 106
Selling price cattle - €/head 864 789 903 764
OUTPUT AND COSTS in €/Male cattle sold (nominal)
Fatteners 2006 2007 2008 20092010e 2011e 2010 /2009 2011 /2009
TOTAL BEEF OUTPUT 1 011 838 973 781 950 1 075 22% 38%
TOTAL BEEF COUPLED DP 166 164 163 152 152 152 0% 0%
of which suckler cow premium 0.0 0.0 0.0 0.0 0 0
of which special male premium 166 164 163 152 152 152 0% 0%
of which slaughter premium 0 0 0 0 0 0
of which extensification premium 0 0 0 0 0 0
of which other DP (incl. National DP) 0 0 0 0 0 0 0% 0%
Feed 309 318 371 350 402 480 15% 37%
of which purchased feed 167 182 168 168 204 244 21% 45%
of which home-grown feed 142 137 203 182 198 236 9% 29%
Animal purchase 349 310 381 230 245 271 7% 18%
Other specific costs 53 36 37 28 28 29 2% 3%
Specific costs 710 664 789 608 675 779 11% 28%
Machinery and building upkeep 65 58 67 67 69 71 3% 5%
Energy (fuel, electricity) 90 67 82 72 77 83 7% 17%
Contract w ork 78.0 59.6 71.3 56.4 58 60 2% 7%
Taxes (exc. milk levy) 0 0 0 0 0 0 2% 3%
Other direct inputs (incl. w ater, insurance on farm buildings)
68 65 62 72 74 77 2% 7%
Non specific costs 301 250 283 267 277 292 4% 9%
Total operating costs 1 012 914 1 073 876 952 1 071 9% 22%
Gross margin (over operating costs) 0 -76 -99 -95 -3 4 -97% -104%
Gross margin (over operating costs) w ith CP* 166 89 64 57 149 156 159% 171%
* CP: coupled payments e: estimate
Depreciation 327 148 118 138
Wages 40 25 28 14
Rent 61 38 38 30
Interest 74 57 74 41
External factors 174 121 140 85
Net margin (before own factors) -501 -345 -357 -317Net margin (before own factors) w ith CP* -335 -180 -194 -165
* CP: coupled payments
Family labour costs 409 319 343 306
Ow n capital unpaid cost 97 69 5 50
Imputed family factors 506 388 349 357
Total economic costs 2 018 1 571 1 679 1 455
Net economic margin (after ow n factors) -1 007 -733 -706 -674
Net economic margin (after ow n factors) with CP* -841 -569 -543 -522
ASSETS in €/Male cattle sold (nominal)
Fatteners 2006 2007 2008 2009
Fixed assets 6 259 3 973 4 244 4 167
Current assets 2 763 2 215 2 500 1 856
Total assets 9 022 6 188 6 744 6 023
INCOME per AWU in €/AWU (nominal)
Fatteners 2006 2007 2008 2009Total output 61 159 70 167 71 432 67 079
Intermediate consumptions 57 664 66 650 70 157 68 466
Balance of subsidies and taxes 37 892 39 456 36 155 32 819
of w hich LFA/AWU 2 071 2 565 2 552 1 690
of w hich environmental/AWU 8 635 7 710 6 632 5 935
Gross Farm Income (GFI) 41 387 42 973 37 429 31 432
Depreciation 24 252 14 226 10 935 12 889
Farm Net Value Added (FNVA) 17 135 28 747 26 495 18 544
Wages 2 523 2 082 2 254 1 193
Rent 4 455 3 649 3 521 3 000
Interest 5 492 5 752 6 590 3 613
External factors 12 470 11 482 12 366 7 806
Balance of subsidies and taxes on investment 0 0 0 0
Farm net income (FNI) 4 665 17 265 14 129 10 738
Family labour costs 31 654 32 347 33 258 30 414
Ow n capital unpaid cost 7 730 7 189 1 354 5 655
Imputed family factors 39 384 39 535 34 612 36 069
Family farms only in EUR/FWU (nominal)
Ow n capital unpaid cost 8 587 7 853 1 445 5 939
Remuneration of Family Labour (RFL) -3 405 11 006 13 635 5 337

EU beef farms report 2012
108
SloveniaSTRUCTURAL INFORMATION
Fatteners 2008 2009
Farms represented 120 120
Sample farms 15 17
Av. Labour in AWU 1.65 1.79Family labour - % 98% 95%
Beef specialisation - % output 75% 72%
Average UAA - ha 22.7 21.8
Forage crops - ha 12.5 14.3
of which % permanent grassland 57% 64%
Stocking density - LU/ha 2.2 1.7
Total beef cattle - LU 27 24
Total LU on the farm 29 25
Cattle (male & female) < 1 year sold - head 0 0
Male cattle 1-2 years sold - head 32 27
Male cattle sold (incl. fem. < 1 year) - head 34 29
Selling price male cattle - €/head 1 072 1 108
Total cattle sold - head 36 30
Total cattle sales - € 37 988 33 238
Selling price cattle - €/head 1 048 1 099
OUTPUT AND COSTS in €/Male cattle sold
Fatteners 2008 20092010e 2011e 2010 /2009 2011 /2009
TOTAL BEEF OUTPUT 1 138 1 121 1 114 1 251 -1% 12%
TOTAL BEEF COUPLED DP 122 136 136 136 0% 0%
of which suckler cow premium 0.0 0.0 0 0
of which special male premium 122 136 136 136 0% 0%
of which slaughter premium 0 0 0 0
of which extensification premium 0 0 0 0
of which other DP (incl. National DP) 0 0 0 0
Feed 286 329 370 500 12% 52%
of which purchased feed 92 120 142 199 19% 67%
of which home-grown feed 194 210 227 301 8% 43%
Animal purchase 420 482 514 567 7% 18%
Other specif ic costs 19 16 16 17 2% 4%
Specific costs 726 828 900 1 084 9% 31%
Machinery and building upkeep 85 96 97 97 1% 2%
Energy (fuel, electricity) 84 65 76 88 18% 36%
Contract w ork 25.3 24.8 25 25 0% 0%
Taxes (exc. milk levy) 0 2 2 2 2% 4%
Other direct inputs (incl. w ater, insurance on farm buildings)
19 22 22 22 0% 0%
Non specific costs 214 209 221 234 6% 12%
Total operating costs 939 1 036 1 121 1 318 8% 27%
Gross margin (over operating costs) 198 85 -7 -67 -109% -179%
Gross margin (over operating costs) with CP* 320 220 128 69 -42% -69%
* CP: coupled payments e: estimate
Depreciation 333 351Wages 7 16Rent 30 22
Interest 10 5
External factors 48 42
Net margin (before own factors) -182 -309Net margin (before own factors) w ith CP* -60 -173
* CP: coupled payments
Family labour costs 240 342Ow n capital unpaid cost -49 211
Imputed family factors 191 554
Total economic costs 1 511 1 983
Net economic margin (after own factors) -373 -862
Net economic margin (after own factors) w ith CP* -252 -727
ASSETS in €/Male cattle sold (nominal)
Fatteners 2008 2009
Fixed assets 9 642 9 823
Current assets 1 063 1 280
Total assets 10 705 11 102
INCOME per AWU in €/AWU (nominal)
Fatteners 2008 2009Total output 27 683 21 225
Intermediate consumptions 21 557 18 296
Balance of subsidies and taxes 12 327 10 116
of w hich LFA/AWU 679 790
of w hich environmental/AWU 1 914 1 778
Gross Farm Income (GFI) 18 453 13 044
Depreciation 8 767 7 583
Farm Net Value Added (FNVA) 9 686 5 462
Wages 188 363
Rent 822 529
Interest 250 98
External factors 1 259 990
Balance of subsidies and taxes on investment 4 188 5 091
Farm net income (FNI) 12 615 9 562
Family labour costs 6 345 7 463
Ow n capital unpaid cost -1 274 4 550
Imputed family factors 5 071 12 013
Family farms in EUR/FWU (nominal)
Ow n capital unpaid cost -1 295 4 797
Remuneration of Family Labour (RFL) 14 112 5 285

EU beef farms report 2012
109
United KingdomSTRUCTURAL INFORMATION
Fatteners 2000 2001 2002 2003 2004 2005 2006 2008 20092009/ 2000
Farms represented 2 610 1 570 1 020 980 1 340 800 520 920 870 -67%
Sample farms 27 23 22 26 26 21 16 23 24
Av. Labour in AWU 1.02 1.31 1.47 1.20 1.32 1.33 1.28 1.61 1.51 48%
Family labour - % 89% 90% 84% 83% 92% 79% 87% 89% 83% -6%
Beef specialisation - % output 73% 70% 68% 72% 67% 66% 67% 69% 68% -6%
Average UAA - ha 45.0 70.2 89.6 83.9 85.7 90.4 77.6 94.1 95.1 111%
Forage crops - ha 31.1 45.7 59.0 59.9 60.6 56.9 56.4 59.1 54.9 76%
of which % permanent grassland 58% 66% 66% 68% 64% 79% 86% 71% 70% 22%
Stocking density - LU/ha 2.1 1.7 1.6 1.7 1.6 1.9 1.9 1.9 2.1 0%
Total beef cattle - LU 63 69 87 95 88 101 101 110 116 84%
Total LU on the farm 67 76 94 103 94 111 113 113 119 77%
Cattle (male & female) < 1 year sold - head 0 0 0 0 0 2 0 8 16 #DIV/0!
Male cattle 1-2 years sold - head 52 51 87 68 70 126 133 163 138 165%
Male cattle sold (incl. fem . < 1 year) - head 81 84 131 107 94 155 153 179 168 107%
Selling price male cattle - €/head 838 811 843 802 910 854 980 1 016 1 051 25%
Total cattle sold - head 108 112 138 126 122 160 153 185 170 58%
Total cattle sales - € 94 569 96 959 116 440 104 710 115 793 137 651 149 625 187 363 177 917 88%
Selling price cattle - €/head 878 865 846 828 948 859 980 1 013 1 047 19%
OUTPUT AND COSTS in €/Male cattle sold
Fatteners 2000 2001 2002 2003 2004 2005 2006 2008 2009 2009/ 20002010e 2011e 2010 /2009 2011 /2009
TOTAL BEEF OUTPUT 991 1 137 975 1 056 1 224 856 941 993 1 121 13% 1 115 1 270 -1% 13%
TOTAL BEEF COUPLED DP 191 291 275 318 343 0 0 0 0 -100% 0 0 0% 0%
of which suckler cow premium 0.0 0.1 0.0 1.0 0.5 0.0 0.0 0.0 0.0 #DIV/0! 0 0
of which special male premium 147 185 151 180 193 0 0 0 0 -100% 0 0
of which slaughter premium 22 52 75 78 83 0 0 0 0 -100% 0 0
of which extensification premium 21 53 44 59 66 0 0 0 0 -100% 0 0
of which other DP (incl. National DP) 0 1 4 0 0 0 0 0 0 -66% 0 0 0% 0%
Feed 219 219 185 223 225 191 185 261 279 28% 327 394 17% 41%
of which purchased feed 139 96 89 122 93 87 107 163 169 21% 209 252 24% 49%
of which home-grown feed 80 123 96 101 132 104 78 98 110 38% 118 143 7% 30%
Animal purchase 583 745 661 686 850 454 534 521 609 4% 649 716 7% 18%
Other specific costs 65 66 56 48 72 61 57 64 61 -6% 69 70 14% 15%
Specific costs 867 1 031 902 958 1 147 707 776 845 949 9% 1 045 1 181 10% 24%
Machinery and building upkeep 53 48 39 42 53 44 63 35 39 -27% 41 44 6% 12%
Energy (fuel, electricity) 25 36 22 23 28 26 24 33 31 24% 35 39 14% 29%
Contract w ork 40.7 41.9 41.7 51.3 41.6 29.7 24.1 25.0 28.2 -31% 30 31 6% 10%
Taxes (exc. milk levy) 6 4 3 4 5 3 2 2 2 -65% 2 2 3% 8%
Other direct inputs (incl. w ater, insurance on farm buildings)
40 54 36 50 62 46 54 43 38-6%
40 41 6% 10%
Non specific costs 165 183 142 170 190 149 167 138 137 -16% 148 158 8% 15%
Total operating costs 1 031 1 214 1 043 1 127 1 337 855 942 983 1 086 5% 1 194 1 339 10% 23%
Gross margin (over operating costs) -41 -77 -68 -71 -113 1 -1 10 35 -186% -78 -69 -324% -298%
Gross margin (over operating costs) w ith CP* 150 214 206 247 229 1 -1 10 35 -77% -78 -69 -323% -297%
* CP: coupled payments e: estimate
Depreciation 78 93 70 82 87 54 79 81 84 7%
Wages 15 26 25 32 17 25 15 15 19 27%
Rent 8 30 29 31 15 20 5 8 13 63%
Interest 25 33 15 12 20 18 15 16 4 -84%
External factors 48 89 70 75 52 62 36 40 36 -25%
Net margin (before own factors) -167 -259 -207 -229 -252 -116 -116 -110 -85 -49%
Net margin (before own factors) with CP* 24 32 67 89 91 -116 -116 -110 -85 -456%* CP: coupled payments
Family labour costs 180 230 145 144 197 123 127 127 117 -35%
Ow n capital unpaid cost 84 108 87 99 123 53 54 34 48 -43%
Imputed fam ily factors 264 339 233 243 320 176 181 161 165 -37%
Total economic costs 1 421 1 735 1 415 1 528 1 796 1 148 1 238 1 265 1 371 -4%
Net economic margin (after own factors) -431 -598 -440 -472 -572 -292 -297 -272 -250 -42%
Net economic margin (after own factors) with CP* -240 -307 -165 -154 -229 -292 -297 -272 -250 4%
ASSETS in €/Male cattle sold (nominal)
Fatteners 2000 2001 2002 2003 2004 2005 2006 2008 2009 2009/ 2000
Fixed assets 4 602 6 244 4 999 5 124 5 588 4 793 5 385 7 620 7 020 53%
Current assets 865 1 315 1 091 1 378 1 295 1 083 1 084 935 1 174 36%
Total assets 5 467 7 559 6 090 6 501 6 883 5 876 6 469 8 556 8 194 50%
INCOME per AWU in €/AWU (nominal)
Fatteners 2000 2001 2002 2003 2004 2005 2006 2008 2009 2009/ 2000Total output 46 226 39 113 48 871 53 026 46 157 72 504 72 377 82 620 90 010 95%
Intermediate consumptions 45 677 42 711 50 023 54 339 49 144 65 516 65 702 73 239 77 474 70%
Balance of subsidies and taxes 18 936 25 301 30 896 36 215 32 926 40 868 38 756 22 735 27 380 45%
of w hich LFA/AWU 0 15 55 0 89 201 234 14 41 #DIV/0!
of w hich environmental/AWU 204 883 450 1 253 2 055 3 194 2 702 2 101 3 027 1381%
Gross Farm Income (GFI) 19 484 21 703 29 744 34 902 29 938 47 856 45 430 32 116 39 917 105%
Depreciation 8 442 8 851 8 878 10 186 9 418 9 638 13 763 12 946 14 155 68%
Farm Net Value Added (FNVA) 11 043 12 852 20 866 24 716 20 520 38 218 31 667 19 170 25 761 133%
Wages 1 727 2 248 3 231 3 573 1 510 4 703 2 364 2 562 3 619 110%
Rent 1 008 2 517 3 762 3 349 1 627 3 889 1 055 1 606 2 566 155%
Interest 2 558 2 990 2 148 1 429 2 094 3 425 2 379 2 831 643 -75%
External factors 5 292 7 755 9 141 8 352 5 231 12 017 5 799 6 999 6 828 29%
Balance of subsidies and taxes on investment 0 54 79 139 76 385 3 281 258 736 #DIV/0!
Farm net income (FNI) 5 750 5 151 11 805 16 503 15 365 26 586 29 149 12 429 19 669 242%
Family labour costs 19 234 21 342 19 846 18 153 21 575 19 648 22 012 20 772 19 360 1%
Ow n capital unpaid cost 9 716 10 480 11 533 12 923 13 871 8 714 9 254 5 627 8 196 -16%
Imputed family factors 28 950 31 822 31 379 31 076 35 446 28 362 31 266 26 399 27 556 -5%
Family farms only in EUR/FWU (nominal)
Ow n capital unpaid cost 10 830 11 578 13 798 15 594 15 172 10 989 10 672 6 373 9 816 -9%
Remuneration of Family Labour (RFL) -5 297 -5 887 325 4 319 1 634 22 539 22 944 7 704 13 741 -359%

EU beef farms report 2012
110
ANNEX VII NOMENCLATURE TABLE
Table 30 Countries and their abbreviations
English name FADN name ISO 3166
symbolEU name
Austria OST AT AT
Belgium BEL BE BE
Bulgaria BGR BG BG
Cyprus CYP CY CY
Czech Republic CZE CZ CZ
Denmark DAN DK DK
Estonia EST EE EE
Finland SUO FI FI
France FRA FR FR
Germany DEU DE DE
Greece ELL GR EL
Hungary HUN HU HU
Ireland IRE IE IE
Italy ITA IT IT
Latvia LVA LV LV
Lithuania LTU LT LT
Luxemburg LUX LU LU
Malta MLT MT MT
Netherlands NED NL NL
Poland POL PL PL
Portugal POR PT PT
Romania ROU RO RO
Slovakia SVK SK SK
Slovenia SVN SI SI
Spain ESP ES ES
Sweden SVE SE SE
United Kingdom UKI GB UK

European Commission
EU beef farms – Report 2012based on FADN
Disclaimer:This publication does not necessarily reflect the official opinion of the European Union. Neither the European Union institutions and bodies nor any person acting on their behalf may be held responsible for the use which may be made of the information contained therein.
Contact:European CommissionDG Agriculture & Rural Development,Microeconomic analysis of EU agricultural holdingsE-mail: [email protected]: http://ec.europa.eu/agriculture/rica/index.cfm

This report provides an overview of the EU beef farms based on the latest data available from the Farm Accountancy Data Network (FADN). It analyses the trend in income, costs of production and beef margin until 2009 and provides estimates of the gross margin until 2011. .
European CommissionDirectorate-General for Agriculture and Rural Development
http://ec.europa.eu/agriculture