eu10 regular economic report april 2011- presentation
DESCRIPTION
EU10 Regular Economic Report April 2011- PresentationTRANSCRIPT

World Bank
EU10 Regular Economic Report
Recovery
and
BeyondBucharest, 19 April 2011

MESSAGES
• With the recovery strengthening, output has reached pre-crisis levels in early 2011 and growth is set to get close to its potential in 2012
• Yet, weak demand and high unemployment could undermine the recovery
• Sustained growth and job creation require stable financial markets, sustainable fiscal balances and structural reforms

Recovery Strengthening

Growth is improving …
Source: Eurostat, Central Statistical Offices, World Bank staff calculations
Year-on-year GDP growth in EU10, EU15, Poland and Romania
-8
-6
-4
-2
0
2
4
6
8
10
EU15 EU10 PL RO
2008
2009
2010

… with rising momentum …
Source: Eurostat, Central Statistical Offices, World Bank staff calculations
Quarter-on-quarter GDP growth in EU10, EU15, Poland and Romania
-1
-0.5
0
0.5
1
1.5
EU15 EU10 PL RO
1Q 10 2Q 10 3Q 10 4Q 10
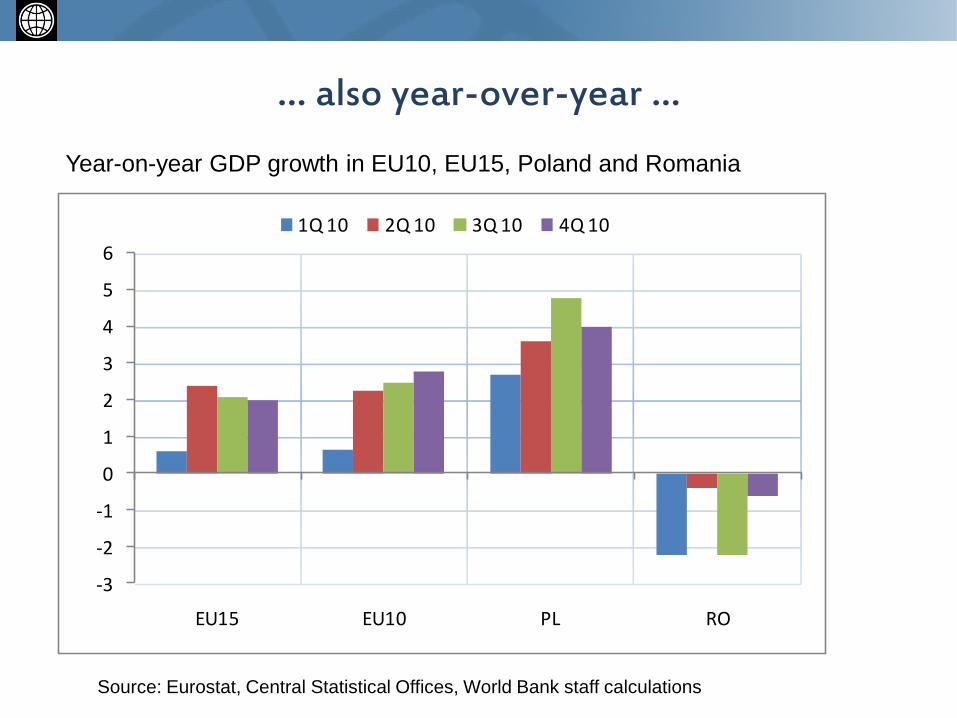
… also year-over-year …
Source: Eurostat, Central Statistical Offices, World Bank staff calculations
Year-on-year GDP growth in EU10, EU15, Poland and Romania
-3
-2
-1
0
1
2
3
4
5
6
EU15 EU10 PL RO
1Q 10 2Q 10 3Q 10 4Q 10

… aided by restocking …
Source: Eurostat, World Bank staff calculations
Contribution to GDP growth in the EU10, percent, year-on-year,
not seasonally adjusted
-10
-8
-6
-4
-2
0
2
4
6
8
4Q
07
1Q
08
2Q
08
3Q
08
4Q
08
1Q
09
2Q
09
3Q
09
4Q
09
1Q
10
2Q
10
3Q
10
4Q
10
Final consumption GFCF Changes in inventories Net exports Other GDP

… lifting growth close to its potential …
Source: World Bank
Projected 2010 and 2012 GDP growth rates, percent

… across the region …
Source: World Bank
Forecasted GDP growth rates, percent
-2
-1
0
1
2
3
4
5
EU15 EU10 PL RO
2010 2011 2012

… and catch-up to pre-crisis levels …
Source: World Bank staff calculations
Level output in 2010, 2011 and 2012 as percent of the pre-crisis peak output
97 99
7884 86
92 93 94 9598 99
106
98102
81
8790
93 95 96 97100
103
110
100
106
84
9192
97 9799 100
103
108
114
70
80
90
100
110
120
EU15 EU10 LV EE LT RO SI HU BG CZ SK PL
Output
2010 2011 2012

… as growth advantage over EU10 has returned
Source: Eurostat, World Bank
EU10 and EU15 projected growth, percent, year-over-year
-8
-6
-4
-2
0
2
4
6
8
10
2005 2006 2007 2008 2009 2010 2011 2012
EU15 EU10 PL RO

Weak Demand
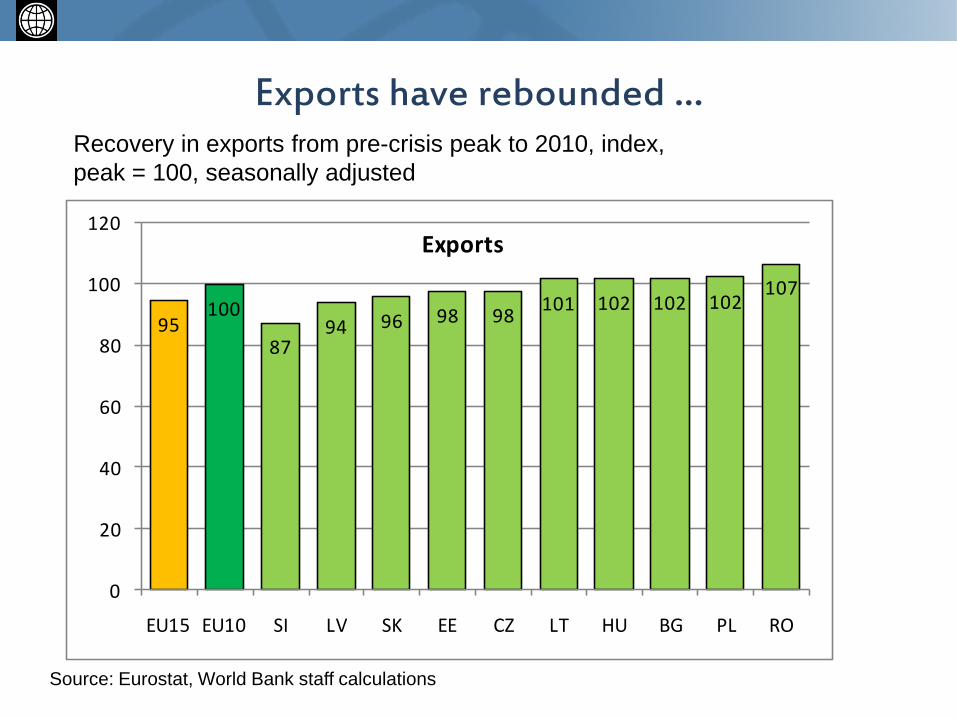
Exports have rebounded …
Source: Eurostat, World Bank staff calculations
Recovery in exports from pre-crisis peak to 2010, index,
peak = 100, seasonally adjusted
95100
8794 96 98 98
101 102 102 102107
0
20
40
60
80
100
120
EU15 EU10 SI LV SK EE CZ LT HU BG PL RO
Exports

… but consumption remains weak in some countries …
Source: Eurostat, World Bank staff calculations
Recovery in final consumption from pre-crisis peak to 2010,
index, peak = 100, seasonally adjusted
100 98
73
82 8286
91 91
101 101 102105
0
20
40
60
80
100
120
EU15 EU10 LV EE LT RO HU BG SI SK CZ PL
Consumption

… and investment weak across the region …
Source: Eurostat, World Bank staff calculations
Recovery in gross fixed investment from pre-crisis peak to 2010,
index, peak = 100, seasonally adjusted
86 84
4451
5765
6973
8187 89
97
0
20
40
60
80
100
120
EU15 EU10 LV EE LT RO BG SI SK HU CZ PL
Investment

… as credit growth to enterprises remains weak
Source: ECB, World Bank staff calculations
Contribution to real credit growth from Oct 2008 to January 2011
-20
-15
-10
-5
0
5
10
15
EU15 EU10 SK CZ PL SI BG EE LV HU LT RO
Credit to HHS Credit to enterprises Credit growth

High Unemployment

Recovery is still jobless …
Source: Eurostat, World Bank staff calculation
Notes: Pre-crisis refers to lowest unemployment rate in period 2007-2008, crisis peak refers to
highest unemployment rate in period January 2008 to current, current is February 2011.
Unemployment rates in EU10 and EU15, pre-crisis, crisis peak and latest, percent
6
7
8
9
10
11
Pre-crisis Crisis peak Current
EU15
EU10

… as unemployment declined only in few countries …
Source: Eurostat, World Bank staff calculation
Notes: Pre-crisis refers to lowest unemployment rate in period 2007-2008, crisis peak refers to
highest unemployment rate in period January 2008 to current, current is February 2011.
Unemployment rates in EU10 and EU15, pre-crisis, crisis peak and latest, percent
0
5
10
15
20
EU15 EU10 CZ RO SI PL BG HU SK EE LV LT
Pre-crisis Crisis peak Current

… and remains high for the young & low-skilled and often of long duration …
Source: Eurostat, World Bank staff calculation
Notes: LTU refers to 3Q 2010.
Unemployment rates in EU10 countries in 4Q 2010, percent
0
5
10
15
20
25
30
35
40
45
EU15 EU10 CZ RO SI PL HU BG SK EE LV LT
total young low-skilled long-term

… even though labor costs are declining in most countries …Real unit labor cost in selected EU10 countries in 4Q 2010, total economy,
annual rate of change, not seasonally adjusted, percent
Source: Eurostat, World Bank staff calculations.
Notes: Data for Poland refer to 3Q 2010.
-10
-8
-6
-4
-2
0
2
4
6
EU15 EU10 LT RO BG EE HU LV SK SI CZ PL
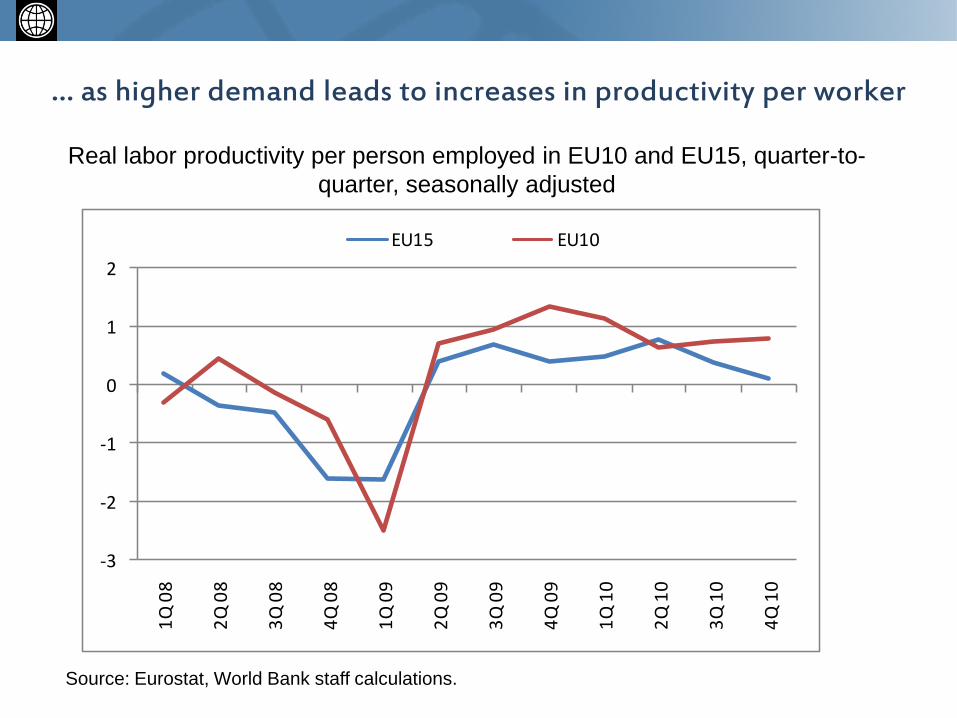
… as higher demand leads to increases in productivity per worker
Real labor productivity per person employed in EU10 and EU15, quarter-to-
quarter, seasonally adjusted
Source: Eurostat, World Bank staff calculations.
-3
-2
-1
0
1
2
1Q
08
2Q
08
3Q
08
4Q
08
1Q
09
2Q
09
3Q
09
4Q
09
1Q
10
2Q
10
3Q
10
4Q
10
EU15 EU10

Policies:
Stable Financial Markets
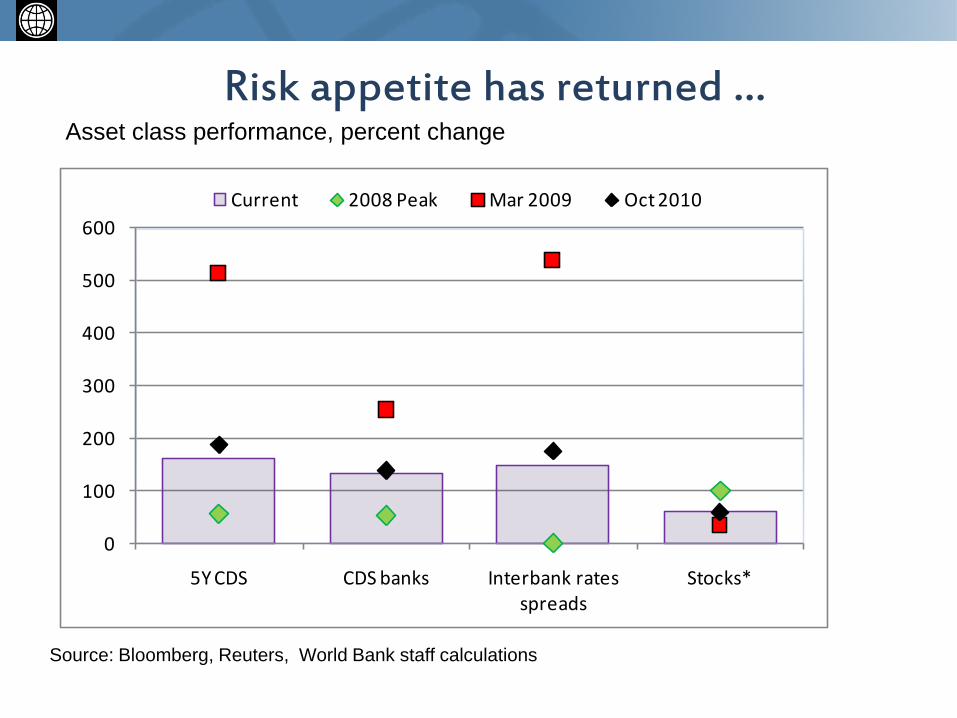
Risk appetite has returned …
Source: Bloomberg, Reuters, World Bank staff calculations
Asset class performance, percent change
0
100
200
300
400
500
600
5Y CDS CDS banks Interbank rates spreads
Stocks*
Current 2008 Peak Mar 2009 Oct 2010
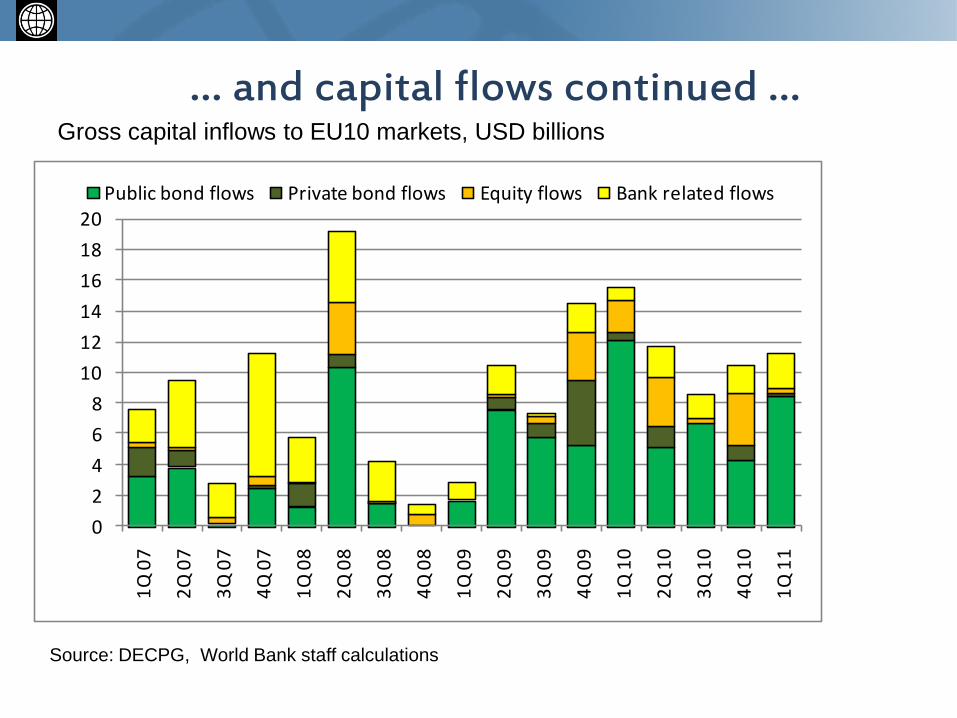
… and capital flows continued …
Source: DECPG, World Bank staff calculations
Gross capital inflows to EU10 markets, USD billions
0
2
4
6
8
10
12
14
16
18
20
1Q
07
2Q
07
3Q
07
4Q
07
1Q
08
2Q
08
3Q
08
4Q
08
1Q
09
2Q
09
3Q
09
4Q
09
1Q
10
2Q
10
3Q
10
4Q
10
1Q
11
Public bond flows Private bond flows Equity flows Bank related flows

… at moderate rate …
Gross capital flows EU10 versus other external markets
Source: GEM database, World Bank staff calculations
0
20
40
60
80
100
120
140
160
180
East
Asi
a an
d
Pac
ific
Lati
n A
me
rica
an
d C
arri
be
an
Mid
dle
Eas
t an
d N
ort
h
Afr
ica
Sou
th A
sia
Sub
-Sah
aran
A
fric
a
Euro
pe
an
d
Ce
ntr
al A
sia*
EU1
0
2008 2009 2010

… leaving exchange rates competitive …
US Dollar exchange rates EU10 versus other external markets, index, 2008=100
Source: GEM database, World Bank staff calculations
60
70
80
90
100
110
120
Ukr
ain
e
Ro
man
ia
Turk
ey
Po
lan
d
Ru
ssia
Hu
nga
ry
Me
xico
Cze
ch R
ep
Ind
ia
Taiw
an
Ind
on
esi
a
Thai
lan
d
Mal
aysi
a
Bra
zil
Sin
gap
ore
Sou
th A
fric
a
2009 2010 2011 pre-crisis=100

… and stock markets below or close to pre-crisis peaks …
Stock markets in EU10 versus other emerging markets, index, 2008=100
Source: GEM database, World Bank staff calculations
0
20
40
60
80
100
120
140
160
180
Ro
man
ia
Cze
ch R
ep
Ru
ssia
Ukr
ain
e
Hu
nga
ry
Bra
zil
Po
lan
d
Ch
ina
Sin
gap
ore
Sou
th A
fric
a
Ind
ia
Mal
aysi
a
Me
xico
Thai
lan
d
Ind
on
esi
a
Turk
ey
2009 2010 2011 pre-crisis =100

… but spillovers from sovereign debt issues in parts of the euro area are a concern …
EU10 government bonds’ yields correlations with Greek, Irish and Portuguese yields
Source: Reuters, Bloomberg, World Bank staff calculations
Notes: 3-month correlations
-1.00
-0.80
-0.60
-0.40
-0.20
0.00
0.20
0.40
0.60
"Greece I" Nov 2009
"Greece II" Apr 2010
"Ireland" Nov 2010
"Portugal" Feb 2011

… as are funding pressures of banks
Non-performing loans of banks in EU10 countries, percent of loan portfolio
Source: Central Banks, World Bank staff calculations.
Notes: Definition of non-performing loans may differ from one country to the next.
0
2
4
6
8
10
12
14
16
18
20
1Q
08
2Q
08
3Q
08
4Q
08
1Q
09
2Q
09
3Q
09
4Q
09
1Q
10
2Q
10
3Q
10
4Q
10
CZ
EE
LV
BG
PL
RO
SK
HU

Policies:
Sustainable Fiscal Balances
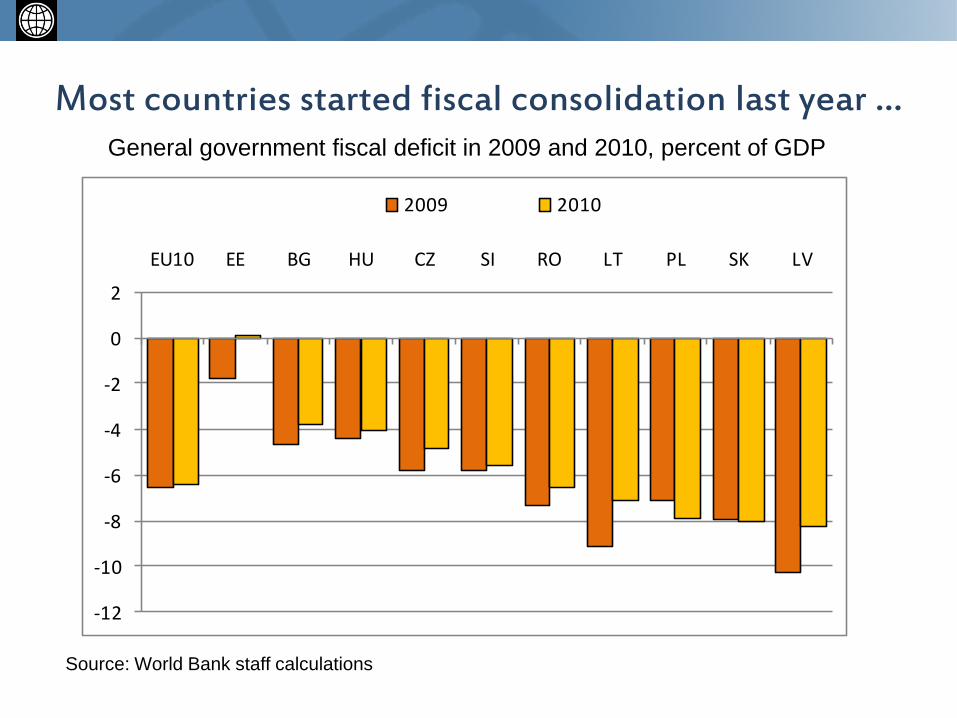
Most countries started fiscal consolidation last year … General government fiscal deficit in 2009 and 2010, percent of GDP
Source: World Bank staff calculations
-12
-10
-8
-6
-4
-2
0
2
EU10 EE BG HU CZ SI RO LT PL SK LV
2009 2010

… helping to improve market risk perception …
Source: Bloomberg, Eurostat, World Bank staff calculations
Reduction in CDS spreads vs. reduction in general government fiscal deficit in 2009/10
BGCZ
EELVLT
HU
PL
RO
SI
SK
-1.0
-0.5
0.0
0.5
1.0
1.5
2.0
2.5
0 200 400 600 800 1000
Re
du
ctio
n in
fis
cal
de
fici
t 2
01
0/0
9
Reduction in CDS spreads Mar 2009 to Mar 2011

… and to moderate increases in government bond yields …
Source: Bloomberg, Eurostat, World Bank staff calculations
EU10 government bond yields
0
2
4
6
8
10
12
14
2008 Peak Mar 2009 Oct 2010 Current
SK CZ PL RO HU

… and envision continued adjustments in the next years … General government fiscal deficit in 2010 to 2012, percent of GDP
Source: World Bank staff calculations
-10
-8
-6
-4
-2
0
2
4
6
EU10 HU SK LT SI CZ PL RO LV BG EE
2010 2011 2012

Decomposition of general government fiscal deficit reduction from 2010 to
2012, percent of GDP
Source: World Bank staff calculations
… mostly on the expenditure side …
-4
-3
-2
-1
0
1
2
3
4
5
6
7
EU10 LV PL RO SK LT BG SI CZ HU EE
Expenditure reduction Revenue increase Reduction in deficit

General government public debt in 2010 to 2012, percent of GDP
Source: World Bank staff calculations
… also to limit further increases in public debt
0
10
20
30
40
50
60
70
80
EU10 EE BG RO LT CZ LV SK SI PL HU
2010 2011 2012

Policies:
Structural
Reforms

Growth helps to bolster financial markets …
Source: Bloomberg, Eurostat, World Bank staff calculations
CDS spreads vs. GDP growth in 2010
BG
CZ
EE
LV
LT HU
PL
RO
SI
SK
-2
-1
0
1
2
3
4
5
0 100 200 300 400
GD
P g
row
th in
20
10
CDS spreads in March 2011

… but will require productivity improvements
Source: Eurostat, World Bank staff calculations
Real labor productivity per hour worked in 4Q 2010, Euro per hour worked

THANK YOU
For more information visit:
www.worldbank.org/eca/eu10rer

Inflation pressures
HICP overall and core inflation in EU10 countries and EU15, year-over-year
Source: Eurostat, World Bank staff calculations
Notes: Core inflation is overall index excluding energy and unprocessed food
-4
0
4
8
12
16
EU15 EU10 CZ SI LT PL SK LV HU BG EE RO
latest Jan-08 Jan-10 Oct-10
-4
0
4
8
12
16
EU15 EU10 SI CZ LT LV SK HU PL BG EE RO
latest Jan-08 Jan-10 Oct-10

Actual output getting close to potential output in some countries
Source: EC Ameco database
Gap between actual and potential output in 2010

Monetary policy has started to tighten in some countries
Source: Central Banks
Key monetary policy interest rates
0
2
4
6
8
10
12Ja
n-0
9
Mar
-09
May
-09
Jul-
09
Sep
-09
No
v-0
9
Jan
-10
Mar
-10
May
-10
Jul-
10
Sep
-10
No
v-1
0
Jan
-11
Mar
-11
CZ HU PL RO EURO