eu2020 targets and measuring development – … 2010/lautar... · 2. flexicurity and social...
TRANSCRIPT

EU2020 TARGETS AND EU2020 TARGETS AND
MEASURING MEASURING
DEVELOPMENTDEVELOPMENT ––
Slovenian approachSlovenian approach
Jana Poljak, mag. Katja Lautar

A. Where do we want to go?
B. Current situation?
C. Recommendations to Slovenia
D. Development planning and EU 2020 targets
E. Targets and indicators
2

A. EU2020 A. EU2020 -- Where do we want to go Where do we want to go
Fiscal
surveillance
Macro-economic
surveillance
Thematic
surveillance
Europe 2020 Integrated Guidelines (IG)
EUROPE 2020 FIVE HEADLINE TARGETS
Stability and
Growth Pact
National Reform
Programmes
Stability and Convergence
Programmes
Commission’s Annual Growth Survey
EU annual policy guidance and recommendations
EU flagship initiatives and levers
National level
EU level
3

EU tools in support of Europe 2020 EU tools in support of Europe 2020
Single
market
relaunch
Trade and
external
policies
EU
financial
support
EU levers for growth and jobs
EU flagship initiatives
EU monitoring and guidance
Macro, thematic
and fiscal
surveillance
Annual Growth Survey
Annual
policy
guidance
Innovation
Union (Oct. 2010)
New Skills
and Jobs(Nov. 2010)
Digital
Agenda(May 2010)
Youth
on the Move(Sept. 2010)
New
Industrial
Policy (Oct. 2010)
Platform against
Poverty (Dec. 2010)
Resource
Efficiency(Early 2011)
4
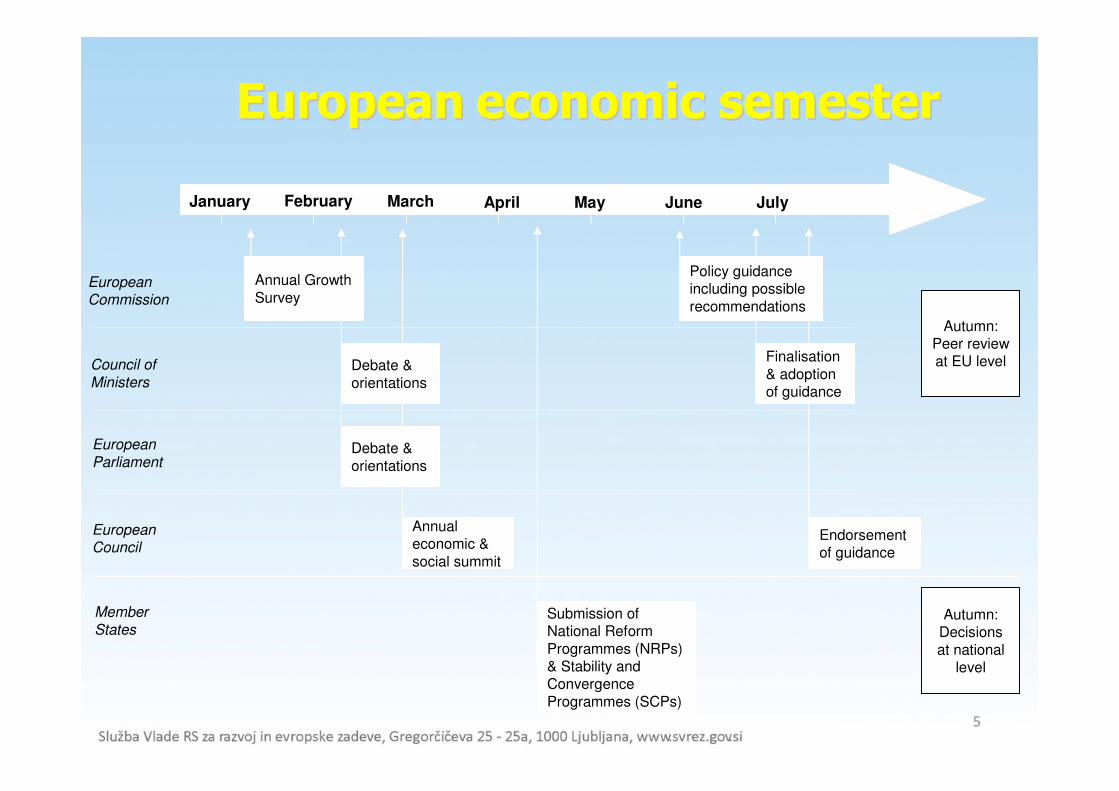
Council of
Ministers
European Commission
European
Parliament
European Council
Annual economic &
social summit
January March AprilFebruary May June July
Submission of National Reform
Programmes (NRPs) & Stability and Convergence
Programmes (SCPs)
Autumn:Peer review at EU level
Autumn:Decisions
at national level
Debate &
orientations
Endorsement of guidance
Finalisation
& adoption of guidance
Member
States
Annual Growth
Survey
Policy guidance including possible
recommendations
Debate &
orientations
EuropeanEuropean economic semester economic semester
5

6
Ambitious reform packages can Ambitious reform packages can
generate significant gainsgenerate significant gains
• GDP could increase by 3.5% in a medium scenario compared with unchanged policies
(Source: Commission Economic Papers 421, Quantifying the potential macroeconomic
effects of the Europe 2020 strategy, stylised scenarios)
• The magnitude of increase depends critically on ambition of reform implementation:
we should be able to raise our average growth rate by about 1/3 over the period
2010-20
• Higher growth goes hand in hand with higher productivity

Key reform areasKey reform areas(from the EPC/EFC report on macro(from the EPC/EFC report on macro--structural bottlenecks)structural bottlenecks)
Bottleneck Policy area Rational for frontloaded action
Fiscal policy and long-term sustainability
Pension reformsDirectly improve long-term sustainability and confidence through higher tax revenues and/orlower public spending in future
CompetitivenessReform of wage bargaining
systems
Contribute to swift recovery through restoring and maintaining of cost competitiveness. In euro area
countries there are added rationale for avoiding imbalances due to monetary union.
Labour utilisation
Reforms of employment protection systems Can accelerate growth by removing impediments to
job creation and is key to ensure that fiscal consolidation does not lead to further increases in unemployment
Incentives to work
Enhancing ALMPs and public
employment services, training
Productivity/total factor productivity
Ensuring sectoral competition and market liberalisation Reduce costs for businesses and contribute to
improving economic activity without burden on public financesImproving business
environment
7

8
B. B. Current situationCurrent situation??
Macroeconomic conditions : Corporate balance sheet adjustment – what should come
next?
Source: Commission Services
Net lending (+) borrowing (-) of institutional sectors
-12
0
19
95
19
96
19
97
19
98
19
99
20
00
20
01
20
02
20
03
20
04
20
05
20
06
20
07
20
08
20
09
% of GDP
General government
Households & NPISH
Corporations
Net lending (+) or net borrowing (-) total economy

9
Macroeconomic conditions: how can the public Macroeconomic conditions: how can the public
finances be set on a sustainable trajectory?finances be set on a sustainable trajectory?
Change in the public pension/GDP ratio over 2007-2060 in pps
Source: Economic Policy Committee
and Commission services

10
Growth Drivers – Knowledge base
TFP growth contributions
-1
0
1
2
3
1996 1997 1998 1999 2000 2001 2002 2003 2004 2005 2006 2007 2008 2009
%
SI SK CZ HU
Source: Commission
services
11
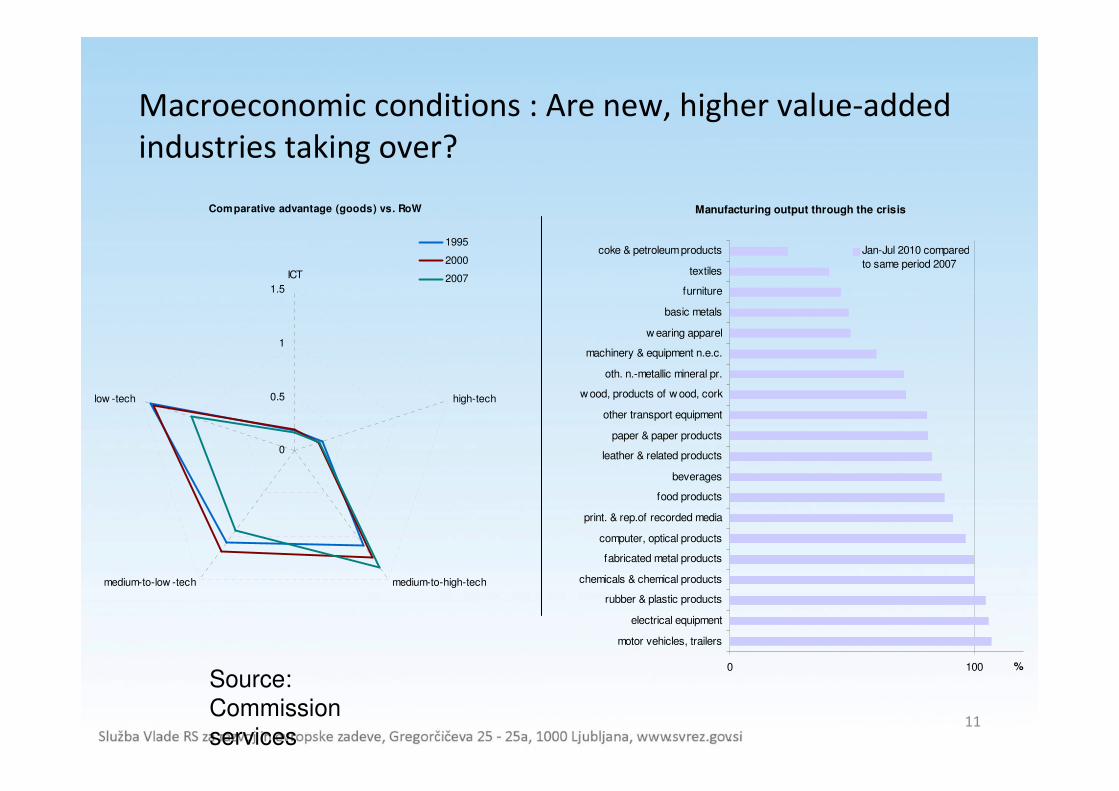
Macroeconomic conditions : Are new, higher value-added
industries taking over?
Manufacturing output through the crisis
0 100
motor vehicles, trailers
electrical equipment
rubber & plastic products
chemicals & chemical products
fabricated metal products
computer, optical products
print. & rep.of recorded media
food products
beverages
leather & related products
paper & paper products
other transport equipment
w ood, products of w ood, cork
oth. n.-metallic mineral pr.
machinery & equipment n.e.c.
w earing apparel
basic metals
furniture
textiles
coke & petroleum products
%
Jan-Jul 2010 compared
to same period 2007
Comparative advantage (goods) vs. RoW
0
0.5
1
1.5
ICT
high-tech
medium-to-high-techmedium-to-low -tech
low -tech
1995
2000
2007
Source:
Commission
services

Growth Drivers – Business environment
12
45th out of 139 countries in WEF Global Competitiveness index
The most problematic factors for doing business
Source: World Economic Forum
13
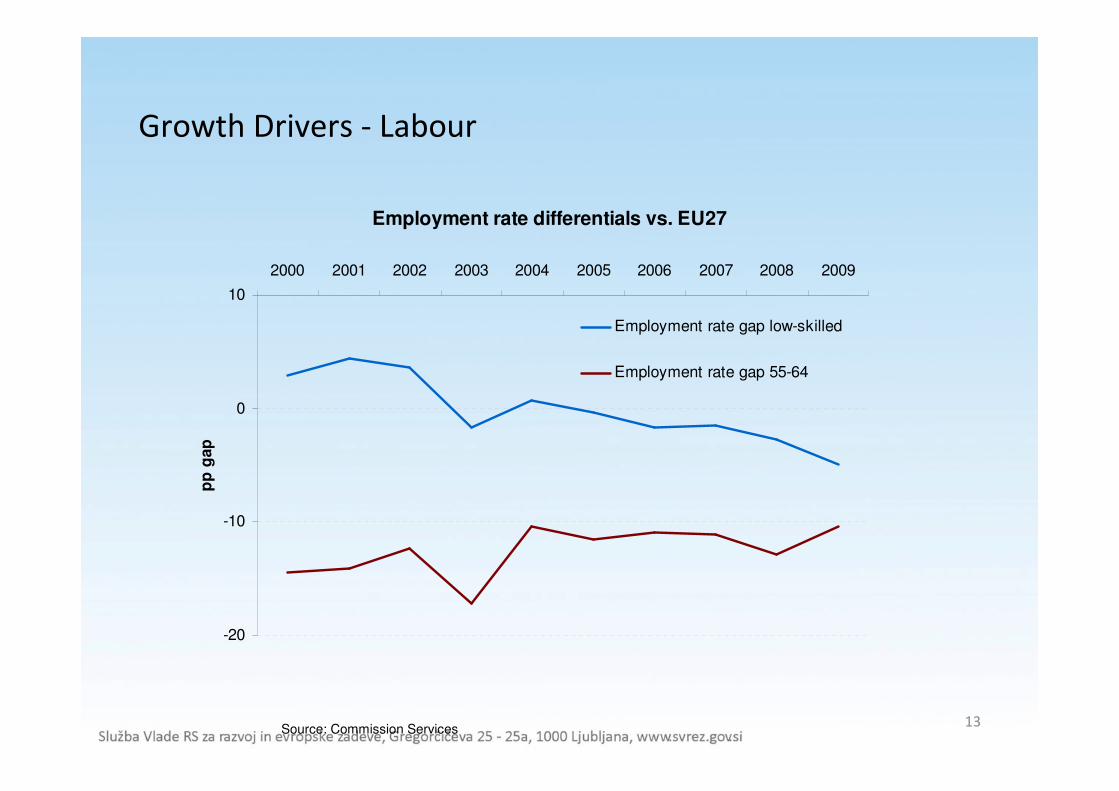
Growth Drivers - Labour
Source: Commission Services
Employment rate differentials vs. EU27
-20
-10
0
10
2000 2001 2002 2003 2004 2005 2006 2007 2008 2009
pp
gap
Employment rate gap low-skilled
Employment rate gap 55-64

14
EU
Pro
duct
mark
et
OECD
Areas: sector-specific regulation (eg telecoms &
energy); business environment; regulatory barriers to entrepreneurship
Areas: low innovation capacity
Labour
mark
et
Kno
wle
dg
e &
inno
vation
C. C. Recent policy recommendationsRecent policy recommendations
Areas: specific labour supply measures for older
workers; making work pay
Enhancing flexibility while tackling segmentation; ensuring better alignment of wages & productivity
Increase competition in the service sector and address other weaknesses in the business environment
Promote innovation capacity & increase overall R&D
investment; refocus human capital investment, especially in tertiary education, on higher value-added activities
(in addition to above): Reform pension system
Increase the powers of the Competition Protection Office
Reduce barriers to entrepreneurship and improve innovation policies
Improve governance of state-owned enterprises before eventual privatisation
Improve expenditure efficiency and structural reforms, especially further
pension reform
Increase labour force participation while reducing labour market dualism
Raise overall R&D spending while stimulating private R&D expenditure
Strengthening the technology-oriented component of public R&D outlays

D. WHY CHANGESD. WHY CHANGES
• The economic and financial crisis brought to the process of post-crisis economy
adjustment measures
• State guaranties
• gap between development/strategic objectives and limited public finances,
• need for restructure expenditures according to strategic priorities
(demographic changes, climate change),
• need to improve efficiency and effectiveness of governmental programmes
(policies),
• goals from different policies in many cases unsystematic and are not related to
the policies.
15
16
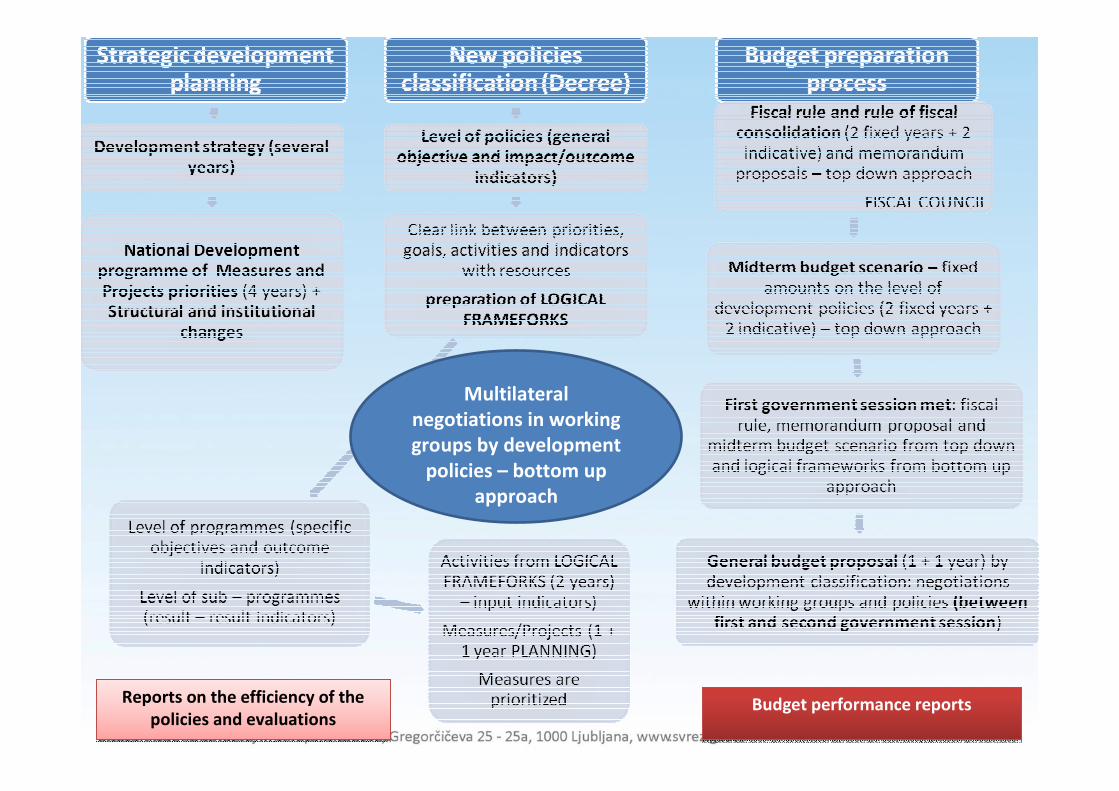
Multilateral
negotiations in working
groups by development
policies – bottom up
approach
Reports on the efficiency of the
policies and evaluations
Reports on the efficiency of the
policies and evaluationsBudget performance reports Budget performance reports

Vicious circle of indebtedness
17
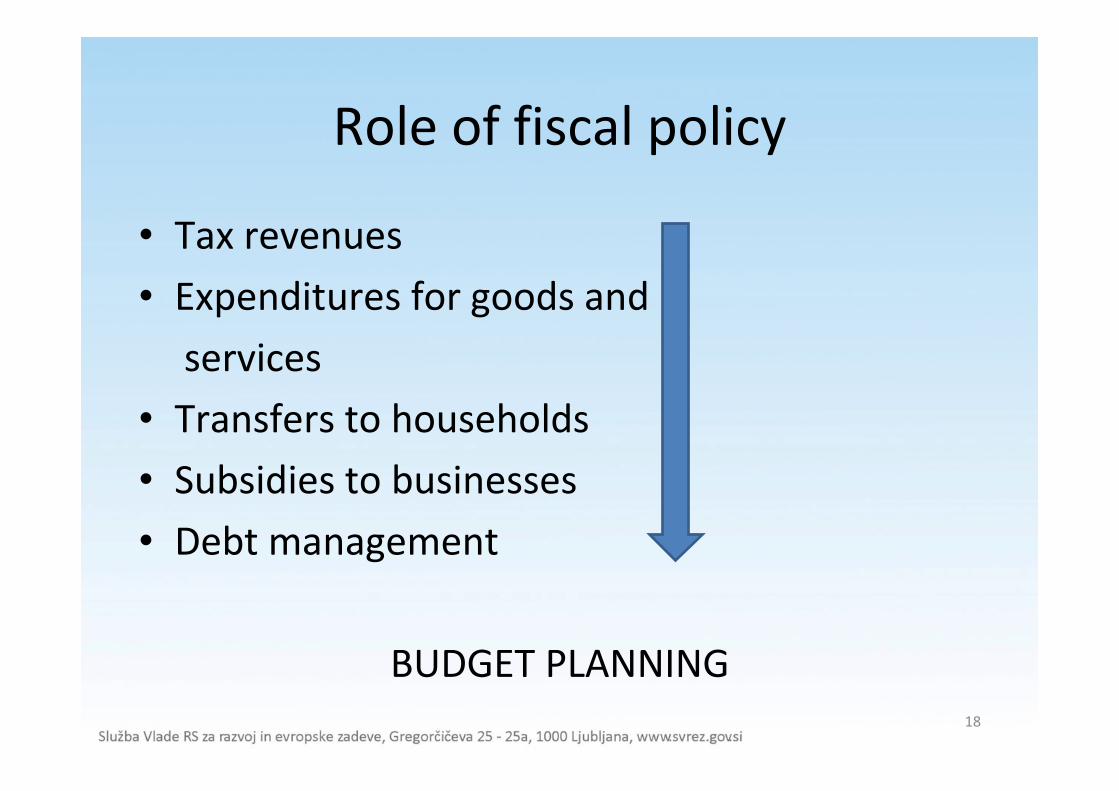
Role of fiscal policy
• Tax revenues
• Expenditures for goods and
services
• Transfers to households
• Subsidies to businesses
• Debt management
BUDGET PLANNING
18

Roles and responsibilitiesGovernment
/SVREZ
• Fiscal policy
goals
• Strategic
priorities
• Ceiling on
expenditure
(policy level)
• Fiscal policy
goals
• Strategic
priorities
• Ceiling on
expenditure
(policy level)
Ministry of Finance
• Estimates and
calculations
• Scenarios
• Possible
measures
• Management of
budget
preparation
• Estimates and
calculations
• Scenarios
• Possible
measures
• Management of
budget
preparation
Other Ministries
• Sectoral
strategies and
objectives
• Formulation of
policies
• Investment
plans and
measures
• Sectoral
strategies and
objectives
• Formulation of
policies
• Investment
plans and
measures
19
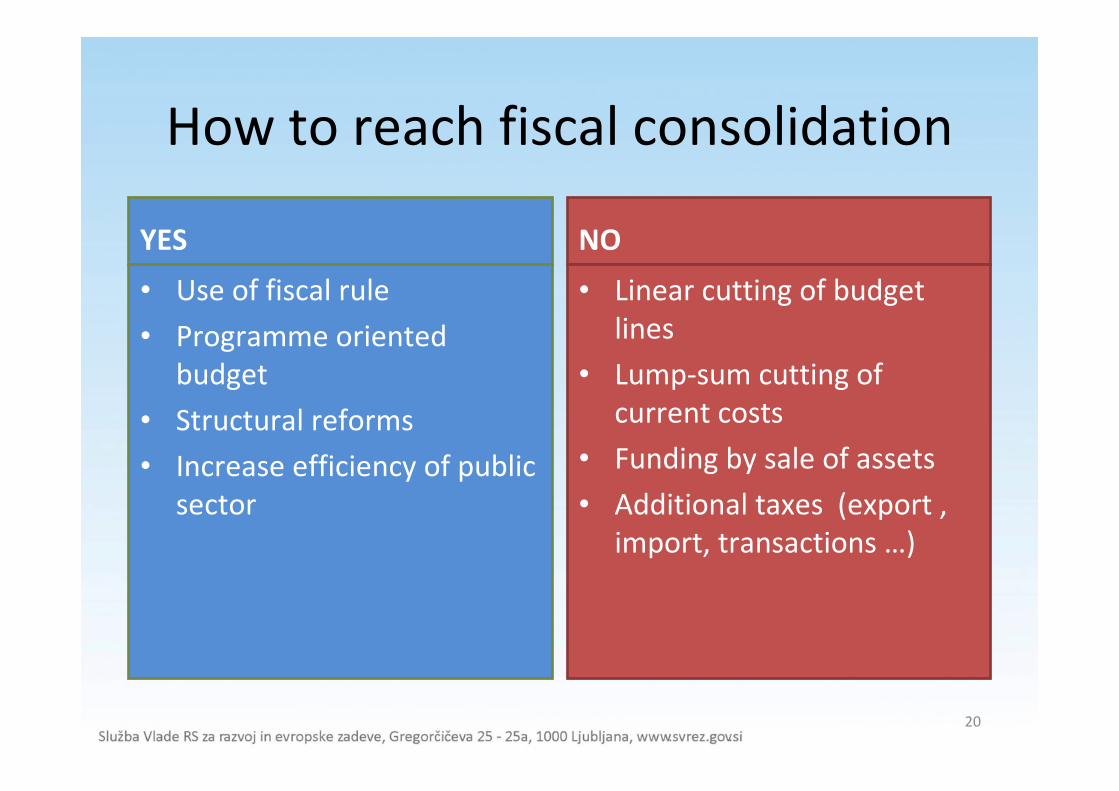
How to reach fiscal consolidation
YES
• Use of fiscal rule
• Programme oriented
budget
• Structural reforms
• Increase efficiency of public
sector
NO
• Linear cutting of budget
lines
• Lump-sum cutting of
current costs
• Funding by sale of assets
• Additional taxes (export ,
import, transactions …)
20

SUSTAINABLE ECONOMIC GROWTH
ECONOMIC POLICY
MEASURES
STRUCTURAL
MEASURES
INSTITUTIONAL
ADJUSTMENTS
EXIT STRATEGY
The Concept of the Exit Strategy
21
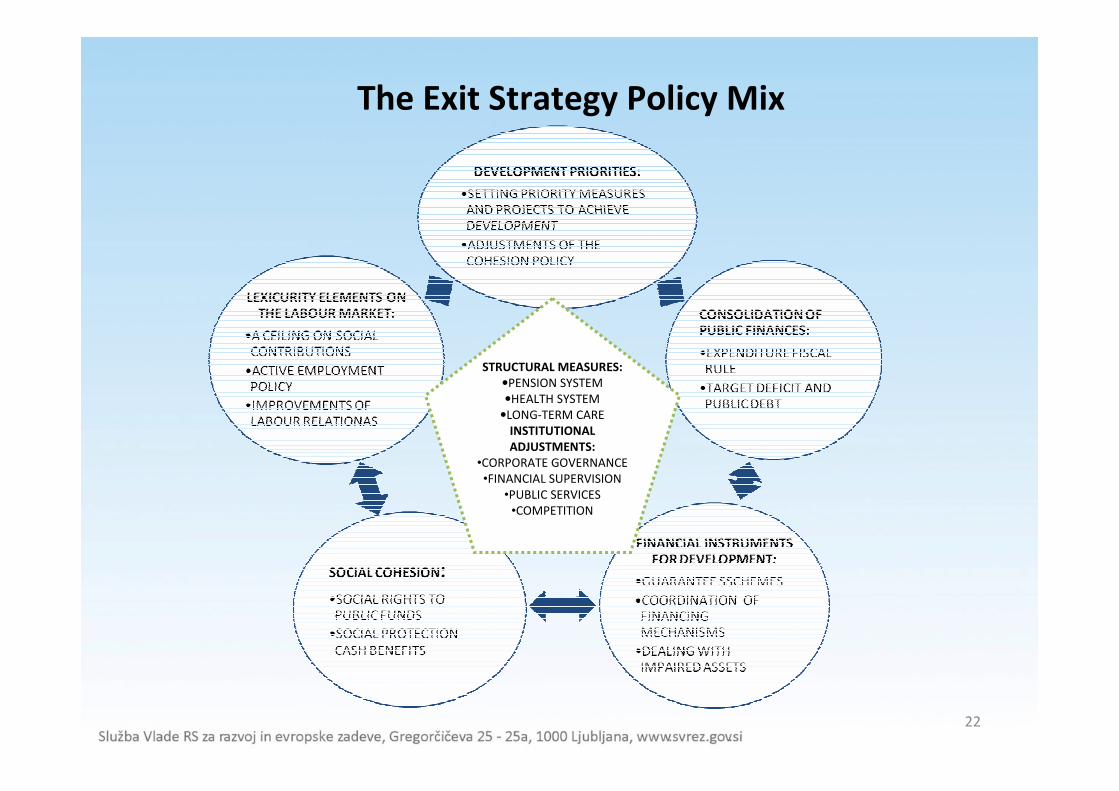
The Exit Strategy Policy Mix
STRUCTURAL MEASURES:
•PENSION SYSTEM
•HEALTH SYSTEM
•LONG-TERM CARE
INSTITUTIONAL
ADJUSTMENTS:
•CORPORATE GOVERNANCE
•FINANCIAL SUPERVISION
•PUBLIC SERVICES
•COMPETITION
22

Development priorities:
added value and new jobs
1. Fostering entrepreneurship and acquiring and applying knowledge for growth
and development: adequate fund-raising (especially for the growth and
development of enterprises), reform of higher education; improved efficiency of
investment in research and development activities, human resources
development; R&D projects in the field of eco-innovation and new green
technologies
2. Flexicurity and social cohesion: training, education and other forms of acquiring
knowledge and competences, preservation and creation of new jobs;
implementation of innovative projects aimed at including vulnerable groups in
the labour market, intensified integration into programmes and services aimed
at increasing social inclusion; health reform
3. Development-oriented transport and energy infrastructure: railway
infrastructure, improvement of passenger transport infrastructure and efficient
use of energy in transport; single transport model; modernisation of the
electricity transmission network, encouragement of electricity production, as
well as co-production based on renewable energy sources.23

Prioritetni programi vlade in njihovo financiranje*
2008
(expendit
ures)
2009
(expendit
ures)
2010
(plan)
2011
(plan)
2012
(target)
2013
(target)
1: Entrepreneurship and knowledge for growth
% GDP 2,2 2,8 3,2 3,0 3,2 3,2
% expenditure of state budget 9,1 9,8 9,9 9,9 11,2 11,9
% of EU expenditure of state budget 1,2 2,3 3,8 3,5 2,7 3,1
2: Flexicurity and social cohesion
% GDP 6,3 7,6 8,6 7,9 7,8 7,8
% expenditure of state budget 26,2 28,5 26,9 26,2 28,1 30,0
% of EU expenditure of state budget 0,0 0,4 0,8 0,7 0,5 0,4
3: Transports and energy development
% GDP 1,7 1,7 2,4 2,1 2,1 2,1
% expenditure of state budget 7,0 6,0 7,2 6,7 7,4 7,9
% of EU expenditure of state budget 0,5 1,0 2,6 2,2 3,2 2,9
SKUPAJ
% GDP 10,2 12,1 14,2 13,1 13,1 13,1
% expenditure of state budget 42,4 44,3 44,0 42,8 46,7 49,8
% of EU expenditure of state budget 1,7 3,7 7,2 6,4 6,4 6,4
*Calculations SVREZ
7

E. EU2020 and Smart growth: E. EU2020 and Smart growth:
01 Entrepreneurship and competitiveness
• General objectives and policy indicators :
– Encourage growth
– Increase sources of funding to support development and growth of enterprises
KAZALNIK ME IZH.
LETO
IZH.
VREDNOST LETO VREDNOST
BDP na prebivalca v standardih kupne moči (SKM)
(EU-27=100
indeks 2008 90,90 2014 94,90
Produktivnost dela (BDP v standardih kupne moči
(SKM)) na delovno aktivnega prebivalca (EU-27=100)
indeks 2008 84,40 2014 88,40
Delež srednje in visoko tehnološko intenzivnih
proizvodov v celotnem izvozu
% 2008 58,20 2014 61,20
Stopnja razvitosti grozdov mesto,
uvrstitev
2009 42,00 2014 36,00
Produktivnost dela (BDP v standardih kupne moči
(SKM)) na del.aktivnega prebivalca
indeks 2008 84,40 2014 88,40
KAZALNIK ME IZH.
LETO
IZH.
VREDNOST LETO VREDNOST
Dostopnost virov tveganega kapitala mesto,
uvrstitev
2009 28,00 2014 28,00
25
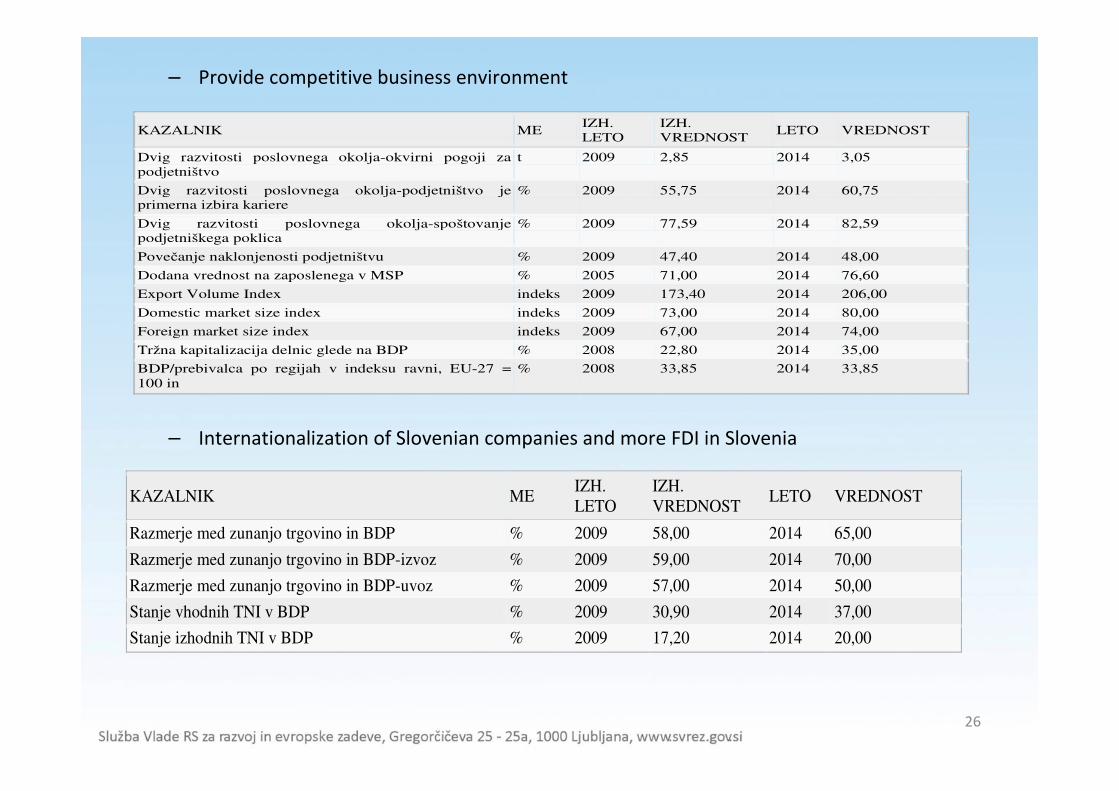
– Provide competitive business environment
– Internationalization of Slovenian companies and more FDI in Slovenia
KAZALNIK ME IZH.
LETO
IZH.
VREDNOST LETO VREDNOST
Dvig razvitosti poslovnega okolja-okvirni pogoji za
podjetništvo
t 2009 2,85 2014 3,05
Dvig razvitosti poslovnega okolja-podjetništvo je
primerna izbira kariere
% 2009 55,75 2014 60,75
Dvig razvitosti poslovnega okolja-spoštovanje
podjetniškega poklica
% 2009 77,59 2014 82,59
Povečanje naklonjenosti podjetništvu % 2009 47,40 2014 48,00
Dodana vrednost na zaposlenega v MSP % 2005 71,00 2014 76,60
Export Volume Index indeks 2009 173,40 2014 206,00
Domestic market size index indeks 2009 73,00 2014 80,00
Foreign market size index indeks 2009 67,00 2014 74,00
Tržna kapitalizacija delnic glede na BDP % 2008 22,80 2014 35,00
BDP/prebivalca po regijah v indeksu ravni, EU-27 =
100 in
% 2008 33,85 2014 33,85
KAZALNIK ME IZH.
LETO
IZH.
VREDNOST LETO VREDNOST
Razmerje med zunanjo trgovino in BDP % 2009 58,00 2014 65,00
Razmerje med zunanjo trgovino in BDP-izvoz % 2009 59,00 2014 70,00
Razmerje med zunanjo trgovino in BDP-uvoz % 2009 57,00 2014 50,00
Stanje vhodnih TNI v BDP % 2009 30,90 2014 37,00
Stanje izhodnih TNI v BDP % 2009 17,20 2014 20,00
26

There are no limits to growth, because there There are no limits to growth, because there
are no limits to human intelligence, are no limits to human intelligence,
imagination and wonderimagination and wonder
Ronald Reagan (1911-2004)
Thank you for your attention.
[email protected], [email protected]
27