eugenio maría de hostos college of education standard 5...
TRANSCRIPT

53
University of Puerto Rico
Río Piedras Campus
Eugenio María de Hostos College of Education
Standard 5. Provider Quality, Continuous Improvement, and Capacity
March, 2018

54
II. Standard 5. Provider Quality, Continuous Improvement, and Capacity
Title: Verify use of analysis of data as outlined in the SSR
A. Evidence in need of verification or corroboration
Periodic evaluations of the assessment system: 2005, 2009, 2014
The SSR states that this assessment system has been subjected to "Periodic evaluations and
enhancements in 2005, 2009 and 2014."
Response:
Since the EPP formally began to develop the unit-wide assessment system in 2001, it has
been subject to periodic evaluations and enhancements. In 2005, a two-day faculty retreat
was carried out with faculty representation from all programs and candidates’
representation of the Student Council to examine and discuss the progress of the
development of the assessment system. As a result of the retreat, the model was revised to
incorporate the advanced component and special emphasis on the use of data for
supporting decision making and actions to improve candidate preparation. The assessment
system has also been evaluated and approved by the Dean of Academic Affairs and
Academic Senate of the UPR Río Piedras Campus as part of the undergraduate curriculum
revision mandated through Certification 46, 2005-06.
In 2008-2009, the Assessment System was evaluated and revised once again by the EPP
Directive Committee, comprising Department, Program, and Special Unit directors and
coordinators, and changes were made to ensure its alignment with the revision of the EPP
Conceptual Framework and to incorporate a third component for the evaluation of unit
operations.
The new version of the assessment system was approved in December 2008 by the EPP
Directive Committee and by the EMHCE Faculty Assembly in February of 2009. The ongoing
evaluation of the unit assessment system through the interconnected efforts of the various
working groups has contributed significantly to the evolution of the system since it was
originally conceptualized and designed. (See Addendum Report Evidence 5.1 Evolution of
the EPP Assessment Model). As of 2017, (last revision of the model began in 2013 with a
task force in charge), the full implementation of a unit-wide assessment system that
integrates multiple and diverse data elements for all key areas of candidate preparation as
envisioned in the EPP Conceptual Framework and CAEP standards has been completed.
Among the major developments that have taken place are the assessment of the electronic
portfolio or Portae; the assessment of writing skills; the development of more
comprehensive partnerships for clinical preparation and performance evaluation; the
assessment of the EPP completers’ impact on P-12 student learning and development,
classroom instruction, and schools; annual assessment of the satisfaction of completers and
employers with the relevance and effectiveness of their preparation; and the incorporation
to a centralized database (OLAS) that collects and reports data on key assessments for each
candidate, as well as the program and campus level.

55
Excerpt from SSR to be clarified or confirmed:
"In 2013 a Task force was established to analyze CAEP's new standards and to determine
compliance of the assurance system with those standards. The processes and assessment
instruments in place were analyzed and recommendations to revise or create new processes
and assessment instruments were made.
Questions for EPP concerning additional evidence, data, and/or interviews
Where are the specific recommendations made based on this analysis?
See Addendum Report Evidence 5.2 Table: How to comply with CAEP’s new standards,
developed by the task force
Examples of recommendations incorporated in the EPP assessment process:
1.1 Develop new instruments that measure dispositions was followed by the development
of an Candidate Exit Survey to measure dispositions.
1.1.b Review rubrics of field experiences to measure dispositions.
2.2 Indicate the number of teachers who have passed the cooperative teacher course.
Every teacher provided evidence of having passed the cooperative teacher course.
3.1 Develop a recruitment plan and the administrative structure that supports it.
4.3 Employer survey in process and will be administered this semester as a pilot;
“promotion and retention” will be included in the employer survey.
5.1 Review and adapt authentic evaluation model with quality criteria.
5.5 Check and review model and specify CAEP’s standard in each assessment process.
What are specific examples of program change based on this analysis?
1. Porta-e: Rubrics were revised, and the reflexive seminars were restructured so that the
ten EPP competencies would be evaluated in the three seminars.
2. Induction program: A coordinator was appointed, and activities were designed to
determine EPP program impact of its completers on P-12 student learning and
development, classroom instruction, and schools; satisfaction of its completers with the
relevance and effectiveness of their preparation; and satisfaction of employers with the
completers’ preparation for their assigned responsibilities in working with P-12 students.
3. Field experiences assessment and rubrics: Field experiences assessment rubrics were
revised, and a partnership for clinical preparation was established (CAECE) to ensure
collaboration to establish, maintain, and refine criteria for selection, professional
development, performance evaluation, continuous improvement, and retention of
clinical educators in all clinical placement settings.
How were P-12 stakeholders involved in this process?
Cooperative teachers participated in an assessment retreat to revise the assessment model
and processes, and in CAECE meetings.
The Puerto Rico Department of Education participated in the induction program in the data
gathering processes of measures required by the state for its teachers.
56
What is the makeup of the Directive Committee?
The Directive Committee or the Administrative Team is composed by the deans, department
chairs, and EPP chairpersons responsible for the direct delivery and day-to-day operation of
teacher preparation programs and other academic and professional programs. The
Administrative Team meets bimonthly and discusses all the matters that concern the
planning, delivery, assessment, and operations of programs.
Title: Verify regular and systematic performance assessment results used to improve
program elements and processes
Evidence in need of verification or corroboration
SSR Evidence 5.1.2, Five years EPP Evaluation Plan UPRRP Learning Outcomes lists alignment
of standards with InTASC. While years are ascribed to each outcome, it is unclear how these
years factor into the evaluation of these standards.
Response: The year indicates the moment when evaluation data was gathered.
Table 5.1.3, Data collection and analysis process provides evidence for the data analysis
process complete with timelines and stakeholders involved. Specific examples of how this
data informs program effectiveness was not listed in these exhibits.
SSR Evidence Table 5.1.3 is a panoramic description of assessment processes.
SSR Evidence 5.3.2 lists data driven changes for program improvement.
Excerpt from SSR to be clarified or confirmed
SSR, p. 30, Evidence 5.1.3 summarizes the data collection and analysis process of the quality
assurance system through the four transition points. This evidence presents data collected,
collection date, person responsible, how data is analyzed, data reported, and data use.
Questions for EPP concerning additional evidence, data, and/or interviews
How was data used to inform specific program and EPP changes?
SSR Evidence 5.3.2 lists data driven changes for program improvement.
How did stakeholder involvement inform these changes?
In SSR Evidence 5.3.2 Section A, the column titled “Actions” describes the involvement of
different stakeholders in each process; Sections B and C, on the column titled “how data is
shared,” describe stakeholder involvement.
Title: Verify validity and reliability of EPP created assessments
Evidence in need of verification or corroboration
As stated in Evidence 5.2.2, "...all of the competencies were evaluated by more than 70% of
the experts as Good in the areas evaluated in Pertinence of the information and Adequate
scaling of the performance levels. In Content clarity and Adequate writing style, only

57
Competency 8 obtained 64% in both items. In these cases, the suggestions for corrections
by the evaluators were followed."
It is unclear what these suggestions were.
Excerpt from SSR to be clarified or confirmed
Table 5.2.4 Results of Validation Process of the Clinical Practice Evaluation Instrument
Results Evidence 5.2.2 show that all of the competencies were evaluated by more than 70%
of the experts as “Good” in the areas evaluated in “Pertinence” of the information and
“Adequate” scaling of the performance levels. In “Content clarity” and “Adequate writing
style,” only Competency 8 obtained 64% in both items. In these cases, the suggestions for
corrections by the evaluators were followed.
Response:
The suggestions made by the evaluators of the validation process of the 2010 Clinical
Practice Evaluation Instrument were:
1) Review the wording of the indicators to make it clearer.
2) Improve the writing of the performance levels.
3) Include the ethical aspect of the evaluation.
4) Include in outcome A "Collect information through various techniques and
instruments."
Questions for EPP concerning additional evidence, data, and/or interviews
What are the suggestions and plans for validating the reliability and validity of all EPP
created assessments?
Response:
Quality assurance system instrument validity and reliability
Instruments created by EPP
This section describes the construction processes of the instruments developed by EPP,
especially the aspects related to its validity and reliability. It offers a substantial extension to
the information offered in the self-study, in addition to presenting the information with
greater organization.
Each instrument and evaluation process of the quality assurance system goes through a
process of development and evaluation in which the faculty ensures there is fairness,
accuracy, consistency, and lack of bias.
All assessment instruments are developed by those faculty that administers them as part of
the key courses in which data are collected. They establish assessment criteria that are
aligned with the EPP Conceptual Framework and the standards of the specific professional
areas. Based on these criteria, rubrics are elaborated along with procedures for their use.

58
Once the initial versions are completed, they are evaluated by all professors who will
administer them, and then they test them by assessing candidates. The Evaluation Office,
the Educational Research Center, and the Teaching Practice Office collaborate in this task.
See Addendum Report Evidence 1.3 Rules for the Construction of a Questionnaire, as an
example of this collaboration process. Below are the names of the instruments developed
by EPP and the data on their validity and reliability.
A. Clinical Practice Evaluation Instrument (CPEI)
Objective
The objective of the Clinical Practice Evaluation Instrument is to evaluate the performance
of the candidates during the practicum.
What is measured
The instrument measures the degree to which candidates have developed the ten EPP
competencies:
1. Knowledge and Mastery of Subject Matter
2. Knowledge of the Student and the Learning Process
3. Planning of Instruction
4. Implementation and Research of Teaching
5. Creation of Learning Environments
6. Communication
7. Integration of Emerging Educational Technologies
8. Evaluation of Learning
9. Relationship with the Community
10. Professional Development and Performance
Alignment
The instrument is aligned with the conceptual framework of the faculty, CAEP standards,
and InTASC standards.
Instrument validity process
The construction of the instrument was conducted by the Teaching Practice Office in the
years 2000 to 2003. The practicum coordinator, the practicum supervisors, and the
cooperating teachers participated in the process. In the initial stage, they made an analysis
of the components of the candidate evaluation process during the practicum and the
evaluation instrument that they were using. For a three-semester period, the literature
review on how to evaluate the teacher candidate was conducted. The advice of graduate-
level professors was important in the process.
The conception behind the candidate evaluation process was guided by the following
premises:

59
• The emphasis of the evaluation must be on the training process.
• The candidate's analysis and reflection should be facilitated in relation to their
strengths and weaknesses.
• The professional and personal development of the candidate must be encouraged.
• The evaluation must take into consideration the diversity and needs of the
candidate.
• Evaluation is conceived as a continuous and collaborative process.
Working groups were formed to elaborate the learning outcomes and the levels of
execution for each of the 10 competences that are presented in the conceptual framework
of the EPP. Four levels of execution were decided for each learning outcome: Exceeds
Expectations, Meets Expectations, In Progress, and Initiated. It was also decided that three
evaluations would be carried out during the semester so that the evaluation would be a
progressive and formative one.
In the academic year 2002-2003, a pilot project was carried out involving 22 cooperating
teachers, candidates and supervisors of practice to validate the instrument. Among the
participating schools of the pilot study were Antonio S. Pedreira, Ramón Vila Mayo, UPR
Elementary School, UPR Secondary School, Julio Sellés Solá, and Juan Ponce de León.
Students from the K-3 and 4-6 grade levels, Theater, Spanish, Science, Music, Family
Ecology, and Art were included among the participating programs. The observations and
recommendations offered by these groups were collected, and the instrument was revised.
In 2010, a second validation process of the instrument took place. This process was led by
Dr. Ana Miró, who was the coordinator of the Teaching Practice Office. All clinical practice
professors participated in the process, candidates and cooperating teachers. The validation
process consisted of four stages.
During the first stage of the validation process, the competencies developed through the
Conceptual Framework approved by the Faculty of the College of Education were reviewed.
At that time the main changes were establishment of an emphasis on diversity, integration
of the research component within the implementation competency, incorporation of a
technology competency, and fusion of the competency related to professional performance
with the professional and personal development competency.
During the second stage, the revised instrument was distributed to all clinical practice
professors, and their feedback was included in the instrument. It was received feedback
from teachers at the preschool and elementary levels; eight components were added to the
two competencies that were fused during the first stage (these were divided into four
components); the technology component was eliminated from the implementation
competency since during the first stage this component (technology) became a separate
competency, and, in its place, the research and creation component was added; and, lastly,
more manifest discrimination criteria were established between the achieved and the
outstanding levels.
60
The third stage primarily consisted of a review of the document developed during the
second stage by a group of professors representing the preschool, elementary, and
secondary levels; assessment; and other areas not related to primary subjects. During this
phase, professors representing the different levels/areas verified the pertinence of the
language used and verified all established criteria related to their professional area.
Additionally, they worked on ranking the performance levels of each component within all
the competencies.
The fourth stage was the content validation of the most recent version of the instrument.
During this phase, the alignment of the competences included in the instrument was
included alongside the dispositions of the future teacher as outlined in the Conceptual
Framework of the EPP. Also, in this phase, representatives from different sectors, including
professors and students, cooperating teachers, and administrators were included.
During the validation process a template was used (See Self Study Evidence 5.2.3) where the
12 evaluators performed their evaluation. The template included the 10 EPP competencies
and the evaluation of the following criteria: Pertinence of the information, Content clarity,
Adequate writing style, Adequate scaling of the performance levels, and their relationship
with the dispositions. For each one, the evaluators used the following scale: 3: Good, 2:
Average, and 1: Needs Improvement. Three was indicative that the evaluator was
completely satisfied with the statement and one would indicate that this premise needed
improvement because it did not comply with the established criteria. An additional column
was added for comments.
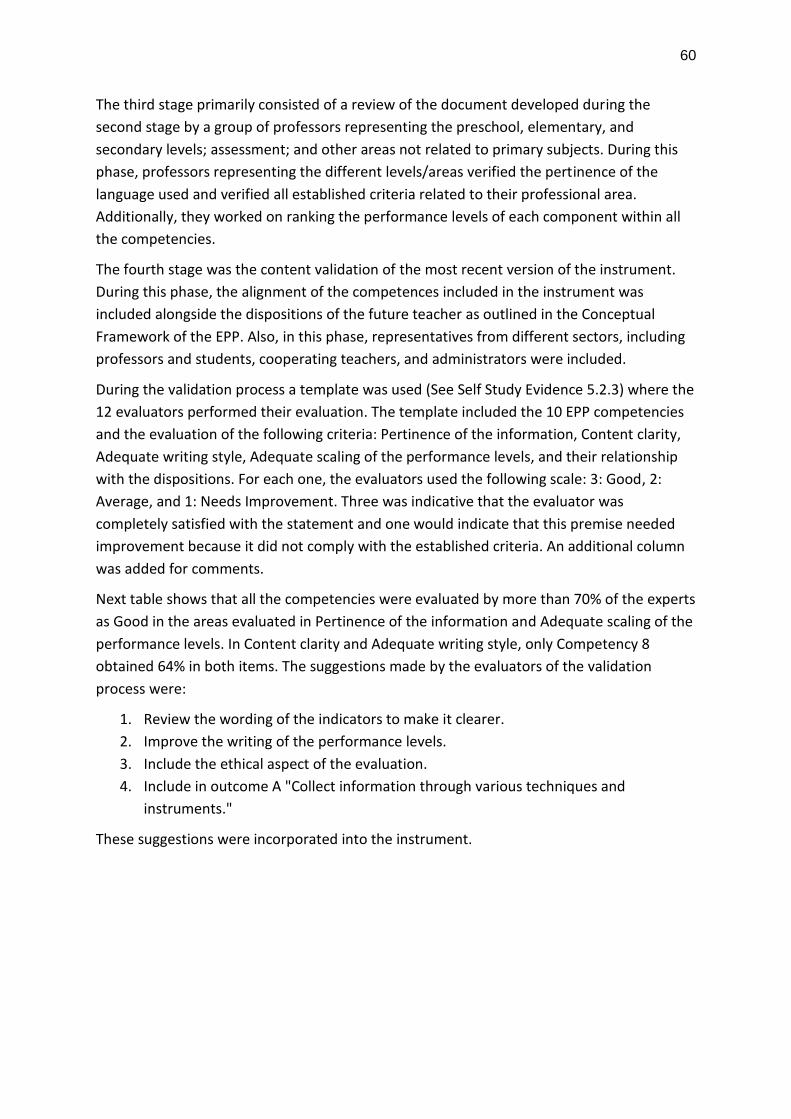
Next table shows that all the competencies were evaluated by more than 70% of the experts
as Good in the areas evaluated in Pertinence of the information and Adequate scaling of the
performance levels. In Content clarity and Adequate writing style, only Competency 8
obtained 64% in both items. The suggestions made by the evaluators of the validation
process were:
1. Review the wording of the indicators to make it clearer.
2. Improve the writing of the performance levels.
3. Include the ethical aspect of the evaluation.
4. Include in outcome A "Collect information through various techniques and
instruments."
These suggestions were incorporated into the instrument.

61
Results of Validation Process of the Clinical Practice Evaluation Instrument
Pertinence of the
information
Content clarity Adequate writing style Adequate scaling of the
performance levels
Compe-
tencies
Good Average Needs
improve-
ment
Good Average Needs
improve-
ment
Good Average Needs
improve-
ment
Good Average Needs
improve-
ment
1 100% 0% 0% 90% 4% 6% 92% 2% 6% 75% 6% 19%
2 97% 3% 0% 86% 14% 0% 100% 0% 0% 89% 3% 8%
3 100% 0% 0% 85% 8% 6% 81% 2% 17% 75% 4% 21%
4 100% 0% 0% 88% 0% 12% 87% 3% 10% 82% 5% 13%
5 100% 0% 0% 88% 4% 8% 94% 6% 0% 79% 2% 19%
6 98% 2% 0% 100% 0% 0% 79% 4% 17% 79% 4% 17%
7 92% 0% 8% 81% 6% 14% 78% 3% 19% 72% 6% 22%
8 86% 6% 8% 64% 8% 28% 64% 8% 33% 75% 6% 19%
9 96% 4% 0% 83% 0% 17% 75% 8% 17% 83% 0% 17%
10 98% 2% 0% 90% 2% 8% 79% 8% 13% 79% 2% 19%
Reliability data
To know the internal consistency of the CPEI instrument, a reliability analysis was performed
using Cronbach's Alpha procedure. The analysis was performed for years 2013-2014, 2014-
2015, and 2015-2016, separately. In each analysis, the data of the 10 evaluated
competences were included. Next table shows the sample sizes used in the analysis and the
reliability coefficient (Cronbach's Alpha). Results from the analysis shows high reliability
coefficients for these three years. In all the analyses, the reliability was greater than .90.
Years N Cronbach's Alpha
2013-2014 175 .933
2014-2015 200 .933
2015-2016 163 .932
Administration
The instrument is administered three times during the practicum.
Analysis
The averages obtained by the candidates in each competence are calculated and compared
with the approval points according to the amount of learning outcomes of each
competence.

62
B. Electronic Portfolio Rubric
Objective
To assess the evidence presented by students in the electronic portfolio to support the
development of EPP competencies.
What is measured
It measures the degree to which candidates have developed EPP competencies.
Alignment
The instrument is aligned with EPP competencies, CAEP standards, and InTASC standards.
Instrument validity process
The Porta-e rubrics were initially developed and piloted in 2003-04 by the Porta-e
Committee with a group of 13 candidates from different programs. The evaluation findings
evidence a very effective experience in assessing candidate competencies and promoting
reflection and in-depth learning of candidates. Since then, as part of the effort to broaden
the implementation of the Porta-e at the unit wide level with all candidates through the
creation of the Professional Reflexive Seminars (FAED 4001, 4002, 4003) with the revised
baccalaureate programs which started in 2008-09, the rubrics have been thoroughly revised
twice by participating faculty to increase the effectiveness of the assessment process. Dr.
Cynthia Lucena, Coordinator of the Porta-e at the time and professor of educational
technology, designed the Porta-e digital platform with the assessment rubrics that all
professors use to provide feedback to candidates on their work. The Porta-e platform and
the professor and student resources site describes the assessment process and rubrics, and
clearly explains what is expected from candidates for each part of the portfolio and
examples of the types of evidence candidates may present. To see this information, go to
https://sites.google.com/a/upr.edu/profesoresportae/home and
https://sites.google.com/a/upr.edu/portae/.
To promote consistency in the use of the Porta-e rubric, Dr. Lucena held a meeting with all
participating professors in December 2009, in which subgroups of professors evaluated
candidate evidences and compared their scores to achieve more consensus in the
interpretation of the criteria and performance levels.
Procedure: Samples of evidence and reflections collected through My Trajectory and
Principles 2, 4, 7, and 10 that were being worked with at the time within the Reflective
Seminar FAED 4001 and 4002. The rubric designed for said purpose was used and the
statistical results among evaluators were compared.
Results obtained using the rubric: To evaluate the work submitted, the professors used the
quality criteria established in the rubric to evaluate the E-Portfolio.
63
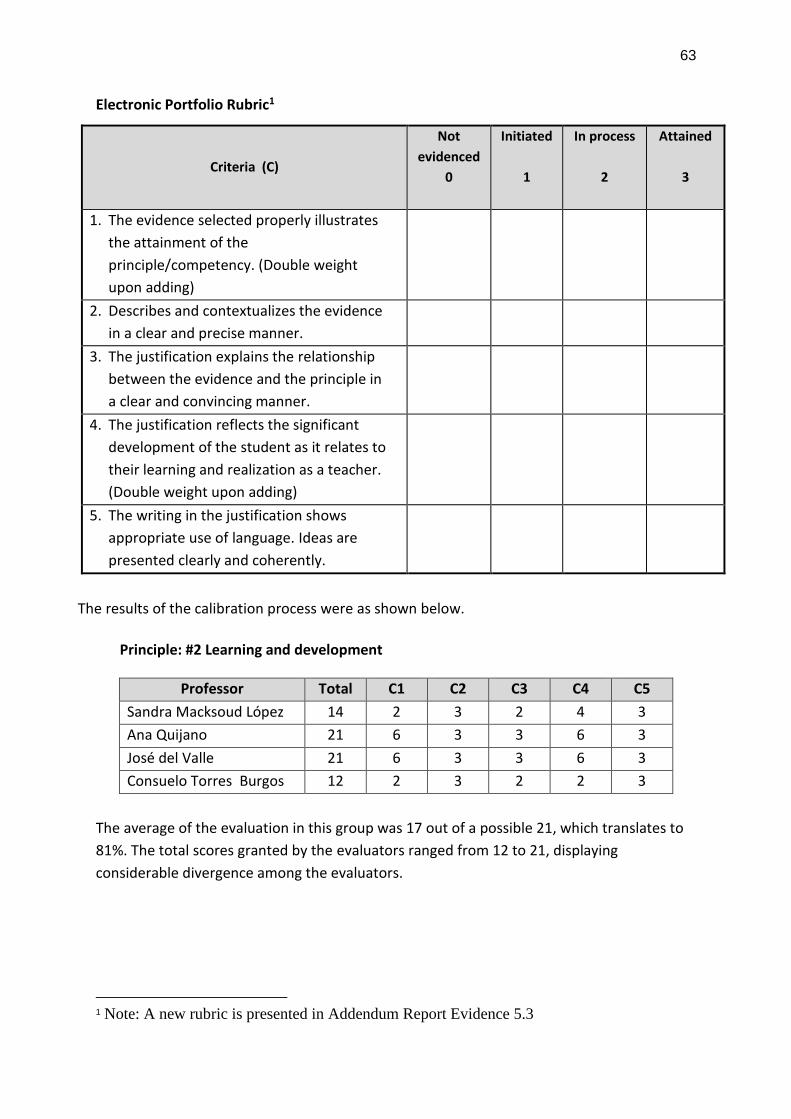
Electronic Portfolio Rubric1
Criteria (C)
Not
evidenced
0
Initiated
1
In process
2
Attained
3
1. The evidence selected properly illustrates
the attainment of the
principle/competency. (Double weight
upon adding)
2. Describes and contextualizes the evidence
in a clear and precise manner.
3. The justification explains the relationship
between the evidence and the principle in
a clear and convincing manner.
4. The justification reflects the significant
development of the student as it relates to
their learning and realization as a teacher.
(Double weight upon adding)
5. The writing in the justification shows
appropriate use of language. Ideas are
presented clearly and coherently.
The results of the calibration process were as shown below.
Principle: #2 Learning and development
Professor Total C1 C2 C3 C4 C5
Sandra Macksoud López 14 2 3 2 4 3
Ana Quijano 21 6 3 3 6 3
José del Valle 21 6 3 3 6 3
Consuelo Torres Burgos 12 2 3 2 2 3
The average of the evaluation in this group was 17 out of a possible 21, which translates to
81%. The total scores granted by the evaluators ranged from 12 to 21, displaying
considerable divergence among the evaluators.
1 Note: A new rubric is presented in Addendum Report Evidence 5.3

64
Principle: # 4 Critical thinking, research, and creativity
Professor Total C1 C2 C3 C4 C5
Annette López 17 4 2 3 6 2
Ileana Quintero 11 2 2 1 4 2
Claudia Álvarez 11 4 1 1 4 1
The average of the scores for this principle was 13 out of 21, which represents 61.90%. In
the evaluation of this principle there were three evaluators and two of them granted the
same score. Convergence within this principle showed that two evaluators were in
agreement and provided the same score and one evaluator had a different score; this
phenomenon occurred with all criteria. It could be said that convergence and divergence
was two to one respectively. Divergence of opposing points were not well marked; the
evaluators differed but to a low degree, with two to one and that occurred in all the criteria
related to principle #4.
Principle: #7 Educational technologies
Professor Total C1 C2 C3 C4 C5
Zulma Medina 7 2 1 1 2 1
Carmen Pacheco 21 6 3 3 6 3
Juan Meléndez 21 6 3 3 6 3
Average: 16.33/21 this average is close to an ideal score with 77.76%. It could improve to
reach a performance of 80% or more. As situation similar to the previous principle occurred
with this principle since two evaluators agreed to grant the same maximum score. The third
evaluator granted very low scores equivalent to 33% of the ideal score.
Principle: # 10 Professional and reflective professional action and development
Professor Total C1 C2 C3 C4 C5
Anita Yudkin 17 4 3 2 6 2
Annette López 19 6 3 2 6 2
Ileana M. Quintero 17 6 2 2 6 1
Claudia Álvarez 19 6 3 2 6 2
Average: 18/21 this result shows that the score obtained is almost ideal with 85.7%. In this
case, the evaluators coincided in granting similar scores that did not differ significantly from
one another. There was not much variation in the scores granted. It ranged between 17 and
19.
Average total for all four principles 15.89/21. This result is the sum of the averages for all
four principles that were developed during the meeting to discuss the four principles. The
15.89 total average represents 75.66% of the ideal score. In this case, 100% is equal to 21.
65
Conclusions: In general, there was considerable convergence among evaluators, with some
exceptions. In each group there was always a professor who distanced themselves from the
others, and the concluding discussion of the evaluation helped to gain understanding of the
way the evaluation was done by each one of the participants to achieve higher consensus. It
is possible that differences in the backgrounds and prior experiences of some of the
evaluators led to differences in the interpretation of the rubric and the evaluation of sample
work. The results from this experience allowed us to see that students’ performances are
not reaching the desired maximum level in any of the principles.
In this sample, all principles would have recommendations for the improvement of the
performance evidence. A search for explanations for this phenomenon would be advised to
determine if it is related to lack of understanding of the principles, use of technology issues,
the importance students give to the development of the Porta e, students’ motivation,
professors’ evaluation criteria, since through the sample used we can see they vary as
reflected by the substantial difference in scoring among evaluators.
Recommendations:
1. Hold a second, follow-up meeting to present results and exchange impressions and
actions needed to review and improve the Seminar, the Porta e, the rubrics and checklists,
and the evaluation process.
2. Wide dissemination of the results of this meeting so that future Porta e evaluators can
take into consideration the aspects identified to promote consistency and equity in the
evaluation of the Port e, and thus they can reflect on their practice and can provide the
means to improve these processes.
3. Hold a meeting to discuss and analyze the principles and reflections that were not
included in this initial process to complete the consistency test among all evaluators using
the Porta e and everything else related to these principles and reflections.
New rubric construction
One of the recommendations made by the group of professors who worked on the
validation of the rubric of the electronic portfolio was to change it to one that was more
precise. The Addendum Report Evidence 5. 3 present the new rubric that is being worked
on.
Administration
The administration is during the courses FAED 4001, FAED 4002 and FAED 4003.
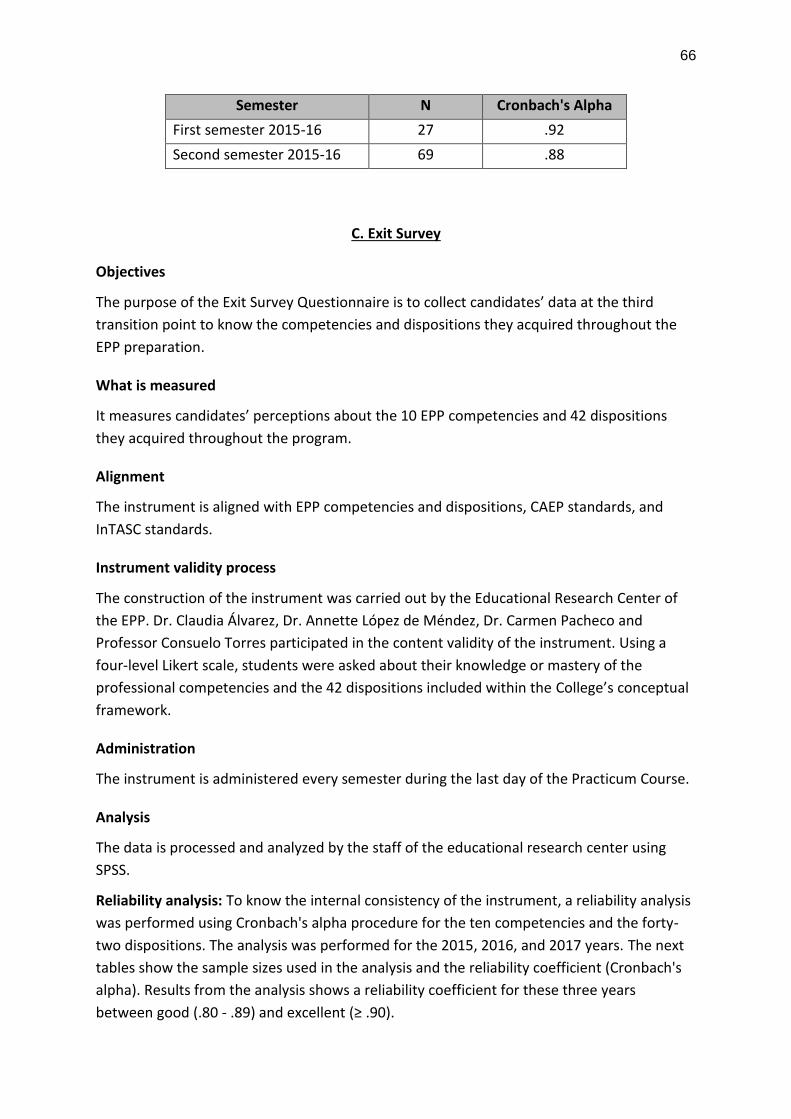
Reliability analysis: To know the internal consistency of the instrument, a reliability analysis
was performed using Cronbach's Alpha procedure for the ten competencies. The analysis
was performed for the 2015-2016. The following tables show the sample sizes used in the
analysis and the reliability coefficient (Cronbach's Alpha). Results from the analysis show a
good reliability coefficient for this year.
66
Semester N Cronbach's Alpha
First semester 2015-16 27 .92
Second semester 2015-16 69 .88
C. Exit Survey
Objectives
The purpose of the Exit Survey Questionnaire is to collect candidates’ data at the third
transition point to know the competencies and dispositions they acquired throughout the
EPP preparation.
What is measured
It measures candidates’ perceptions about the 10 EPP competencies and 42 dispositions
they acquired throughout the program.
Alignment
The instrument is aligned with EPP competencies and dispositions, CAEP standards, and
InTASC standards.
Instrument validity process
The construction of the instrument was carried out by the Educational Research Center of
the EPP. Dr. Claudia Álvarez, Dr. Annette López de Méndez, Dr. Carmen Pacheco and
Professor Consuelo Torres participated in the content validity of the instrument. Using a
four-level Likert scale, students were asked about their knowledge or mastery of the
professional competencies and the 42 dispositions included within the College’s conceptual
framework.
Administration
The instrument is administered every semester during the last day of the Practicum Course.
Analysis
The data is processed and analyzed by the staff of the educational research center using
SPSS.
Reliability analysis: To know the internal consistency of the instrument, a reliability analysis
was performed using Cronbach's alpha procedure for the ten competencies and the forty-
two dispositions. The analysis was performed for the 2015, 2016, and 2017 years. The next
tables show the sample sizes used in the analysis and the reliability coefficient (Cronbach's
alpha). Results from the analysis shows a reliability coefficient for these three years
between good (.80 - .89) and excellent (≥ .90).

67
Ten competencies
Years N Cronbach's Alpha
2015 59 .82
2016 38 .88
2017 75 .90
Forty-Two Dispositions
Years N Cronbach's Alpha
2015 42 .95
2016 36 .98
2017 64 .98
D. Technology Survey
Objectives
• Identify the technologies used in classroom by professors.
• Identify the technologies promoted in candidates by professors.
• Identify activities professors promote among candidates to present within the
electronic portfolio.
Alignment
The instrument is aligned with technology aspects within the EPP competencies, CAEP
standards, and InTASC standards.
What is measured
The instrument measures the different technologies used by professors in their courses
which are geared to the promotion of their integration/adoption among the candidates. It
also measures the technology integration/adoption activities within the classroom.
Instrument validity process
The Department of Arts, Technologies and Innovations oversaw the construction of the
instrument since the professors who teach technology and innovation are assigned to this
department. A preliminary questionnaire was designed based on the stated objectives and
an evaluation of that instrument was carried out by professors (Dr. Luis de Jesús, Dr. Juan
Meléndez, and Dr. Carmen Pacheco). It was also reviewed by the director of Educational
Research Office (CIE, for its acronym in Spanish) and the director of the Evaluation Office.
68
Administration
The instrument was administered online in October 2016.
Analysis
The Department of Arts, Technologies and Innovations was in charge of the analysis and
interpretation.
E. Completers’ Satisfaction Survey
Objective
The objective of this survey is to determine completers’ satisfaction with the Eugenio María
de Hostos College of Education (EMHCE) teacher preparation program, as well as their
perceptions of need in relevant topics of their job as educators.
What is measured?
1. Completers' perception of their own competency levels in the 10 EPP competencies
and five dispositions.
2. Areas of professional improvement
3. Completers’ satisfaction with general aspects of the EMHCE teacher preparation
program (foundation courses, practicum courses, professors’ preparation, research
opportunities, etc.)
Alignment
The items on professional competencies are aligned with the requirements established by
CAEP for Standard 4 and the InTASC standards (2011), the EPP competencies, and the UPR
Institutional Vision and Mission Document.
Instrument construction process
1. The instrument was constructed using and modifying some of the items from two
scales of the questionnaire developed by Dr. Macksoud and colleagues in 2009: 1)
Teacher Preparation Program Areas, and 2) Areas of Interest and Professional
Development. In addition, the survey included the ten EPP competencies and five
dispositions of the Clinical Practice Evaluation Instrument.
2. To ascertain the content validity of the survey a team of six experts reviewed the
instrument. The expert panel was comprised by two professors, two practicum
supervisors, one candidate who was doing her practicum and a graduate research
student. The group reviewed the instrument in three dimensions: content related to
competency, relation of the question to the standard aim, clarity and coherence in
the descriptor, and grammar. Recommendations were discussed in a CAEP meeting
69
with members of all 5 standards. Consensus among the experts was the criteria to
accept or not the question/item.
3. The questionnaire is divided into four sections: I. Occupational and Academic
Information (17 items); II. Mastery of Professional Competencies (10 items) and
Dispositions, which were used to evaluate their clinical practicum, and a scale of 13
items for areas for improvement; III. General Satisfaction of the Program; IV
Evidence of Impact Practices. Five questions (both close- and open-ended)
concerning the completer’s practice in the schools and in their work environment
that promote learning, development, and achievements in their students, and
professional achievements of the completer. These questions were particularly
important because they are related directly and indirectly with the impact of
teachers’ actions in their students.
4. To meet the criteria of teachers’ impact on her/his students, five questions were
developed: a) Activities or initiatives created that had a positive impact on the
students’ academic growth; b) the completer had to choose from nine categories of
“students achievements supported by teacher” (completer) on a multiple response
question, where the completer could mark all that applied. Nine categories of
students’ achievements were presented: c) the survey asked the completer to
describe with some detail (type of achievement, date, place, name of the prize,
context) of the achievement of his/her students; and d) the question of completer
achievement also adds foundation to his/her professional profile.
Administration
It was administered online using the Google Academic for Education Tool provided by the
institution. The director of the Induction Project and her assistant designed and corrected
the instrument in their drive. Induction Project developed its data base of completers with
data form the Clinical Practice Office, Registrar’s Office, clinical practice supervisors, and
many professional workshops that were programed. We had research permission granted
from the University of Puerto Rico Institutional Committee for the Protection of Human
Subjects in Research. (CIPSHI #1617-036).
Analysis
The director of the Induction Project was in charge of analyzing the data along with her
research assistants. A reliability analysis (internal consistency) was performed using
Cronbach's alpha. Results from this analysis showed high (.98) reliability coefficients for the
competencies scales and .97 for the dispositions scales. The items for Professional
Improvement had a Cronbach's alpha coefficient of 0.96, indicating excellent reliability and
the items for Program Satisfaction had a Cronbach's alpha coefficient of 0.93, indicating
excellent reliability.

70
F. Completer Information Form (before “Contact Survey”)
The Contact Survey will now be called the “Completer Information Form” because the data
gathered was intended for database building purposes. All the data was descriptive and
qualitative. It was validated in content and appearance by an expert panel of two practicum
supervisors, two student-teachers, one graduate student, and two professors. A pencil-
paper version was piloted with 15 completers on March 2015, and the response was
positive; the 15 completers answered all the questions, and no negative comments were
received. The data that the completers provided about their professional achievements and
their students’ achievements as well was used to create categories that were included in the
Completers Satisfaction Survey Section IV called “Evidence of Professional Practice.”
The categories created for “student achievements supported by completers” as well as
“completers’ professional achievements” were used on both the Employer Satisfaction
Survey and the Completers’ Opinion Survey II.
G. Employers’ Opinion Survey
Objectives
To know the satisfaction of employers (school directors) with the teacher preparation
program of EMHCE and the completers' professional achievements.
What is measured
The questionnaire measures the opinion of the school directors on the execution of
completers, professional achievements, student achievements, and their opinion regarding
the quality of the EMHCE Teacher Preparation Program.
Alignment
The questionnaire is aligned with the requirements established by CAEP for Standard 4 and
the InTASC standards. Ten (10) EPP competencies and five dispositions (included in one
question) were aligned to the Clinical Practice Evaluation Instrument. The questions
included in Survey II related to promotions and recruitment responded to CAEP Requisites
on Standard 4.
Instrument construction process
This survey was originally created in 2007 and developed by the Educational Research
Center (CIE, for its acronym in Spanish) and was titled as Employers’ Opinion Survey. Data
provided by the employers (school directors) through this instrument was used in the Self-
Study for NCATE accreditation on 2010 with good results. The CIE presented their results
before many audiences.
For accreditation and research purposes, the instrument was revised and modified,
considering CAEP criteria, by the director of the Induction Project and her staff, currently in

71
charge of the Standard 4, and piloted in January 2016 – Employers’ Survey I and refined as
Employers’ Satisfaction Survey II.
The Employers’ Opinion Survey I (2016) included questions directly related to professional
competencies and five dispositions and incorporated new questions about student
achievements promoted by completers to connect valuable information for 4.1 Student
Impact. We also included completers’ achievements and questions related to promotions.
Seven experts in different areas (three professors, two clinical supervisors, one method
design expert, one school principal, and one teacher) read the instrument and provided
meaningful suggestions such as, shorter questions, using concepts that were well
understood by school principals from public system, municipal and private, and to reduce
long explanations. After the panel revised the document, it was piloted with 28 directors,
and these results were analyzed (SSR evidence 4.3 Employers' Satisfaction Survey I).
On September 2016, it was revised and titled Survey II, adding questions related to public
school labor conditions, and specific questions about novice completers (experience within
the last five years or less); thus, we were able to fully comply with the standard. We decided
to include instructions to the employers that they provide amount of information related to
novice teachers.
To ascertain the content validity of the instrument, a team of six experts reviewed the
questions of the instrument. The expert panel were two professors, two practicum
supervisors, one graduate student in Educative Leadership Program (before known as the
“Administration and Supervision Program”), who was doing her practicum and a graduate
research student. They revised individually the instrument in three dimensions: content
related to competency, relation of the question to the standard aim, clarity and coherence
in the descriptor, and grammar. Recommendations were discussed in a CAEP meeting with
members of all 5 standards. Consensus among the experts was the criteria to accept or not
the question/item.
Administration
The survey was administered through a digital link created with Google Educational Tools
used in the UPRRP, designed by the Induction Project for this accreditation process. Survey II
(2016) was completed by 98 employers/school principals online and through an official
memorandum from the Central Office. For the private sector, the contact was the Private
Schools Association and the PR Council of Education. We had research permission granted
from the University of Puerto Rico IRB or Institutional Committee for the Protection of
Human Subjects in Research. (CIPSHI #1617-036).
Analysis
Dr. Nellie Zambrana, the director of the Induction Office, and her assistant Yamil Ortiz, were
in charge of analyzing the gathered data. It was used the Statistical Package for the Social

72
Sciences to gather the data and Intellectus Statistics to calculate the Cronbach’s alpha
coefficients for the competencies and dispositions scales.
Reliability
The items for Competencies had a Cronbach's alpha coefficient of 0.98, indicating excellent
reliability. For the disposition scale, the Cronbach's alpha coefficients was .97.
References
George, D. & Mallery, P. (2016). SPSS for Windows step by step: a simple guide and
reference, 11.0 update (14th ed.). Boston, MA: Allyn and Bacon.
Intellectus Statistics [Online computer software]. (2017). Retrieved from
https://analyze.intellectusstatistics.com/
H. Evaluation of the Teacher Practice Experience
Objective: To evaluate the practicum course by candidates.
What is measured
The performance of the Supervisors of the Practicum, Cooperating Teacher, School Director
and Teaching Practice Office in the Practicum.
Alignment
This instrument is aligned with the number 141 certification of the academic year 2013-
2014 of the Academic Senate of the Rio Piedra’s Campus: Evaluation of Professor in
University Courses and with circular letter number 2-2012-2013 of the Department of
Education of Puerto Rico: Public Policies Related to the Norms that Regulate the
Organization and Functioning of the Teaching Practice Program.
Validity processes
This instrument was designed by the CAEP Standard 2 committee. This committee consisted
of a supervisor, a cooperating teacher and a teacher practice coordinator. It was reviewed
by the CAEP Committee - Standard # 2 on April 25, 2016 and May 9, 2016 by Dr. Loida
Martínez, Associate Dean of Academic Affairs of the Faculty of Education and Dr. Rubén
Rosado of the CAEP Committee Standard # 5.
The questionnaire consists of four scales: a scale to evaluate the Supervisors of the
Practicum that consists of 14 items, another scale to evaluate the Cooperating Teacher that
consists of 12 items, another scale to evaluate the School Director of 6 items and the last of
4 items the Teaching Practice Office is evaluated.

73
Reliability data
To know the internal consistency of the instrument, a reliability analysis was performed
using Cronbach's Alpha procedure. The analysis was performed for second semester 2016-
2017. Results from the analysis shows a good reliability for the Teaching Practice Office
Scale and a high reliability for the Supervisors of the Practicum, Cooperating Teacher, and
School Director scales. See table below.
N Cronbach's Alpha
Supervisors of the Practicum 44 .91
Cooperating Teacher 46 .92
School Director 44 .91
Teaching Practice Office 44 .80
Administration: It was administered in the second semester of the 2016-2017 academic
year. The results will be reviewed, and the results discussed in the next meeting of the
CAECE Advisory Committee on Educational Clinical Experiences.
Note: The Evaluation of the Teacher Practice Experience instrument is presented in
Addendum Report Evidence 5.4.
Title: Verify measures, analysis and sharing of completer impact data to ensure future
improvement
Evidence in need of verification or corroboration
Completer impact is evidenced in 5.4.1. Evidence regarding data, analysis and future plans
from analysis regarding patterns and trends was unclear. For example, in the area of P12
student learning/development the future directions column stated:
"Strengthening of the Induction Program. See Planning Section."
No planning section on this document was found.
Response:
The planning section referred in the SSR was Section V Selected Improvement Plan. In this
Addendum Report, this Plan is strengthened and is found in Section V: Response to the
Selected Improvement Plan (SIP).
Excerpt from SSR to be clarified or confirmed
SSR, p. 32, See Evidence 5.4.1 Monitoring and use of measures of completer impact and
outcome measures; Evidence 5.4.2 EPP Enrollment, Retention, Graduation Rates and
Benchmark Information by Program; Evidence 5.4.3 Longitudinal Analysis; 5.4.4 UPRRP
Analysis of EPP Academic Programs; Analysis and Reflection of the EPP Academic
Programs to improve retention and graduation rates.
74
Questions for EPP concerning additional evidence, data, and/or interviews
Where is the planning section for each action listed on 5.4.1? What are these plans? How
are all stakeholders involved in these plans?
Actions listed for Impact Measures 1,2,3,4, and outcome measure #7 related to Standard 4,
Program Impact are addressed in Section V, Selected Improvement Plan of the SSR and this
Addendum.
Outcome measure #5 Completer graduation rate -EPP Student Affairs Deanship annual
operational plan and resources listed in SSR Evidence 3.1.1
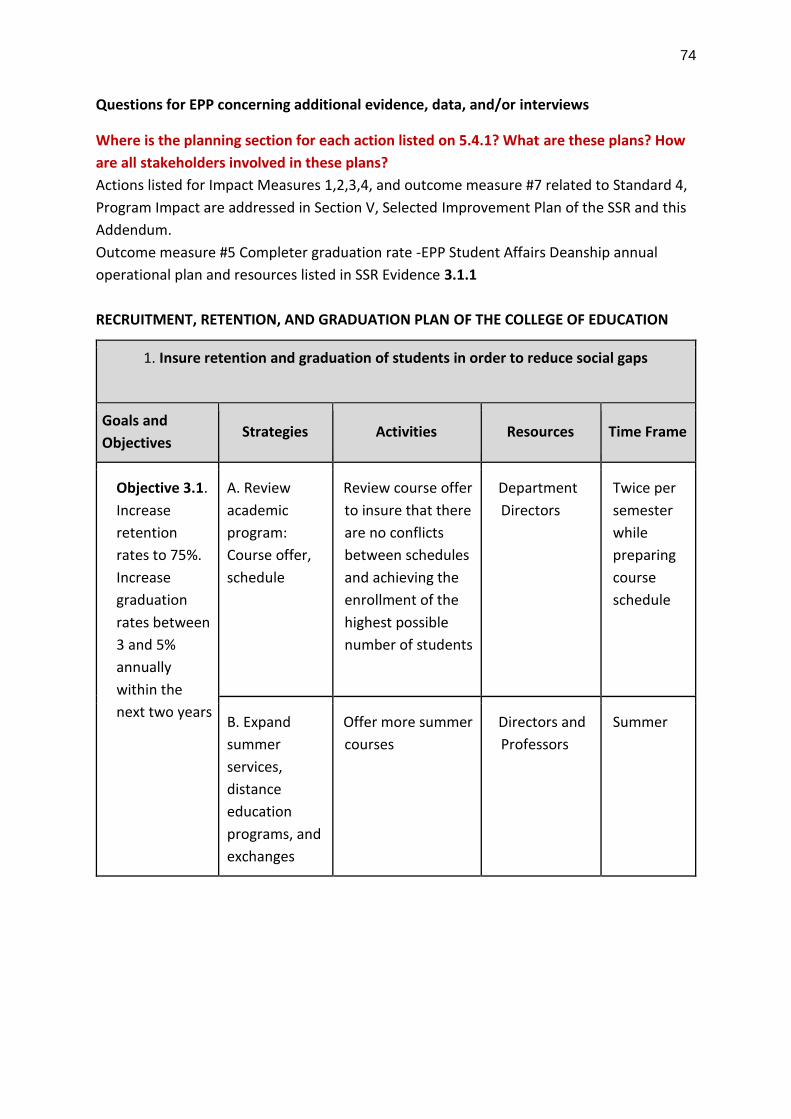
RECRUITMENT, RETENTION, AND GRADUATION PLAN OF THE COLLEGE OF EDUCATION
1. Insure retention and graduation of students in order to reduce social gaps
Goals and
Objectives Strategies Activities Resources Time Frame
Objective 3.1.
Increase
retention
rates to 75%.
Increase
graduation
rates between
3 and 5%
annually
within the
next two years
A. Review
academic
program:
Course offer,
schedule
Review course offer
to insure that there
are no conflicts
between schedules
and achieving the
enrollment of the
highest possible
number of students
Department
Directors
Twice per
semester
while
preparing
course
schedule
B. Expand
summer
services,
distance
education
programs, and
exchanges
Offer more summer
courses
Directors and
Professors
Summer

75
1. Insure retention and graduation of students in order to reduce social gaps
Goals and
Objectives Strategies Activities Resources Time Frame
C. Strengthen
academic
guidance and
counseling
Workshops,
conferences, and
meetings with
students
Academic
counselors
and guides
Student
guides
Program
Twice per
semester
D. Provide
support to
students with
personal,
financial, and
mental health
problems
Make referrals to
appropriate
personnel in each
area
Deans,
directors,
academic
advisors, and
professors
Year round
E. Strengthen
intervention
processes for
students
withdrawing
from courses
Establish policy and
protocol to work
with course
withdrawals
Student
Affairs Dean,
Directors, and
Area
Coordinators
March,
2015
F. Celebrate
recognition for
goal
achievement
activities
Dean’s Honor Roll
Awards and
Medals activity
Assign a budget at
the Office of the
Dean level for these
activities and to
purchase the
awards that will be
presented in the
activities
Student
Affairs Office
Director
Academic
Advisors
Student
Affairs Dean
December
and May

76
1. Insure retention and graduation of students in order to reduce social gaps
Goals and
Objectives Strategies Activities Resources Time Frame
Recognize students
that have been able
to get out of
probationary status
Identify funding
from agencies and
professional
associations related
to education
Outcome measure # 6. Licensure rate is a shared responsibility of the EPP Academic Affairs
Deanship and EPP Academic Departments
Stakeholders involved in these plans are:
-P-12 Interactive Committee: An annual meeting is celebrated where plans, actions,
assessment data are shared and discussed to determine roles and strategies needed to
solve important issues that have arisen.
- Puerto Rico Department of Education: Meetings are held to coordinate activities and
develop processes to gather and analyze completers data and assessment results.
- School directors, private and public schools: Contacts by email, phone calls, school visits,
meetings, attendance to seminars, conferences and congresses held by the EPP to gather
and share data on assessment processes.
-Completers and cooperative teachers: contacts by email, phone calls, school visits,
meetings, attendance to seminars, conferences and congresses held by the EPP to gather
and share data on assessment processes.
Title: Verify systematic sharing of CAEP's eight outcome and impact
Measures
Evidence in need of verification or corroboration
Specific information regarding how the eight outcomes and impact measure are shared
with the community.

77
-P-12 Interactive Committee: An annual meeting is celebrated where plans, actions,
assessment data are shared and discussed to determine roles and strategies needed to
solve important issues that have arisen.
- Puerto Rico Department of Education: Meetings are held to coordinate activities and
develop processes to gather and analyze completers data and assessment results.
- School directors, private and public schools: contacts by email, phone calls, school visits,
meetings, attendance to seminars, conferences and congresses held by the EPP to gather
and share data on assessment processes.
-Completers and cooperative teachers: contacts by email, phone calls, school visits,
meetings, attendance to seminars, conferences and congresses held by the EPP to gather
and share data on assessment processes.
- Office of Evaluation Bulletin Breves Apuntes, EMHCE WEB Page, Induction WEB page and
-Teacher's Practice Blog (http://practicadocenteuprrp.wordpress.com)
-http://paideia.uprrp.edu/wp-content/uploads/2013/11/QUE-DICE-UN-GRUPO-DE-
EGRESADOS-DE-LA-FACULTAD-DE-EDUCACION.pdf
Questions for EPP concerning additional evidence, data, and/or interviews
How does the EPP share the eight outcome and impact measures with the community?
How are these measures used by all stakeholders to assess candidate impact?
Response:
In CAEP ACCREDITATION HANDBOOK, (Version 3- March 2016), STANDARD 5: Provider
Quality, Continuous Improvement, and Capacity, page 64, it is stated referring to impact
measure #8, Student loan default rates and other consumer information, that: “CAEP does
not use consumer information in accreditation decision making”; therefore, the EPP
submitted evidence of the 7 outcome and impact measures used by CAEP in accreditation
decision making.
The EPP share the 7 outcome and impact measures with the community and stakeholders,
using different strategies according to stakeholders’ role.
-P-12 Interactive Committee: An annual meeting is celebrated where plans, actions,
assessment data are shared and discussed to determine roles and strategies needed to
solve important issues that have arisen.
- Puerto Rico Department of Education: Meetings are held to coordinate activities and
develop processes to gather and analyze completers’ data and assessment results.
- School directors, private and public schools: contacts by email, phone calls, school visits,
meetings, attendance to seminars, conferences and congresses held by the EPP to gather
and share data on assessment processes.
-Completers and cooperative teachers: contacts by email, phone calls, school visits,
meetings, attendance to seminars, conferences and congresses held by the EPP to gather
and share data on assessment processes.

78
- Office of Evaluation Bulletin Breves Apuntes, EMHCE WEB Page, Induction WEB page and
-Teacher's Practice Blog (http://practicadocenteuprrp.wordpress.com)
-Portfolio evidence and processes
https://sites.google.com/a/upr.edu/profesoresportae/home
and/https://sites.google.com/a/upr.edu/portae/.
-Collaborative Project to Support Neighboring Schools -
http://educacion.uprrp.edu/proyecto-colaborativo-de-acompanamiento-a-escuelas-
aledanas-3
Preliminary recommendations for new AFIs including a rationale for each.
Area for Improvement: Rationale
AFI: The EPP's quality assurance system for EPP created assessments may not rely on valid
and reliable data.
Rationale: The EPP does not provide reliability and validity information on all EPP created
assessments.
Reliability and validity information for all EPP created assessment is provided in this
Addendum Report, Section: Quality assurance system instrument validity and reliability
of Standard 5