eurl gmff proficiency test report ct 02/17gmo-crl.jrc.ec.europa.eu/ctdocs/eurl-gmff-ct-02-17...
TRANSCRIPT
EURL-GMFF-CT-0117final CTR
EURL GMFF Proficiency Test
Report CT 0217
Determination of GM
Soybean 40-3-2 in Chicken
Feed and Soybean Flour
Broothaerts W Beaz Hidalgo R Corbisier
P Cordeiro F Dimitrievska B Emteborg
H Maretti M Robouch P Emons H
EUR 28873 EN
This publication is a Technical report by the Joint Research Centre (JRC) the European Commissionrsquos science
and knowledge service It aims to provide evidence-based scientific support to the European policymaking
process The scientific output expressed does not imply a policy position of the European Commission Neither
the European Commission nor any person acting on behalf of the Commission is responsible for the use that
might be made of this publication
Contact information European Union Reference Laboratory for GM Food and Feed European Commission Joint Research Centre Directorate F ndash Health Consumers amp Reference Materials Via E Fermi 2749 I-21027 Ispra (VA) Italy Email JRC-EURL-GMFF-CTeceuropaeu Tel +39 0332 78 9952 JRC Science Hub httpseceuropaeujrc JRC109028 EUR 28873 EN
PDF ISBN 978-92-79-76303-8 ISSN 1831-9424 doi 102760461562
Date 20 November 2017
Luxembourg Publications Office of the European Union 2017 copy European Union 2017 Reuse is authorised provided the source is acknowledged The reuse policy of European Commission documents is regulated by Decision 2011833EU (OJ L 330 14122011 p 39) For any use or reproduction of photos or other material that is not under the EU copyright permission must be sought directly from the copyright holders
How to cite this report Broothaerts W Beaz Hidalgo R Corbisier P Cordeiro F Dimitrievska B Emteborg H Maretti M Robouch P Emons H EURL GMFF Proficiency Test Report CT 0217 Determination of GM Soybean 40-3-2 in Chicken Feed and Soybean Flour EUR 28873 EN Publications Office of the European Union Luxembourg 2017 ISBN 978-92-79-76303-8 doi 10-2760461562
All images copy European Union 2017
EURL GMFF Proficiency test report CT
0217
Determination of GM Soybean 40-3-2
in Chicken Feed and Soybean Flour
Broothaerts W Beaz Hidalgo R Corbisier P Cordeiro F Dimitrievska B Emteborg H Maretti M Robouch P Emons H
268-PT Accredited by the
Belgian Accreditation Body (BELAC)
Quality assurance
The European Union Reference Laboratory for GM Food and Feed (EURL GMFF) hosted
by the Joint Research Centre (JRC-Ispra and JRC-Geel) is ISOIEC 170252005
accredited (certificate number Belac 268 TEST flexible scope for DNA extraction DNA
identification and real-time PCR) and ISOIEC 170432010 accredited (certificate
number Belac 268 PT proficiency test provider)
Confidentiality statement
The procedures used for the organisation of PTs are accredited according to ISO
170432010 and guarantee that the identity of the participants and the information
provided by them is treated as confidential The participants in this PT received a unique
laboratory code that is used throughout this report Laboratory codes of the National
Reference Laboratories appointed in line with Regulation (EC) No 8822004 will be
disclosed to DG SANTE for (long-term) performance assessment
List of abbreviations
CT Comparative test (here referred to as PT proficiency test)
EURL European Union Reference Laboratory
GMFF Genetically modified food and feed
kbp (kilo) thousand base pairs
LOQ Limit of quantification
mm Mass fraction or mass per mass percentage
NRL National Reference Laboratory
OCL Official Control Laboratory
qPCR Quantitative (real-time) Polymerase Chain Reaction
SD Standard deviation
σpt Standard deviation for proficiency assessment
Uu Expandedstandard measurement uncertainty
z and ζ Performance scores used to assess the measurement capability of a laboratory
EURL GMFF CT 0217 report
Contents
Executive summary 6
1 Introduction 7
2 Test items 8
21 Test item 1 8
22 Test item 2 10
3 Instructions to the participants 11
4 Results 12
41 Participation to the PT 12
42 Information on the testing provided in the questionnaire 14
43 GM event identification 15
44 GM event quantification 15
441 Number of participants reporting a quantitative result 15
442 Assigned values 16
443 Calculation of performance scores 17
444 Performance of the laboratories 18
5 Conclusions 23
Acknowledgements 24
References 26
Annexes 28
Annex 1 Homogeneity and stability of test items 28
A11 Homogeneity of test items 28
A12 Stability of test items 29
Annex 2 Questionnaire data 30
Annex 3 Qualitative performance of the participants 38
Annex 4 Participants quantitative performance 39
EURL GMFF CT 0217 report
646
Executive summary
The European Union Reference Laboratory for Genetically Modified Food and Feed (EURL
GMFF) organised a proficiency test (PT) for National Reference Laboratories (NRLs) to
support the official controls on food and feed in line with Regulation (EC) No 8822004
Other official control laboratories were allowed to participate on a voluntary basis
Two test items were distributed test item 1 (T1) was composed of ground chicken feed
spiked with a mixture of GM soybean event MON-Oslash4Oslash32-6 (40-3-2) and non-GM soybean
and test item 2 (T2) was a soybean flour containing the same GM soybean event 40-3-2
Participants were required to screen T1 and T2 for the presence of three GM soybean
events and to quantify the event that was present with the highest GM mass fraction The
results had to be reported in GM mass fraction (massmass )
Eighty-six participants from 39 countries participated to this PT including 54 NRLs of
which 33 are designated in line with Regulation (EC) No 8822004 (NRL882) and 21 are
nominated in Regulation (EU) No 1202014 to support the EURL GMFF on method
validation (NRL120) as well as 10 other EU official control laboratories
The qualitative results ie the correct identification of the GM event were evaluated and
scored as correct or incorrect The assigned value for the 40-3-2 soybean mass fraction in
both test materials was derived as the robust mean of the data provided by the NRLs
Laboratory performance was primarily evaluated by calculating z scores
The results reported indicate that all participants identified the correct GM event in both
test items All but one NRL obtained a satisfactory performance (z) score for the reported
40-3-2 soybean mass fraction in both test items and the performance of one other NRL
was unacceptable for T1 because they reported the 40-3-2 mass fraction as below their
LOQ Six and two NRLs obtained a questionable z score for T1 and T2 respectively
Considering the results provided by the other participants (non-NRL) three and two non-
NRLs obtained an unsatisfactory z score for T1 and T2 respectively Another three
laboratories obtained a questionable z score for T1 and one laboratory for T2
The laboratories ability to provide results close to the assigned value within their claimed
measurement uncertainty was additionally evaluated by ζ scores Twenty four and 16
laboratories had an unsatisfactory ζ scores for T1 and T2 respectively Unsatisfactory ζ
scores were mainly the consequence of an underestimated or not reported measurement
uncertainty Guidance is provided for correctly estimating the measurement uncertainty of
analytical results
A root-cause analysis will be requested from NRLs with an unsatisfactory z score result in
this PT and will be followed-up
EURL GMFF CT 0217 report
746
1 Introduction
The Joint Research Centre (JRC) of the European Commission was established as European
Union Reference Laboratory for GM Food and Feed (EURL GMFF) by Regulations (EC) No
18292003(1) and (EC) No 8822004(2) Regulation (EC) No 8822004 also requires
Member States to designate National Reference Laboratories (NRL882) for each EURL
coordinating activities for the official control of compliance with food and feed law The
analytical methods used for these controls have been validated by the EURL GMFF as
required by Regulation (EC) No 18292003 and for this task the EURL GMFF is supported
by NRLs listed in Regulation (EU) No 1202014(3) (NRL120 several of them are also
NRL882) The Member States of the European Union may also appoint other laboratories
(non-NRLs) to perform the official controls on food and feed
It is crucial that official control laboratories can accurately and reliably determine the GM
content in food and feed samples Regulation (EC) No 18292003 established a threshold
for labelling of food and feed products containing genetically modified material that is
authorised in the EU (09 ) Furthermore Regulation (EU) No 6192011(4) introduced a
minimum performance limit (01 mm ) for detecting the accidental presence in feed of
genetically modified material with pending or expired authorisation status Compliance
with these values is verified by the Member States of the European Union in the official
control of food and feed
The EURL GMFF is tasked with the organisation of proficiency tests (called comparative
tests or CT in the GMO legislation(2)) to foster the correct application of the analytical
methods available for the official controls The EURL GMFF is operating under a quality
management system which is accredited according to ISOIEC 17043(5) for the
organisation of proficiency testing
This report summarises the results obtained in a PT organised by the EURL GMFF in 2017
(CT 0217) Participation in such PTs is mandatory for NRL882 recommended for
NRL120 and open to other official control laboratories
EURL GMFF CT 0217 report
846
2 Test items
The test items used in this PT were prepared and characterised at JRC-Geel
21 Test item 1
The T1 test item was prepared from base materials that were characterised before their
use (Table 1) The base materials employed for the preparation of T1 were chicken feed
(AVEVE for biological agriculture according to EC 8342007 and EC 8892008) the ERM-
BF410ak as non GM soybean powder and the ERM-BF410bp(6) containing the MON-Oslash4Oslash32-
6 event (hereafter named 40-3-2) as spiking material (Table 1)
The chicken feed was composed according to the label of Bio maize kernels Bio soybean
oil-cake Bio-sunflower oil-cake Bio wheat Bio barley maize gluten potato proteins
calcium monophosphate calcium carbonate Bio soybean oil and sodium chloride The
analytical composition indicated a content of 175 protein 5 fat 13 ashes 5
cellulose 033 methionine 078 lysine 37 calcium 052 phosphorus and
01 sodium The chicken feed was milled using a cryo-grinding vibrating mill (Palla mill
KHD Humboldt-Wedag Koumlln DE) and sieved with a 500 microm stainless steel mesh on a
sieving machine equipped with an ultrasonic sieving aid (Russel Finex London UK) The
remaining powder was mixed in a DynaMIX CM200 (WAB Muttenz CH) for 1 h to
homogenise the distribution of the different types of seed tissues
The residual water mass fractions for the chicken feed powder and the powders of the
certified reference materials ERM-BF410ak and ERM-BF410bp were measured by
volumetric Karl Fischer titration (758 KFD Titrino Metrohm Herisau CH) The results
showed that the powders were sufficiently dry to perform the dry mixing and did not
require an additional drying step
The particle size distribution of the powders was measured using laser diffraction (PSA
Sympatec Clausthal-Zellerfeld DE) It was concluded that the particle size distribution of
these powders was sufficiently similar to allow subsequent preparations of mixtures
The amount and the quality of the DNA extracted from the chicken feed powder the non-
GM soybean flour and the GM spiking material were verified by UV spectrometry
fluorometry and gel electrophoresis A CTAB-tip 20G method (Qiagen Hilden Germany)
optimised for soybean was chosen with a sample intake of 200 mg because it yielded a
sufficient amount of DNA of PCR-grade quality from the base materials DNA extracted
with the in-house CTAB method was tested for PCR inhibition between 40 ngmicroL to 02
ngmicroL with a lectin qPCR assay (5 microL per PCR) and did not show any inhibition (Cq values
were very close to the theoretical Cq values) The PCR efficiencies ranged from 96 to 98
with a coefficient of determination (R2) between 099 and 100 confirming the absence
of significant amounts of PCR inhibitors in the extracts
The CTAB method yielded a sufficient amount of DNA of PCR-grade quality from both non-
GM and GM base materials
The level of fragmentation of the extracted DNA was investigated by 10 agarose gel
electrophoresis A smear from plusmn 12 to 1 kbp could be clearly seen in the chicken feed
DNA indicating some level of fragmentation of the extracted DNA while the DNA
extracted from the soybean materials migrated as a high molecular weight band (above 12
kbp) The amount of soybean DNA that could be extracted and amplified from the chicken
feed powder was determined by qPCR with a lectin assay using DNA from a soybean CRM
as calibrant this amount appeared to be rather low (lt1 of total DNA) The yield of
amplifiable DNA per mg of chicken feed powder and the yield of DNA measured by
PicoGreen for the soybean materials composed of pure soybean were taken into account
to calculate the amount of chicken feed powder non-GM soybean and GM soybean to be
mixed to obtain a target value of approximately 08 mm event 40-3-2 in T1
EURL GMFF CT 0217 report
946
Table 1 Characteristics of the base materials used for preparation of test item 1 (T1)
Characteristic Chicken Feed Non-GM
Soybean Flour
40-3-2
Soybean Flour
Type of base material Scratch grains CRM CRM
Origin AVEVE (Belgium) ERM-BF410ak ERM-BF410bp
Grinding method Cryo-grinding vibrating mill Used as such Used as such
Mixing method DynaMIX CM200 (WAB Muttenz CH)
Water content in gkg mean plusmn U
(k = 2 n = 3) 106 plusmn 15 115 plusmn 07 155 plusmn 10
Particle diameter in microm mean plusmn U
(k = 2 n = 5) 1114 plusmn 198 1188 plusmn 272 1213 plusmn 60
Soybean DNA yield in ngmg1 mean plusmn U
(k = 2) 07 plusmn 01 (n=5) 579 plusmn 178 (n=3) 729 plusmn 18 (n=2)
Genetic elements detected with screening
pre-spotted plates (Cq value)2
Hmg (Cq 246) Lec (247) CruA (Cq 357) UGP (281) PLD (365) P35S (Cq 333) tNOS (Cq 368) CTP2-EPSPS (Cq 357) Cry1AbAc (Cq 360) PAT (Cq 376)
Lec (Cq 215) Lec (Cq 212) p35S (Cq 212) tNOS (Cq 225) PAT (Cq 348)
GM soybean events detected with event-
specific pre-spotted plates (Cq value)2
40-3-2 (Cq 340) MON87701 (Cq 374) MON89788 (Cq 363) Lec (Cq 246)
NA 40-3-2 (Cq 214) A5547 (Cq 412)
Mass used to prepare T1 (g) 11032 96 108
Nominal target GM mass fraction in T1
(mm ) NA NA 08
1 Results reported here for a sample intake of 200 mg with the in-house validated CTAB method + Genomic-tip 20G purification for soybean (JRC-GEEL) The soybean DNA yield value for the chicken feed was determined by qPCR whereas the yield from the non-GM and GM soybean materials was measured by fluorometry 2 A screening and GM soybean event-specific pre-spotted plate (PSP) was used for these tests NA not applicable k coverage factor U expanded uncertainty
The presence of different species and GM events in the base materials and in a pilot
mixture was tested by using the screening(7) and GM soybean event-specific pre-spotted
plates(8)
The presence of maize and soybean in the chicken feed powder was confirmed by the early
quantification cycle obtained for the high mobility gene (hmg) and lectin (lec) assays Late
amplifications for the UDP-glucose pyrophosphorylase (ugp) phospholipase D (PLD) and
cruciferin A (cruA) genes confirmed the respective presence of potato sunflower and
rapeseed in the chicken feed
The chicken feed powder (labelled bio) also contained traces of genetic markers such as
p35S tNOS EPSPS and Cry1AbAc which indicate a contamination of the chicken feed by
genetically modified plant materials The GM soybean event-specific assays confirmed the
presence of traces of 3 GM soybeans namely 40-3-2 MON87701 and MON89788 The
level of contamination was estimated to be below 001
The final test item was prepared gravimetrically in accordance with ISO 170342016(9) as
follows
The mass of the GM ingredient to add (40-3-2 soybean) was calculated taking into
account the amount of DNA that could be extracted and amplified from the different
materials (Table 1)
The compound sample T1 was mixed in a DynaMIX CM200 for 15 h to improve
homogeneity
After finalisation of the mixing step the powders were filled manually in 20 mL
brown glass vials using lyophilisation inserts manually placed in the bottle necks
Before final closure of the vials air was evacuated in a freeze-dryer and replaced
by argon The vials were finally closed inside the freeze-dryer with the help of a
hydraulic device and then sealed with blue aluminium caps to maintain the inert
atmosphere and to prevent accidental opening during storage and transport
A total of 200 vials containing each at least 5 g of flour were then labelled with a
sample number and the description Sample T1 (chicken feed)
EURL GMFF CT 0217 report
1046
Following the inventory and the selection of vials for future analysis according to a
random stratified sampling scheme the bottles were brought to a storage room for
long-term storage in the dark at 4 plusmn 3 degC
Homogeneity and stability testing of T1 was performed in-house as described in Annex 1
using an event-specific quantification method previously validated by the EURL GMFF
Material T1 was found to be homogeneous for the GM event added (p-value gt 005)
based on a 200 mg sample intake
From the isochronous stability study it was concluded that the test item would be
sufficiently stable under ambient shipment conditions (5 significance level) Stability
was also confirmed during the whole period of the PT between the dispatch of the test
items until the deadline of reporting the results (Annex 1)
JRC-Ispra tested the T1 material and this confirmed the results obtained by JRC-Geel The
average (n = 91) mass fraction of event 40-3-2 measured in T1 was 069 plusmn 004 mm
(U k = 2) which approximated the expected nominal value but may have been
influenced by the characteristics of the different base materials
22 Test item 2
The T2 test item was a new batch of a certified reference material that was not yet
released on the market (Table 2) The bottles of T2 were re-labelled with a unique sample
number as Sample T2 (soybean flour)
Homogeneity and short-term stability of T2 had been previously demonstrated as part of
the certification of the CRM stability monitoring confirmed the stability of T2 during the
running time of the PT (Annex 1)
Table 2 Characteristics of test item 2 (T2)
Characteristic Soybean feed
Type of base material CRM
Origin ERM-BF410dp(6) containing 100 plusmn 06 gkg MON-Oslash4Oslash32-6 soybean produced in 2017 by JRC-Geel
The certificate of ERM-BF410dp warns that a difference (at 95 confidence level)
between the total DNA content in the two powders used for the production of ERM-
BF410dp was found to be significant (due to the different size of non-GM and GM seeds)
and is likely to have an impact when using this CRM Depending on the composition of the
unknown sample real-time PCR measurement results of ERM-BF410dp may differ up to
239 plusmn 11 (average plusmn U) compared to the results of the unknown sample This
difference may depend also on the DNA extraction method selected and both effects may
be additive This observation was confirmed by the participants in this PT who used the
previous 40-3-2 soybean CRM batch (ERM-BF410n) for the calibration of the T2
measurements
EURL GMFF CT 0217 report
1146
3 Instructions to the participants
Participants in this PT were instructed to analyse the two test items (T1 and T2) as
follows
Test Item 1 Chicken feed
- Screen for the presence of the following three GM soybean event(s) 40-3-2
68416 and MON89788
- Quantify the GM soybean event that is present with the highest GM mass fraction
Test Item 2 Soybean flour
- Screen for the presence of the following three GM soybean event(s) 40-3-2
68416 and MON89788
- Quantify the GM soybean event that is present with the highest GM mass fraction
Quantitative results had to be reported in mm as outlined below
Mass GM event [g]
mm = x 100 (1)
Total mass species [g]
Participants were requested
- to use procedures for detectionquantification of the GM events that resemble as
closely as possible the ones used in routine sample analysis
- to take care in ensuring that the DNA extraction method employed is adapted to
the matrix and that the quality of the DNA obtained is suitable for PCR
- to report the quantitative results with two decimal places (eg 064 or 129)
- to follow the general rule that results obtained using a calibrant certified for GM
mass fraction (ie a matrix CRM certified in [x] gkg) can directly be expressed in
mm while results obtained using a calibrant certified for DNA copy number
ratio (eg a plasmid containing both the GM and reference gene target or some
matrix CRMs) need to be converted into mm using a conversion factor(1011)
- to pay attention to the correct estimation and reporting of the measurement
uncertainty and coverage factor used as the uncertainty reported would be
considered in the evaluation of the results using zeta scores
- in case of an unsatisfactory performance to fill in a form indicating the root-cause
analysis and providing evidence demonstrating the effectiveness of the corrective
actions implemented (for NRLs only)
The participants were also informed that the identification information on the participants
in this PT would be kept confidential except for the NRLs that have been appointed in line
with Regulation (EC) No 8822004 their lab codes will be disclosed to DG SANTE for the
purpose of an assessment of their performance
EURL GMFF CT 0217 report
1246
4 Results
41 Participation to the PT
On 31 May 2017 199 laboratories were informed about the upcoming PT EURL-GMFF-CT-
0217 Finally 89 laboratories registered for it and received a random unique lab code
(L01 to L89) Eighty-six laboratories from 39 countries returned results within the
reporting deadline Three non-NRLs did not submit any results two of which (L21 L28)
had not received the samples from customs while L67 did not provide any justification for
not participating
Table 3 shows an overview of the participation to this PT
Table 3 Communication about and participation to the PT 0217
Characteristic of the PT Result
Date of PT announcement 31 May 2017
Deadline for registration 14 June 2017
Date of shipment of samples 3 July 2017
Deadline for result submission 25 August 2017
Number of laboratories informed 199
Number of registered laboratories 89
Registered laboratories that failed to submit their data 3
Number of participating laboratories 86
The participating laboratories fell into the following assigned categories (Table 4)
Thirty-three NRLs designated in line with Regulation (EC) No 8822004 (NRL882)
representing 25 EU Member States (many of them are also NRL120) In addition
Ireland delegated its NRL882 tasks to one of the PT participants Estonia and
Malta were not represented in this PT
Twenty-one NRLs nominated under Regulation (EU) No 1202014 (NRL120) that
are not at the same time NRL under Regulation (EC) No 8822004
Thirty-two laboratories that are not NRL but are appointed by their National
Authority to perform official controls This category includes 10 EU official control
laboratories (OCLs) and 22 laboratories from non-EU countries including Serbia
and Switzerland
Among the countries Germany was represented with 17 laboratories Italy with 6
laboratories and Belgium and Poland with 4 laboratories each all other countries had
between one and three participating laboratories
EURL GMFF CT 0217 report
1346
Table 4 Overview of participants to CT 0217 by country and category
Country Participants NRL8821 NRL120 Non-NRL
AUSTRIA 2 2
BELGIUM 4 3
1
BRAZIL 2
2
BULGARIA 2 1
1
CHILE 1
1
COLOMBIA 1
1
CROATIA 2 1
1
CYPRUS 1 1
CZECH REPUBLIC 1 1
DENMARK 1 1
FINLAND 2 1 1
FRANCE 2 2
GERMANY 17 1 14 2
GREECE 1 1
HUNGARY 2 1
1
INDIA 1
1
ITALY 6 1 2 3
LATVIA 1 1
LEBANON 1
1
LITHUANIA 1 1
LUXEMBOURG 1 1
MEXICO 1
1
NETHERLANDS 2 1 1
PHILIPPINES 1
1
POLAND 4 3 1
PORTUGAL 1 1
ROMANIA 2 1
1
SERBIA 3
3
SINGAPORE 1
1
SLOVAKIA 2 2
SLOVENIA 1 1
SPAIN 2 2
SWEDEN 1 1
SWITZERLAND 2
2
TURKEY 1
1
UKRAINE 3
3
UNITED KINGDOM 3 1 2
UNITED STATES 1
1
VIETNAM 3
3
Total 86 33 21 32 1 No NRL882 from Estonia or Malta participated to this PT
EURL GMFF CT 0217 report
1446
42 Information on the testing provided in the questionnaire
Participants were asked to fill in an online questionnaire (through EUSurvey) on their
testing methodology used for T1 and T2 consisting of a number of mostly multiple-choice
questions A total of 82 laboratories completed the questionnaire including all 33
NRL882 20 out of 21 NRL120 and 29 out of 32 non-NRLs (questionnaires were missing
from L03 L10 L38 and L49)
Table 5 summarises the main answers received whereas Annex 2 shows all answers The
results on GM event identification are reported in Section 43
Table 5 Summary of the main answers provided in the questionnaire of CT 0217
Question (and Question
number) Test Item 1 ndash 40-3-2 Test Item 2 ndash 40-3-2
Test item analysed Yes (801) No (2) Yes (82) No (0)
Reason for lack of analysis (Q1)
Matrix out of scope (1) other practical constraints (1) -
DNA extraction method (Q2) CTAB (41) NucleoSpin Food (10) CTAB (40) NucleoSpin Food (11)
Additional DNA purification method (Q3)
None (51) Ethanol (9) None (52) Ethanol (9)
Number of replicates (Q4) 2 (52) 4 (10) 2 (56) 4 (10)
Approach to test for PCR inhibition (Q5)
OD ratios (40) delta Cq or GM between two dilutions (31)
OD ratios (36) delta Cq or GM between two dilutions (32)
Reason for not testing all events (Q9)
Not applicable (45) below the LOQ (18) Not applicable (61) reagents not available (10)
Approach used (Q6a) Standard curves (68) delta Cq (9) Standard curves (71) delta Cq (9)
Calibrant used (Q6b) CRM JRC-Geel in gkg (71) other RM in copies (4) CRM JRC-Geel in gkg (74) other RM in copies (4)
Taxon-specific endogenous gene (Q6c)
lec-74 bp (65) lec-81 or 118 bp (each 5) lec-74 bp (63) lec-118 bp (6)
Unit of measurement and data expression (Q6d)
Mass (59) copies=mass CRM (13) Mass (61) copies=mass CRM (14)
Amount of DNA (Q6e) 200 ng (30) 100 ng (18) 200 ng (30) 100 ng (21)
LOQ (Q6f) 01 (37) lt01 (34) 01 (39) lt01 (39)
LOQ determination (Q6g) In-house validation (42) current analysis (20) In-house validation (43) current analysis (21)
Uncertainty determination (Q6h)
Precision of replicates (32) in-house validation (27) Precision of replicates (32) in-house validation (30)
1 The numbers shown refer to the number of laboratories that reported the answer The answers that were reported with the two largest frequencies are mentioned
One NRL882 (L73) reported that T1 was out of the scope of the laboratory and one non-
NRL (L43) reported that the T1 matrix was not analysed because of practical constraints
The evaluation of the answers shows that the most commonly employed DNA extraction
method for both T1 and T2 was one based on CTAB with the NucleoSpin Food kit ranking
second No additional purification methods were generally applied The majority of
laboratories analysed two replicate DNA extracts Most laboratories checked the quality of
the DNA extracts by verifying the OD ratios andor running two dilutions a minority of
laboratories performed a PCR inhibition run on 3 or 4 DNA dilutions with a reference gene
For the quantitative analysis the most common approach used was based on two standard
curves however 9 laboratories applied the delta Cq approach One laboratory (L50)
mentioned the use of digital PCR for 40-3-2 soybean quantification in T1 and T2 The
available CRMs from the JRC were used by most laboratories but 5 laboratories used a
non-certified reference material (RM) where values were expressed in GM copy number
ratio (4) or GM mass fraction (1) Lec was used as taxon-specific reference gene by all
laboratories for soybean (mostly the 74 bp version) The majority of laboratories
performed their measurements in the same unit as the certified value of the calibrant used
(gkg) and no conversion factor was applied The LOQ reported was either taken from in-
house validation of the method or determined from the analysis results for this CT In
most cases a LOQ of 01 mm or lower was reported The measurement uncertainty
was either derived from the standard deviation of the measurement replicates or from the
intermediate precision determined in the frame of the single-laboratory validation study
EURL GMFF CT 0217 report
1546
43 GM event identification
Table 6 summarises the results reported by the participants through the questionnaire
regarding the (qualitative) identification of the GM events
Table 6 Summary of GM event identification results of the participants as reported in the
questionnaire or (in brackets) inferred from the quantitative result reported
Laboratories Test Item GM Event Present Absent Not Tested Sample Not Analysed
NRL882 and NRL120
T1
40-3-2 52 (+1) 0 0
1 68416 0 51 1
MON89788 32 19 1
T2
40-3-2 53 (+1) 0 0
0 68416 0 52 1
MON89788 5 47 1
Non-NRLs
T1
40-3-2 28 (+2) 0 0
1 68416 1 14 13
MON89788 16 7 5
T2
40-3-2 29 (+2) 0 0
0 68416 1 14 14
MON89788 4 21 4
All 53 NRLs who had tested T1 identified the 40-3-2 event in T1 The 68416 soybean event
was found absent in T1 whereas MON89788 soybean was detected by 32 NRLs in T1
Seven NRLs also reported to have quantified MON89788 in T1 and while most laboratories
reported the GM mass fraction as being below the LOQ two laboratories reported a GM
mass fraction of 002 and 0025 mm The presence of traces of MON89788 soybean in
the chicken feed was indeed confirmed by JRC-Geel (see Table 1)
For T2 all 54 NRLs identified the 40-3-2 event and found 68416 absent MON89788
soybean was detected by 5 NRLs but quantified as below the LOQ (note that the presence
of MON89788 in T2 was not confirmed by JRC-Geel) The results show that EU NRLs are
able to correctly identify the 40-3-2 soybean event in both a compound feed matrix and in
soybean flour
The results of all non-NRLs were also satisfactory for event 40-3-2 soybean however a
larger proportion of laboratories did not test the event MON89788 and particularly
68416
The performance of all laboratories for qualitative identification of the correct GM events is
summarised in Annex 3
44 GM event quantification
441 Number of participants reporting a quantitative result
Table 7 presents the number of laboratories having submitted quantitative data for the GM
event present in the test items A large majority of participating laboratories reported a
quantitative result for 40-3-2 soybean in T1 (93 ) and T2 (97 ) Among the NRLs one
NRL120 (L88) provided a result for 40-3-2 soybean in T2 but not for T1 reporting that
the mass fraction of the 40-3-2 event was below the LOQ in T1 All NRL882 participants
quantified the event in both test items except L73 for which the T1 matrix was out of
their scope
Expanded measurement uncertainties were reported by the NRLs for all measurement
results with the coverage factor reported for 88 and 87 of the results for T1 and T2
respectively (Table 7) Although the results show that most control laboratories
understand the principle that analytical results should be reported with an expanded
uncertainty when asked it is unclear why some laboratories did not report the coverage
factor (k) used to convert the standard uncertainty into an expanded uncertainty that
corresponds to a 95 level of confidence
EURL GMFF CT 0217 report
1646
Table 7 Number of laboratories reporting a quantitative GM event-specific result
Quantitative Results
Reported
Test Item 1 ndash 40-3-2 Soybean Test Item 2 ndash 40-3-2 Soybean
NRL882 NRL120 Non-NRL NRL882 NRL120 Non-NRL
Total participants 33 21 32 33 21 32
Quantitative result 32a 20b 28c 33 21 29c
Measurement uncertainty 32 20 19 33 21 20
Coverage factor 28 18 17 28 19 18 a L73 (NRL882) did not analyse T1 as the matrix is out of the scope of the laboratory b L88 (NRL120) did not provide a quantitative result for 40-3-2 soybean in T1 c L10 L11 and L71 (non-NRLs) have not reported a quantitative result for T1 and T2 L43 has not analysed T1
442 Assigned values
The assigned value (xpt) for the mass fraction of event 40-3-2 soybean in T1 and T2 was
based on the consensus value of the data from a pre-selected part of participants in this
PT calculated using robust statistics(1213) This statistical approach minimises the
influence of outlying values The data taken into account for the calculation of the robust
means were those from the NRLs (NRL882 and NRL120) only The data from non-NRLs
were excluded because of the heterogeneity of this group with regard to experience in
GMO analysis
The results of proficiency tests for the analysis of GMOs are often log-normally distributed
(skewed)(1415) This was not the case for the results of this PT however for consistency
with previous PTs the same approach was followed as in previous rounds The results
reported by the NRLs were first log10-transformed and the robust mean (xpt-log) and
corresponding robust standard deviation (s) were calculated The standard measurement
uncertainty [u(xpt-log)] of the assigned value is assumed to include the effects of
uncertainty due to inhomogeneity and instability it is estimated according to ISO
135282015 (section 773)(16) as follows
N
s )x(u
logpt 251 (2)
where s = robust standard deviation of the results expressed in mm (log scale)
N = number of results used for the calculation (from NRLs only)
A coverage factor (k) of 2 was used to calculate the expanded uncertainty (U)
corresponding to a 95 level of confidence(17)
The assigned values and associated uncertainties for 40-3-2 soybean in both test items
are reported in Table 8 The standard deviation for proficiency assessment (σpt-log) was set
to 010 (on the log scale) for both test items based on reasonable performance
expectations and experience from previous PTs
Table 8 Overview of assigned values and uncertainties for the GM mass fraction in T1 and T2
Variable 40-3-2 Soybean in T1 40-3-2 Soybean in T2
Assigned value derived as Robust mean of log10-transformed data Robust mean of log10-transformed data
Number of data points (NRLs) 52 54
Assigned Value (xpt-log) -00973a -01186b
Standard uncertainty [u(xpt-log)] 00207 00122
Standard deviation for proficiency assessment (σpt-log)
010 010
a The assigned value for the mass fraction of 40-3-2 soybean in T1 corresponds to an approximate GM in the raw domain of 080 mm b The assigned value for the mass fraction of 40-3-2 soybean in T2 corresponds to an approximate GM in the raw domain of 076 mm
The robust mean of the 40-3-2 soybean mass fraction reported for T2 was 24 lower (on
the raw scale) than the certified value of this new batch of CRM(6) which was released in
October 2017 (ie after this PT) This observation was already noticed during CRM
production and a note on this is included in the CRM certificate (see Section 22 in this PT
EURL GMFF CT 0217 report
1746
report) Laboratories that have calibrated their measurements with the previous 40-3-2
soybean CRM (ERM-BF410n series) or another RM characterised by a 11 ratio between
the DNA content of the GM and non-GM fraction are therefore expected to measure a
much lower GM mass fraction in the new CRM than the certified value of 100 mm The
important message here is to not mix up the previous CRM batch with the new one as
both batches do not contain the same amount of transgenic copies Despite this
observation the aim of using a CRM calibrant is to have a common reference point for the
implementation of EU legislation on GMO thresholds and labelling(11)
443 Calculation of performance scores
Individual laboratory performance was expressed in terms of z and ζ scores in accordance
with ISO 135282015(16) both calculated in the log domain as follows
logpt
logpti
σ
xx
)log(z (4)
22 )x(u)x(u
)log(
logptlogi
logpti xx (5)
where xi = the measurement result as reported by a participant
u(xi) = the standard measurement uncertainty of the result reported xpt-log = the assigned value
u(xi-log) = the standard measurement uncertainty of the result reported
u(xpt-log) = the standard measurement uncertainty of the assigned value
σpt-log = the standard deviation for proficiency assessment
For calculation of the ζ scores the expanded uncertainties on the results reported by the
laboratories were translated into standard measurement uncertainties [u(xi)] using the
coverage factor reported and converted to the log domain as follows (following general
rules for the measurement uncertainty of log10-transformed values)
i
i
x
x )(u )x(u logi 4340 (6)
When no measurement uncertainty was reported it was set to zero (u(xi) = 0) When no
coverage factor was reported k was set to 173 (assuming a rectangular distribution
around the reported value with boundaries valuing plusmn Uradic3 (17))
Performance scores were calculated on the results as reported by the participants and
rounded to one decimal afterwards The interpretation of the z and ζ performance scores
was done according to ISO 170432010(5)
|score| le 20 satisfactory performance
20 lt |score| lt 30 questionable performance
|score| ge 30 unsatisfactory performance
The z score compares the participants deviation from the assigned value with the
standard deviation for proficiency assessment (σpt-log) used as common quality criterion
Measurements that are carried out correctly are assumed to generate results that can be
described by a normal distribution with mean xpt-log and standard deviation σpt-log The z
scores will then be normally distributed with a mean of zero and a standard deviation of
EURL GMFF CT 0217 report
1846
10 Only 03 of scores would be expected to fall outside the range -30 lt z lt 30 and
only 5 would be expected to fall outside the range -20 le z le 20 These percentages
may change when the true interlaboratory variability deviates from the agreed standard
deviation which was set to 010 It is unlikely that unacceptable z scores will occur by
chance when no real problem exists rather it is likely that there is an identifiable cause
for any anomaly when an unsatisfactory performance expressed as a z score is obtained
The ζ score states whether the laboratorys result agrees with the assigned value within
the respective measurement uncertainty The denominator is the combined uncertainty of
the assigned value [u(xpt-log)] and the measurement uncertainty as stated by the
laboratory [u(xi-log)] The ζ score includes all parts of a measurement result namely the
expected value (assigned value) its measurement uncertainty in the unit of the result as
well as the uncertainty of the reported values An unsatisfactory ζ score can either be
caused by the presence of a significant bias (inaccurate measurement) or by a non-
realistic estimation of the measurement uncertainty (seriously under-estimated) or by a
combination of both Participants that have obtained a satisfactory z score but an
unsatisfactory ζ score may have underestimated their measurement uncertainty
Participants that have obtained an unsatisfactory z score but a satisfactory ζ score may
have assessed the uncertainty of their result accurately but the result itself does not meet
the performance expected for the PT scheme
More detailed information about measurement uncertainty evaluation can be found in
some international standards and other guidance documents(1718192021)
444 Performance of the laboratories
The performance of the laboratories for GM quantification is primarily evaluated on the
basis of their z scores The ζ scores obtained are providing additional information to the
laboratory regarding the correct estimation of the measurement uncertainty of the result
but should be used as indicative values only
4441 z scores
Table 9 summarises the performance results obtained in this PT based on the z scores
Detailed results per laboratory are reported in Annex 4 Tables A41 and A42 and Figures
A41 and A42
Table 9 Evaluation of laboratory performance for GM event quantification through z scores
Laboratory Performance Test Item 1 Test Item 2
40-3-2 Soybean 40-3-2 Soybean
Number of laboratories with |z| le 20 (satisfactory) 67 78
Number of laboratories with 20 lt |z| lt 30 (questionable) 9 3
Number of laboratories with |z| ge 30 (unsatisfactory) 4a 2 a One additional NRL120 (L88) reported a value ltLOQ which is considered unacceptable
A total of 4 laboratories obtained an unsatisfactory performance expressed as z score for
quantification of event 40-3-2 in T1 (1 NRL882 and 3 non-NRLs) and 2 laboratories for T2
(2 non-NRL) Another 5 NRL882 1 NRL120 and 3 non-NRLs obtained a questionable z
score for T1 and one NRL882 one NRL120 and one non-NRL similarly for T2 In case of
an unsatisfactory performance obtained by an NRL the laboratory will be requested to
perform a root-cause analysis and to communicate the outcome to the EURL GMFF who
will then follow-up with the laboratory
One laboratory (L88) had reported that the 40-3-2 soybean mass fraction in T1 was below
its LOQ of 004 mm While less than X values were not included in the data
evaluation they were compared to the corresponding xpt ndash U(xpt) (after conversion to the
log scale) Since the reported less than X value was lower than the corresponding xpt ndash
U(xpt) the laboratory should have been able to quantify the analyte Therefore the
laboratory statement was considered as unsatisfactory
EURL GMFF CT 0217 report
1946
Although the performance scores were calculated on the log-transformed data the
corresponding GM mass fractions on the raw domain which are easier to understand in
daily laboratory practice approximated the following values
For 40-3-2 soybean in T1
Assigned value on the raw domain 080 mm
|z| le 20 lower and upper limits 050 ndash 128 mm
|z| lt 30 lower and upper limits 041 ndash 157 mm
For 40-3-2 soybean in T2
Assigned value on the raw domain 076 mm
|z| le 20 lower and upper limits 048 ndash 122 mm
|z| lt 30 lower and upper limits 039 ndash 150 mm
The general performance of the laboratories for quantification of event 40-3-2 soybean in
both test items was very good This event is one of the older GM events inserted in the
EU Register of authorised events in 1996 and is commonly found in feed samples on the
global market It is therefore not surprising that most laboratories are able to detect this
event and to quantify it accurately In a previous PT in 2014 (CT 0214) which also
included a chicken feed sample containing 40-3-2 soybean the general performance of the
participants was much worse (16 unsatisfactory z scores among 70 results based on an
agreed σpt-log of 020) The latter outcome was due to issues with the extraction of good
quality DNA from the highly processed matrix which contained the 40-3-2 soybean already
before processing (ie the GM soybean was not spiked in) The chicken feed used in the
current PT was from a different origin compared to the one used in CT 0214 although
also in this case the extracted DNA was at least partially degraded In contrast the DNA
from the spiked 40-3-2 soybean was of high-molecular weight (see Section 21) and
therefore easier to amplify during PCR More important is that a considerable fraction of
unprocessed non-GM soybean was added to the T1 mix to increase the total soybean
content the measurements on the DNA extracted from the latter material presumably of
good amplification quality probably contributed mainly to the denominator (ie the taxon-
specific DNA fraction) in the equation to express the GM content The improved
performance of the laboratories participating to the current PT may also be the result of
the increased experience in the extraction of PCR-grade DNA from demanding sample
matrices
Most of the results reported for T2 which was a seed-based matrix and therefore it was
easier to extract good quality DNA were close to the assigned value with its expanded
measurement uncertainty this can be seen in Figure A42 in Annex 4
The participants to this PT were requested to quantify the same GM event in a compound
feed (T1) on the one hand and in a pure soybean material (T2) on the other hand Figure
1 compares the performance of the laboratories to provide acceptable results for both
tasks The horizontal and vertical axes correspond to a z score of 0 for T1 and T2
respectively while the dashed red lines indicate the limits of the satisfactory z scores
(|z|=2) Points in the lower left or upper right quadrant corresponding to L18 and L75
indicate participants who have a systematic bias in the application of the method The
points at the far-left of the x-axis (L26 and L69) represent participants that have had a
problem particularly with T1 but not so much with T2 this may be related to the DNA
extraction part of the workflow which was more challenging for T1 compared to T2 There
are also other participants that may have had similar issues with T1 as more points lie
outside the satisfaction interval on the x-axis compared to the y-axis
For many but not all participants there seem to be a slight tendency for consistent z
scores for T1 and T2 (points along the diagonal line) which gives evidence of participant
bias that affected both test items in a similar way There are also a number of participants
that have obtained a z score close to zero for both test items and which are represented
by points close to where the horizontal and vertical axes cross eg L05 L06 L09 L44
EURL GMFF CT 0217 report
2046
L46 L50 L54 L55 L63 L64 L85 L87 and L89 (within |z|lt05 for T1 and T2) These
laboratories 12 NRLs and one non-NRL seem to have the whole analytical method
including DNA extraction and real-time PCR very well under control for different types of
samples The highly proficient non-NRL used digital PCR for both measurements indicating
that this method also seems reliable for GM soybean quantification in different matrices
Figure 1 Youden plot comparing the z scores obtained by the participants for the determination of the 40-3-2 soybean mass fraction in T1 and T2
The dashed red lines indicate the limits of satisfactory performance (|z|le20) for each test item The diagonal line displays the consistency of z scores in T1 and T2
EURL GMFF CT 0217 report
2146
4442 ζ scores
Tables A41 and A42 also report the ζ scores obtained by the laboratories as an
informative evaluation for the laboratories of their result in combination with the reported
uncertainty A total of 54 laboratories were given a satisfactory performance when
expressed as ζ score for quantification of 40-3-2 soybean in T1 3 a questionable and 24
an unsatisfactory performance score (N = 81) For 40-3-2 soybean in T2 (N = 83) 62
laboratories performed satisfactorily 5 questionable and 16 unsatisfactorily As explained
in Section 443 a bad ζ score may be due to a result that strongly deviates from the
assigned value (and has therefore also yielded an unsatisfactory performance when
expressed as a z score) or it may indicate an underestimation of the measurement
uncertainty of the result
Figures A41 and A42 (Annex 4) allow verification if the reported measurement
uncertainty bars overlap with the horizontal dashed (black) lines that delineate the
satisfactory interval for the z scores Laboratory L03 provided an expanded measurement
uncertainty of 1520 for T1 and T2 which is either strongly overestimated or corresponds
to a relative uncertainty instead of the requested absolute uncertainty in mm Also L53
has strongly overestimated its measurement uncertainty for the mass fraction of 40-3-2
soybean in T1 and T2 and L76 for T2 only although they both obtained a satisfactory ζ
score because their reported values were sufficiently close to the assigned value From the
same figures in Annex 4 it can easily be seen that several laboratories may have reported
a rather low measurement uncertainty (or no uncertainty at all) and therefore received an
unsatisfactory ζ score eg the NRLs L01 L02 L40 and L78 would have obtained a
satisfactory ζ score for 40-3-2 in T1 if they had reported a realistic measurement
uncertainty (Figure A41) Similarly for 40-3-2 in T2 (Figure A42) the results of the NRLs
L38 L40 L41 L77 L78 and L83 would have been satisfactory if they had reported a
realistic measurement uncertainty Furthermore nearly all laboratories that had not
reported a measurement uncertainty value and thus received an assumed uncertainty of
zero received an unsatisfactory ζ score From the questionnaire it was noted that 32
laboratories (ie more than 13 of all participants) estimated the measurement
uncertainty on the basis of the precision of the analysis replicates only such an approach
may not be sufficient to account for all analytical variability
ISO 135282015(16) suggests to check whether a reported standard uncertainty (with a
coverage factor k=1) is realistic and lies between a minimum and maximum uncertainty
(umin and umax) This allows participants to review their reported uncertainty and evaluate if
the reported uncertainty is counting all relevant components or is over-counting some
components It is unlikely that a participant result will have a smaller standard uncertainty
than the measurement uncertainty of the assigned value so u(xpt) can be used as a lower
limit called umin It is also unlikely that a participant reported standard uncertainty is
larger than the robust standard deviation of the (NRL) results (umax)
As an example Figure 2 compares the relative standard uncertainties (ui) reported by
the participants of this PT for T1 calculated from the expanded uncertainty U and reported
k factor and expressed as percentage of the reported result On the raw data scale umin
and umax for the 40-3-2 soybean mass fraction in T1 correspond to 5 and 28
respectively Therefore a standard measurement uncertainty smaller than 004 mm is
probably underestimated while a standard uncertainty above 023 mm may be
overestimated However these are informative indicators only Measurement uncertainties
below umin or above umax can be valid and in such case the laboratory should check the
result or the uncertainty estimate
EURL GMFF CT 0217 report
2246
Figure 2 Reported relative standard uncertainties (ui) for T1
The horizontal blue lines refer to umin and umax as defined in the text Note that the relative
uncertainty of L03 is out of scale and not shown Laboratories that failed to report a measurement uncertainty were given a zero value
EURL GMFF CT 0217 report
2346
5 Conclusions
Participants in this PT were required to analyse two test items varying in composition and
complexity but containing the same GM event The analytical tasks resembled the routine
operational analysis tasks of an official control laboratory analysing a food or feed material
for the presence of material derived from containing or consisting of GMOs
The results reported by the participants were analysed and a performance evaluation was
carried out taking into account both the qualitative and the quantitative results reported
A large majority of the participants performed satisfactorily for the tasks in this PT ie the
detection and quantification of the soybean event 40-3-2 in T1 a chicken feed powder
and in T2 a soybean flour All participants who tested for the events were able to identify
the correct event in both test items Regarding quantification four laboratories including
one NRL882 and 3 non-NRLs obtained an unsatisfactory z performance score for the 40-
3-2 soybean measurements in the more difficult feed matrix One NRL120 reported an
unacceptable ltLOQ result for the 40-3-2 soybean mass fraction in T1 but the reported
result for T2 was satisfactory Two of the non-NRL laboratories were also unsatisfactory for
the quantification of the same event in the T2 matrix
It is recommended for several laboratories to re-consider the estimation of their
measurement uncertainty in order to report a more realistic uncertainty and
consequently to obtain a satisfactory ζ performance score
EURL GMFF CT 0217 report
2446
Acknowledgements
We acknowledge the support of the members of the Advisory Board for Comparative
Testing (Lotte Hougs Nina Papazova Martin Sandberg and Manuela Schulze) for reviewing
this report and of the Reference Materials Unit of JRC particularly Brigitte Fontenelle for
taking care of the sample dispatching The laboratories listed below are acknowledged for
their participation in this exercise
Body 1 Organisation Department City Country
NRL882
AGES-Institute for Food Safety Vienna Vienna AUSTRIA Umweltbundesamt GmbH Vienna AUSTRIA CRA-W - Walloon Agricultural Research Center Valorization of agric prod Gembloux BELGIUM Institute for Agricultural and Fisheries Research Technology and Food - PI Merelbeke BELGIUM Scientific Institute of Public Health (WIV-ISP) PBB - GMOlab Brussels BELGIUM National Center of Public Health and Analyses GMO Sofia BULGARIA Croatian Institute of Public Health Zagreb CROATIA State General Laboratory GMOs and Allergens Nicosia CYPRUS
Crop Research Institute Prague CZECH REPUBLIC
Danish Veterinary and Food Administration Food Chem and Plant Health Ringsted DENMARK Finnish Customs Laboratory Espoo FINLAND BioGEVES Surgeres FRANCE Service Commun des Laboratoires Illkirch Graffenstad FRANCE Bundesamt fuumlr Verbraucherschutz und Lebensmittelsicherheit
Referat 503 Berlin GERMANY
General Chemical State Laboratory A Chemical Service of Athens Athens GREECE National Food Chain Safety Office Budapest HUNGARY Istituto Zooprofilattico Lazio e Toscana Biotechnology Unit Rome ITALY Institute of Food Safety Animal Health and Environment bdquoBIORrdquo
Riga LATVIA
National Food and Veterinary Risk Assessment Institute
Molecular Biology and GMO Vilnius LITHUANIA
Laboratoire National de Santeacute food control Dudelange LUXEMBOURG RIKILT Wageningen University amp Research Wageningen NETHERLANDS Instytut Zootechniki PIB KLP Szczecin Szczecin POLAND National Veterinary Research Institute Pulawy POLAND Regional Laboratory of Genetically Modified Food Tarnobrzeg POLAND Instituto Nacional de Investigaccedilatildeo Agraacuteria e Veterinaacuteria
UEIS-SAFSV Oeiras PORTUGAL
Institute for Diagnosis and Animal Health Molecular Biology and GMOs Bucharest ROMANIA State Veterinary and Food Institute VFI in Dolny Kubin Dolny Kubin SLOVAKIA Central Control and Testing Institute of Agriculture Bratislava
OMB NRL Bratislava SLOVAKIA
National Institute of Biology Ljubljana SLOVENIA Laboratorio Arbitral Agroalimentario LAA-MAPAMA OGM Madrid SPAIN Centro Nacional De Alimentaciograven (Agencia Espantildea De Consumo Seguridad Alimentaria Y Nutriciograven)
Biotechnology Unit Madrid SPAIN
National Food Agency Uppsala SWEDEN
LGC Teddington UNITED KINGDOM
NRL120
Finnish Food Safety Authority Evira Helsinki FINLAND Thuumlringer Landesamt fuumlr Verbraucherschutz (TLV) Lebensmittelsicherheit Bad Langensalza GERMANY LAVES-Lebensmittel- und Veterinaumlrinstitut BraunschweigHannover
Braunschweig GERMANY
Landesuntersuchungsanstalt fuumlr das Gesundheits- und Veterinaumlrwesen Sachsen
Amtliche Lebensmitteluntersuchung
Dresden GERMANY
BfR Food Safety Berlin GERMANY Landesamt fuumlr Verbraucherschutz Sachsen-Anhalt Fachbereich 3 Halle GERMANY Landesamt fuumlr Landwirtschaft Lebensmittelsicherheit und Fischerei M-V (LALLF MV)
200PCR Rostock GERMANY
Institut fuumlr Hygiene und Umwelt Hamburg Gentechnikuumlberwachungslabor Hamburg GERMANY LUFA Speyer Referat II2 Speyer GERMANY CVUA Freiburg GMO Freiburg GERMANY Bavarian Health and Food Safety Authority (LGL) Oberschleissheim GERMANY LTZ Augustenberg Karlsruhe GERMANY LLBB Berlin GERMANY Landeslabor Schleswig-Holstein Neumuumlnster GERMANY Staatliche Betriebsgesellschaft fuumlr Umwelt und Landwirtschaft
GB 6 Fachbereich 63 Nossen GERMANY
EURL GMFF CT 0217 report
2546
0
Body Organisation Department City Country
NRL120 cont
Istituto Superiore di Sanitagrave DSPVSA Rome ITALY
CREA-SCS Sede di Tavazzano Laboratorio
Tavazzano (LO) ITALY
Netherlands Food and Consumer Product Safety Authority (NVWA)
Laboratorium VV Wageningen NETHERLANDS
Plant Breeding and Acclimatization Institute NRI GMO Controlling Laboratory Blonie POLAND
Fera Science Ltd Plants York UNITED KINGDOM
SASA Scottish Government Seed certification Edinburgh UNITED KINGDOM
Non-NRL
FASFC Melle GMO Melle BELGIUM
Laboratoacuterio Nacional Agropecuaacuterio - LANAGROMG Pedro LeopoldoMG BRAZIL
Ministry of Agriculture Livestock and Food Supply Official Laboratory of Goiaacutes Goiania BRAZIL
Laboratory of SGS Bulgaria Ltd Varna BULGARIA
Servicio Agriacutecola y Ganadero Biotechnology Santiago CHILE
Instituto Nacional de Vigilancia de Medicamentos y Alimentos Invima
Laboratorio OGM Bogotaacute COLOMBIA
Croatian Centre for Agriculture Food and Rural Affairs Institute for Seed and Seedlings
Non-NRL Osijek CROATIA
CVUA-OWL Detmold GERMANY
Thuumlringer Landesanstalt fuumlr Landwirtschaft
Jena GERMANY
Biomi Ltd Godollo HUNGARY
ICAR-National Bureau of Plant Genetic Resources Division of Genomic Resources
New Delhi INDIA
IZSLER Brescia ITALY
Istituto Sperimentale Del Piemonte Liguria e Valle DAosta
SC Biotechnologie Torino ITALY
Istituto Zooprofilattico Sperimentale Abruzzo e Molise Hygiene in Food Technology Teramo ITALY
American University of Science and Technology Laboratory Science amp Technology
Ashrafieh-Beirut LEBANON
SENASICA-CNRDOGM Deteccioacuten de OGM Tecaacutemac MEXICO
Bureau of Plant Industry National Plant Quarantine Services Division Post Entry Quarantine Station
Department of Agriculture Los Banos Laguna PHILIPPINES
Laboratorul Central pentru Calitatea Semintelor si a Materialului Saditor Bucuresti
LEDOMG Bucuresti ROMANIA
Institute of Molecular Genetics and Genetic Engineering
Plant Molecular Biology Belgrade SERBIA
SP Laboratorija ad Genetical dpt Becej SERBIA
A Bio Tech Lab Laboratory for biotechnology Sremska Kamenica SERBIA
Agri-Food amp Veterinary Authority of Singapore Veterinary Public Health Labor Singapore SINGAPORE
Federal Food Safety and Veterinary Office FSVO Risk Assessment Division Bern SWITZERLAND
Agroscope Feed Analytics Posieux SWITZERLAND
Ankara Food Control Laboratory Molecular Biology Ankara TURKEY
State Scientific Research Institute of laboratory Diagnostic and Veterynary Sanitary Expertise
Research GMOs Department Kyiv UKRAINE
Ukrmetrteststandart Molecular Biology Kiev UKRAINE
Ukrainian Laboratory of Quality and Safety of Agricultural Products (ULQSAP)
Chabany village UKRAINE
USDA-GIPSA Biotechnology Laboratory Kansas City UNITED STATES
Agricultural Genetics Institute GMO Detection 04 VIETNAM
National Institute for Food Control Quality management Ha Noi VIETNAM
Quality Assurance and Testing Center 3 (QUATEST 3) Microbiology ndash GMO Testing Lab
Bienhoa VIETNAM
1 NRL882 means NRLs designated by their Member State to coordinate the activities of official laboratories for GMO control under Regulation (EC) No 8822004 NRL120 means NRLs nominated under Regulation (EU) No 1202014 to support the EURL GMFF on method validation (and not also NRL882) Non-NRL means official control laboratories from EU or non-EU countries that are not NRLs according to the Regulations mentioned above
EURL GMFF CT 0217 report
2646
References
(including those referred to in the Annexes)
1 Regulation (EC) No 18292003 of the European Parliament and of the Council of 22
September 2003 on genetically modified food and feed Off J Eur Union L 268 1-23
2 Regulation (EC) No 8822004 of the European Parliament and of the Council of 29
April 2004 on official controls performed to ensure the verification of compliance with
feed and food law animal health and animal welfare rules Off J Eur Union L 191 1-
52
3 Commission Implementing Regulation (EU) No 1202014 of 7 February 2014
amending Regulation (EC) No 19812006 on detailed rules for the implementation of
Article 32 of Regulation (EC) No 18292003 of the European Parliament and the
Council as regards the Community reference laboratory for genetically modified
organisms Off J Eur Union L 39 46-52
4 Commission Regulation (EU) No 6192011 of 24 June 2011 laying down the methods
of sampling and analysis for the official control of feed as regards presence of
genetically modified material for which an authorisation procedure is pending or the
authorisation of which has expired Off J Eur Union L 166 9-15
5 ISOIEC 170432010 Conformity assessment ndash General requirements for proficiency
testing International Organization for Standardization Geneva Switzerland
6 Dimitrievska B Kortekaas AM Seghers J Leys H Corbisier Ph Trapmann S
(2017) The certification of different mass fractions of MON-Oslash4Oslash32-6 in soya bean
powder Certified Reference Materials ERMreg-BF410ap ERMreg-BF410bp ERMreg-
BF410cp ERMreg-BF410dp and ERMreg-BF410ep EC certification report EUR 28665 EN
ISBN 978-92-79-70107-8
7 Rosa SF Gatto F Angers-Loustau A Petrillo M Kreysa J Querci M (2016)
Development and applicability of a ready-to-use PCR system for GMO screening Food
Chemistry 201 110ndash119
8 Querci M Foti N Bogni B Kluga L Broll H amp Van den Eede G (2009) Real-
time PCR-based ready-to-use multi-target analytical system for GMO detection Food
Anal Methods 2 325-336
9 ISO 170342016 General requirements for the competence of reference material
producers International Organization for Standardization Geneva Switzerland
10 Technical guidance document from the European Union Reference Laboratory for
Genetically Modified Food and Feed on the implementation of Commission Regulation
(EU) No 6192011 (httpgmo-crljrceceuropaeuguidancedocshtm)
11 Corbisier P Barbante A Berben G Broothaerts W De Loose M Emons H
Georgieva Tz Lievens A Mazzara M Papazova N Perri E Sowa S Stebih D Terzi
V Trapmann S (2017) Recommendation for the unit of measurement and the
measuring system to report traceable and comparable results expressing GM content
in accordance with EU legislation JRC Technical report (httpgmo-
crljrceceuropaeuENGLdocsWG-UoM-Final-Reportpdf)
12 Analytical Methods Committee (1989) Robust statistics ndash How not to reject outliers
Part 1 Basic Concepts Analyst 114 1359-1364
13 Analytical Methods Committee (2001) Robust statistics a method for coping with
outliers AMC Technical Brief No 6 April 2001
14 Thompson M Ellison SLR Owen L Mathieson K Powell J Key P Wood R
Damant AP (2006) Scoring in Genetically Modified Organism Proficiency Tests
Based on Log-Transformed Results J AOAC Int 89 232-239
EURL GMFF CT 0217 report
2746
15 Analytical Methods Committee (2004) GMO Proficiency Testing Interpreting z scores
derived from log-transformed data RSC AMC Technical Brief No 18 December
2004
16 ISO 135282015 Statistical methods for use in proficiency testing by interlaboratory
comparison International Organization for Standardization Geneva Switzerland
17 Ellison SLR Williams A (Eds) EurachemCITAC guide Quantifying Uncertainty in
Analytical Measurement Third edition (2012) ISBN 978-0-948926-30-3 Available
from wwweurachemorg
18 ISOIEC Guide 98-32008 (JCGMWG1100) Uncertainty of measurement - Part 3
Guide to the expression of uncertainty in measurement
19 Linsinger T (2010) Comparison of a measurement result with the certified value
Application Note 1 Luxemburg Office for Official Publications of the European
Communities (httpscrmjrceceuropaeu)
20 Trapmann S Burns M Broll H Macarthur R Wood R Zel J (2009) Guidance
Document on Measurement Uncertainty for GMO Testing Laboratories Luxembourg
Office for Official Publications of the European Communities EUR 22756 EN2-2009
21 Corbisier P Zobell O Trapmann S Auclair G and Emons H (2014) Training
Manual on GMO Quantification Proper Calibration and Estimation of Measurement
Uncertainty Luxembourg Publications Office of the European Union
(doi10278710085)
22 Thompson M Wood R (1993) The international harmonized protocol for the
proficiency testing of (chemical) analytical laboratories J AOAC Int 76 926-940
23 Powell J Owen L (2002) Reliability of Food Measurements The Application of
Proficiency Testing to GMO Analysis Accred Qual Ass 7 392-402
24 Linsinger TPJ van der Veen AMH Gawlik BM Pauwels J Lamberty A
(2004) Planning and combining of isochronous stability studies of CRMs Accred Qual
Assur 9 464-472
EURL GMFF CT 0217 report
2846
Annexes
Annex 1 Homogeneity and stability of test items
A11 Homogeneity of test items
The homogeneity of T2 was confirmed during the certification of this CRM
The assessment of the homogeneity(16) of T1 was performed after the test item had been
packed in its final form and before distribution to participants using the following
acceptance criterion
pts s 30 (A11)
Where ss is the between-test item standard deviation as determined by a 1-way random
effects ANOVA(22) and σpt is the standard deviation for comparative testing The value of
σpt the target standard deviation for proficiency assessment was based upon the
experience acquired in previous PTs and set to 010 on the log domain(23)
If the criterion according to A11 is met (ie ss le 0030) the between-test item standard
deviation contributes no more than about 10 to the standard deviation for comparative
testing
The repeatability of the test method is the square root of the mean sum of squares within-
test items MSwithin The relative between-test item standard deviation ssrel is given by
100
y
n
MSMS
s
withinbetween
rels (A12)
where MSbetween is the mean sum of squares between test items
MSwithin is the mean sum of squares within test items
n is the number of replicates for each sample
y is the mean of the homogeneity data
If MSwithin gt MSbetween then
100
1
24
y
nNn
ityrepeatabil
us bbrels (A13)
where ubb is the maximum uncertainty contribution that can be obtained by the hidden
heterogeneity of the material
Seven bottles (N = 7) were randomly selected and analysed in five replicates (n = 5) The
between-test item standard deviation was 0018 mm The criterion described in
formula (A11) was fulfilled (0018 lt 0030) indicating that T1 was adequately
homogeneous
EURL GMFF CT 0217 report
2946
A12 Stability of test items
For T1 an isochronous short-term stability study(24) involving two test samples with three
replicates each (N = 2 n = 3) was conducted over two and four weeks at +4 degC +18 degC
and +60 degC The 40-3-2 soybean mass fraction was measured by qPCR The
measurements were performed under intermediate precision conditions with respect to the
PCR plates
The results did not reveal any influence of time or storage at +4 degC or +18 degC on the
stability of the test item (compared to storage at -70 degC) with regard to the soybean event
40-3-2 mass fraction Even at 60 degC no significant trend was measured although the
extracted DNA was more fragmented as seen by agarose gel electrophoresis
The test items were shipped at ambient temperature
The stability of T1 during the period covered by the PT (approximately 5 months between
production of the test item and the deadline for results reporting) was tested by analysing
simultaneously on one PCR plate two units (N = 2 n = 3) stored either at the normal
storage temperature (4 degC) or at a reference temperature (-70 degC) The evaluation was
based on the results ratio between samples stored at 4 degC and -70 degC The data were
evaluated against storage time and regression lines were calculated The slopes of the
regression lines were tested for statistical significance (lossincrease due to storage) No
significant trend was detected at a 95 confidence level The T1 material can therefore
be stored at 4 degC and was stable during the period covered by this CT
The stability of T2 was ensured as part of the post-certification stability monitoring of
ERM-BF410p Measurements were performed simultaneously on one PCR plate as
described for T1 on units stored at the normal storage temperature (4 degC) and at a
reference temperature (-70 degC) No significant trend was detected at a 95 confidence
level The T2 material can therefore be stored at 4 degC and was stable during the period
covered by this CT
EURL GMFF CT 0217 report
3046
Annex 2 Questionnaire data
The results received from 82 laboratories were exported from the EUSurvey
Questionnaire on CT 0217 analysis and are tabulated below Multiple answers were
allowed for all questions except for the questions on the calibrant used The results of the
open questions were manually analysed and reported Answers to the questions on GM
events that were not to be quantified in the test items are not shown
Select the group to which your organisation belongs Note 882 and 120 refer to EU Regulations 8822004 and 1202014
resp select NRL120 if your organisation is ONLY listed under Regulation 1202014 select non-NRL if your organisation is
not an NRL under either EU Regulation
Answers Ratio
NRL882 33 402
NRL120 20 244
Non-NRL 29 354
No Answer 0 0
T1 Please select the option that applies and proceed with the questionnaire
Answers Ratio
T1 was not analysed go to Q1 2 244
T1 was analysed go to Q2 80 976
No Answer 0 0
T1 1 Why did you not analyse test item 1
Answers Ratio
a) The sample matrix is out of the scope of our laboratory 1 122
b) The methods are not validated in our laboratory 0 0
c) We could not obtain sufficient good quality DNA suitable for further analysis 0 0
d) Reference material primers probes or other reagents were not available (in time) 0 0
e) We tried but our analysis failed 0 0
f) Other practical constraints (instrument broken no personnel etc) 1 122
g) Other reason 0 0
No Answer 80 976
T1 2 Select the DNA extraction method used for T1
Answers Ratio
CTAB 41 50
NucleoSpin Food 10 122
NucleoSpin Plant 3 366
GeneSpin 4 488
Promega Wizard 3 366
DNeasy Plant 3 366
DNeasy Mericon Food 5 61
Biotecon Foodproof 5 61
SDS 4 488
Fast ID Genomic DNA 2 244
Maxwell 16 Plant DNA 0 0
Maxwell 16 Food Feed Seed 5 61
Generon Ion Force 1 122
Other 2 244
No Answer 2 244
T1 3 Select any additional DNA purification method used for T1
Answers Ratio
No additional clean-up 51 622
Additional ethanol precipitation 9 110
Eurofins DNAExtractor cleaning column 3 366
Promega Wizard DNA clean-up resin 6 732
Qiagen QIAQuick 4 488
Qiagen Genomic-Tip 20G 1 122
Other method (no need to specify) 7 854
No Answer 2 244
EURL GMFF CT 0217 report
3146
T1 4 Indicate the number of replicate DNA extractions used to obtain the results
Answers Ratio
1 0 0
2 52 634
3 9 110
4 10 122
5 2 244
6 6 732
gt6 1 122
No Answer 2 244
T1 5 Select the approach(es) used to show absence of PCR inhibition
Answers Ratio None (no inhibition was suspected based on experience) 6 732
We check that the optical density ratios (OD260280 260230) are acceptable 40 488
We verify that the amplification curves look normal 24 293
We run two dilutions and verify if the delta Cq or GM are as expected 31 378
We run three or four dilutions and verify if the delta Cq or GM are as expected 13 158
We perform a PCR inhibition run with a reference gene before analysis 3 or 4 dilutions linear regression extrapolation of Cq for undiluted extract compare this to the measured Cq
16 195
We add an internal positive control to the reactions and check the Cq 15 183
Other 1 122
No Answer 2 244
T1 6 Select the option applicable to your analysis for 40-3-2 soybean in T1
Answers Ratio
Not tested 0 0
Detected but not quantified 3 366
Detected and quantified please fill in Q6a-6h 77 939
Found absent 0 0
No Answer 2 244
T1 7 Select the option applicable to your analysis for 68416 soybean in T1
Answers Ratio
Not tested 14 171
Detected but not quantified 2 244
Detected and quantified please fill in Q7a-7h 0 0
Found absent 64 781
No Answer 2 244
T1 8 Select the option applicable to your analysis for MON89788 soybean in T1
Answers Ratio
Not tested 6 732
Detected but not quantified 33 402
Detected and quantified please fill in Q8a-8h 15 183
Found absent 26 317
No Answer 2 244
T1 9 If applicable why did you not test or quantify all GM events in T1
Answers Ratio
a) Not applicable all GM events listed were tested and all those detected were quantified 45 549
b) The event-specific detection method is not validated in our laboratory 7 854
c) Reference material primers probes or other reagents were not available (in time) 9 110
d) The result obtained was below the LODLOQ 18 220
e) Practical constraints (instrument broken no personnel etc) 0 0
f) Other reason 9 110
No Answer 2 244
T1 6a Soybean 40-3-2 Which quantification approach was used
Answers Ratio
Standard curve method (2 calibration curves) 68 829
Delta Cq method (one calibration curve) 9 110
Digital PCR (no calibration curve) 2 244
EURL GMFF CT 0217 report
3246
No Answer 5 61
T1 6b Select the calibrant used for the 40-3-2 standard curve
Answers Ratio
CRM from JRC (ex-IRMM) certified in GM mass fraction (gkg) 71 866
Non-certified RM (eg lab QC material) expressed in GM mass fraction (gkg or mm ) 1 122
Non-certified RM (eg lab QC material) expressed in GM DNA copy number ratio (eg determined by digital PCR)
4 488
No calibrant used digital PCR done 1 122
No Answer 5 61
T1 6c Select the endogenous target(s) used for relative quantification of 40-3-2 soybean in T1
Answers Ratio
Soybean lec 74 bp (40-3-2 MON89788 MON87701 44406 356043 305423 etc) 65 793
Soybean lec 81 bp (Pauli et al 2001) 5 61
Soybean lec 102 bp (A5547 FG72) 1 122
Soybean lec 105 bp (A2704) 0 0
Soybean lec 118 bp (Shindo et al 2002) 5 61
Other please specify below 1 122
No Answer 5 61
Specify the reference target(s) used (if different from above)
SOJA LEKTIN 80 bp - Va M Pijnenburrg H Gendre F Brignon P (1999) J Agric Food Chem 475261-5266
T1 6d Clarify the unit of measurement used and any conversion between units if applicable Carefully read the choices
below and select the one used in the measurements that resulted in a final result in GM mm for 40-3-2 If unclear or a
different approach was used please clarify this in the free text box below
Answers Ratio
The RM and the calibration standards were expressed in mass (or mass ) no conversion factor was applied
59 720
The calibration standards were expressed in DNA copies calculated from the RM in gkg but a conversion factor of 1 was applied (eg 10 mm GM = 10 cpcp GM corresponding to a 10x dilution of a 100 RM)
13 159
The calibration standards were expressed in DNA copies calculated from the RM in gkg and a conversion factor gt1 was applied to take account of the zygosity and target gene copies (double conversion applied) a conversion factor (eg 2) was used to convert from mass to copies (eg 20 mm GM = 10 cpcp GM corresponding to a 5x dilution of a 100 RM) the final result was again converted to mm by using the same conversion factor (eg x 2) Please specify this factor below
0 0
The measurements were done in DNA copies (as the RM used was expressed in this unit or digital PCR was used) A conversion factor was applied onto the final GM please specify this factor below
2 244
The measurements were done in DNA copies (as the RM used was expressed in this unit or digital PCR was used) No conversion factor was applied onto the final GM
3 366
No Answer 5 61
Conversion factor used to turn results into mm if applicable andor clarification on preparation of standards
1
Conversion factor of 1
T1 6e What was the amount of sample DNA (ng) used per PCR for 40-3-2 Choose the concentration that is closest to what
you used If applicable select multiple concentrations (eg if several dilutions were tested) but only those of which the
result was used to determine the reported GM
Answers Ratio
DNA concentration not determined 12 146
250 ng 5 61
200 ng 30 366
150 ng 9 110
100 ng 18 220
50 ng 14 171
25 ng 6 732
15 ng 0 0
lt10 ng 0 0
No Answer 5 61
EURL GMFF CT 0217 report
3346
T1 6f What was the LOQ (in mm ) for the 40-3-2 quantification
Answers
001 3 002 4 003 1 004 6 005 7 006 2 008 4 009 7 01 37 019 1 02 1 03 1 035 1 04 1 13 1
T1 6g How was the LOQ for 40-3-2 determined (if applicable)
Answers Ratio
Determined from the qPCR analysis for the current sample 20 244
Determined during the in-house validation of the method 42 512
Taken from the EURL GMFF validation report 17 207
By another approach please explain below 2 244
No Answer 5 61
Explanation on alternative LOQ determination
Determined from the digital PCR analysis for the current sample Information about LOQ introduced by the manufacturer (R-Biopharm) of diagnostic kit The u was obtain through the estimation of the sd taking into account the repeatability and intermediate precision associated with the test sample Coverage factor k = 2 was applied then
T1 6h How did you estimate the measurement uncertainty on the result reported for 40-3-2 soybean
Answers Ratio
Uncertainty budget (ISO GUM) 2 244
Uncertainty of the method (in-house validation) 27 329
Known uncertainty of the standard method 9 110
Measurement of replicates (precision) 32 390
From interlaboratory comparison data 4 488
Estimation based on judgement 2 244
In another way please specify below 6 732
No Answer 5 61
Explanation on alternative determination of measurement uncertainty
U=Sa radic1p+1n+(c0-c)2Sxx
Uncertainty=Coverage Factor (P=95 anf f=n-1) Standard Deviation Square-root (Number of Measurements)
MU was estimated according to the Guidance Document on MU for GMO Testing Laboratories JRC ISSN 1018-5593
we used a calculated k-factor based on the number of repeats
Estimation based on within laboratory reproducibility
95 confidence interval of the results for the current sample
The u was obtain through the estimation of the sd taking into account the repeatability and intermediate precision associated with the test sample Coverage factor k = 2 was applied then
Combined Uncertainty (CRM + measurement) following Application note (Lingsinger 2005 JRC Geel)
Additional comments and suggestions
MON89788 soybean was detected but not quantified because results for this event were lt LOQ
We saw in the qPCR for MON89788 Ct-values at 37 - 39 but lt LOD (lt 002 )
Additional tests with one extract performed with Nucleospin Food Kit and with one extract performed with CTAB+Nucleospin Food Kit showed no significant differences in event detection and GTS 40-3-2 quantification (examined with digital PCR)
T19 not all detected GM were asked to be quantified
For T1 trace amounts of MON89788 were detected either in qualitative screening as well as in quantification The givencalculated GM (mm) of 002 is well below the known and validated LOQ of the method which is 01 We detected a low level of MON89788 but as this quantified at 0006 lower than the threshold for reporting we took this as a negative result
According course material of JRC GMO Quantification Proper calibration and Estimation of Measurement Uncertainty
MU is based on intermediate precision data
EURL GMFF CT 0217 report
3446
The sample was strongly inhibited MON89788 was detected under LOQ
In T1 the measured GM for MON89788 of 001 is below the determined LOQ (02) therefore no MU was reported
MON89788 was detected in traces at the LOD
MON89788 SOY result obtained below the LOQ but copy numbers of MON89788 was above LOD
T1 was inhibited A 10x dilution of the DNA was needed to get a reasonable result
DNA extraction of T1 has conducted using DNA extraction kits SureFood Prep Basic (S1052) and SureFood Prep Advanced (S1053) R-Biopharm AG Identification of Soya GM-lines was conducted using diagnostic kits SureFood GMO ID Roundup Ready Soya (S2030) and SureFood GMO ID RR2Y (S2034) Quantification kits were SureFood GMO Quant Roundup Ready Soya (S2014) SureFood GMO Quant 35S soya (S2028) and SureFood GMO Quant RR2Y Soya (S2029) R-Biopharm AG MON89788 soybean was detected in sample T1 but only in some cases - 2 PCR replicates were always positive out of 4 after several repetitions
Remark (precision) in relation to T18 and T19 MON89788 soybean was detected in the sample but not quantified because of lt LOQ
T2 Please select the option that applies and proceed with the questionnaire
Answers Ratio
T2 was not analysed go to Q1 0 0
T2 was analysed go to Q2 82 100
No Answer 0 0
T2 1 Why did you not analyse test item 2
Answers Ratio
a) The sample matrix is out of the scope of our laboratory 0 0
b) The methods are not validated in our laboratory 0 0
c) We could not obtain sufficient good quality DNA suitable for further analysis 0 0
d) Reference material primers probes or other reagents were not available (in time) 0 0
e) We tried but our analysis failed 0 0
f) Other practical constraints (instrument broken no personnel etc) 0 0
g) Other reason 0 0
No Answer 82 100
T2 2 Select the DNA extraction method used for T2
Answers Ratio
CTAB 40 488
NucleoSpin Food 11 134
NucleoSpin Plant 3 366
GeneSpin 4 488
Promega Wizard 3 366
DNeasy Plant 3 366
DNeasy Mericon Food 4 488
Biotecon Foodproof 5 61
SDS 4 488
Fast ID Genomic DNA 3 366
Maxwell 16 Plant DNA 0 0
Maxwell 16 Food Feed Seed 4 488
Generon Ion Force 1 122
Other 2 244
No Answer 0 0
T2 3 Select any additional DNA purification method used for T2
Answers Ratio
No additional clean-up 52 634
Additional ethanol precipitation 9 110
Eurofins DNAExtractor cleaning column 3 366
Promega Wizard DNA clean-up resin 6 732
Qiagen QIAQuick 5 61
Qiagen Genomic-Tip 20G 1 122
Other method (no need to specify) 8 976
No Answer 0 0
EURL GMFF CT 0217 report
3546
T2 4 Indicate the number of replicate DNA extractions used to obtain the results
Answers Ratio
1 0 0
2 56 683
3 9 110
4 10 122
5 2 244
6 4 488
gt6 1 122
No Answer 0 0
T2 5 Select the approach(es) used to show absence of PCR inhibition
Answers Ratio
None (no inhibition was suspected based on experience) 7 854
We run two dilutions and verify if the delta Cq or GM are as expected 32 390
We run three or four dilutions and verify if the delta Cq or GM are as expected 12 146
We perform a PCR inhibition run with a reference gene before analysis 3 or 4 dilutions linear regression extrapolation of Cq of undiluted extract compare this to the measured Cq
15 183
We add an internal positive control to the reactions and check the Cq 16 195
We verify that the amplification curves look normal 25 305
We check that the optical density ratios (OD260280 260230) are acceptable 36 439
Other 1 122
No Answer 0 0
T2 6 Select the option applicable to your analysis for 40-3-2 soybean in T2
Answers Ratio
Not tested 0 0
Detected but not quantified 2 244
Detected and quantified please fill in Q6a-6h 80 976
Found absent 0 0
No Answer 0 0
T2 7 Select the option applicable to your analysis for 68416 soybean in T2
Answers Ratio
Not tested 15 183
Detected but not quantified 1 122
Detected and quantified please fill in Q7a-7h 0 0
Found absent 66 805
No Answer 0 0
T2 8 Select the option applicable to your analysis for MON89788 soybean in T2
Answers Ratio
Not tested 5 61
Detected but not quantified 6 732
Detected and quantified please fill in Q8a-8h 3 366
Found absent 68 829
No Answer 0 0
T2 9 If applicable why did you not test or quantify all GM events in T2
Answers Ratio
a) Not applicable all GM events listed were tested and all those detected were quantified 61 744
b) The event-specific detection method is not validated in our laboratory 6 732
c) Reference material primers probes or other reagents were not available (in time) 10 122
d) The result obtained was below the LODLOQ 5 61
e) Practical constraints (instrument broken no personnel etc) 0 0
f) Other reason 2 244
No Answer 0 0
T2 6a 40-3-2 Which quantification approach was used
Answers Ratio
Standard curve method (2 calibration curves) 71 866
Delta Cq method (one calibration curve) 9 110
Digital PCR (no calibration curve) 2 244
EURL GMFF CT 0217 report
3646
No Answer 2 244
T2 6b Select the calibrant used for the 40-3-2 standard curve
Answers Ratio
CRM from JRC (ex-IRMM) certified in GM mass fraction (gkg) 74 902
CRM from IRMM certified in GM copy number ratio (plasmid CRM) 0 0
Non-certified RM (eg lab QC material) expressed in GM mass fraction (gkg or mm ) 1 122
Non-certified RM (eg lab QC material) expressed in GM DNA copy number ratio (eg determined by digital PCR)
4 488
No calibrant used digital PCR done 1 122
No Answer 2 244
T2 6c Select the endogenous target(s) used for relative quantification of 40-3-2 soybean in T2
Answers Ratio
Soybean lec 74 bp (40-3-2 MON89788 MON87701 44406 356043 305423 etc) 63 768
Soybean lec 81 bp (Pauli et al 2001) 5 61
Soybean lec 102 bp (A5547 FG72) 1 122
Soybean lec 105 bp (A2704) 0 0
Soybean lec 118 bp (Shindo et al 2002) 6 732
Other please specify below 2 244
No Answer 5 61
Specify the reference target(s) used (if different from above)
Lectin - 74bp
lec 74bp
Lectine
SOJA LEKTIN 80 bp Va M Pijnenburrg H Gendre F Brignon P (1999) J Agric Food Chem 475261-5266
Terry C F Harris N Event-specific detection of Roundup Ready soya using two different real time PCR detection chemistries Eur Food Res Technol (2001) 213425-431
T2 6d Clarify the unit of measurement used and any conversion between units if applicable Carefully read the choices
below and select the one used in the measurements that resulted in a final result in GM mm for 40-3-2 If unclear or a
different approach was used please clarify this in the free text box below
Answers Ratio
The RM and the calibration standards were expressed in mass (or mass ) no conversion factor was applied
61 744
The calibration standards were expressed in DNA copies calculated from the RM in gkg but a conversion factor of 1 was applied (eg 10 mm GM = 10 cpcp GM corresponding to a 10x dilution of a 100 RM)
14 171
The calibration standards were expressed in DNA copies calculated from the RM in gkg and a conversion factor gt1 was applied to take account of the zygosity and target gene copies (double conversion applied) a conversion factor (eg 2) was used to convert from mass to copies (eg 20 mm GM = 10 cpcp GM corresponding to a 5x dilution of a 100 RM) the final result was again converted to mm by using the same conversion factor (eg x 2) Please specify this factor below
0 0
The measurements were done in DNA copies (as the RM used was expressed in this unit or digital PCR was used) A conversion factor was applied onto the final GM please specify this factor below
2 244
The measurements were done in DNA copies (as the RM used was expressed in this unit or digital PCR was used) No conversion factor was applied onto the final GM
3 366
No Answer 2 244
Conversion factor used to turn results into mm if applicable andor clarification on preparation of standards
1
Conversion factor of 1
T2 6e What was the amount of sample DNA (ng) used per PCR for 40-3-2 Choose the concentration that is closest to what
you used If applicable select multiple concentrations (eg if several dilutions were tested) but only those of which the
result was used to determine the reported GM
Answers Ratio
DNA concentration not determined 12 146
250 ng 5 61
200 ng 30 366
150 ng 7 854
100 ng 21 256
EURL GMFF CT 0217 report
3746
50 ng 17 207
25 ng 7 854
15 ng 2 244
lt10 ng 0 0
No Answer 2 244
T2 6f What was the LOQ (in mm ) for the 40-3-2 quantification
Answers
001 5 002 6 003 1 004 7 005 7 006 2 007 1 008 2 009 8 01 39 026 1 028 1
T2 6g How was the LOQ for 40-3-2 determined (if applicable)
Answers Ratio
Determined from the qPCR analysis for the current sample 21 256
Determined during the in-house validation of the method 43 524
Taken from the EURL GMFF validation report 19 232
By another approach please explain below 3 366
No Answer 2 244
Explanation on alternative LOQ determination
Determined from the digital PCR analysis for the current sample
Information about LOQ introduced by the manufacturer (R-Biopharm) of diagnostic kit
T2 6h How did you estimate the measurement uncertainty on the result reported for 40-3-2
Answers Ratio
Uncertainty budget (ISO GUM) 2 244
Uncertainty of the method (in-house validation) 30 366
Known uncertainty of the standard method 8 976
Measurement of replicates (precision) 32 390
From interlaboratory comparison data 4 488
Estimation based on judgement 2 244
In another way please specify below 7 854
No Answer 2 244
Explanation on alternative determination of measurement uncertainty
U=Sa radic1p+1n+(c0-c)2Sxx Uncertainty=Coverage Factor (P=95 anf f=n-1) Standard Deviation Square-root (Number of Measurements)
MU was estimated according to the Guidance Document on MU for GMO Testing Laboratories JRC ISSN 1018-5593
We used a calculated k-factor based on the number of repeats
Estimation based on within laboratory reproducibility
95 confidence interval of the results for the current sample
30 of the quantification result
The u was obtain through the estimation of the sd taking into account the repeatability and intermediate precision associated with the test sample Coverage factor k = 2 was applied then
Combined Uncertainty (CRM + measurement) following Application note (Lingsinger 2005 JRC Geel)
Additional comments and suggestions
Event 68416 was not tested due to non-availability of Positive control and reference material
DNA extraction of T2 has conducted using DNA extraction kits SureFood Prep Basic etc (see T1)
The NucleoSpin Food + NucleoSpin gDNA Clean-up was also used for DNA extraction from T1 and T2 samples The results for 40-3-2 were 25 - 30 lower than CTAB results T1 050 +- 018 (ww) T2 058 +- 020 (ww)
AOCS 0906-B as calibrant for MON89788 in T2 also
EURL GMFF CT 0217 report
3846
Annex 3 Qualitative performance of the participants
Table A31 Performance of the participants for the qualitative identification of GM events in CT-0217
The correct answer (yes) is that the GM event has been detected in the test item
Lab 40-3-2 detected in T1 40-3-2 detected in T2 Lab 40-3-2 detected in T1 40-3-2 detected in T2
L01 yes yes L45 yes yes
L02 yes yes L46 yes yes
L03 yes yes L47 yes yes
L04 yes yes L48 yes yes
L05 yes yes L49 yes yes
L06 yes yes L50 yes yes
L07 yes yes L51 yes yes
L08 yes yes L52 yes yes
L09 yes yes L53 yes yes
L10 yes Yes L54 yes yes
L11 yes yes L55 yes yes
L12 yes yes L56 yes yes
L13 yes yes L57 yes yes
L14 yes yes L58 yes yes
L15 yes yes L59 yes yes
L16 yes yes L60 yes yes
L17 yes yes L61 yes yes
L18 yes yes L62 yes yes
L19 yes yes L63 yes yes
L20 yes yes L66 yes yes
L22 yes yes L68 yes yes
L23 yes yes L69 yes yes
L24 yes yes L70 yes yes
L25 yes yes L71 yes yes
L26 yes yes L72 yes yes
L27 yes yes L73 T1 was not analysed yes
L29 yes yes L74 yes yes
L30 yes yes L75 yes yes
L31 yes yes L76 yes yes
L32 yes yes L77 yes yes
L33 yes yes L78 yes yes
L34 yes yes L79 yes yes
L35 yes yes L80 yes yes
L36 yes yes L81 yes yes
L37 yes yes L82 yes yes
L38 yes yes L83 yes yes
L39 yes yes L84 yes yes
L40 yes yes L85 yes yes
L41 yes yes L86 yes yes
L42 yes yes L87 yes yes
L43 T1 was not analysed yes L88 yes yes
L44 yes yes L89 yes yes
Although the questionnaire was not returned by the participant the presence of the event was inferred from the quantitative result reported
L10 did not fill in the questionnaire but reported a larger than 01 result for T1 and T2
EURL GMFF CT 0217 report
3946
Annex 4 Participants quantitative performance
The z and ζ scores of all laboratories are reported in Tables A41 and A42 and in Figures
A41 and A42 for 40-3-2 soybean in T1 and T2 respectively For consistency the
reported results are shown with two decimals the performance scores with one decimal
The z scores are displayed in green (satisfactory) orange (questionable) or red cells
(unsatisfactory)
Table A41 Quantitative results (in mm ) and performance scores of participants of CT-0217 for 40-3-2 soybean in chicken feed (T1)
Lab1 Category xi U k2 Log(xi) u(xi) u(xi-log) z score ζ score3
L01 NRL120 064 008 200 -019 004 003 -10 -28
L02 NRL882 057 002 200 -024 001 001 -15 -67
L03 Non-NRL 073 1520 200 -014 760 452 -04 00
L04 Non-NRL 075
-012 000 000 -03 -13
L05 NRL120 073 007 257 -014 003 002 -04 -15
L06 NRL882 075 021 200 -012 011 006 -03 -04
L07 NRL882 065 013 200 -019 007 004 -09 -19
L08 NRL120 062 023 200 -021 012 008 -11 -13
L09 NRL882 081 027 200 -009 014 007 01 01
L12 Non-NRL 100 051 200 000 026 011 10 09
L13 NRL882 094 019 173 -003 011 005 07 13
L14 Non-NRL 063
-020 000 000 -10 -50
L15 NRL882 110 011 200 004 005 002 14 46
L16 Non-NRL 117
007 000 000 17 80
L17 NRL882 072 010 200 -014 005 003 -05 -12
L18 Non-NRL 040
-040 000 000 -30 -145
L19 Non-NRL 115 063 173 006 036 014 16 11
L20 NRL120 108 032 200 003 016 006 13 19
L22 Non-NRL 051 030 223 -029 013 011 -20 -17
L23 Non-NRL 047 009 200 -033 005 004 -23 -50
L24 NRL882 072 019 200 -014 010 006 -05 -07
L25 Non-NRL 120
008 000 000 18 85
L26 NRL882 023 009 200 -064 005 008 -54 -62
L27 Non-NRL 098 015 200 -001 008 003 09 23
L29 NRL120 090 008 173 -005 005 002 05 17
L30 NRL882 045 013 200 -035 007 006 -25 -38
L31 NRL882 080 038 223 -010 017 009 00 00
L32 Non-NRL 076 039 200 -012 020 011 -02 -02
L33 NRL-120 057 014 200 -024 007 005 -15 -26
L34 NRL120 061 016 200 -021 008 006 -12 -19
L35 NRL882 097 027 200 -001 014 006 08 13
L36 Non-NRL 090 030 200 -005 015 007 05 07
L37 NRL120 065 026 200 -019 013 009 -09 -10
L38 NRL120 093 014 237 -003 006 003 07 19
L39 Non-NRL 112
005 000 000 15 71
L40 NRL882 053 008 200 -028 004 003 -18 -46
L41 NRL120 080 003 200 -010 002 001 00 00
L42 NRL882 104 031 200 002 016 006 11 17
L44 NRL120 084 007 257 -008 003 001 02 09
L45 NRL882 065 018 200 -019 009 006 -09 -14
L46 NRL882 081 018 200 -009 009 005 01 01
L47 NRL882 141 027 173 015 016 005 25 47
L48 NRL882 059 028 200 -023 014 010 -13 -13
L49 Non-NRL 089 031 200 -005 016 008 05 06
L50 NRL120 073 005 200 -014 003 001 -04 -15
L51 Non-NRL 077 049 200 -011 025 014 -02 -01
L52 Non-NRL 091 012 200 -004 006 003 06 16
L53 Non-NRL 043 081 200 -037 041 041 -27 -07
L54 NRL882 074 035 200 -013 018 010 -03 -03
L55 Non-NRL 076 019 173 -012 011 006 -02 -03
EURL GMFF CT 0217 report
4046
Lab1 Category xi U k2 Log(xi) u(xi) u(xi-log) z score ζ score3
L56 NRL882 115 022 173 006 013 005 16 30
L57 NRL120 075 020 200 -012 010 006 -03 -04
L58 NRL120 089 016 200 -005 008 004 05 11
L59 NRL882 137 038 200 014 019 006 23 37
L60 NRL882 068 017 200 -017 009 005 -07 -12
L61 Non-NRL 065
-019 000 000 -09 -43
L62 NRL120 130 037 237 011 016 005 21 38
L63 Non-NRL 088 006 200 -006 003 001 04 16
L64 NRL882 081 024 173 -009 014 007 01 01
L65 Non-NRL 116 065 200 006 033 012 16 13
L66 NRL882 048 024 200 -032 012 011 -22 -20
L68 NRL882 139 015 200 014 008 002 24 77
L69 Non-NRL 010 004 200 -101 002 008 -91 -105
L70 Non-NRL 057 010 200 -024 005 004 -15 -34
L72 NRL882 108 032 200 003 016 007 13 19
L74 NRL882 075 019 200 -012 010 005 -03 -05
L75 Non-NRL 862
094 000 000 103 499
L76 NRL882 099 038 200 000 019 008 09 11
L77 NRL120 075 009 226 -012 004 002 -03 -09
L78 NRL120 059 006 300 -023 002 001 -13 -52
L79 Non-NRL 046
-034 000 000 -24 -116
L80 NRL120 071 024 200 -015 012 007 -05 -07
L81 NRL882 071 028 200 -015 014 009 -05 -06
L82 NRL120 092 015 200 -004 008 004 06 15
L83 NRL120 114 013 173 006 008 003 15 44
L84 Non-NRL 071 030 200 -015 015 009 -05 -05
L85 NRL882 074 031 201 -013 015 009 -03 -04
L86 Non-NRL 066 022 200 -018 011 007 -08 -11
L87 NRL882 085 015 200 -007 008 004 03 06
L88 NRL-120 lt0044
L89 NRL882 079 022 200 -010 011 006 -01 -01
1 One NRL882 (L73) did not report a quantitative result for 40-3-2 in T1 because T1 is out of scope of the laboratory 2 If the k factor was not reported by the laboratory a value of 173 was assigned (radic3) for calculation of the ζ score 3 The ζ scores are provided for information only with indicative of a questionable score and of an unsatisfactory score 4 The less than value reported by the laboratory is considered unsatisfactory
EURL GMFF CT 0217 report
4146
Table A42 Quantitative results (in mm ) and performance scores of participants of CT-0217 for
40-3-2 soybean in soybean flour (T2)
Lab1 Category xi U k2 Log(xi) u(xi) u(xi-log) z score ζ score3
L01 NRL120 071 007 200 -015 004 002 -03 -12
L02 NRL882 081 003 200 -009 002 001 03 19
L03 Non-NRL 088 1520 200 -006 760 375 06 00
L04 Non-NRL 089
-005 000 000 07 56
L05 NRL120 075 005 257 -012 002 001 -01 -04
L06 NRL882 080 022 200 -010 011 006 02 04
L07 NRL882 076 009 200 -012 005 003 00 00
L08 NRL120 042 016 200 -038 008 008 -26 -31
L09 NRL882 081 027 200 -009 014 007 03 04
L12 Non-NRL 076 039 200 -012 020 011 00 00
L13 NRL882 069 011 173 -016 006 004 -04 -10
L14 Non-NRL 075
-012 000 000 -01 -05
L15 NRL882 084 011 200 -008 005 003 04 14
L16 Non-NRL 088
-006 000 000 06 52
L17 NRL882 075 010 200 -012 005 003 -01 -02
L18 Non-NRL 034
-047 000 000 -35 -287
L19 Non-NRL 089 016 173 -005 009 005 07 15
L20 NRL120 104 031 200 002 016 006 14 21
L22 Non-NRL 081 026 223 -009 012 006 03 04
L23 Non-NRL 064 012 200 -019 006 004 -08 -18
L24 NRL882 079 021 200 -010 011 006 02 03
L25 Non-NRL 085
-007 000 000 05 39
L26 NRL882 117 039 200 007 020 007 19 25
L27 Non-NRL 118 018 200 007 009 003 19 54
L29 NRL120 078 004 173 -011 002 001 01 06
L30 NRL882 069 020 200 -016 010 006 -04 -07
L31 NRL882 096 077 233 -002 033 015 10 07
L32 Non-NRL 090 039 200 -005 020 009 07 08
L33 NRL-120 078 004 200 -011 002 001 01 06
L34 NRL120 073 014 200 -014 007 004 -02 -04
L35 NRL882 095 027 200 -002 014 006 10 15
L36 Non-NRL 077 003 200 -011 002 001 01 03
L37 NRL120 075 010 200 -012 005 003 -01 -02
L38 NRL120 119 008 237 008 003 001 19 112
L39 Non-NRL 062
-021 000 000 -09 -73
L40 NRL882 045 008 200 -035 004 004 -23 -56
L41 NRL120 087 002 200 -006 001 000 06 44
L42 NRL882 068 020 200 -017 010 006 -05 -08
L43 Non-NRL 065
-019 000 000 -07 -56
L44 NRL120 074 006 220 -013 003 002 -01 -06
L45 NRL882 073 021 200 -014 011 006 -02 -03
L46 NRL882 081 018 200 -009 009 005 03 05
L47 NRL882 062 012 173 -021 007 005 -09 -18
L48 NRL882 074 035 173 -013 020 012 -01 -01
L49 Non-NRL 073 026 200 -014 013 008 -02 -02
L50 NRL120 081 007 200 -009 004 002 03 12
L51 Non-NRL 068 044 200 -017 022 014 -05 -03
L52 Non-NRL 073 011 200 -014 006 003 -02 -05
L53 Non-NRL 058 081 200 -024 041 030 -12 -04
L54 NRL882 073 026 200 -014 013 008 -02 -02
L55 Non-NRL 072 018 173 -014 010 006 -02 -04
L56 NRL882 066 018 173 -018 010 007 -06 -09
L57 NRL120 060 020 200 -022 010 007 -10 -14
L58 NRL120 067 011 200 -017 006 004 -06 -15
L59 NRL882 076 022 200 -012 011 006 00 00
L60 NRL882 080 020 200 -010 010 005 02 04
L61 Non-NRL 050
-030 000 000 -18 -150
EURL GMFF CT 0217 report
4246
Lab1 Category xi U k2 Log(xi) u(xi) u(xi-log) z score ζ score3
L62 NRL120 075 012 245 -012 005 003 -01 -02
L63 Non-NRL 075 004 200 -012 002 001 -01 -04
L64 NRL882 078 023 173 -011 013 007 01 01
L65 Non-NRL 051 023 200 -029 012 010 -17 -18
L66 NRL882 073 024 200 -014 012 007 -02 -02
L68 NRL882 091 011 200 -004 006 003 08 27
L69 Non-NRL 092 035 200 -004 018 008 08 10
L70 Non-NRL 050 009 200 -030 005 004 -18 -45
L72 NRL882 092 028 200 -004 014 007 08 12
L73 NRL882 092 030 200 -004 015 007 08 11
L74 NRL882 064 013 200 -019 007 004 -08 -16
L75 Non-NRL 644
081 000 000 93 760
L76 NRL882 056 099 200 -025 050 038 -13 -03
L77 NRL120 054 006 226 -027 003 002 -15 -61
L78 NRL120 065 001 300 -019 000 000 -07 -55
L79 Non-NRL 071
-015 000 000 -03 -25
L80 NRL120 095 030 200 -002 015 007 10 14
L81 NRL882 077 032 200 -011 016 009 01 01
L82 NRL120 102 032 200 001 016 007 13 18
L83 NRL120 084 005 173 -008 003 001 04 22
L84 Non-NRL 045 030 200 -035 015 014 -23 -16
L85 NRL882 082 015 212 -009 007 004 03 08
L86 Non-NRL 073 024 200 -014 012 007 -02 -02
L87 NRL882 077 012 200 -011 006 003 01 01
L88 NRL120 065 020 200 -019 010 007 -07 -10
L89 NRL882 077 021 200 -011 011 006 01 01
1 All participating NRL882 reported a quantitative result for 40-3-2 soybean in T2 2 If the k factor was not reported by the laboratory a value of 173 was assigned (radic3) for calculation of the ζ score 3 The ζ scores are provided for information only with indicative of a questionable score and of an unsatisfactory score
EURL GMFF CT 0217 report 4346
Figure A41 Laboratory results for soybean event 40-3-2 in test item 1 and kernel density distribution (insert)
The horizontal full line shows the assigned value (on the log scale) the dashed black lines represent the expanded measurement uncertainty of the assigned value and the wider interval (dashed red lines) represents the limits of satisfaction (|z|le 20) Laboratory results are shown with the expanded measurement uncertainties (when reported) the expanded measurement uncertainty of L03 is out of scale
EURL GMFF CT 0217 report 4446
Figure A42 Laboratory results for soybean event 40-3-2 in test item 2 and kernel density distribution (insert)
The horizontal full line shows the assigned value (on the log scale) the dashed black lines represent the expanded measurement uncertainty of the assigned value and the wider interval (dashed red lines) represents the limits of satisfaction (|z|le 20) Laboratory results are shown with the expanded measurement uncertainties (when reported) the expanded measurement uncertainty of L03 is out of scale
Europe Direct is a service to help you find answers
to your questions about the European Union
Freephone number ()
00 800 6 7 8 9 10 11 () The information given is free as are most calls (though some operators phone boxes or hotels may
charge you)
More information on the European Union is available on the internet (httpeuropaeu)
HOW TO OBTAIN EU PUBLICATIONS
Free publications
bull one copy
via EU Bookshop (httpbookshopeuropaeu)
bull more than one copy or postersmaps
from the European Unionrsquos representations (httpeceuropaeurepresent_enhtm) from the delegations in non-EU countries (httpeeaseuropaeudelegationsindex_enhtm) by contacting the Europe Direct service (httpeuropaeueuropedirectindex_enhtm) or calling 00 800 6 7 8 9 10 11 (freephone number from anywhere in the EU) () () The information given is free as are most calls (though some operators phone boxes or hotels may charge you)
Priced publications
bull via EU Bookshop (httpbookshopeuropaeu)
KJ-N
A-2
8873-E
N-N
doi 102760461562
ISBN 978-92-79-76303-8
EURL GMFF CT 0217 report
Contents
Executive summary 6
1 Introduction 7
2 Test items 8
21 Test item 1 8
22 Test item 2 10
3 Instructions to the participants 11
4 Results 12
41 Participation to the PT 12
42 Information on the testing provided in the questionnaire 14
43 GM event identification 15
44 GM event quantification 15
441 Number of participants reporting a quantitative result 15
442 Assigned values 16
443 Calculation of performance scores 17
444 Performance of the laboratories 18
5 Conclusions 23
Acknowledgements 24
References 26
Annexes 28
Annex 1 Homogeneity and stability of test items 28
A11 Homogeneity of test items 28
A12 Stability of test items 29
Annex 2 Questionnaire data 30
Annex 3 Qualitative performance of the participants 38
Annex 4 Participants quantitative performance 39
EURL GMFF CT 0217 report
646
Executive summary
The European Union Reference Laboratory for Genetically Modified Food and Feed (EURL
GMFF) organised a proficiency test (PT) for National Reference Laboratories (NRLs) to
support the official controls on food and feed in line with Regulation (EC) No 8822004
Other official control laboratories were allowed to participate on a voluntary basis
Two test items were distributed test item 1 (T1) was composed of ground chicken feed
spiked with a mixture of GM soybean event MON-Oslash4Oslash32-6 (40-3-2) and non-GM soybean
and test item 2 (T2) was a soybean flour containing the same GM soybean event 40-3-2
Participants were required to screen T1 and T2 for the presence of three GM soybean
events and to quantify the event that was present with the highest GM mass fraction The
results had to be reported in GM mass fraction (massmass )
Eighty-six participants from 39 countries participated to this PT including 54 NRLs of
which 33 are designated in line with Regulation (EC) No 8822004 (NRL882) and 21 are
nominated in Regulation (EU) No 1202014 to support the EURL GMFF on method
validation (NRL120) as well as 10 other EU official control laboratories
The qualitative results ie the correct identification of the GM event were evaluated and
scored as correct or incorrect The assigned value for the 40-3-2 soybean mass fraction in
both test materials was derived as the robust mean of the data provided by the NRLs
Laboratory performance was primarily evaluated by calculating z scores
The results reported indicate that all participants identified the correct GM event in both
test items All but one NRL obtained a satisfactory performance (z) score for the reported
40-3-2 soybean mass fraction in both test items and the performance of one other NRL
was unacceptable for T1 because they reported the 40-3-2 mass fraction as below their
LOQ Six and two NRLs obtained a questionable z score for T1 and T2 respectively
Considering the results provided by the other participants (non-NRL) three and two non-
NRLs obtained an unsatisfactory z score for T1 and T2 respectively Another three
laboratories obtained a questionable z score for T1 and one laboratory for T2
The laboratories ability to provide results close to the assigned value within their claimed
measurement uncertainty was additionally evaluated by ζ scores Twenty four and 16
laboratories had an unsatisfactory ζ scores for T1 and T2 respectively Unsatisfactory ζ
scores were mainly the consequence of an underestimated or not reported measurement
uncertainty Guidance is provided for correctly estimating the measurement uncertainty of
analytical results
A root-cause analysis will be requested from NRLs with an unsatisfactory z score result in
this PT and will be followed-up
EURL GMFF CT 0217 report
746
1 Introduction
The Joint Research Centre (JRC) of the European Commission was established as European
Union Reference Laboratory for GM Food and Feed (EURL GMFF) by Regulations (EC) No
18292003(1) and (EC) No 8822004(2) Regulation (EC) No 8822004 also requires
Member States to designate National Reference Laboratories (NRL882) for each EURL
coordinating activities for the official control of compliance with food and feed law The
analytical methods used for these controls have been validated by the EURL GMFF as
required by Regulation (EC) No 18292003 and for this task the EURL GMFF is supported
by NRLs listed in Regulation (EU) No 1202014(3) (NRL120 several of them are also
NRL882) The Member States of the European Union may also appoint other laboratories
(non-NRLs) to perform the official controls on food and feed
It is crucial that official control laboratories can accurately and reliably determine the GM
content in food and feed samples Regulation (EC) No 18292003 established a threshold
for labelling of food and feed products containing genetically modified material that is
authorised in the EU (09 ) Furthermore Regulation (EU) No 6192011(4) introduced a
minimum performance limit (01 mm ) for detecting the accidental presence in feed of
genetically modified material with pending or expired authorisation status Compliance
with these values is verified by the Member States of the European Union in the official
control of food and feed
The EURL GMFF is tasked with the organisation of proficiency tests (called comparative
tests or CT in the GMO legislation(2)) to foster the correct application of the analytical
methods available for the official controls The EURL GMFF is operating under a quality
management system which is accredited according to ISOIEC 17043(5) for the
organisation of proficiency testing
This report summarises the results obtained in a PT organised by the EURL GMFF in 2017
(CT 0217) Participation in such PTs is mandatory for NRL882 recommended for
NRL120 and open to other official control laboratories
EURL GMFF CT 0217 report
846
2 Test items
The test items used in this PT were prepared and characterised at JRC-Geel
21 Test item 1
The T1 test item was prepared from base materials that were characterised before their
use (Table 1) The base materials employed for the preparation of T1 were chicken feed
(AVEVE for biological agriculture according to EC 8342007 and EC 8892008) the ERM-
BF410ak as non GM soybean powder and the ERM-BF410bp(6) containing the MON-Oslash4Oslash32-
6 event (hereafter named 40-3-2) as spiking material (Table 1)
The chicken feed was composed according to the label of Bio maize kernels Bio soybean
oil-cake Bio-sunflower oil-cake Bio wheat Bio barley maize gluten potato proteins
calcium monophosphate calcium carbonate Bio soybean oil and sodium chloride The
analytical composition indicated a content of 175 protein 5 fat 13 ashes 5
cellulose 033 methionine 078 lysine 37 calcium 052 phosphorus and
01 sodium The chicken feed was milled using a cryo-grinding vibrating mill (Palla mill
KHD Humboldt-Wedag Koumlln DE) and sieved with a 500 microm stainless steel mesh on a
sieving machine equipped with an ultrasonic sieving aid (Russel Finex London UK) The
remaining powder was mixed in a DynaMIX CM200 (WAB Muttenz CH) for 1 h to
homogenise the distribution of the different types of seed tissues
The residual water mass fractions for the chicken feed powder and the powders of the
certified reference materials ERM-BF410ak and ERM-BF410bp were measured by
volumetric Karl Fischer titration (758 KFD Titrino Metrohm Herisau CH) The results
showed that the powders were sufficiently dry to perform the dry mixing and did not
require an additional drying step
The particle size distribution of the powders was measured using laser diffraction (PSA
Sympatec Clausthal-Zellerfeld DE) It was concluded that the particle size distribution of
these powders was sufficiently similar to allow subsequent preparations of mixtures
The amount and the quality of the DNA extracted from the chicken feed powder the non-
GM soybean flour and the GM spiking material were verified by UV spectrometry
fluorometry and gel electrophoresis A CTAB-tip 20G method (Qiagen Hilden Germany)
optimised for soybean was chosen with a sample intake of 200 mg because it yielded a
sufficient amount of DNA of PCR-grade quality from the base materials DNA extracted
with the in-house CTAB method was tested for PCR inhibition between 40 ngmicroL to 02
ngmicroL with a lectin qPCR assay (5 microL per PCR) and did not show any inhibition (Cq values
were very close to the theoretical Cq values) The PCR efficiencies ranged from 96 to 98
with a coefficient of determination (R2) between 099 and 100 confirming the absence
of significant amounts of PCR inhibitors in the extracts
The CTAB method yielded a sufficient amount of DNA of PCR-grade quality from both non-
GM and GM base materials
The level of fragmentation of the extracted DNA was investigated by 10 agarose gel
electrophoresis A smear from plusmn 12 to 1 kbp could be clearly seen in the chicken feed
DNA indicating some level of fragmentation of the extracted DNA while the DNA
extracted from the soybean materials migrated as a high molecular weight band (above 12
kbp) The amount of soybean DNA that could be extracted and amplified from the chicken
feed powder was determined by qPCR with a lectin assay using DNA from a soybean CRM
as calibrant this amount appeared to be rather low (lt1 of total DNA) The yield of
amplifiable DNA per mg of chicken feed powder and the yield of DNA measured by
PicoGreen for the soybean materials composed of pure soybean were taken into account
to calculate the amount of chicken feed powder non-GM soybean and GM soybean to be
mixed to obtain a target value of approximately 08 mm event 40-3-2 in T1
EURL GMFF CT 0217 report
946
Table 1 Characteristics of the base materials used for preparation of test item 1 (T1)
Characteristic Chicken Feed Non-GM
Soybean Flour
40-3-2
Soybean Flour
Type of base material Scratch grains CRM CRM
Origin AVEVE (Belgium) ERM-BF410ak ERM-BF410bp
Grinding method Cryo-grinding vibrating mill Used as such Used as such
Mixing method DynaMIX CM200 (WAB Muttenz CH)
Water content in gkg mean plusmn U
(k = 2 n = 3) 106 plusmn 15 115 plusmn 07 155 plusmn 10
Particle diameter in microm mean plusmn U
(k = 2 n = 5) 1114 plusmn 198 1188 plusmn 272 1213 plusmn 60
Soybean DNA yield in ngmg1 mean plusmn U
(k = 2) 07 plusmn 01 (n=5) 579 plusmn 178 (n=3) 729 plusmn 18 (n=2)
Genetic elements detected with screening
pre-spotted plates (Cq value)2
Hmg (Cq 246) Lec (247) CruA (Cq 357) UGP (281) PLD (365) P35S (Cq 333) tNOS (Cq 368) CTP2-EPSPS (Cq 357) Cry1AbAc (Cq 360) PAT (Cq 376)
Lec (Cq 215) Lec (Cq 212) p35S (Cq 212) tNOS (Cq 225) PAT (Cq 348)
GM soybean events detected with event-
specific pre-spotted plates (Cq value)2
40-3-2 (Cq 340) MON87701 (Cq 374) MON89788 (Cq 363) Lec (Cq 246)
NA 40-3-2 (Cq 214) A5547 (Cq 412)
Mass used to prepare T1 (g) 11032 96 108
Nominal target GM mass fraction in T1
(mm ) NA NA 08
1 Results reported here for a sample intake of 200 mg with the in-house validated CTAB method + Genomic-tip 20G purification for soybean (JRC-GEEL) The soybean DNA yield value for the chicken feed was determined by qPCR whereas the yield from the non-GM and GM soybean materials was measured by fluorometry 2 A screening and GM soybean event-specific pre-spotted plate (PSP) was used for these tests NA not applicable k coverage factor U expanded uncertainty
The presence of different species and GM events in the base materials and in a pilot
mixture was tested by using the screening(7) and GM soybean event-specific pre-spotted
plates(8)
The presence of maize and soybean in the chicken feed powder was confirmed by the early
quantification cycle obtained for the high mobility gene (hmg) and lectin (lec) assays Late
amplifications for the UDP-glucose pyrophosphorylase (ugp) phospholipase D (PLD) and
cruciferin A (cruA) genes confirmed the respective presence of potato sunflower and
rapeseed in the chicken feed
The chicken feed powder (labelled bio) also contained traces of genetic markers such as
p35S tNOS EPSPS and Cry1AbAc which indicate a contamination of the chicken feed by
genetically modified plant materials The GM soybean event-specific assays confirmed the
presence of traces of 3 GM soybeans namely 40-3-2 MON87701 and MON89788 The
level of contamination was estimated to be below 001
The final test item was prepared gravimetrically in accordance with ISO 170342016(9) as
follows
The mass of the GM ingredient to add (40-3-2 soybean) was calculated taking into
account the amount of DNA that could be extracted and amplified from the different
materials (Table 1)
The compound sample T1 was mixed in a DynaMIX CM200 for 15 h to improve
homogeneity
After finalisation of the mixing step the powders were filled manually in 20 mL
brown glass vials using lyophilisation inserts manually placed in the bottle necks
Before final closure of the vials air was evacuated in a freeze-dryer and replaced
by argon The vials were finally closed inside the freeze-dryer with the help of a
hydraulic device and then sealed with blue aluminium caps to maintain the inert
atmosphere and to prevent accidental opening during storage and transport
A total of 200 vials containing each at least 5 g of flour were then labelled with a
sample number and the description Sample T1 (chicken feed)
EURL GMFF CT 0217 report
1046
Following the inventory and the selection of vials for future analysis according to a
random stratified sampling scheme the bottles were brought to a storage room for
long-term storage in the dark at 4 plusmn 3 degC
Homogeneity and stability testing of T1 was performed in-house as described in Annex 1
using an event-specific quantification method previously validated by the EURL GMFF
Material T1 was found to be homogeneous for the GM event added (p-value gt 005)
based on a 200 mg sample intake
From the isochronous stability study it was concluded that the test item would be
sufficiently stable under ambient shipment conditions (5 significance level) Stability
was also confirmed during the whole period of the PT between the dispatch of the test
items until the deadline of reporting the results (Annex 1)
JRC-Ispra tested the T1 material and this confirmed the results obtained by JRC-Geel The
average (n = 91) mass fraction of event 40-3-2 measured in T1 was 069 plusmn 004 mm
(U k = 2) which approximated the expected nominal value but may have been
influenced by the characteristics of the different base materials
22 Test item 2
The T2 test item was a new batch of a certified reference material that was not yet
released on the market (Table 2) The bottles of T2 were re-labelled with a unique sample
number as Sample T2 (soybean flour)
Homogeneity and short-term stability of T2 had been previously demonstrated as part of
the certification of the CRM stability monitoring confirmed the stability of T2 during the
running time of the PT (Annex 1)
Table 2 Characteristics of test item 2 (T2)
Characteristic Soybean feed
Type of base material CRM
Origin ERM-BF410dp(6) containing 100 plusmn 06 gkg MON-Oslash4Oslash32-6 soybean produced in 2017 by JRC-Geel
The certificate of ERM-BF410dp warns that a difference (at 95 confidence level)
between the total DNA content in the two powders used for the production of ERM-
BF410dp was found to be significant (due to the different size of non-GM and GM seeds)
and is likely to have an impact when using this CRM Depending on the composition of the
unknown sample real-time PCR measurement results of ERM-BF410dp may differ up to
239 plusmn 11 (average plusmn U) compared to the results of the unknown sample This
difference may depend also on the DNA extraction method selected and both effects may
be additive This observation was confirmed by the participants in this PT who used the
previous 40-3-2 soybean CRM batch (ERM-BF410n) for the calibration of the T2
measurements
EURL GMFF CT 0217 report
1146
3 Instructions to the participants
Participants in this PT were instructed to analyse the two test items (T1 and T2) as
follows
Test Item 1 Chicken feed
- Screen for the presence of the following three GM soybean event(s) 40-3-2
68416 and MON89788
- Quantify the GM soybean event that is present with the highest GM mass fraction
Test Item 2 Soybean flour
- Screen for the presence of the following three GM soybean event(s) 40-3-2
68416 and MON89788
- Quantify the GM soybean event that is present with the highest GM mass fraction
Quantitative results had to be reported in mm as outlined below
Mass GM event [g]
mm = x 100 (1)
Total mass species [g]
Participants were requested
- to use procedures for detectionquantification of the GM events that resemble as
closely as possible the ones used in routine sample analysis
- to take care in ensuring that the DNA extraction method employed is adapted to
the matrix and that the quality of the DNA obtained is suitable for PCR
- to report the quantitative results with two decimal places (eg 064 or 129)
- to follow the general rule that results obtained using a calibrant certified for GM
mass fraction (ie a matrix CRM certified in [x] gkg) can directly be expressed in
mm while results obtained using a calibrant certified for DNA copy number
ratio (eg a plasmid containing both the GM and reference gene target or some
matrix CRMs) need to be converted into mm using a conversion factor(1011)
- to pay attention to the correct estimation and reporting of the measurement
uncertainty and coverage factor used as the uncertainty reported would be
considered in the evaluation of the results using zeta scores
- in case of an unsatisfactory performance to fill in a form indicating the root-cause
analysis and providing evidence demonstrating the effectiveness of the corrective
actions implemented (for NRLs only)
The participants were also informed that the identification information on the participants
in this PT would be kept confidential except for the NRLs that have been appointed in line
with Regulation (EC) No 8822004 their lab codes will be disclosed to DG SANTE for the
purpose of an assessment of their performance
EURL GMFF CT 0217 report
1246
4 Results
41 Participation to the PT
On 31 May 2017 199 laboratories were informed about the upcoming PT EURL-GMFF-CT-
0217 Finally 89 laboratories registered for it and received a random unique lab code
(L01 to L89) Eighty-six laboratories from 39 countries returned results within the
reporting deadline Three non-NRLs did not submit any results two of which (L21 L28)
had not received the samples from customs while L67 did not provide any justification for
not participating
Table 3 shows an overview of the participation to this PT
Table 3 Communication about and participation to the PT 0217
Characteristic of the PT Result
Date of PT announcement 31 May 2017
Deadline for registration 14 June 2017
Date of shipment of samples 3 July 2017
Deadline for result submission 25 August 2017
Number of laboratories informed 199
Number of registered laboratories 89
Registered laboratories that failed to submit their data 3
Number of participating laboratories 86
The participating laboratories fell into the following assigned categories (Table 4)
Thirty-three NRLs designated in line with Regulation (EC) No 8822004 (NRL882)
representing 25 EU Member States (many of them are also NRL120) In addition
Ireland delegated its NRL882 tasks to one of the PT participants Estonia and
Malta were not represented in this PT
Twenty-one NRLs nominated under Regulation (EU) No 1202014 (NRL120) that
are not at the same time NRL under Regulation (EC) No 8822004
Thirty-two laboratories that are not NRL but are appointed by their National
Authority to perform official controls This category includes 10 EU official control
laboratories (OCLs) and 22 laboratories from non-EU countries including Serbia
and Switzerland
Among the countries Germany was represented with 17 laboratories Italy with 6
laboratories and Belgium and Poland with 4 laboratories each all other countries had
between one and three participating laboratories
EURL GMFF CT 0217 report
1346
Table 4 Overview of participants to CT 0217 by country and category
Country Participants NRL8821 NRL120 Non-NRL
AUSTRIA 2 2
BELGIUM 4 3
1
BRAZIL 2
2
BULGARIA 2 1
1
CHILE 1
1
COLOMBIA 1
1
CROATIA 2 1
1
CYPRUS 1 1
CZECH REPUBLIC 1 1
DENMARK 1 1
FINLAND 2 1 1
FRANCE 2 2
GERMANY 17 1 14 2
GREECE 1 1
HUNGARY 2 1
1
INDIA 1
1
ITALY 6 1 2 3
LATVIA 1 1
LEBANON 1
1
LITHUANIA 1 1
LUXEMBOURG 1 1
MEXICO 1
1
NETHERLANDS 2 1 1
PHILIPPINES 1
1
POLAND 4 3 1
PORTUGAL 1 1
ROMANIA 2 1
1
SERBIA 3
3
SINGAPORE 1
1
SLOVAKIA 2 2
SLOVENIA 1 1
SPAIN 2 2
SWEDEN 1 1
SWITZERLAND 2
2
TURKEY 1
1
UKRAINE 3
3
UNITED KINGDOM 3 1 2
UNITED STATES 1
1
VIETNAM 3
3
Total 86 33 21 32 1 No NRL882 from Estonia or Malta participated to this PT
EURL GMFF CT 0217 report
1446
42 Information on the testing provided in the questionnaire
Participants were asked to fill in an online questionnaire (through EUSurvey) on their
testing methodology used for T1 and T2 consisting of a number of mostly multiple-choice
questions A total of 82 laboratories completed the questionnaire including all 33
NRL882 20 out of 21 NRL120 and 29 out of 32 non-NRLs (questionnaires were missing
from L03 L10 L38 and L49)
Table 5 summarises the main answers received whereas Annex 2 shows all answers The
results on GM event identification are reported in Section 43
Table 5 Summary of the main answers provided in the questionnaire of CT 0217
Question (and Question
number) Test Item 1 ndash 40-3-2 Test Item 2 ndash 40-3-2
Test item analysed Yes (801) No (2) Yes (82) No (0)
Reason for lack of analysis (Q1)
Matrix out of scope (1) other practical constraints (1) -
DNA extraction method (Q2) CTAB (41) NucleoSpin Food (10) CTAB (40) NucleoSpin Food (11)
Additional DNA purification method (Q3)
None (51) Ethanol (9) None (52) Ethanol (9)
Number of replicates (Q4) 2 (52) 4 (10) 2 (56) 4 (10)
Approach to test for PCR inhibition (Q5)
OD ratios (40) delta Cq or GM between two dilutions (31)
OD ratios (36) delta Cq or GM between two dilutions (32)
Reason for not testing all events (Q9)
Not applicable (45) below the LOQ (18) Not applicable (61) reagents not available (10)
Approach used (Q6a) Standard curves (68) delta Cq (9) Standard curves (71) delta Cq (9)
Calibrant used (Q6b) CRM JRC-Geel in gkg (71) other RM in copies (4) CRM JRC-Geel in gkg (74) other RM in copies (4)
Taxon-specific endogenous gene (Q6c)
lec-74 bp (65) lec-81 or 118 bp (each 5) lec-74 bp (63) lec-118 bp (6)
Unit of measurement and data expression (Q6d)
Mass (59) copies=mass CRM (13) Mass (61) copies=mass CRM (14)
Amount of DNA (Q6e) 200 ng (30) 100 ng (18) 200 ng (30) 100 ng (21)
LOQ (Q6f) 01 (37) lt01 (34) 01 (39) lt01 (39)
LOQ determination (Q6g) In-house validation (42) current analysis (20) In-house validation (43) current analysis (21)
Uncertainty determination (Q6h)
Precision of replicates (32) in-house validation (27) Precision of replicates (32) in-house validation (30)
1 The numbers shown refer to the number of laboratories that reported the answer The answers that were reported with the two largest frequencies are mentioned
One NRL882 (L73) reported that T1 was out of the scope of the laboratory and one non-
NRL (L43) reported that the T1 matrix was not analysed because of practical constraints
The evaluation of the answers shows that the most commonly employed DNA extraction
method for both T1 and T2 was one based on CTAB with the NucleoSpin Food kit ranking
second No additional purification methods were generally applied The majority of
laboratories analysed two replicate DNA extracts Most laboratories checked the quality of
the DNA extracts by verifying the OD ratios andor running two dilutions a minority of
laboratories performed a PCR inhibition run on 3 or 4 DNA dilutions with a reference gene
For the quantitative analysis the most common approach used was based on two standard
curves however 9 laboratories applied the delta Cq approach One laboratory (L50)
mentioned the use of digital PCR for 40-3-2 soybean quantification in T1 and T2 The
available CRMs from the JRC were used by most laboratories but 5 laboratories used a
non-certified reference material (RM) where values were expressed in GM copy number
ratio (4) or GM mass fraction (1) Lec was used as taxon-specific reference gene by all
laboratories for soybean (mostly the 74 bp version) The majority of laboratories
performed their measurements in the same unit as the certified value of the calibrant used
(gkg) and no conversion factor was applied The LOQ reported was either taken from in-
house validation of the method or determined from the analysis results for this CT In
most cases a LOQ of 01 mm or lower was reported The measurement uncertainty
was either derived from the standard deviation of the measurement replicates or from the
intermediate precision determined in the frame of the single-laboratory validation study
EURL GMFF CT 0217 report
1546
43 GM event identification
Table 6 summarises the results reported by the participants through the questionnaire
regarding the (qualitative) identification of the GM events
Table 6 Summary of GM event identification results of the participants as reported in the
questionnaire or (in brackets) inferred from the quantitative result reported
Laboratories Test Item GM Event Present Absent Not Tested Sample Not Analysed
NRL882 and NRL120
T1
40-3-2 52 (+1) 0 0
1 68416 0 51 1
MON89788 32 19 1
T2
40-3-2 53 (+1) 0 0
0 68416 0 52 1
MON89788 5 47 1
Non-NRLs
T1
40-3-2 28 (+2) 0 0
1 68416 1 14 13
MON89788 16 7 5
T2
40-3-2 29 (+2) 0 0
0 68416 1 14 14
MON89788 4 21 4
All 53 NRLs who had tested T1 identified the 40-3-2 event in T1 The 68416 soybean event
was found absent in T1 whereas MON89788 soybean was detected by 32 NRLs in T1
Seven NRLs also reported to have quantified MON89788 in T1 and while most laboratories
reported the GM mass fraction as being below the LOQ two laboratories reported a GM
mass fraction of 002 and 0025 mm The presence of traces of MON89788 soybean in
the chicken feed was indeed confirmed by JRC-Geel (see Table 1)
For T2 all 54 NRLs identified the 40-3-2 event and found 68416 absent MON89788
soybean was detected by 5 NRLs but quantified as below the LOQ (note that the presence
of MON89788 in T2 was not confirmed by JRC-Geel) The results show that EU NRLs are
able to correctly identify the 40-3-2 soybean event in both a compound feed matrix and in
soybean flour
The results of all non-NRLs were also satisfactory for event 40-3-2 soybean however a
larger proportion of laboratories did not test the event MON89788 and particularly
68416
The performance of all laboratories for qualitative identification of the correct GM events is
summarised in Annex 3
44 GM event quantification
441 Number of participants reporting a quantitative result
Table 7 presents the number of laboratories having submitted quantitative data for the GM
event present in the test items A large majority of participating laboratories reported a
quantitative result for 40-3-2 soybean in T1 (93 ) and T2 (97 ) Among the NRLs one
NRL120 (L88) provided a result for 40-3-2 soybean in T2 but not for T1 reporting that
the mass fraction of the 40-3-2 event was below the LOQ in T1 All NRL882 participants
quantified the event in both test items except L73 for which the T1 matrix was out of
their scope
Expanded measurement uncertainties were reported by the NRLs for all measurement
results with the coverage factor reported for 88 and 87 of the results for T1 and T2
respectively (Table 7) Although the results show that most control laboratories
understand the principle that analytical results should be reported with an expanded
uncertainty when asked it is unclear why some laboratories did not report the coverage
factor (k) used to convert the standard uncertainty into an expanded uncertainty that
corresponds to a 95 level of confidence
EURL GMFF CT 0217 report
1646
Table 7 Number of laboratories reporting a quantitative GM event-specific result
Quantitative Results
Reported
Test Item 1 ndash 40-3-2 Soybean Test Item 2 ndash 40-3-2 Soybean
NRL882 NRL120 Non-NRL NRL882 NRL120 Non-NRL
Total participants 33 21 32 33 21 32
Quantitative result 32a 20b 28c 33 21 29c
Measurement uncertainty 32 20 19 33 21 20
Coverage factor 28 18 17 28 19 18 a L73 (NRL882) did not analyse T1 as the matrix is out of the scope of the laboratory b L88 (NRL120) did not provide a quantitative result for 40-3-2 soybean in T1 c L10 L11 and L71 (non-NRLs) have not reported a quantitative result for T1 and T2 L43 has not analysed T1
442 Assigned values
The assigned value (xpt) for the mass fraction of event 40-3-2 soybean in T1 and T2 was
based on the consensus value of the data from a pre-selected part of participants in this
PT calculated using robust statistics(1213) This statistical approach minimises the
influence of outlying values The data taken into account for the calculation of the robust
means were those from the NRLs (NRL882 and NRL120) only The data from non-NRLs
were excluded because of the heterogeneity of this group with regard to experience in
GMO analysis
The results of proficiency tests for the analysis of GMOs are often log-normally distributed
(skewed)(1415) This was not the case for the results of this PT however for consistency
with previous PTs the same approach was followed as in previous rounds The results
reported by the NRLs were first log10-transformed and the robust mean (xpt-log) and
corresponding robust standard deviation (s) were calculated The standard measurement
uncertainty [u(xpt-log)] of the assigned value is assumed to include the effects of
uncertainty due to inhomogeneity and instability it is estimated according to ISO
135282015 (section 773)(16) as follows
N
s )x(u
logpt 251 (2)
where s = robust standard deviation of the results expressed in mm (log scale)
N = number of results used for the calculation (from NRLs only)
A coverage factor (k) of 2 was used to calculate the expanded uncertainty (U)
corresponding to a 95 level of confidence(17)
The assigned values and associated uncertainties for 40-3-2 soybean in both test items
are reported in Table 8 The standard deviation for proficiency assessment (σpt-log) was set
to 010 (on the log scale) for both test items based on reasonable performance
expectations and experience from previous PTs
Table 8 Overview of assigned values and uncertainties for the GM mass fraction in T1 and T2
Variable 40-3-2 Soybean in T1 40-3-2 Soybean in T2
Assigned value derived as Robust mean of log10-transformed data Robust mean of log10-transformed data
Number of data points (NRLs) 52 54
Assigned Value (xpt-log) -00973a -01186b
Standard uncertainty [u(xpt-log)] 00207 00122
Standard deviation for proficiency assessment (σpt-log)
010 010
a The assigned value for the mass fraction of 40-3-2 soybean in T1 corresponds to an approximate GM in the raw domain of 080 mm b The assigned value for the mass fraction of 40-3-2 soybean in T2 corresponds to an approximate GM in the raw domain of 076 mm
The robust mean of the 40-3-2 soybean mass fraction reported for T2 was 24 lower (on
the raw scale) than the certified value of this new batch of CRM(6) which was released in
October 2017 (ie after this PT) This observation was already noticed during CRM
production and a note on this is included in the CRM certificate (see Section 22 in this PT
EURL GMFF CT 0217 report
1746
report) Laboratories that have calibrated their measurements with the previous 40-3-2
soybean CRM (ERM-BF410n series) or another RM characterised by a 11 ratio between
the DNA content of the GM and non-GM fraction are therefore expected to measure a
much lower GM mass fraction in the new CRM than the certified value of 100 mm The
important message here is to not mix up the previous CRM batch with the new one as
both batches do not contain the same amount of transgenic copies Despite this
observation the aim of using a CRM calibrant is to have a common reference point for the
implementation of EU legislation on GMO thresholds and labelling(11)
443 Calculation of performance scores
Individual laboratory performance was expressed in terms of z and ζ scores in accordance
with ISO 135282015(16) both calculated in the log domain as follows
logpt
logpti
σ
xx
)log(z (4)
22 )x(u)x(u
)log(
logptlogi
logpti xx (5)
where xi = the measurement result as reported by a participant
u(xi) = the standard measurement uncertainty of the result reported xpt-log = the assigned value
u(xi-log) = the standard measurement uncertainty of the result reported
u(xpt-log) = the standard measurement uncertainty of the assigned value
σpt-log = the standard deviation for proficiency assessment
For calculation of the ζ scores the expanded uncertainties on the results reported by the
laboratories were translated into standard measurement uncertainties [u(xi)] using the
coverage factor reported and converted to the log domain as follows (following general
rules for the measurement uncertainty of log10-transformed values)
i
i
x
x )(u )x(u logi 4340 (6)
When no measurement uncertainty was reported it was set to zero (u(xi) = 0) When no
coverage factor was reported k was set to 173 (assuming a rectangular distribution
around the reported value with boundaries valuing plusmn Uradic3 (17))
Performance scores were calculated on the results as reported by the participants and
rounded to one decimal afterwards The interpretation of the z and ζ performance scores
was done according to ISO 170432010(5)
|score| le 20 satisfactory performance
20 lt |score| lt 30 questionable performance
|score| ge 30 unsatisfactory performance
The z score compares the participants deviation from the assigned value with the
standard deviation for proficiency assessment (σpt-log) used as common quality criterion
Measurements that are carried out correctly are assumed to generate results that can be
described by a normal distribution with mean xpt-log and standard deviation σpt-log The z
scores will then be normally distributed with a mean of zero and a standard deviation of
EURL GMFF CT 0217 report
1846
10 Only 03 of scores would be expected to fall outside the range -30 lt z lt 30 and
only 5 would be expected to fall outside the range -20 le z le 20 These percentages
may change when the true interlaboratory variability deviates from the agreed standard
deviation which was set to 010 It is unlikely that unacceptable z scores will occur by
chance when no real problem exists rather it is likely that there is an identifiable cause
for any anomaly when an unsatisfactory performance expressed as a z score is obtained
The ζ score states whether the laboratorys result agrees with the assigned value within
the respective measurement uncertainty The denominator is the combined uncertainty of
the assigned value [u(xpt-log)] and the measurement uncertainty as stated by the
laboratory [u(xi-log)] The ζ score includes all parts of a measurement result namely the
expected value (assigned value) its measurement uncertainty in the unit of the result as
well as the uncertainty of the reported values An unsatisfactory ζ score can either be
caused by the presence of a significant bias (inaccurate measurement) or by a non-
realistic estimation of the measurement uncertainty (seriously under-estimated) or by a
combination of both Participants that have obtained a satisfactory z score but an
unsatisfactory ζ score may have underestimated their measurement uncertainty
Participants that have obtained an unsatisfactory z score but a satisfactory ζ score may
have assessed the uncertainty of their result accurately but the result itself does not meet
the performance expected for the PT scheme
More detailed information about measurement uncertainty evaluation can be found in
some international standards and other guidance documents(1718192021)
444 Performance of the laboratories
The performance of the laboratories for GM quantification is primarily evaluated on the
basis of their z scores The ζ scores obtained are providing additional information to the
laboratory regarding the correct estimation of the measurement uncertainty of the result
but should be used as indicative values only
4441 z scores
Table 9 summarises the performance results obtained in this PT based on the z scores
Detailed results per laboratory are reported in Annex 4 Tables A41 and A42 and Figures
A41 and A42
Table 9 Evaluation of laboratory performance for GM event quantification through z scores
Laboratory Performance Test Item 1 Test Item 2
40-3-2 Soybean 40-3-2 Soybean
Number of laboratories with |z| le 20 (satisfactory) 67 78
Number of laboratories with 20 lt |z| lt 30 (questionable) 9 3
Number of laboratories with |z| ge 30 (unsatisfactory) 4a 2 a One additional NRL120 (L88) reported a value ltLOQ which is considered unacceptable
A total of 4 laboratories obtained an unsatisfactory performance expressed as z score for
quantification of event 40-3-2 in T1 (1 NRL882 and 3 non-NRLs) and 2 laboratories for T2
(2 non-NRL) Another 5 NRL882 1 NRL120 and 3 non-NRLs obtained a questionable z
score for T1 and one NRL882 one NRL120 and one non-NRL similarly for T2 In case of
an unsatisfactory performance obtained by an NRL the laboratory will be requested to
perform a root-cause analysis and to communicate the outcome to the EURL GMFF who
will then follow-up with the laboratory
One laboratory (L88) had reported that the 40-3-2 soybean mass fraction in T1 was below
its LOQ of 004 mm While less than X values were not included in the data
evaluation they were compared to the corresponding xpt ndash U(xpt) (after conversion to the
log scale) Since the reported less than X value was lower than the corresponding xpt ndash
U(xpt) the laboratory should have been able to quantify the analyte Therefore the
laboratory statement was considered as unsatisfactory
EURL GMFF CT 0217 report
1946
Although the performance scores were calculated on the log-transformed data the
corresponding GM mass fractions on the raw domain which are easier to understand in
daily laboratory practice approximated the following values
For 40-3-2 soybean in T1
Assigned value on the raw domain 080 mm
|z| le 20 lower and upper limits 050 ndash 128 mm
|z| lt 30 lower and upper limits 041 ndash 157 mm
For 40-3-2 soybean in T2
Assigned value on the raw domain 076 mm
|z| le 20 lower and upper limits 048 ndash 122 mm
|z| lt 30 lower and upper limits 039 ndash 150 mm
The general performance of the laboratories for quantification of event 40-3-2 soybean in
both test items was very good This event is one of the older GM events inserted in the
EU Register of authorised events in 1996 and is commonly found in feed samples on the
global market It is therefore not surprising that most laboratories are able to detect this
event and to quantify it accurately In a previous PT in 2014 (CT 0214) which also
included a chicken feed sample containing 40-3-2 soybean the general performance of the
participants was much worse (16 unsatisfactory z scores among 70 results based on an
agreed σpt-log of 020) The latter outcome was due to issues with the extraction of good
quality DNA from the highly processed matrix which contained the 40-3-2 soybean already
before processing (ie the GM soybean was not spiked in) The chicken feed used in the
current PT was from a different origin compared to the one used in CT 0214 although
also in this case the extracted DNA was at least partially degraded In contrast the DNA
from the spiked 40-3-2 soybean was of high-molecular weight (see Section 21) and
therefore easier to amplify during PCR More important is that a considerable fraction of
unprocessed non-GM soybean was added to the T1 mix to increase the total soybean
content the measurements on the DNA extracted from the latter material presumably of
good amplification quality probably contributed mainly to the denominator (ie the taxon-
specific DNA fraction) in the equation to express the GM content The improved
performance of the laboratories participating to the current PT may also be the result of
the increased experience in the extraction of PCR-grade DNA from demanding sample
matrices
Most of the results reported for T2 which was a seed-based matrix and therefore it was
easier to extract good quality DNA were close to the assigned value with its expanded
measurement uncertainty this can be seen in Figure A42 in Annex 4
The participants to this PT were requested to quantify the same GM event in a compound
feed (T1) on the one hand and in a pure soybean material (T2) on the other hand Figure
1 compares the performance of the laboratories to provide acceptable results for both
tasks The horizontal and vertical axes correspond to a z score of 0 for T1 and T2
respectively while the dashed red lines indicate the limits of the satisfactory z scores
(|z|=2) Points in the lower left or upper right quadrant corresponding to L18 and L75
indicate participants who have a systematic bias in the application of the method The
points at the far-left of the x-axis (L26 and L69) represent participants that have had a
problem particularly with T1 but not so much with T2 this may be related to the DNA
extraction part of the workflow which was more challenging for T1 compared to T2 There
are also other participants that may have had similar issues with T1 as more points lie
outside the satisfaction interval on the x-axis compared to the y-axis
For many but not all participants there seem to be a slight tendency for consistent z
scores for T1 and T2 (points along the diagonal line) which gives evidence of participant
bias that affected both test items in a similar way There are also a number of participants
that have obtained a z score close to zero for both test items and which are represented
by points close to where the horizontal and vertical axes cross eg L05 L06 L09 L44
EURL GMFF CT 0217 report
2046
L46 L50 L54 L55 L63 L64 L85 L87 and L89 (within |z|lt05 for T1 and T2) These
laboratories 12 NRLs and one non-NRL seem to have the whole analytical method
including DNA extraction and real-time PCR very well under control for different types of
samples The highly proficient non-NRL used digital PCR for both measurements indicating
that this method also seems reliable for GM soybean quantification in different matrices
Figure 1 Youden plot comparing the z scores obtained by the participants for the determination of the 40-3-2 soybean mass fraction in T1 and T2
The dashed red lines indicate the limits of satisfactory performance (|z|le20) for each test item The diagonal line displays the consistency of z scores in T1 and T2
EURL GMFF CT 0217 report
2146
4442 ζ scores
Tables A41 and A42 also report the ζ scores obtained by the laboratories as an
informative evaluation for the laboratories of their result in combination with the reported
uncertainty A total of 54 laboratories were given a satisfactory performance when
expressed as ζ score for quantification of 40-3-2 soybean in T1 3 a questionable and 24
an unsatisfactory performance score (N = 81) For 40-3-2 soybean in T2 (N = 83) 62
laboratories performed satisfactorily 5 questionable and 16 unsatisfactorily As explained
in Section 443 a bad ζ score may be due to a result that strongly deviates from the
assigned value (and has therefore also yielded an unsatisfactory performance when
expressed as a z score) or it may indicate an underestimation of the measurement
uncertainty of the result
Figures A41 and A42 (Annex 4) allow verification if the reported measurement
uncertainty bars overlap with the horizontal dashed (black) lines that delineate the
satisfactory interval for the z scores Laboratory L03 provided an expanded measurement
uncertainty of 1520 for T1 and T2 which is either strongly overestimated or corresponds
to a relative uncertainty instead of the requested absolute uncertainty in mm Also L53
has strongly overestimated its measurement uncertainty for the mass fraction of 40-3-2
soybean in T1 and T2 and L76 for T2 only although they both obtained a satisfactory ζ
score because their reported values were sufficiently close to the assigned value From the
same figures in Annex 4 it can easily be seen that several laboratories may have reported
a rather low measurement uncertainty (or no uncertainty at all) and therefore received an
unsatisfactory ζ score eg the NRLs L01 L02 L40 and L78 would have obtained a
satisfactory ζ score for 40-3-2 in T1 if they had reported a realistic measurement
uncertainty (Figure A41) Similarly for 40-3-2 in T2 (Figure A42) the results of the NRLs
L38 L40 L41 L77 L78 and L83 would have been satisfactory if they had reported a
realistic measurement uncertainty Furthermore nearly all laboratories that had not
reported a measurement uncertainty value and thus received an assumed uncertainty of
zero received an unsatisfactory ζ score From the questionnaire it was noted that 32
laboratories (ie more than 13 of all participants) estimated the measurement
uncertainty on the basis of the precision of the analysis replicates only such an approach
may not be sufficient to account for all analytical variability
ISO 135282015(16) suggests to check whether a reported standard uncertainty (with a
coverage factor k=1) is realistic and lies between a minimum and maximum uncertainty
(umin and umax) This allows participants to review their reported uncertainty and evaluate if
the reported uncertainty is counting all relevant components or is over-counting some
components It is unlikely that a participant result will have a smaller standard uncertainty
than the measurement uncertainty of the assigned value so u(xpt) can be used as a lower
limit called umin It is also unlikely that a participant reported standard uncertainty is
larger than the robust standard deviation of the (NRL) results (umax)
As an example Figure 2 compares the relative standard uncertainties (ui) reported by
the participants of this PT for T1 calculated from the expanded uncertainty U and reported
k factor and expressed as percentage of the reported result On the raw data scale umin
and umax for the 40-3-2 soybean mass fraction in T1 correspond to 5 and 28
respectively Therefore a standard measurement uncertainty smaller than 004 mm is
probably underestimated while a standard uncertainty above 023 mm may be
overestimated However these are informative indicators only Measurement uncertainties
below umin or above umax can be valid and in such case the laboratory should check the
result or the uncertainty estimate
EURL GMFF CT 0217 report
2246
Figure 2 Reported relative standard uncertainties (ui) for T1
The horizontal blue lines refer to umin and umax as defined in the text Note that the relative
uncertainty of L03 is out of scale and not shown Laboratories that failed to report a measurement uncertainty were given a zero value
EURL GMFF CT 0217 report
2346
5 Conclusions
Participants in this PT were required to analyse two test items varying in composition and
complexity but containing the same GM event The analytical tasks resembled the routine
operational analysis tasks of an official control laboratory analysing a food or feed material
for the presence of material derived from containing or consisting of GMOs
The results reported by the participants were analysed and a performance evaluation was
carried out taking into account both the qualitative and the quantitative results reported
A large majority of the participants performed satisfactorily for the tasks in this PT ie the
detection and quantification of the soybean event 40-3-2 in T1 a chicken feed powder
and in T2 a soybean flour All participants who tested for the events were able to identify
the correct event in both test items Regarding quantification four laboratories including
one NRL882 and 3 non-NRLs obtained an unsatisfactory z performance score for the 40-
3-2 soybean measurements in the more difficult feed matrix One NRL120 reported an
unacceptable ltLOQ result for the 40-3-2 soybean mass fraction in T1 but the reported
result for T2 was satisfactory Two of the non-NRL laboratories were also unsatisfactory for
the quantification of the same event in the T2 matrix
It is recommended for several laboratories to re-consider the estimation of their
measurement uncertainty in order to report a more realistic uncertainty and
consequently to obtain a satisfactory ζ performance score
EURL GMFF CT 0217 report
2446
Acknowledgements
We acknowledge the support of the members of the Advisory Board for Comparative
Testing (Lotte Hougs Nina Papazova Martin Sandberg and Manuela Schulze) for reviewing
this report and of the Reference Materials Unit of JRC particularly Brigitte Fontenelle for
taking care of the sample dispatching The laboratories listed below are acknowledged for
their participation in this exercise
Body 1 Organisation Department City Country
NRL882
AGES-Institute for Food Safety Vienna Vienna AUSTRIA Umweltbundesamt GmbH Vienna AUSTRIA CRA-W - Walloon Agricultural Research Center Valorization of agric prod Gembloux BELGIUM Institute for Agricultural and Fisheries Research Technology and Food - PI Merelbeke BELGIUM Scientific Institute of Public Health (WIV-ISP) PBB - GMOlab Brussels BELGIUM National Center of Public Health and Analyses GMO Sofia BULGARIA Croatian Institute of Public Health Zagreb CROATIA State General Laboratory GMOs and Allergens Nicosia CYPRUS
Crop Research Institute Prague CZECH REPUBLIC
Danish Veterinary and Food Administration Food Chem and Plant Health Ringsted DENMARK Finnish Customs Laboratory Espoo FINLAND BioGEVES Surgeres FRANCE Service Commun des Laboratoires Illkirch Graffenstad FRANCE Bundesamt fuumlr Verbraucherschutz und Lebensmittelsicherheit
Referat 503 Berlin GERMANY
General Chemical State Laboratory A Chemical Service of Athens Athens GREECE National Food Chain Safety Office Budapest HUNGARY Istituto Zooprofilattico Lazio e Toscana Biotechnology Unit Rome ITALY Institute of Food Safety Animal Health and Environment bdquoBIORrdquo
Riga LATVIA
National Food and Veterinary Risk Assessment Institute
Molecular Biology and GMO Vilnius LITHUANIA
Laboratoire National de Santeacute food control Dudelange LUXEMBOURG RIKILT Wageningen University amp Research Wageningen NETHERLANDS Instytut Zootechniki PIB KLP Szczecin Szczecin POLAND National Veterinary Research Institute Pulawy POLAND Regional Laboratory of Genetically Modified Food Tarnobrzeg POLAND Instituto Nacional de Investigaccedilatildeo Agraacuteria e Veterinaacuteria
UEIS-SAFSV Oeiras PORTUGAL
Institute for Diagnosis and Animal Health Molecular Biology and GMOs Bucharest ROMANIA State Veterinary and Food Institute VFI in Dolny Kubin Dolny Kubin SLOVAKIA Central Control and Testing Institute of Agriculture Bratislava
OMB NRL Bratislava SLOVAKIA
National Institute of Biology Ljubljana SLOVENIA Laboratorio Arbitral Agroalimentario LAA-MAPAMA OGM Madrid SPAIN Centro Nacional De Alimentaciograven (Agencia Espantildea De Consumo Seguridad Alimentaria Y Nutriciograven)
Biotechnology Unit Madrid SPAIN
National Food Agency Uppsala SWEDEN
LGC Teddington UNITED KINGDOM
NRL120
Finnish Food Safety Authority Evira Helsinki FINLAND Thuumlringer Landesamt fuumlr Verbraucherschutz (TLV) Lebensmittelsicherheit Bad Langensalza GERMANY LAVES-Lebensmittel- und Veterinaumlrinstitut BraunschweigHannover
Braunschweig GERMANY
Landesuntersuchungsanstalt fuumlr das Gesundheits- und Veterinaumlrwesen Sachsen
Amtliche Lebensmitteluntersuchung
Dresden GERMANY
BfR Food Safety Berlin GERMANY Landesamt fuumlr Verbraucherschutz Sachsen-Anhalt Fachbereich 3 Halle GERMANY Landesamt fuumlr Landwirtschaft Lebensmittelsicherheit und Fischerei M-V (LALLF MV)
200PCR Rostock GERMANY
Institut fuumlr Hygiene und Umwelt Hamburg Gentechnikuumlberwachungslabor Hamburg GERMANY LUFA Speyer Referat II2 Speyer GERMANY CVUA Freiburg GMO Freiburg GERMANY Bavarian Health and Food Safety Authority (LGL) Oberschleissheim GERMANY LTZ Augustenberg Karlsruhe GERMANY LLBB Berlin GERMANY Landeslabor Schleswig-Holstein Neumuumlnster GERMANY Staatliche Betriebsgesellschaft fuumlr Umwelt und Landwirtschaft
GB 6 Fachbereich 63 Nossen GERMANY
EURL GMFF CT 0217 report
2546
0
Body Organisation Department City Country
NRL120 cont
Istituto Superiore di Sanitagrave DSPVSA Rome ITALY
CREA-SCS Sede di Tavazzano Laboratorio
Tavazzano (LO) ITALY
Netherlands Food and Consumer Product Safety Authority (NVWA)
Laboratorium VV Wageningen NETHERLANDS
Plant Breeding and Acclimatization Institute NRI GMO Controlling Laboratory Blonie POLAND
Fera Science Ltd Plants York UNITED KINGDOM
SASA Scottish Government Seed certification Edinburgh UNITED KINGDOM
Non-NRL
FASFC Melle GMO Melle BELGIUM
Laboratoacuterio Nacional Agropecuaacuterio - LANAGROMG Pedro LeopoldoMG BRAZIL
Ministry of Agriculture Livestock and Food Supply Official Laboratory of Goiaacutes Goiania BRAZIL
Laboratory of SGS Bulgaria Ltd Varna BULGARIA
Servicio Agriacutecola y Ganadero Biotechnology Santiago CHILE
Instituto Nacional de Vigilancia de Medicamentos y Alimentos Invima
Laboratorio OGM Bogotaacute COLOMBIA
Croatian Centre for Agriculture Food and Rural Affairs Institute for Seed and Seedlings
Non-NRL Osijek CROATIA
CVUA-OWL Detmold GERMANY
Thuumlringer Landesanstalt fuumlr Landwirtschaft
Jena GERMANY
Biomi Ltd Godollo HUNGARY
ICAR-National Bureau of Plant Genetic Resources Division of Genomic Resources
New Delhi INDIA
IZSLER Brescia ITALY
Istituto Sperimentale Del Piemonte Liguria e Valle DAosta
SC Biotechnologie Torino ITALY
Istituto Zooprofilattico Sperimentale Abruzzo e Molise Hygiene in Food Technology Teramo ITALY
American University of Science and Technology Laboratory Science amp Technology
Ashrafieh-Beirut LEBANON
SENASICA-CNRDOGM Deteccioacuten de OGM Tecaacutemac MEXICO
Bureau of Plant Industry National Plant Quarantine Services Division Post Entry Quarantine Station
Department of Agriculture Los Banos Laguna PHILIPPINES
Laboratorul Central pentru Calitatea Semintelor si a Materialului Saditor Bucuresti
LEDOMG Bucuresti ROMANIA
Institute of Molecular Genetics and Genetic Engineering
Plant Molecular Biology Belgrade SERBIA
SP Laboratorija ad Genetical dpt Becej SERBIA
A Bio Tech Lab Laboratory for biotechnology Sremska Kamenica SERBIA
Agri-Food amp Veterinary Authority of Singapore Veterinary Public Health Labor Singapore SINGAPORE
Federal Food Safety and Veterinary Office FSVO Risk Assessment Division Bern SWITZERLAND
Agroscope Feed Analytics Posieux SWITZERLAND
Ankara Food Control Laboratory Molecular Biology Ankara TURKEY
State Scientific Research Institute of laboratory Diagnostic and Veterynary Sanitary Expertise
Research GMOs Department Kyiv UKRAINE
Ukrmetrteststandart Molecular Biology Kiev UKRAINE
Ukrainian Laboratory of Quality and Safety of Agricultural Products (ULQSAP)
Chabany village UKRAINE
USDA-GIPSA Biotechnology Laboratory Kansas City UNITED STATES
Agricultural Genetics Institute GMO Detection 04 VIETNAM
National Institute for Food Control Quality management Ha Noi VIETNAM
Quality Assurance and Testing Center 3 (QUATEST 3) Microbiology ndash GMO Testing Lab
Bienhoa VIETNAM
1 NRL882 means NRLs designated by their Member State to coordinate the activities of official laboratories for GMO control under Regulation (EC) No 8822004 NRL120 means NRLs nominated under Regulation (EU) No 1202014 to support the EURL GMFF on method validation (and not also NRL882) Non-NRL means official control laboratories from EU or non-EU countries that are not NRLs according to the Regulations mentioned above
EURL GMFF CT 0217 report
2646
References
(including those referred to in the Annexes)
1 Regulation (EC) No 18292003 of the European Parliament and of the Council of 22
September 2003 on genetically modified food and feed Off J Eur Union L 268 1-23
2 Regulation (EC) No 8822004 of the European Parliament and of the Council of 29
April 2004 on official controls performed to ensure the verification of compliance with
feed and food law animal health and animal welfare rules Off J Eur Union L 191 1-
52
3 Commission Implementing Regulation (EU) No 1202014 of 7 February 2014
amending Regulation (EC) No 19812006 on detailed rules for the implementation of
Article 32 of Regulation (EC) No 18292003 of the European Parliament and the
Council as regards the Community reference laboratory for genetically modified
organisms Off J Eur Union L 39 46-52
4 Commission Regulation (EU) No 6192011 of 24 June 2011 laying down the methods
of sampling and analysis for the official control of feed as regards presence of
genetically modified material for which an authorisation procedure is pending or the
authorisation of which has expired Off J Eur Union L 166 9-15
5 ISOIEC 170432010 Conformity assessment ndash General requirements for proficiency
testing International Organization for Standardization Geneva Switzerland
6 Dimitrievska B Kortekaas AM Seghers J Leys H Corbisier Ph Trapmann S
(2017) The certification of different mass fractions of MON-Oslash4Oslash32-6 in soya bean
powder Certified Reference Materials ERMreg-BF410ap ERMreg-BF410bp ERMreg-
BF410cp ERMreg-BF410dp and ERMreg-BF410ep EC certification report EUR 28665 EN
ISBN 978-92-79-70107-8
7 Rosa SF Gatto F Angers-Loustau A Petrillo M Kreysa J Querci M (2016)
Development and applicability of a ready-to-use PCR system for GMO screening Food
Chemistry 201 110ndash119
8 Querci M Foti N Bogni B Kluga L Broll H amp Van den Eede G (2009) Real-
time PCR-based ready-to-use multi-target analytical system for GMO detection Food
Anal Methods 2 325-336
9 ISO 170342016 General requirements for the competence of reference material
producers International Organization for Standardization Geneva Switzerland
10 Technical guidance document from the European Union Reference Laboratory for
Genetically Modified Food and Feed on the implementation of Commission Regulation
(EU) No 6192011 (httpgmo-crljrceceuropaeuguidancedocshtm)
11 Corbisier P Barbante A Berben G Broothaerts W De Loose M Emons H
Georgieva Tz Lievens A Mazzara M Papazova N Perri E Sowa S Stebih D Terzi
V Trapmann S (2017) Recommendation for the unit of measurement and the
measuring system to report traceable and comparable results expressing GM content
in accordance with EU legislation JRC Technical report (httpgmo-
crljrceceuropaeuENGLdocsWG-UoM-Final-Reportpdf)
12 Analytical Methods Committee (1989) Robust statistics ndash How not to reject outliers
Part 1 Basic Concepts Analyst 114 1359-1364
13 Analytical Methods Committee (2001) Robust statistics a method for coping with
outliers AMC Technical Brief No 6 April 2001
14 Thompson M Ellison SLR Owen L Mathieson K Powell J Key P Wood R
Damant AP (2006) Scoring in Genetically Modified Organism Proficiency Tests
Based on Log-Transformed Results J AOAC Int 89 232-239
EURL GMFF CT 0217 report
2746
15 Analytical Methods Committee (2004) GMO Proficiency Testing Interpreting z scores
derived from log-transformed data RSC AMC Technical Brief No 18 December
2004
16 ISO 135282015 Statistical methods for use in proficiency testing by interlaboratory
comparison International Organization for Standardization Geneva Switzerland
17 Ellison SLR Williams A (Eds) EurachemCITAC guide Quantifying Uncertainty in
Analytical Measurement Third edition (2012) ISBN 978-0-948926-30-3 Available
from wwweurachemorg
18 ISOIEC Guide 98-32008 (JCGMWG1100) Uncertainty of measurement - Part 3
Guide to the expression of uncertainty in measurement
19 Linsinger T (2010) Comparison of a measurement result with the certified value
Application Note 1 Luxemburg Office for Official Publications of the European
Communities (httpscrmjrceceuropaeu)
20 Trapmann S Burns M Broll H Macarthur R Wood R Zel J (2009) Guidance
Document on Measurement Uncertainty for GMO Testing Laboratories Luxembourg
Office for Official Publications of the European Communities EUR 22756 EN2-2009
21 Corbisier P Zobell O Trapmann S Auclair G and Emons H (2014) Training
Manual on GMO Quantification Proper Calibration and Estimation of Measurement
Uncertainty Luxembourg Publications Office of the European Union
(doi10278710085)
22 Thompson M Wood R (1993) The international harmonized protocol for the
proficiency testing of (chemical) analytical laboratories J AOAC Int 76 926-940
23 Powell J Owen L (2002) Reliability of Food Measurements The Application of
Proficiency Testing to GMO Analysis Accred Qual Ass 7 392-402
24 Linsinger TPJ van der Veen AMH Gawlik BM Pauwels J Lamberty A
(2004) Planning and combining of isochronous stability studies of CRMs Accred Qual
Assur 9 464-472
EURL GMFF CT 0217 report
2846
Annexes
Annex 1 Homogeneity and stability of test items
A11 Homogeneity of test items
The homogeneity of T2 was confirmed during the certification of this CRM
The assessment of the homogeneity(16) of T1 was performed after the test item had been
packed in its final form and before distribution to participants using the following
acceptance criterion
pts s 30 (A11)
Where ss is the between-test item standard deviation as determined by a 1-way random
effects ANOVA(22) and σpt is the standard deviation for comparative testing The value of
σpt the target standard deviation for proficiency assessment was based upon the
experience acquired in previous PTs and set to 010 on the log domain(23)
If the criterion according to A11 is met (ie ss le 0030) the between-test item standard
deviation contributes no more than about 10 to the standard deviation for comparative
testing
The repeatability of the test method is the square root of the mean sum of squares within-
test items MSwithin The relative between-test item standard deviation ssrel is given by
100
y
n
MSMS
s
withinbetween
rels (A12)
where MSbetween is the mean sum of squares between test items
MSwithin is the mean sum of squares within test items
n is the number of replicates for each sample
y is the mean of the homogeneity data
If MSwithin gt MSbetween then
100
1
24
y
nNn
ityrepeatabil
us bbrels (A13)
where ubb is the maximum uncertainty contribution that can be obtained by the hidden
heterogeneity of the material
Seven bottles (N = 7) were randomly selected and analysed in five replicates (n = 5) The
between-test item standard deviation was 0018 mm The criterion described in
formula (A11) was fulfilled (0018 lt 0030) indicating that T1 was adequately
homogeneous
EURL GMFF CT 0217 report
2946
A12 Stability of test items
For T1 an isochronous short-term stability study(24) involving two test samples with three
replicates each (N = 2 n = 3) was conducted over two and four weeks at +4 degC +18 degC
and +60 degC The 40-3-2 soybean mass fraction was measured by qPCR The
measurements were performed under intermediate precision conditions with respect to the
PCR plates
The results did not reveal any influence of time or storage at +4 degC or +18 degC on the
stability of the test item (compared to storage at -70 degC) with regard to the soybean event
40-3-2 mass fraction Even at 60 degC no significant trend was measured although the
extracted DNA was more fragmented as seen by agarose gel electrophoresis
The test items were shipped at ambient temperature
The stability of T1 during the period covered by the PT (approximately 5 months between
production of the test item and the deadline for results reporting) was tested by analysing
simultaneously on one PCR plate two units (N = 2 n = 3) stored either at the normal
storage temperature (4 degC) or at a reference temperature (-70 degC) The evaluation was
based on the results ratio between samples stored at 4 degC and -70 degC The data were
evaluated against storage time and regression lines were calculated The slopes of the
regression lines were tested for statistical significance (lossincrease due to storage) No
significant trend was detected at a 95 confidence level The T1 material can therefore
be stored at 4 degC and was stable during the period covered by this CT
The stability of T2 was ensured as part of the post-certification stability monitoring of
ERM-BF410p Measurements were performed simultaneously on one PCR plate as
described for T1 on units stored at the normal storage temperature (4 degC) and at a
reference temperature (-70 degC) No significant trend was detected at a 95 confidence
level The T2 material can therefore be stored at 4 degC and was stable during the period
covered by this CT
EURL GMFF CT 0217 report
3046
Annex 2 Questionnaire data
The results received from 82 laboratories were exported from the EUSurvey
Questionnaire on CT 0217 analysis and are tabulated below Multiple answers were
allowed for all questions except for the questions on the calibrant used The results of the
open questions were manually analysed and reported Answers to the questions on GM
events that were not to be quantified in the test items are not shown
Select the group to which your organisation belongs Note 882 and 120 refer to EU Regulations 8822004 and 1202014
resp select NRL120 if your organisation is ONLY listed under Regulation 1202014 select non-NRL if your organisation is
not an NRL under either EU Regulation
Answers Ratio
NRL882 33 402
NRL120 20 244
Non-NRL 29 354
No Answer 0 0
T1 Please select the option that applies and proceed with the questionnaire
Answers Ratio
T1 was not analysed go to Q1 2 244
T1 was analysed go to Q2 80 976
No Answer 0 0
T1 1 Why did you not analyse test item 1
Answers Ratio
a) The sample matrix is out of the scope of our laboratory 1 122
b) The methods are not validated in our laboratory 0 0
c) We could not obtain sufficient good quality DNA suitable for further analysis 0 0
d) Reference material primers probes or other reagents were not available (in time) 0 0
e) We tried but our analysis failed 0 0
f) Other practical constraints (instrument broken no personnel etc) 1 122
g) Other reason 0 0
No Answer 80 976
T1 2 Select the DNA extraction method used for T1
Answers Ratio
CTAB 41 50
NucleoSpin Food 10 122
NucleoSpin Plant 3 366
GeneSpin 4 488
Promega Wizard 3 366
DNeasy Plant 3 366
DNeasy Mericon Food 5 61
Biotecon Foodproof 5 61
SDS 4 488
Fast ID Genomic DNA 2 244
Maxwell 16 Plant DNA 0 0
Maxwell 16 Food Feed Seed 5 61
Generon Ion Force 1 122
Other 2 244
No Answer 2 244
T1 3 Select any additional DNA purification method used for T1
Answers Ratio
No additional clean-up 51 622
Additional ethanol precipitation 9 110
Eurofins DNAExtractor cleaning column 3 366
Promega Wizard DNA clean-up resin 6 732
Qiagen QIAQuick 4 488
Qiagen Genomic-Tip 20G 1 122
Other method (no need to specify) 7 854
No Answer 2 244
EURL GMFF CT 0217 report
3146
T1 4 Indicate the number of replicate DNA extractions used to obtain the results
Answers Ratio
1 0 0
2 52 634
3 9 110
4 10 122
5 2 244
6 6 732
gt6 1 122
No Answer 2 244
T1 5 Select the approach(es) used to show absence of PCR inhibition
Answers Ratio None (no inhibition was suspected based on experience) 6 732
We check that the optical density ratios (OD260280 260230) are acceptable 40 488
We verify that the amplification curves look normal 24 293
We run two dilutions and verify if the delta Cq or GM are as expected 31 378
We run three or four dilutions and verify if the delta Cq or GM are as expected 13 158
We perform a PCR inhibition run with a reference gene before analysis 3 or 4 dilutions linear regression extrapolation of Cq for undiluted extract compare this to the measured Cq
16 195
We add an internal positive control to the reactions and check the Cq 15 183
Other 1 122
No Answer 2 244
T1 6 Select the option applicable to your analysis for 40-3-2 soybean in T1
Answers Ratio
Not tested 0 0
Detected but not quantified 3 366
Detected and quantified please fill in Q6a-6h 77 939
Found absent 0 0
No Answer 2 244
T1 7 Select the option applicable to your analysis for 68416 soybean in T1
Answers Ratio
Not tested 14 171
Detected but not quantified 2 244
Detected and quantified please fill in Q7a-7h 0 0
Found absent 64 781
No Answer 2 244
T1 8 Select the option applicable to your analysis for MON89788 soybean in T1
Answers Ratio
Not tested 6 732
Detected but not quantified 33 402
Detected and quantified please fill in Q8a-8h 15 183
Found absent 26 317
No Answer 2 244
T1 9 If applicable why did you not test or quantify all GM events in T1
Answers Ratio
a) Not applicable all GM events listed were tested and all those detected were quantified 45 549
b) The event-specific detection method is not validated in our laboratory 7 854
c) Reference material primers probes or other reagents were not available (in time) 9 110
d) The result obtained was below the LODLOQ 18 220
e) Practical constraints (instrument broken no personnel etc) 0 0
f) Other reason 9 110
No Answer 2 244
T1 6a Soybean 40-3-2 Which quantification approach was used
Answers Ratio
Standard curve method (2 calibration curves) 68 829
Delta Cq method (one calibration curve) 9 110
Digital PCR (no calibration curve) 2 244
EURL GMFF CT 0217 report
3246
No Answer 5 61
T1 6b Select the calibrant used for the 40-3-2 standard curve
Answers Ratio
CRM from JRC (ex-IRMM) certified in GM mass fraction (gkg) 71 866
Non-certified RM (eg lab QC material) expressed in GM mass fraction (gkg or mm ) 1 122
Non-certified RM (eg lab QC material) expressed in GM DNA copy number ratio (eg determined by digital PCR)
4 488
No calibrant used digital PCR done 1 122
No Answer 5 61
T1 6c Select the endogenous target(s) used for relative quantification of 40-3-2 soybean in T1
Answers Ratio
Soybean lec 74 bp (40-3-2 MON89788 MON87701 44406 356043 305423 etc) 65 793
Soybean lec 81 bp (Pauli et al 2001) 5 61
Soybean lec 102 bp (A5547 FG72) 1 122
Soybean lec 105 bp (A2704) 0 0
Soybean lec 118 bp (Shindo et al 2002) 5 61
Other please specify below 1 122
No Answer 5 61
Specify the reference target(s) used (if different from above)
SOJA LEKTIN 80 bp - Va M Pijnenburrg H Gendre F Brignon P (1999) J Agric Food Chem 475261-5266
T1 6d Clarify the unit of measurement used and any conversion between units if applicable Carefully read the choices
below and select the one used in the measurements that resulted in a final result in GM mm for 40-3-2 If unclear or a
different approach was used please clarify this in the free text box below
Answers Ratio
The RM and the calibration standards were expressed in mass (or mass ) no conversion factor was applied
59 720
The calibration standards were expressed in DNA copies calculated from the RM in gkg but a conversion factor of 1 was applied (eg 10 mm GM = 10 cpcp GM corresponding to a 10x dilution of a 100 RM)
13 159
The calibration standards were expressed in DNA copies calculated from the RM in gkg and a conversion factor gt1 was applied to take account of the zygosity and target gene copies (double conversion applied) a conversion factor (eg 2) was used to convert from mass to copies (eg 20 mm GM = 10 cpcp GM corresponding to a 5x dilution of a 100 RM) the final result was again converted to mm by using the same conversion factor (eg x 2) Please specify this factor below
0 0
The measurements were done in DNA copies (as the RM used was expressed in this unit or digital PCR was used) A conversion factor was applied onto the final GM please specify this factor below
2 244
The measurements were done in DNA copies (as the RM used was expressed in this unit or digital PCR was used) No conversion factor was applied onto the final GM
3 366
No Answer 5 61
Conversion factor used to turn results into mm if applicable andor clarification on preparation of standards
1
Conversion factor of 1
T1 6e What was the amount of sample DNA (ng) used per PCR for 40-3-2 Choose the concentration that is closest to what
you used If applicable select multiple concentrations (eg if several dilutions were tested) but only those of which the
result was used to determine the reported GM
Answers Ratio
DNA concentration not determined 12 146
250 ng 5 61
200 ng 30 366
150 ng 9 110
100 ng 18 220
50 ng 14 171
25 ng 6 732
15 ng 0 0
lt10 ng 0 0
No Answer 5 61
EURL GMFF CT 0217 report
3346
T1 6f What was the LOQ (in mm ) for the 40-3-2 quantification
Answers
001 3 002 4 003 1 004 6 005 7 006 2 008 4 009 7 01 37 019 1 02 1 03 1 035 1 04 1 13 1
T1 6g How was the LOQ for 40-3-2 determined (if applicable)
Answers Ratio
Determined from the qPCR analysis for the current sample 20 244
Determined during the in-house validation of the method 42 512
Taken from the EURL GMFF validation report 17 207
By another approach please explain below 2 244
No Answer 5 61
Explanation on alternative LOQ determination
Determined from the digital PCR analysis for the current sample Information about LOQ introduced by the manufacturer (R-Biopharm) of diagnostic kit The u was obtain through the estimation of the sd taking into account the repeatability and intermediate precision associated with the test sample Coverage factor k = 2 was applied then
T1 6h How did you estimate the measurement uncertainty on the result reported for 40-3-2 soybean
Answers Ratio
Uncertainty budget (ISO GUM) 2 244
Uncertainty of the method (in-house validation) 27 329
Known uncertainty of the standard method 9 110
Measurement of replicates (precision) 32 390
From interlaboratory comparison data 4 488
Estimation based on judgement 2 244
In another way please specify below 6 732
No Answer 5 61
Explanation on alternative determination of measurement uncertainty
U=Sa radic1p+1n+(c0-c)2Sxx
Uncertainty=Coverage Factor (P=95 anf f=n-1) Standard Deviation Square-root (Number of Measurements)
MU was estimated according to the Guidance Document on MU for GMO Testing Laboratories JRC ISSN 1018-5593
we used a calculated k-factor based on the number of repeats
Estimation based on within laboratory reproducibility
95 confidence interval of the results for the current sample
The u was obtain through the estimation of the sd taking into account the repeatability and intermediate precision associated with the test sample Coverage factor k = 2 was applied then
Combined Uncertainty (CRM + measurement) following Application note (Lingsinger 2005 JRC Geel)
Additional comments and suggestions
MON89788 soybean was detected but not quantified because results for this event were lt LOQ
We saw in the qPCR for MON89788 Ct-values at 37 - 39 but lt LOD (lt 002 )
Additional tests with one extract performed with Nucleospin Food Kit and with one extract performed with CTAB+Nucleospin Food Kit showed no significant differences in event detection and GTS 40-3-2 quantification (examined with digital PCR)
T19 not all detected GM were asked to be quantified
For T1 trace amounts of MON89788 were detected either in qualitative screening as well as in quantification The givencalculated GM (mm) of 002 is well below the known and validated LOQ of the method which is 01 We detected a low level of MON89788 but as this quantified at 0006 lower than the threshold for reporting we took this as a negative result
According course material of JRC GMO Quantification Proper calibration and Estimation of Measurement Uncertainty
MU is based on intermediate precision data
EURL GMFF CT 0217 report
3446
The sample was strongly inhibited MON89788 was detected under LOQ
In T1 the measured GM for MON89788 of 001 is below the determined LOQ (02) therefore no MU was reported
MON89788 was detected in traces at the LOD
MON89788 SOY result obtained below the LOQ but copy numbers of MON89788 was above LOD
T1 was inhibited A 10x dilution of the DNA was needed to get a reasonable result
DNA extraction of T1 has conducted using DNA extraction kits SureFood Prep Basic (S1052) and SureFood Prep Advanced (S1053) R-Biopharm AG Identification of Soya GM-lines was conducted using diagnostic kits SureFood GMO ID Roundup Ready Soya (S2030) and SureFood GMO ID RR2Y (S2034) Quantification kits were SureFood GMO Quant Roundup Ready Soya (S2014) SureFood GMO Quant 35S soya (S2028) and SureFood GMO Quant RR2Y Soya (S2029) R-Biopharm AG MON89788 soybean was detected in sample T1 but only in some cases - 2 PCR replicates were always positive out of 4 after several repetitions
Remark (precision) in relation to T18 and T19 MON89788 soybean was detected in the sample but not quantified because of lt LOQ
T2 Please select the option that applies and proceed with the questionnaire
Answers Ratio
T2 was not analysed go to Q1 0 0
T2 was analysed go to Q2 82 100
No Answer 0 0
T2 1 Why did you not analyse test item 2
Answers Ratio
a) The sample matrix is out of the scope of our laboratory 0 0
b) The methods are not validated in our laboratory 0 0
c) We could not obtain sufficient good quality DNA suitable for further analysis 0 0
d) Reference material primers probes or other reagents were not available (in time) 0 0
e) We tried but our analysis failed 0 0
f) Other practical constraints (instrument broken no personnel etc) 0 0
g) Other reason 0 0
No Answer 82 100
T2 2 Select the DNA extraction method used for T2
Answers Ratio
CTAB 40 488
NucleoSpin Food 11 134
NucleoSpin Plant 3 366
GeneSpin 4 488
Promega Wizard 3 366
DNeasy Plant 3 366
DNeasy Mericon Food 4 488
Biotecon Foodproof 5 61
SDS 4 488
Fast ID Genomic DNA 3 366
Maxwell 16 Plant DNA 0 0
Maxwell 16 Food Feed Seed 4 488
Generon Ion Force 1 122
Other 2 244
No Answer 0 0
T2 3 Select any additional DNA purification method used for T2
Answers Ratio
No additional clean-up 52 634
Additional ethanol precipitation 9 110
Eurofins DNAExtractor cleaning column 3 366
Promega Wizard DNA clean-up resin 6 732
Qiagen QIAQuick 5 61
Qiagen Genomic-Tip 20G 1 122
Other method (no need to specify) 8 976
No Answer 0 0
EURL GMFF CT 0217 report
3546
T2 4 Indicate the number of replicate DNA extractions used to obtain the results
Answers Ratio
1 0 0
2 56 683
3 9 110
4 10 122
5 2 244
6 4 488
gt6 1 122
No Answer 0 0
T2 5 Select the approach(es) used to show absence of PCR inhibition
Answers Ratio
None (no inhibition was suspected based on experience) 7 854
We run two dilutions and verify if the delta Cq or GM are as expected 32 390
We run three or four dilutions and verify if the delta Cq or GM are as expected 12 146
We perform a PCR inhibition run with a reference gene before analysis 3 or 4 dilutions linear regression extrapolation of Cq of undiluted extract compare this to the measured Cq
15 183
We add an internal positive control to the reactions and check the Cq 16 195
We verify that the amplification curves look normal 25 305
We check that the optical density ratios (OD260280 260230) are acceptable 36 439
Other 1 122
No Answer 0 0
T2 6 Select the option applicable to your analysis for 40-3-2 soybean in T2
Answers Ratio
Not tested 0 0
Detected but not quantified 2 244
Detected and quantified please fill in Q6a-6h 80 976
Found absent 0 0
No Answer 0 0
T2 7 Select the option applicable to your analysis for 68416 soybean in T2
Answers Ratio
Not tested 15 183
Detected but not quantified 1 122
Detected and quantified please fill in Q7a-7h 0 0
Found absent 66 805
No Answer 0 0
T2 8 Select the option applicable to your analysis for MON89788 soybean in T2
Answers Ratio
Not tested 5 61
Detected but not quantified 6 732
Detected and quantified please fill in Q8a-8h 3 366
Found absent 68 829
No Answer 0 0
T2 9 If applicable why did you not test or quantify all GM events in T2
Answers Ratio
a) Not applicable all GM events listed were tested and all those detected were quantified 61 744
b) The event-specific detection method is not validated in our laboratory 6 732
c) Reference material primers probes or other reagents were not available (in time) 10 122
d) The result obtained was below the LODLOQ 5 61
e) Practical constraints (instrument broken no personnel etc) 0 0
f) Other reason 2 244
No Answer 0 0
T2 6a 40-3-2 Which quantification approach was used
Answers Ratio
Standard curve method (2 calibration curves) 71 866
Delta Cq method (one calibration curve) 9 110
Digital PCR (no calibration curve) 2 244
EURL GMFF CT 0217 report
3646
No Answer 2 244
T2 6b Select the calibrant used for the 40-3-2 standard curve
Answers Ratio
CRM from JRC (ex-IRMM) certified in GM mass fraction (gkg) 74 902
CRM from IRMM certified in GM copy number ratio (plasmid CRM) 0 0
Non-certified RM (eg lab QC material) expressed in GM mass fraction (gkg or mm ) 1 122
Non-certified RM (eg lab QC material) expressed in GM DNA copy number ratio (eg determined by digital PCR)
4 488
No calibrant used digital PCR done 1 122
No Answer 2 244
T2 6c Select the endogenous target(s) used for relative quantification of 40-3-2 soybean in T2
Answers Ratio
Soybean lec 74 bp (40-3-2 MON89788 MON87701 44406 356043 305423 etc) 63 768
Soybean lec 81 bp (Pauli et al 2001) 5 61
Soybean lec 102 bp (A5547 FG72) 1 122
Soybean lec 105 bp (A2704) 0 0
Soybean lec 118 bp (Shindo et al 2002) 6 732
Other please specify below 2 244
No Answer 5 61
Specify the reference target(s) used (if different from above)
Lectin - 74bp
lec 74bp
Lectine
SOJA LEKTIN 80 bp Va M Pijnenburrg H Gendre F Brignon P (1999) J Agric Food Chem 475261-5266
Terry C F Harris N Event-specific detection of Roundup Ready soya using two different real time PCR detection chemistries Eur Food Res Technol (2001) 213425-431
T2 6d Clarify the unit of measurement used and any conversion between units if applicable Carefully read the choices
below and select the one used in the measurements that resulted in a final result in GM mm for 40-3-2 If unclear or a
different approach was used please clarify this in the free text box below
Answers Ratio
The RM and the calibration standards were expressed in mass (or mass ) no conversion factor was applied
61 744
The calibration standards were expressed in DNA copies calculated from the RM in gkg but a conversion factor of 1 was applied (eg 10 mm GM = 10 cpcp GM corresponding to a 10x dilution of a 100 RM)
14 171
The calibration standards were expressed in DNA copies calculated from the RM in gkg and a conversion factor gt1 was applied to take account of the zygosity and target gene copies (double conversion applied) a conversion factor (eg 2) was used to convert from mass to copies (eg 20 mm GM = 10 cpcp GM corresponding to a 5x dilution of a 100 RM) the final result was again converted to mm by using the same conversion factor (eg x 2) Please specify this factor below
0 0
The measurements were done in DNA copies (as the RM used was expressed in this unit or digital PCR was used) A conversion factor was applied onto the final GM please specify this factor below
2 244
The measurements were done in DNA copies (as the RM used was expressed in this unit or digital PCR was used) No conversion factor was applied onto the final GM
3 366
No Answer 2 244
Conversion factor used to turn results into mm if applicable andor clarification on preparation of standards
1
Conversion factor of 1
T2 6e What was the amount of sample DNA (ng) used per PCR for 40-3-2 Choose the concentration that is closest to what
you used If applicable select multiple concentrations (eg if several dilutions were tested) but only those of which the
result was used to determine the reported GM
Answers Ratio
DNA concentration not determined 12 146
250 ng 5 61
200 ng 30 366
150 ng 7 854
100 ng 21 256
EURL GMFF CT 0217 report
3746
50 ng 17 207
25 ng 7 854
15 ng 2 244
lt10 ng 0 0
No Answer 2 244
T2 6f What was the LOQ (in mm ) for the 40-3-2 quantification
Answers
001 5 002 6 003 1 004 7 005 7 006 2 007 1 008 2 009 8 01 39 026 1 028 1
T2 6g How was the LOQ for 40-3-2 determined (if applicable)
Answers Ratio
Determined from the qPCR analysis for the current sample 21 256
Determined during the in-house validation of the method 43 524
Taken from the EURL GMFF validation report 19 232
By another approach please explain below 3 366
No Answer 2 244
Explanation on alternative LOQ determination
Determined from the digital PCR analysis for the current sample
Information about LOQ introduced by the manufacturer (R-Biopharm) of diagnostic kit
T2 6h How did you estimate the measurement uncertainty on the result reported for 40-3-2
Answers Ratio
Uncertainty budget (ISO GUM) 2 244
Uncertainty of the method (in-house validation) 30 366
Known uncertainty of the standard method 8 976
Measurement of replicates (precision) 32 390
From interlaboratory comparison data 4 488
Estimation based on judgement 2 244
In another way please specify below 7 854
No Answer 2 244
Explanation on alternative determination of measurement uncertainty
U=Sa radic1p+1n+(c0-c)2Sxx Uncertainty=Coverage Factor (P=95 anf f=n-1) Standard Deviation Square-root (Number of Measurements)
MU was estimated according to the Guidance Document on MU for GMO Testing Laboratories JRC ISSN 1018-5593
We used a calculated k-factor based on the number of repeats
Estimation based on within laboratory reproducibility
95 confidence interval of the results for the current sample
30 of the quantification result
The u was obtain through the estimation of the sd taking into account the repeatability and intermediate precision associated with the test sample Coverage factor k = 2 was applied then
Combined Uncertainty (CRM + measurement) following Application note (Lingsinger 2005 JRC Geel)
Additional comments and suggestions
Event 68416 was not tested due to non-availability of Positive control and reference material
DNA extraction of T2 has conducted using DNA extraction kits SureFood Prep Basic etc (see T1)
The NucleoSpin Food + NucleoSpin gDNA Clean-up was also used for DNA extraction from T1 and T2 samples The results for 40-3-2 were 25 - 30 lower than CTAB results T1 050 +- 018 (ww) T2 058 +- 020 (ww)
AOCS 0906-B as calibrant for MON89788 in T2 also
EURL GMFF CT 0217 report
3846
Annex 3 Qualitative performance of the participants
Table A31 Performance of the participants for the qualitative identification of GM events in CT-0217
The correct answer (yes) is that the GM event has been detected in the test item
Lab 40-3-2 detected in T1 40-3-2 detected in T2 Lab 40-3-2 detected in T1 40-3-2 detected in T2
L01 yes yes L45 yes yes
L02 yes yes L46 yes yes
L03 yes yes L47 yes yes
L04 yes yes L48 yes yes
L05 yes yes L49 yes yes
L06 yes yes L50 yes yes
L07 yes yes L51 yes yes
L08 yes yes L52 yes yes
L09 yes yes L53 yes yes
L10 yes Yes L54 yes yes
L11 yes yes L55 yes yes
L12 yes yes L56 yes yes
L13 yes yes L57 yes yes
L14 yes yes L58 yes yes
L15 yes yes L59 yes yes
L16 yes yes L60 yes yes
L17 yes yes L61 yes yes
L18 yes yes L62 yes yes
L19 yes yes L63 yes yes
L20 yes yes L66 yes yes
L22 yes yes L68 yes yes
L23 yes yes L69 yes yes
L24 yes yes L70 yes yes
L25 yes yes L71 yes yes
L26 yes yes L72 yes yes
L27 yes yes L73 T1 was not analysed yes
L29 yes yes L74 yes yes
L30 yes yes L75 yes yes
L31 yes yes L76 yes yes
L32 yes yes L77 yes yes
L33 yes yes L78 yes yes
L34 yes yes L79 yes yes
L35 yes yes L80 yes yes
L36 yes yes L81 yes yes
L37 yes yes L82 yes yes
L38 yes yes L83 yes yes
L39 yes yes L84 yes yes
L40 yes yes L85 yes yes
L41 yes yes L86 yes yes
L42 yes yes L87 yes yes
L43 T1 was not analysed yes L88 yes yes
L44 yes yes L89 yes yes
Although the questionnaire was not returned by the participant the presence of the event was inferred from the quantitative result reported
L10 did not fill in the questionnaire but reported a larger than 01 result for T1 and T2
EURL GMFF CT 0217 report
3946
Annex 4 Participants quantitative performance
The z and ζ scores of all laboratories are reported in Tables A41 and A42 and in Figures
A41 and A42 for 40-3-2 soybean in T1 and T2 respectively For consistency the
reported results are shown with two decimals the performance scores with one decimal
The z scores are displayed in green (satisfactory) orange (questionable) or red cells
(unsatisfactory)
Table A41 Quantitative results (in mm ) and performance scores of participants of CT-0217 for 40-3-2 soybean in chicken feed (T1)
Lab1 Category xi U k2 Log(xi) u(xi) u(xi-log) z score ζ score3
L01 NRL120 064 008 200 -019 004 003 -10 -28
L02 NRL882 057 002 200 -024 001 001 -15 -67
L03 Non-NRL 073 1520 200 -014 760 452 -04 00
L04 Non-NRL 075
-012 000 000 -03 -13
L05 NRL120 073 007 257 -014 003 002 -04 -15
L06 NRL882 075 021 200 -012 011 006 -03 -04
L07 NRL882 065 013 200 -019 007 004 -09 -19
L08 NRL120 062 023 200 -021 012 008 -11 -13
L09 NRL882 081 027 200 -009 014 007 01 01
L12 Non-NRL 100 051 200 000 026 011 10 09
L13 NRL882 094 019 173 -003 011 005 07 13
L14 Non-NRL 063
-020 000 000 -10 -50
L15 NRL882 110 011 200 004 005 002 14 46
L16 Non-NRL 117
007 000 000 17 80
L17 NRL882 072 010 200 -014 005 003 -05 -12
L18 Non-NRL 040
-040 000 000 -30 -145
L19 Non-NRL 115 063 173 006 036 014 16 11
L20 NRL120 108 032 200 003 016 006 13 19
L22 Non-NRL 051 030 223 -029 013 011 -20 -17
L23 Non-NRL 047 009 200 -033 005 004 -23 -50
L24 NRL882 072 019 200 -014 010 006 -05 -07
L25 Non-NRL 120
008 000 000 18 85
L26 NRL882 023 009 200 -064 005 008 -54 -62
L27 Non-NRL 098 015 200 -001 008 003 09 23
L29 NRL120 090 008 173 -005 005 002 05 17
L30 NRL882 045 013 200 -035 007 006 -25 -38
L31 NRL882 080 038 223 -010 017 009 00 00
L32 Non-NRL 076 039 200 -012 020 011 -02 -02
L33 NRL-120 057 014 200 -024 007 005 -15 -26
L34 NRL120 061 016 200 -021 008 006 -12 -19
L35 NRL882 097 027 200 -001 014 006 08 13
L36 Non-NRL 090 030 200 -005 015 007 05 07
L37 NRL120 065 026 200 -019 013 009 -09 -10
L38 NRL120 093 014 237 -003 006 003 07 19
L39 Non-NRL 112
005 000 000 15 71
L40 NRL882 053 008 200 -028 004 003 -18 -46
L41 NRL120 080 003 200 -010 002 001 00 00
L42 NRL882 104 031 200 002 016 006 11 17
L44 NRL120 084 007 257 -008 003 001 02 09
L45 NRL882 065 018 200 -019 009 006 -09 -14
L46 NRL882 081 018 200 -009 009 005 01 01
L47 NRL882 141 027 173 015 016 005 25 47
L48 NRL882 059 028 200 -023 014 010 -13 -13
L49 Non-NRL 089 031 200 -005 016 008 05 06
L50 NRL120 073 005 200 -014 003 001 -04 -15
L51 Non-NRL 077 049 200 -011 025 014 -02 -01
L52 Non-NRL 091 012 200 -004 006 003 06 16
L53 Non-NRL 043 081 200 -037 041 041 -27 -07
L54 NRL882 074 035 200 -013 018 010 -03 -03
L55 Non-NRL 076 019 173 -012 011 006 -02 -03
EURL GMFF CT 0217 report
4046
Lab1 Category xi U k2 Log(xi) u(xi) u(xi-log) z score ζ score3
L56 NRL882 115 022 173 006 013 005 16 30
L57 NRL120 075 020 200 -012 010 006 -03 -04
L58 NRL120 089 016 200 -005 008 004 05 11
L59 NRL882 137 038 200 014 019 006 23 37
L60 NRL882 068 017 200 -017 009 005 -07 -12
L61 Non-NRL 065
-019 000 000 -09 -43
L62 NRL120 130 037 237 011 016 005 21 38
L63 Non-NRL 088 006 200 -006 003 001 04 16
L64 NRL882 081 024 173 -009 014 007 01 01
L65 Non-NRL 116 065 200 006 033 012 16 13
L66 NRL882 048 024 200 -032 012 011 -22 -20
L68 NRL882 139 015 200 014 008 002 24 77
L69 Non-NRL 010 004 200 -101 002 008 -91 -105
L70 Non-NRL 057 010 200 -024 005 004 -15 -34
L72 NRL882 108 032 200 003 016 007 13 19
L74 NRL882 075 019 200 -012 010 005 -03 -05
L75 Non-NRL 862
094 000 000 103 499
L76 NRL882 099 038 200 000 019 008 09 11
L77 NRL120 075 009 226 -012 004 002 -03 -09
L78 NRL120 059 006 300 -023 002 001 -13 -52
L79 Non-NRL 046
-034 000 000 -24 -116
L80 NRL120 071 024 200 -015 012 007 -05 -07
L81 NRL882 071 028 200 -015 014 009 -05 -06
L82 NRL120 092 015 200 -004 008 004 06 15
L83 NRL120 114 013 173 006 008 003 15 44
L84 Non-NRL 071 030 200 -015 015 009 -05 -05
L85 NRL882 074 031 201 -013 015 009 -03 -04
L86 Non-NRL 066 022 200 -018 011 007 -08 -11
L87 NRL882 085 015 200 -007 008 004 03 06
L88 NRL-120 lt0044
L89 NRL882 079 022 200 -010 011 006 -01 -01
1 One NRL882 (L73) did not report a quantitative result for 40-3-2 in T1 because T1 is out of scope of the laboratory 2 If the k factor was not reported by the laboratory a value of 173 was assigned (radic3) for calculation of the ζ score 3 The ζ scores are provided for information only with indicative of a questionable score and of an unsatisfactory score 4 The less than value reported by the laboratory is considered unsatisfactory
EURL GMFF CT 0217 report
4146
Table A42 Quantitative results (in mm ) and performance scores of participants of CT-0217 for
40-3-2 soybean in soybean flour (T2)
Lab1 Category xi U k2 Log(xi) u(xi) u(xi-log) z score ζ score3
L01 NRL120 071 007 200 -015 004 002 -03 -12
L02 NRL882 081 003 200 -009 002 001 03 19
L03 Non-NRL 088 1520 200 -006 760 375 06 00
L04 Non-NRL 089
-005 000 000 07 56
L05 NRL120 075 005 257 -012 002 001 -01 -04
L06 NRL882 080 022 200 -010 011 006 02 04
L07 NRL882 076 009 200 -012 005 003 00 00
L08 NRL120 042 016 200 -038 008 008 -26 -31
L09 NRL882 081 027 200 -009 014 007 03 04
L12 Non-NRL 076 039 200 -012 020 011 00 00
L13 NRL882 069 011 173 -016 006 004 -04 -10
L14 Non-NRL 075
-012 000 000 -01 -05
L15 NRL882 084 011 200 -008 005 003 04 14
L16 Non-NRL 088
-006 000 000 06 52
L17 NRL882 075 010 200 -012 005 003 -01 -02
L18 Non-NRL 034
-047 000 000 -35 -287
L19 Non-NRL 089 016 173 -005 009 005 07 15
L20 NRL120 104 031 200 002 016 006 14 21
L22 Non-NRL 081 026 223 -009 012 006 03 04
L23 Non-NRL 064 012 200 -019 006 004 -08 -18
L24 NRL882 079 021 200 -010 011 006 02 03
L25 Non-NRL 085
-007 000 000 05 39
L26 NRL882 117 039 200 007 020 007 19 25
L27 Non-NRL 118 018 200 007 009 003 19 54
L29 NRL120 078 004 173 -011 002 001 01 06
L30 NRL882 069 020 200 -016 010 006 -04 -07
L31 NRL882 096 077 233 -002 033 015 10 07
L32 Non-NRL 090 039 200 -005 020 009 07 08
L33 NRL-120 078 004 200 -011 002 001 01 06
L34 NRL120 073 014 200 -014 007 004 -02 -04
L35 NRL882 095 027 200 -002 014 006 10 15
L36 Non-NRL 077 003 200 -011 002 001 01 03
L37 NRL120 075 010 200 -012 005 003 -01 -02
L38 NRL120 119 008 237 008 003 001 19 112
L39 Non-NRL 062
-021 000 000 -09 -73
L40 NRL882 045 008 200 -035 004 004 -23 -56
L41 NRL120 087 002 200 -006 001 000 06 44
L42 NRL882 068 020 200 -017 010 006 -05 -08
L43 Non-NRL 065
-019 000 000 -07 -56
L44 NRL120 074 006 220 -013 003 002 -01 -06
L45 NRL882 073 021 200 -014 011 006 -02 -03
L46 NRL882 081 018 200 -009 009 005 03 05
L47 NRL882 062 012 173 -021 007 005 -09 -18
L48 NRL882 074 035 173 -013 020 012 -01 -01
L49 Non-NRL 073 026 200 -014 013 008 -02 -02
L50 NRL120 081 007 200 -009 004 002 03 12
L51 Non-NRL 068 044 200 -017 022 014 -05 -03
L52 Non-NRL 073 011 200 -014 006 003 -02 -05
L53 Non-NRL 058 081 200 -024 041 030 -12 -04
L54 NRL882 073 026 200 -014 013 008 -02 -02
L55 Non-NRL 072 018 173 -014 010 006 -02 -04
L56 NRL882 066 018 173 -018 010 007 -06 -09
L57 NRL120 060 020 200 -022 010 007 -10 -14
L58 NRL120 067 011 200 -017 006 004 -06 -15
L59 NRL882 076 022 200 -012 011 006 00 00
L60 NRL882 080 020 200 -010 010 005 02 04
L61 Non-NRL 050
-030 000 000 -18 -150
EURL GMFF CT 0217 report
4246
Lab1 Category xi U k2 Log(xi) u(xi) u(xi-log) z score ζ score3
L62 NRL120 075 012 245 -012 005 003 -01 -02
L63 Non-NRL 075 004 200 -012 002 001 -01 -04
L64 NRL882 078 023 173 -011 013 007 01 01
L65 Non-NRL 051 023 200 -029 012 010 -17 -18
L66 NRL882 073 024 200 -014 012 007 -02 -02
L68 NRL882 091 011 200 -004 006 003 08 27
L69 Non-NRL 092 035 200 -004 018 008 08 10
L70 Non-NRL 050 009 200 -030 005 004 -18 -45
L72 NRL882 092 028 200 -004 014 007 08 12
L73 NRL882 092 030 200 -004 015 007 08 11
L74 NRL882 064 013 200 -019 007 004 -08 -16
L75 Non-NRL 644
081 000 000 93 760
L76 NRL882 056 099 200 -025 050 038 -13 -03
L77 NRL120 054 006 226 -027 003 002 -15 -61
L78 NRL120 065 001 300 -019 000 000 -07 -55
L79 Non-NRL 071
-015 000 000 -03 -25
L80 NRL120 095 030 200 -002 015 007 10 14
L81 NRL882 077 032 200 -011 016 009 01 01
L82 NRL120 102 032 200 001 016 007 13 18
L83 NRL120 084 005 173 -008 003 001 04 22
L84 Non-NRL 045 030 200 -035 015 014 -23 -16
L85 NRL882 082 015 212 -009 007 004 03 08
L86 Non-NRL 073 024 200 -014 012 007 -02 -02
L87 NRL882 077 012 200 -011 006 003 01 01
L88 NRL120 065 020 200 -019 010 007 -07 -10
L89 NRL882 077 021 200 -011 011 006 01 01
1 All participating NRL882 reported a quantitative result for 40-3-2 soybean in T2 2 If the k factor was not reported by the laboratory a value of 173 was assigned (radic3) for calculation of the ζ score 3 The ζ scores are provided for information only with indicative of a questionable score and of an unsatisfactory score
EURL GMFF CT 0217 report 4346
Figure A41 Laboratory results for soybean event 40-3-2 in test item 1 and kernel density distribution (insert)
The horizontal full line shows the assigned value (on the log scale) the dashed black lines represent the expanded measurement uncertainty of the assigned value and the wider interval (dashed red lines) represents the limits of satisfaction (|z|le 20) Laboratory results are shown with the expanded measurement uncertainties (when reported) the expanded measurement uncertainty of L03 is out of scale
EURL GMFF CT 0217 report 4446
Figure A42 Laboratory results for soybean event 40-3-2 in test item 2 and kernel density distribution (insert)
The horizontal full line shows the assigned value (on the log scale) the dashed black lines represent the expanded measurement uncertainty of the assigned value and the wider interval (dashed red lines) represents the limits of satisfaction (|z|le 20) Laboratory results are shown with the expanded measurement uncertainties (when reported) the expanded measurement uncertainty of L03 is out of scale
Europe Direct is a service to help you find answers
to your questions about the European Union
Freephone number ()
00 800 6 7 8 9 10 11 () The information given is free as are most calls (though some operators phone boxes or hotels may
charge you)
More information on the European Union is available on the internet (httpeuropaeu)
HOW TO OBTAIN EU PUBLICATIONS
Free publications
bull one copy
via EU Bookshop (httpbookshopeuropaeu)
bull more than one copy or postersmaps
from the European Unionrsquos representations (httpeceuropaeurepresent_enhtm) from the delegations in non-EU countries (httpeeaseuropaeudelegationsindex_enhtm) by contacting the Europe Direct service (httpeuropaeueuropedirectindex_enhtm) or calling 00 800 6 7 8 9 10 11 (freephone number from anywhere in the EU) () () The information given is free as are most calls (though some operators phone boxes or hotels may charge you)
Priced publications
bull via EU Bookshop (httpbookshopeuropaeu)
KJ-N
A-2
8873-E
N-N
doi 102760461562
ISBN 978-92-79-76303-8

EURL GMFF CT 0217 report
2546
0
Body Organisation Department City Country
NRL120 cont
Istituto Superiore di Sanitagrave DSPVSA Rome ITALY
CREA-SCS Sede di Tavazzano Laboratorio
Tavazzano (LO) ITALY
Netherlands Food and Consumer Product Safety Authority (NVWA)
Laboratorium VV Wageningen NETHERLANDS
Plant Breeding and Acclimatization Institute NRI GMO Controlling Laboratory Blonie POLAND
Fera Science Ltd Plants York UNITED KINGDOM
SASA Scottish Government Seed certification Edinburgh UNITED KINGDOM
Non-NRL
FASFC Melle GMO Melle BELGIUM
Laboratoacuterio Nacional Agropecuaacuterio - LANAGROMG Pedro LeopoldoMG BRAZIL
Ministry of Agriculture Livestock and Food Supply Official Laboratory of Goiaacutes Goiania BRAZIL
Laboratory of SGS Bulgaria Ltd Varna BULGARIA
Servicio Agriacutecola y Ganadero Biotechnology Santiago CHILE
Instituto Nacional de Vigilancia de Medicamentos y Alimentos Invima
Laboratorio OGM Bogotaacute COLOMBIA
Croatian Centre for Agriculture Food and Rural Affairs Institute for Seed and Seedlings
Non-NRL Osijek CROATIA
CVUA-OWL Detmold GERMANY
Thuumlringer Landesanstalt fuumlr Landwirtschaft
Jena GERMANY
Biomi Ltd Godollo HUNGARY
ICAR-National Bureau of Plant Genetic Resources Division of Genomic Resources
New Delhi INDIA
IZSLER Brescia ITALY
Istituto Sperimentale Del Piemonte Liguria e Valle DAosta
SC Biotechnologie Torino ITALY
Istituto Zooprofilattico Sperimentale Abruzzo e Molise Hygiene in Food Technology Teramo ITALY
American University of Science and Technology Laboratory Science amp Technology
Ashrafieh-Beirut LEBANON
SENASICA-CNRDOGM Deteccioacuten de OGM Tecaacutemac MEXICO
Bureau of Plant Industry National Plant Quarantine Services Division Post Entry Quarantine Station
Department of Agriculture Los Banos Laguna PHILIPPINES
Laboratorul Central pentru Calitatea Semintelor si a Materialului Saditor Bucuresti
LEDOMG Bucuresti ROMANIA
Institute of Molecular Genetics and Genetic Engineering
Plant Molecular Biology Belgrade SERBIA
SP Laboratorija ad Genetical dpt Becej SERBIA
A Bio Tech Lab Laboratory for biotechnology Sremska Kamenica SERBIA
Agri-Food amp Veterinary Authority of Singapore Veterinary Public Health Labor Singapore SINGAPORE
Federal Food Safety and Veterinary Office FSVO Risk Assessment Division Bern SWITZERLAND
Agroscope Feed Analytics Posieux SWITZERLAND
Ankara Food Control Laboratory Molecular Biology Ankara TURKEY
State Scientific Research Institute of laboratory Diagnostic and Veterynary Sanitary Expertise
Research GMOs Department Kyiv UKRAINE
Ukrmetrteststandart Molecular Biology Kiev UKRAINE
Ukrainian Laboratory of Quality and Safety of Agricultural Products (ULQSAP)
Chabany village UKRAINE
USDA-GIPSA Biotechnology Laboratory Kansas City UNITED STATES
Agricultural Genetics Institute GMO Detection 04 VIETNAM
National Institute for Food Control Quality management Ha Noi VIETNAM
Quality Assurance and Testing Center 3 (QUATEST 3) Microbiology ndash GMO Testing Lab
Bienhoa VIETNAM
1 NRL882 means NRLs designated by their Member State to coordinate the activities of official laboratories for GMO control under Regulation (EC) No 8822004 NRL120 means NRLs nominated under Regulation (EU) No 1202014 to support the EURL GMFF on method validation (and not also NRL882) Non-NRL means official control laboratories from EU or non-EU countries that are not NRLs according to the Regulations mentioned above
EURL GMFF CT 0217 report
2646
References
(including those referred to in the Annexes)
1 Regulation (EC) No 18292003 of the European Parliament and of the Council of 22
September 2003 on genetically modified food and feed Off J Eur Union L 268 1-23
2 Regulation (EC) No 8822004 of the European Parliament and of the Council of 29
April 2004 on official controls performed to ensure the verification of compliance with
feed and food law animal health and animal welfare rules Off J Eur Union L 191 1-
52
3 Commission Implementing Regulation (EU) No 1202014 of 7 February 2014
amending Regulation (EC) No 19812006 on detailed rules for the implementation of
Article 32 of Regulation (EC) No 18292003 of the European Parliament and the
Council as regards the Community reference laboratory for genetically modified
organisms Off J Eur Union L 39 46-52
4 Commission Regulation (EU) No 6192011 of 24 June 2011 laying down the methods
of sampling and analysis for the official control of feed as regards presence of
genetically modified material for which an authorisation procedure is pending or the
authorisation of which has expired Off J Eur Union L 166 9-15
5 ISOIEC 170432010 Conformity assessment ndash General requirements for proficiency
testing International Organization for Standardization Geneva Switzerland
6 Dimitrievska B Kortekaas AM Seghers J Leys H Corbisier Ph Trapmann S
(2017) The certification of different mass fractions of MON-Oslash4Oslash32-6 in soya bean
powder Certified Reference Materials ERMreg-BF410ap ERMreg-BF410bp ERMreg-
BF410cp ERMreg-BF410dp and ERMreg-BF410ep EC certification report EUR 28665 EN
ISBN 978-92-79-70107-8
7 Rosa SF Gatto F Angers-Loustau A Petrillo M Kreysa J Querci M (2016)
Development and applicability of a ready-to-use PCR system for GMO screening Food
Chemistry 201 110ndash119
8 Querci M Foti N Bogni B Kluga L Broll H amp Van den Eede G (2009) Real-
time PCR-based ready-to-use multi-target analytical system for GMO detection Food
Anal Methods 2 325-336
9 ISO 170342016 General requirements for the competence of reference material
producers International Organization for Standardization Geneva Switzerland
10 Technical guidance document from the European Union Reference Laboratory for
Genetically Modified Food and Feed on the implementation of Commission Regulation
(EU) No 6192011 (httpgmo-crljrceceuropaeuguidancedocshtm)
11 Corbisier P Barbante A Berben G Broothaerts W De Loose M Emons H
Georgieva Tz Lievens A Mazzara M Papazova N Perri E Sowa S Stebih D Terzi
V Trapmann S (2017) Recommendation for the unit of measurement and the
measuring system to report traceable and comparable results expressing GM content
in accordance with EU legislation JRC Technical report (httpgmo-
crljrceceuropaeuENGLdocsWG-UoM-Final-Reportpdf)
12 Analytical Methods Committee (1989) Robust statistics ndash How not to reject outliers
Part 1 Basic Concepts Analyst 114 1359-1364
13 Analytical Methods Committee (2001) Robust statistics a method for coping with
outliers AMC Technical Brief No 6 April 2001
14 Thompson M Ellison SLR Owen L Mathieson K Powell J Key P Wood R
Damant AP (2006) Scoring in Genetically Modified Organism Proficiency Tests
Based on Log-Transformed Results J AOAC Int 89 232-239
EURL GMFF CT 0217 report
2746
15 Analytical Methods Committee (2004) GMO Proficiency Testing Interpreting z scores
derived from log-transformed data RSC AMC Technical Brief No 18 December
2004
16 ISO 135282015 Statistical methods for use in proficiency testing by interlaboratory
comparison International Organization for Standardization Geneva Switzerland
17 Ellison SLR Williams A (Eds) EurachemCITAC guide Quantifying Uncertainty in
Analytical Measurement Third edition (2012) ISBN 978-0-948926-30-3 Available
from wwweurachemorg
18 ISOIEC Guide 98-32008 (JCGMWG1100) Uncertainty of measurement - Part 3
Guide to the expression of uncertainty in measurement
19 Linsinger T (2010) Comparison of a measurement result with the certified value
Application Note 1 Luxemburg Office for Official Publications of the European
Communities (httpscrmjrceceuropaeu)
20 Trapmann S Burns M Broll H Macarthur R Wood R Zel J (2009) Guidance
Document on Measurement Uncertainty for GMO Testing Laboratories Luxembourg
Office for Official Publications of the European Communities EUR 22756 EN2-2009
21 Corbisier P Zobell O Trapmann S Auclair G and Emons H (2014) Training
Manual on GMO Quantification Proper Calibration and Estimation of Measurement
Uncertainty Luxembourg Publications Office of the European Union
(doi10278710085)
22 Thompson M Wood R (1993) The international harmonized protocol for the
proficiency testing of (chemical) analytical laboratories J AOAC Int 76 926-940
23 Powell J Owen L (2002) Reliability of Food Measurements The Application of
Proficiency Testing to GMO Analysis Accred Qual Ass 7 392-402
24 Linsinger TPJ van der Veen AMH Gawlik BM Pauwels J Lamberty A
(2004) Planning and combining of isochronous stability studies of CRMs Accred Qual
Assur 9 464-472
EURL GMFF CT 0217 report
2846
Annexes
Annex 1 Homogeneity and stability of test items
A11 Homogeneity of test items
The homogeneity of T2 was confirmed during the certification of this CRM
The assessment of the homogeneity(16) of T1 was performed after the test item had been
packed in its final form and before distribution to participants using the following
acceptance criterion
pts s 30 (A11)
Where ss is the between-test item standard deviation as determined by a 1-way random
effects ANOVA(22) and σpt is the standard deviation for comparative testing The value of
σpt the target standard deviation for proficiency assessment was based upon the
experience acquired in previous PTs and set to 010 on the log domain(23)
If the criterion according to A11 is met (ie ss le 0030) the between-test item standard
deviation contributes no more than about 10 to the standard deviation for comparative
testing
The repeatability of the test method is the square root of the mean sum of squares within-
test items MSwithin The relative between-test item standard deviation ssrel is given by
100
y
n
MSMS
s
withinbetween
rels (A12)
where MSbetween is the mean sum of squares between test items
MSwithin is the mean sum of squares within test items
n is the number of replicates for each sample
y is the mean of the homogeneity data
If MSwithin gt MSbetween then
100
1
24
y
nNn
ityrepeatabil
us bbrels (A13)
where ubb is the maximum uncertainty contribution that can be obtained by the hidden
heterogeneity of the material
Seven bottles (N = 7) were randomly selected and analysed in five replicates (n = 5) The
between-test item standard deviation was 0018 mm The criterion described in
formula (A11) was fulfilled (0018 lt 0030) indicating that T1 was adequately
homogeneous
EURL GMFF CT 0217 report
2946
A12 Stability of test items
For T1 an isochronous short-term stability study(24) involving two test samples with three
replicates each (N = 2 n = 3) was conducted over two and four weeks at +4 degC +18 degC
and +60 degC The 40-3-2 soybean mass fraction was measured by qPCR The
measurements were performed under intermediate precision conditions with respect to the
PCR plates
The results did not reveal any influence of time or storage at +4 degC or +18 degC on the
stability of the test item (compared to storage at -70 degC) with regard to the soybean event
40-3-2 mass fraction Even at 60 degC no significant trend was measured although the
extracted DNA was more fragmented as seen by agarose gel electrophoresis
The test items were shipped at ambient temperature
The stability of T1 during the period covered by the PT (approximately 5 months between
production of the test item and the deadline for results reporting) was tested by analysing
simultaneously on one PCR plate two units (N = 2 n = 3) stored either at the normal
storage temperature (4 degC) or at a reference temperature (-70 degC) The evaluation was
based on the results ratio between samples stored at 4 degC and -70 degC The data were
evaluated against storage time and regression lines were calculated The slopes of the
regression lines were tested for statistical significance (lossincrease due to storage) No
significant trend was detected at a 95 confidence level The T1 material can therefore
be stored at 4 degC and was stable during the period covered by this CT
The stability of T2 was ensured as part of the post-certification stability monitoring of
ERM-BF410p Measurements were performed simultaneously on one PCR plate as
described for T1 on units stored at the normal storage temperature (4 degC) and at a
reference temperature (-70 degC) No significant trend was detected at a 95 confidence
level The T2 material can therefore be stored at 4 degC and was stable during the period
covered by this CT
EURL GMFF CT 0217 report
3046
Annex 2 Questionnaire data
The results received from 82 laboratories were exported from the EUSurvey
Questionnaire on CT 0217 analysis and are tabulated below Multiple answers were
allowed for all questions except for the questions on the calibrant used The results of the
open questions were manually analysed and reported Answers to the questions on GM
events that were not to be quantified in the test items are not shown
Select the group to which your organisation belongs Note 882 and 120 refer to EU Regulations 8822004 and 1202014
resp select NRL120 if your organisation is ONLY listed under Regulation 1202014 select non-NRL if your organisation is
not an NRL under either EU Regulation
Answers Ratio
NRL882 33 402
NRL120 20 244
Non-NRL 29 354
No Answer 0 0
T1 Please select the option that applies and proceed with the questionnaire
Answers Ratio
T1 was not analysed go to Q1 2 244
T1 was analysed go to Q2 80 976
No Answer 0 0
T1 1 Why did you not analyse test item 1
Answers Ratio
a) The sample matrix is out of the scope of our laboratory 1 122
b) The methods are not validated in our laboratory 0 0
c) We could not obtain sufficient good quality DNA suitable for further analysis 0 0
d) Reference material primers probes or other reagents were not available (in time) 0 0
e) We tried but our analysis failed 0 0
f) Other practical constraints (instrument broken no personnel etc) 1 122
g) Other reason 0 0
No Answer 80 976
T1 2 Select the DNA extraction method used for T1
Answers Ratio
CTAB 41 50
NucleoSpin Food 10 122
NucleoSpin Plant 3 366
GeneSpin 4 488
Promega Wizard 3 366
DNeasy Plant 3 366
DNeasy Mericon Food 5 61
Biotecon Foodproof 5 61
SDS 4 488
Fast ID Genomic DNA 2 244
Maxwell 16 Plant DNA 0 0
Maxwell 16 Food Feed Seed 5 61
Generon Ion Force 1 122
Other 2 244
No Answer 2 244
T1 3 Select any additional DNA purification method used for T1
Answers Ratio
No additional clean-up 51 622
Additional ethanol precipitation 9 110
Eurofins DNAExtractor cleaning column 3 366
Promega Wizard DNA clean-up resin 6 732
Qiagen QIAQuick 4 488
Qiagen Genomic-Tip 20G 1 122
Other method (no need to specify) 7 854
No Answer 2 244
EURL GMFF CT 0217 report
3146
T1 4 Indicate the number of replicate DNA extractions used to obtain the results
Answers Ratio
1 0 0
2 52 634
3 9 110
4 10 122
5 2 244
6 6 732
gt6 1 122
No Answer 2 244
T1 5 Select the approach(es) used to show absence of PCR inhibition
Answers Ratio None (no inhibition was suspected based on experience) 6 732
We check that the optical density ratios (OD260280 260230) are acceptable 40 488
We verify that the amplification curves look normal 24 293
We run two dilutions and verify if the delta Cq or GM are as expected 31 378
We run three or four dilutions and verify if the delta Cq or GM are as expected 13 158
We perform a PCR inhibition run with a reference gene before analysis 3 or 4 dilutions linear regression extrapolation of Cq for undiluted extract compare this to the measured Cq
16 195
We add an internal positive control to the reactions and check the Cq 15 183
Other 1 122
No Answer 2 244
T1 6 Select the option applicable to your analysis for 40-3-2 soybean in T1
Answers Ratio
Not tested 0 0
Detected but not quantified 3 366
Detected and quantified please fill in Q6a-6h 77 939
Found absent 0 0
No Answer 2 244
T1 7 Select the option applicable to your analysis for 68416 soybean in T1
Answers Ratio
Not tested 14 171
Detected but not quantified 2 244
Detected and quantified please fill in Q7a-7h 0 0
Found absent 64 781
No Answer 2 244
T1 8 Select the option applicable to your analysis for MON89788 soybean in T1
Answers Ratio
Not tested 6 732
Detected but not quantified 33 402
Detected and quantified please fill in Q8a-8h 15 183
Found absent 26 317
No Answer 2 244
T1 9 If applicable why did you not test or quantify all GM events in T1
Answers Ratio
a) Not applicable all GM events listed were tested and all those detected were quantified 45 549
b) The event-specific detection method is not validated in our laboratory 7 854
c) Reference material primers probes or other reagents were not available (in time) 9 110
d) The result obtained was below the LODLOQ 18 220
e) Practical constraints (instrument broken no personnel etc) 0 0
f) Other reason 9 110
No Answer 2 244
T1 6a Soybean 40-3-2 Which quantification approach was used
Answers Ratio
Standard curve method (2 calibration curves) 68 829
Delta Cq method (one calibration curve) 9 110
Digital PCR (no calibration curve) 2 244
EURL GMFF CT 0217 report
3246
No Answer 5 61
T1 6b Select the calibrant used for the 40-3-2 standard curve
Answers Ratio
CRM from JRC (ex-IRMM) certified in GM mass fraction (gkg) 71 866
Non-certified RM (eg lab QC material) expressed in GM mass fraction (gkg or mm ) 1 122
Non-certified RM (eg lab QC material) expressed in GM DNA copy number ratio (eg determined by digital PCR)
4 488
No calibrant used digital PCR done 1 122
No Answer 5 61
T1 6c Select the endogenous target(s) used for relative quantification of 40-3-2 soybean in T1
Answers Ratio
Soybean lec 74 bp (40-3-2 MON89788 MON87701 44406 356043 305423 etc) 65 793
Soybean lec 81 bp (Pauli et al 2001) 5 61
Soybean lec 102 bp (A5547 FG72) 1 122
Soybean lec 105 bp (A2704) 0 0
Soybean lec 118 bp (Shindo et al 2002) 5 61
Other please specify below 1 122
No Answer 5 61
Specify the reference target(s) used (if different from above)
SOJA LEKTIN 80 bp - Va M Pijnenburrg H Gendre F Brignon P (1999) J Agric Food Chem 475261-5266
T1 6d Clarify the unit of measurement used and any conversion between units if applicable Carefully read the choices
below and select the one used in the measurements that resulted in a final result in GM mm for 40-3-2 If unclear or a
different approach was used please clarify this in the free text box below
Answers Ratio
The RM and the calibration standards were expressed in mass (or mass ) no conversion factor was applied
59 720
The calibration standards were expressed in DNA copies calculated from the RM in gkg but a conversion factor of 1 was applied (eg 10 mm GM = 10 cpcp GM corresponding to a 10x dilution of a 100 RM)
13 159
The calibration standards were expressed in DNA copies calculated from the RM in gkg and a conversion factor gt1 was applied to take account of the zygosity and target gene copies (double conversion applied) a conversion factor (eg 2) was used to convert from mass to copies (eg 20 mm GM = 10 cpcp GM corresponding to a 5x dilution of a 100 RM) the final result was again converted to mm by using the same conversion factor (eg x 2) Please specify this factor below
0 0
The measurements were done in DNA copies (as the RM used was expressed in this unit or digital PCR was used) A conversion factor was applied onto the final GM please specify this factor below
2 244
The measurements were done in DNA copies (as the RM used was expressed in this unit or digital PCR was used) No conversion factor was applied onto the final GM
3 366
No Answer 5 61
Conversion factor used to turn results into mm if applicable andor clarification on preparation of standards
1
Conversion factor of 1
T1 6e What was the amount of sample DNA (ng) used per PCR for 40-3-2 Choose the concentration that is closest to what
you used If applicable select multiple concentrations (eg if several dilutions were tested) but only those of which the
result was used to determine the reported GM
Answers Ratio
DNA concentration not determined 12 146
250 ng 5 61
200 ng 30 366
150 ng 9 110
100 ng 18 220
50 ng 14 171
25 ng 6 732
15 ng 0 0
lt10 ng 0 0
No Answer 5 61
EURL GMFF CT 0217 report
3346
T1 6f What was the LOQ (in mm ) for the 40-3-2 quantification
Answers
001 3 002 4 003 1 004 6 005 7 006 2 008 4 009 7 01 37 019 1 02 1 03 1 035 1 04 1 13 1
T1 6g How was the LOQ for 40-3-2 determined (if applicable)
Answers Ratio
Determined from the qPCR analysis for the current sample 20 244
Determined during the in-house validation of the method 42 512
Taken from the EURL GMFF validation report 17 207
By another approach please explain below 2 244
No Answer 5 61
Explanation on alternative LOQ determination
Determined from the digital PCR analysis for the current sample Information about LOQ introduced by the manufacturer (R-Biopharm) of diagnostic kit The u was obtain through the estimation of the sd taking into account the repeatability and intermediate precision associated with the test sample Coverage factor k = 2 was applied then
T1 6h How did you estimate the measurement uncertainty on the result reported for 40-3-2 soybean
Answers Ratio
Uncertainty budget (ISO GUM) 2 244
Uncertainty of the method (in-house validation) 27 329
Known uncertainty of the standard method 9 110
Measurement of replicates (precision) 32 390
From interlaboratory comparison data 4 488
Estimation based on judgement 2 244
In another way please specify below 6 732
No Answer 5 61
Explanation on alternative determination of measurement uncertainty
U=Sa radic1p+1n+(c0-c)2Sxx
Uncertainty=Coverage Factor (P=95 anf f=n-1) Standard Deviation Square-root (Number of Measurements)
MU was estimated according to the Guidance Document on MU for GMO Testing Laboratories JRC ISSN 1018-5593
we used a calculated k-factor based on the number of repeats
Estimation based on within laboratory reproducibility
95 confidence interval of the results for the current sample
The u was obtain through the estimation of the sd taking into account the repeatability and intermediate precision associated with the test sample Coverage factor k = 2 was applied then
Combined Uncertainty (CRM + measurement) following Application note (Lingsinger 2005 JRC Geel)
Additional comments and suggestions
MON89788 soybean was detected but not quantified because results for this event were lt LOQ
We saw in the qPCR for MON89788 Ct-values at 37 - 39 but lt LOD (lt 002 )
Additional tests with one extract performed with Nucleospin Food Kit and with one extract performed with CTAB+Nucleospin Food Kit showed no significant differences in event detection and GTS 40-3-2 quantification (examined with digital PCR)
T19 not all detected GM were asked to be quantified
For T1 trace amounts of MON89788 were detected either in qualitative screening as well as in quantification The givencalculated GM (mm) of 002 is well below the known and validated LOQ of the method which is 01 We detected a low level of MON89788 but as this quantified at 0006 lower than the threshold for reporting we took this as a negative result
According course material of JRC GMO Quantification Proper calibration and Estimation of Measurement Uncertainty
MU is based on intermediate precision data
EURL GMFF CT 0217 report
3446
The sample was strongly inhibited MON89788 was detected under LOQ
In T1 the measured GM for MON89788 of 001 is below the determined LOQ (02) therefore no MU was reported
MON89788 was detected in traces at the LOD
MON89788 SOY result obtained below the LOQ but copy numbers of MON89788 was above LOD
T1 was inhibited A 10x dilution of the DNA was needed to get a reasonable result
DNA extraction of T1 has conducted using DNA extraction kits SureFood Prep Basic (S1052) and SureFood Prep Advanced (S1053) R-Biopharm AG Identification of Soya GM-lines was conducted using diagnostic kits SureFood GMO ID Roundup Ready Soya (S2030) and SureFood GMO ID RR2Y (S2034) Quantification kits were SureFood GMO Quant Roundup Ready Soya (S2014) SureFood GMO Quant 35S soya (S2028) and SureFood GMO Quant RR2Y Soya (S2029) R-Biopharm AG MON89788 soybean was detected in sample T1 but only in some cases - 2 PCR replicates were always positive out of 4 after several repetitions
Remark (precision) in relation to T18 and T19 MON89788 soybean was detected in the sample but not quantified because of lt LOQ
T2 Please select the option that applies and proceed with the questionnaire
Answers Ratio
T2 was not analysed go to Q1 0 0
T2 was analysed go to Q2 82 100
No Answer 0 0
T2 1 Why did you not analyse test item 2
Answers Ratio
a) The sample matrix is out of the scope of our laboratory 0 0
b) The methods are not validated in our laboratory 0 0
c) We could not obtain sufficient good quality DNA suitable for further analysis 0 0
d) Reference material primers probes or other reagents were not available (in time) 0 0
e) We tried but our analysis failed 0 0
f) Other practical constraints (instrument broken no personnel etc) 0 0
g) Other reason 0 0
No Answer 82 100
T2 2 Select the DNA extraction method used for T2
Answers Ratio
CTAB 40 488
NucleoSpin Food 11 134
NucleoSpin Plant 3 366
GeneSpin 4 488
Promega Wizard 3 366
DNeasy Plant 3 366
DNeasy Mericon Food 4 488
Biotecon Foodproof 5 61
SDS 4 488
Fast ID Genomic DNA 3 366
Maxwell 16 Plant DNA 0 0
Maxwell 16 Food Feed Seed 4 488
Generon Ion Force 1 122
Other 2 244
No Answer 0 0
T2 3 Select any additional DNA purification method used for T2
Answers Ratio
No additional clean-up 52 634
Additional ethanol precipitation 9 110
Eurofins DNAExtractor cleaning column 3 366
Promega Wizard DNA clean-up resin 6 732
Qiagen QIAQuick 5 61
Qiagen Genomic-Tip 20G 1 122
Other method (no need to specify) 8 976
No Answer 0 0
EURL GMFF CT 0217 report
3546
T2 4 Indicate the number of replicate DNA extractions used to obtain the results
Answers Ratio
1 0 0
2 56 683
3 9 110
4 10 122
5 2 244
6 4 488
gt6 1 122
No Answer 0 0
T2 5 Select the approach(es) used to show absence of PCR inhibition
Answers Ratio
None (no inhibition was suspected based on experience) 7 854
We run two dilutions and verify if the delta Cq or GM are as expected 32 390
We run three or four dilutions and verify if the delta Cq or GM are as expected 12 146
We perform a PCR inhibition run with a reference gene before analysis 3 or 4 dilutions linear regression extrapolation of Cq of undiluted extract compare this to the measured Cq
15 183
We add an internal positive control to the reactions and check the Cq 16 195
We verify that the amplification curves look normal 25 305
We check that the optical density ratios (OD260280 260230) are acceptable 36 439
Other 1 122
No Answer 0 0
T2 6 Select the option applicable to your analysis for 40-3-2 soybean in T2
Answers Ratio
Not tested 0 0
Detected but not quantified 2 244
Detected and quantified please fill in Q6a-6h 80 976
Found absent 0 0
No Answer 0 0
T2 7 Select the option applicable to your analysis for 68416 soybean in T2
Answers Ratio
Not tested 15 183
Detected but not quantified 1 122
Detected and quantified please fill in Q7a-7h 0 0
Found absent 66 805
No Answer 0 0
T2 8 Select the option applicable to your analysis for MON89788 soybean in T2
Answers Ratio
Not tested 5 61
Detected but not quantified 6 732
Detected and quantified please fill in Q8a-8h 3 366
Found absent 68 829
No Answer 0 0
T2 9 If applicable why did you not test or quantify all GM events in T2
Answers Ratio
a) Not applicable all GM events listed were tested and all those detected were quantified 61 744
b) The event-specific detection method is not validated in our laboratory 6 732
c) Reference material primers probes or other reagents were not available (in time) 10 122
d) The result obtained was below the LODLOQ 5 61
e) Practical constraints (instrument broken no personnel etc) 0 0
f) Other reason 2 244
No Answer 0 0
T2 6a 40-3-2 Which quantification approach was used
Answers Ratio
Standard curve method (2 calibration curves) 71 866
Delta Cq method (one calibration curve) 9 110
Digital PCR (no calibration curve) 2 244
EURL GMFF CT 0217 report
3646
No Answer 2 244
T2 6b Select the calibrant used for the 40-3-2 standard curve
Answers Ratio
CRM from JRC (ex-IRMM) certified in GM mass fraction (gkg) 74 902
CRM from IRMM certified in GM copy number ratio (plasmid CRM) 0 0
Non-certified RM (eg lab QC material) expressed in GM mass fraction (gkg or mm ) 1 122
Non-certified RM (eg lab QC material) expressed in GM DNA copy number ratio (eg determined by digital PCR)
4 488
No calibrant used digital PCR done 1 122
No Answer 2 244
T2 6c Select the endogenous target(s) used for relative quantification of 40-3-2 soybean in T2
Answers Ratio
Soybean lec 74 bp (40-3-2 MON89788 MON87701 44406 356043 305423 etc) 63 768
Soybean lec 81 bp (Pauli et al 2001) 5 61
Soybean lec 102 bp (A5547 FG72) 1 122
Soybean lec 105 bp (A2704) 0 0
Soybean lec 118 bp (Shindo et al 2002) 6 732
Other please specify below 2 244
No Answer 5 61
Specify the reference target(s) used (if different from above)
Lectin - 74bp
lec 74bp
Lectine
SOJA LEKTIN 80 bp Va M Pijnenburrg H Gendre F Brignon P (1999) J Agric Food Chem 475261-5266
Terry C F Harris N Event-specific detection of Roundup Ready soya using two different real time PCR detection chemistries Eur Food Res Technol (2001) 213425-431
T2 6d Clarify the unit of measurement used and any conversion between units if applicable Carefully read the choices
below and select the one used in the measurements that resulted in a final result in GM mm for 40-3-2 If unclear or a
different approach was used please clarify this in the free text box below
Answers Ratio
The RM and the calibration standards were expressed in mass (or mass ) no conversion factor was applied
61 744
The calibration standards were expressed in DNA copies calculated from the RM in gkg but a conversion factor of 1 was applied (eg 10 mm GM = 10 cpcp GM corresponding to a 10x dilution of a 100 RM)
14 171
The calibration standards were expressed in DNA copies calculated from the RM in gkg and a conversion factor gt1 was applied to take account of the zygosity and target gene copies (double conversion applied) a conversion factor (eg 2) was used to convert from mass to copies (eg 20 mm GM = 10 cpcp GM corresponding to a 5x dilution of a 100 RM) the final result was again converted to mm by using the same conversion factor (eg x 2) Please specify this factor below
0 0
The measurements were done in DNA copies (as the RM used was expressed in this unit or digital PCR was used) A conversion factor was applied onto the final GM please specify this factor below
2 244
The measurements were done in DNA copies (as the RM used was expressed in this unit or digital PCR was used) No conversion factor was applied onto the final GM
3 366
No Answer 2 244
Conversion factor used to turn results into mm if applicable andor clarification on preparation of standards
1
Conversion factor of 1
T2 6e What was the amount of sample DNA (ng) used per PCR for 40-3-2 Choose the concentration that is closest to what
you used If applicable select multiple concentrations (eg if several dilutions were tested) but only those of which the
result was used to determine the reported GM
Answers Ratio
DNA concentration not determined 12 146
250 ng 5 61
200 ng 30 366
150 ng 7 854
100 ng 21 256
EURL GMFF CT 0217 report
3746
50 ng 17 207
25 ng 7 854
15 ng 2 244
lt10 ng 0 0
No Answer 2 244
T2 6f What was the LOQ (in mm ) for the 40-3-2 quantification
Answers
001 5 002 6 003 1 004 7 005 7 006 2 007 1 008 2 009 8 01 39 026 1 028 1
T2 6g How was the LOQ for 40-3-2 determined (if applicable)
Answers Ratio
Determined from the qPCR analysis for the current sample 21 256
Determined during the in-house validation of the method 43 524
Taken from the EURL GMFF validation report 19 232
By another approach please explain below 3 366
No Answer 2 244
Explanation on alternative LOQ determination
Determined from the digital PCR analysis for the current sample
Information about LOQ introduced by the manufacturer (R-Biopharm) of diagnostic kit
T2 6h How did you estimate the measurement uncertainty on the result reported for 40-3-2
Answers Ratio
Uncertainty budget (ISO GUM) 2 244
Uncertainty of the method (in-house validation) 30 366
Known uncertainty of the standard method 8 976
Measurement of replicates (precision) 32 390
From interlaboratory comparison data 4 488
Estimation based on judgement 2 244
In another way please specify below 7 854
No Answer 2 244
Explanation on alternative determination of measurement uncertainty
U=Sa radic1p+1n+(c0-c)2Sxx Uncertainty=Coverage Factor (P=95 anf f=n-1) Standard Deviation Square-root (Number of Measurements)
MU was estimated according to the Guidance Document on MU for GMO Testing Laboratories JRC ISSN 1018-5593
We used a calculated k-factor based on the number of repeats
Estimation based on within laboratory reproducibility
95 confidence interval of the results for the current sample
30 of the quantification result
The u was obtain through the estimation of the sd taking into account the repeatability and intermediate precision associated with the test sample Coverage factor k = 2 was applied then
Combined Uncertainty (CRM + measurement) following Application note (Lingsinger 2005 JRC Geel)
Additional comments and suggestions
Event 68416 was not tested due to non-availability of Positive control and reference material
DNA extraction of T2 has conducted using DNA extraction kits SureFood Prep Basic etc (see T1)
The NucleoSpin Food + NucleoSpin gDNA Clean-up was also used for DNA extraction from T1 and T2 samples The results for 40-3-2 were 25 - 30 lower than CTAB results T1 050 +- 018 (ww) T2 058 +- 020 (ww)
AOCS 0906-B as calibrant for MON89788 in T2 also
EURL GMFF CT 0217 report
3846
Annex 3 Qualitative performance of the participants
Table A31 Performance of the participants for the qualitative identification of GM events in CT-0217
The correct answer (yes) is that the GM event has been detected in the test item
Lab 40-3-2 detected in T1 40-3-2 detected in T2 Lab 40-3-2 detected in T1 40-3-2 detected in T2
L01 yes yes L45 yes yes
L02 yes yes L46 yes yes
L03 yes yes L47 yes yes
L04 yes yes L48 yes yes
L05 yes yes L49 yes yes
L06 yes yes L50 yes yes
L07 yes yes L51 yes yes
L08 yes yes L52 yes yes
L09 yes yes L53 yes yes
L10 yes Yes L54 yes yes
L11 yes yes L55 yes yes
L12 yes yes L56 yes yes
L13 yes yes L57 yes yes
L14 yes yes L58 yes yes
L15 yes yes L59 yes yes
L16 yes yes L60 yes yes
L17 yes yes L61 yes yes
L18 yes yes L62 yes yes
L19 yes yes L63 yes yes
L20 yes yes L66 yes yes
L22 yes yes L68 yes yes
L23 yes yes L69 yes yes
L24 yes yes L70 yes yes
L25 yes yes L71 yes yes
L26 yes yes L72 yes yes
L27 yes yes L73 T1 was not analysed yes
L29 yes yes L74 yes yes
L30 yes yes L75 yes yes
L31 yes yes L76 yes yes
L32 yes yes L77 yes yes
L33 yes yes L78 yes yes
L34 yes yes L79 yes yes
L35 yes yes L80 yes yes
L36 yes yes L81 yes yes
L37 yes yes L82 yes yes
L38 yes yes L83 yes yes
L39 yes yes L84 yes yes
L40 yes yes L85 yes yes
L41 yes yes L86 yes yes
L42 yes yes L87 yes yes
L43 T1 was not analysed yes L88 yes yes
L44 yes yes L89 yes yes
Although the questionnaire was not returned by the participant the presence of the event was inferred from the quantitative result reported
L10 did not fill in the questionnaire but reported a larger than 01 result for T1 and T2
EURL GMFF CT 0217 report
3946
Annex 4 Participants quantitative performance
The z and ζ scores of all laboratories are reported in Tables A41 and A42 and in Figures
A41 and A42 for 40-3-2 soybean in T1 and T2 respectively For consistency the
reported results are shown with two decimals the performance scores with one decimal
The z scores are displayed in green (satisfactory) orange (questionable) or red cells
(unsatisfactory)
Table A41 Quantitative results (in mm ) and performance scores of participants of CT-0217 for 40-3-2 soybean in chicken feed (T1)
Lab1 Category xi U k2 Log(xi) u(xi) u(xi-log) z score ζ score3
L01 NRL120 064 008 200 -019 004 003 -10 -28
L02 NRL882 057 002 200 -024 001 001 -15 -67
L03 Non-NRL 073 1520 200 -014 760 452 -04 00
L04 Non-NRL 075
-012 000 000 -03 -13
L05 NRL120 073 007 257 -014 003 002 -04 -15
L06 NRL882 075 021 200 -012 011 006 -03 -04
L07 NRL882 065 013 200 -019 007 004 -09 -19
L08 NRL120 062 023 200 -021 012 008 -11 -13
L09 NRL882 081 027 200 -009 014 007 01 01
L12 Non-NRL 100 051 200 000 026 011 10 09
L13 NRL882 094 019 173 -003 011 005 07 13
L14 Non-NRL 063
-020 000 000 -10 -50
L15 NRL882 110 011 200 004 005 002 14 46
L16 Non-NRL 117
007 000 000 17 80
L17 NRL882 072 010 200 -014 005 003 -05 -12
L18 Non-NRL 040
-040 000 000 -30 -145
L19 Non-NRL 115 063 173 006 036 014 16 11
L20 NRL120 108 032 200 003 016 006 13 19
L22 Non-NRL 051 030 223 -029 013 011 -20 -17
L23 Non-NRL 047 009 200 -033 005 004 -23 -50
L24 NRL882 072 019 200 -014 010 006 -05 -07
L25 Non-NRL 120
008 000 000 18 85
L26 NRL882 023 009 200 -064 005 008 -54 -62
L27 Non-NRL 098 015 200 -001 008 003 09 23
L29 NRL120 090 008 173 -005 005 002 05 17
L30 NRL882 045 013 200 -035 007 006 -25 -38
L31 NRL882 080 038 223 -010 017 009 00 00
L32 Non-NRL 076 039 200 -012 020 011 -02 -02
L33 NRL-120 057 014 200 -024 007 005 -15 -26
L34 NRL120 061 016 200 -021 008 006 -12 -19
L35 NRL882 097 027 200 -001 014 006 08 13
L36 Non-NRL 090 030 200 -005 015 007 05 07
L37 NRL120 065 026 200 -019 013 009 -09 -10
L38 NRL120 093 014 237 -003 006 003 07 19
L39 Non-NRL 112
005 000 000 15 71
L40 NRL882 053 008 200 -028 004 003 -18 -46
L41 NRL120 080 003 200 -010 002 001 00 00
L42 NRL882 104 031 200 002 016 006 11 17
L44 NRL120 084 007 257 -008 003 001 02 09
L45 NRL882 065 018 200 -019 009 006 -09 -14
L46 NRL882 081 018 200 -009 009 005 01 01
L47 NRL882 141 027 173 015 016 005 25 47
L48 NRL882 059 028 200 -023 014 010 -13 -13
L49 Non-NRL 089 031 200 -005 016 008 05 06
L50 NRL120 073 005 200 -014 003 001 -04 -15
L51 Non-NRL 077 049 200 -011 025 014 -02 -01
L52 Non-NRL 091 012 200 -004 006 003 06 16
L53 Non-NRL 043 081 200 -037 041 041 -27 -07
L54 NRL882 074 035 200 -013 018 010 -03 -03
L55 Non-NRL 076 019 173 -012 011 006 -02 -03
EURL GMFF CT 0217 report
4046
Lab1 Category xi U k2 Log(xi) u(xi) u(xi-log) z score ζ score3
L56 NRL882 115 022 173 006 013 005 16 30
L57 NRL120 075 020 200 -012 010 006 -03 -04
L58 NRL120 089 016 200 -005 008 004 05 11
L59 NRL882 137 038 200 014 019 006 23 37
L60 NRL882 068 017 200 -017 009 005 -07 -12
L61 Non-NRL 065
-019 000 000 -09 -43
L62 NRL120 130 037 237 011 016 005 21 38
L63 Non-NRL 088 006 200 -006 003 001 04 16
L64 NRL882 081 024 173 -009 014 007 01 01
L65 Non-NRL 116 065 200 006 033 012 16 13
L66 NRL882 048 024 200 -032 012 011 -22 -20
L68 NRL882 139 015 200 014 008 002 24 77
L69 Non-NRL 010 004 200 -101 002 008 -91 -105
L70 Non-NRL 057 010 200 -024 005 004 -15 -34
L72 NRL882 108 032 200 003 016 007 13 19
L74 NRL882 075 019 200 -012 010 005 -03 -05
L75 Non-NRL 862
094 000 000 103 499
L76 NRL882 099 038 200 000 019 008 09 11
L77 NRL120 075 009 226 -012 004 002 -03 -09
L78 NRL120 059 006 300 -023 002 001 -13 -52
L79 Non-NRL 046
-034 000 000 -24 -116
L80 NRL120 071 024 200 -015 012 007 -05 -07
L81 NRL882 071 028 200 -015 014 009 -05 -06
L82 NRL120 092 015 200 -004 008 004 06 15
L83 NRL120 114 013 173 006 008 003 15 44
L84 Non-NRL 071 030 200 -015 015 009 -05 -05
L85 NRL882 074 031 201 -013 015 009 -03 -04
L86 Non-NRL 066 022 200 -018 011 007 -08 -11
L87 NRL882 085 015 200 -007 008 004 03 06
L88 NRL-120 lt0044
L89 NRL882 079 022 200 -010 011 006 -01 -01
1 One NRL882 (L73) did not report a quantitative result for 40-3-2 in T1 because T1 is out of scope of the laboratory 2 If the k factor was not reported by the laboratory a value of 173 was assigned (radic3) for calculation of the ζ score 3 The ζ scores are provided for information only with indicative of a questionable score and of an unsatisfactory score 4 The less than value reported by the laboratory is considered unsatisfactory
EURL GMFF CT 0217 report
4146
Table A42 Quantitative results (in mm ) and performance scores of participants of CT-0217 for
40-3-2 soybean in soybean flour (T2)
Lab1 Category xi U k2 Log(xi) u(xi) u(xi-log) z score ζ score3
L01 NRL120 071 007 200 -015 004 002 -03 -12
L02 NRL882 081 003 200 -009 002 001 03 19
L03 Non-NRL 088 1520 200 -006 760 375 06 00
L04 Non-NRL 089
-005 000 000 07 56
L05 NRL120 075 005 257 -012 002 001 -01 -04
L06 NRL882 080 022 200 -010 011 006 02 04
L07 NRL882 076 009 200 -012 005 003 00 00
L08 NRL120 042 016 200 -038 008 008 -26 -31
L09 NRL882 081 027 200 -009 014 007 03 04
L12 Non-NRL 076 039 200 -012 020 011 00 00
L13 NRL882 069 011 173 -016 006 004 -04 -10
L14 Non-NRL 075
-012 000 000 -01 -05
L15 NRL882 084 011 200 -008 005 003 04 14
L16 Non-NRL 088
-006 000 000 06 52
L17 NRL882 075 010 200 -012 005 003 -01 -02
L18 Non-NRL 034
-047 000 000 -35 -287
L19 Non-NRL 089 016 173 -005 009 005 07 15
L20 NRL120 104 031 200 002 016 006 14 21
L22 Non-NRL 081 026 223 -009 012 006 03 04
L23 Non-NRL 064 012 200 -019 006 004 -08 -18
L24 NRL882 079 021 200 -010 011 006 02 03
L25 Non-NRL 085
-007 000 000 05 39
L26 NRL882 117 039 200 007 020 007 19 25
L27 Non-NRL 118 018 200 007 009 003 19 54
L29 NRL120 078 004 173 -011 002 001 01 06
L30 NRL882 069 020 200 -016 010 006 -04 -07
L31 NRL882 096 077 233 -002 033 015 10 07
L32 Non-NRL 090 039 200 -005 020 009 07 08
L33 NRL-120 078 004 200 -011 002 001 01 06
L34 NRL120 073 014 200 -014 007 004 -02 -04
L35 NRL882 095 027 200 -002 014 006 10 15
L36 Non-NRL 077 003 200 -011 002 001 01 03
L37 NRL120 075 010 200 -012 005 003 -01 -02
L38 NRL120 119 008 237 008 003 001 19 112
L39 Non-NRL 062
-021 000 000 -09 -73
L40 NRL882 045 008 200 -035 004 004 -23 -56
L41 NRL120 087 002 200 -006 001 000 06 44
L42 NRL882 068 020 200 -017 010 006 -05 -08
L43 Non-NRL 065
-019 000 000 -07 -56
L44 NRL120 074 006 220 -013 003 002 -01 -06
L45 NRL882 073 021 200 -014 011 006 -02 -03
L46 NRL882 081 018 200 -009 009 005 03 05
L47 NRL882 062 012 173 -021 007 005 -09 -18
L48 NRL882 074 035 173 -013 020 012 -01 -01
L49 Non-NRL 073 026 200 -014 013 008 -02 -02
L50 NRL120 081 007 200 -009 004 002 03 12
L51 Non-NRL 068 044 200 -017 022 014 -05 -03
L52 Non-NRL 073 011 200 -014 006 003 -02 -05
L53 Non-NRL 058 081 200 -024 041 030 -12 -04
L54 NRL882 073 026 200 -014 013 008 -02 -02
L55 Non-NRL 072 018 173 -014 010 006 -02 -04
L56 NRL882 066 018 173 -018 010 007 -06 -09
L57 NRL120 060 020 200 -022 010 007 -10 -14
L58 NRL120 067 011 200 -017 006 004 -06 -15
L59 NRL882 076 022 200 -012 011 006 00 00
L60 NRL882 080 020 200 -010 010 005 02 04
L61 Non-NRL 050
-030 000 000 -18 -150
EURL GMFF CT 0217 report
4246
Lab1 Category xi U k2 Log(xi) u(xi) u(xi-log) z score ζ score3
L62 NRL120 075 012 245 -012 005 003 -01 -02
L63 Non-NRL 075 004 200 -012 002 001 -01 -04
L64 NRL882 078 023 173 -011 013 007 01 01
L65 Non-NRL 051 023 200 -029 012 010 -17 -18
L66 NRL882 073 024 200 -014 012 007 -02 -02
L68 NRL882 091 011 200 -004 006 003 08 27
L69 Non-NRL 092 035 200 -004 018 008 08 10
L70 Non-NRL 050 009 200 -030 005 004 -18 -45
L72 NRL882 092 028 200 -004 014 007 08 12
L73 NRL882 092 030 200 -004 015 007 08 11
L74 NRL882 064 013 200 -019 007 004 -08 -16
L75 Non-NRL 644
081 000 000 93 760
L76 NRL882 056 099 200 -025 050 038 -13 -03
L77 NRL120 054 006 226 -027 003 002 -15 -61
L78 NRL120 065 001 300 -019 000 000 -07 -55
L79 Non-NRL 071
-015 000 000 -03 -25
L80 NRL120 095 030 200 -002 015 007 10 14
L81 NRL882 077 032 200 -011 016 009 01 01
L82 NRL120 102 032 200 001 016 007 13 18
L83 NRL120 084 005 173 -008 003 001 04 22
L84 Non-NRL 045 030 200 -035 015 014 -23 -16
L85 NRL882 082 015 212 -009 007 004 03 08
L86 Non-NRL 073 024 200 -014 012 007 -02 -02
L87 NRL882 077 012 200 -011 006 003 01 01
L88 NRL120 065 020 200 -019 010 007 -07 -10
L89 NRL882 077 021 200 -011 011 006 01 01
1 All participating NRL882 reported a quantitative result for 40-3-2 soybean in T2 2 If the k factor was not reported by the laboratory a value of 173 was assigned (radic3) for calculation of the ζ score 3 The ζ scores are provided for information only with indicative of a questionable score and of an unsatisfactory score
EURL GMFF CT 0217 report 4346
Figure A41 Laboratory results for soybean event 40-3-2 in test item 1 and kernel density distribution (insert)
The horizontal full line shows the assigned value (on the log scale) the dashed black lines represent the expanded measurement uncertainty of the assigned value and the wider interval (dashed red lines) represents the limits of satisfaction (|z|le 20) Laboratory results are shown with the expanded measurement uncertainties (when reported) the expanded measurement uncertainty of L03 is out of scale
EURL GMFF CT 0217 report 4446
Figure A42 Laboratory results for soybean event 40-3-2 in test item 2 and kernel density distribution (insert)
The horizontal full line shows the assigned value (on the log scale) the dashed black lines represent the expanded measurement uncertainty of the assigned value and the wider interval (dashed red lines) represents the limits of satisfaction (|z|le 20) Laboratory results are shown with the expanded measurement uncertainties (when reported) the expanded measurement uncertainty of L03 is out of scale
Europe Direct is a service to help you find answers
to your questions about the European Union
Freephone number ()
00 800 6 7 8 9 10 11 () The information given is free as are most calls (though some operators phone boxes or hotels may
charge you)
More information on the European Union is available on the internet (httpeuropaeu)
HOW TO OBTAIN EU PUBLICATIONS
Free publications
bull one copy
via EU Bookshop (httpbookshopeuropaeu)
bull more than one copy or postersmaps
from the European Unionrsquos representations (httpeceuropaeurepresent_enhtm) from the delegations in non-EU countries (httpeeaseuropaeudelegationsindex_enhtm) by contacting the Europe Direct service (httpeuropaeueuropedirectindex_enhtm) or calling 00 800 6 7 8 9 10 11 (freephone number from anywhere in the EU) () () The information given is free as are most calls (though some operators phone boxes or hotels may charge you)
Priced publications
bull via EU Bookshop (httpbookshopeuropaeu)
KJ-N
A-2
8873-E
N-N
doi 102760461562
ISBN 978-92-79-76303-8
EURL GMFF CT 0217 report
2646
References
(including those referred to in the Annexes)
1 Regulation (EC) No 18292003 of the European Parliament and of the Council of 22
September 2003 on genetically modified food and feed Off J Eur Union L 268 1-23
2 Regulation (EC) No 8822004 of the European Parliament and of the Council of 29
April 2004 on official controls performed to ensure the verification of compliance with
feed and food law animal health and animal welfare rules Off J Eur Union L 191 1-
52
3 Commission Implementing Regulation (EU) No 1202014 of 7 February 2014
amending Regulation (EC) No 19812006 on detailed rules for the implementation of
Article 32 of Regulation (EC) No 18292003 of the European Parliament and the
Council as regards the Community reference laboratory for genetically modified
organisms Off J Eur Union L 39 46-52
4 Commission Regulation (EU) No 6192011 of 24 June 2011 laying down the methods
of sampling and analysis for the official control of feed as regards presence of
genetically modified material for which an authorisation procedure is pending or the
authorisation of which has expired Off J Eur Union L 166 9-15
5 ISOIEC 170432010 Conformity assessment ndash General requirements for proficiency
testing International Organization for Standardization Geneva Switzerland
6 Dimitrievska B Kortekaas AM Seghers J Leys H Corbisier Ph Trapmann S
(2017) The certification of different mass fractions of MON-Oslash4Oslash32-6 in soya bean
powder Certified Reference Materials ERMreg-BF410ap ERMreg-BF410bp ERMreg-
BF410cp ERMreg-BF410dp and ERMreg-BF410ep EC certification report EUR 28665 EN
ISBN 978-92-79-70107-8
7 Rosa SF Gatto F Angers-Loustau A Petrillo M Kreysa J Querci M (2016)
Development and applicability of a ready-to-use PCR system for GMO screening Food
Chemistry 201 110ndash119
8 Querci M Foti N Bogni B Kluga L Broll H amp Van den Eede G (2009) Real-
time PCR-based ready-to-use multi-target analytical system for GMO detection Food
Anal Methods 2 325-336
9 ISO 170342016 General requirements for the competence of reference material
producers International Organization for Standardization Geneva Switzerland
10 Technical guidance document from the European Union Reference Laboratory for
Genetically Modified Food and Feed on the implementation of Commission Regulation
(EU) No 6192011 (httpgmo-crljrceceuropaeuguidancedocshtm)
11 Corbisier P Barbante A Berben G Broothaerts W De Loose M Emons H
Georgieva Tz Lievens A Mazzara M Papazova N Perri E Sowa S Stebih D Terzi
V Trapmann S (2017) Recommendation for the unit of measurement and the
measuring system to report traceable and comparable results expressing GM content
in accordance with EU legislation JRC Technical report (httpgmo-
crljrceceuropaeuENGLdocsWG-UoM-Final-Reportpdf)
12 Analytical Methods Committee (1989) Robust statistics ndash How not to reject outliers
Part 1 Basic Concepts Analyst 114 1359-1364
13 Analytical Methods Committee (2001) Robust statistics a method for coping with
outliers AMC Technical Brief No 6 April 2001
14 Thompson M Ellison SLR Owen L Mathieson K Powell J Key P Wood R
Damant AP (2006) Scoring in Genetically Modified Organism Proficiency Tests
Based on Log-Transformed Results J AOAC Int 89 232-239
EURL GMFF CT 0217 report
2746
15 Analytical Methods Committee (2004) GMO Proficiency Testing Interpreting z scores
derived from log-transformed data RSC AMC Technical Brief No 18 December
2004
16 ISO 135282015 Statistical methods for use in proficiency testing by interlaboratory
comparison International Organization for Standardization Geneva Switzerland
17 Ellison SLR Williams A (Eds) EurachemCITAC guide Quantifying Uncertainty in
Analytical Measurement Third edition (2012) ISBN 978-0-948926-30-3 Available
from wwweurachemorg
18 ISOIEC Guide 98-32008 (JCGMWG1100) Uncertainty of measurement - Part 3
Guide to the expression of uncertainty in measurement
19 Linsinger T (2010) Comparison of a measurement result with the certified value
Application Note 1 Luxemburg Office for Official Publications of the European
Communities (httpscrmjrceceuropaeu)
20 Trapmann S Burns M Broll H Macarthur R Wood R Zel J (2009) Guidance
Document on Measurement Uncertainty for GMO Testing Laboratories Luxembourg
Office for Official Publications of the European Communities EUR 22756 EN2-2009
21 Corbisier P Zobell O Trapmann S Auclair G and Emons H (2014) Training
Manual on GMO Quantification Proper Calibration and Estimation of Measurement
Uncertainty Luxembourg Publications Office of the European Union
(doi10278710085)
22 Thompson M Wood R (1993) The international harmonized protocol for the
proficiency testing of (chemical) analytical laboratories J AOAC Int 76 926-940
23 Powell J Owen L (2002) Reliability of Food Measurements The Application of
Proficiency Testing to GMO Analysis Accred Qual Ass 7 392-402
24 Linsinger TPJ van der Veen AMH Gawlik BM Pauwels J Lamberty A
(2004) Planning and combining of isochronous stability studies of CRMs Accred Qual
Assur 9 464-472
EURL GMFF CT 0217 report
2846
Annexes
Annex 1 Homogeneity and stability of test items
A11 Homogeneity of test items
The homogeneity of T2 was confirmed during the certification of this CRM
The assessment of the homogeneity(16) of T1 was performed after the test item had been
packed in its final form and before distribution to participants using the following
acceptance criterion
pts s 30 (A11)
Where ss is the between-test item standard deviation as determined by a 1-way random
effects ANOVA(22) and σpt is the standard deviation for comparative testing The value of
σpt the target standard deviation for proficiency assessment was based upon the
experience acquired in previous PTs and set to 010 on the log domain(23)
If the criterion according to A11 is met (ie ss le 0030) the between-test item standard
deviation contributes no more than about 10 to the standard deviation for comparative
testing
The repeatability of the test method is the square root of the mean sum of squares within-
test items MSwithin The relative between-test item standard deviation ssrel is given by
100
y
n
MSMS
s
withinbetween
rels (A12)
where MSbetween is the mean sum of squares between test items
MSwithin is the mean sum of squares within test items
n is the number of replicates for each sample
y is the mean of the homogeneity data
If MSwithin gt MSbetween then
100
1
24
y
nNn
ityrepeatabil
us bbrels (A13)
where ubb is the maximum uncertainty contribution that can be obtained by the hidden
heterogeneity of the material
Seven bottles (N = 7) were randomly selected and analysed in five replicates (n = 5) The
between-test item standard deviation was 0018 mm The criterion described in
formula (A11) was fulfilled (0018 lt 0030) indicating that T1 was adequately
homogeneous
EURL GMFF CT 0217 report
2946
A12 Stability of test items
For T1 an isochronous short-term stability study(24) involving two test samples with three
replicates each (N = 2 n = 3) was conducted over two and four weeks at +4 degC +18 degC
and +60 degC The 40-3-2 soybean mass fraction was measured by qPCR The
measurements were performed under intermediate precision conditions with respect to the
PCR plates
The results did not reveal any influence of time or storage at +4 degC or +18 degC on the
stability of the test item (compared to storage at -70 degC) with regard to the soybean event
40-3-2 mass fraction Even at 60 degC no significant trend was measured although the
extracted DNA was more fragmented as seen by agarose gel electrophoresis
The test items were shipped at ambient temperature
The stability of T1 during the period covered by the PT (approximately 5 months between
production of the test item and the deadline for results reporting) was tested by analysing
simultaneously on one PCR plate two units (N = 2 n = 3) stored either at the normal
storage temperature (4 degC) or at a reference temperature (-70 degC) The evaluation was
based on the results ratio between samples stored at 4 degC and -70 degC The data were
evaluated against storage time and regression lines were calculated The slopes of the
regression lines were tested for statistical significance (lossincrease due to storage) No
significant trend was detected at a 95 confidence level The T1 material can therefore
be stored at 4 degC and was stable during the period covered by this CT
The stability of T2 was ensured as part of the post-certification stability monitoring of
ERM-BF410p Measurements were performed simultaneously on one PCR plate as
described for T1 on units stored at the normal storage temperature (4 degC) and at a
reference temperature (-70 degC) No significant trend was detected at a 95 confidence
level The T2 material can therefore be stored at 4 degC and was stable during the period
covered by this CT
EURL GMFF CT 0217 report
3046
Annex 2 Questionnaire data
The results received from 82 laboratories were exported from the EUSurvey
Questionnaire on CT 0217 analysis and are tabulated below Multiple answers were
allowed for all questions except for the questions on the calibrant used The results of the
open questions were manually analysed and reported Answers to the questions on GM
events that were not to be quantified in the test items are not shown
Select the group to which your organisation belongs Note 882 and 120 refer to EU Regulations 8822004 and 1202014
resp select NRL120 if your organisation is ONLY listed under Regulation 1202014 select non-NRL if your organisation is
not an NRL under either EU Regulation
Answers Ratio
NRL882 33 402
NRL120 20 244
Non-NRL 29 354
No Answer 0 0
T1 Please select the option that applies and proceed with the questionnaire
Answers Ratio
T1 was not analysed go to Q1 2 244
T1 was analysed go to Q2 80 976
No Answer 0 0
T1 1 Why did you not analyse test item 1
Answers Ratio
a) The sample matrix is out of the scope of our laboratory 1 122
b) The methods are not validated in our laboratory 0 0
c) We could not obtain sufficient good quality DNA suitable for further analysis 0 0
d) Reference material primers probes or other reagents were not available (in time) 0 0
e) We tried but our analysis failed 0 0
f) Other practical constraints (instrument broken no personnel etc) 1 122
g) Other reason 0 0
No Answer 80 976
T1 2 Select the DNA extraction method used for T1
Answers Ratio
CTAB 41 50
NucleoSpin Food 10 122
NucleoSpin Plant 3 366
GeneSpin 4 488
Promega Wizard 3 366
DNeasy Plant 3 366
DNeasy Mericon Food 5 61
Biotecon Foodproof 5 61
SDS 4 488
Fast ID Genomic DNA 2 244
Maxwell 16 Plant DNA 0 0
Maxwell 16 Food Feed Seed 5 61
Generon Ion Force 1 122
Other 2 244
No Answer 2 244
T1 3 Select any additional DNA purification method used for T1
Answers Ratio
No additional clean-up 51 622
Additional ethanol precipitation 9 110
Eurofins DNAExtractor cleaning column 3 366
Promega Wizard DNA clean-up resin 6 732
Qiagen QIAQuick 4 488
Qiagen Genomic-Tip 20G 1 122
Other method (no need to specify) 7 854
No Answer 2 244
EURL GMFF CT 0217 report
3146
T1 4 Indicate the number of replicate DNA extractions used to obtain the results
Answers Ratio
1 0 0
2 52 634
3 9 110
4 10 122
5 2 244
6 6 732
gt6 1 122
No Answer 2 244
T1 5 Select the approach(es) used to show absence of PCR inhibition
Answers Ratio None (no inhibition was suspected based on experience) 6 732
We check that the optical density ratios (OD260280 260230) are acceptable 40 488
We verify that the amplification curves look normal 24 293
We run two dilutions and verify if the delta Cq or GM are as expected 31 378
We run three or four dilutions and verify if the delta Cq or GM are as expected 13 158
We perform a PCR inhibition run with a reference gene before analysis 3 or 4 dilutions linear regression extrapolation of Cq for undiluted extract compare this to the measured Cq
16 195
We add an internal positive control to the reactions and check the Cq 15 183
Other 1 122
No Answer 2 244
T1 6 Select the option applicable to your analysis for 40-3-2 soybean in T1
Answers Ratio
Not tested 0 0
Detected but not quantified 3 366
Detected and quantified please fill in Q6a-6h 77 939
Found absent 0 0
No Answer 2 244
T1 7 Select the option applicable to your analysis for 68416 soybean in T1
Answers Ratio
Not tested 14 171
Detected but not quantified 2 244
Detected and quantified please fill in Q7a-7h 0 0
Found absent 64 781
No Answer 2 244
T1 8 Select the option applicable to your analysis for MON89788 soybean in T1
Answers Ratio
Not tested 6 732
Detected but not quantified 33 402
Detected and quantified please fill in Q8a-8h 15 183
Found absent 26 317
No Answer 2 244
T1 9 If applicable why did you not test or quantify all GM events in T1
Answers Ratio
a) Not applicable all GM events listed were tested and all those detected were quantified 45 549
b) The event-specific detection method is not validated in our laboratory 7 854
c) Reference material primers probes or other reagents were not available (in time) 9 110
d) The result obtained was below the LODLOQ 18 220
e) Practical constraints (instrument broken no personnel etc) 0 0
f) Other reason 9 110
No Answer 2 244
T1 6a Soybean 40-3-2 Which quantification approach was used
Answers Ratio
Standard curve method (2 calibration curves) 68 829
Delta Cq method (one calibration curve) 9 110
Digital PCR (no calibration curve) 2 244
EURL GMFF CT 0217 report
3246
No Answer 5 61
T1 6b Select the calibrant used for the 40-3-2 standard curve
Answers Ratio
CRM from JRC (ex-IRMM) certified in GM mass fraction (gkg) 71 866
Non-certified RM (eg lab QC material) expressed in GM mass fraction (gkg or mm ) 1 122
Non-certified RM (eg lab QC material) expressed in GM DNA copy number ratio (eg determined by digital PCR)
4 488
No calibrant used digital PCR done 1 122
No Answer 5 61
T1 6c Select the endogenous target(s) used for relative quantification of 40-3-2 soybean in T1
Answers Ratio
Soybean lec 74 bp (40-3-2 MON89788 MON87701 44406 356043 305423 etc) 65 793
Soybean lec 81 bp (Pauli et al 2001) 5 61
Soybean lec 102 bp (A5547 FG72) 1 122
Soybean lec 105 bp (A2704) 0 0
Soybean lec 118 bp (Shindo et al 2002) 5 61
Other please specify below 1 122
No Answer 5 61
Specify the reference target(s) used (if different from above)
SOJA LEKTIN 80 bp - Va M Pijnenburrg H Gendre F Brignon P (1999) J Agric Food Chem 475261-5266
T1 6d Clarify the unit of measurement used and any conversion between units if applicable Carefully read the choices
below and select the one used in the measurements that resulted in a final result in GM mm for 40-3-2 If unclear or a
different approach was used please clarify this in the free text box below
Answers Ratio
The RM and the calibration standards were expressed in mass (or mass ) no conversion factor was applied
59 720
The calibration standards were expressed in DNA copies calculated from the RM in gkg but a conversion factor of 1 was applied (eg 10 mm GM = 10 cpcp GM corresponding to a 10x dilution of a 100 RM)
13 159
The calibration standards were expressed in DNA copies calculated from the RM in gkg and a conversion factor gt1 was applied to take account of the zygosity and target gene copies (double conversion applied) a conversion factor (eg 2) was used to convert from mass to copies (eg 20 mm GM = 10 cpcp GM corresponding to a 5x dilution of a 100 RM) the final result was again converted to mm by using the same conversion factor (eg x 2) Please specify this factor below
0 0
The measurements were done in DNA copies (as the RM used was expressed in this unit or digital PCR was used) A conversion factor was applied onto the final GM please specify this factor below
2 244
The measurements were done in DNA copies (as the RM used was expressed in this unit or digital PCR was used) No conversion factor was applied onto the final GM
3 366
No Answer 5 61
Conversion factor used to turn results into mm if applicable andor clarification on preparation of standards
1
Conversion factor of 1
T1 6e What was the amount of sample DNA (ng) used per PCR for 40-3-2 Choose the concentration that is closest to what
you used If applicable select multiple concentrations (eg if several dilutions were tested) but only those of which the
result was used to determine the reported GM
Answers Ratio
DNA concentration not determined 12 146
250 ng 5 61
200 ng 30 366
150 ng 9 110
100 ng 18 220
50 ng 14 171
25 ng 6 732
15 ng 0 0
lt10 ng 0 0
No Answer 5 61
EURL GMFF CT 0217 report
3346
T1 6f What was the LOQ (in mm ) for the 40-3-2 quantification
Answers
001 3 002 4 003 1 004 6 005 7 006 2 008 4 009 7 01 37 019 1 02 1 03 1 035 1 04 1 13 1
T1 6g How was the LOQ for 40-3-2 determined (if applicable)
Answers Ratio
Determined from the qPCR analysis for the current sample 20 244
Determined during the in-house validation of the method 42 512
Taken from the EURL GMFF validation report 17 207
By another approach please explain below 2 244
No Answer 5 61
Explanation on alternative LOQ determination
Determined from the digital PCR analysis for the current sample Information about LOQ introduced by the manufacturer (R-Biopharm) of diagnostic kit The u was obtain through the estimation of the sd taking into account the repeatability and intermediate precision associated with the test sample Coverage factor k = 2 was applied then
T1 6h How did you estimate the measurement uncertainty on the result reported for 40-3-2 soybean
Answers Ratio
Uncertainty budget (ISO GUM) 2 244
Uncertainty of the method (in-house validation) 27 329
Known uncertainty of the standard method 9 110
Measurement of replicates (precision) 32 390
From interlaboratory comparison data 4 488
Estimation based on judgement 2 244
In another way please specify below 6 732
No Answer 5 61
Explanation on alternative determination of measurement uncertainty
U=Sa radic1p+1n+(c0-c)2Sxx
Uncertainty=Coverage Factor (P=95 anf f=n-1) Standard Deviation Square-root (Number of Measurements)
MU was estimated according to the Guidance Document on MU for GMO Testing Laboratories JRC ISSN 1018-5593
we used a calculated k-factor based on the number of repeats
Estimation based on within laboratory reproducibility
95 confidence interval of the results for the current sample
The u was obtain through the estimation of the sd taking into account the repeatability and intermediate precision associated with the test sample Coverage factor k = 2 was applied then
Combined Uncertainty (CRM + measurement) following Application note (Lingsinger 2005 JRC Geel)
Additional comments and suggestions
MON89788 soybean was detected but not quantified because results for this event were lt LOQ
We saw in the qPCR for MON89788 Ct-values at 37 - 39 but lt LOD (lt 002 )
Additional tests with one extract performed with Nucleospin Food Kit and with one extract performed with CTAB+Nucleospin Food Kit showed no significant differences in event detection and GTS 40-3-2 quantification (examined with digital PCR)
T19 not all detected GM were asked to be quantified
For T1 trace amounts of MON89788 were detected either in qualitative screening as well as in quantification The givencalculated GM (mm) of 002 is well below the known and validated LOQ of the method which is 01 We detected a low level of MON89788 but as this quantified at 0006 lower than the threshold for reporting we took this as a negative result
According course material of JRC GMO Quantification Proper calibration and Estimation of Measurement Uncertainty
MU is based on intermediate precision data
EURL GMFF CT 0217 report
3446
The sample was strongly inhibited MON89788 was detected under LOQ
In T1 the measured GM for MON89788 of 001 is below the determined LOQ (02) therefore no MU was reported
MON89788 was detected in traces at the LOD
MON89788 SOY result obtained below the LOQ but copy numbers of MON89788 was above LOD
T1 was inhibited A 10x dilution of the DNA was needed to get a reasonable result
DNA extraction of T1 has conducted using DNA extraction kits SureFood Prep Basic (S1052) and SureFood Prep Advanced (S1053) R-Biopharm AG Identification of Soya GM-lines was conducted using diagnostic kits SureFood GMO ID Roundup Ready Soya (S2030) and SureFood GMO ID RR2Y (S2034) Quantification kits were SureFood GMO Quant Roundup Ready Soya (S2014) SureFood GMO Quant 35S soya (S2028) and SureFood GMO Quant RR2Y Soya (S2029) R-Biopharm AG MON89788 soybean was detected in sample T1 but only in some cases - 2 PCR replicates were always positive out of 4 after several repetitions
Remark (precision) in relation to T18 and T19 MON89788 soybean was detected in the sample but not quantified because of lt LOQ
T2 Please select the option that applies and proceed with the questionnaire
Answers Ratio
T2 was not analysed go to Q1 0 0
T2 was analysed go to Q2 82 100
No Answer 0 0
T2 1 Why did you not analyse test item 2
Answers Ratio
a) The sample matrix is out of the scope of our laboratory 0 0
b) The methods are not validated in our laboratory 0 0
c) We could not obtain sufficient good quality DNA suitable for further analysis 0 0
d) Reference material primers probes or other reagents were not available (in time) 0 0
e) We tried but our analysis failed 0 0
f) Other practical constraints (instrument broken no personnel etc) 0 0
g) Other reason 0 0
No Answer 82 100
T2 2 Select the DNA extraction method used for T2
Answers Ratio
CTAB 40 488
NucleoSpin Food 11 134
NucleoSpin Plant 3 366
GeneSpin 4 488
Promega Wizard 3 366
DNeasy Plant 3 366
DNeasy Mericon Food 4 488
Biotecon Foodproof 5 61
SDS 4 488
Fast ID Genomic DNA 3 366
Maxwell 16 Plant DNA 0 0
Maxwell 16 Food Feed Seed 4 488
Generon Ion Force 1 122
Other 2 244
No Answer 0 0
T2 3 Select any additional DNA purification method used for T2
Answers Ratio
No additional clean-up 52 634
Additional ethanol precipitation 9 110
Eurofins DNAExtractor cleaning column 3 366
Promega Wizard DNA clean-up resin 6 732
Qiagen QIAQuick 5 61
Qiagen Genomic-Tip 20G 1 122
Other method (no need to specify) 8 976
No Answer 0 0
EURL GMFF CT 0217 report
3546
T2 4 Indicate the number of replicate DNA extractions used to obtain the results
Answers Ratio
1 0 0
2 56 683
3 9 110
4 10 122
5 2 244
6 4 488
gt6 1 122
No Answer 0 0
T2 5 Select the approach(es) used to show absence of PCR inhibition
Answers Ratio
None (no inhibition was suspected based on experience) 7 854
We run two dilutions and verify if the delta Cq or GM are as expected 32 390
We run three or four dilutions and verify if the delta Cq or GM are as expected 12 146
We perform a PCR inhibition run with a reference gene before analysis 3 or 4 dilutions linear regression extrapolation of Cq of undiluted extract compare this to the measured Cq
15 183
We add an internal positive control to the reactions and check the Cq 16 195
We verify that the amplification curves look normal 25 305
We check that the optical density ratios (OD260280 260230) are acceptable 36 439
Other 1 122
No Answer 0 0
T2 6 Select the option applicable to your analysis for 40-3-2 soybean in T2
Answers Ratio
Not tested 0 0
Detected but not quantified 2 244
Detected and quantified please fill in Q6a-6h 80 976
Found absent 0 0
No Answer 0 0
T2 7 Select the option applicable to your analysis for 68416 soybean in T2
Answers Ratio
Not tested 15 183
Detected but not quantified 1 122
Detected and quantified please fill in Q7a-7h 0 0
Found absent 66 805
No Answer 0 0
T2 8 Select the option applicable to your analysis for MON89788 soybean in T2
Answers Ratio
Not tested 5 61
Detected but not quantified 6 732
Detected and quantified please fill in Q8a-8h 3 366
Found absent 68 829
No Answer 0 0
T2 9 If applicable why did you not test or quantify all GM events in T2
Answers Ratio
a) Not applicable all GM events listed were tested and all those detected were quantified 61 744
b) The event-specific detection method is not validated in our laboratory 6 732
c) Reference material primers probes or other reagents were not available (in time) 10 122
d) The result obtained was below the LODLOQ 5 61
e) Practical constraints (instrument broken no personnel etc) 0 0
f) Other reason 2 244
No Answer 0 0
T2 6a 40-3-2 Which quantification approach was used
Answers Ratio
Standard curve method (2 calibration curves) 71 866
Delta Cq method (one calibration curve) 9 110
Digital PCR (no calibration curve) 2 244
EURL GMFF CT 0217 report
3646
No Answer 2 244
T2 6b Select the calibrant used for the 40-3-2 standard curve
Answers Ratio
CRM from JRC (ex-IRMM) certified in GM mass fraction (gkg) 74 902
CRM from IRMM certified in GM copy number ratio (plasmid CRM) 0 0
Non-certified RM (eg lab QC material) expressed in GM mass fraction (gkg or mm ) 1 122
Non-certified RM (eg lab QC material) expressed in GM DNA copy number ratio (eg determined by digital PCR)
4 488
No calibrant used digital PCR done 1 122
No Answer 2 244
T2 6c Select the endogenous target(s) used for relative quantification of 40-3-2 soybean in T2
Answers Ratio
Soybean lec 74 bp (40-3-2 MON89788 MON87701 44406 356043 305423 etc) 63 768
Soybean lec 81 bp (Pauli et al 2001) 5 61
Soybean lec 102 bp (A5547 FG72) 1 122
Soybean lec 105 bp (A2704) 0 0
Soybean lec 118 bp (Shindo et al 2002) 6 732
Other please specify below 2 244
No Answer 5 61
Specify the reference target(s) used (if different from above)
Lectin - 74bp
lec 74bp
Lectine
SOJA LEKTIN 80 bp Va M Pijnenburrg H Gendre F Brignon P (1999) J Agric Food Chem 475261-5266
Terry C F Harris N Event-specific detection of Roundup Ready soya using two different real time PCR detection chemistries Eur Food Res Technol (2001) 213425-431
T2 6d Clarify the unit of measurement used and any conversion between units if applicable Carefully read the choices
below and select the one used in the measurements that resulted in a final result in GM mm for 40-3-2 If unclear or a
different approach was used please clarify this in the free text box below
Answers Ratio
The RM and the calibration standards were expressed in mass (or mass ) no conversion factor was applied
61 744
The calibration standards were expressed in DNA copies calculated from the RM in gkg but a conversion factor of 1 was applied (eg 10 mm GM = 10 cpcp GM corresponding to a 10x dilution of a 100 RM)
14 171
The calibration standards were expressed in DNA copies calculated from the RM in gkg and a conversion factor gt1 was applied to take account of the zygosity and target gene copies (double conversion applied) a conversion factor (eg 2) was used to convert from mass to copies (eg 20 mm GM = 10 cpcp GM corresponding to a 5x dilution of a 100 RM) the final result was again converted to mm by using the same conversion factor (eg x 2) Please specify this factor below
0 0
The measurements were done in DNA copies (as the RM used was expressed in this unit or digital PCR was used) A conversion factor was applied onto the final GM please specify this factor below
2 244
The measurements were done in DNA copies (as the RM used was expressed in this unit or digital PCR was used) No conversion factor was applied onto the final GM
3 366
No Answer 2 244
Conversion factor used to turn results into mm if applicable andor clarification on preparation of standards
1
Conversion factor of 1
T2 6e What was the amount of sample DNA (ng) used per PCR for 40-3-2 Choose the concentration that is closest to what
you used If applicable select multiple concentrations (eg if several dilutions were tested) but only those of which the
result was used to determine the reported GM
Answers Ratio
DNA concentration not determined 12 146
250 ng 5 61
200 ng 30 366
150 ng 7 854
100 ng 21 256
EURL GMFF CT 0217 report
3746
50 ng 17 207
25 ng 7 854
15 ng 2 244
lt10 ng 0 0
No Answer 2 244
T2 6f What was the LOQ (in mm ) for the 40-3-2 quantification
Answers
001 5 002 6 003 1 004 7 005 7 006 2 007 1 008 2 009 8 01 39 026 1 028 1
T2 6g How was the LOQ for 40-3-2 determined (if applicable)
Answers Ratio
Determined from the qPCR analysis for the current sample 21 256
Determined during the in-house validation of the method 43 524
Taken from the EURL GMFF validation report 19 232
By another approach please explain below 3 366
No Answer 2 244
Explanation on alternative LOQ determination
Determined from the digital PCR analysis for the current sample
Information about LOQ introduced by the manufacturer (R-Biopharm) of diagnostic kit
T2 6h How did you estimate the measurement uncertainty on the result reported for 40-3-2
Answers Ratio
Uncertainty budget (ISO GUM) 2 244
Uncertainty of the method (in-house validation) 30 366
Known uncertainty of the standard method 8 976
Measurement of replicates (precision) 32 390
From interlaboratory comparison data 4 488
Estimation based on judgement 2 244
In another way please specify below 7 854
No Answer 2 244
Explanation on alternative determination of measurement uncertainty
U=Sa radic1p+1n+(c0-c)2Sxx Uncertainty=Coverage Factor (P=95 anf f=n-1) Standard Deviation Square-root (Number of Measurements)
MU was estimated according to the Guidance Document on MU for GMO Testing Laboratories JRC ISSN 1018-5593
We used a calculated k-factor based on the number of repeats
Estimation based on within laboratory reproducibility
95 confidence interval of the results for the current sample
30 of the quantification result
The u was obtain through the estimation of the sd taking into account the repeatability and intermediate precision associated with the test sample Coverage factor k = 2 was applied then
Combined Uncertainty (CRM + measurement) following Application note (Lingsinger 2005 JRC Geel)
Additional comments and suggestions
Event 68416 was not tested due to non-availability of Positive control and reference material
DNA extraction of T2 has conducted using DNA extraction kits SureFood Prep Basic etc (see T1)
The NucleoSpin Food + NucleoSpin gDNA Clean-up was also used for DNA extraction from T1 and T2 samples The results for 40-3-2 were 25 - 30 lower than CTAB results T1 050 +- 018 (ww) T2 058 +- 020 (ww)
AOCS 0906-B as calibrant for MON89788 in T2 also
EURL GMFF CT 0217 report
3846
Annex 3 Qualitative performance of the participants
Table A31 Performance of the participants for the qualitative identification of GM events in CT-0217
The correct answer (yes) is that the GM event has been detected in the test item
Lab 40-3-2 detected in T1 40-3-2 detected in T2 Lab 40-3-2 detected in T1 40-3-2 detected in T2
L01 yes yes L45 yes yes
L02 yes yes L46 yes yes
L03 yes yes L47 yes yes
L04 yes yes L48 yes yes
L05 yes yes L49 yes yes
L06 yes yes L50 yes yes
L07 yes yes L51 yes yes
L08 yes yes L52 yes yes
L09 yes yes L53 yes yes
L10 yes Yes L54 yes yes
L11 yes yes L55 yes yes
L12 yes yes L56 yes yes
L13 yes yes L57 yes yes
L14 yes yes L58 yes yes
L15 yes yes L59 yes yes
L16 yes yes L60 yes yes
L17 yes yes L61 yes yes
L18 yes yes L62 yes yes
L19 yes yes L63 yes yes
L20 yes yes L66 yes yes
L22 yes yes L68 yes yes
L23 yes yes L69 yes yes
L24 yes yes L70 yes yes
L25 yes yes L71 yes yes
L26 yes yes L72 yes yes
L27 yes yes L73 T1 was not analysed yes
L29 yes yes L74 yes yes
L30 yes yes L75 yes yes
L31 yes yes L76 yes yes
L32 yes yes L77 yes yes
L33 yes yes L78 yes yes
L34 yes yes L79 yes yes
L35 yes yes L80 yes yes
L36 yes yes L81 yes yes
L37 yes yes L82 yes yes
L38 yes yes L83 yes yes
L39 yes yes L84 yes yes
L40 yes yes L85 yes yes
L41 yes yes L86 yes yes
L42 yes yes L87 yes yes
L43 T1 was not analysed yes L88 yes yes
L44 yes yes L89 yes yes
Although the questionnaire was not returned by the participant the presence of the event was inferred from the quantitative result reported
L10 did not fill in the questionnaire but reported a larger than 01 result for T1 and T2
EURL GMFF CT 0217 report
3946
Annex 4 Participants quantitative performance
The z and ζ scores of all laboratories are reported in Tables A41 and A42 and in Figures
A41 and A42 for 40-3-2 soybean in T1 and T2 respectively For consistency the
reported results are shown with two decimals the performance scores with one decimal
The z scores are displayed in green (satisfactory) orange (questionable) or red cells
(unsatisfactory)
Table A41 Quantitative results (in mm ) and performance scores of participants of CT-0217 for 40-3-2 soybean in chicken feed (T1)
Lab1 Category xi U k2 Log(xi) u(xi) u(xi-log) z score ζ score3
L01 NRL120 064 008 200 -019 004 003 -10 -28
L02 NRL882 057 002 200 -024 001 001 -15 -67
L03 Non-NRL 073 1520 200 -014 760 452 -04 00
L04 Non-NRL 075
-012 000 000 -03 -13
L05 NRL120 073 007 257 -014 003 002 -04 -15
L06 NRL882 075 021 200 -012 011 006 -03 -04
L07 NRL882 065 013 200 -019 007 004 -09 -19
L08 NRL120 062 023 200 -021 012 008 -11 -13
L09 NRL882 081 027 200 -009 014 007 01 01
L12 Non-NRL 100 051 200 000 026 011 10 09
L13 NRL882 094 019 173 -003 011 005 07 13
L14 Non-NRL 063
-020 000 000 -10 -50
L15 NRL882 110 011 200 004 005 002 14 46
L16 Non-NRL 117
007 000 000 17 80
L17 NRL882 072 010 200 -014 005 003 -05 -12
L18 Non-NRL 040
-040 000 000 -30 -145
L19 Non-NRL 115 063 173 006 036 014 16 11
L20 NRL120 108 032 200 003 016 006 13 19
L22 Non-NRL 051 030 223 -029 013 011 -20 -17
L23 Non-NRL 047 009 200 -033 005 004 -23 -50
L24 NRL882 072 019 200 -014 010 006 -05 -07
L25 Non-NRL 120
008 000 000 18 85
L26 NRL882 023 009 200 -064 005 008 -54 -62
L27 Non-NRL 098 015 200 -001 008 003 09 23
L29 NRL120 090 008 173 -005 005 002 05 17
L30 NRL882 045 013 200 -035 007 006 -25 -38
L31 NRL882 080 038 223 -010 017 009 00 00
L32 Non-NRL 076 039 200 -012 020 011 -02 -02
L33 NRL-120 057 014 200 -024 007 005 -15 -26
L34 NRL120 061 016 200 -021 008 006 -12 -19
L35 NRL882 097 027 200 -001 014 006 08 13
L36 Non-NRL 090 030 200 -005 015 007 05 07
L37 NRL120 065 026 200 -019 013 009 -09 -10
L38 NRL120 093 014 237 -003 006 003 07 19
L39 Non-NRL 112
005 000 000 15 71
L40 NRL882 053 008 200 -028 004 003 -18 -46
L41 NRL120 080 003 200 -010 002 001 00 00
L42 NRL882 104 031 200 002 016 006 11 17
L44 NRL120 084 007 257 -008 003 001 02 09
L45 NRL882 065 018 200 -019 009 006 -09 -14
L46 NRL882 081 018 200 -009 009 005 01 01
L47 NRL882 141 027 173 015 016 005 25 47
L48 NRL882 059 028 200 -023 014 010 -13 -13
L49 Non-NRL 089 031 200 -005 016 008 05 06
L50 NRL120 073 005 200 -014 003 001 -04 -15
L51 Non-NRL 077 049 200 -011 025 014 -02 -01
L52 Non-NRL 091 012 200 -004 006 003 06 16
L53 Non-NRL 043 081 200 -037 041 041 -27 -07
L54 NRL882 074 035 200 -013 018 010 -03 -03
L55 Non-NRL 076 019 173 -012 011 006 -02 -03
EURL GMFF CT 0217 report
4046
Lab1 Category xi U k2 Log(xi) u(xi) u(xi-log) z score ζ score3
L56 NRL882 115 022 173 006 013 005 16 30
L57 NRL120 075 020 200 -012 010 006 -03 -04
L58 NRL120 089 016 200 -005 008 004 05 11
L59 NRL882 137 038 200 014 019 006 23 37
L60 NRL882 068 017 200 -017 009 005 -07 -12
L61 Non-NRL 065
-019 000 000 -09 -43
L62 NRL120 130 037 237 011 016 005 21 38
L63 Non-NRL 088 006 200 -006 003 001 04 16
L64 NRL882 081 024 173 -009 014 007 01 01
L65 Non-NRL 116 065 200 006 033 012 16 13
L66 NRL882 048 024 200 -032 012 011 -22 -20
L68 NRL882 139 015 200 014 008 002 24 77
L69 Non-NRL 010 004 200 -101 002 008 -91 -105
L70 Non-NRL 057 010 200 -024 005 004 -15 -34
L72 NRL882 108 032 200 003 016 007 13 19
L74 NRL882 075 019 200 -012 010 005 -03 -05
L75 Non-NRL 862
094 000 000 103 499
L76 NRL882 099 038 200 000 019 008 09 11
L77 NRL120 075 009 226 -012 004 002 -03 -09
L78 NRL120 059 006 300 -023 002 001 -13 -52
L79 Non-NRL 046
-034 000 000 -24 -116
L80 NRL120 071 024 200 -015 012 007 -05 -07
L81 NRL882 071 028 200 -015 014 009 -05 -06
L82 NRL120 092 015 200 -004 008 004 06 15
L83 NRL120 114 013 173 006 008 003 15 44
L84 Non-NRL 071 030 200 -015 015 009 -05 -05
L85 NRL882 074 031 201 -013 015 009 -03 -04
L86 Non-NRL 066 022 200 -018 011 007 -08 -11
L87 NRL882 085 015 200 -007 008 004 03 06
L88 NRL-120 lt0044
L89 NRL882 079 022 200 -010 011 006 -01 -01
1 One NRL882 (L73) did not report a quantitative result for 40-3-2 in T1 because T1 is out of scope of the laboratory 2 If the k factor was not reported by the laboratory a value of 173 was assigned (radic3) for calculation of the ζ score 3 The ζ scores are provided for information only with indicative of a questionable score and of an unsatisfactory score 4 The less than value reported by the laboratory is considered unsatisfactory
EURL GMFF CT 0217 report
4146
Table A42 Quantitative results (in mm ) and performance scores of participants of CT-0217 for
40-3-2 soybean in soybean flour (T2)
Lab1 Category xi U k2 Log(xi) u(xi) u(xi-log) z score ζ score3
L01 NRL120 071 007 200 -015 004 002 -03 -12
L02 NRL882 081 003 200 -009 002 001 03 19
L03 Non-NRL 088 1520 200 -006 760 375 06 00
L04 Non-NRL 089
-005 000 000 07 56
L05 NRL120 075 005 257 -012 002 001 -01 -04
L06 NRL882 080 022 200 -010 011 006 02 04
L07 NRL882 076 009 200 -012 005 003 00 00
L08 NRL120 042 016 200 -038 008 008 -26 -31
L09 NRL882 081 027 200 -009 014 007 03 04
L12 Non-NRL 076 039 200 -012 020 011 00 00
L13 NRL882 069 011 173 -016 006 004 -04 -10
L14 Non-NRL 075
-012 000 000 -01 -05
L15 NRL882 084 011 200 -008 005 003 04 14
L16 Non-NRL 088
-006 000 000 06 52
L17 NRL882 075 010 200 -012 005 003 -01 -02
L18 Non-NRL 034
-047 000 000 -35 -287
L19 Non-NRL 089 016 173 -005 009 005 07 15
L20 NRL120 104 031 200 002 016 006 14 21
L22 Non-NRL 081 026 223 -009 012 006 03 04
L23 Non-NRL 064 012 200 -019 006 004 -08 -18
L24 NRL882 079 021 200 -010 011 006 02 03
L25 Non-NRL 085
-007 000 000 05 39
L26 NRL882 117 039 200 007 020 007 19 25
L27 Non-NRL 118 018 200 007 009 003 19 54
L29 NRL120 078 004 173 -011 002 001 01 06
L30 NRL882 069 020 200 -016 010 006 -04 -07
L31 NRL882 096 077 233 -002 033 015 10 07
L32 Non-NRL 090 039 200 -005 020 009 07 08
L33 NRL-120 078 004 200 -011 002 001 01 06
L34 NRL120 073 014 200 -014 007 004 -02 -04
L35 NRL882 095 027 200 -002 014 006 10 15
L36 Non-NRL 077 003 200 -011 002 001 01 03
L37 NRL120 075 010 200 -012 005 003 -01 -02
L38 NRL120 119 008 237 008 003 001 19 112
L39 Non-NRL 062
-021 000 000 -09 -73
L40 NRL882 045 008 200 -035 004 004 -23 -56
L41 NRL120 087 002 200 -006 001 000 06 44
L42 NRL882 068 020 200 -017 010 006 -05 -08
L43 Non-NRL 065
-019 000 000 -07 -56
L44 NRL120 074 006 220 -013 003 002 -01 -06
L45 NRL882 073 021 200 -014 011 006 -02 -03
L46 NRL882 081 018 200 -009 009 005 03 05
L47 NRL882 062 012 173 -021 007 005 -09 -18
L48 NRL882 074 035 173 -013 020 012 -01 -01
L49 Non-NRL 073 026 200 -014 013 008 -02 -02
L50 NRL120 081 007 200 -009 004 002 03 12
L51 Non-NRL 068 044 200 -017 022 014 -05 -03
L52 Non-NRL 073 011 200 -014 006 003 -02 -05
L53 Non-NRL 058 081 200 -024 041 030 -12 -04
L54 NRL882 073 026 200 -014 013 008 -02 -02
L55 Non-NRL 072 018 173 -014 010 006 -02 -04
L56 NRL882 066 018 173 -018 010 007 -06 -09
L57 NRL120 060 020 200 -022 010 007 -10 -14
L58 NRL120 067 011 200 -017 006 004 -06 -15
L59 NRL882 076 022 200 -012 011 006 00 00
L60 NRL882 080 020 200 -010 010 005 02 04
L61 Non-NRL 050
-030 000 000 -18 -150
EURL GMFF CT 0217 report
4246
Lab1 Category xi U k2 Log(xi) u(xi) u(xi-log) z score ζ score3
L62 NRL120 075 012 245 -012 005 003 -01 -02
L63 Non-NRL 075 004 200 -012 002 001 -01 -04
L64 NRL882 078 023 173 -011 013 007 01 01
L65 Non-NRL 051 023 200 -029 012 010 -17 -18
L66 NRL882 073 024 200 -014 012 007 -02 -02
L68 NRL882 091 011 200 -004 006 003 08 27
L69 Non-NRL 092 035 200 -004 018 008 08 10
L70 Non-NRL 050 009 200 -030 005 004 -18 -45
L72 NRL882 092 028 200 -004 014 007 08 12
L73 NRL882 092 030 200 -004 015 007 08 11
L74 NRL882 064 013 200 -019 007 004 -08 -16
L75 Non-NRL 644
081 000 000 93 760
L76 NRL882 056 099 200 -025 050 038 -13 -03
L77 NRL120 054 006 226 -027 003 002 -15 -61
L78 NRL120 065 001 300 -019 000 000 -07 -55
L79 Non-NRL 071
-015 000 000 -03 -25
L80 NRL120 095 030 200 -002 015 007 10 14
L81 NRL882 077 032 200 -011 016 009 01 01
L82 NRL120 102 032 200 001 016 007 13 18
L83 NRL120 084 005 173 -008 003 001 04 22
L84 Non-NRL 045 030 200 -035 015 014 -23 -16
L85 NRL882 082 015 212 -009 007 004 03 08
L86 Non-NRL 073 024 200 -014 012 007 -02 -02
L87 NRL882 077 012 200 -011 006 003 01 01
L88 NRL120 065 020 200 -019 010 007 -07 -10
L89 NRL882 077 021 200 -011 011 006 01 01
1 All participating NRL882 reported a quantitative result for 40-3-2 soybean in T2 2 If the k factor was not reported by the laboratory a value of 173 was assigned (radic3) for calculation of the ζ score 3 The ζ scores are provided for information only with indicative of a questionable score and of an unsatisfactory score
EURL GMFF CT 0217 report 4346
Figure A41 Laboratory results for soybean event 40-3-2 in test item 1 and kernel density distribution (insert)
The horizontal full line shows the assigned value (on the log scale) the dashed black lines represent the expanded measurement uncertainty of the assigned value and the wider interval (dashed red lines) represents the limits of satisfaction (|z|le 20) Laboratory results are shown with the expanded measurement uncertainties (when reported) the expanded measurement uncertainty of L03 is out of scale
EURL GMFF CT 0217 report 4446
Figure A42 Laboratory results for soybean event 40-3-2 in test item 2 and kernel density distribution (insert)
The horizontal full line shows the assigned value (on the log scale) the dashed black lines represent the expanded measurement uncertainty of the assigned value and the wider interval (dashed red lines) represents the limits of satisfaction (|z|le 20) Laboratory results are shown with the expanded measurement uncertainties (when reported) the expanded measurement uncertainty of L03 is out of scale
Europe Direct is a service to help you find answers
to your questions about the European Union
Freephone number ()
00 800 6 7 8 9 10 11 () The information given is free as are most calls (though some operators phone boxes or hotels may
charge you)
More information on the European Union is available on the internet (httpeuropaeu)
HOW TO OBTAIN EU PUBLICATIONS
Free publications
bull one copy
via EU Bookshop (httpbookshopeuropaeu)
bull more than one copy or postersmaps
from the European Unionrsquos representations (httpeceuropaeurepresent_enhtm) from the delegations in non-EU countries (httpeeaseuropaeudelegationsindex_enhtm) by contacting the Europe Direct service (httpeuropaeueuropedirectindex_enhtm) or calling 00 800 6 7 8 9 10 11 (freephone number from anywhere in the EU) () () The information given is free as are most calls (though some operators phone boxes or hotels may charge you)
Priced publications
bull via EU Bookshop (httpbookshopeuropaeu)
KJ-N
A-2
8873-E
N-N
doi 102760461562
ISBN 978-92-79-76303-8

EURL GMFF CT 0217 report
2946
A12 Stability of test items
For T1 an isochronous short-term stability study(24) involving two test samples with three
replicates each (N = 2 n = 3) was conducted over two and four weeks at +4 degC +18 degC
and +60 degC The 40-3-2 soybean mass fraction was measured by qPCR The
measurements were performed under intermediate precision conditions with respect to the
PCR plates
The results did not reveal any influence of time or storage at +4 degC or +18 degC on the
stability of the test item (compared to storage at -70 degC) with regard to the soybean event
40-3-2 mass fraction Even at 60 degC no significant trend was measured although the
extracted DNA was more fragmented as seen by agarose gel electrophoresis
The test items were shipped at ambient temperature
The stability of T1 during the period covered by the PT (approximately 5 months between
production of the test item and the deadline for results reporting) was tested by analysing
simultaneously on one PCR plate two units (N = 2 n = 3) stored either at the normal
storage temperature (4 degC) or at a reference temperature (-70 degC) The evaluation was
based on the results ratio between samples stored at 4 degC and -70 degC The data were
evaluated against storage time and regression lines were calculated The slopes of the
regression lines were tested for statistical significance (lossincrease due to storage) No
significant trend was detected at a 95 confidence level The T1 material can therefore
be stored at 4 degC and was stable during the period covered by this CT
The stability of T2 was ensured as part of the post-certification stability monitoring of
ERM-BF410p Measurements were performed simultaneously on one PCR plate as
described for T1 on units stored at the normal storage temperature (4 degC) and at a
reference temperature (-70 degC) No significant trend was detected at a 95 confidence
level The T2 material can therefore be stored at 4 degC and was stable during the period
covered by this CT
EURL GMFF CT 0217 report
3046
Annex 2 Questionnaire data
The results received from 82 laboratories were exported from the EUSurvey
Questionnaire on CT 0217 analysis and are tabulated below Multiple answers were
allowed for all questions except for the questions on the calibrant used The results of the
open questions were manually analysed and reported Answers to the questions on GM
events that were not to be quantified in the test items are not shown
Select the group to which your organisation belongs Note 882 and 120 refer to EU Regulations 8822004 and 1202014
resp select NRL120 if your organisation is ONLY listed under Regulation 1202014 select non-NRL if your organisation is
not an NRL under either EU Regulation
Answers Ratio
NRL882 33 402
NRL120 20 244
Non-NRL 29 354
No Answer 0 0
T1 Please select the option that applies and proceed with the questionnaire
Answers Ratio
T1 was not analysed go to Q1 2 244
T1 was analysed go to Q2 80 976
No Answer 0 0
T1 1 Why did you not analyse test item 1
Answers Ratio
a) The sample matrix is out of the scope of our laboratory 1 122
b) The methods are not validated in our laboratory 0 0
c) We could not obtain sufficient good quality DNA suitable for further analysis 0 0
d) Reference material primers probes or other reagents were not available (in time) 0 0
e) We tried but our analysis failed 0 0
f) Other practical constraints (instrument broken no personnel etc) 1 122
g) Other reason 0 0
No Answer 80 976
T1 2 Select the DNA extraction method used for T1
Answers Ratio
CTAB 41 50
NucleoSpin Food 10 122
NucleoSpin Plant 3 366
GeneSpin 4 488
Promega Wizard 3 366
DNeasy Plant 3 366
DNeasy Mericon Food 5 61
Biotecon Foodproof 5 61
SDS 4 488
Fast ID Genomic DNA 2 244
Maxwell 16 Plant DNA 0 0
Maxwell 16 Food Feed Seed 5 61
Generon Ion Force 1 122
Other 2 244
No Answer 2 244
T1 3 Select any additional DNA purification method used for T1
Answers Ratio
No additional clean-up 51 622
Additional ethanol precipitation 9 110
Eurofins DNAExtractor cleaning column 3 366
Promega Wizard DNA clean-up resin 6 732
Qiagen QIAQuick 4 488
Qiagen Genomic-Tip 20G 1 122
Other method (no need to specify) 7 854
No Answer 2 244
EURL GMFF CT 0217 report
3146
T1 4 Indicate the number of replicate DNA extractions used to obtain the results
Answers Ratio
1 0 0
2 52 634
3 9 110
4 10 122
5 2 244
6 6 732
gt6 1 122
No Answer 2 244
T1 5 Select the approach(es) used to show absence of PCR inhibition
Answers Ratio None (no inhibition was suspected based on experience) 6 732
We check that the optical density ratios (OD260280 260230) are acceptable 40 488
We verify that the amplification curves look normal 24 293
We run two dilutions and verify if the delta Cq or GM are as expected 31 378
We run three or four dilutions and verify if the delta Cq or GM are as expected 13 158
We perform a PCR inhibition run with a reference gene before analysis 3 or 4 dilutions linear regression extrapolation of Cq for undiluted extract compare this to the measured Cq
16 195
We add an internal positive control to the reactions and check the Cq 15 183
Other 1 122
No Answer 2 244
T1 6 Select the option applicable to your analysis for 40-3-2 soybean in T1
Answers Ratio
Not tested 0 0
Detected but not quantified 3 366
Detected and quantified please fill in Q6a-6h 77 939
Found absent 0 0
No Answer 2 244
T1 7 Select the option applicable to your analysis for 68416 soybean in T1
Answers Ratio
Not tested 14 171
Detected but not quantified 2 244
Detected and quantified please fill in Q7a-7h 0 0
Found absent 64 781
No Answer 2 244
T1 8 Select the option applicable to your analysis for MON89788 soybean in T1
Answers Ratio
Not tested 6 732
Detected but not quantified 33 402
Detected and quantified please fill in Q8a-8h 15 183
Found absent 26 317
No Answer 2 244
T1 9 If applicable why did you not test or quantify all GM events in T1
Answers Ratio
a) Not applicable all GM events listed were tested and all those detected were quantified 45 549
b) The event-specific detection method is not validated in our laboratory 7 854
c) Reference material primers probes or other reagents were not available (in time) 9 110
d) The result obtained was below the LODLOQ 18 220
e) Practical constraints (instrument broken no personnel etc) 0 0
f) Other reason 9 110
No Answer 2 244
T1 6a Soybean 40-3-2 Which quantification approach was used
Answers Ratio
Standard curve method (2 calibration curves) 68 829
Delta Cq method (one calibration curve) 9 110
Digital PCR (no calibration curve) 2 244
EURL GMFF CT 0217 report
3246
No Answer 5 61
T1 6b Select the calibrant used for the 40-3-2 standard curve
Answers Ratio
CRM from JRC (ex-IRMM) certified in GM mass fraction (gkg) 71 866
Non-certified RM (eg lab QC material) expressed in GM mass fraction (gkg or mm ) 1 122
Non-certified RM (eg lab QC material) expressed in GM DNA copy number ratio (eg determined by digital PCR)
4 488
No calibrant used digital PCR done 1 122
No Answer 5 61
T1 6c Select the endogenous target(s) used for relative quantification of 40-3-2 soybean in T1
Answers Ratio
Soybean lec 74 bp (40-3-2 MON89788 MON87701 44406 356043 305423 etc) 65 793
Soybean lec 81 bp (Pauli et al 2001) 5 61
Soybean lec 102 bp (A5547 FG72) 1 122
Soybean lec 105 bp (A2704) 0 0
Soybean lec 118 bp (Shindo et al 2002) 5 61
Other please specify below 1 122
No Answer 5 61
Specify the reference target(s) used (if different from above)
SOJA LEKTIN 80 bp - Va M Pijnenburrg H Gendre F Brignon P (1999) J Agric Food Chem 475261-5266
T1 6d Clarify the unit of measurement used and any conversion between units if applicable Carefully read the choices
below and select the one used in the measurements that resulted in a final result in GM mm for 40-3-2 If unclear or a
different approach was used please clarify this in the free text box below
Answers Ratio
The RM and the calibration standards were expressed in mass (or mass ) no conversion factor was applied
59 720
The calibration standards were expressed in DNA copies calculated from the RM in gkg but a conversion factor of 1 was applied (eg 10 mm GM = 10 cpcp GM corresponding to a 10x dilution of a 100 RM)
13 159
The calibration standards were expressed in DNA copies calculated from the RM in gkg and a conversion factor gt1 was applied to take account of the zygosity and target gene copies (double conversion applied) a conversion factor (eg 2) was used to convert from mass to copies (eg 20 mm GM = 10 cpcp GM corresponding to a 5x dilution of a 100 RM) the final result was again converted to mm by using the same conversion factor (eg x 2) Please specify this factor below
0 0
The measurements were done in DNA copies (as the RM used was expressed in this unit or digital PCR was used) A conversion factor was applied onto the final GM please specify this factor below
2 244
The measurements were done in DNA copies (as the RM used was expressed in this unit or digital PCR was used) No conversion factor was applied onto the final GM
3 366
No Answer 5 61
Conversion factor used to turn results into mm if applicable andor clarification on preparation of standards
1
Conversion factor of 1
T1 6e What was the amount of sample DNA (ng) used per PCR for 40-3-2 Choose the concentration that is closest to what
you used If applicable select multiple concentrations (eg if several dilutions were tested) but only those of which the
result was used to determine the reported GM
Answers Ratio
DNA concentration not determined 12 146
250 ng 5 61
200 ng 30 366
150 ng 9 110
100 ng 18 220
50 ng 14 171
25 ng 6 732
15 ng 0 0
lt10 ng 0 0
No Answer 5 61
EURL GMFF CT 0217 report
3346
T1 6f What was the LOQ (in mm ) for the 40-3-2 quantification
Answers
001 3 002 4 003 1 004 6 005 7 006 2 008 4 009 7 01 37 019 1 02 1 03 1 035 1 04 1 13 1
T1 6g How was the LOQ for 40-3-2 determined (if applicable)
Answers Ratio
Determined from the qPCR analysis for the current sample 20 244
Determined during the in-house validation of the method 42 512
Taken from the EURL GMFF validation report 17 207
By another approach please explain below 2 244
No Answer 5 61
Explanation on alternative LOQ determination
Determined from the digital PCR analysis for the current sample Information about LOQ introduced by the manufacturer (R-Biopharm) of diagnostic kit The u was obtain through the estimation of the sd taking into account the repeatability and intermediate precision associated with the test sample Coverage factor k = 2 was applied then
T1 6h How did you estimate the measurement uncertainty on the result reported for 40-3-2 soybean
Answers Ratio
Uncertainty budget (ISO GUM) 2 244
Uncertainty of the method (in-house validation) 27 329
Known uncertainty of the standard method 9 110
Measurement of replicates (precision) 32 390
From interlaboratory comparison data 4 488
Estimation based on judgement 2 244
In another way please specify below 6 732
No Answer 5 61
Explanation on alternative determination of measurement uncertainty
U=Sa radic1p+1n+(c0-c)2Sxx
Uncertainty=Coverage Factor (P=95 anf f=n-1) Standard Deviation Square-root (Number of Measurements)
MU was estimated according to the Guidance Document on MU for GMO Testing Laboratories JRC ISSN 1018-5593
we used a calculated k-factor based on the number of repeats
Estimation based on within laboratory reproducibility
95 confidence interval of the results for the current sample
The u was obtain through the estimation of the sd taking into account the repeatability and intermediate precision associated with the test sample Coverage factor k = 2 was applied then
Combined Uncertainty (CRM + measurement) following Application note (Lingsinger 2005 JRC Geel)
Additional comments and suggestions
MON89788 soybean was detected but not quantified because results for this event were lt LOQ
We saw in the qPCR for MON89788 Ct-values at 37 - 39 but lt LOD (lt 002 )
Additional tests with one extract performed with Nucleospin Food Kit and with one extract performed with CTAB+Nucleospin Food Kit showed no significant differences in event detection and GTS 40-3-2 quantification (examined with digital PCR)
T19 not all detected GM were asked to be quantified
For T1 trace amounts of MON89788 were detected either in qualitative screening as well as in quantification The givencalculated GM (mm) of 002 is well below the known and validated LOQ of the method which is 01 We detected a low level of MON89788 but as this quantified at 0006 lower than the threshold for reporting we took this as a negative result
According course material of JRC GMO Quantification Proper calibration and Estimation of Measurement Uncertainty
MU is based on intermediate precision data
EURL GMFF CT 0217 report
3446
The sample was strongly inhibited MON89788 was detected under LOQ
In T1 the measured GM for MON89788 of 001 is below the determined LOQ (02) therefore no MU was reported
MON89788 was detected in traces at the LOD
MON89788 SOY result obtained below the LOQ but copy numbers of MON89788 was above LOD
T1 was inhibited A 10x dilution of the DNA was needed to get a reasonable result
DNA extraction of T1 has conducted using DNA extraction kits SureFood Prep Basic (S1052) and SureFood Prep Advanced (S1053) R-Biopharm AG Identification of Soya GM-lines was conducted using diagnostic kits SureFood GMO ID Roundup Ready Soya (S2030) and SureFood GMO ID RR2Y (S2034) Quantification kits were SureFood GMO Quant Roundup Ready Soya (S2014) SureFood GMO Quant 35S soya (S2028) and SureFood GMO Quant RR2Y Soya (S2029) R-Biopharm AG MON89788 soybean was detected in sample T1 but only in some cases - 2 PCR replicates were always positive out of 4 after several repetitions
Remark (precision) in relation to T18 and T19 MON89788 soybean was detected in the sample but not quantified because of lt LOQ
T2 Please select the option that applies and proceed with the questionnaire
Answers Ratio
T2 was not analysed go to Q1 0 0
T2 was analysed go to Q2 82 100
No Answer 0 0
T2 1 Why did you not analyse test item 2
Answers Ratio
a) The sample matrix is out of the scope of our laboratory 0 0
b) The methods are not validated in our laboratory 0 0
c) We could not obtain sufficient good quality DNA suitable for further analysis 0 0
d) Reference material primers probes or other reagents were not available (in time) 0 0
e) We tried but our analysis failed 0 0
f) Other practical constraints (instrument broken no personnel etc) 0 0
g) Other reason 0 0
No Answer 82 100
T2 2 Select the DNA extraction method used for T2
Answers Ratio
CTAB 40 488
NucleoSpin Food 11 134
NucleoSpin Plant 3 366
GeneSpin 4 488
Promega Wizard 3 366
DNeasy Plant 3 366
DNeasy Mericon Food 4 488
Biotecon Foodproof 5 61
SDS 4 488
Fast ID Genomic DNA 3 366
Maxwell 16 Plant DNA 0 0
Maxwell 16 Food Feed Seed 4 488
Generon Ion Force 1 122
Other 2 244
No Answer 0 0
T2 3 Select any additional DNA purification method used for T2
Answers Ratio
No additional clean-up 52 634
Additional ethanol precipitation 9 110
Eurofins DNAExtractor cleaning column 3 366
Promega Wizard DNA clean-up resin 6 732
Qiagen QIAQuick 5 61
Qiagen Genomic-Tip 20G 1 122
Other method (no need to specify) 8 976
No Answer 0 0
EURL GMFF CT 0217 report
3546
T2 4 Indicate the number of replicate DNA extractions used to obtain the results
Answers Ratio
1 0 0
2 56 683
3 9 110
4 10 122
5 2 244
6 4 488
gt6 1 122
No Answer 0 0
T2 5 Select the approach(es) used to show absence of PCR inhibition
Answers Ratio
None (no inhibition was suspected based on experience) 7 854
We run two dilutions and verify if the delta Cq or GM are as expected 32 390
We run three or four dilutions and verify if the delta Cq or GM are as expected 12 146
We perform a PCR inhibition run with a reference gene before analysis 3 or 4 dilutions linear regression extrapolation of Cq of undiluted extract compare this to the measured Cq
15 183
We add an internal positive control to the reactions and check the Cq 16 195
We verify that the amplification curves look normal 25 305
We check that the optical density ratios (OD260280 260230) are acceptable 36 439
Other 1 122
No Answer 0 0
T2 6 Select the option applicable to your analysis for 40-3-2 soybean in T2
Answers Ratio
Not tested 0 0
Detected but not quantified 2 244
Detected and quantified please fill in Q6a-6h 80 976
Found absent 0 0
No Answer 0 0
T2 7 Select the option applicable to your analysis for 68416 soybean in T2
Answers Ratio
Not tested 15 183
Detected but not quantified 1 122
Detected and quantified please fill in Q7a-7h 0 0
Found absent 66 805
No Answer 0 0
T2 8 Select the option applicable to your analysis for MON89788 soybean in T2
Answers Ratio
Not tested 5 61
Detected but not quantified 6 732
Detected and quantified please fill in Q8a-8h 3 366
Found absent 68 829
No Answer 0 0
T2 9 If applicable why did you not test or quantify all GM events in T2
Answers Ratio
a) Not applicable all GM events listed were tested and all those detected were quantified 61 744
b) The event-specific detection method is not validated in our laboratory 6 732
c) Reference material primers probes or other reagents were not available (in time) 10 122
d) The result obtained was below the LODLOQ 5 61
e) Practical constraints (instrument broken no personnel etc) 0 0
f) Other reason 2 244
No Answer 0 0
T2 6a 40-3-2 Which quantification approach was used
Answers Ratio
Standard curve method (2 calibration curves) 71 866
Delta Cq method (one calibration curve) 9 110
Digital PCR (no calibration curve) 2 244
EURL GMFF CT 0217 report
3646
No Answer 2 244
T2 6b Select the calibrant used for the 40-3-2 standard curve
Answers Ratio
CRM from JRC (ex-IRMM) certified in GM mass fraction (gkg) 74 902
CRM from IRMM certified in GM copy number ratio (plasmid CRM) 0 0
Non-certified RM (eg lab QC material) expressed in GM mass fraction (gkg or mm ) 1 122
Non-certified RM (eg lab QC material) expressed in GM DNA copy number ratio (eg determined by digital PCR)
4 488
No calibrant used digital PCR done 1 122
No Answer 2 244
T2 6c Select the endogenous target(s) used for relative quantification of 40-3-2 soybean in T2
Answers Ratio
Soybean lec 74 bp (40-3-2 MON89788 MON87701 44406 356043 305423 etc) 63 768
Soybean lec 81 bp (Pauli et al 2001) 5 61
Soybean lec 102 bp (A5547 FG72) 1 122
Soybean lec 105 bp (A2704) 0 0
Soybean lec 118 bp (Shindo et al 2002) 6 732
Other please specify below 2 244
No Answer 5 61
Specify the reference target(s) used (if different from above)
Lectin - 74bp
lec 74bp
Lectine
SOJA LEKTIN 80 bp Va M Pijnenburrg H Gendre F Brignon P (1999) J Agric Food Chem 475261-5266
Terry C F Harris N Event-specific detection of Roundup Ready soya using two different real time PCR detection chemistries Eur Food Res Technol (2001) 213425-431
T2 6d Clarify the unit of measurement used and any conversion between units if applicable Carefully read the choices
below and select the one used in the measurements that resulted in a final result in GM mm for 40-3-2 If unclear or a
different approach was used please clarify this in the free text box below
Answers Ratio
The RM and the calibration standards were expressed in mass (or mass ) no conversion factor was applied
61 744
The calibration standards were expressed in DNA copies calculated from the RM in gkg but a conversion factor of 1 was applied (eg 10 mm GM = 10 cpcp GM corresponding to a 10x dilution of a 100 RM)
14 171
The calibration standards were expressed in DNA copies calculated from the RM in gkg and a conversion factor gt1 was applied to take account of the zygosity and target gene copies (double conversion applied) a conversion factor (eg 2) was used to convert from mass to copies (eg 20 mm GM = 10 cpcp GM corresponding to a 5x dilution of a 100 RM) the final result was again converted to mm by using the same conversion factor (eg x 2) Please specify this factor below
0 0
The measurements were done in DNA copies (as the RM used was expressed in this unit or digital PCR was used) A conversion factor was applied onto the final GM please specify this factor below
2 244
The measurements were done in DNA copies (as the RM used was expressed in this unit or digital PCR was used) No conversion factor was applied onto the final GM
3 366
No Answer 2 244
Conversion factor used to turn results into mm if applicable andor clarification on preparation of standards
1
Conversion factor of 1
T2 6e What was the amount of sample DNA (ng) used per PCR for 40-3-2 Choose the concentration that is closest to what
you used If applicable select multiple concentrations (eg if several dilutions were tested) but only those of which the
result was used to determine the reported GM
Answers Ratio
DNA concentration not determined 12 146
250 ng 5 61
200 ng 30 366
150 ng 7 854
100 ng 21 256
EURL GMFF CT 0217 report
3746
50 ng 17 207
25 ng 7 854
15 ng 2 244
lt10 ng 0 0
No Answer 2 244
T2 6f What was the LOQ (in mm ) for the 40-3-2 quantification
Answers
001 5 002 6 003 1 004 7 005 7 006 2 007 1 008 2 009 8 01 39 026 1 028 1
T2 6g How was the LOQ for 40-3-2 determined (if applicable)
Answers Ratio
Determined from the qPCR analysis for the current sample 21 256
Determined during the in-house validation of the method 43 524
Taken from the EURL GMFF validation report 19 232
By another approach please explain below 3 366
No Answer 2 244
Explanation on alternative LOQ determination
Determined from the digital PCR analysis for the current sample
Information about LOQ introduced by the manufacturer (R-Biopharm) of diagnostic kit
T2 6h How did you estimate the measurement uncertainty on the result reported for 40-3-2
Answers Ratio
Uncertainty budget (ISO GUM) 2 244
Uncertainty of the method (in-house validation) 30 366
Known uncertainty of the standard method 8 976
Measurement of replicates (precision) 32 390
From interlaboratory comparison data 4 488
Estimation based on judgement 2 244
In another way please specify below 7 854
No Answer 2 244
Explanation on alternative determination of measurement uncertainty
U=Sa radic1p+1n+(c0-c)2Sxx Uncertainty=Coverage Factor (P=95 anf f=n-1) Standard Deviation Square-root (Number of Measurements)
MU was estimated according to the Guidance Document on MU for GMO Testing Laboratories JRC ISSN 1018-5593
We used a calculated k-factor based on the number of repeats
Estimation based on within laboratory reproducibility
95 confidence interval of the results for the current sample
30 of the quantification result
The u was obtain through the estimation of the sd taking into account the repeatability and intermediate precision associated with the test sample Coverage factor k = 2 was applied then
Combined Uncertainty (CRM + measurement) following Application note (Lingsinger 2005 JRC Geel)
Additional comments and suggestions
Event 68416 was not tested due to non-availability of Positive control and reference material
DNA extraction of T2 has conducted using DNA extraction kits SureFood Prep Basic etc (see T1)
The NucleoSpin Food + NucleoSpin gDNA Clean-up was also used for DNA extraction from T1 and T2 samples The results for 40-3-2 were 25 - 30 lower than CTAB results T1 050 +- 018 (ww) T2 058 +- 020 (ww)
AOCS 0906-B as calibrant for MON89788 in T2 also
EURL GMFF CT 0217 report
3846
Annex 3 Qualitative performance of the participants
Table A31 Performance of the participants for the qualitative identification of GM events in CT-0217
The correct answer (yes) is that the GM event has been detected in the test item
Lab 40-3-2 detected in T1 40-3-2 detected in T2 Lab 40-3-2 detected in T1 40-3-2 detected in T2
L01 yes yes L45 yes yes
L02 yes yes L46 yes yes
L03 yes yes L47 yes yes
L04 yes yes L48 yes yes
L05 yes yes L49 yes yes
L06 yes yes L50 yes yes
L07 yes yes L51 yes yes
L08 yes yes L52 yes yes
L09 yes yes L53 yes yes
L10 yes Yes L54 yes yes
L11 yes yes L55 yes yes
L12 yes yes L56 yes yes
L13 yes yes L57 yes yes
L14 yes yes L58 yes yes
L15 yes yes L59 yes yes
L16 yes yes L60 yes yes
L17 yes yes L61 yes yes
L18 yes yes L62 yes yes
L19 yes yes L63 yes yes
L20 yes yes L66 yes yes
L22 yes yes L68 yes yes
L23 yes yes L69 yes yes
L24 yes yes L70 yes yes
L25 yes yes L71 yes yes
L26 yes yes L72 yes yes
L27 yes yes L73 T1 was not analysed yes
L29 yes yes L74 yes yes
L30 yes yes L75 yes yes
L31 yes yes L76 yes yes
L32 yes yes L77 yes yes
L33 yes yes L78 yes yes
L34 yes yes L79 yes yes
L35 yes yes L80 yes yes
L36 yes yes L81 yes yes
L37 yes yes L82 yes yes
L38 yes yes L83 yes yes
L39 yes yes L84 yes yes
L40 yes yes L85 yes yes
L41 yes yes L86 yes yes
L42 yes yes L87 yes yes
L43 T1 was not analysed yes L88 yes yes
L44 yes yes L89 yes yes
Although the questionnaire was not returned by the participant the presence of the event was inferred from the quantitative result reported
L10 did not fill in the questionnaire but reported a larger than 01 result for T1 and T2
EURL GMFF CT 0217 report
3946
Annex 4 Participants quantitative performance
The z and ζ scores of all laboratories are reported in Tables A41 and A42 and in Figures
A41 and A42 for 40-3-2 soybean in T1 and T2 respectively For consistency the
reported results are shown with two decimals the performance scores with one decimal
The z scores are displayed in green (satisfactory) orange (questionable) or red cells
(unsatisfactory)
Table A41 Quantitative results (in mm ) and performance scores of participants of CT-0217 for 40-3-2 soybean in chicken feed (T1)
Lab1 Category xi U k2 Log(xi) u(xi) u(xi-log) z score ζ score3
L01 NRL120 064 008 200 -019 004 003 -10 -28
L02 NRL882 057 002 200 -024 001 001 -15 -67
L03 Non-NRL 073 1520 200 -014 760 452 -04 00
L04 Non-NRL 075
-012 000 000 -03 -13
L05 NRL120 073 007 257 -014 003 002 -04 -15
L06 NRL882 075 021 200 -012 011 006 -03 -04
L07 NRL882 065 013 200 -019 007 004 -09 -19
L08 NRL120 062 023 200 -021 012 008 -11 -13
L09 NRL882 081 027 200 -009 014 007 01 01
L12 Non-NRL 100 051 200 000 026 011 10 09
L13 NRL882 094 019 173 -003 011 005 07 13
L14 Non-NRL 063
-020 000 000 -10 -50
L15 NRL882 110 011 200 004 005 002 14 46
L16 Non-NRL 117
007 000 000 17 80
L17 NRL882 072 010 200 -014 005 003 -05 -12
L18 Non-NRL 040
-040 000 000 -30 -145
L19 Non-NRL 115 063 173 006 036 014 16 11
L20 NRL120 108 032 200 003 016 006 13 19
L22 Non-NRL 051 030 223 -029 013 011 -20 -17
L23 Non-NRL 047 009 200 -033 005 004 -23 -50
L24 NRL882 072 019 200 -014 010 006 -05 -07
L25 Non-NRL 120
008 000 000 18 85
L26 NRL882 023 009 200 -064 005 008 -54 -62
L27 Non-NRL 098 015 200 -001 008 003 09 23
L29 NRL120 090 008 173 -005 005 002 05 17
L30 NRL882 045 013 200 -035 007 006 -25 -38
L31 NRL882 080 038 223 -010 017 009 00 00
L32 Non-NRL 076 039 200 -012 020 011 -02 -02
L33 NRL-120 057 014 200 -024 007 005 -15 -26
L34 NRL120 061 016 200 -021 008 006 -12 -19
L35 NRL882 097 027 200 -001 014 006 08 13
L36 Non-NRL 090 030 200 -005 015 007 05 07
L37 NRL120 065 026 200 -019 013 009 -09 -10
L38 NRL120 093 014 237 -003 006 003 07 19
L39 Non-NRL 112
005 000 000 15 71
L40 NRL882 053 008 200 -028 004 003 -18 -46
L41 NRL120 080 003 200 -010 002 001 00 00
L42 NRL882 104 031 200 002 016 006 11 17
L44 NRL120 084 007 257 -008 003 001 02 09
L45 NRL882 065 018 200 -019 009 006 -09 -14
L46 NRL882 081 018 200 -009 009 005 01 01
L47 NRL882 141 027 173 015 016 005 25 47
L48 NRL882 059 028 200 -023 014 010 -13 -13
L49 Non-NRL 089 031 200 -005 016 008 05 06
L50 NRL120 073 005 200 -014 003 001 -04 -15
L51 Non-NRL 077 049 200 -011 025 014 -02 -01
L52 Non-NRL 091 012 200 -004 006 003 06 16
L53 Non-NRL 043 081 200 -037 041 041 -27 -07
L54 NRL882 074 035 200 -013 018 010 -03 -03
L55 Non-NRL 076 019 173 -012 011 006 -02 -03
EURL GMFF CT 0217 report
4046
Lab1 Category xi U k2 Log(xi) u(xi) u(xi-log) z score ζ score3
L56 NRL882 115 022 173 006 013 005 16 30
L57 NRL120 075 020 200 -012 010 006 -03 -04
L58 NRL120 089 016 200 -005 008 004 05 11
L59 NRL882 137 038 200 014 019 006 23 37
L60 NRL882 068 017 200 -017 009 005 -07 -12
L61 Non-NRL 065
-019 000 000 -09 -43
L62 NRL120 130 037 237 011 016 005 21 38
L63 Non-NRL 088 006 200 -006 003 001 04 16
L64 NRL882 081 024 173 -009 014 007 01 01
L65 Non-NRL 116 065 200 006 033 012 16 13
L66 NRL882 048 024 200 -032 012 011 -22 -20
L68 NRL882 139 015 200 014 008 002 24 77
L69 Non-NRL 010 004 200 -101 002 008 -91 -105
L70 Non-NRL 057 010 200 -024 005 004 -15 -34
L72 NRL882 108 032 200 003 016 007 13 19
L74 NRL882 075 019 200 -012 010 005 -03 -05
L75 Non-NRL 862
094 000 000 103 499
L76 NRL882 099 038 200 000 019 008 09 11
L77 NRL120 075 009 226 -012 004 002 -03 -09
L78 NRL120 059 006 300 -023 002 001 -13 -52
L79 Non-NRL 046
-034 000 000 -24 -116
L80 NRL120 071 024 200 -015 012 007 -05 -07
L81 NRL882 071 028 200 -015 014 009 -05 -06
L82 NRL120 092 015 200 -004 008 004 06 15
L83 NRL120 114 013 173 006 008 003 15 44
L84 Non-NRL 071 030 200 -015 015 009 -05 -05
L85 NRL882 074 031 201 -013 015 009 -03 -04
L86 Non-NRL 066 022 200 -018 011 007 -08 -11
L87 NRL882 085 015 200 -007 008 004 03 06
L88 NRL-120 lt0044
L89 NRL882 079 022 200 -010 011 006 -01 -01
1 One NRL882 (L73) did not report a quantitative result for 40-3-2 in T1 because T1 is out of scope of the laboratory 2 If the k factor was not reported by the laboratory a value of 173 was assigned (radic3) for calculation of the ζ score 3 The ζ scores are provided for information only with indicative of a questionable score and of an unsatisfactory score 4 The less than value reported by the laboratory is considered unsatisfactory
EURL GMFF CT 0217 report
4146
Table A42 Quantitative results (in mm ) and performance scores of participants of CT-0217 for
40-3-2 soybean in soybean flour (T2)
Lab1 Category xi U k2 Log(xi) u(xi) u(xi-log) z score ζ score3
L01 NRL120 071 007 200 -015 004 002 -03 -12
L02 NRL882 081 003 200 -009 002 001 03 19
L03 Non-NRL 088 1520 200 -006 760 375 06 00
L04 Non-NRL 089
-005 000 000 07 56
L05 NRL120 075 005 257 -012 002 001 -01 -04
L06 NRL882 080 022 200 -010 011 006 02 04
L07 NRL882 076 009 200 -012 005 003 00 00
L08 NRL120 042 016 200 -038 008 008 -26 -31
L09 NRL882 081 027 200 -009 014 007 03 04
L12 Non-NRL 076 039 200 -012 020 011 00 00
L13 NRL882 069 011 173 -016 006 004 -04 -10
L14 Non-NRL 075
-012 000 000 -01 -05
L15 NRL882 084 011 200 -008 005 003 04 14
L16 Non-NRL 088
-006 000 000 06 52
L17 NRL882 075 010 200 -012 005 003 -01 -02
L18 Non-NRL 034
-047 000 000 -35 -287
L19 Non-NRL 089 016 173 -005 009 005 07 15
L20 NRL120 104 031 200 002 016 006 14 21
L22 Non-NRL 081 026 223 -009 012 006 03 04
L23 Non-NRL 064 012 200 -019 006 004 -08 -18
L24 NRL882 079 021 200 -010 011 006 02 03
L25 Non-NRL 085
-007 000 000 05 39
L26 NRL882 117 039 200 007 020 007 19 25
L27 Non-NRL 118 018 200 007 009 003 19 54
L29 NRL120 078 004 173 -011 002 001 01 06
L30 NRL882 069 020 200 -016 010 006 -04 -07
L31 NRL882 096 077 233 -002 033 015 10 07
L32 Non-NRL 090 039 200 -005 020 009 07 08
L33 NRL-120 078 004 200 -011 002 001 01 06
L34 NRL120 073 014 200 -014 007 004 -02 -04
L35 NRL882 095 027 200 -002 014 006 10 15
L36 Non-NRL 077 003 200 -011 002 001 01 03
L37 NRL120 075 010 200 -012 005 003 -01 -02
L38 NRL120 119 008 237 008 003 001 19 112
L39 Non-NRL 062
-021 000 000 -09 -73
L40 NRL882 045 008 200 -035 004 004 -23 -56
L41 NRL120 087 002 200 -006 001 000 06 44
L42 NRL882 068 020 200 -017 010 006 -05 -08
L43 Non-NRL 065
-019 000 000 -07 -56
L44 NRL120 074 006 220 -013 003 002 -01 -06
L45 NRL882 073 021 200 -014 011 006 -02 -03
L46 NRL882 081 018 200 -009 009 005 03 05
L47 NRL882 062 012 173 -021 007 005 -09 -18
L48 NRL882 074 035 173 -013 020 012 -01 -01
L49 Non-NRL 073 026 200 -014 013 008 -02 -02
L50 NRL120 081 007 200 -009 004 002 03 12
L51 Non-NRL 068 044 200 -017 022 014 -05 -03
L52 Non-NRL 073 011 200 -014 006 003 -02 -05
L53 Non-NRL 058 081 200 -024 041 030 -12 -04
L54 NRL882 073 026 200 -014 013 008 -02 -02
L55 Non-NRL 072 018 173 -014 010 006 -02 -04
L56 NRL882 066 018 173 -018 010 007 -06 -09
L57 NRL120 060 020 200 -022 010 007 -10 -14
L58 NRL120 067 011 200 -017 006 004 -06 -15
L59 NRL882 076 022 200 -012 011 006 00 00
L60 NRL882 080 020 200 -010 010 005 02 04
L61 Non-NRL 050
-030 000 000 -18 -150
EURL GMFF CT 0217 report
4246
Lab1 Category xi U k2 Log(xi) u(xi) u(xi-log) z score ζ score3
L62 NRL120 075 012 245 -012 005 003 -01 -02
L63 Non-NRL 075 004 200 -012 002 001 -01 -04
L64 NRL882 078 023 173 -011 013 007 01 01
L65 Non-NRL 051 023 200 -029 012 010 -17 -18
L66 NRL882 073 024 200 -014 012 007 -02 -02
L68 NRL882 091 011 200 -004 006 003 08 27
L69 Non-NRL 092 035 200 -004 018 008 08 10
L70 Non-NRL 050 009 200 -030 005 004 -18 -45
L72 NRL882 092 028 200 -004 014 007 08 12
L73 NRL882 092 030 200 -004 015 007 08 11
L74 NRL882 064 013 200 -019 007 004 -08 -16
L75 Non-NRL 644
081 000 000 93 760
L76 NRL882 056 099 200 -025 050 038 -13 -03
L77 NRL120 054 006 226 -027 003 002 -15 -61
L78 NRL120 065 001 300 -019 000 000 -07 -55
L79 Non-NRL 071
-015 000 000 -03 -25
L80 NRL120 095 030 200 -002 015 007 10 14
L81 NRL882 077 032 200 -011 016 009 01 01
L82 NRL120 102 032 200 001 016 007 13 18
L83 NRL120 084 005 173 -008 003 001 04 22
L84 Non-NRL 045 030 200 -035 015 014 -23 -16
L85 NRL882 082 015 212 -009 007 004 03 08
L86 Non-NRL 073 024 200 -014 012 007 -02 -02
L87 NRL882 077 012 200 -011 006 003 01 01
L88 NRL120 065 020 200 -019 010 007 -07 -10
L89 NRL882 077 021 200 -011 011 006 01 01
1 All participating NRL882 reported a quantitative result for 40-3-2 soybean in T2 2 If the k factor was not reported by the laboratory a value of 173 was assigned (radic3) for calculation of the ζ score 3 The ζ scores are provided for information only with indicative of a questionable score and of an unsatisfactory score
EURL GMFF CT 0217 report 4346
Figure A41 Laboratory results for soybean event 40-3-2 in test item 1 and kernel density distribution (insert)
The horizontal full line shows the assigned value (on the log scale) the dashed black lines represent the expanded measurement uncertainty of the assigned value and the wider interval (dashed red lines) represents the limits of satisfaction (|z|le 20) Laboratory results are shown with the expanded measurement uncertainties (when reported) the expanded measurement uncertainty of L03 is out of scale
EURL GMFF CT 0217 report 4446
Figure A42 Laboratory results for soybean event 40-3-2 in test item 2 and kernel density distribution (insert)
The horizontal full line shows the assigned value (on the log scale) the dashed black lines represent the expanded measurement uncertainty of the assigned value and the wider interval (dashed red lines) represents the limits of satisfaction (|z|le 20) Laboratory results are shown with the expanded measurement uncertainties (when reported) the expanded measurement uncertainty of L03 is out of scale
Europe Direct is a service to help you find answers
to your questions about the European Union
Freephone number ()
00 800 6 7 8 9 10 11 () The information given is free as are most calls (though some operators phone boxes or hotels may
charge you)
More information on the European Union is available on the internet (httpeuropaeu)
HOW TO OBTAIN EU PUBLICATIONS
Free publications
bull one copy
via EU Bookshop (httpbookshopeuropaeu)
bull more than one copy or postersmaps
from the European Unionrsquos representations (httpeceuropaeurepresent_enhtm) from the delegations in non-EU countries (httpeeaseuropaeudelegationsindex_enhtm) by contacting the Europe Direct service (httpeuropaeueuropedirectindex_enhtm) or calling 00 800 6 7 8 9 10 11 (freephone number from anywhere in the EU) () () The information given is free as are most calls (though some operators phone boxes or hotels may charge you)
Priced publications
bull via EU Bookshop (httpbookshopeuropaeu)
KJ-N
A-2
8873-E
N-N
doi 102760461562
ISBN 978-92-79-76303-8
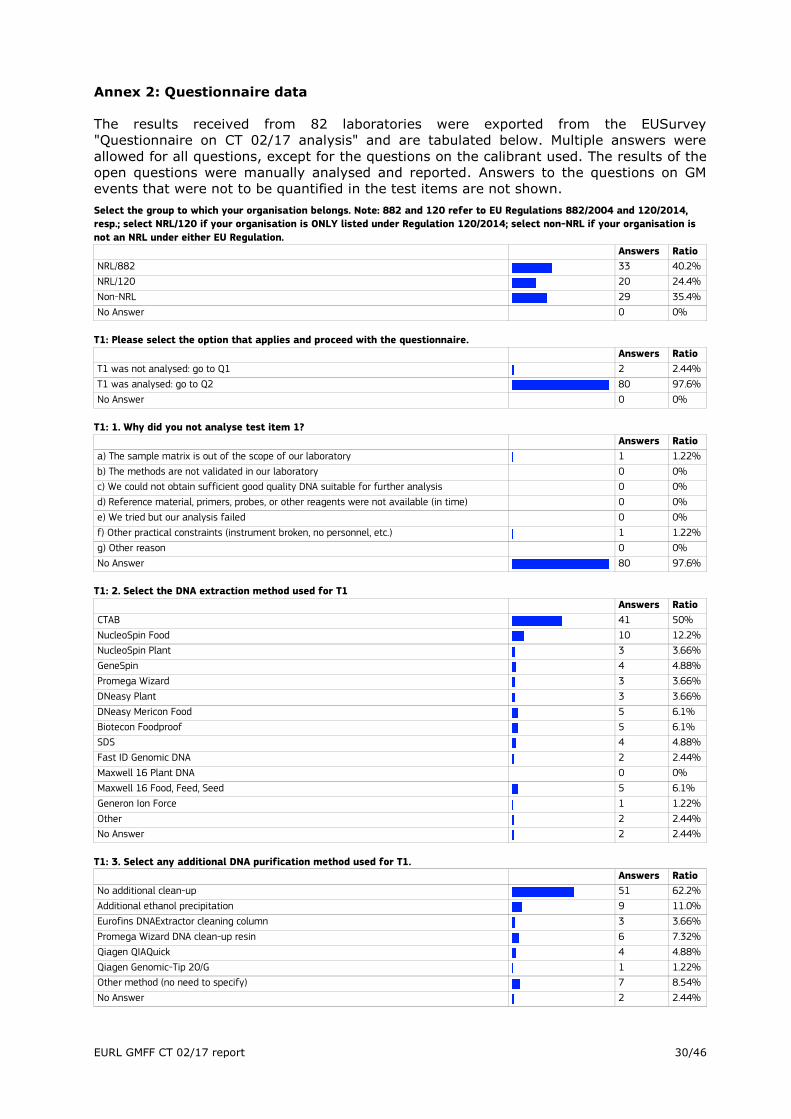
EURL GMFF CT 0217 report
4246
Lab1 Category xi U k2 Log(xi) u(xi) u(xi-log) z score ζ score3
L62 NRL120 075 012 245 -012 005 003 -01 -02
L63 Non-NRL 075 004 200 -012 002 001 -01 -04
L64 NRL882 078 023 173 -011 013 007 01 01
L65 Non-NRL 051 023 200 -029 012 010 -17 -18
L66 NRL882 073 024 200 -014 012 007 -02 -02
L68 NRL882 091 011 200 -004 006 003 08 27
L69 Non-NRL 092 035 200 -004 018 008 08 10
L70 Non-NRL 050 009 200 -030 005 004 -18 -45
L72 NRL882 092 028 200 -004 014 007 08 12
L73 NRL882 092 030 200 -004 015 007 08 11
L74 NRL882 064 013 200 -019 007 004 -08 -16
L75 Non-NRL 644
081 000 000 93 760
L76 NRL882 056 099 200 -025 050 038 -13 -03
L77 NRL120 054 006 226 -027 003 002 -15 -61
L78 NRL120 065 001 300 -019 000 000 -07 -55
L79 Non-NRL 071
-015 000 000 -03 -25
L80 NRL120 095 030 200 -002 015 007 10 14
L81 NRL882 077 032 200 -011 016 009 01 01
L82 NRL120 102 032 200 001 016 007 13 18
L83 NRL120 084 005 173 -008 003 001 04 22
L84 Non-NRL 045 030 200 -035 015 014 -23 -16
L85 NRL882 082 015 212 -009 007 004 03 08
L86 Non-NRL 073 024 200 -014 012 007 -02 -02
L87 NRL882 077 012 200 -011 006 003 01 01
L88 NRL120 065 020 200 -019 010 007 -07 -10
L89 NRL882 077 021 200 -011 011 006 01 01
1 All participating NRL882 reported a quantitative result for 40-3-2 soybean in T2 2 If the k factor was not reported by the laboratory a value of 173 was assigned (radic3) for calculation of the ζ score 3 The ζ scores are provided for information only with indicative of a questionable score and of an unsatisfactory score
EURL GMFF CT 0217 report 4346
Figure A41 Laboratory results for soybean event 40-3-2 in test item 1 and kernel density distribution (insert)
The horizontal full line shows the assigned value (on the log scale) the dashed black lines represent the expanded measurement uncertainty of the assigned value and the wider interval (dashed red lines) represents the limits of satisfaction (|z|le 20) Laboratory results are shown with the expanded measurement uncertainties (when reported) the expanded measurement uncertainty of L03 is out of scale
EURL GMFF CT 0217 report 4446
Figure A42 Laboratory results for soybean event 40-3-2 in test item 2 and kernel density distribution (insert)
The horizontal full line shows the assigned value (on the log scale) the dashed black lines represent the expanded measurement uncertainty of the assigned value and the wider interval (dashed red lines) represents the limits of satisfaction (|z|le 20) Laboratory results are shown with the expanded measurement uncertainties (when reported) the expanded measurement uncertainty of L03 is out of scale
Europe Direct is a service to help you find answers
to your questions about the European Union
Freephone number ()
00 800 6 7 8 9 10 11 () The information given is free as are most calls (though some operators phone boxes or hotels may
charge you)
More information on the European Union is available on the internet (httpeuropaeu)
HOW TO OBTAIN EU PUBLICATIONS
Free publications
bull one copy
via EU Bookshop (httpbookshopeuropaeu)
bull more than one copy or postersmaps
from the European Unionrsquos representations (httpeceuropaeurepresent_enhtm) from the delegations in non-EU countries (httpeeaseuropaeudelegationsindex_enhtm) by contacting the Europe Direct service (httpeuropaeueuropedirectindex_enhtm) or calling 00 800 6 7 8 9 10 11 (freephone number from anywhere in the EU) () () The information given is free as are most calls (though some operators phone boxes or hotels may charge you)
Priced publications
bull via EU Bookshop (httpbookshopeuropaeu)
KJ-N
A-2
8873-E
N-N
doi 102760461562
ISBN 978-92-79-76303-8
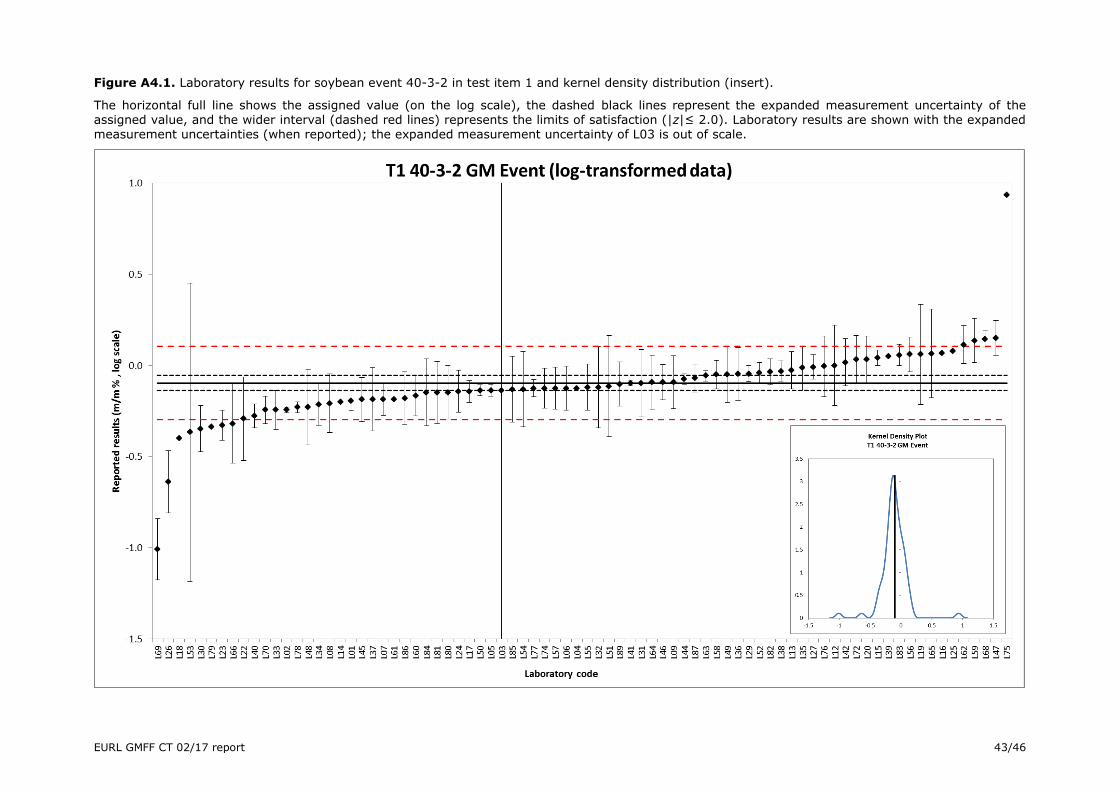
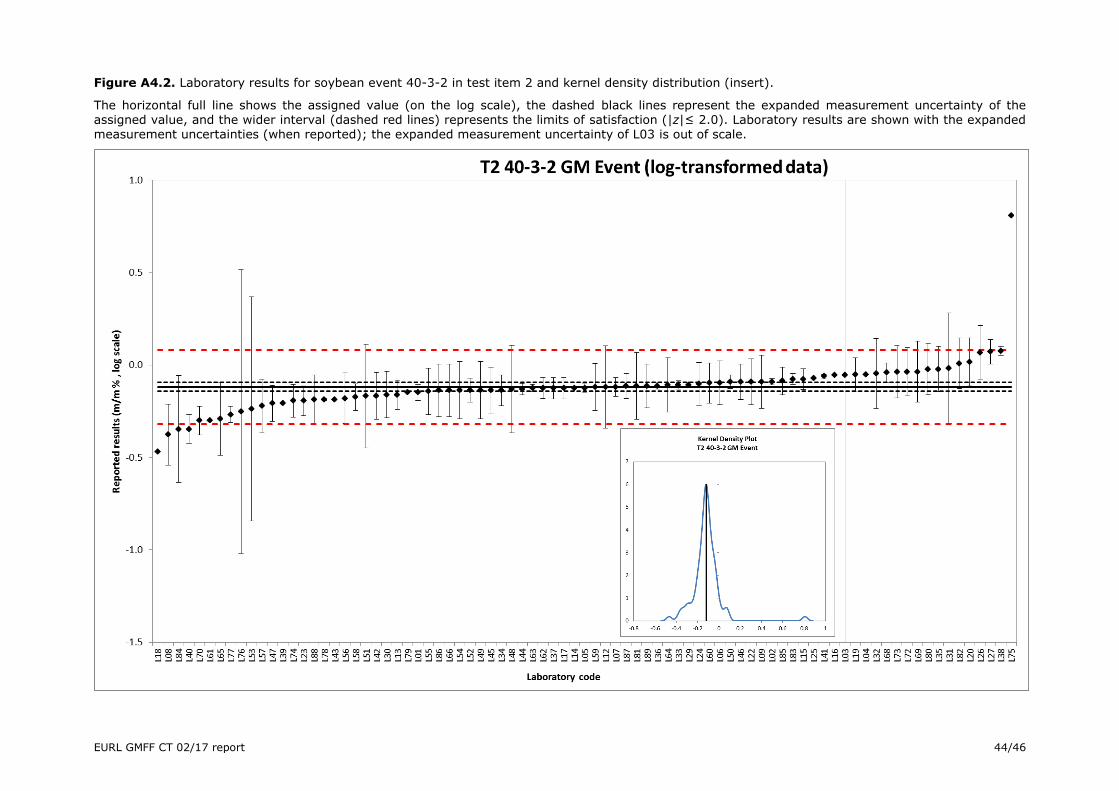

KJ-N
A-2
8873-E
N-N
doi 102760461562
ISBN 978-92-79-76303-8