eurl-hm-23 proficiency test report - european commission · this publication is a technical report...
TRANSCRIPT

1
Pieter Dehouck, Ioannis Fiamegkos, Hakan Emteborg, Jean Charoud-Got, James Snell, Aneta Cizek-Stroh and Piotr Robouch
Determination of total As, Cd, Pb, Hgand inorganic As in palm kernel expeller
EURL-HM-23 Proficiency Test Report
2016
JRC 103688
This publication is a Technical report by the Joint Research Centre (JRC), the European Commission’s science and knowledge service. It aims to provide evidence-based scientific support to the European policy-making process. The scientific output expressed does not imply a policy position of the European Commission. Neither the European Commission nor any person acting on behalf of the Commission is responsible for the use which might be made of this publication. Contact information Name: Piotr Robouch Address: Retieseweg, 111 – 2440 Geel, Belgium E-mail: [email protected] Tel.: JRC Science Hub https://ec.europa.eu/jrc JRC 103688
Brussels, Belgium: European Commission, 2016 © European Union, 2016 Reproduction is authorised provided the source is acknowledged. How to cite: Pieter Dehouck, Ioannis Fiamegkos, Hakan Emteborg, Jean Charoud-Got, James Snell, Aneta Cizek-Stroh and Piotr Robouch; "EURL-HM-23 Proficiency Test Report", Technical Report JRC 103688 All images © European Union 2016, except: Cover Page, Vikusha, image reference: 91449685, 2016. Source: [istockphoto.com]

EURL-HM-23 Proficiency test report
Determination of total As, Cd, Pb, Hg and inorganic As in palm kernel expeller
Pieter Dehouck, Ioannis Fiamegkos, Hakan Emteborg, Jean Charoud-Got, James Snell, Aneta Cizek-Stroh and Piotr Robouch

Table of contents Executive summary .............................................................................................. 1 1 Introduction ................................................................................................... 2 2 Scope ........................................................................................................... 2 3 Set up of the exercise ..................................................................................... 2
3.1 Time frame .............................................................................................. 2 3.2 Confidentiality .......................................................................................... 2 3.3 Distribution .............................................................................................. 3 3.4 Instructions to participants ......................................................................... 3
4 Test item ...................................................................................................... 3 4.1 Preparation .............................................................................................. 3 4.2 Homogeneity and stability .......................................................................... 4
5 Assigned values and corresponding uncertainties ................................................ 4 5.1 Assigned values ........................................................................................ 4 5.2 Associated uncertainties ............................................................................. 6 5.3 Standard deviation of the proficiency test assessment, σpt .............................. 7
6 Evaluation of results ....................................................................................... 7 6.1 Scores and evaluation criteria ..................................................................... 7 6.2 General observations ................................................................................. 9 6.3 Laboratory results and scorings ................................................................... 9
6.3.1 Performances ...................................................................................... 9 6.3.2 Uncertainties .................................................................................... 10 6.3.3 Compliance assessment ...................................................................... 11 6.3.4 Additional information from the questionnaire ........................................ 12
7 Conclusion ................................................................................................... 13 Acknowledgements ............................................................................................ 14 Annexes ........................................................................................................... 17 Annex 1: List of abbreviations .............................................................................. 18 Annex 2: JRC web announcement ........................................................................ 19 Annex 3: Invitation letter to NRLs ........................................................................ 20 Annex 4: Test item accompanying letter ................................................................ 21 Annex 5: Confirmation of receipt form .................................................................. 22 Annex 6: Questionnaire ...................................................................................... 23 Annex 7: Homogeneity and stability results ........................................................... 25 Annex 8: Results for total As ............................................................................... 26 Annex 9: Results for Cd ...................................................................................... 28 Annex 10: Results for Pb ..................................................................................... 30 Annex 11: Results for Hg .................................................................................... 32 Annex 12: Results for iAs .................................................................................... 34 Annex 13: Overview of performance versus technique ............................................. 36 Annex 14: Conformity as expressed by the participants. .......................................... 37 Annex 15: Experimental details as reported by the participants ................................ 38

1
Executive summary The European Union Reference Laboratory for Heavy Metals in Feed and Food (EURL-HM) organised a proficiency test (EURL-HM-23) for the determination of total As, Cd, Pb, Hg, and inorganic As (iAs) mass fractions in palm kernel expeller to support Directive 2002/32/EC on undesirable substances in animal feed. This PT was open only to National Reference Laboratories (NRLs).
The EURL-HM-23 test item was a palm kernel expeller spiked with As, Cd, Hg and Pb. The homogeneity and stability of the test item were evaluated and the assigned values were derived from the results reported by the selected expert laboratories.
Thirty four National Reference Laboratories from thirty countries (all EU member states plus Iceland and Norway) registered to the exercise and reported results.
Laboratory results were rated using z- and zeta (ζ-) scores in accordance with ISO 13528:2015. The following relative standard deviations for proficiency assessment (σpt) were set according to the modified Horwitz equation: 15% for total As and iAs; 16% for Cd; 17% for Pb and 22% for Hg.
More than 87% of the participating NRLs reported satisfactory results (according to the z-score) for total As, Cd, Pb and Hg, and more than 76% for iAs, thus confirming their ability in monitoring maximum levels set by the EU Directive 2002/32/EC.
Most of the laboratories provided realistic estimates of their measurement uncertainties.

2
1 Introduction Palm kernel expeller (PKE) is a by-product from the crushing and expelling of oil from the kernel (seed) of palm tree fruits. Because of its medium-grade protein, high fibre, good level of residual oil and high palmitic acid, it is widely used in compound feeds for adult ruminant livestock such as dairy cow, beef cow and sheep [1],[2],[3].
The European Directive 2002/32/EC on undesirable substances in animal feed [4] set a maximum level for arsenic in PKE of 4 mg kg-1 relative to a feed with a moisture content of 12 %. In 2011 several notifications were introduced in the the Rapid Alert System for Food and Feed (RASFF) related to high arsenic content in PKE to be imported into a Member State (https://webgate.ec.europa.eu/rasff-window/).
The European Union Reference Laboratory for Heavy Metals in Feed and Food (EURL-HM), hosted by the Joint Research Centre in Geel (JRC-Geel), organised the proficiency test (PT) EURL-HM-23 for the determination of total arsenic (As), cadmium (Cd), lead (Pb), mercury (Hg) and inorganic Arsenic (iAs) mass fractions in PKE. This PT was agreed with the Directorate General for Health and Food Safety (DG SANTE) in the annual work programme 2016 of the EURL-HM.
This report summarises the outcome of this PT.
2 Scope As stated in Regulation (EC) No 882/2004 [5] one of the core duties of EURLs is to organise interlaboratory comparisons for the benefit of NRLs.
The present PT aims to assess the performance of NRLs in the determination of total As, Cd, Pb, Hg and iAs mass fractions in a PKE dry powder.
In addition, participants were asked to evaluate the conformity of the analysed material according to the maximum levels (MLs) set in legislation.
The reported results were assessed following the administrative and logistic procedures of the JRC Unit in charge of the EURL-HM, which is accredited for the organisation of PTs according to ISO 17043:2010 [6].
This PT is identified as EURL-HM-23.
3 Set up of the exercise
3.1 Time frame The organisation of the EUR-HM-23 exercise was agreed upon by the NRL network at the 10th EURL-HM Workshop held in Brussels on September 28-29, 2015. The exercise was announced on the JRC webpage on March 18, 2016 (Annex 2) and an invitation letter was sent (via e-mail) to all NRLs of the network on April 4, 2016 (Annex 3). The registration deadline was set to April 29, 2016. Samples were sent to participants on May 12, 2016. Dispatch was monitored by the PT coordinator using the messenger's parcel tracking system on the internet. The deadline for reporting of results was set to June 30, 2016.
3.2 Confidentiality The procedures used for the organisation of PTs, are accredited according to ISO 17043:2010 [6] and guarantee that the identity of the participants and the information provided by them is treated as confidential.

3
3.3 Distribution Each participant received:
One bottle of the test item (approx. 20 g of material);
The "Test item accompanying letter" (Annex 4); and
A "Confirmation of receipt form" to be sent back to JRC-Geel after receipt of the test item (Annex 5).
3.4 Instructions to participants Detailed instructions were given to participants in the "Test item accompanying letter" mentioned above. Measurands were defined as "the mass fractions of total As, Cd, Pb, Hg and iAs in palm kernel expeller dry powder".
Participants were asked to perform two or three independent measurements, to report their calculated mean (xi) and the associated expanded measurement uncertainty (U(xi)) together with the coverage factor (k) and analytical technique used for the analysis.
Results were to be reported relative to a feed with a moisture content of 12 % as required by Directive 2002/32/EC.
Upon specific request from DG SANTE, no instructions were provided by the EURL-HM to laboratories on how to perform the moisture corrections necessary for reporting, since official control laboratories are supposed to know the proper procedure.
Participants received an individual code to access the on-line reporting interface, to report their measurement results and to complete the related questionnaire. A dedicated questionnaire was used to gather additional information related to measurements and laboratories (Annex 6).
Participants were informed that the procedure used for the analysis should resemble as closely as possible their routine procedures for this type of matrix/analytes and mass fraction levels.
The laboratory codes were given randomly and communicated to the participants by e-mail.
4 Test item
4.1 Preparation The Belgian NRL (CODA-CERVA) kindly provided the starting material - 10 kg of PKE in granulated form - that was used for the preparation of the test items. The delivered material was directly stored at 4 °C until processing.
The material was first cryogenically milled using a Palla VM-KT vibrating mill from Humboldt-Wedag (Köln, Germany). After milling, the material was sieved over a 250 µm stainless steel sieve. About 8.5 kg of the fine fraction was collected and stored at 4 °C.
About 4.9 kg was mixed in a Dynamix CM-200 (WAB, Basel, Switzerland) for one hour. The material was then spiked with As, Cd, Pb and Hg: 4840.6 g of powder were placed in a 60 L plastic drum to which 10 L of MilliQ water were added to make a homogeneous suspension. Then 1 L of spike solution was added to the suspension and was stirred for 30 min. The spiked material was freeze dried in a Martin Christ model Epsilon 2-100D freeze dryer (Osterode, Germany). The freeze dried palm kernel expeller powder was mixed in a Dynamix CM-200 for one hour.

4
Portions of 20 g were manually filled into 100 ml amber glass acid-washed bottles using acid washed plastic spoons under an extraction point. The bottles were closed with acid washed inserts and screw caps.
Each vial was identified with a unique number and the name of the PT exercise.
4.2 Homogeneity and stability Measurements for the homogeneity and stability studies were performed by ALS Scandinavia AB (Luleå, Sweden).
Inductively coupled plasma mass spectrometry (ICP-MS) was used after microwave digestion (0.3-0.5 g of sample in a mixture of HNO3/H2O2) to determine the mass fractions of total As, Cd, Pb and Hg.
The statistical treatment of data was performed by the EURL-HM.
Homogeneity was evaluated according to ISO 13528:2015 [7]. The test item proved to be adequately homogeneous for the investigated analytes.
The stability study confirmed that the material was stable and the uncertainty contribution due to stability was set to zero (ust = 0) for all analytes.
The contribution from homogeneity (uhom) to the standard uncertainty of the assigned value (u(xpt)) was calculated using SoftCRM [8]. The analytical results reported by the expert laboratory and the statistical evaluation of the homogeneity and stability studies are presented in Annex 7 and Table 1.
5 Assigned values and corresponding uncertainties
5.1 Assigned values The assigned values (xpt) of the five measurands (mass fractions of total As, Cd, Pb, Hg and iAs in palm kernel expeller relative to a moisture content of 12 %), were derived from the results reported by expert laboratories, all selected on the basis of their demonstrated measurement capabilities.
The following expert laboratories analysed one or more measurands:
ALS Scandinavia AB (Luleå, Sweden); CSPA - Centro de Salud Pública de Alicante (Alicante, Spain); SCK-CEN - Studiecentrum voor Kernenergie (Mol, Belgium); UBA - Umweltbundesamt GmbH (Wien, Austria); Institute for Chemistry, University of Graz (Graz, Austria) JRC-Geel, Directorate F - Health, Consumers and Reference Materials (Geel,
Belgium) Faculty of Chemistry, University of Barcelona (Barcelona, Spain)
Expert laboratories were asked to use the method of analysis of their choice and no further requirements were imposed regarding methodology. They were also requested to report their results together with the associated expanded measurement uncertainty and with a clear and detailed description on how their measurement uncertainty was calculated. Results were to be reported relative to a feed with a moisture content of 12 % as required by Directive 2002/32/EC.

5
ALS Scandinavia used inductively coupled plasma mass spectrometry (ICP-MS) after closed microwave digestion of the sample (approx. 0.3-0.5 g in closed Teflon containers) using HNO3 and H2O2. Analyses were made according to the modified ISO 17294-1, 2 and modified US EPA Method 200.8 for the measurement of total As, Cd, Pb and Hg.
CSPA used ICP-MS after microwave digestion of the sample (approx. 0.25 g in quartz digestion vessels) using HNO3 and H2O2 for measuring total As, Cd and Pb. The measurement of Hg was performed by Direct Mercury Analyser (DMA).
SCK-CEN applied instrumental neutron activation analysis (kÓ-NAA) for the determination of total As, Cd and Hg mass fractions. Three samples of (approx. 350 mg) were transferred in standard high-density polyethylene vials and weighed. Samples were irradiated for seven hours in channel Y4 of the BR1 reactor under a thermal flux of 3 1011 n s-1 cm2 together with several IRMM-530 (Al-0.1 % Au alloy) neutron flux monitors and two reference materials (SMELLS II and NIST 1633b 'Coal fly ash') used for validation. Three spectra of each sample were collected on a k0-calibrated HPGe detector under repeatability conditions: 1 day, 2 days and 13-15 days after irradiation for the determination of As, Ca and finally Hg, respectively. Only an indicative value was reported for Hg.
UBA used ICP-MS according to ISO 17294-2 for the determination of As, Cd and Pb. The measurement of Hg was done by Cold Vapour Atomic Absorption Spectrometry (CV-AAS) according to ISO 12846, while iAs was determined using HPLC-ICP-MS according to ISO 17294-2.
The University of Graz determined total As in about 250 mg of the sample after microwave-assisted digestion with HNO3 by ICP-MS using (i) helium as the collision cell gas to remove polyatomic interferences and (ii) 74Ge and 115In as internal standards. For iAs, samples of about 500 mg were heated with a solution of CF3COOH/H2O2 (95 oC for 60 min) and analysed by HPLC-ICP-MS.
JRC-Geel analysed total As by ICP-MS; Cd and Pb by ID-ICP-MS; and Hg by CV-AAS, applying the following experimental protocols:
Samples (0.25 to 0.5 g) were digested in a Milestone Ultraclave micro-wave digestion apparatus with (i) 5 mL concentrated nitric acid (for As) or with (ii) 5 mL concentrated nitric acid and 0.5 mL of concentrated hydrofluoric acid (for Cd, Hg and Pb).
Digests for As, Cd and Pb measurement were diluted in 2 % nitric acid solution, and for Pb measurement, about 1 µg/L Tl (IRMM-649 isotopic certified reference material) was added.
As, Cd and Pb were measured on an Agilent 7500ce inductively coupled plasma mass spectrometer, using a He-filled collision cell for As measurement. Arsenic was measured by external calibration with 5 standards.
For isotope dilution measurements, samples were blended with IRMM-622 (111Cd enriched) and Inorganic Ventures (206Pb enriched) isotopic certified reference materials prior to sample digestion. For Cd isotope dilution measurements, the 113Cd/111Cd ratio was measured using digests of an unspiked sample and tabulated natural isotopic abundances as reference. For Pb measurement, the Pb molar mass was measured in an unspiked sample using the Tl internal standard (IRMM-649) as reference, and the isotope dilution measurement used the 206Pb/208Pb ratio, again using the Tl internal standard as reference.

6
Digests for Hg measurement were mixed with 1 ml of a 6 % potassium permanganate solution and a 20 % hydroxylamine solution is added until the solution is colourless. The digests were made up to about 35 mL before measurement. Hg was measured on an Analytik-Jena Zeenit 600 atomic absorption spectrometer fitted with a "Hydrea" cold-vapour generation system and Ir-coated graphite furnace for sample concentration. Sub-samples of 10 mL of digests were measured batch-wise alongside 4 standards for external calibration.
The University of Barcelona analysed iAs weighing about 0.2 g of test material in PTFE vessels and carrying out a microwave digestion with a HNO3/H2O2 solution followed by an HPLC-ICP-MS analysis.
5.2 Associated uncertainties The associated standard uncertainties of the assigned values (u(xpt)) were calculated following the law of uncertainty propagation, combining the standard measurement uncertainty of the characterization (uchar) with the standard uncertainty contributions from homogeneity (uhom) and stability (ust), in compliance with ISO Guide 35 [9].
The uncertainty uchar is estimated according to the recommendations of ISO Guide 35 [9]:
√
where "s" refers to the standard deviation of the mean values obtained by the expert laboratories and "p" refers to the number of expert laboratories.
Figure 1: Assigned values for EURL-HM-23. Circles and error bars represent reported values by the retained expert laboratories (xi± 2ui). The solid line represents the assigned value (xpt) while the dashed lines represent the assigned range (xpt ± 2 u(xpt))

7
5.3 Standard deviation of the proficiency test assessment, σpt All the relative standard deviations for PT assessment (σpt, in mg kg-1 and %) presented in Table 1 were calculated using the Horwitz equation modified by Thompson [10].
Table 1: Results and associated expanded measurement uncertainties (as) reported by expert laboratories; the assigned values (xpt, u(xpt) and U(xpt)(k=2)); the standard uncertainties (uchar, ust and uhom);and the standard deviation for PT assessment σpt. Values are expressed in mg kg-1 relative to PKE with a moisture content of 12 %.
tot-As Cd Pb Hg iAs
Expert 1 2.2 ± 0.15 1.4 ± 0.095 0.83 ± 0.066 0.046 ± 0.0046 2.0 ± 0.2
Expert 2 2.14 ± 0.21 1.21 ± 0.12 0.902 ± 0.09 0.0488 ± 0.0049
Expert 3 2.28 ± 0.103 1.27 ± 0.0521 0.822 ± 0.0127 0.0484 ± 0.00227
Expert 4 2.624 ± 0.121 1.589 ± 0.247
Expert 5 2.28 ± 0.4 1.29 ± 0.019 0.8461 ± 0.013 0.0493 ± 0.007
Expert 6 2.17 ± 0.1 2.07 ± 0.12
Expert 7 1.97 ± 0.16
xpt 2.28 1.35 0.850 0.0481 2.01
uchar 0.072 0.067 0.018 0.00073 0.030
uhom 0.037 0.015 0.008 0.00080 0.032
ust 0 0 0 0 0
u(xpt) 0.081 0.068 0.020 0.00109 0.044
U(xpt)* 0.16 0.14 0.039 0.0022 0.09
σpt 0.34 0.22 0.145 0.0106 0.30
σpt (%) 15% 16% 17% 22% 15%
u(xpt)/σpt 0.24 0.32 0.14 0.10 0.14
6 Evaluation of results
6.1 Scores and evaluation criteria Individual laboratory performance was expressed in terms of z- and ζ-scores according to ISO 13528:2015 [7]:
pt
ptii
xxz
σ
Eq. 1
)()( 22
pti
ptii
xuxu
xx
Eq. 2

8
where: xi is the measurement result reported by a participant;
u(xi) is the standard measurement uncertainty reported by a participant;
xpt is the assigned value;
u(xpt) is the standard measurement uncertainty of the assigned value;
pt is the standard deviation for proficiency test assessment.
The interpretation of the z- and ζ- scores is done according ISO 13528:2015 [7]:
|score| ≤ 2 satisfactory performance (green in Annexes 8-13,15)
2 < |score| < 3 questionable performance (yellow in Annexes 8-13,15)
|score| ≥ 3 unsatisfactory performance (red in Annexes 8-13,15)
The z-score compares the participant's deviation from the assigned value with the standard deviation for proficiency test assessment (pt) used as common quality criterion.
The ζ-score states whether the laboratory's result agrees with the assigned value within the respective uncertainty. The denominator is the combined uncertainty of the assigned value u(xpt) and the measurement uncertainty as stated by the laboratory u(xi). The ζ-score includes all parts of a measurement result, namely the expected value (assigned value), its measurement uncertainty in the unit of the result as well as the uncertainty of the reported values. An unsatisfactory ζ-score can either be caused by an inappropriate estimation of the concentration, or of its measurement uncertainty, or both.
The standard measurement uncertainty of the laboratory u(xi) was obtained by dividing the reported expanded measurement uncertainty by the reported coverage factor, k. When no uncertainty was reported, it was set to zero (u(xi) = 0). When k was not specified, the reported expanded measurement uncertainty was considered as the half-width of a rectangular distribution; u(xi) was then calculated by dividing this half-width by √3, as recommended by Eurachem and CITAC [11].
Uncertainty estimation is not trivial, therefore an additional assessment was provided to each laboratory reporting measurement uncertainty, indicating how reasonable their measurement uncertainty estimation was.
The standard measurement uncertainty from the laboratory u(xi) is most likely to fall in a range between a minimum and a maximum allowed uncertainty (Case "a": umin ≤ ulab≤ umax). umin is set to the standard uncertainties of the assigned values u(xpt). It is unlikely that a laboratory carrying out the analysis on a routine basis would determine the measurand with a smaller measurement uncertainty than the expert laboratories chosen to establish the assigned value. umax is set to the standard deviation accepted for the PT assessment (pt). Consequently, Case "a" becomes: u(xpt) ≤ u(xi) ≤ pt.
If u(xi) is smaller than u(xpt) (Case "b") the laboratory may have underestimated its measurement uncertainty. Such a statement has to be taken with care as each laboratory reported only measurement uncertainty, whereas the uncertainty associated with the assigned value also includes contributions for homogeneity and stability of the test item. If those are large, measurement uncertainties smaller than uref are possible and plausible.
If u(xi) is larger than pt (Case "c") the laboratory may have overestimated its measurement uncertainty. An evaluation of this statement can be made when looking at the difference between the reported value and the assigned value: if the difference is smaller than the expanded uncertainty U(xpt) then overestimation is likely. If the difference is larger but xi agrees with xpt within their respective expanded measurement uncertainties, then the measurement uncertainty is properly assessed resulting in a

9
satisfactory performance expressed as a ζ-score, though the corresponding performance, expressed as a z-score, may be questionable or unsatisfactory.
It should be pointed out that "umax" is a normative criterion when set by legislation.
6.2 General observations Thirty four NRLs from thirty countries registered to the exercise, covering all EU member states plus Iceland and Norway. All registered NRLs reported results. The participants having reported results are listed in the "Acknowledgment" section.
Thirty two (out of 34) laboratories reported results for As, Cd, Pb while thirty one laboratories for Hg. Only 21 results were reported for iAs (Table 2).
Table 2: Overview of the number of reported results per measurand (out of 34).
Reported Results Comments
As 32 (94%) No results from laboratories 020 and 034
Cd 32 (94%) No results from laboratories 020 and 034
Pb 32 (94%) Of which one "less than X" value; No results from laboratories 020 and 034
Hg 31 (91%) Of which one "less than X" value; No results from laboratories 022, 034 and 036
iAs 21 (62%) No results from 13 laboratories
6.3 Laboratory results and scorings
6.3.1 Performances Annexes 8 to 12 present the reported results as tables and graphs for each measurand, where NRLs are denoted as "0XX". The corresponding Kernel density plots, obtained using the software available from the Statistical Subcommittee of the Analytical Methods Committee of the UK Royal Society of Chemistry [12] are also included.
The laboratory performance for the "determination of total As, Cd, Pb Hg and iAs in PKE relative to 12 % moisture content" were assessed using the z- and ζ-scores, since the ISO 13528 recommendation (u(xpt) 0.3 pt) was fulfilled for all measurands.
Total (As, Cd, Pb, Hg) and iAs
Figures 1 and 2 present the laboratory performances for total As, Cd, Pb and Hg, assessed by the z- and ζ-scores. Most of the participants having reported results performed satisfactorily for these measurands: above 87% for the z-score and 77% for the ζ-scores. Twenty three laboratories (out of 34) performed satisfactorily for the determination of the four measurands (total As, Cd, Pb and Hg). Similarly, most of the participants reporting for iAs performed satisfactorily for this measurand, with 76% of the z-scores and ζ-scores ≤ 2.
For As and Cd no direct correlations could be found between the analytical methods used by the laboratories and the quality of the reported results (see Annex 14).
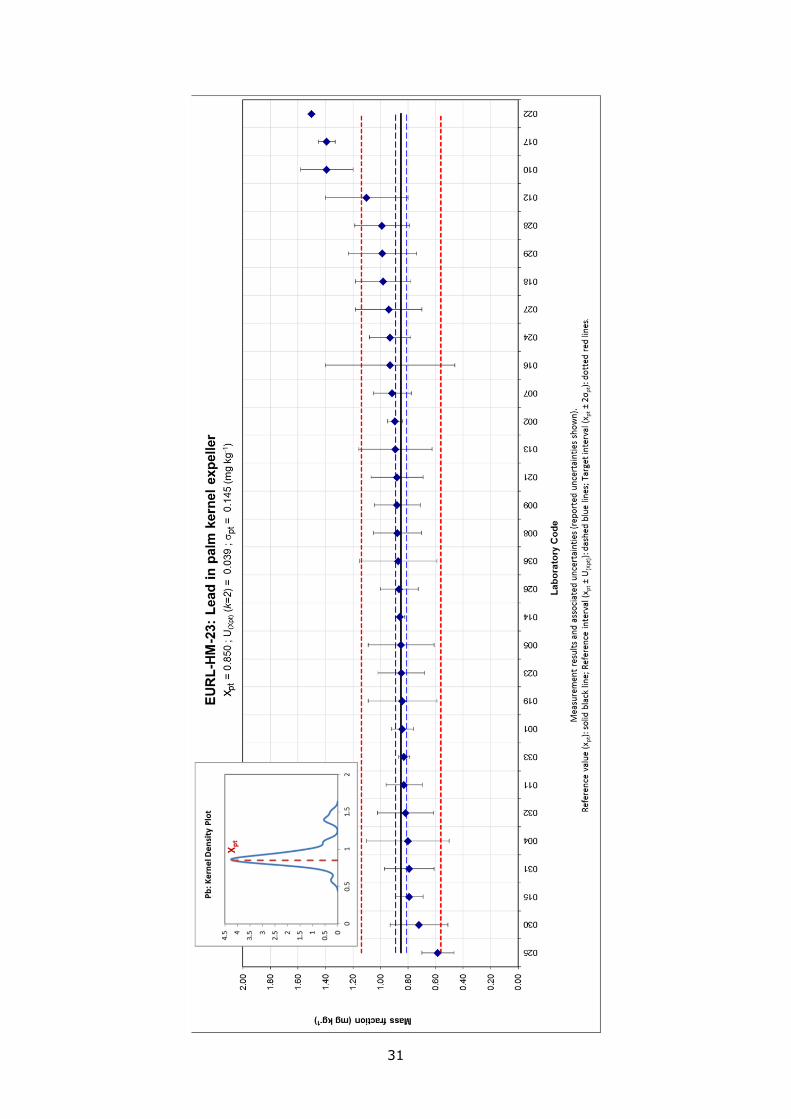
Two unsatisfactory performances and a truncated value ("less than") were obtained for Pb applying AAS. This may be attributed to the relatively low level of Pb in the test item (0.85 mg kg-1) compared to the higher MRL for Pb in animal feed (10 mg kg-1). Annex 15

10
shows that for Pb LODs for AAS methods are generally higher than those for ICP-MS methods. Nevertheless, laboratory 003 may consider re-evaluating the high limit of quantification reported ("less than 1.8").
Similarly, two laboratories using CV-AAS reported the highest Hg results leading to z-scores above 3. Two other results for Hg obtained by AAS were flagged as unsatisfactory and questionable.
Figure 2:
Overview of laboratory performance per measurand according to z-scores.
Corresponding number of laboratories indicated in the graph.
Satisfactory (green); Questionable (yellow); Unsatisfactory (orange)
Figure 3:
Overview of laboratory performance per measurand according to ζ-scores.
Corresponding number of laboratories indicated in the graph.
Satisfactory (green); Questionable (yellow); Unsatisfactory (orange)
Truncated values
Two "less than X" values were reported, one for Pb and one for Cd. The limit values "X" reported by the laboratories usually correspond to the limits of quantification (LOQ) or limits of detection (LOD) of the applied methods. Those reporting “less than X” values were not included in the data evaluation. However, reported “less than X” values were compared with the corresponding xpt – U(xpt). If the reported limit value “X” is lower than the corresponding xpt – U(xpt), this statement is considered incorrect, since the laboratory should have detected the respective analyte. The two "less than X" values in this exercise were correct statements.
6.3.2 Uncertainties Figure 3 presents the uncertainty assessment per measurand. Most of the participants (above 70%) reported realistic measurement uncertainty estimates for Cd, Hg, Pb and iAs (case "a": u(xpt) ≤ u(xi) ≤ σpt).
A lower number of realistic "case a" (59%) is obtained for total As. Of the 19% of underestimated "case b", three laboratories reported combined uncertainties ranging from 0.058 to 0.07 - to be compared to u(xpt) = 0.08 mg kg-1. Similarly, of the 22% of "case c", four laboratories reported combined uncertainties ranging from 0.35 to 0.37 - to be compared to pt = 0.34 mg kg-1.

11
Figure 4: Review of uncertainties reported per measurand.
Corresponding number of laboratories indicated in the graph.
Case "a" (green): u(xpt) ≤ u(xi) ≤ σpt Case "b" (yellow) u(xi) < u(xpt); Case "c" (blue)= u(xi) > σpt
6.3.3 Compliance assessment When comparing the maximum levels (MLs) - set in the European Directive 2002/32/EC for undesirable substances in animal feed - to the assigned ranges in the palm kernel expeller (Table 3), one concludes that the test item is non-compliant for cadmium (only) for which xpt – U(xpt) > ML.
Table 3: Maximum limits (MLs), assigned values and their associated expanded uncertainties. All values expressed in mg kg-1
, relative to PKE with a moisture content of 12 %.
Elements xpt ± U(xpt) MLs
As 2.28 ± 0.16 4
Cd 1.35 ± 0.14 1
Pb 0.85 ± 0.039 10
Hg 0.048 ± 0.0022 0.1 Participants were requested to assess the compliance of the test item according to Directive 2002/32/EC, and provide proper justification to support their statement. In order to assess the consistency of the laboratory compliance statement, one must consider the following three components:
1) the laboratory compliance statement (Compliant or Non-Compliant) 2) the laboratory measurement results:
- reported (or not) for the relevant analyte (Cd); - to be compared to the relevant ML: xi - Ui > ML?
3) the laboratory justification (correct, incorrect or partially incorrect). The answers received (Annex 14) are summarised in Table 4. Sixteen (out of 34) laboratories assessed correctly the test item to be non-compliant (47 % true non-compliant, TNC). Other four laboratories stated the material to be non-compliant while presenting partially incorrect justifications (12 % false non-compliant, FNC). Six laboratories assumed the material to be compliant (17 % true compliant, TC) due to either their low measurement results for Cd (cf. laboratories 003 and 036) or their large measurement uncertainty reported (cf. laboratories 004, 019, 005 and 013). Finally, four laboratories gave an inconsistent assessment (12 % false compliant, FC), while four other laboratories (12 %) did not provide any statement.

12
Table 4: Laboratory statements on the compliance assessment, laboratory measurement results for Cd compared to the ML, laboratory justifications (correct, incorrect or partially incorrect) and a categorisation of the laboratory compliance assessment into FC (false compliant), TC (true compliant), TNC (true non-compliant) and FNC (false non-compliant).
Laboratory Statement
Laboratory Measurement
Laboratory Justification
Category Nr. of labs
Comment
Compliant xi – Ui > ML Correct FC 1 025: xi > ML
None 2
No Cd result None FC 1
xi – Ui ML None TC 6
Non-Compliant xi – Ui > ML Correct TNC 16
Part. incorrect FNC 3 007: wrong ML(As); 012:wrong ML(Cd); 033: As & Hg
xi – Ui ML Part. incorrect 1 008: xi > ML
No Assessment 4
6.3.4 Additional information from the questionnaire The questionnaire was answered by all 34 participants. Different approaches were used to evaluate measurement uncertainties (Table 4). The majority of the NRLs carry out an in-house validation in order to estimate the measurement uncertainty (19 out of 34). Twenty-five out of 34 usually report uncertainty to their customers.
Laboratories were asked to report the LODs of the methods used for the determination of the five measurands. Annex 14 presents LODs, the general experimental conditions and the techniques used for the determination of total As, Cd, Pb and Hg. Large discrepancies in reported LODs are observed even among laboratories using the same technique.
Table 5: Approaches used to estimate measurement uncertainties. Multiple selections were possible.
Approach followed for uncertainty calculation Number of labs.
According to ISO-GUM 7 According to ISO 21748 0 Derived from a single-laboratory validation study 19 Determined as standard deviation of replicate measurements 8 Estimation based on judgment 1 Derived from inter-comparison data 8
According to the NORDTEST guidelines 2
Applying the Horwitz equation 1
The reported recovery factors ranged from 80 to 113 % and two main approaches were used for the determination of recoveries: spiking and use of reference materials.
All of the NRLs stated that they have an ISO/IEC 17025 accreditation and 26 NRLs confirmed they are accredited for one or more of the investigated measurands in feed.

13
For some participants, the unsatisfactory performance could be linked to a lack of experience (evaluated as number of analyses per year) for this type of analysis.
7 Conclusion The EURL-HM-23 PT was organised in 2016 to assess the analytical capabilities of the NRLs for the EU using a palm kernel expeller spiked with As, Cd, Pb and Hg as test item.
The overall performance of the participants in the determination of total As, Cd, Hg, Pb and iAs was satisfactory. This confirms the analytical capabilities of the NRLs to enforce the European Directive 2002/32/EC setting levels for undesirable substances in feed. However, 13 out 34 did not report results for iAs.
As for compliance assessment, only 47 % of the participants stated correctly (providing proper justification) that the test item was non-compliant according to the maximum level set by Directive 2002/32/EC for cadmium in palm kernel expeller. Other laboratories having reported satisfactory results should therefore improve their assessment procedure selecting relevant MLs and phrasing accurately their justification, or providing realistic (not over-estimated) measurement uncertainties.
Overall, NRLs reported good measurement uncertainty estimates, thus demonstrating the effectiveness of the various PTs and training courses organised by the EURL-HM in the past 10 years.
14
Acknowledgements
The EURL-HM wishes to thank the Belgian NRL (CODA-CERVA) for providing the palm kernel expeller granulates later processed and used as test item for this proficiency test.
The authors wish to thank colleagues from the JRC-Geel site for their valuable contributions during the preparation of the proficiency test item.
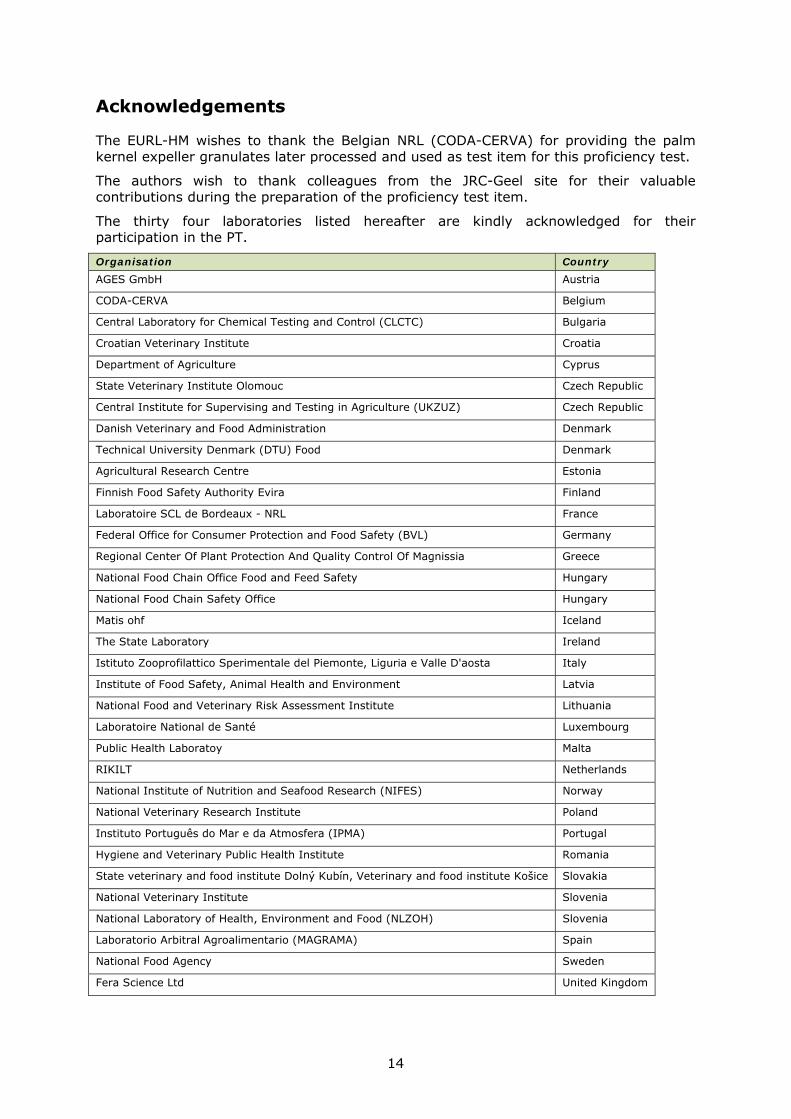
The thirty four laboratories listed hereafter are kindly acknowledged for their participation in the PT.
Organisation Country AGES GmbH Austria
CODA-CERVA Belgium
Central Laboratory for Chemical Testing and Control (CLCTC) Bulgaria
Croatian Veterinary Institute Croatia
Department of Agriculture Cyprus
State Veterinary Institute Olomouc Czech Republic
Central Institute for Supervising and Testing in Agriculture (UKZUZ) Czech Republic
Danish Veterinary and Food Administration Denmark
Technical University Denmark (DTU) Food Denmark
Agricultural Research Centre Estonia
Finnish Food Safety Authority Evira Finland
Laboratoire SCL de Bordeaux - NRL France
Federal Office for Consumer Protection and Food Safety (BVL) Germany
Regional Center Of Plant Protection And Quality Control Of Magnissia Greece
National Food Chain Office Food and Feed Safety Hungary
National Food Chain Safety Office Hungary
Matis ohf Iceland
The State Laboratory Ireland
Istituto Zooprofilattico Sperimentale del Piemonte, Liguria e Valle D'aosta Italy
Institute of Food Safety, Animal Health and Environment Latvia
National Food and Veterinary Risk Assessment Institute Lithuania
Laboratoire National de Santé Luxembourg
Public Health Laboratoy Malta
RIKILT Netherlands
National Institute of Nutrition and Seafood Research (NIFES) Norway
National Veterinary Research Institute Poland
Instituto Português do Mar e da Atmosfera (IPMA) Portugal
Hygiene and Veterinary Public Health Institute Romania
State veterinary and food institute Dolný Kubín, Veterinary and food institute Košice Slovakia
National Veterinary Institute Slovenia
National Laboratory of Health, Environment and Food (NLZOH) Slovenia
Laboratorio Arbitral Agroalimentario (MAGRAMA) Spain
National Food Agency Sweden
Fera Science Ltd United Kingdom

15
References
[1] Manufacturing tropical oil products, (2016). http://www.wilmar-international.com/our-business/tropical-oils/manufacturing/tropical-oils-products/palm-kernel-expeller/.
[2] Palm Kernel Expeller, (2016). http://www.kwalternativefeeds.co.uk/products/view-products/palm-kernel-expeller/.
[3] T.T. Sue, Quality and Characteristics of Malaysian Palm Kernel Cakes/Expellers, (2001). http://palmoilis.mpob.gov.my/publications/POD/pod34-tang.pdf.
[4] European Commission, DIRECTIVE 2002/32/EC OF THE EUROPEAN PARLIAMENT AND OF THE COUNCIL of 7 May 2002 on undesirable substances in animal feed, Off. J. Eur. Communities. L 269 (2002) 1–15. doi:2004R0726 - v.7 of 05.06.2013.
[5] Commission Regulation, (EC) No 882/2004 of the European Parliament and of the Council of 29 April 2004 on official controls performed to ensure the verification of compliance with feed and food law, animal health and animal welfare rules, Off. J. Eur. Union. L165/1 (2004).
[6] ISO/IEC 17043 “Conformity assessment – General requirements for proficiency testing”, issued by ISO-Geneva (CH), International Organisation for Standardization, 2010.
[7] ISO 13528:2015 “Statistical methods for use in proficiency testing by interlaboratory comparisons”, issued by ISO-Geneva (CH), International Organisation for Standardization, 2015.
[8] SoftCRM, (n.d.). http://www.eie.gr/iopc/softcrm/index.html.
[9] ISO Guide 35 “Reference materials - general and statistical principles for certification”, issued by ISO-Geneva (CH), International Organisation for Standardization, 2006.
[10] M. Thompson, Recent trends in inter-laboratory precision at ppb and sub-ppb concentrations in relation to fitness for purpose criteria in proficiency testing, Analyst. 125 (2000) 385–386. doi:10.1039/B000282H.
[11] Eurachem/Citac, “Quantifying Uncertainty in Analytical Measurement,” 2012. http://www.eurachem.org.
[12] Analytical Methods Committee, Representing data distributions with kernel density estimates, AMC Tech. Br. 4 (2006) 2. http://www.rsc.org/images/brief4_tcm18-25925.pdf.

16
------------------ This is a blank page ----------------

17
Annexes

18
Annex 1: List of abbreviations
CV-AAS Cold Vapour Atomic Absorption Spectrometry
DG SANTE Directorate General for Health and Food Safety
DMA Direct Mercury Analyser (also called Elemental Mercury Analyzer, EMA)
ET-AAS Electro Thermal – Atomic Absorption Spectrometry (also called Graphite Furnace Atomic Absorption Spectroscopy, GF-AAS)
GUM Guide for the Expression of Uncertainty in Measurement
HG-AAS Hydride Generation – Atomic Absorption Spectrometry
HPLC High Performance Liquid Chromatography
ICP-(Q)MS Inductively Coupled Plasma –(Quadrupole) Mass Spectrometry
ID-GC-ICP-MS Isotope Dilution – Gas Chromatography – ICP-MS
JRC Joint Research Centre
LOD Limit of detection
NRL National Reference Laboratory
PKE PT
Palm Kernel Expeller Proficiency Test
Z-ET-AAS Zeeman ET-AAS

19
Annex 2: JRC web announcement

20
Annex 3: Invitation letter to NRLs

21
Annex 4: Test item accompanying letter

22
Annex 5: Confirmation of receipt form

23
Annex 6: Questionnaire

24
25
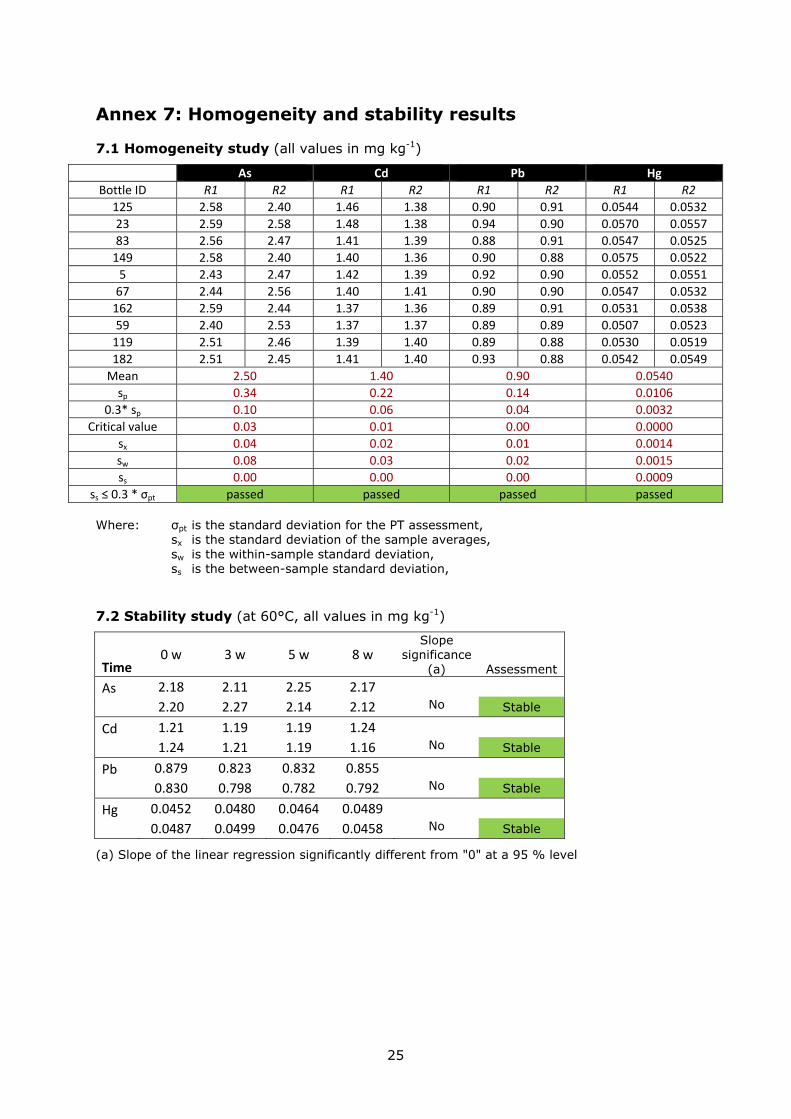
Annex 7: Homogeneity and stability results
7.1 Homogeneity study (all values in mg kg-1)
As Cd Pb Hg
Bottle ID R1 R2 R1 R2 R1 R2 R1 R2
125 2.58 2.40 1.46 1.38 0.90 0.91 0.0544 0.0532
23 2.59 2.58 1.48 1.38 0.94 0.90 0.0570 0.0557
83 2.56 2.47 1.41 1.39 0.88 0.91 0.0547 0.0525
149 2.58 2.40 1.40 1.36 0.90 0.88 0.0575 0.0522
5 2.43 2.47 1.42 1.39 0.92 0.90 0.0552 0.0551
67 2.44 2.56 1.40 1.41 0.90 0.90 0.0547 0.0532
162 2.59 2.44 1.37 1.36 0.89 0.91 0.0531 0.0538
59 2.40 2.53 1.37 1.37 0.89 0.89 0.0507 0.0523
119 2.51 2.46 1.39 1.40 0.89 0.88 0.0530 0.0519
182 2.51 2.45 1.41 1.40 0.93 0.88 0.0542 0.0549
Mean 2.50 1.40 0.90 0.0540
sp 0.34 0.22 0.14 0.0106
0.3* sp 0.10 0.06 0.04 0.0032
Critical value 0.03 0.01 0.00 0.0000
sx 0.04 0.02 0.01 0.0014
sw 0.08 0.03 0.02 0.0015
ss 0.00 0.00 0.00 0.0009
ss ≤ 0.3 * σpt passed passed passed passed Where: σpt is the standard deviation for the PT assessment,
sx is the standard deviation of the sample averages, sw is the within-sample standard deviation, ss is the between-sample standard deviation,
7.2 Stability study (at 60°C, all values in mg kg-1)
Time 0 w 3 w 5 w 8 w
Slope significance
(a) Assessment As 2.18 2.11 2.25 2.17
2.20 2.27 2.14 2.12 No Stable
Cd 1.21 1.19 1.19 1.24
1.24 1.21 1.19 1.16 No Stable
Pb 0.879 0.823 0.832 0.855
0.830 0.798 0.782 0.792 No Stable
Hg 0.0452 0.0480 0.0464 0.0489
0.0487 0.0499 0.0476 0.0458 No Stable
(a) Slope of the linear regression significantly different from "0" at a 95 % level

26
Annex 8: Results for total As
Assigned values: xpt = 2.28; U(xpt) = 0.16 (k=2) and σpt = 0.34; all values in mg kg‐1,
relative to a feed with a moisture content of 12 %
Lab Code Xi U(xi) ka technique u(xi) z‐scoreb ζ‐score uncert.c
001 2.31 0.13 2 ICP‐MS 0.065 0.08 0.27 b
002 1.96 0.14 2 ICP‐MS 0.07 ‐0.94 ‐3.01 b
003 2.2 0.5 2 AAS 0.25 ‐0.24 ‐0.31 a
004 2.3 1.2 2 AAS 0.6 0.05 0.03 c
005 2.29 0.46 2 ICP‐MS 0.23 0.02 0.03 a
007 2.180 0.327 2 ICP‐MS 0.1635 ‐0.30 ‐0.56 a
008 1.991 0.37829 2 ICP‐MS 0.189145 ‐0.85 ‐1.42 a
009 2.03 0.47 2 ICP‐MS 0.235 ‐0.74 ‐1.02 a
010 1.99 0.55 2 HG‐AAS 0.275 ‐0.85 ‐1.02 a
011 2.22 0.46 2 ICP‐MS 0.23 ‐0.18 ‐0.26 a
012 2.4 0.7 2 ICP‐OES 0.35 0.34 0.33 c
013 2.241 0.403 2 AAS 0.2015 ‐0.12 ‐0.19 a
014 2.251 0.116 2 ICP‐MS 0.058 ‐0.09 ‐0.31 b
015 2.10 0.34 2 ICP‐MS 0.17 ‐0.53 ‐0.97 a
016 2.4 0.96 2 ICP‐MS 0.48 0.34 0.24 c
017 1.47 0.06 2 AAS 0.03 ‐2.37 ‐9.41 b
018 3.6 1.1 3 ICP‐MS 0.366667 3.85 3.51 c
019 2.1 0.47 2 AAS 0.235 ‐0.53 ‐0.73 a
020
021 2.4 0.5 2 ICP‐MS 0.25 0.34 0.45 a
022 2.0 √3 AAS 0 ‐0.82 ‐3.49 b
023 2.06 0.37 2 ICP‐MS 0.185 ‐0.65 ‐1.10 a
024 2.29 0.44 2 AAS 0.22 0.02 0.03 a
025 2.021 0.303 2 AAS 0.1515 ‐0.76 ‐1.52 a
026 2.285 0.274 2 ICP‐MS 0.137 0.01 0.02 a
027 2.50 0.63 √3 ICP‐MS 0.363731 0.64 0.58 c
028 2.274 0.455 2 ICP‐MS 0.2275 ‐0.02 ‐0.03 a
029 3.10 0.78 2 ICP‐MS 0.39 2.39 2.05 c
030 2.271 0.393 2 ICP‐MS 0.1965 ‐0.03 ‐0.05 a
031 2.2 0.37 2 ICP‐MS 0.185 ‐0.24 ‐0.41 a
032 2.20 0.50 2 ICP‐MS 0.25 ‐0.24 ‐0.31 a
033 2.29 0.11 2 ICP‐MS 0.055 0.02 0.08 b
034
036 1.7 0.7 2 ICP‐MS 0.35 ‐1.70 ‐1.62 c
a √3 is set by the ILC coordinator when no coverage factor k is reported. The reported uncertainty was assumed to have a rectangular distribution with k=√3, b score evaluation colours: satisfactory, questionable, unsatisfactory, c Case "a": u(xpt) ≤ u(xi) ≤ σpt; Case "b": u(xi) < u(xpt); and Case "c": u(xi) > σpt

27

28
Annex 9: Results for Cd
Assigned values: xpt = 1.35; U(xpt) = 0.14 (k=2); and σpt = 0.22; all values in mg kg‐1,
relative to a feed with a moisture content of 12 %
Lab Code Xi U(xi) ka technique u(xi) z‐scoreb ζ‐score uncert.c
001 1.4 0.1 2 ICP‐MS 0.05 0.22 0.57 b
002 1.24 0.07 2 ICP‐MS 0.035 ‐0.52 ‐1.46 b
003 1.1 0.2 2 AAS 0.1 ‐1.16 ‐2.08 a
004 1.3 0.6 2 AAS 0.3 ‐0.24 ‐0.17 c
005 1.32 0.34 2 ICP‐MS 0.17 ‐0.15 ‐0.17 a
007 1.250 0.187 2 ICP‐MS 0.0935 ‐0.47 ‐0.88 a
008 1.213 0.23047 2 ICP‐MS 0.115235 ‐0.64 ‐1.04 a
009 1.29 0.19 2 ICP‐MS 0.095 ‐0.29 ‐0.53 a
010 1.47 0.26 2 AAS 0.13 0.55 0.80 a
011 1.45 0.24 2 ICP‐MS 0.12 0.45 0.71 a
012 1.4 0.3 2 ICP‐OES 0.15 0.22 0.29 a
013 1.403 0.421 2 AAS 0.2105 0.24 0.23 a
014 1.305 0.040 2 ICP‐MS 0.02 ‐0.22 ‐0.66 b
015 1.26 0.21 2 ICP‐MS 0.105 ‐0.42 ‐0.73 a
016 1.4 0.56 2 ICP‐MS 0.28 0.22 0.17 c
017 1.50 0.12 2 AAS 0.06 0.69 1.63 b
018 1.4 0.3 3 ICP‐MS 0.1 0.22 0.40 a
019 1.3 0.54 2 AAS 0.27 ‐0.24 ‐0.19 c
020
021 1.5 0.3 2 ICP‐MS 0.15 0.69 0.90 a
022 1.49 √3 AAS 0 0.64 2.02 b
023 1.30 0.23 2 ICP‐MS 0.115 ‐0.24 ‐0.39 a
024 1.26 0.19 2 AAS 0.095 ‐0.42 ‐0.78 a
025 1.414 0.283 2 AAS 0.1415 0.29 0.40 a
026 1.433 0.201 2 ICP‐MS 0.1005 0.38 0.67 a
027 1.45 0.36 √3 ICP‐MS 0.207846 0.45 0.45 a
028 1.411 0.282 2 ICP‐MS 0.141 0.27 0.38 a
029 1.55 0.39 2 ICP‐MS 0.195 0.92 0.96 a
030 1.303 0.275 2 ICP‐MS 0.1375 ‐0.23 ‐0.32 a
031 1.3 0.22 2 ICP‐MS 0.11 ‐0.24 ‐0.40 a
032 1.33 0.25 2 ICP‐MS 0.125 ‐0.10 ‐0.15 a
033 1.38 0.07 2 ICP‐MS 0.035 0.13 0.37 b
034
036 1.1 0.4 2 ICP‐MS 0.2 ‐1.16 ‐1.19 a
a √3 is set by the ILC coordinator when no coverage factor k is reported. The reported uncertainty was assumed to have a rectangular distribution with k=√3, b score evaluation colours: satisfactory, questionable, unsatisfactory, c Case "a": u(xpt) ≤ u(xi) ≤ σpt; Case "b": u(xi) < u(xpt); and Case "c": u(xi) > σpt

29

30
Annex 10: Results for Pb
Assigned values: : xpt = 0.850; U(xpt) = 0.039 (k=2); and σpt = 0.145 ; all values in mg kg‐1,
relative to a feed with a moisture content of 12 %
Lab Code Xi U(xi) ka technique u(xi) z‐scoreb ζ‐score uncert.c
001 0.84 0.08 2 ICP‐MS 0.04 ‐0.07 ‐0.22 a
002 0.893 0.054 2 ICP‐MS 0.027 0.30 1.29 a
003 < 1.8 AAS
004 0.8 0.3 2 AAS 0.15 ‐0.35 ‐0.33 c
005 0.85 0.24 2 ICP‐MS 0.12 0.00 0.00 a
007 0.914 0.137 2 ICP‐MS 0.0685 0.44 0.90 a
008 0.876 0.1752 2 ICP‐MS 0.0876 0.18 0.29 a
009 0.879 0.167 2 ICP‐MS 0.0835 0.20 0.34 a
010 1.39 0.19 2 AAS 0.095 3.74 5.57 a
011 0.828 0.132 2 ICP‐MS 0.066 ‐0.15 ‐0.32 a
012 1.1 0.3 2 ICP‐OES 0.15 1.73 1.65 c
013 0.891 0.267 2 AAS 0.1335 0.28 0.30 a
014 0.858 0.036 2 ICP‐MS 0.018 0.06 0.30 b
015 0.79 0.10 2 ICP‐MS 0.05 ‐0.42 ‐1.12 a
016 0.93 0.47 2 ICP‐MS 0.235 0.55 0.34 c
017 1.39 0.06 2 0.03 3.74 15.07 a
018 0.98 0.2 3 ICP‐MS 0.066667 0.90 1.87 a
019 0.84 0.25 2 AAS 0.125 ‐0.07 ‐0.08 a
020
021 0.88 0.19 2 ICP‐MS 0.095 0.21 0.31 a
022 1.5 √3 AAS 0 4.50 33.16 b
023 0.848 0.170 2 ICP‐MS 0.085 ‐0.01 ‐0.02 a
024 0.93 0.15 2 AAS 0.075 0.55 1.03 a
025 0.583 0.117 2 AAS 0.0585 ‐1.85 ‐4.33 a
026 0.864 0.137 2 ICP‐MS 0.0685 0.10 0.20 a
027 0.94 0.24 √3 ICP‐MS 0.138564 0.62 0.64 a
028 0.988 0.198 2 ICP‐MS 0.099 0.96 1.37 a
029 0.985 0.246 2 ICP‐MS 0.123 0.93 1.08 a
030 0.720 0.209 2 ICP‐MS 0.1045 ‐0.90 ‐1.22 a
031 0.79 0.18 2 ICP‐MS 0.09 ‐0.42 ‐0.65 a
032 0.818 0.204 2 ICP‐MS 0.102 ‐0.22 ‐0.31 a
033 0.828 0.041 2 ICP‐MS 0.0205 ‐0.15 ‐0.78 a
034
036 0.87 0.28 2 ICP‐MS 0.14 0.14 0.14 a
a √3 is set by the ILC coordinator when no coverage factor k is reported. The reported uncertainty was assumed to have a rectangular distribution with k=√3, b score evaluation colours: satisfactory, questionable, unsatisfactory, c Case "a": u(xpt) ≤ u(xi) ≤ σpt; Case "b": u(xi) < u(xpt); and Case "c": u(xi) > σpt
31

32
Annex 11: Results for Hg
Assigned values: xpt = 0.0481; U(xpt) = 0.0022 (k=2); and σpt = 0.0106 ; all values in mg kg‐1,
relative to a feed with a moisture content of 12 %
Lab Code Xi U(xi) ka technique u(xi) z‐scoreb ζ‐score uncert.c
001 0.059 0.006 2 ICP‐MS 0.003 1.03 3.41 a
002 0.052 0.005 2 DMA 0.0025 0.37 1.43 a
003 0.052 0.008 2 AAS 0.004 0.37 0.94 a
004 0.07 0.02 2 AAS 0.01 2.07 2.18 a
005 0.052 0.015 2 ICP‐MS 0.0075 0.37 0.51 a
007 0.052 0.013 2 AMA‐254 0.0065 0.37 0.59 a
008 0.051 0.00255 2 AMA‐254 0.001275 0.27 1.72 a
009 0.0483 0.0126 2 ICP‐MS 0.0063 0.02 0.03 a
010 0.093 0.012 2 CV‐AAS 0.006 4.24 7.36 a
011 0.051 0.015 2 ICP‐MS 0.0075 0.27 0.38 a
012 0.046 0.004 2 AMA‐254 0.002 ‐0.20 ‐0.92 a
013 0.068 0.008 2 AAS 0.004 1.88 4.80 a
014 0.052 0.008 2 ICP‐MS 0.004 0.37 0.94 a
015 0.045 0.007 2 ICP‐MS 0.0035 ‐0.29 ‐0.84 a
016 0.058 0.023 2 ICP‐MS 0.0115 0.93 0.86 c
017 0.082 0.004 2 AAS 0.002 3.20 14.85 a
018 0.0490 0.0010 3 DMA 0.000333 0.08 0.78 b
019 0.048 0.01 2 AAS 0.005 ‐0.01 ‐0.02 a
020 0.0543 0.00217 2 AMA‐254 0.001085 0.58 4.01 b
021 0.056 0.012 2 DMA 0.006 0.75 1.30 a
022
023 0.0495 0.0104 2 AAS 0.0052 0.13 0.26 a
024 0.054 0.014 2 HG‐CVAAS 0.007 0.56 0.83 a
025 0.064 0.016 2 AAS 0.008 1.50 1.97 a
026 0.0596 0.0137 2 ICP‐MS 0.00685 1.08 1.66 a
027 < 0.08 ICP‐MS
028 0.057 0.011 2 ICP‐MS 0.0055 0.84 1.59 a
029 0.06 0.015 2 ICP‐MS 0.0075 1.12 1.57 a
030 0.0392 0.010 2 DMA 0.005 ‐0.84 ‐1.74 a
031 0.053 0.011 2 DMA 0.0055 0.46 0.87 a
032 0.0471 0.0118 2 ICP‐MS 0.0059 ‐0.09 ‐0.17 a
033 0.110 0.006 2 CV‐AAS 0.003 5.84 19.37 a
034
036
a √3 is set by the ILC coordinator when no coverage factor k is reported. The reported uncertainty was assumed to have a rectangular distribution with k=√3, b score evaluation colours: satisfactory, questionable, unsatisfactory, c Case "a": u(xpt) ≤ u(xi) ≤ σpt; Case "b": u(xi) < u(xpt); and Case "c": u(xi) > σpt

33
34
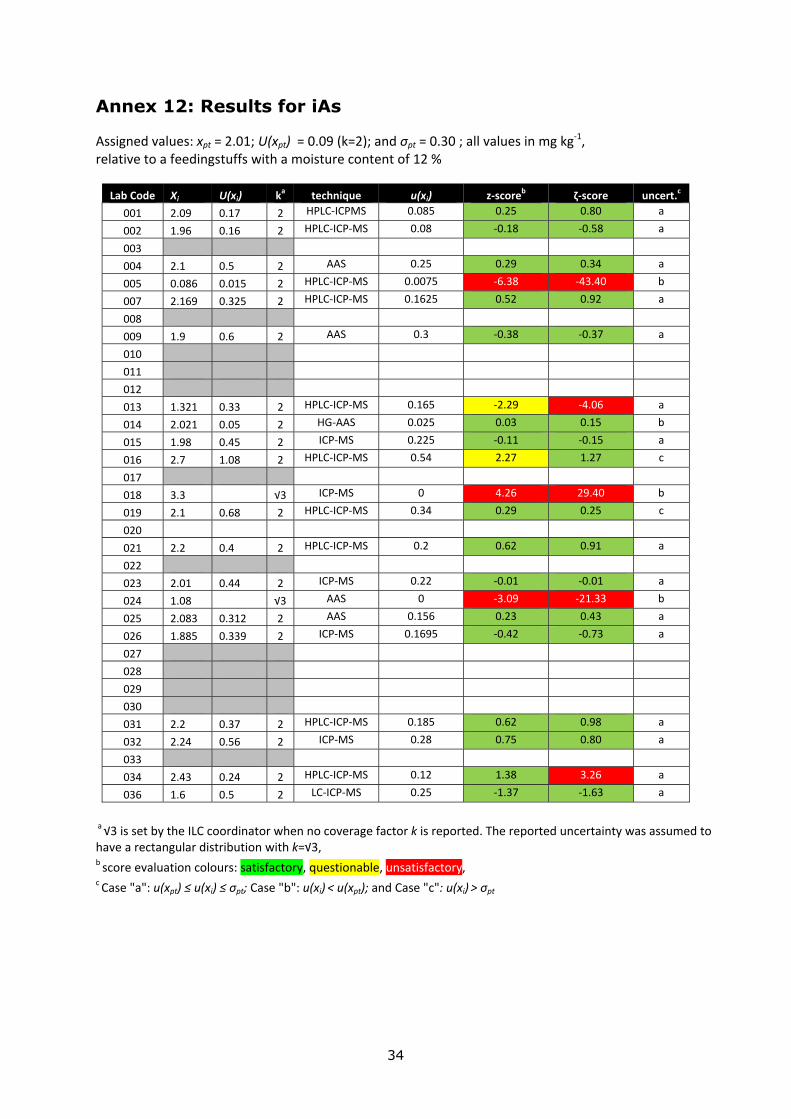
Annex 12: Results for iAs
Assigned values: xpt = 2.01; U(xpt) = 0.09 (k=2); and σpt = 0.30 ; all values in mg kg‐1, relative to a feedingstuffs with a moisture content of 12 %
Lab Code Xi U(xi) ka technique u(xi) z‐scoreb ζ‐score uncert.c
001 2.09 0.17 2 HPLC‐ICPMS 0.085 0.25 0.80 a
002 1.96 0.16 2 HPLC‐ICP‐MS 0.08 ‐0.18 ‐0.58 a
003
004 2.1 0.5 2 AAS 0.25 0.29 0.34 a
005 0.086 0.015 2 HPLC‐ICP‐MS 0.0075 ‐6.38 ‐43.40 b
007 2.169 0.325 2 HPLC‐ICP‐MS 0.1625 0.52 0.92 a
008
009 1.9 0.6 2 AAS 0.3 ‐0.38 ‐0.37 a
010
011
012
013 1.321 0.33 2 HPLC‐ICP‐MS 0.165 ‐2.29 ‐4.06 a
014 2.021 0.05 2 HG‐AAS 0.025 0.03 0.15 b
015 1.98 0.45 2 ICP‐MS 0.225 ‐0.11 ‐0.15 a
016 2.7 1.08 2 HPLC‐ICP‐MS 0.54 2.27 1.27 c
017
018 3.3 √3 ICP‐MS 0 4.26 29.40 b
019 2.1 0.68 2 HPLC‐ICP‐MS 0.34 0.29 0.25 c
020
021 2.2 0.4 2 HPLC‐ICP‐MS 0.2 0.62 0.91 a
022
023 2.01 0.44 2 ICP‐MS 0.22 ‐0.01 ‐0.01 a
024 1.08 √3 AAS 0 ‐3.09 ‐21.33 b
025 2.083 0.312 2 AAS 0.156 0.23 0.43 a
026 1.885 0.339 2 ICP‐MS 0.1695 ‐0.42 ‐0.73 a
027
028
029
030
031 2.2 0.37 2 HPLC‐ICP‐MS 0.185 0.62 0.98 a
032 2.24 0.56 2 ICP‐MS 0.28 0.75 0.80 a
033
034 2.43 0.24 2 HPLC‐ICP‐MS 0.12 1.38 3.26 a
036 1.6 0.5 2 LC‐ICP‐MS 0.25 ‐1.37 ‐1.63 a
a √3 is set by the ILC coordinator when no coverage factor k is reported. The reported uncertainty was assumed to have a rectangular distribution with k=√3, b score evaluation colours: satisfactory, questionable, unsatisfactory, c Case "a": u(xpt) ≤ u(xi) ≤ σpt; Case "b": u(xi) < u(xpt); and Case "c": u(xi) > σpt

35

36
Annex 13: Overview of performance versus technique
Lab total As Cd Pb Hg iAs
001 ICP‐MS ICP‐MS ICP‐MS ICP‐MS HPLC‐ICP‐MS
002 ICP‐MS ICP‐MS ICP‐MS DMA HPLC‐ICP‐MS
003 AAS AAS ‐‐ AAS ‐‐
004 AAS AAS AAS AAS AAS
005 ICP‐MS ICP‐MS ICP‐MS ICP‐MS HPLC‐ICP‐MS
007 ICP‐MS ICP‐MS ICP‐MS AMA 254 HPLC‐ICP‐MS
008 ICP‐MS ICP‐MS ICP‐MS AMA 254 ‐‐
009 ICP‐MS ICP‐MS ICP‐MS ICP‐MS AAS
010 HG‐AAS AAS AAS CV‐AAS ‐‐
011 ICP‐MS ICP‐MS ICP‐MS ICP‐MS ‐‐
012 ICP‐OES ICP‐OES ICP‐OES AMA254 ‐‐
013 AAS AAS AAS AAS HPLC‐ICP‐MS
014 ICP‐MS ICP‐MS ICP‐MS ICP‐MS HG–AAS
015 ICP‐MS ICP‐MS ICP‐MS ICP‐MS ICP‐MS
016 ICP‐MS ICP‐MS ICP‐MS ICP‐MS HPLC‐ICP‐MS
017 AAS AAS AAS ‐‐
018 ICP‐MS ICP‐MS ICP‐MS DMA ICP‐MS
019 AAS AAS AAS AAS HPLC‐ICPMS
020 ‐‐ ‐‐ ‐‐ AMA‐254 ‐‐
021 ICP‐MS ICP‐MS ICP‐MS DMA HPLC‐ICP‐MS
022 AAS AAS AAS ‐‐ ‐‐
023 ICP‐MS ICP‐MS ICP‐MS AAS ICP‐MS
024 AAS AAS AAS HG‐CVAAS AAS
025 AAS AAS AAS AAS AAS
026 ICP‐MS ICP‐MS ICP‐MS ICP‐MS ICP‐MS
027 ICP‐MS ICP‐MS ICP‐MS ‐‐ ‐‐
028 ICP‐MS ICP‐MS ICP‐MS ICP‐MS ‐‐
029 ICP‐MS ICP‐MS ICP‐MS ICP‐MS ‐‐
030 ICP‐MS ICP‐MS ICP‐MS DMA ‐‐
031 ICP‐MS ICP‐MS ICP‐MS DMA HPLC‐ICP‐MS
032 ICP‐MS ICP‐MS ICP‐MS ICP‐MS ICP‐MS
033 ICP‐MS ICP‐MS ICP‐MS CV‐AAS ‐‐
034 ‐‐ ‐‐ ‐‐ ‐‐ HPLC‐ICP‐MS
036 ICP‐MS ICP‐MS ICP‐MS ‐‐ LC‐ICP‐MS
Z-Score evaluation colours: satisfactory, questionable, unsatisfactory.

37
Annex 14: Conformity as expressed by the participants.
Lab Comply If not compliant, specify why.a xi – Ui b Eval.c
001 Yes > ML FC
002 No Result of Cd exceeds the maximum level (ML) as laid down in DIR 2002/32/EC for "Feed materials of vegetable origin". Results of As, iAs, Pb and Hg do not exceed the MLs.
> ML TNC
003 Yes < ML TC
004 Yes < ML TC
005 Yes < ML TC
007 No because of exceeding ML for Cd (feed materials of vegetable origin 1 ppm) and exceeding ML for inorg. As (2ppm/88 % dry mass)
> ML FNC
008 No Cd is more than 1 mg/kg < ML FNC
009 No Cd is above MRL (1,0 mg/kg) > ML TNC
010 No For Cd the maximum level is 1 mg/Kg in feed materials of vegetable origin > ML TNC
011 No The content of cadmium (minus measurement uncertainty) is higher than maximum permitted content.
> ML TNC
012 No Cd exceeds allowed maximum content (0.5 mg/kg 12 % moisture) > ML FNC
013 Yes < ML TC
014 No Cd content is higher than 1 mg/kg > ML TNC
015 No Cd: Reg.value 1mg/kg. Our result 1.05mg/kg (after UM subtracted) > ML TNC
016 ? < ML
017 No Not compliant for Cd > ML TNC
018 ? > ML
019 Yes < ML TC
020 Yes (Note authors: No Cd results) nd FC
021 No Cd concentration: 1.456 mg/kg - 0.288 mg/kg = 1.168 mg/kg > 1 mg/kg (the maximum level for Cd in feed materials of vegetable origin)
> ML TNC
022 No Out of limits for Cd > ML TNC
023 No Cd content value exceeds the maximum allowed > ML TNC
024 No Cd content is over the maximum level (1mg/Kg) > ML TNC
025 Yes The Cd content is over 1 mg/kg > ML FC
026 No ML for Cadmium for plant ingredient is 1mg/kg, which is violated even after substracting the measurement uncertainty
> ML TNC
027 No Non compliant for Cd > ML TNC
028 ? > ML
029 Yes > ML FC
030 No Because concentration of Cd is above limit of 1 mg/kg (calculating Measurement Uncertainty )
> ML TNC
031 No The concentration of cadmium in the sample (after subtracting the uncertainty) is above 1 mg/Kg, which, according to regulation 574/2011 is the maximum limit for Feed materials of vegetable origin.
> ML TNC
032 No Cd-level above ML ( 1 mg/kg) > ML TNC
033 No As, Cd, Hg are more then limit > ML FNC
034 ? No MLs for iAs in palm kernel expeller (Note Authors: no Cd results) nd
036 Yes < ML TC a Wrong justifications are marked in yellow. b Maximum Level for Cd in palm kernel expeller set by DIR 2002/32/EC: ML = 1 mg kg-1
c TNC: True Non-Compliant, TC: True Compliant, FNC: False Non-Compliant, FC: False Compliant.

38
Annex 15: Experimental details (as reported by the participants)
Lab Code Measurand
Digestion type Acid mixture
Temperature (oC)
Time (min)
Recovery %
LODs (mg/kg)
001 As CMW HNO3 166 54 104 0,005
001 Cd CMW HNO3 166 54 104 0,002
001 Pb CMW HNO3 166 54 97 0,003
001 Hg CMW HNO3 166 54 95 0,001
002 As CMW HNO3/H2O2 150C/180 20/10 108 0.0009
002 Cd CMW HNO3/H2O2 150C/180 20/10 90 0.0003
002 Pb CMW HNO3/H2O2 150C/180 20/10 111 0.004
002 Hg no dig. ‐ ‐ ‐ 101 0.0002
003 As CMW HNO3/H202/HF 200 28 91.76 0.18
003 Cd CMW HNO3/H202/HF 200 28 98.21 0.075
003 Pb CMW HNO3/H202/HF 200 28 88.75 0.50
003 Hg ‐‐ ‐‐ ‐‐ ‐‐ 94.12 0.010
004 As Dry Ash HNO3 445 24 h 96 0.063
004 Cd OWD HNO3/H2O2 170 1 h 88 0.01
004 Pb OWD HNO3/H2O2 170 1 h 100 0.05
004 Hg CMW HNO3/H2O2 170 20 112 0.025
005 As CMW HNO3/HCl 220 25 100 0,01
005 Cd CMW HNO3/HCl 220 25 100 0,003
005 Pb CMW HNO3/HCl 220 25 100 0,004
005 Hg CMW HNO3/HCl 220 25 100 0,019
007 As OMW HNO3 200 10 98‐102 0,006
007 Cd OMW HNO3 200 10 98‐102 0,006
007 Pb OMW HNO3 200 10 98‐102 0,09
007 Hg no dig. no acids dry combustion
in oxygen 270s temp. programe 98‐102 0,0006
008 As CMW HNO3/H2O2 max.190 51 102 0.00231
008 Cd CMW HNO3/H2O2 max.190 51 89 0.00160
008 Pb CMW HNO3/H2O2 max.190 51 102 0.00135
008 Hg Dry Ash ‐‐ ‐‐ ‐‐ 102 0.000146
009 As CMW HNO3/H2O2 200 60 88 0,1
009 Cd CMW HNO3/H2O2 200 60 95 0,01
009 Pb CMW HNO3/H2O2 200 60 95 0,01
009 Hg CMW HNO3/H2O2 200 60 0,01
010 As Dry Ash HNO3/HCl 450 12 h 102 0.100
010 Cd Dry Ash HNO3/HCl 450 24 h 94.2 0.07
010 Pb Dry Ash HNO3/HCl 450 24 h 100 0.5
010 Hg CMW HNO3 180 50 98 0.003
011 As CMW HNO3/H2O2 200 20 100 0.008
011 Cd CMW HNO3/H2O2 200 20 89 0.002
011 Pb CMW HNO3/H2O2 200 20 100 0.005
011 Hg CMW HNO3/H2O2 200 20 84 0.008
012 As CMW HNO3/H2O2 100‐200 22 93 0,5
012 Cd CMW HNO3/H2O2 100‐200 22 92 0,1
012 Pb CMW HNO3/H2O2 100‐200 22 83 0,5
012 Hg none none 200‐650 3
013 As Dry Ash ‐‐ 550 24 h 89 0.002
013 Cd Dry Ash ‐‐ 450 24 h 93 0.001
013 Pb Dry Ash 450 24h 94 0.002
013 Hg Pressure bomb ‐ 3 0.001

39
Lab Code Measurand
Digestion type Acid mixture
Temperature (oC)
Time (min)
Recovery %
LODs (mg/kg)
014 As CMW HNO3/H2O2 180 30 104 0,010
014 Cd CMW HNO3/H2O2 180 30 min 102 0,002
014 Pb CMW HNO3/H2O2 180 30 min 100 0,005
014 Hg CMW HNO3/H2O2 180 30 min 101 0,010
015 As CMW HNO3/HCl 240 15 100 0.003
015 Cd CMW HNO3/HCl 240 15 102 0.08
015 Pb CMW HNO3/HCl 240 15 110 0.02
015 Hg CMW HNO3, HCl 240 15 113 0.002
016 As CMW HNO3 0,01
016 Cd CMW HNO3 0,005
016 Pb CMW HNO3 0,03
016 Hg CMW HNO3 0,005
017 As CMW HNO3/H2O2 185 15 97.3 0.06
017 Cd CMW HNO3/H2O2 185 15 96.6 0.01
017 Pb CMW HNO3/H2O2 185 15 99.6 0.07
017 Hg CMW HNO3/H2O2 185 15 100.8 0.01
018 As MW HNO3/H2O2 180 10 1
018 Cd MW HNO3/H2O2 180 10 0.5
018 Pb MW HNO3/H2O2 180 10 0.1
018 Hg ‐‐ ‐‐ ‐‐ ‐‐ 0.005
019 As CMW HNO3 210 30 0.03
019 Cd CMW HNO3 210 30 0.004
019 Pb CMW HNO3 210 30 0.02
019 Hg CMW HNO3 210 30 0.01
020 As
020 Cd
020 Pb
020 Hg 95.8 0.00042
021 As CMW HNO3 180 30 110 0.0006
021 Cd CMW HNO3 180 30 103.5 0.0017
021 Pb CMW HNO3 180 30 99.7 0.0048
021 Hg 105 0.0002
022 As CMW HNO3/H2O2 200 40 80 0.08
022 Cd CMW HNO3/H2O2 200 40 85 0.1
022 Pb CMW HNO3/H2O2 200 40 90 0.05
022 Hg HNO3/H2O2 200 40
023 As CMW HNO/H2O2 200 20 101 0.020
023 Cd CMW HNO/H2O2 200 20 102 0.005
023 Pb CMW HNO/H2O2 200 20 96 0.020
023 Hg Dry Ash ‐ 850 150 s 103 0.005
024 As Pressure bomb HNO3/H2O2 180
Ramp/hold 20/20 80‐110 0.067
024 Cd Pressure bomb HNO3/H2O2 180
Ramp/hold 20/20 80‐110 0.0033
024 Pb Pressure bomb HNO3/H2O2 180
Ramp/hold 20/20 80‐110 0.010
024 Hg Pressure bomb HNO3/H2O2 180
Ramp/hold 20/20 80‐110 0.016
025 As CMW HNO3/H2O2 200 20 98 0.04
025 Cd CMW HNO3/H2O2 200 20 110 0.04
025 Pb CMW HNO3/H2O2 200 20 90 0.04
025 Hg CMW HNO3/H2O2 200 20 92 0.04

40
Lab Code Measurand
Digestion type Acid mixture
Temperature (oC)
Time (min)
Recovery %
LODs (mg/kg)
026 As CMW HNO3 220 20 102 0.013
026 Cd CMW HNO3 220 20 100 0.0014
026 Pb CMW HNO3 220 20 102 0.006
026 Hg CMW HNO3 220 20 105 0.003
027 As MW HNO3 200 30 111 0.05
027 Cd MW HNO3 200 30 111 0.02
027 Pb MW HNO3 200 30 107 0.27
027 Hg MW HNO3 200 30 103 0.08
028 As CMW HNO3/H2O2 200 8 0,002
028 Cd CMW HNO3/H2O2 200 8 0,02
028 Pb CMW HNO3/H2O2 200 8 0,02
028 Hg CMW HNO3/H2O2 200 8 0,03
029 As CMW HNO3/H2O2 230 50 0.01
029 Cd CMW HNO3/H2O2 230 50 0.01
029 Pb CMW HNO3/H2O2 230 50 0.02
029 Hg CMW HNO3/H2O2 230 50 0.01
030 As CMW HNO3/H2O2 210 30 98,81 10
030 Cd CMW HNO3/H2O2 210 30 98,81 10
030 Pb CMW HNO3/H2O2 210 30 99,45 10
030 Hg ‐ ‐ ‐ ‐ 96 1
031 As CMW HNO3/H2O2 200 40 97 0.020
031 Cd CMW HNO3/H2O2 200 40 94 0.004
031 Pb CMW HNO3/H2O2 200 40 95 0.006
031 Hg 102 0.010
032 As CMW HNO3 230 20 100 0,025
032 Cd CMW HNO3 230 20 100 0,006
032 Pb CMW HNO3 230 20 100 0,02
032 Hg CMW HNO3 230 20 100 0,013
033 As CMW HNO3/H2O2 180°C 30. 100 0.005
033 Cd CMW HNO3/H2O2 180°C 30. 100 0.005
033 Pb CMW HNO3/H2O2 180°C 30. 100 0.010
033 Hg OWD HNO3/H2SO4 200°C 15 min. 100 0.005
034 As
034 Cd
034 Pb
034 Hg
036 As CMW HNO3 200 20 100 0.2
036 Cd CMW HNO3 200 20 100 0.05
036 Pb CMW HNO3 200 20 100 0.05
036 Hg 100 0.015
CMW: closed microwave digestion; OWD: open wave digestion

Europe Direct is a service to help you find answers to your questions about the European Union Free phone number (*): 00 800 6 7 8 9 10 11 (*) Certain mobile telephone operators do not allow access to 00 800 numbers or these calls may be billed. A great deal of additional information on the European Union is available on the Internet. It can be accessed through the Europa server http://europa.eu
How to obtain EU publications Our publications are available from EU Bookshop (http://bookshop.europa.eu), where you can place an order with the sales agent of your choice. The Publications Office has a worldwide network of sales agents. You can obtain their contact details by sending a fax to (352) 29 29-42758.

XX-N
A-xxxxx-EN
-N