europe - china freight trains: traffic volumes and
TRANSCRIPT

Europe - China freight trains:
traffic volumes and infrastructure development
Péter Bucsky University of Pécs
Doctoral School of Earth Sciences

Eurasian Landbridge – numerous alternative routes
Source: https://america.cgtn.com/2017/05/13/5000-china-europe-cargo-trains-expected-by-2020#

Belt and Road Initiative
• Not an infrastructure developmentplan
• Rail freight is part of it, but there is no comprehensive strategy, instituion
• In Europe there are rail freightcorridors – it involves a lot of cooperation and a long time to try tomake rail transport more competitive

Why is infrastructure development importnatfor China?
0
20 000
40 000
60 000
80 000
100 000
120 000
140 000
2006 2007 2008 2009 2010 2011 2012 2013 2014 2015 2016
Road transport
Length of motorway network, km
Passennger km on roads (100 million)
Freight Ton-Kilometers on roads (100 million)
0
5 000
10 000
15 000
20 000
25 000
30 000
35 000
40 000
2007 2008 2009 2010 2011 2012 2013 2014 2015 2016
Rail Transport
Length of National Electrified Railways (km)
Passenger-Kilometers of Railways (100 million passenger-km)
Freight Ton-Kilometers of Railways(100 million ton-km)

As trade of China growth in Eurasia, transportroutes will be more and more important
Trade with the 40 countries along the New Silk Road by partner (billion USD)
2008 2014 Change Change %
Yearly average
growth rateFrance 120 106 -14 -11.7% -1.8%Germany 333 307 -26 -7.8% -1.2%Italy 103 94 -9 -8.7% -1.3%Netherlands 86 86 0 0.0% 0.0%Poland 36 38 2 5.6% 0.8%Rest of EU 476 475 -1 -0.2% 0.0%China 278 528 250 89.9% 9.6%Source: UN Comtrade database
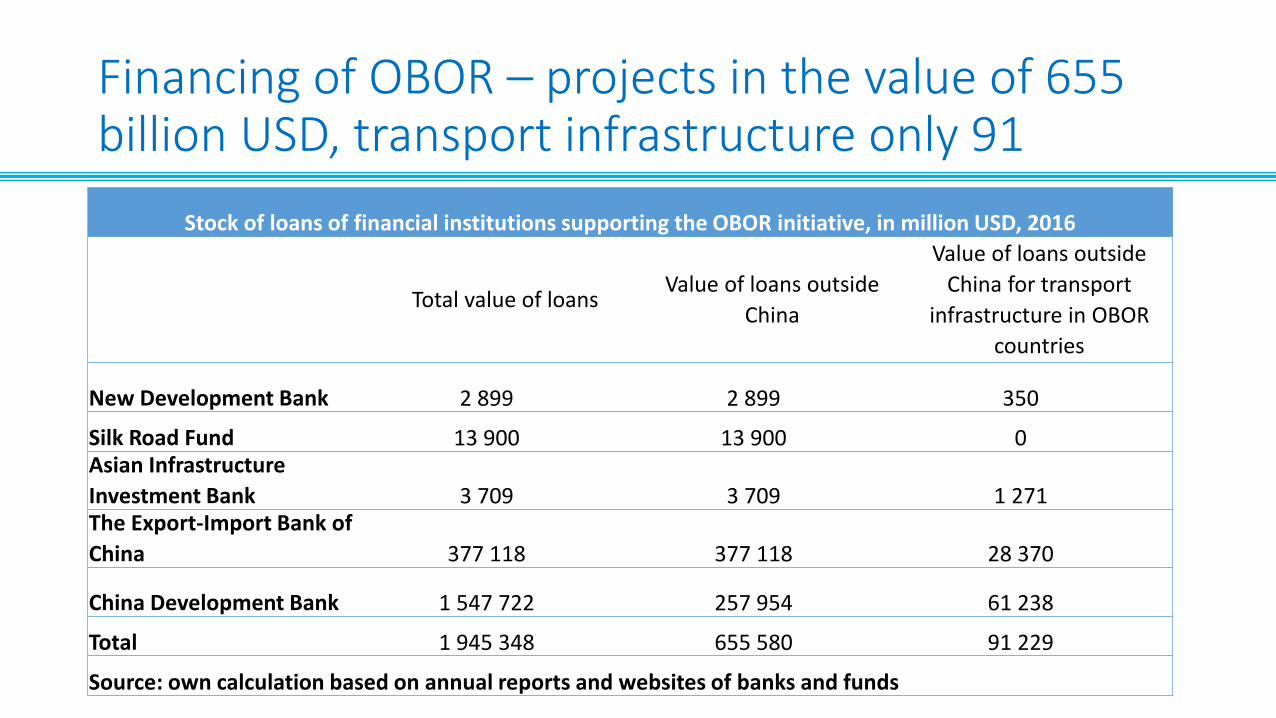
Financing of OBOR – projects in the value of 655 billion USD, transport infrastructure only 91
Stock of loans of financial institutions supporting the OBOR initiative, in million USD, 2016
Total value of loansValue of loans outside
China
Value of loans outside
China for transport
infrastructure in OBOR
countries
New Development Bank 2 899 2 899 350
Silk Road Fund 13 900 13 900 0Asian Infrastructure
Investment Bank 3 709 3 709 1 271The Export-Import Bank of
China 377 118 377 118 28 370
China Development Bank 1 547 722 257 954 61 238
Total 1 945 348 655 580 91 229
Source: own calculation based on annual reports and websites of banks and funds

Regional shift of production within China
• Inner-Chineese cities are further away from ports
• Closer to European – but even closer to Central-Asian, Iranian and Pakistani markets
GDP growth rate: %, 2007-2016The distribution of low-tech manufacturing in China
Source: Jun Hou, Stephen Gelb and Linda Calabrese: The shift in manufacturing employment in china
Source: National Bureau of Statistics

Value added by industry by region – still no major change
1996 2006 2016

Has China’s extensive internal infrastructure development reached it’s limits?
USA: 77,000 km autópályaArea: 9,147,420 km2
Population: 326,766,748
China: 133,000 km motorwayArea: 9,388,211 km2
Population: 1,415,045,928

High speed rail: two third of all lines of the world are in China!• The network is almost complete
• Till 2019 all major cities will be reached
• For China’s railway industry growing exports are vital
• The continuation of lines to neighboring countries could follow – only Vietnam has high population density

High speed rail – already very advanced
• From the total global ~41 thousandd km high speed rail ~27 thousand km in China (65%)
• The growth in global passenger km for high speed almost solely came from China.
Billion passenger km
Source: UIC
0,00
2 000,00
4 000,00
6 000,00
8 000,00
10 000,00
12 000,00
14 000,00
16 000,00
18 000,00
20 000,00
2007 2008 2009 2010 2011 2012 2013 2014 2015 2016
Development of passenger km in China (100 million)
Passenger-Kilometers of Railways Passenger-Kilometers of Highways
Passenger-Kilometers of Civil Aviation Source: National Bureau of Statistics
-1,3%
6,4%
13,0%
CAGR

The importance of rail is declining with thegrowth of distance
0,0%
5,0%
10,0%
15,0%
20,0%
25,0%
30,0%
35,0%
40,0%
45,0%
The role of railway in trade of the EU with Eurasian countries
Value Quantity
Source: European Union commercial trade database

How important railway became in railtranport with trade with China? 1) Quantity
0,0%
0,2%
0,4%
0,6%
0,8%
1,0%
1,2%
0
10 000
20 000
30 000
40 000
50 000
60 000
70 000
80 000
90 000
EU exports thousand tons
Sea Air Rail Other Share of railway
0,0%
0,5%
1,0%
1,5%
2,0%
2,5%
3,0%
3,5%
0
10 000
20 000
30 000
40 000
50 000
60 000
70 000
EU imports thousand tons
Sea Air Rail Other Share of railway
Source: European Union commercial trade database

How important railway became in railtranport with trade with China? 2) Value
Source: European Union commercial trade database
0,0%
0,2%
0,4%
0,6%
0,8%
1,0%
1,2%
0
10 000
20 000
30 000
40 000
50 000
60 000
70 000
80 000
90 000
EU exports million euros
Sea Air Rail Other Share of railway
0,0%
0,2%
0,4%
0,6%
0,8%
1,0%
1,2%
1,4%
1,6%
1,8%
0
50 000
100 000
150 000
200 000
250 000
300 000
350 000
400 000
EU imports million euros
Sea Air Rail Other Share of railway

Within the EU rail transport with China is veryconcentrated

Number of TEUs is growing, butstill low
17 611 32 00052 000
102 000
164 000
6 60412 000
30 000
51 000
99 000
24 21644 000
82 000
153 000
263 000
0
50 000
100 000
150 000
200 000
250 000
300 000
2013 2014 2015 2016 2017
Containers transported through Russia between EU and China
China-EU EU-China
Capacity: 21.413 TEU –all rail traffic is equal to 3 gigaliners traffic
Sanghai port: yearly 40.230.000 TEU –containers by rail equals 2,4 days traffic of
the port

In cross-border traffic EU-China container traffic is still less important than conventional goods
0,0%
1,0%
2,0%
3,0%
4,0%
5,0%
6,0%
7,0%
8,0%
0
2 000
4 000
6 000
8 000
10 000
12 000
14 000
16 000
2014 2015 2016
China - Kazakhstan border traffic, tons
China-Kazakhstan
EU China Containter traffic
EU China Containter traffic, share
0,0%
2,0%
4,0%
6,0%
8,0%
10,0%
12,0%
14,0%
16,0%
0
1 000
2 000
3 000
4 000
5 000
6 000
7 000
2014 2015 2016
Poland - Belarus border traffic, tons
Poland-Belarus
EU China Containter traffic
EU China Containter traffic, share

How many trains?
„The number of China-Europe freight train trips reached a new high of more than 3,000 last year, and is expected to reach 4,000 this year, according to China Railway Corporation.” 2018-01-20, Xinhuahttp://www.xinhuanet.com/english/2018-01/20/c_136911059.htm
Own calculation from timetables: in 2014 ~350 trains both direction, in2017 ~1800 trains both directions→ 2,5 trains / day / direction
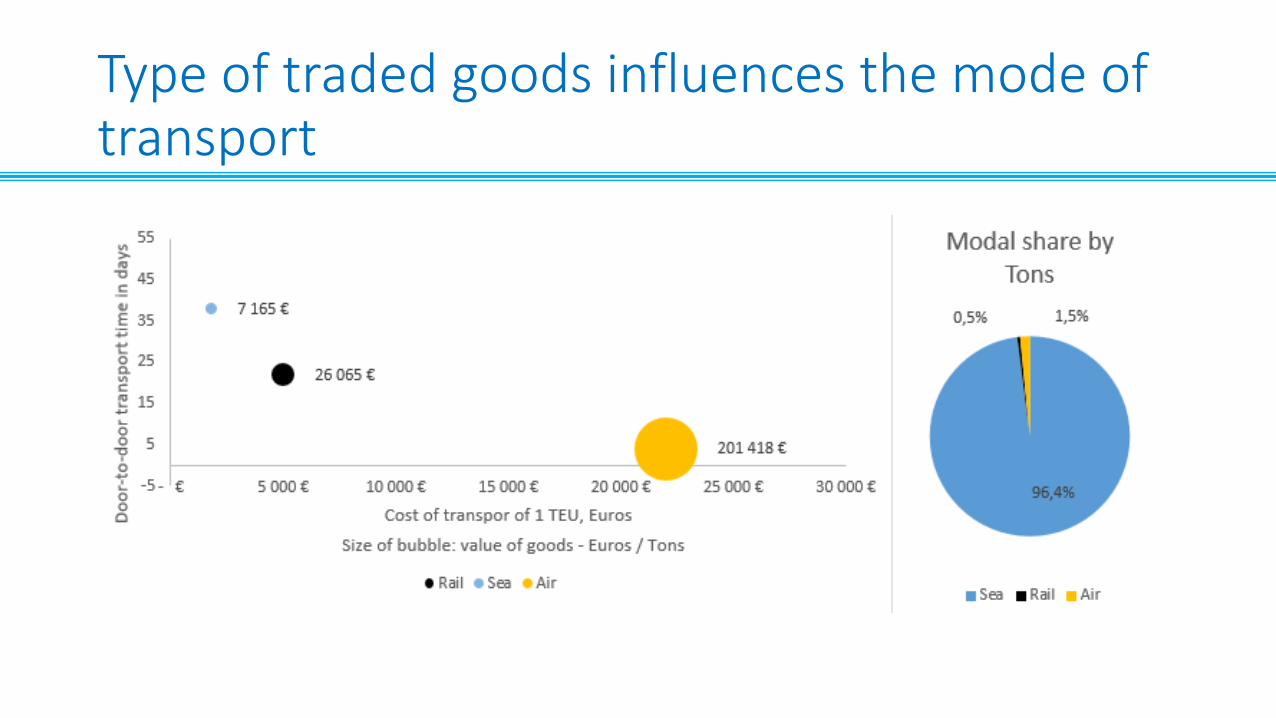
Type of traded goods influences the mode oftransport

Costs and subsidies
• Russia’s Trancontainer: „...cancellation of, or reductions in the government support may have an adverse effect on rail container transportation on relevant routes.”
• From the 5-6 thousand euros / container costs 1-2 thousand is provided by local governments in China, 20-30% of total costs!
• Is it worth it for the central government and the provinces?

Thank you for your attention!
Questions?