european bottled water - overvie · top 15 bottled water markets worldwide – by per capita...
TRANSCRIPT

European Bottled Water - Overview
Stewart Macintosh
16th June 2011

Confidential & Proprietary © Canadean
The Big Picture

Confidential & Proprietary © Canadean
Global Bottled Water
0
20,000
40,000
60,000
80,000
100,000
120,000
140,000
160,000
180,000
2000 2001 2002 2003 2004 2005 2006 2007 2008 2009 2010
M Litres

Confidential & Proprietary © Canadean
Top 15 Bottled Water Markets Worldwide – by per capita consumption
73
78
79
87
90
92
95
106
109
111
114
118
121
166
181 Italy
Germany
Spain
Belgium
Greece
France
Switzerland
Czech Republic
Hungary
USA
Litres per capita
Ranking: 2010
Austria
Argentina Portugal
Serbia
Poland
Global Total: 24.7

Confidential & Proprietary © Canadean
Top 15 Bottled Water Markets Worldwide – by volume
3,000
3,100
3,150
3,260
3,670
4,180
4,560
5,570
5,840
6,350
7,170
10,870
13,570
19,660
27,120 USA
China
Germany
Italy
France
Spain
Indonesia
Poland
Brazil
Russia
M Litres
Ranking: 2010
Argentina Nigeria
Mexico
Thailand
India
Global Total: 169 Billion Litres

Confidential & Proprietary © Canadean
Fastest Growing Bottled Water Markets Worldwide – by volume
64
71
82
118
193
296
309
332
397
443
545
609
683
1,189
2,774
USA
China
Turkey
Peru
France
Saudi Arabia
Indonesia
Poland
Brazil
Russia
M Litres
Incremental Volume
2009-2010
Philippines
Nigeria
Mexico
Thailand
India
Global Growth: 9,350 M Litres

Confidential & Proprietary © Canadean
Fastest Shrinking Bottled Water Markets Worldwide – by volume
(5)
(8)
(9)
(10)
(10)
(14)
(15)
(19)
(24)
(29)
(30)
-45
(52)
(208)
(451)
Czech Rep
Italy
Taiwan
Netherlands
Argentina
Norway
Greece
Croatia
Romania
Japan
M Litres
Incremental Volume
2009-2010
Hong Kong
Bulgaria
Bosnia
Switzerland
Spain
Global Growth: 9,350 M Litres

Confidential & Proprietary © Canadean
Within Europe

Confidential & Proprietary © Canadean
0
10,000
20,000
30,000
40,000
50,000
60,000
70,000
2000 2001 2002 2003 2004 2005 2006 2007 2008 2009 2010
West Europe
East Europe
Europe
Europe – East & West
Confidential & Proprietary © Canadean
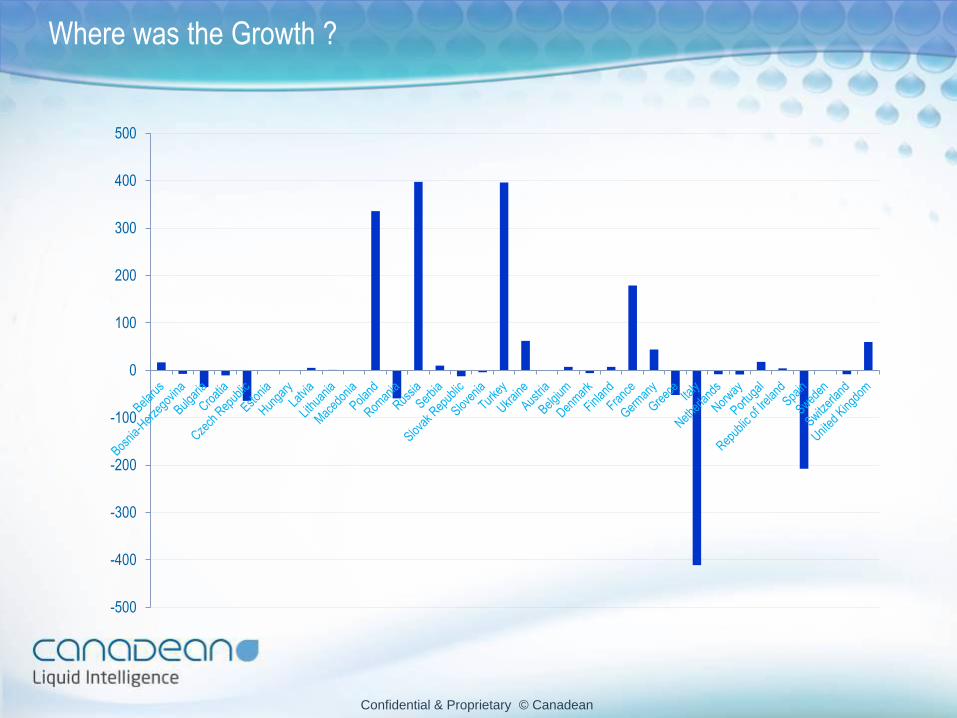
-500
-400
-300
-200
-100
0
100
200
300
400
500
Where was the Growth ?

Confidential & Proprietary © Canadean
-500
-400
-300
-200
-100
0
100
200
300
400
500
Where was the Growth ?

Confidential & Proprietary © Canadean
0
5,000
10,000
15,000
20,000
25,000
30,000
35,000
40,000
2000 2001 2002 2003 2004 2005 2006 2007 2008 2009 2010
Still
Light Carbonation
Sparkling
Europe - Carbonation

Confidential & Proprietary © Canadean
0
5,000
10,000
15,000
20,000
25,000
30,000
2000 2001 2002 2003 2004 2005 2006 2007 2008 2009 2010
Still
Light Carbonation
Sparkling
West Europe - Carbonation

Confidential & Proprietary © Canadean
0
1,000
2,000
3,000
4,000
5,000
6,000
7,000
8,000
9,000
2000 2001 2002 2003 2004 2005 2006 2007 2008 2009 2010
Still
Light Carbonation
Sparkling
East Europe - Carbonation

Confidential & Proprietary © Canadean
0
10,000
20,000
30,000
40,000
50,000
60,000
2000 2001 2002 2003 2004 2005 2006 2007 2008 2009 2010
Spring
Mineral
Table
Europe – Water Source

Confidential & Proprietary © Canadean
0
5,000
10,000
15,000
20,000
25,000
30,000
35,000
40,000
45,000
2000 2001 2002 2003 2004 2005 2006 2007 2008 2009 2010
Spring
Mineral
Table
West Europe – Water Source

Confidential & Proprietary © Canadean
0
1,000
2,000
3,000
4,000
5,000
6,000
7,000
8,000
9,000
10,000
2000 2001 2002 2003 2004 2005 2006 2007 2008 2009 2010
Spring
Mineral
Table
East Europe – Water Source

Confidential & Proprietary © Canadean
What’s Up, What’s Down
Mineral Low
Spring Low
Table Low
-300
-200
-100
0
100
200
300
400
Bel
arus
Bos
nia-
Her
zego
vina
Bul
garia
Cro
atia
Cze
ch R
epub
lic
Est
onia
Hun
gary
Latv
ia
Lith
uani
a
Mac
edon
ia
Pol
and
Rom
ania
Rus
sia
Ser
bia
Slo
vak
Rep
ublic
Slo
veni
a
Tur
key
Ukr
aine
Aus
tria
Bel
gium
Den
mar
k
Fin
land
Fra
nce
Ger
man
y
Gre
ece
Italy
Net
herla
nds
Nor
way
Por
tuga
l
Rep
ublic
of I
rela
nd
Spa
in
Sw
eden
Sw
itzer
land
Uni
ted
Kin
gdom
09-10 YOY Growth

Confidential & Proprietary © Canadean
What’s Up, What’s Down
Mineral Low
Mineral Still
Mineral Sparkling
Spring Still
Spring SparklingTable Still
-300
-200
-100
0
100
200
300
400
Bulgaria Hungary Poland Romania Russia Turkey Ukraine FranceGermany Greece Italy
Spain
09-10 YOY Growth
Confidential & Proprietary © Canadean
0
10,000
20,000
30,000
40,000
50,000
60,000
2000 2001 2002 2003 2004 2005 2006 2007 2008 2009 2010
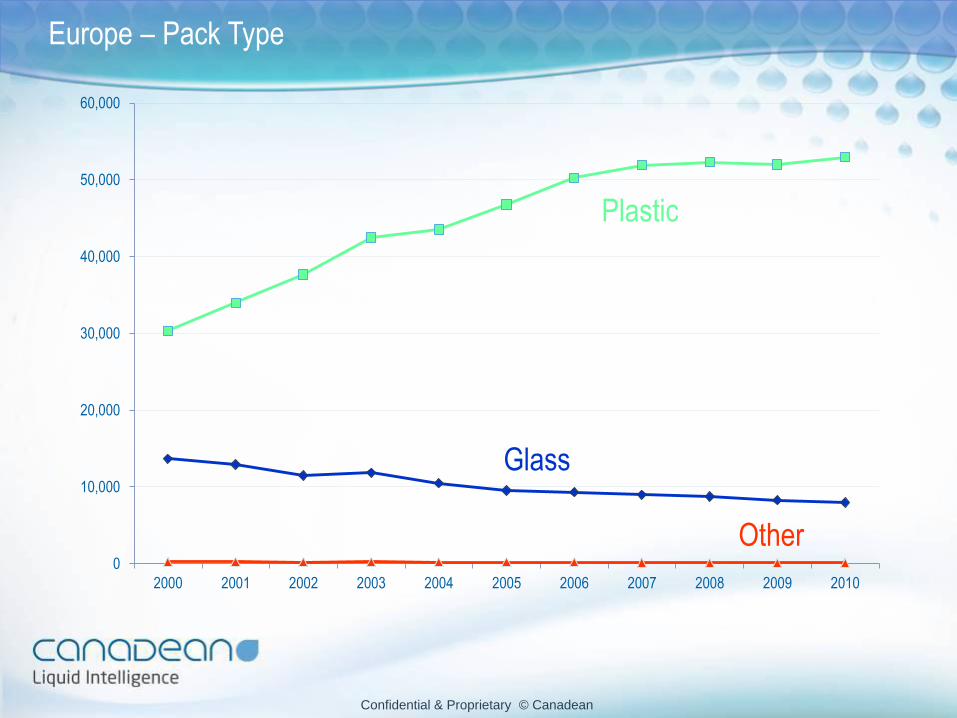
Plastic
Glass
Other
Europe – Pack Type

Confidential & Proprietary © Canadean
0
10,000
20,000
30,000
40,000
50,000
60,000
2000 2001 2002 2003 2004 2005 2006 2007 2008 2009 2010
Multiserve
Single Serve
Large
Europe – Pack Size
Confidential & Proprietary © Canadean
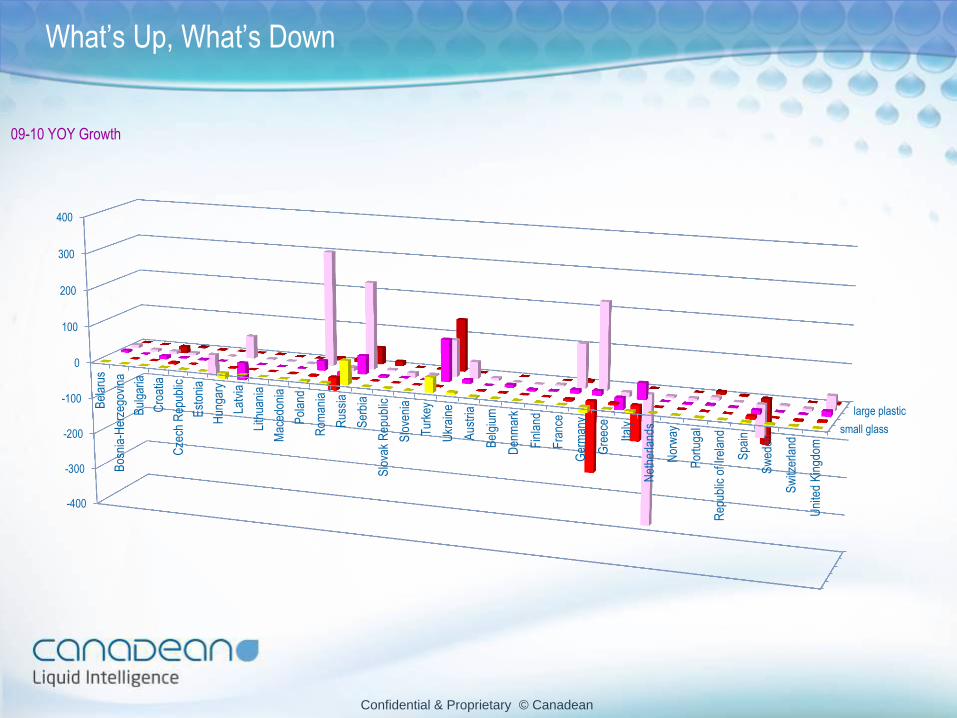
What’s Up, What’s Down
small glass
large plastic
-400
-300
-200
-100
0
100
200
300
400
Bel
arus
Bos
nia-
Her
zego
vina
Bul
garia
Cro
atia
Cze
ch R
epub
lic
Est
onia
Hun
gary
Latv
ia
Lith
uani
a
Mac
edon
ia
Pol
and
Rom
ania
Rus
sia
Ser
bia
Slo
vak
Rep
ublic
Slo
veni
a
Tur
key
Ukr
aine
Aus
tria
Bel
gium
Den
mar
k
Fin
land
Fra
nce
Ger
man
y
Gre
ece
Italy
Net
herla
nds
Nor
way
Por
tuga
l
Rep
ublic
of I
rela
nd
Spa
in
Sw
eden
Sw
itzer
land
Uni
ted
Kin
gdom
09-10 YOY Growth

Confidential & Proprietary © Canadean
0
5
10
15
20
25
2000 2001 2002 2003 2004 2005 2006 2007 2008 2009 2010
Europe – Private Label Share

Confidential & Proprietary © Canadean
Top 15 Private Label Markets – Europe, Bottled Water
21.0
22.4
22.6
22.8
23.7
24.1
25.7
28.3
30.5
30.6
31.4
33
37.9
41.6
41.9 Belgium
Germany
Netherlands
UK
Czech Rep
Hungary
Estonia
Slovenia
Switzerland
Sweden
Ranking: 2010 France Finland
Denmark
Latvia
Poland
European Average PL share: 19.9%

Confidential & Proprietary © Canadean
0
100
200
300
400
500
600
700
800
900
1,000
2000 2001 2002 2003 2004 2005 2006 2007 2008 2009 2010
Europe – Flavoured Water

Confidential & Proprietary © Canadean
0
500
1,000
1,500
2,000
2,500
Plain Water & Flavoured Water

Confidential & Proprietary © Canadean
Top 15 Brands – Europe, Bottled Water
Cristaline
San Benedetto
Evian
Levissima
Volvic
Sant’Anna di Vinadio
BonAqua
Erikli
Vittel
Gerolsteiner
Ranking: 2010 Zywiec Zdroj Vera
Aquarel
Norda
Font Vella

Confidential & Proprietary © Canadean
Top 15 Brand Owners – Europe, Bottled Water
Nestle
Danone Group
Coca-Cola
San Benedetto
Groupe Alma
Ferrarelle
Fonti di Vanadio
Hoevelmann
Sogeam
Norda
Ranking: 2010 Gerolsteiner PepsiCo
Hassia
Vichy Catalan
Cogedi

Confidential & Proprietary © Canadean
Who is Where
Sogeam
Fonti di Vinadio
Groupe Alma
San Benedetto
Coca-Cola
Danone Group
Nestle