european characterization factors for damage to natural vegetation by ozone in life cycle impact...
TRANSCRIPT

at SciVerse ScienceDirect
Atmospheric Environment 77 (2013) 318e324
Contents lists available
Atmospheric Environment
journal homepage: www.elsevier .com/locate/atmosenv
European characterization factors for damage to natural vegetation byozone in life cycle impact assessment
Thomas M.W. J. van Goethem a,*, Philipp Preiss b, Ligia. B. Azevedo a, Joachim Roos b,Rainer Friedrich b, Mark. A.J. Huijbregts a, Rosalie van Zelm a
aDepartment of Environmental Science, Institute for Water and Wetland Research, Radboud University Nijmegen, P.O. Box 9010,6500 GL Nijmegen, The NetherlandsbDepartment for Technology Assessment and Environment (TFU), Institute for Energy Economics and the Rational Use of Energy (IER), Universität Stuttgart,Hessbruehlstr. 49a, 70565 Stuttgart, Germany
h i g h l i g h t s
� Characterization Factors expressing damage to natural vegetation by ozone were derived.� Emissions and deposition of NOx and NMVOC in 65 European regions were included.� Characterization factors were largest for NOx emissions in Southern European regions.� NOx contributes for 81% to ozone damage in natural vegetation in Europe.� NOx contributes more to ozone than to acidification effects on natural vegetation.
a r t i c l e i n f o
Article history:Received 8 February 2013Received in revised form1 May 2013Accepted 3 May 2013
Keywords:Atmospheric fate factorNOx and NMVOCAOT40Trees and grasslandEffect factorSpecies sensitivity distribution
* Corresponding author. Tel.: þ31 243652060; fax:E-mail address: [email protected] (T.M.W.J.
1352-2310/$ e see front matter � 2013 Elsevier Ltd.http://dx.doi.org/10.1016/j.atmosenv.2013.05.009
a b s t r a c t
Spatially explicit characterization factors (CFs) for tropospheric ozone damage on natural vegetationcaused by anthropogenic NOx and NMVOC emissions are presented for 65 European regions. The CFswere defined as the area-integrated increase in the potentially affected fraction (PAF) of trees andgrassland species due to a change in emission of NOx and NMVOCs. The CF consists of a Fate Factor,quantifying the relationship between the emission of precursor substances and ozone exposure, and anarea-integrated Effect Factor, quantifying the relationship between ozone exposure and the damage tonatural vegetation. The relationships describing the ecological effects of a pollutant were based on alognormal relationship between the PAF and ground level ozone concentration. We found higher CFs forNOx compared to NMVOC, and these were largest in south European regions. Furthermore, we found thatboth the fate factor and effect factor contribute to the spatial differences found in the CFs. Our studyshows that effects caused by ozone exposure from NOx emissions are larger than those of acidificationcaused by NOx, indicating the importance of including ozone effects to natural vegetation in life cycleassessment studies.
� 2013 Elsevier Ltd. All rights reserved.
1. Introduction
Long term surveys show that tropospheric ozone backgroundconcentrations have significantly increased over recent decades,and concentrations are predicted to further increase with 0.5e2%per year over the next 50 years in the Northern Hemisphere(Vingarzan, 2004; Derwent et al., 2007). Tropospheric ozone in agiven area can have several sources, such as downward transport ofstratospheric ozone to the troposphere or by photochemical
þ31 243553450.van Goethem).
All rights reserved.
reactions of nitrogen oxides (NOx) and non-methane volatileorganic compounds (NMVOCs). NOx and NMVOC are primary pre-cursor substances originating from anthropogenic and non-anthropogenic emissions. These pollutants can come from localsources or long-range transport (Ainsworth et al., 2012). Ozone isrecognized as an important air pollutant, affecting human healthand vegetation, including trees and grassland species (Ashmore,2005). Adverse effects in plants include reduction of growth andseed production, premature senescence, reduced ability to with-stand stressors, and increased leaf injuries (Emberson et al., 2003).
In life cycle impact assessment (LCIA), characterization factors(CFs) estimate the environmental impact of a pollutant per unit ofemission (Udo de Haes et al., 2002). Although CFs are available for
T.M.W.J. van Goethem et al. / Atmospheric Environment 77 (2013) 318e324 319
human health damage caused by ozone (e.g. Van Zelm et al., 2008),studies assessing the impact to natural ecosystems have yet onlyincluded regionalized fate and exposure modelling, excluding ef-fects on natural vegetation (Bare, 2011; Hauschild et al., 2006;Frechette-Marleau et al., 2008). Recently, Van Goethem et al. (2013)developed quantitative exposureeeffect relationships for ozone onnatural vegetation (forests and natural grasslands, respectively).These relationships can be used to include ozone effects on naturalecosystems in LCIA.
The aim of this study was to determine region-specific charac-terization factors for damage on natural vegetation of troposphericozone caused by anthropogenic NOx and NMVOC emissions. TheCFs were characterized for 65 European regions and subsequentlycompared to assess the differences in impact between the regions.Furthermore, normalization factors for ozone exposure on naturalvegetation were presented. The normalization factor equals thepotentially affected fraction of natural plant species in Europe dueto emissions of NOx and NMVOC in 2010 per capita.
2. Methods
2.1. Characterization factors
The characterisation factors were defined as the area-integratedchange in Potentially Affected Fraction (PAF) of forest and naturalgrassland species due to a change in emission of ozone precursorsubstances, i.e. NOx or NMVOC (in m2 yr kg�1). The CF consists of aFate Factor (FF), quantifying the relationship between the emissionof precursor substances and ozone exposure, and an Effect Factor(EF), quantifying the relationship between ozone exposure and thedamage to natural vegetation. Ozone exposure is expressed as thesum of the differences between the hourly mean ozone concen-tration and 40 ppb during daylight hours over the relevant growingseason (AOT40 in ppm h). The CFs for ozone were calculated for 65European regions separately as;
CFx;i;e ¼Xj
Xe
�FFx;i/j$EFj;e
�(1)
where FFx,i/j (ppm h yr kg�1) is the partial fate factor representingthe change in AOT40 in receiving grid j (spatial resolution of0.5 � 0.5�) following a change in the emission of substance x (i.e.NOx and NMVOCs) in region i and the effect factor EFj,e(m2 ppm�1 h) is the change in the PAF of species of vegetation e (i.e.trees and grasslands) in grid j due to a change in ozone exposure.
2.2. Fate factor
The partial fate factor (FFi/j, unit: ppm h yr kg�1) represents thechange in AOT40 in a receiving compartment cell j (DAOT40i,j, unit:ppb h) due to a change of emission of precursor x in region i (DMi,[kg yr�1]):
FFx;i/j ¼DAOT40j
DMi(2)
The exposure is taken over time and for daytime only (Tuovinen,2000). The AOT40 exposure index is a measure of chronic ozoneexposure widely used in the risk assessment of ozone (LRTAP,2004).
Partial fate factors for the European continent were determinedwith the EMEP atmospheric chemical transport model, whichsimulates emissions, atmospheric transport, chemical trans-formation, and removal from air of NOx and NMVOCs and estimatesground level ozone concentrations (Tarrasón, 2009a). To calculate
FFs for the grassland vegetation, the change in AOT40 on 1mgroundlevel height was used. For the trees vegetation the upper canopyheight (3 m) was used. The model divides Europe into 65 emissionsource regions (EMEP, 2008), and receptor grid cells of 0.5� � 0.5�.To derive the partial fate factors, emissions of NOx and NMVOCs aredecreased by 15% compared to the baseline emission inventory foreach region. The 15% represents a realistic “quasi-marginal” changeof emissions but still allows to assume sufficient linearity and todownscale the change of impacts to a unit of emission change(Tarrasón, 2009b). FFs were determined for each region, precursorpollutant, and 2010 background emissions. The emission dataset for2010 corresponds to the baseline Current Legislation (CLE) scenario,developed by IIASA for the development of the Thematic StrategyonAir (Amann et al., 2008; Tarrasón, 2009b). Because of inter-annualvariability in the meteorology, average results based on meteoro-logical years 1996,1997,1998, and 2000were derived as these yearsrepresent typical conditions (Tarrasón, 2009a).
2.3. Effect factor
EFs were derived via the following steps. First, species-specificAOT40 exposureebiomass response functions, as reported by VanGoethem et al. (2013), were used to derive EC50 values for treesand grassland species. The species-specific EC50 equals the AOT40at which there is a 50% reduction in biomass compared to a situa-tion with no ozone over-exposure, i.e. AOT40 ¼ 0. We selected theEC50, as it follows the same approach employed for toxicity in LCA(see e.g. Rosenbaum et al., 2008). Note that some species showed tobe insensitive to ozone exposure, i.e. no EC50 value was derived forthese species. In a second step, we used the EC50-values to derive aSpecies Sensitivity Distribution (SSD) for respectively forest andnatural grassland species, taking into account the fraction of specieswith no biomass decrease. An SSDs represents a cumulativestressor-response distribution based on single-species sensitivitydata. Assuming a lognormal species sensitivity distribution forozone exposure, the PAF can be derived as:
PAFj;e ¼ 1� fnbdse$
ffiffiffiffiffiffiffiffiffi2$p
p$AOT40j;e$ln10
$
ZAOT40
0
exp
��� 12$
�log
�AOT40j;e
�� mese
�2�dAOT40
(3)
where AOT40j,e represents the ambient ozone concentration in gridj of vegetation type e (either forest or natural grassland), me is theaverage of the 10logEC50 values for ozone in AOT40-units (ppm h),as observed for different species in vegetation type e, fnbd is thefraction of species with no biomass decrease and se is the standarddeviation of the 10logEC50-data within vegetation type e.
In a third step, we calculated the marginal change in PAF due tothe marginal change in ground level ozone exposure (in ppm h),equal to the derivative of Equation (3), via:
vPAFj;evAOT40j
¼ 1� fnbdse$
ffiffiffiffiffiffiffiffiffi2$p
p$AOT40j;e$ln10
$exp
��� 12$
�log
�AOT40j;e
�� mese
�2� (4)
In a final step, the grid-specific marginal effect factor (MEF) pervegetation type was defined as:
MEFj;e ¼ vPAFj;evAOT40j
$Aj;e (5)

Fig. 1. Species sensitivity distributions based on EC50 values for trees (n ¼ 9) andgrassland (n ¼ 87) using a lognormal distribution.
T.M.W.J. van Goethem et al. / Atmospheric Environment 77 (2013) 318e324320
where Aj,e is the area (m2) occupied by vegetation type e in grid j.The AOT40j,e data were based on grid-specific background
AOT40 concentrations for 2010 determined by the EMEP model(Simpson et al., 2003). For the grassland vegetation, AOT40 valuesbased on a growing season of MayeJuly and a ground level heightof 1 m were used. For the trees vegetation, AprileSeptember andthe upper canopy height (3 m) was used. The Global Land Cover2000 (GLC2000) database was used to calculate the grid-specificarea occupied by each vegetation type (Bartholomé and Belward,2005). Classification of GLC2000 types into trees and grasslandscan be found in Table S1.
2.4. Sensitivity analysis
To test the sensitivity of the CF regarding the relationshipdescribing the ecological effects of ozone on natural vegetation, themarginal effect factor (MEF) was compared to two other options tocalculate an effect factor. This was done because there is noconsensus yet in the best way to derive an EF (Huijbregts et al.,2011).
A simplified EF, assuming a linear change in PAF with changingAOT40 represents the average effect between a PAF of 0.5 and 0.This linear method is commonly used in ecotoxicology (Penningtonet al., 2004):
LEFj;e ¼ DPAFj;eDAOT40j
$Aj;e ¼ 0:5$ð1� fnbdÞ10m
$Aj;e (6)
where 10m is the AOT40 value that affects 50% of the species invegetation type e in grid j.
For the average effect factor (AEF), it is assumed that the dis-tance between the current and desired situation is proportionallydistributed over the stressor range. And, as opposed to LEF, theactual concentration of AOT40 in grid j (AOT40j) estimates theaverage distance to the PAF at 0 (Huijbregts et al., 2011). Theaverage distance between the current state and the preferred stateof the environment can be calculated as:
AEFj;e ¼ DPAFj;eDAOT40j
$Aj;e ¼ PAFj;eAOT40j
$Aj;e (7)
where PAFj,e is related to the AOT40j,e representing the ambientozone concentration in grid j of vegetation type e.
2.5. Normalization factor
The normalization factors (NF) for ozone impacts in Europewere derived by multiplication of the region-specific character-ization factors with the substance-specific emissions in each regionof 2010, divided by the total population in all regions (Table S2)(Vestreng et al., 2012). The normalization factor equals the area-integrated potentially affected fraction of natural plant species inEurope due to emissions in 2010 of NOx and NMVOC per capita (inPAF m2 capita�1):
NF ¼P
xP
i�Mx;i$CFx;i
�P
i�Npop;i
� (8)
where NF is the normalization factor of the summation of all 65regions. Mx,i is the emission of precursor x (NMVOC or NOx) in re-gion i (in kg yr�1), CFx,i is the characterization factor for substance xin region i and Npop,i is the number of inhabitants in region i(CIESIN, 2005).
2.6. Statistical analysis
Pearson correlation test was used to determine linear correla-tion between CF and total Fate Factor to have an indication if the FFcontributes most to the variation in CF results for emissions of bothNMVOC and NOx.
3. Results
3.1. Species sensitivity distributions
Fig. 1 shows the species sensitivity distributions for grasslandspecies and trees based on EC50-data with the fraction of specieswith no biomass decrease included. The SSDs were based on 87grassland species and 9 tree species. The percentage of species inthe dataset that exhibited a biomass reduction was 71% for grass-land species and 100% for tree species.
3.2. Characterization factors
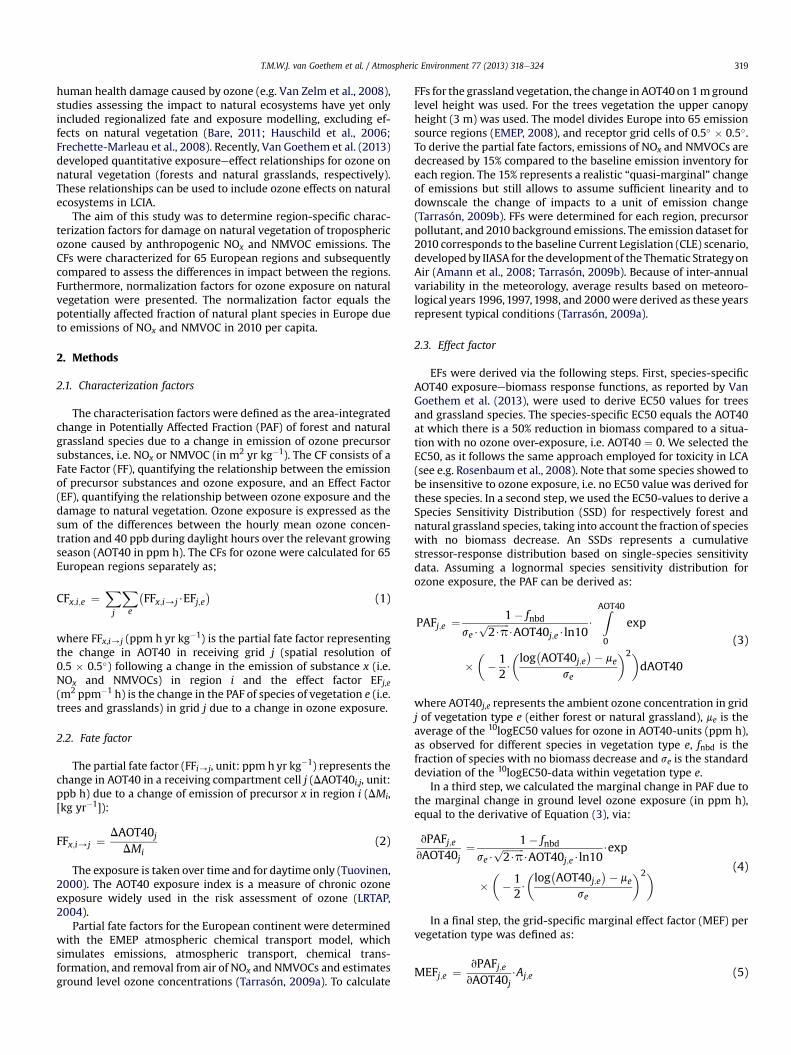
Characterization factors for damage to natural vegetation bytropospheric ozone were calculated for 65 European regions bothfor NMVOC and NOx (in m2 yr kg�1) (Fig. 2). The full region-specificresults are given in the SI (Table S3). The region-specific CFs andemission weighted CFs for Europe are included in Table S3.Weighing was done based on region specific emissions in 2010(Table S2) (Vestreng et al., 2012). The CFs for ozone damage due toNMVOC emissions range from 0.3 to 5.0 m2 yr kg�1, with smallestCFs for Sweden and Finland and largest for Luxembourg and Italy.The CFs for NOx emissions range from�0.3 to 20.6 m2 yr kg�1, withsmallest a negative CF for the Netherlands and largest CFs forFrance and Switzerland. The negative CFs for NOx indicate thatincreased emissions will actually lead to a net reduced ozoneexposure. Overall, the CFs for NOx emissions are largest in SouthEuropean regions. For NMVOC emissions CFs are largest for regionsin Central Europe.
The correlation between CF and the total FF was tested. This wasdone by plotting the characterization factors versus the sum of thepartial fate factors (
PFF) for every emission region (Fig. 3). A cor-
relation between CF andP
FF was found by using the Pearsoncorrelation test, r-values of 0.73 and 0.70 were found for NMVOCand NOx respectively. Both r-values were reported with a p-value<0.0001. However, the R-squares of the linear regressions, 0.53 and
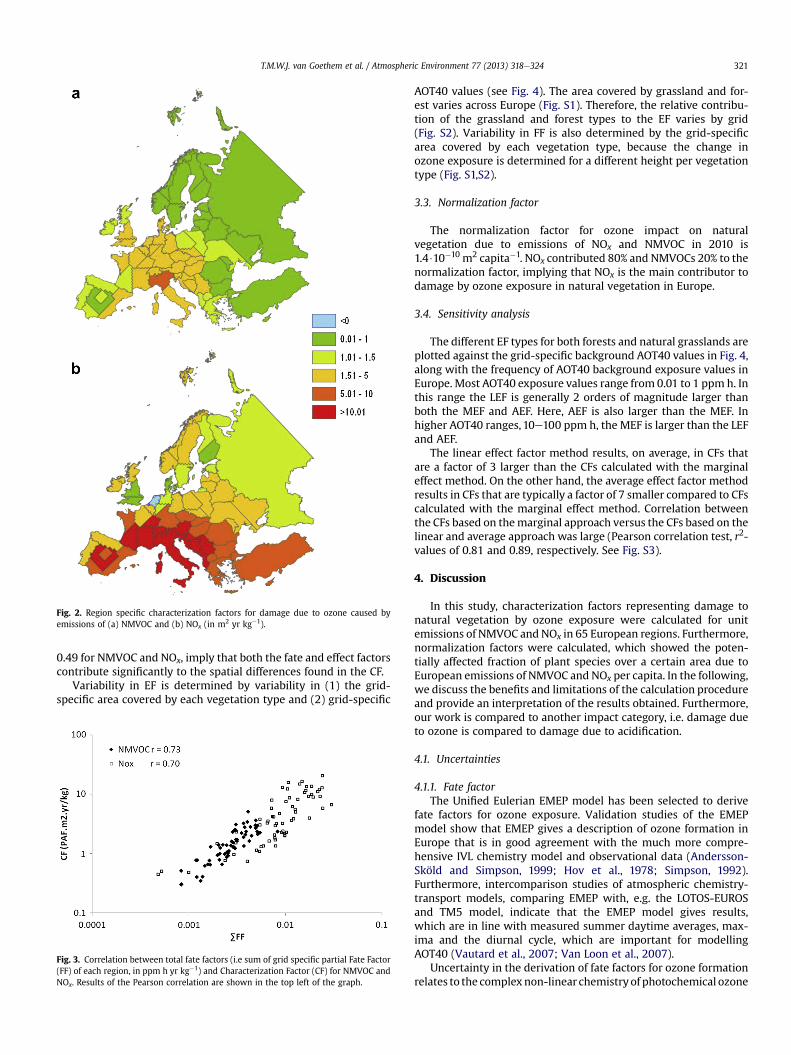
Fig. 2. Region specific characterization factors for damage due to ozone caused byemissions of (a) NMVOC and (b) NOx (in m2 yr kg�1).
T.M.W.J. van Goethem et al. / Atmospheric Environment 77 (2013) 318e324 321
0.49 for NMVOC and NOx, imply that both the fate and effect factorscontribute significantly to the spatial differences found in the CF.
Variability in EF is determined by variability in (1) the grid-specific area covered by each vegetation type and (2) grid-specific
Fig. 3. Correlation between total fate factors (i.e sum of grid specific partial Fate Factor(FF) of each region, in ppm h yr kg�1) and Characterization Factor (CF) for NMVOC andNOx. Results of the Pearson correlation are shown in the top left of the graph.
AOT40 values (see Fig. 4). The area covered by grassland and for-est varies across Europe (Fig. S1). Therefore, the relative contribu-tion of the grassland and forest types to the EF varies by grid(Fig. S2). Variability in FF is also determined by the grid-specificarea covered by each vegetation type, because the change inozone exposure is determined for a different height per vegetationtype (Fig. S1,S2).
3.3. Normalization factor
The normalization factor for ozone impact on naturalvegetation due to emissions of NOx and NMVOC in 2010 is1.4$10�10 m2 capita�1. NOx contributed 80% and NMVOCs 20% to thenormalization factor, implying that NOx is the main contributor todamage by ozone exposure in natural vegetation in Europe.
3.4. Sensitivity analysis
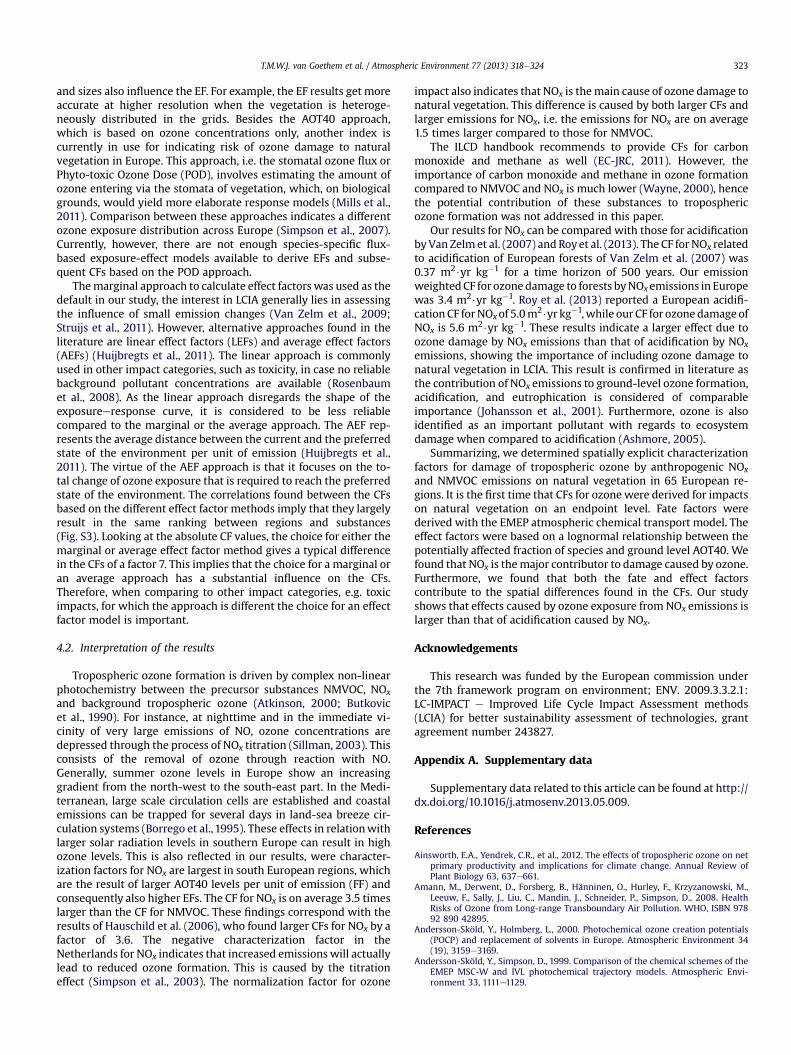
The different EF types for both forests and natural grasslands areplotted against the grid-specific background AOT40 values in Fig. 4,along with the frequency of AOT40 background exposure values inEurope. Most AOT40 exposure values range from 0.01 to 1 ppm h. Inthis range the LEF is generally 2 orders of magnitude larger thanboth the MEF and AEF. Here, AEF is also larger than the MEF. Inhigher AOT40 ranges, 10e100 ppm h, the MEF is larger than the LEFand AEF.
The linear effect factor method results, on average, in CFs thatare a factor of 3 larger than the CFs calculated with the marginaleffect method. On the other hand, the average effect factor methodresults in CFs that are typically a factor of 7 smaller compared to CFscalculated with the marginal effect method. Correlation betweenthe CFs based on themarginal approach versus the CFs based on thelinear and average approach was large (Pearson correlation test, r2-values of 0.81 and 0.89, respectively. See Fig. S3).
4. Discussion
In this study, characterization factors representing damage tonatural vegetation by ozone exposure were calculated for unitemissions of NMVOC and NOx in 65 European regions. Furthermore,normalization factors were calculated, which showed the poten-tially affected fraction of plant species over a certain area due toEuropean emissions of NMVOC and NOx per capita. In the following,we discuss the benefits and limitations of the calculation procedureand provide an interpretation of the results obtained. Furthermore,our work is compared to another impact category, i.e. damage dueto ozone is compared to damage due to acidification.
4.1. Uncertainties
4.1.1. Fate factorThe Unified Eulerian EMEP model has been selected to derive
fate factors for ozone exposure. Validation studies of the EMEPmodel show that EMEP gives a description of ozone formation inEurope that is in good agreement with the much more compre-hensive IVL chemistry model and observational data (Andersson-Sköld and Simpson, 1999; Hov et al., 1978; Simpson, 1992).Furthermore, intercomparison studies of atmospheric chemistry-transport models, comparing EMEP with, e.g. the LOTOS-EUROSand TM5 model, indicate that the EMEP model gives results,which are in line with measured summer daytime averages, max-ima and the diurnal cycle, which are important for modellingAOT40 (Vautard et al., 2007; Van Loon et al., 2007).
Uncertainty in the derivation of fate factors for ozone formationrelates to the complexnon-linear chemistry of photochemical ozone

Fig. 4. Marginal Effect Factors (MEF), Linear Effect Factors (LEF) and Average Effect Factors (AEF) (with area excluded) for (A) grasslands and (B) forests (left vertical axis). And AOT40values per grid (right vertical axis) for grasslands and forest plotted as a frequency distribution with steps of 0.02 ppm h.
T.M.W.J. van Goethem et al. / Atmospheric Environment 77 (2013) 318e324322
creation, including the interaction between the precursors NOx andNMVOC, and meteorological conditions (Simpson et al., 2003;Solberg et al., 2004). Emission inventories are a large source of un-certainty in model predictions (Atkinson, 2000). Meteorologicallyinduced variability of AOT40 shows a gradient decreasing fromnorth-west to south-east Europe (EEA, 2009). The variability wasestimated as approximately 10% for southern Europe, 20e30% incentral Europe and 50% ormore in the United Kingdom (EEA, 2009).Further uncertainty arises due to the fact that different NMVOCsubstances have different potential to create ozone (Andersson-Sköld and Holmberg, 2000). The mixture of different NMVOCs candiffer across regions and sectors. However, the current FF is anaverage for the common mix of NMVOCs. The model can beimproved by including sector dependent NMVOC speciation or evensubstance-specific model runs (Derwent et al., 2007).
Because only the EMEP regions are covered, receptor areasoutside this area are not taken into account in the fate factor cal-culations. As a result, the area-integrated ozone exposure will beunderestimated for NMVOC and NOx emissions, because impactsdue to ozone outside of the receptor area are not taken intoaccount.
4.1.2. Effect factorThe GLC2000 database was used to calculate the grid-specific
area occupied by each vegetation type. However, not all GLC2000land cover classes corresponded in terms of species composition toour classification in vegetation types, therefore making the rightallocation for some of the classes uncertain, especially for transi-tional vegetation (Table S1). For instance, the shrub cover class wasappointed to the grassland type but it might contain tree species as
well. Making a more detailed division in vegetation types, however,was not possible because of lack of detailed response data for awide range of taxonomic groups.
The relationships between ozone exposure and damage forforests and grasslands were calculated using species-specificexposure-response data based on experimental studies (VanGoethem et al., 2013). However, in contrast to Van Goethem et al.(2013) no distinction was made between annual and perennialgrassland species, because no grid-specific data on the area eachspecies group occupied was available. A general concern regardingthe exposure-response data is that the sensitivity to ozone expo-sure can be overestimated at the community level due to a biastowards the use of sensitive species in fumigation experiments,therefore leading to overestimated CFs (Mills et al., 2007).Furthermore, there are uncertainties regarding variation in atmo-spheric conditions and species responses (Fuhrer, 2002). In litera-ture significant inter- and intraspecific variation in response toozone exposure was reported for species occurring in multiple re-gions (Oksanen et al., 2001). This variation is mostly explained bydifferences in climate, for instance, climatic factors such as highvapour pressure deficits can reduce ozone uptake through stomata(Biswas et al., 2008). This implies that region-specific SSDs areneeded to show the distinctly different environmental conditionsand species assemblages, e.g. on an ecoregion or biome level. Thiswas, however, not possible due to lack of available data (VanGoethem et al., 2013). Furthermore, there is larger uncertainty inthe tree SSD because it was based on 9 tree species compared to 61species for grassland. However, the EF for grassland has a highercontribution to the CF compared to the EF for forests, thereforelimiting overall uncertainty (Fig. S4). The receptor grid resolution
T.M.W.J. van Goethem et al. / Atmospheric Environment 77 (2013) 318e324 323
and sizes also influence the EF. For example, the EF results get moreaccurate at higher resolution when the vegetation is heteroge-neously distributed in the grids. Besides the AOT40 approach,which is based on ozone concentrations only, another index iscurrently in use for indicating risk of ozone damage to naturalvegetation in Europe. This approach, i.e. the stomatal ozone flux orPhyto-toxic Ozone Dose (POD), involves estimating the amount ofozone entering via the stomata of vegetation, which, on biologicalgrounds, would yield more elaborate response models (Mills et al.,2011). Comparison between these approaches indicates a differentozone exposure distribution across Europe (Simpson et al., 2007).Currently, however, there are not enough species-specific flux-based exposure-effect models available to derive EFs and subse-quent CFs based on the POD approach.
Themarginal approach to calculate effect factors was used as thedefault in our study, the interest in LCIA generally lies in assessingthe influence of small emission changes (Van Zelm et al., 2009;Struijs et al., 2011). However, alternative approaches found in theliterature are linear effect factors (LEFs) and average effect factors(AEFs) (Huijbregts et al., 2011). The linear approach is commonlyused in other impact categories, such as toxicity, in case no reliablebackground pollutant concentrations are available (Rosenbaumet al., 2008). As the linear approach disregards the shape of theexposureeresponse curve, it is considered to be less reliablecompared to the marginal or the average approach. The AEF rep-resents the average distance between the current and the preferredstate of the environment per unit of emission (Huijbregts et al.,2011). The virtue of the AEF approach is that it focuses on the to-tal change of ozone exposure that is required to reach the preferredstate of the environment. The correlations found between the CFsbased on the different effect factor methods imply that they largelyresult in the same ranking between regions and substances(Fig. S3). Looking at the absolute CF values, the choice for either themarginal or average effect factor method gives a typical differencein the CFs of a factor 7. This implies that the choice for a marginal oran average approach has a substantial influence on the CFs.Therefore, when comparing to other impact categories, e.g. toxicimpacts, for which the approach is different the choice for an effectfactor model is important.
4.2. Interpretation of the results
Tropospheric ozone formation is driven by complex non-linearphotochemistry between the precursor substances NMVOC, NOx
and background tropospheric ozone (Atkinson, 2000; Butkovicet al., 1990). For instance, at nighttime and in the immediate vi-cinity of very large emissions of NO, ozone concentrations aredepressed through the process of NOx titration (Sillman, 2003). Thisconsists of the removal of ozone through reaction with NO.Generally, summer ozone levels in Europe show an increasinggradient from the north-west to the south-east part. In the Medi-terranean, large scale circulation cells are established and coastalemissions can be trapped for several days in land-sea breeze cir-culation systems (Borrego et al., 1995). These effects in relationwithlarger solar radiation levels in southern Europe can result in highozone levels. This is also reflected in our results, were character-ization factors for NOx are largest in south European regions, whichare the result of larger AOT40 levels per unit of emission (FF) andconsequently also higher EFs. The CF for NOx is on average 3.5 timeslarger than the CF for NMVOC. These findings correspond with theresults of Hauschild et al. (2006), who found larger CFs for NOx by afactor of 3.6. The negative characterization factor in theNetherlands for NOx indicates that increased emissionswill actuallylead to reduced ozone formation. This is caused by the titrationeffect (Simpson et al., 2003). The normalization factor for ozone
impact also indicates that NOx is themain cause of ozone damage tonatural vegetation. This difference is caused by both larger CFs andlarger emissions for NOx, i.e. the emissions for NOx are on average1.5 times larger compared to those for NMVOC.
The ILCD handbook recommends to provide CFs for carbonmonoxide and methane as well (EC-JRC, 2011). However, theimportance of carbon monoxide and methane in ozone formationcompared to NMVOC and NOx is much lower (Wayne, 2000), hencethe potential contribution of these substances to troposphericozone formation was not addressed in this paper.
Our results for NOx can be compared with those for acidificationbyVan Zelm et al. (2007) and Royet al. (2013). The CF for NOx relatedto acidification of European forests of Van Zelm et al. (2007) was0.37 m2$yr kg�1 for a time horizon of 500 years. Our emissionweightedCF for ozonedamage to forests byNOxemissions in Europewas 3.4 m2$yr kg�1. Roy et al. (2013) reported a European acidifi-cation CF forNOxof 5.0m2$yr kg�1,while our CF for ozonedamageofNOx is 5.6 m2$yr kg�1. These results indicate a larger effect due toozone damage by NOx emissions than that of acidification by NOx
emissions, showing the importance of including ozone damage tonatural vegetation in LCIA. This result is confirmed in literature asthe contribution of NOx emissions to ground-level ozone formation,acidification, and eutrophication is considered of comparableimportance (Johansson et al., 2001). Furthermore, ozone is alsoidentified as an important pollutant with regards to ecosystemdamage when compared to acidification (Ashmore, 2005).
Summarizing, we determined spatially explicit characterizationfactors for damage of tropospheric ozone by anthropogenic NOx
and NMVOC emissions on natural vegetation in 65 European re-gions. It is the first time that CFs for ozone were derived for impactson natural vegetation on an endpoint level. Fate factors werederived with the EMEP atmospheric chemical transport model. Theeffect factors were based on a lognormal relationship between thepotentially affected fraction of species and ground level AOT40. Wefound that NOx is themajor contributor to damage caused by ozone.Furthermore, we found that both the fate and effect factorscontribute to the spatial differences found in the CFs. Our studyshows that effects caused by ozone exposure from NOx emissions islarger than that of acidification caused by NOx.
Acknowledgements
This research was funded by the European commission underthe 7th framework program on environment; ENV. 2009.3.3.2.1:LC-IMPACT e Improved Life Cycle Impact Assessment methods(LCIA) for better sustainability assessment of technologies, grantagreement number 243827.
Appendix A. Supplementary data
Supplementary data related to this article can be found at http://dx.doi.org/10.1016/j.atmosenv.2013.05.009.
References
Ainsworth, E.A., Yendrek, C.R., et al., 2012. The effects of tropospheric ozone on netprimary productivity and implications for climate change. Annual Review ofPlant Biology 63, 637e661.
Amann, M., Derwent, D., Forsberg, B., Hänninen, O., Hurley, F., Krzyzanowski, M.,Leeuw, F., Sally, J., Liu, C., Mandin, J., Schneider, P., Simpson, D., 2008. HealthRisks of Ozone from Long-range Transboundary Air Pollution. WHO, ISBN 97892 890 42895.
Andersson-Sköld, Y., Holmberg, L., 2000. Photochemical ozone creation potentials(POCP) and replacement of solvents in Europe. Atmospheric Environment 34(19), 3159e3169.
Andersson-Sköld, Y., Simpson, D., 1999. Comparison of the chemical schemes of theEMEP MSC-W and IVL photochemical trajectory models. Atmospheric Envi-ronment 33, 1111e1129.

T.M.W.J. van Goethem et al. / Atmospheric Environment 77 (2013) 318e324324
Ashmore, M.R., 2005. Assessing the future global impacts of ozone on vegetation.Plant Cell and Environment 28 (8), 949e964.
Atkinson, R., 2000. Atmospheric chemistry of VOCs and NOx. Atmospheric Envi-ronment 34, 2063e2101.
Bare, J., 2011. TRACI 2.0: the tool for the reduction and assessment of chemical andother environmental impacts 2.0. Clean Technologies and Environmental Policy13 (5), 687e696.
Bartholomé, E., Belward, A.S., 2005. GLC2000: a new approach to global land covermapping from Earth observation data. International Journal of Remote Sensing26 (9), 1959e1977.
Biswas, D.K., XU H, Li YG., Sun, J.Z., Wang, X.Z., Han, X.G., Jang, G.M., 2008. Genotypicdifferences in leaf biochemical, physiological and growth responses to ozone in20 winter wheat cultivars released over the past 60 years. Global ChangeBiology 14, 46e59.
Borrego, C., Coutinho, M., Barros, N., 1995. Intercomparison of two meso-meteorological models applied to the Lisbon region. Meteorology, and Atmo-spheric Physics 57, 21e29.
Butkovic, V., Cvitas, T., Klasing, L., 1990. Photochemical ozone in the Mediterranean.Science of the Total Environment 99, 145e151.
CIESIN, 2005. Center for International Earth Science Information Network (CIESIN),Columbia University; and Centro Internacional de Agricultura Tropical (CIAT).In: Gridded Population of the World, Version 3 (GPWv3). Socioeconomic Dataand Applications Center (SEDAC), Columbia University, Palisades, NY. Availableat: http://sedac.ciesin.columbia.edu/gpw (accessed 03.08.12.).
Derwent, R.G., Simmonds, P.G., et al., 2007. Trends over a 20-year period from 1987to 2007 in surface ozone at the atmospheric research station, Mace Head,Ireland. Atmospheric Environment 41 (39), 9091e9098.
EC-JRC, 2011. ILCD Handbook. Recommendations Based on Existing EnvironmentalImpact Assessment Models and Factors for Life Cycle Assessment in EuropeanContext. http://lct.jrc.ec.europa.eu.
EEA, 2009. Assessment of Ground-level Ozone in EEA Member Countries, with aFocus on Long-term Trends. EEA Technical Report No 7/2009. ISSN: 1725-2237.
Emberson, L.D., Ashmore, M.R., Murray, F., 2003. Air Pollution Impacts on Crops andForests e a Global Assessment. Imperial College Press, London, UK.
EMEP, 2008. EMEP Report 1/2008, Transboundary Acidification, Eutrophication andGround Level Ozone in Europe in 2006. ISSN: 1504-6192. (Chapter 4): Photo-Oxidants: Validation and Combined Maps.
Frechette-Marleau, S., Becaert, V., et al., 2008. Evaluating the variability of aquaticacidification and photochemical ozone formation characterization factorsfor Canadian emissions. International Journal of Life Cycle Assessment 13 (7),593e604.
Fuhrer, J., 2002. Ozone impacts on vegetation. Ozone-Science & Engineering 24 (1),69e74.
Hauschild, M.Z., Potting, J., et al., 2006. Spatial differentiation in the characterisationof photochemical ozone formation e the EDIP2003 methodology. InternationalJournal of Life Cycle Assessment 11, 72e80.
Hov, Ø., Hesstvedt, E., Isaksen, I.S.A., 1978. Long range transport of troposphericozone. Nature 242, 341e344.
Huijbregts, M.A.J., Hellweg, S., Hertwich, E., 2011. Do we need a paradigm shift in lifecycle impact assessment? Environmental Science & Technology 45 (9), 3833e3834.
Johansson, M., Suutari, R., Bak, J., Lovblad, G., Posch, M., Simpson, D., Tuovinen, J.P.,Torseth, K., 2001. The importance of nitrogen oxides for the exceedance ofcritical thresholds in the Nordic countries. Water Air and Soil Pollution 130 (1e4), 1739e1744.
LRTAP Convention, 2004. Manual on Methodologies and Criteria for Modeling andMapping Critical Loads & Levels and Air Pollution Effects, Risks and Trends. In:Convention on Long-range Transboundary Air Pollution. http://www.icpmapping.org.
Mills, G., Hayes, F., Jones, M.L.M., Cinderby, S., 2007. Identifying ozone-sensitivecommunities of semi-natural vegetation suitable for mapping exceedance ofcritical levels. Environmental Pollution 146 (3), 736e743.
Mills, G., Hayes, F., Simpson, D., Emberson, L., Norris, D., Harmens, H., Buker, P., 2011.Evidence of widespread effects of ozone on crops and (semi-)natural vegetationin Europe (1990e2006) in relation to AOT40-and flux-based risk maps. GlobalChange Biology 17 (1), 592e613.
Oksanen, E., Amores, G., Kokko, H., Santamaria, J.M., Karenlapmpi, L., 2001. Geno-typic variation in growth and physiological responses of Finnish hybrid aspen(Populus tremuloides � P. tremula) to elevated tropospheric ozone concentra-tion. Tree Physiology 21, 1171e1181.
Pennington, D.W., Payet, J., Hauschild, M., 2004. Aquatic ecotoxicologicalindicators in life-cycle assessment. Environmental Toxicology and Chemistry 23(7), 1796e1807.
Rosenbaum, R.K., Bachmann, T.M., Gold, L.S., Huijbregts, M.A.J., Jolliet, O., Juraske, R.,Koehler, A., Larsen, H.F., MacLeod, M., Margni, M., McKone, T.E., Payet, J.,Schuhmacher, M., van de Meent, D., Hauschild, M.Z., 2008. USEtox-the UNEP-SETAC toxicity model: recommended characterisation factors for humantoxicity and freshwater ecotoxicity in life cycle impact assessment. Interna-tional Journal of Life Cycle Assessment 13 (7), 532e546.
Roy, P.O., Azevedo, L.B., Margni, M., Van Zelm, R., Deschênes, L., Huijbregts, M.A.J.,2013. Uncertainty and Spatial Variability in Characterization Factors forTerrestrial Acidification at the Global Scale (submitted for publication).
Sillman, S., 2003. Tropospheric ozone and photochemical smog. In: SherwoodLollar, B. (Ed.), Treatise on Geochemistry. Environmental Geochemistry, Ch. 11,vol. 9. Elsevier.
Simpson, D., 1992. Long period modelling of photochemical oxidants in Europe.Calculations for July 1985. Atmospheric Environment 26A (9), 1609e1634.
Simpson, D., Fagerli, H., Jonson, J.E., Tsyro, S., Wind, P., Tuovinen, J.P., 2003. EMEPStatus Report 1/2003 Part I Transboundary Acidifica Tion and Eutrophicationand Ground Level Ozone in Europe: Unified EMEP Model Description. EMEP/MSC-W Status Report 1/03. Norwegian Meteorological Institute, Oslo, Norway.From: http://www.emep.int/UniDoc/index.html.
Simpson, D., Ashmore, M.R., Emberson, L., et al., 2007. A comparison of two differentapproaches for mapping potential ozone damage to vegetation. A model study.Environmental Pollution 146, 715e725.
Solberg, S., Simpson, D., Jonson, J.E., Hjellbrekke, A.G., Derwent, R., 2004. Chapter 6,on Ozone in “EMEP assessment Part I, European Perspective”. In: Lövblad, Gun,Tarrasón, Leonor, Tørsethand, Kjetil, Dutchak, Sergey (Eds.), ISBN 82-7144-032-2. From: http://www.emep.int/assessment/Part1/087-116_06-Ozone-Part1.pdf.
Struijs, J., Beusen, A., De Zwart, D., Huijbregts, M.A.J., 2011. Characterization factorsfor inland water eutrophication at the damage level in life cycle impactassessment. International Journal for Life Cycle Assessment 16, 59e64.
Tarrasón, L., 2009a. Report on Deliveries of Source-receptor Matrices with theRegional EMEP Unified Model. NEEDS Project, FP6, Rs1b_TP1.2-Project no:502687.
Tarrasón, L., 2009b. Report on Methodology to Account for Non-linearity of ImpactsDepending on Different Background Emission Scenarios. NEEDS Project, FP6,Rs1b_TP1.2-Project no: 502687.
Tuovinen, J.P., 2000. Assessing vegetation exposure to ozone: properties of the-AOT40 index and modifications by deposition modeling. EnvironmentalPollution 109 (3), 361e372.
Udo de Haes, H.A., Finnveden, G., Goedkoop, M., Hauschild, M., Hertwich, E.,Hofstetter, P., Jolliet, O., Klöpffer, W., Krewitt, W., Lindeijer, E., Müller-Wenk, R.,Olsen, S.I., Pennington, D.W., Potting, J., Steen, B., 2002. Life Cycle ImpactAssessment: Striving Towards Best Practice. SETAC Press, Pensacola, Florida.
Van Goethem, T.M.J.W., Azevedo, L.B., van Zelm, R., Hayes, F., Ashmore, M.R.,Huijbregts, M.A.J., 2013. Plant sensitivity distributions for ozone exposure.Environmental Pollution 178, 1e6.
Van Loon, M., Vautard, R., Schaap, M., Bergstrom, R., Bessagnet, B., Brandt, J.,Builtjes, P.J.H., Christensen, J.H., Cuvelier, C., Graff, A., Jonson, J.E., Krol, M.,Langner, J., Roberts, P., Rouil, L., Stern, R., Tarrason, L., Thunis, P., Vignati, E.,White, L., Wind, P., 2007. Evaluation of long-term ozone simulations from sevenregional air quality models and their ensemble. Atmospheric Environment 41(10), 2083e2097.
Van Zelm, R., Huijbregts, M.A.J., Van Jaarsveld, H.A., Reinds, G.J., De Zwart, D.,Struijs, J., Van de Meent, D., 2007. Time horizon dependent characterizationfactors for acidification in life-cycle assessment based on forest plant speciesoccurrence in Europe. Environmental Science and Technology 41 (3), 922e927.
Van Zelm, R., Huijbregts, M.A.J., den Hollander, H.A., van Jaarsveld, H.A., Sauter, F.J.,Struijs, J., van Wijnen, H.J., van de Meent, D., 2008. European characterizationfactors for human health damage of PM10 and ozone in life cycle impactassessment. Atmospheric Environment 42, 441e453.
Van Zelm, R., Huijbregts, M.A.J., Posthuma, L., Wintersen, A., Van de Meent, D., 2009.Pesticide ecotoxicological effect factors and their uncertainties for freshwaterecosystems. International Journal of Life Cycle Assessment 14, 43e51.
Vautard, R., Builtjes, P.H.J., Thunis, P., Cuvelier, C., Bedogni, M., Bessagnet, B.,Honore, C., Moussiopoulos, N., Pirovano, G., Schaap, M., Stern, R., Tarrason, L.,Wind, P., 2007. Evaluation and intercomparison of ozone and PM10 simulationsby several chemistry transport models over four European cities within theCityDelta project. Atmospheric Environment 41 (1), 173e188.
Vestreng, V., Mareckova, K., Kakareka, S., Malchykhina, A., Kukharchyk, T., 2012.Inventory Review 2010; Emission Data Reported to LRTAP Convention and NECDirective. EMEP. http://www.ceip.at/.
Vingarzan, R., 2004. A review of surface ozone background levels and trends. At-mospheric Environment 38 (21), 3431e3442.
Wayne, R.P., 2000. Chemistry of Atmospheres, third ed. Oxford University Press.