european communication monitor 2011 results · infopaq is a global, european-based company, with...
TRANSCRIPT


2
Content
Overview 03
Research design and socio-demographic analysis 09
Credibility of public relations and alternative concepts 20
Decision making, leadership style and role enactment 33
Power of communication departments 47
ROI of communication 68
Strategic issues and trust 76
Development of disciplines and communication channels 84
Social media: Governance, skills and activities 95
Future qualification needs and training 111
Salaries 124
Annex (references, authors and advisory board, imprint) 132
Overview

4
Key facts
European Communication Monitor 2011
Most comprehensive analysis of communication management and public relations worldwidewith 2,209 participating professionals from 43 countries
Annual research project conducted since 2007 by a group of professors from 11 renowneduniversities across Europe, led by Prof. Dr. Ansgar Zerfass, University of Leipzig
Organised by the European Public Relations Education and Research Association (EUPRERA), European Association of Communication Directors (EACD) and Communication Director Magazine
Sponsors: Infopaq and Grayling
Research topics in 2011: Decision making, leadership style, role enactment; power of communication departments; ROI of communication; trust; development of disciplinesand communication channels; social media governance, skills and activites; qualificationneeds; salaries; credibility of public relations and alternative concepts for the profession

5
Academic task force
Research team Ansgar Zerfass, Prof. Dr., University of Leipzig (GE) – Lead Researcher Piet Verhoeven, Ass. Prof. Dr., University of Amsterdam (NL) Ralph Tench, Prof. Dr., Leeds Metropolitan University (UK) Angeles Moreno, Prof. Dr., University Rey Juan Carlos, Madrid (ES) Dejan Verčič, Prof. Dr., University of Ljubljana (SI)
Advisory board Emanuele Invernizzi, Prof. Dr., IULM University, Milano (IT) Valerie Carayol, Prof. Dr., University of Bordeaux (FR) Francesco Lurati, Prof. Dr., University of Lugano (CH) Finn Frandsen, Prof., Aarhus University (DK) Øyvind Ihlen, Prof. Dr., University of Oslo (NO) Ryszard Lawniczak, Prof. Dr., Poznan University of Economics (PL)
Statistical analysis and assistant researchers Ronny Fechner M.A., University of Leipzig (GE)
Katharina Simon B.Sc., University of Leipzig (GE)
6
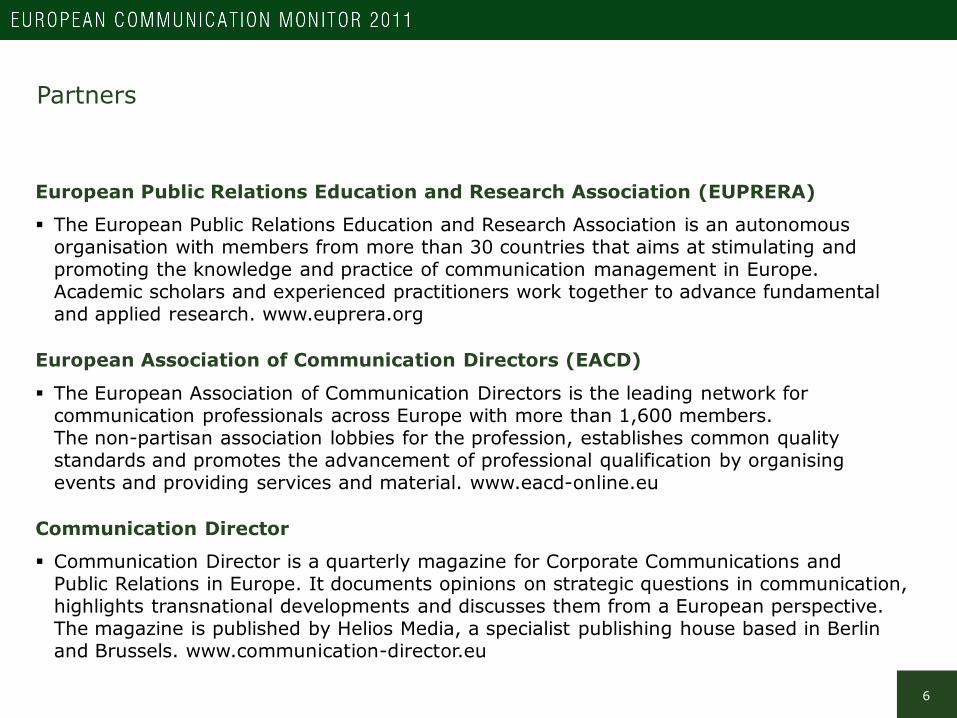
Partners
European Public Relations Education and Research Association (EUPRERA)
The European Public Relations Education and Research Association is an autonomous organisation with members from more than 30 countries that aims at stimulating and promoting the knowledge and practice of communication management in Europe. Academic scholars and experienced practitioners work together to advance fundamental and applied research. www.euprera.org
European Association of Communication Directors (EACD)
The European Association of Communication Directors is the leading network for communication professionals across Europe with more than 1,600 members.The non-partisan association lobbies for the profession, establishes common qualitystandards and promotes the advancement of professional qualification by organisingevents and providing services and material. www.eacd-online.eu
Communication Director
Communication Director is a quarterly magazine for Corporate Communications and Public Relations in Europe. It documents opinions on strategic questions in communication, highlights transnational developments and discusses them from a European perspective. The magazine is published by Helios Media, a specialist publishing house based in Berlin and Brussels. www.communication-director.eu
7
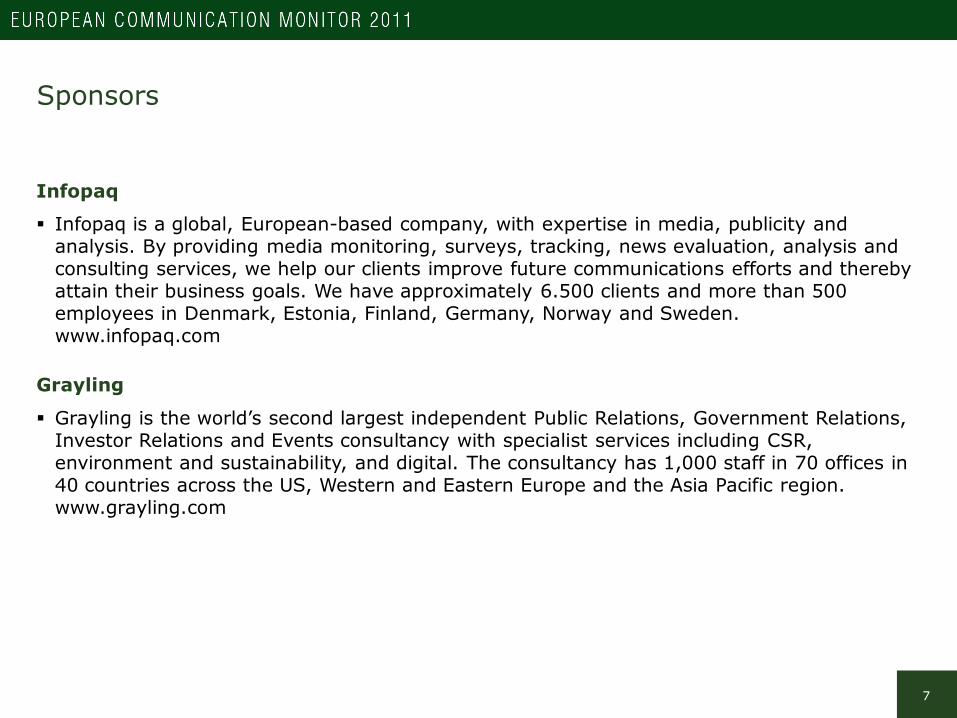
Sponsors
Infopaq
Infopaq is a global, European-based company, with expertise in media, publicity and analysis. By providing media monitoring, surveys, tracking, news evaluation, analysis and consulting services, we help our clients improve future communications efforts and thereby attain their business goals. We have approximately 6.500 clients and more than 500 employees in Denmark, Estonia, Finland, Germany, Norway and Sweden.www.infopaq.com
Grayling
Grayling is the world’s second largest independent Public Relations, Government Relations, Investor Relations and Events consultancy with specialist services including CSR, environment and sustainability, and digital. The consultancy has 1,000 staff in 70 offices in 40 countries across the US, Western and Eastern Europe and the Asia Pacific region.www.grayling.com

8
Copyright and reproduction of results
Quotation The material presented in this document represents empirical insights and interpretation
by the research team. It is intellectual property subject to international copyright. Publication date: July 2011.
You are welcome to quote from the content of this survey and reproduce any graphics, subject to the condition that the source including the internet address is clearly quoted and depicted on every chart. See the imprint for more information.
The full report (text and figures) is available as a book published by Helios Media,133 pp., ISBN 978-3-942263-12-2.
Suggested citation for this document (APA style) Zerfass, A., Verhoeven, P., Tench, R., Moreno, A., & Verčič, D. (2011):
European Communication Monitor 2011. Empirical Insights into Strategic Communication in Europe. Results of an Empirical Survey in 43 Countries (Chart Version).Brussels: EACD, EUPRERA (available at: www.communicationmonitor.eu)
Short quotation to be used in legends (charts/graphics) Source: European Communication Monitor 2011

Research design and socio-demographic analysis

10
Outline of the survey
Aims and focus
to monitor trends in communication management
to analyse the changing framework for the profession in Europe
to evaluate specific topics like decision making, power, trust, social media skills,return on investment for communications, qualification needs, salaries and theimage of public relations as well as alternative concepts for the profession.
to identify the development of communication management in differenttypes of organisations, countries and regions
Target group
Communication managers and PR professionals working in organisationsand consultancies throughout Europe

11
Methodology
Survey method and sampling
online survey in March 2011 (4 weeks), English language
questionnaire with 20 sections, based on hypotheses and instruments derived fromprevious research and literature
pre-test with 31 practitioners in 10 European countries
personal invitation to 30,000+ professionals throughout Europe via e-mail based on a database provided by EACD; additional invitations to participate via national branch associations and networks (partly self-recruiting); 4,014 respondents and 2,277 fully completed replies
evaluation is based on 2,209 fully completed replies by participants clearly identified as part of the population (communication professionals in Europe)
Statistical analysis
methods of empirical research, descriptive and analytical analysis (using SPSS)
results have been statistically agreed by Pearson's chi-square tests (x²) or Spearman'srank correlation tests (rho) and are classified as significant (p ≤ 0.05) where appropriate
in this report, significant correlations are marked in the footnotes
12
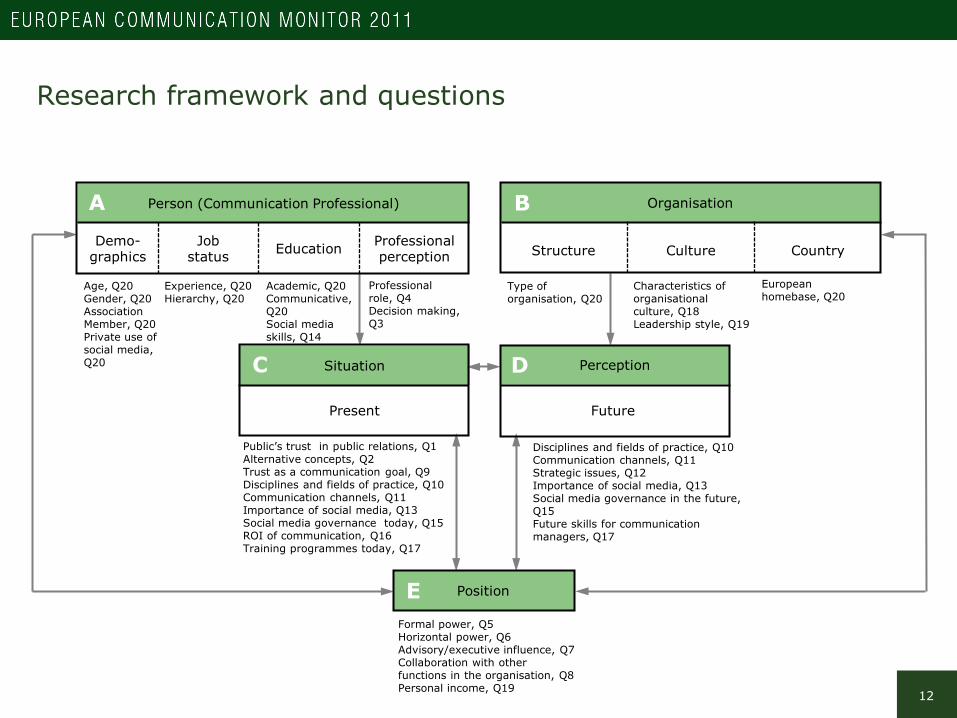
Public’s trust in public relations, Q1Alternative concepts, Q2Trust as a communication goal, Q9Disciplines and fields of practice, Q10Communication channels, Q11Importance of social media, Q13 Social media governance today, Q15ROI of communication, Q16Training programmes today, Q17
Professionalrole, Q4Decision making, Q3
Research framework and questions
ProfessionalperceptionEducationJob
statusDemo-
graphics
Person (Communication Professional)
CountryCultureStructure
Organisation
Present
Situation
Future
PerceptionC
Age, Q20Gender, Q20AssociationMember, Q20Private use of social media, Q20
Experience, Q20Hierarchy, Q20
Academic, Q20Communicative, Q20Social mediaskills, Q14
Type oforganisation, Q20
Characteristics of organisationalculture, Q18Leadership style, Q19
European homebase, Q20
Disciplines and fields of practice, Q10Communication channels, Q11Strategic issues, Q12Importance of social media, Q13Social media governance in the future, Q15Future skills for communicationmanagers, Q17
Position
Formal power, Q5Horizontal power, Q6Advisory/executive influence, Q7Collaboration with other functions in the organisation, Q8 Personal income, Q19
A
D
E
B

13www.communicationmonitor.eu / Zerfass et al. 2011 / n = 2,209 PR professionals in 43 European countries; Q 20.
Position Organisation
Head of communication, Agency CEO
48.8% Communication department joint stock company 28.0% private company 18.2% government-owned, public
sector, political organisation 14.1% non-profit organisation,
association 10.9%
71.2%
Responsible for singlecommunication discipline, Unit Leader
28.8%
Team member,Consultant
17.6% Communication consultancy,PR Agency, Freelance consultant
28.8%
Other 5.7%
Job experience Gender / Age
Up to 5 years 15.9% Female 55.6%
6 to 10 years 27.4% Male 44.4%
More than 10 years 56.7% Age (on average) 41.2 years
Demographic background of participants
14
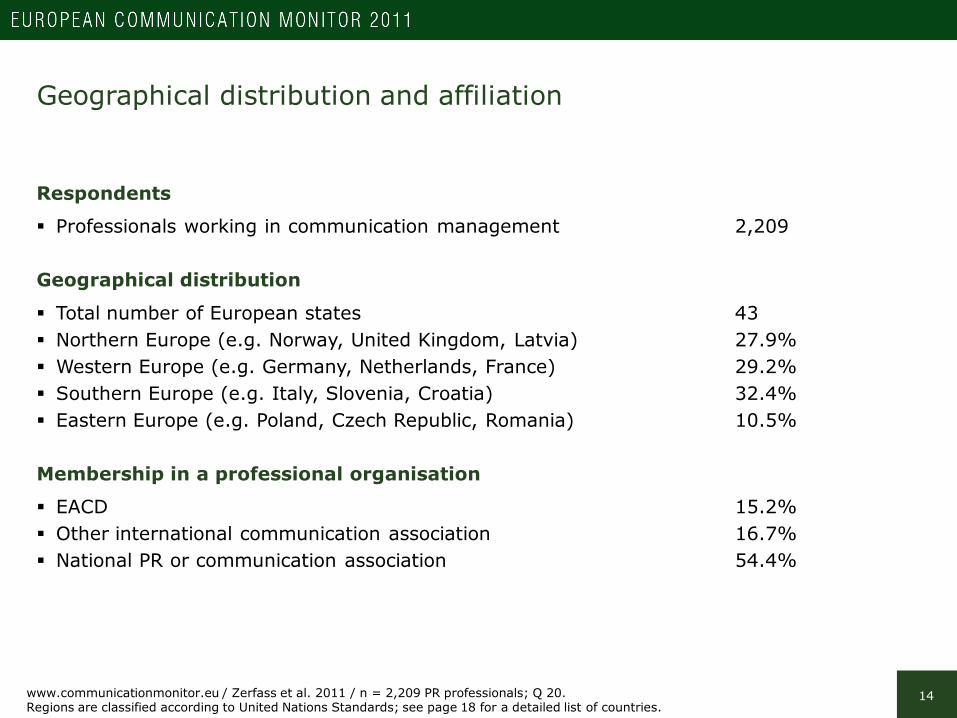
Geographical distribution and affiliation
Respondents
Professionals working in communication management 2,209
Geographical distribution
Total number of European states 43 Northern Europe (e.g. Norway, United Kingdom, Latvia) 27.9% Western Europe (e.g. Germany, Netherlands, France) 29.2% Southern Europe (e.g. Italy, Slovenia, Croatia) 32.4% Eastern Europe (e.g. Poland, Czech Republic, Romania) 10.5%
Membership in a professional organisation
EACD 15.2% Other international communication association 16.7% National PR or communication association 54.4%
www.communicationmonitor.eu / Zerfass et al. 2011 / n = 2,209 PR professionals; Q 20. Regions are classified according to United Nations Standards; see page 18 for a detailed list of countries.

15
Personal background of respondents
Communication qualifications
Academic degree in Communication(Bachelor, Master, Doctorate) 44.5%
Professional certificate in Public Relations /Communication Management 25.6%
Professional certificate in othercommunication discipline 16.2%
Highest academic educational qualification
Doctorate (Ph.D., Dr.) 6.7%
Master (M.A., M.Sc., Mag., M.B.A.), Diploma 58.8%
Bachelor (B.A., B.Sc.) 27.8%
No academic degree 6.6%
www.communicationmonitor.eu / Zerfass et al. 2011 / n = 2,209 PR professionals; Q 20.
16
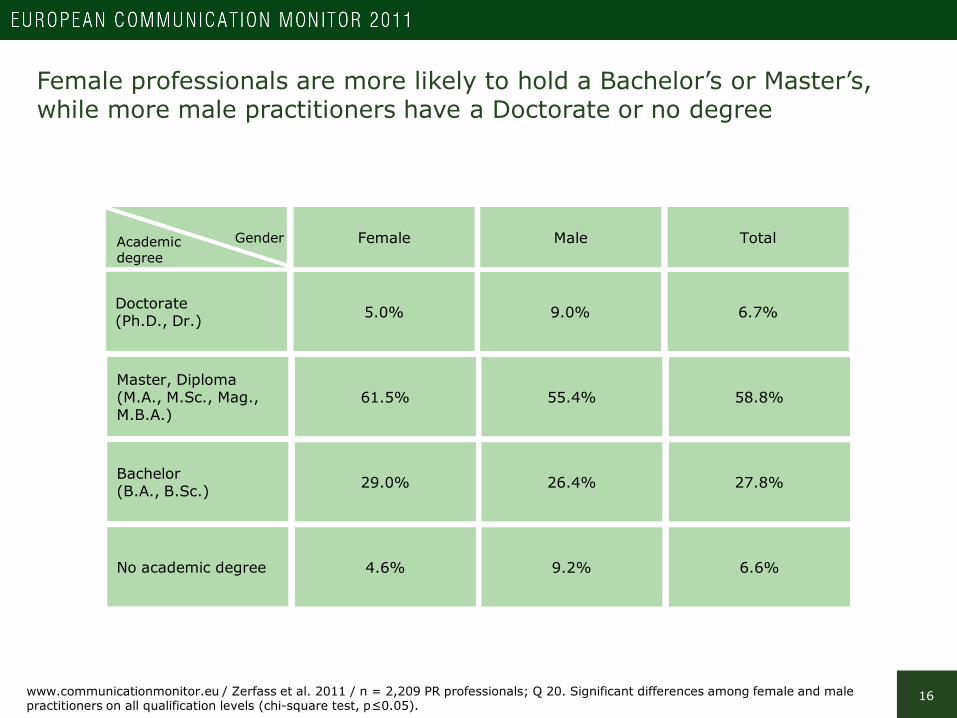
Female professionals are more likely to hold a Bachelor’s or Master’s, while more male practitioners have a Doctorate or no degree
5.0% 9.0%Doctorate (Ph.D., Dr.) 6.7%
Female Male Total
61.5% 55.4%Master, Diploma(M.A., M.Sc., Mag., M.B.A.)
58.8%
29.0% 26.4%Bachelor (B.A., B.Sc.) 27.8%
4.6% 9.2%No academic degree 6.6%
www.communicationmonitor.eu / Zerfass et al. 2011 / n = 2,209 PR professionals; Q 20. Significant differences among female and male practitioners on all qualification levels (chi-square test, p≤0.05).
GenderAcademic degree
17
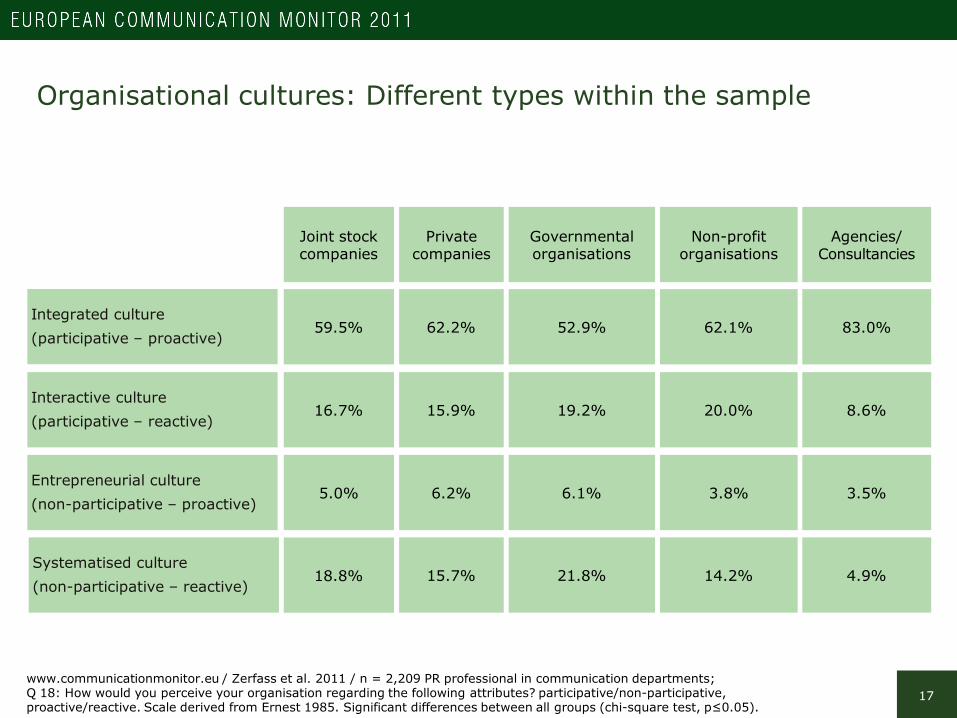
Organisational cultures: Different types within the sample
Joint stock companies
Private companies
Governmental organisations
59.5% 62.2% 52.9%
Non-profit organisations
62.1%
16.7% 15.9% 19.2% 20.0%
5.0% 6.2% 6.1% 3.8%
18.8% 15.7% 21.8% 14.2%
Interactive culture(participative – reactive)
Entrepreneurial culture(non-participative – proactive)
Systematised culture(non-participative – reactive)
Integrated culture(participative – proactive)
www.communicationmonitor.eu / Zerfass et al. 2011 / n = 2,209 PR professional in communication departments;Q 18: How would you perceive your organisation regarding the following attributes? participative/non-participative,proactive/reactive. Scale derived from Ernest 1985. Significant differences between all groups (chi-square test, p≤0.05).
Agencies/Consultancies
83.0%
8.6%
3.5%
4.9%

18
Countries and regions represented in the study
Respondents are based in 43 European countries and four regions
Northern Europe 27.9%(n=617)
Western Europe 29.2%(n=645)
Eastern Europe 10.5%(n=231)
Southern Europe 32.4%(n=716)
DenmarkEstoniaFinlandIcelandIrelandLatviaLithuaniaNorwaySwedenUnited Kingdom
AustriaBelgiumFranceGermanyLiechtensteinLuxembourgNetherlandsSwitzerland
BelarusBulgariaCzech RepublicGeorgiaHungaryPolandRomaniaRussiaSlovakiaUkraine
AlbaniaBosnia and HerzegovinaCroatiaCyprus**GreeceItalyKosovo*MacedoniaMaltaMontenegroPortugalSerbiaSloveniaSpainTurkey**
In this survey, the universe of 50 European countries is based on the official list of European Countries by the European Union (http://europa. eu/abc/european_countries). Countries are assigned to regions according to the official classification of the United Nations Statistics Division (http://unstats.un.org/unsd/methods/m49/m49regin.htm). Countries marked * are not included in the UN classification; countries marked ** are assigned to Western Asia. These countries were collated like adjacent nations. No respondents were registered for this survey from Andorra, Armenia, Azerbaijan, Moldova, Monaco, San Marino and Vatican City.

19
Interpretation
Insights into the structures and evolution of communications in Europe
Based on a sample of 2,209 professionals from 43 European countries, this research is the most comprehensive transnational study ever conducted in the field of public relations and communication management.
Respondents are characterised by a high level of experience: more than three out of four are head of communications, unit leaders or agency CEOs, 56 per cent have more than ten years of professional experience, the average age is 41 years. The survey lays a solid foundation for identifying basic structures and developments in strategic communication.
It is necessary to note that economies, communication landscapes and professions are in rather different stages of development throughout Europe. Moreover, there is no knowledge about the population of communication departments and agencies in Europe. The survey has been conducted in the English language. Consequently, the findings presented here can not claim representativeness. They are especially useful to identify relevant patterns and trends in the field, which may stimulate qualitative discussions.
The analysis is based on thorough empirical research and analysis. Replies from participants not currently working in communication management (academics, students) and from non-European countries have been removed. Only fully completed questionnaires have been taken into account. Data have been analysed using the appropriate statistical procedures like chi-square tests and rank correlation tests.
Credibility of public relations and alternative concepts

21www.communicationmonitor.eu / Zerfass et al. 2011 / n = 2,209 PR professionals; Q 1: In many European countries public relations (PR) has negative connotations in the media. PR is often reduced to press relations and publicity. Professionals are sometimes labeled as ‘spin doctors’ and ‘propagandists’. What do you think of these statements? Scale 1-5, considered scale points 4-5.
41.6%
72.8%
73.7%
42.2%
In my country, PR has negative connotations in the mass media
Negative connotations of PR in the media damage the reputation of communication
professionals
Negative connotations of PR decrease trust in communication professionals
The term ‘public relations’ is discredited
Professional communication is impaired by negative connotationsof public relations in many European countries
22
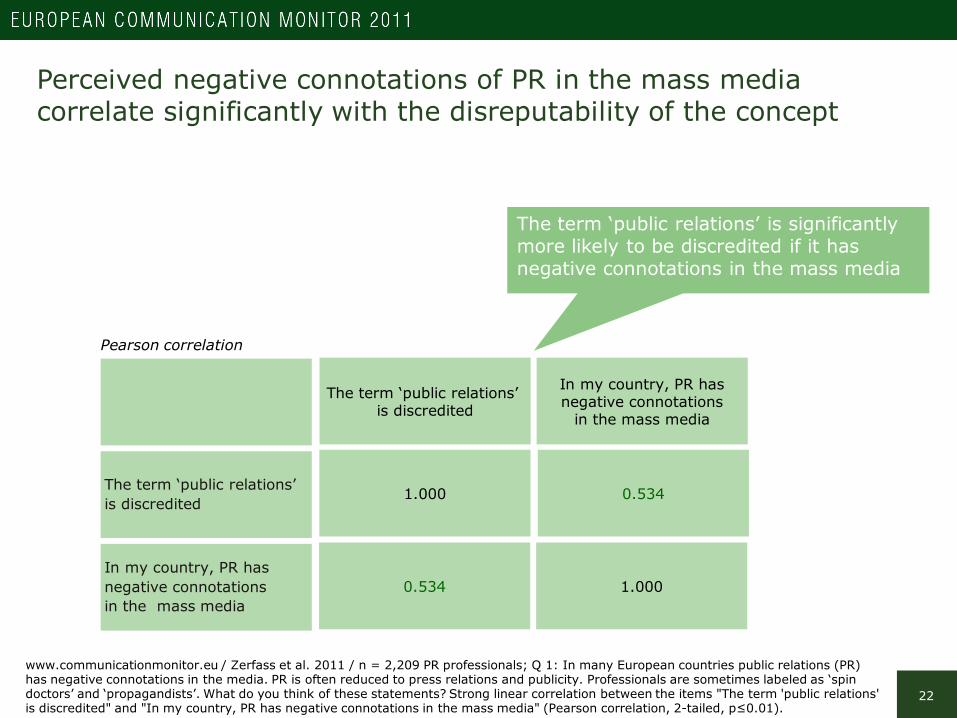
Perceived negative connotations of PR in the mass mediacorrelate significantly with the disreputability of the concept
1.000 0.534
The term ‘public relations’ is discredited
In my country, PR hasnegative connotations
in the mass media
0.534 1.000
Pearson correlation
The term ‘public relations’ is significantly more likely to be discredited if it has negative connotations in the mass media
The term ‘public relations’ is discredited
In my country, PR hasnegative connotations in the mass media
www.communicationmonitor.eu / Zerfass et al. 2011 / n = 2,209 PR professionals; Q 1: In many European countries public relations (PR) has negative connotations in the media. PR is often reduced to press relations and publicity. Professionals are sometimes labeled as ‘spin doctors’ and ‘propagandists’. What do you think of these statements? Strong linear correlation between the items "The term 'public relations' is discredited" and "In my country, PR has negative connotations in the mass media" (Pearson correlation, 2-tailed, p≤0.01).

23
Perceived image of PR in the mass media: Predominantly negative in theUK and Poland, less problematic in Belgium, Sweden and Italy
Switzerland (36.6%)
Germany (45.0%)
Netherlands (35.0%)
Belgium (27.9%)
France (32.0%)
United Kingdom (59.1%)
Norway (52.7%)
Sweden (28.4%)Denmark (50.0%)
Italy (30.4%)
Serbia (45.5%)
Croatia (52.3%)
Slovenia (48.9%)
Spain (37.7%)
Poland (63.6%)
40%
20%
0%
60%
80%
“In my country, PR has negative connotationsin the mass media”
www.communicationmonitor.eu / Zerfass et al. 2011 / n = 2,209 PR professionals; Q 1: In many European countries public relations (PR) has negative connotations in the media. PR is often reduced to press relations and publicity. Professionals are sometimes labeled as ‘spin doctors’ and ‘propagandists’. What do you think of these statements? In my country, PR has negative connotations in the mass media.Scale 1-5, considered scale points 4-5 / Q 20.

24
The term ‘public relations’ is discredited in most countries
Switzerland (32.1%)
Germany (43.4%)
Netherlands (31.7%)
Belgium (33.3%)
France (40.0%)
United Kingdom (37.1%)
Norway (45.2%)
Sweden (30.7%)Denmark (38.7%)
Italy (44.4%)
Serbia (62.6%)
Croatia (65.8%)
Slovenia (53.2%)
Spain (55.1%)
Poland (51.5%)
40%
20%
0%
60%
80%
“The term ‘public relations’ is discredited”
www.communicationmonitor.eu / Zerfass et al. 2011 / n = 2,209 PR professionals; Q 1: In many European countries public relations (PR) has negative connotations in the media. PR is often reduced to press relations and publicity. Professionals are sometimes labeled as ‘spin doctors’ and ‘propagandists’. What do you think of these statements? The term ‘public relations’ is discredited. Scale 1-5, considered scale points 4-5 / Q 20.

25
Consultants are more critical of the term ‘public relations’ than professionals working in communication departments
Communicationdepartments
37.8%
Agencies/Consultancies
70.9%
50.9%
77.7%
72.5% 76.8%
38.2% 52.3%
Negative connotations of PR in the media damagethe reputation of communication professionals
Negative connotations of PR decreasetrust in communication professionals
The term ‘public relations’ is discredited
In my country, PR has negative connotations in the mass media
www.communicationmonitor.eu / Zerfass et al. 2011 / n = 2,209 PR professionals; Q 1: In many European countries public relations (PR) has negative connotations in the media. PR is often reduced to press relations and publicity. Professionals are sometimes labeled as ‘spin doctors’ and ‘propagandists’. What do you think of these statements? Scale 1-5, considered scale points 4-5 / Q 20. Significant differencesbetween respondents from communication departments and agencies (chi-square test, p≤0.05).

26
Perceived negative connotations of public relations in different typesof organisations (details)
Joint stock companies
Private companies
Governmental organisations
35.6% 33.8% 46.2%
Non-profit organisations
39.6%
69.3% 71.8% 70.5% 74.2%
72.3% 71.9% 71.5% 75.0%
37.2% 39.6% 42.3% 32.9%
Negative connotations of PR in the mediadamage the reputationof comm. professionals
Negative connotations of PR decrease trust in communicationprofessionals
The term ‘public relations’ is discredited
In my country, PR has negative connotations in the mass media
www.communicationmonitor.eu / Zerfass et al. 2011 / n = 2,209 PR professionals; Q 1: In many European countries public relations (PR) has negative connotations in the media. PR is often reduced to press relations and publicity. Professionals are sometimes labeled as ‘spin doctors’ and ‘propagandists’. What do you think of these statements? Scale 1-5, considered scale points 4-5 / Q 20. Significant differencesbetween all types of organisations (chi-square test, p≤0.05).
Agencies/Consultancies
50.9%
77.7%
76.8%
52.3%
Overall
41.6%
72.8%
73.7%
42.4%

27
Suitability of alternative concepts to describe the various internal and externalcommunication activities by an organisation
‘Public relations’ is no longer regarded as a suitable labelfor the profession compared to other concepts
www.communicationmonitor.eu / Zerfass et al. 2011 / n = 2,209 PR professionals; Q 2: Researchers are discussing several concepts to describe the various internal and external communication activities by an organisation. How would you value these descriptions/labels?Scale 1-5, considered scale points 4-5.
67.9%
61.3%
55.7%
46.7%
45.9%
34.0%
32.6%
Corporate Communications
Strategic Communication
Communication Management
Public Relations
Integrated Communications
Business Communication
Organisational Communication

28
Companies favour ‘Corporate Communications’; non-profit and governmental organisations prefer ‘Strategic Communication’
www.communicationmonitor.eu / Zerfass et al. 2011 / n = 2,209 PR professionals; Q 2: Researchers are discussing several concepts to describe the various internal and external communication activities by an organisation. How would you value these descriptions/labels?Scale 1-5 / Q 20. Items 1, 4, 5: significant differences between all types of organisations (chi-square test, p≤0.05).
Joint stock companies Private companies Governmental Organisations
Non-profit organisations Consultancies & Agencies
Not adequate at all
Public Relations
Business Communications
Integrated Communications
Corporate Communications
Organisational Communication
Communication Management
Strategic Communication
Very suitable

29
Concepts and labels for the profession are judged differentlyin various countries (example: UK versus Germany)
www.communicationmonitor.eu / Zerfass et al. 2011 / n = 2,209 PR professionals; Q 2: Researchers are discussing several concepts to describe the various internal and external communication activities by an organisation. How would you value these descriptions/labels?Scale 1-5 / Q 20.
United Kingdom Germany Overall
Not adequate at all
Public Relations
Business Communications
Integrated Communications
Corporate Communications
Organisational Communication
Communication Management
Strategic Communication
Very suitable

30
Practitioners who are sceptical of the term PR dislike‘Integrated Communications’ as well
www.communicationmonitor.eu / Zerfass et al. 2011 / n = 2,209 PR professionals; Q 2: Researchers are discussing several concepts to describe the various internal and external communication activities by an organisation. How would you value these descriptions/labels?Scale 1-5, considered scale points 4-5. Linear negative correlation between discreditation of PR and suitability of the PR concept (Pearson correlation, 2-tailed, p≤0.01).
67.9%
61.3%
55.7%
46.7%
45.9%
34.0%
32.6%
67.7%
62.7%
59.1%
45.2%
39.1%
34.8%
34.4%
Corporate Communications
Strategic Communication
Communication Management
Public Relations
Integrated Communications
Business Communication
Organisational Communication
All professionals Professionals claiming that the term 'public relations' is discredited
31
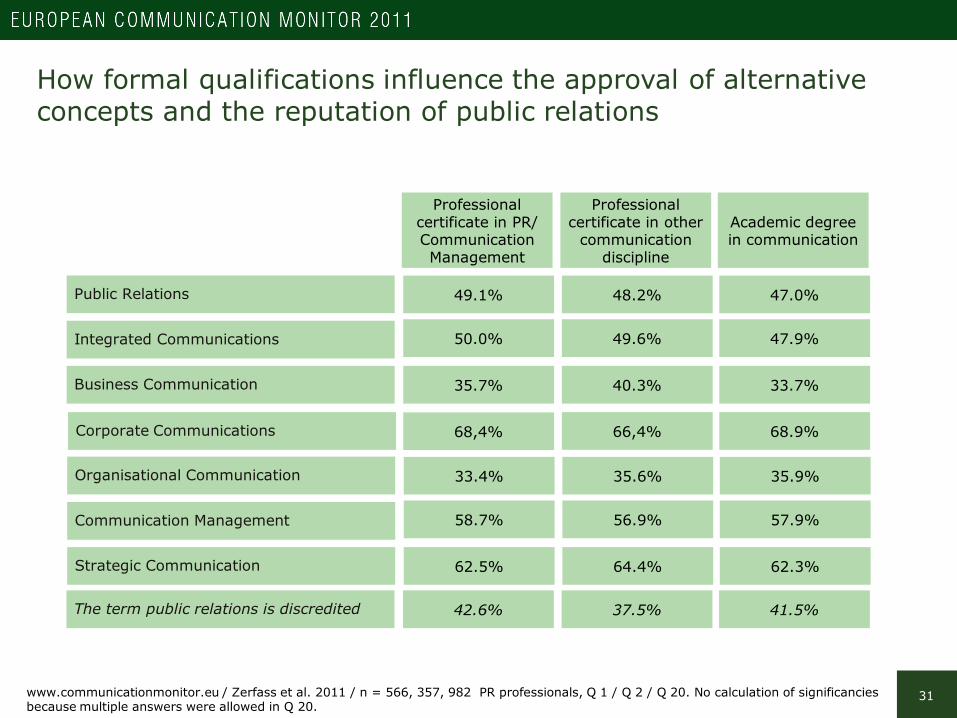
How formal qualifications influence the approval of alternative concepts and the reputation of public relations
www.communicationmonitor.eu / Zerfass et al. 2011 / n = 566, 357, 982 PR professionals, Q 1 / Q 2 / Q 20. No calculation of significanciesbecause multiple answers were allowed in Q 20.
Professional certificate in PR/ Communication Management
Professional certificate in other
communication discipline
Academic degree in communication
49.1% 48.2% 47.0%
50.0% 49.6% 47.9%
35.7% 40.3% 33.7%
68,4% 66,4% 68.9%
Integrated Communications
Business Communication
Corporate Communications
Public Relations
33.4% 35.6% 35.9%
58.7% 56.9% 57.9%
62.5% 64.4% 62.3%
Communication Management
Strategic Communication
Organisational Communication
42.6% 37.5% 41.5%The term public relations is discredited
32
Interpretation
Negative reputation of public relations calls for new concepts and labels
Across Europe, communication professionals report negative connotations of ‘public relations’ in the mass media. The image of PR is especially bad in Poland, the United Kingdom, Norway, Croatia, Denmark, Slovenia, Serbia and Germany. Even in the rest of Europe at least three out of ten practitioners report negative perceptions of the term.
Negative connotations of PR in the media damage the reputation of communication professionals as well as trust in their activities. Further research, i. e. media content analysis, may prove these perceptions and provide more detailed insights.
The survey reveals a significant correlation between the media image and the disreputability of ‘public relations’ as a term and overall concept. PR is partly discredited in most European countries, especially in Eastern and Southern Europe, but also in Norway and Germany.
As a consequence, most communication professionals favour alternative labels for the profession – especially corporate communications, strategic communication and communication management.
When comparing the acceptance within different types of organisations, ‘corporate communications’ is leading the field across the respondent groups, while ‘strategic communication’ is the second most popular label.
The terms ‘integrated communication’ and ‘organisational communication’, often used in the academic realm, are less popular for the professional field.
The approval of alternative concepts is not significantly influenced by the formal qualifications of communication professionals.

Decision making, leadership style and role enactment

34
Decision making: Most professionals rely on rational approaches and best practices, only a minority take risks
84.7%
67.6%
55.9%
53.9%
45.1%
38.6%
When making a decision, I make a thorough evaluation based on all possible information
When making decisions, it is useful to rely on best practices used by similiar organisations
I like the shared responsibility that comes from group decision-making
Reviewing (scientific) literature and research helps to prepare a decision
A risk not taken is usually an opportunity lost
Decision-making is driven by the availability of new communication technologies
www.communicationmonitor.eu / Zerfass et al. 2011 / n = 2,209 PR professionals; Q 3: How do you make decisions as a communication professional? Scale 1-5, considered scale points 4-5. Types of decision making partly derived from Werder & Holzhausen 2011.

35
European professionals have a different decision-making profilethan their counterparts in the United States
84.7%
55.9%
45.1%
90.8%
52.9%
53.0%
Rational decision making
Group decision making
Risk-acceptance decision making
European professionalsUS professionals
www.communicationmonitor.eu / Zerfass et al. 2011 / n = 2,209 PR professionals; Q 3: How do you make decisions as a communication professional? Scale 1-5, considered scale points 4-5; Werder & Holtzhausen 2009, 2011 / nmax = 825. Scale 1-7, considered scale point 5-7.

36
Types of decision making in European regions
www.communicationmonitor.eu / Zerfass et al. 2011 / n = 2,209 PR professionals; Q 3: How do you make decisions as a communication professional? Scale 1-5. / Q 20. Items 2, 3, 4: significant differences between the four regions (chi-square test, p≤0.05).
Western Europe Northern Europe Southern Europe Eastern Europe
Strongly disagree
When making a decision,I make a thorough evaluation
based on all possible information
Totally agree
I like the shared responsibility thatcomes from group decision-making
A risk not taken is usually an opportunity lost
Decision-making is drivenby the availability of new
communication technologies
Reviewing (scientific) literature and research helps to prepare a decision
When making decisions, it isuseful to rely on best practicesused by similiar organisations
37
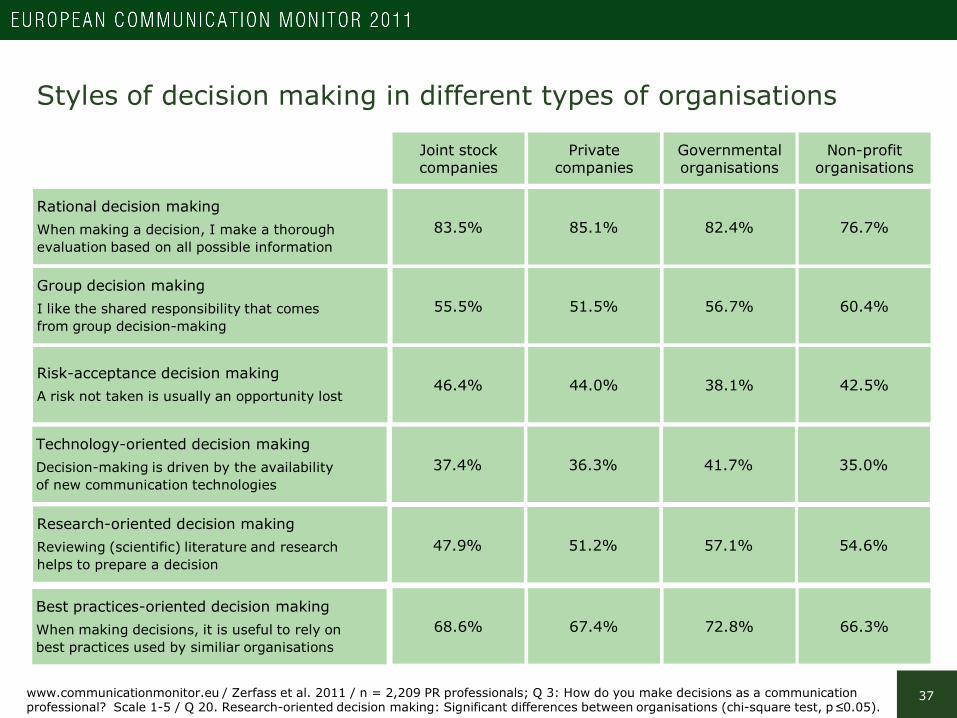
Styles of decision making in different types of organisations
Joint stock companies
Private companies
Governmental organisations
83.5% 85.1% 82.4%
Non-profit organisations
76.7%
55.5% 51.5% 56.7% 60.4%
46.4% 44.0% 38.1% 42.5%
Group decision makingI like the shared responsibility that comes from group decision-making
Risk-acceptance decision makingA risk not taken is usually an opportunity lost
Rational decision makingWhen making a decision, I make a thoroughevaluation based on all possible information
37.4% 36.3% 41.7% 35.0%Technology-oriented decision making Decision-making is driven by the availabilityof new communication technologies
47.9% 51.2% 57.1% 54.6%
Best practices-oriented decision makingWhen making decisions, it is useful to rely on best practices used by similiar organisations
Research-oriented decision makingReviewing (scientific) literature and research helps to prepare a decision
68.6% 67.4% 72.8% 66.3%
www.communicationmonitor.eu / Zerfass et al. 2011 / n = 2,209 PR professionals; Q 3: How do you make decisions as a communication professional? Scale 1-5 / Q 20. Research-oriented decision making: Significant differences between organisations (chi-square test, p≤0.05).
38
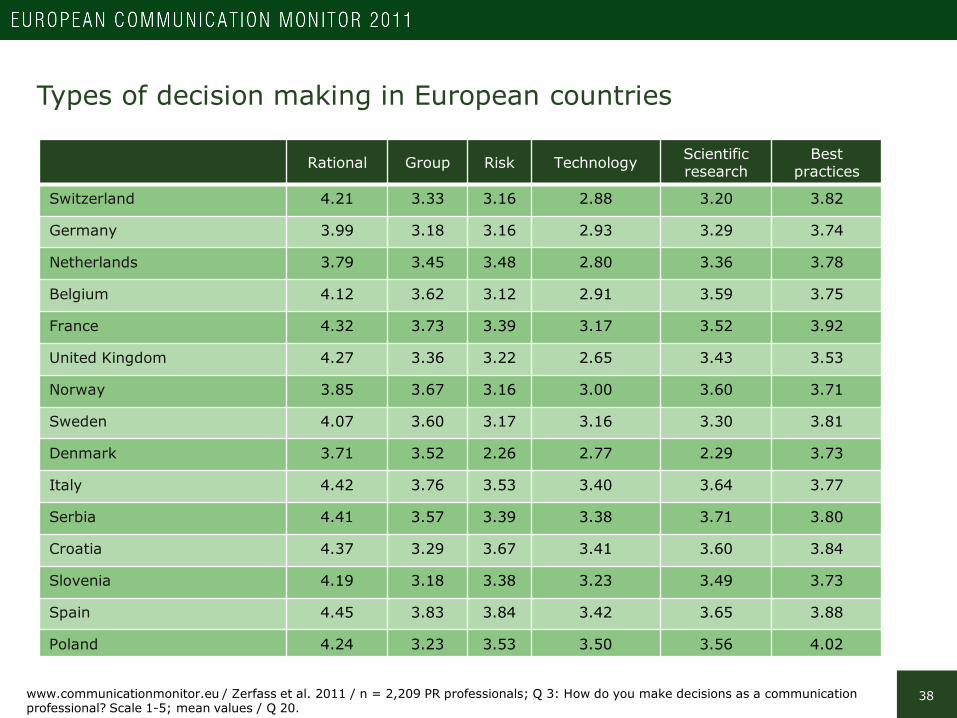
Types of decision making in European countries
www.communicationmonitor.eu / Zerfass et al. 2011 / n = 2,209 PR professionals; Q 3: How do you make decisions as a communication professional? Scale 1-5; mean values / Q 20.
Rational Group Risk Technology Scientificresearch
Best practices
Switzerland 4.21 3.33 3.16 2.88 3.20 3.82
Germany 3.99 3.18 3.16 2.93 3.29 3.74
Netherlands 3.79 3.45 3.48 2.80 3.36 3.78
Belgium 4.12 3.62 3.12 2.91 3.59 3.75
France 4.32 3.73 3.39 3.17 3.52 3.92
United Kingdom 4.27 3.36 3.22 2.65 3.43 3.53
Norway 3.85 3.67 3.16 3.00 3.60 3.71
Sweden 4.07 3.60 3.17 3.16 3.30 3.81
Denmark 3.71 3.52 2.26 2.77 2.29 3.73
Italy 4.42 3.76 3.53 3.40 3.64 3.77
Serbia 4.41 3.57 3.39 3.38 3.71 3.80
Croatia 4.37 3.29 3.67 3.41 3.60 3.84
Slovenia 4.19 3.18 3.38 3.23 3.49 3.73
Spain 4.45 3.83 3.84 3.42 3.65 3.88
Poland 4.24 3.23 3.53 3.50 3.56 4.02
39
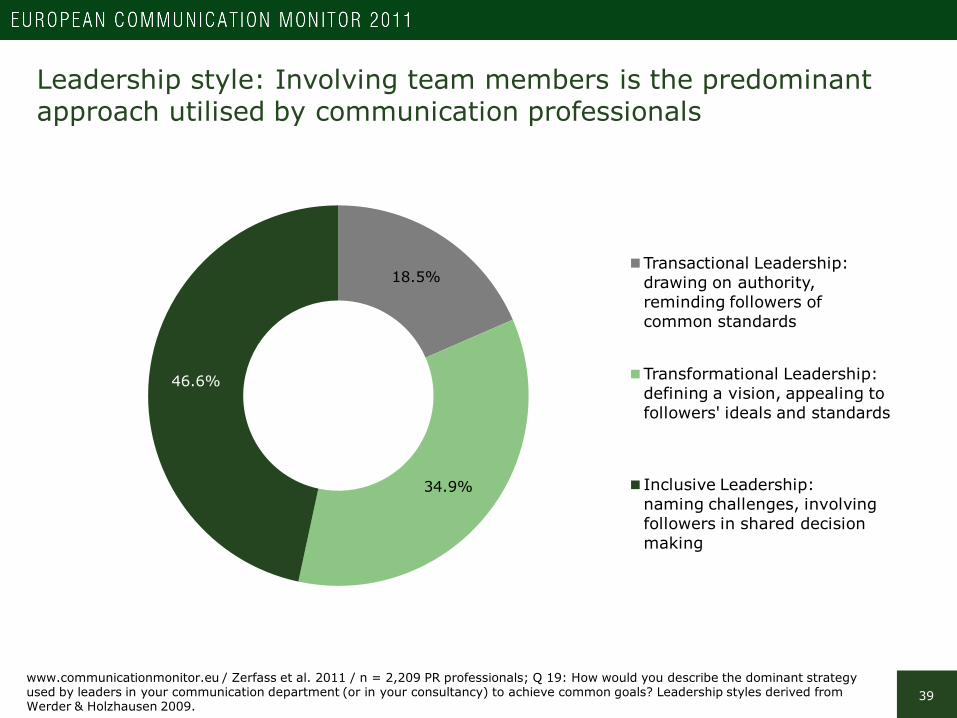
Leadership style: Involving team members is the predominant approach utilised by communication professionals
www.communicationmonitor.eu / Zerfass et al. 2011 / n = 2,209 PR professionals; Q 19: How would you describe the dominant strategy used by leaders in your communication department (or in your consultancy) to achieve common goals? Leadership styles derived from Werder & Holzhausen 2009.
18.5%
34.9%
46.6%
Transactional Leadership: drawing on authority, reminding followers of common standards
Transformational Leadership: defining a vision, appealing to followers' ideals and standards
Inclusive Leadership: naming challenges, involving followers in shared decision making

40
Leadership style in different types of organisations
Joint stock companies
Private companies
Governmental organisations
17.2% 17.9% 29.8%
Non-profit organisations
20.8%
36.4% 35.8% 32.7% 31.7%
46.4% 46.3% 37.5% 47.5%
TransformationalLeaders define a vision and appeal to followers’ ideals and values
InclusiveLeaders name challenges and involve followers in shared decision making
TransactionalLeaders draw on their authority and remind followers of common standards
Agencies/Consultancies
13.7%
35.2%
51.2%
www.communicationmonitor.eu / Zerfass et al. 2011 / n = 2,209 PR professionals; Q 19: How would you describe the dominant strategy used by leaders in your communication department (or in your consultancy) to achieve common goals? / Q 20. Leadership styles derived from Werder & Holzhausen 2009. Significant differences between the five types of organisations (chi-square test, p≤0.05).

41
Organisational culture and leadership style are interdependent
Transactional Leadership
Transformational Leadership
InclusiveLeadership
Interactive culture(participative – reactive)
Entrepreneurial culture(non-participative – proactive)
Systematised culture(non-participative – reactive)
Integrated culture(participative – proactive)
11.8% 35.9% 52.4%
20.9% 33.6% 45.5%
20.8% 49.1% 30.2%
46.5% 26.9% 26.6%
www.communicationmonitor.eu / Zerfass et al. 2011 / n = 2,209 PR professionals; Q 19: How would you describe the dominant strategy used by leaders in your communication department (or in your consultancy) to achieve common goals? / Q 18: How would you perceive your organisation regarding the following attributes? Significant differences between the three types of culture (chi-square test, p≤0.05).
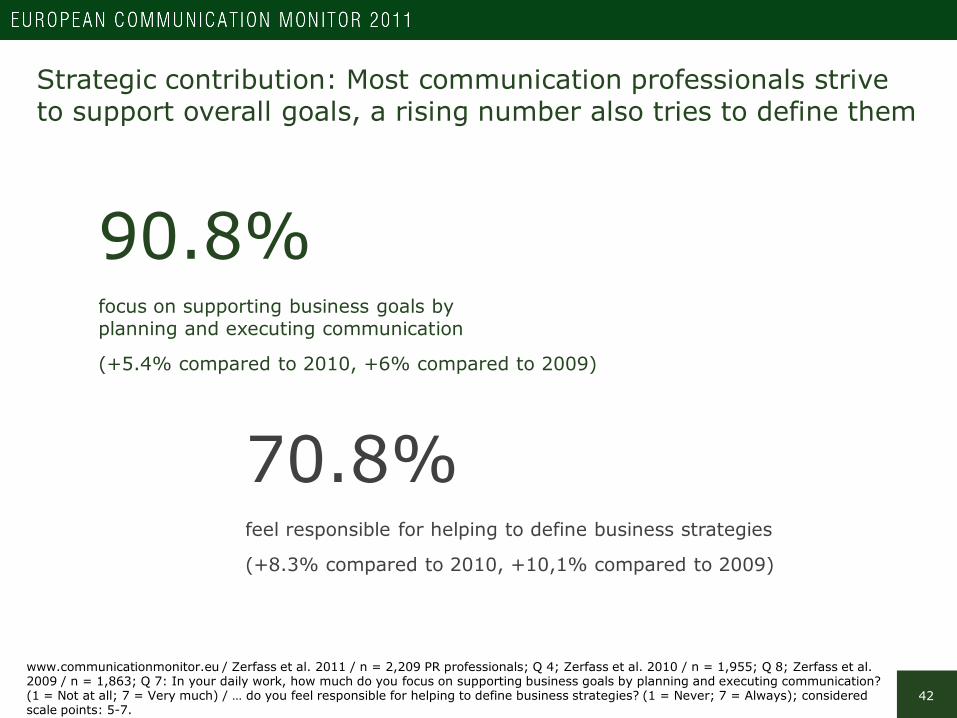
42
Strategic contribution: Most communication professionals strive to support overall goals, a rising number also tries to define them
70.8%feel responsible for helping to define business strategies
(+8.3% compared to 2010, +10,1% compared to 2009)
90.8%focus on supporting business goals byplanning and executing communication
(+5.4% compared to 2010, +6% compared to 2009)
www.communicationmonitor.eu / Zerfass et al. 2011 / n = 2,209 PR professionals; Q 4; Zerfass et al. 2010 / n = 1,955; Q 8; Zerfass et al. 2009 / n = 1,863; Q 7: In your daily work, how much do you focus on supporting business goals by planning and executing communication? (1 = Not at all; 7 = Very much) / … do you feel responsible for helping to define business strategies? (1 = Never; 7 = Always); considered scale points: 5-7.

43
Professional roles: Most practitioners act as strategic facilitatorsor operational supporters
Scale: 1-4 Scale: 5-7
Sca
le:
5-7
Sca
le:
1-4
OperationalSupporters
23.2%
NOT AT ALLSUPPORTING BUSINESS GOALS BY MANAGING COMMUNICATION
VERY MUCHSUPPORTING BUSINESS GOALS BY MANAGING COMMUNICATION
ALWAYSHELPING TO DEFINE BUSINESS STRATEGIES
NEVERHELPING TO DEFINE BUSINESS STRATEGIES
StrategicFacilitators
67.6%
BusinessAdvisers
3.2%
IsolatedExperts6.0%
www.communicationmonitor.eu / Zerfass et al. 2011 / n = 2,209 PR professionals; Q 4: In your daily work, how much do you focus on supporting business goals by planning and executing communication? (1 = Not at all; 7 = Very much) / … do you feel responsible for helping to define business strategies? (1 = Never; 7 = Always).

44
All professional roles tend to use rational decision making;operational supporters are risk-averse and copy best practices
www.communicationmonitor.eu / Zerfass et al. 2011 / n = 2,209 PR professionals; Q 4, Q 20. Decision-making is driven by the availabilityof new communication technologies: Significant differences between the four roles (chi-square test, p≤0.05).
Isolated Experts Business Advisers Operational Supporters Strategic Faciliators
Strongly disagree
When making a decision,I make a thorough evaluation
based on all possible information
Totally agree
I like the shared responsibility thatcomes from group decision-making
A risk not taken is usually an opportunity lost
Decision-making is drivenby the availability of new
communication technologies
Reviewing (scientific) literature and research helps to prepare a decision
When making decisions, it isuseful to rely on best practicesused by similiar organisations

45
Distribution of professional roles in European regions
Northern Europe
Strategic Facilitators
Operational Supporters
72.0% 66.8%
20.0%
Western Europe
Southern Europe
Eastern Europe
22.2%
65.3%
26.2% 27.7%
64.9%
www.communicationmonitor.eu / Zerfass et al. 2011 / n = 2,209 PR professionals; Q 4, Q 20. Significant differences between all regions (chi-square test, p≤0.05 ).
Business Advisers 4.6%1.8% 3.3% 2.2%
Isolated Experts 8.7%4.1% 5.3% 5.2%

46
Interpretation
Inclusive leadership and risk-averse decision making are predominant
Patterns of decision making utilised by European communication professionals differ from the behaviour of their counterparts in the United States. Both groups prefer rational decision making based on an evaluation of all information available. Only a minority of practitioners in Europe accept that a risk not taken is an opportunity lost. However, the shared responsibility offered by group-decision making is more popular than in the US.
Along this line, almost every second respondent reports a predominance for the inclusive leadership style, which means that leaders involve followers in shared decision making.
Practitioners in non-profit organisations use significantly different ways of decision making and leadership. Rational decisions are less common and an inclusive leadership style is prevalent.
67.8 per cent of communication professionals identify themselves with the advanced ‘strategic facilitator’ role, meaning that they support organisational goals by executing communication on the one hand whilst also helping to define business strategies. This number has risen by 10 per cent within the last two years. When making decisions, strategic facilitators are more rational, research-based and risk-friendly. Operational supporters are the second most important role. Only 6 per cent of the professionals act as isolated experts who do not contribute to strategic goals at all. This role is more common in Southern Europe than in any other region.
Power of communication departments

48
The top communication manager within the organisation …
Formal power of the communication function: In most organisations, communication leaders have a broad level of responsibility
www.communicationmonitor.eu / Zerfass et al. 2011 / n = 1,450 PR professionals in communication departments; Q 5: Within your organisation, the top communication manager is responsible for …; * public/media and communities, marketing/consumers, internal/employees, financial/investors, lobbying/politics
41.7% 41.7%
12.1%
4.6%
is responsible for all kinds of communication and
stakeholders*
is responsible for at least three communication fields
and stakeholder groups
is responsible for press/media relations and internal communication
is responsible for press/media relations

49
Reporting lines and hierarchy: The majority of top level communication managers reports directly to the CEO
www.communicationmonitor.eu / Zerfass et al. 2011 / n = 1,450 PR professionals in communication departments; Q 5: Within your organisation, the top communication manager ….
sits on the board17.8%
reports directly to the CEO
59.9%
reports to another board member or function
17.7%
does not report directly to the CEO or anyone who
sits on the board4.6%
The top communication manager within the organisation …
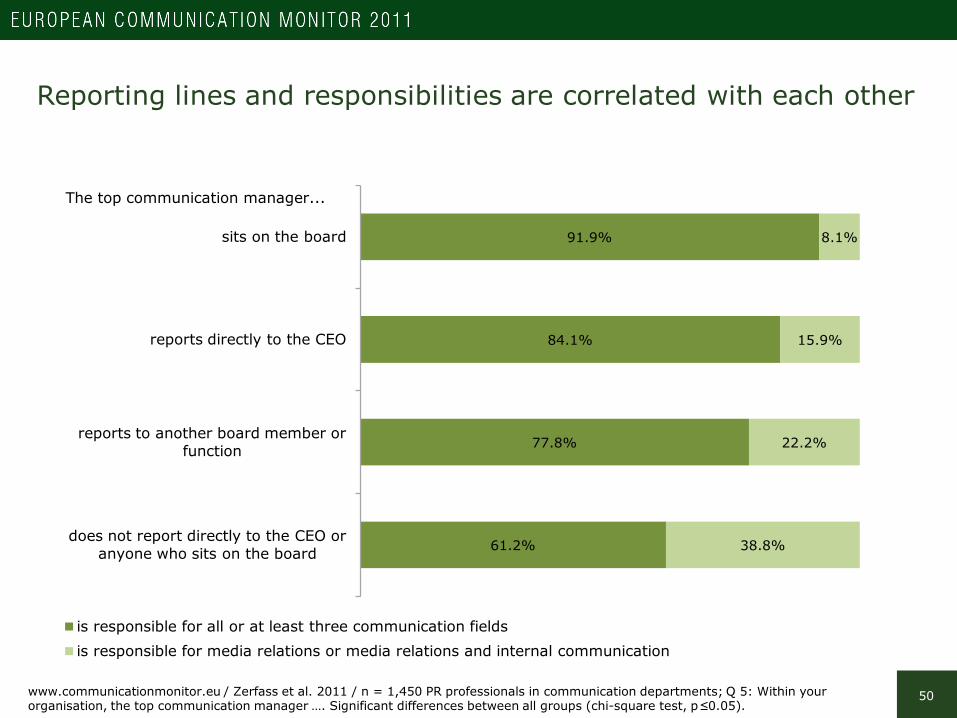
50
91.9%
84.1%
77.8%
61.2%
8.1%
15.9%
22.2%
38.8%
sits on the board
reports directly to the CEO
reports to another board member or function
does not report directly to the CEO or anyone who sits on the board
The top communication manager...
is responsible for all or at least three communication fieldsis responsible for media relations or media relations and internal communication
www.communicationmonitor.eu / Zerfass et al. 2011 / n = 1,450 PR professionals in communication departments; Q 5: Within your organisation, the top communication manager …. Significant differences between all groups (chi-square test, p≤0.05).
Reporting lines and responsibilities are correlated with each other

51
Levels of responsibility differ significantly within European regions
www.communicationmonitor.eu / Zerfass et al. 2011 / n = 1,450 PR professionals in communication departments; Q 5: Within your organisation, the top communication manager …. / Q 20. Significant differences between all four regions (chi-square test, p≤0.05).
40.0%47.9%
35.3%44.9%
43.1%40.0%
41.3%
43.4%
12.3%8.8%
16.4%
9.6%
4.6% 3.3% 7.0% 2.2%
Western Europe Northern Europe Southern Europe Eastern Europe
The top communicationmanager...
is responsible for press/media relations
is responsible for press/media relations and internal communication
is responsible for at least three communication fields and stakeholder groups
is responsible for all kinds of communication and stakeholders
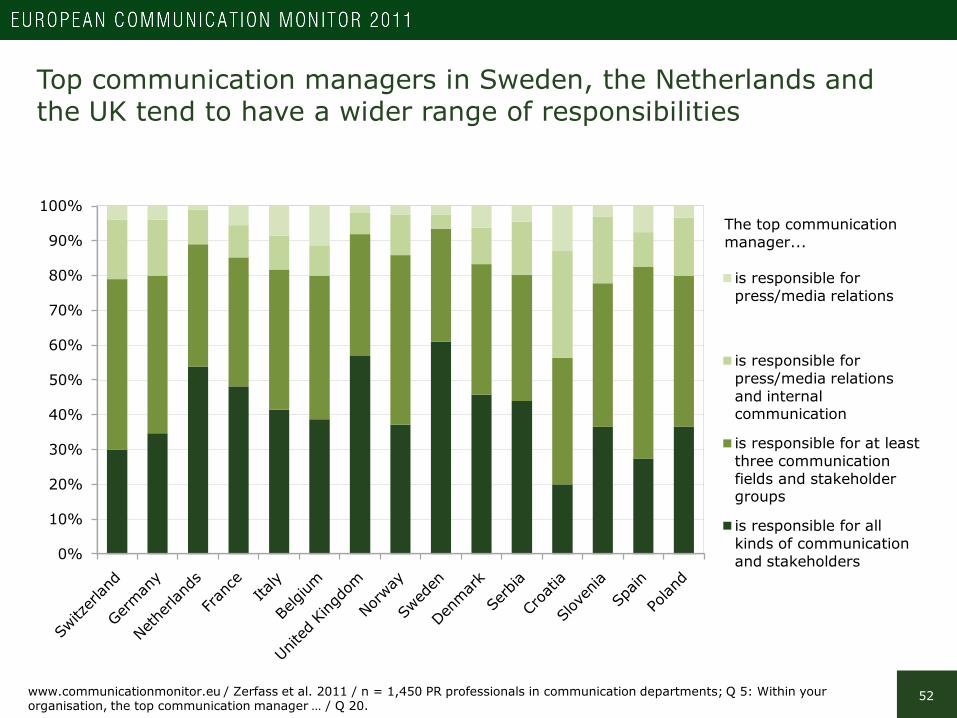
52
Top communication managers in Sweden, the Netherlands and the UK tend to have a wider range of responsibilities
www.communicationmonitor.eu / Zerfass et al. 2011 / n = 1,450 PR professionals in communication departments; Q 5: Within your organisation, the top communication manager … / Q 20.
0%
10%
20%
30%
40%
50%
60%
70%
80%
90%
100%The top communicationmanager...
is responsible for press/media relations
is responsible for press/media relations and internal communication
is responsible for at least three communication fields and stakeholder groups
is responsible for all kinds of communication and stakeholders

53
In governmental organisations, one out of ten communicationmanagers is merely responsible for media relations
www.communicationmonitor.eu / Zerfass et al. 2011 / n = 1,450 PR professionals in communication departments; Q 5: Within your organisation, the top communication manager …. / Q 20. Significant differences between the organisations (chi-square test, p≤0.05).
40.1% 42.0% 41.6% 45.6%
45.7% 39.3%34.2%
44.2%
11.3%14.4%
14.4%
7.4%
2.9% 4.3% 9.7% 2.8%
Joint stock companies
Private companies Governmental organisations
Non-profit organisations
The top communication manager...
is responsible for press/media relations
is responsible for press/media relations and internal communication
is responsible for at least three communication fields and stakeholder groups
is responsible for all kinds of communication and stakeholders
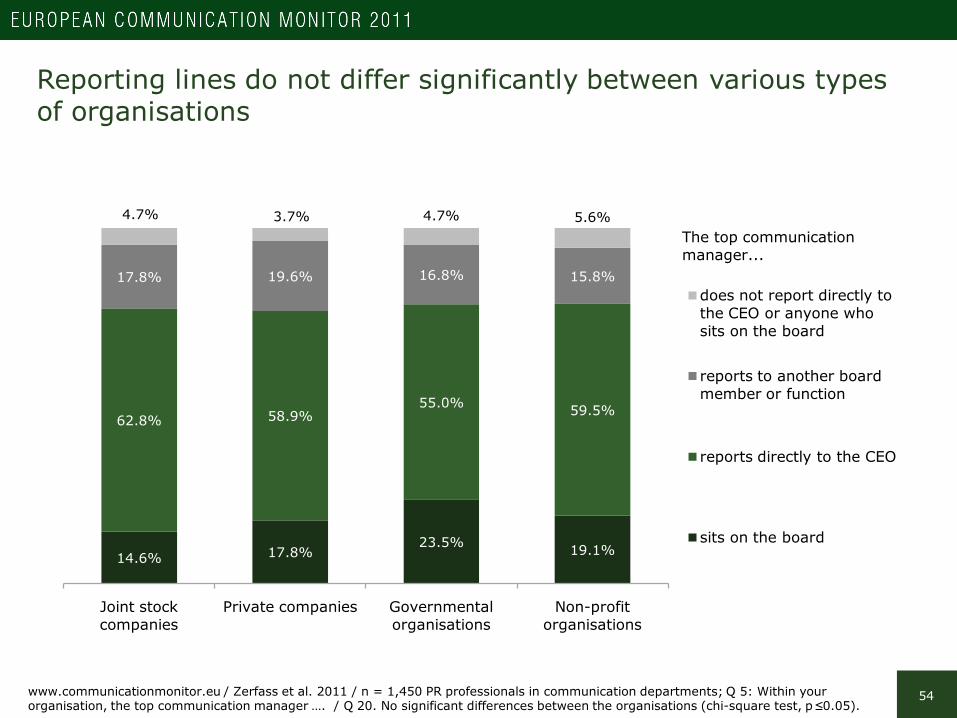
54
Reporting lines do not differ significantly between various typesof organisations
www.communicationmonitor.eu / Zerfass et al. 2011 / n = 1,450 PR professionals in communication departments; Q 5: Within your organisation, the top communication manager …. / Q 20. No significant differences between the organisations (chi-square test, p≤0.05).
14.6% 17.8%23.5% 19.1%
62.8% 58.9%55.0% 59.5%
17.8% 19.6% 16.8% 15.8%
4.7% 3.7% 4.7% 5.6%
Joint stock companies
Private companies Governmental organisations
Non-profit organisations
The top communication manager...
does not report directly to the CEO or anyone who sits on the board
reports to another board member or function
reports directly to the CEO
sits on the board

55
In Northern European countries, a quarter of the top level communicators sit on the board
www.communicationmonitor.eu / Zerfass et al. 2011 / n = 1,450 PR professionals in communication departments; Q 5: Within your organisation, the top communication manager …. / Q 20. Significant differences between all four regions (chi-square test, p≤0.05).
11.2%23.9% 19.9%
13.2%
65.5%52.3% 60.7%
64.0%
18.2% 20.6% 14.2% 16.9%
5.1% 3.3% 5.2% 5.9%
Western Europe Northern Europe Southern Europe Eastern Europe
The top communication manager...
does not report directly to the CEO or anyone who sits on the board
reports to another board member or function
reports directly to the CEO
sits on the board

56
Top communication managers in Germany and France are least likely to hold a board position
www.communicationmonitor.eu / Zerfass et al. 2011 / n = 1,450 PR professionals in communication departments; Q 5: Within your organisation, the top communication manager …. / Q 20.
0%
10%
20%
30%
40%
50%
60%
70%
80%
90%
100%The top communicationmanager...
does not report directly to the CEO or anyone who sits on the board
reports to another board member or function
reports directly to the CEO
sits on the board

57
Top communication managers tend to apply the inclusive leadership style if they have a broader area of responsibility
www.communicationmonitor.eu / Zerfass et al. 2011 / n = 1,450 PR professionals in communication departments; Q 19: How would you describe the dominant strategy used by leaders in your communication department to achieve common goals? / Q 5. Significant differences between the four groups (chi-square test, p≤0.05).
17.5% 17.5%
41.8%
35.9% 36.3%
32.0%
23.9%
46.5% 46.2%
36.0%
34.3%
all kinds of communication and stakeholders
at least three communication fields and
stakeholder groupspress/media relations and internal communication press/media relations
The top communication manager is responsible for …
Transactional Leadership
Transformational Leadership
Inclusive Leadership

58
Leaders tend to apply the inclusive leadership style if they sit on the board or report directly to the CEO
www.communicationmonitor.eu / Zerfass et al. 2011 / n = 1,450 PR professionals in communication departments; Q 19: How would you describe the dominant strategy used by leaders in your communication department to achieve common goals? / Q 5. Significant differences between the four groups (chi-square test, p≤0.05).
14.7%18.7%
24.9%
47.8%
37.2% 35.6% 33.1%26.9%
48.1%45.7%
42.0%
25.4%
sits on the boardreports directly to the
CEOreports to another board
member or function
does not report directly to the CEO or anyone who sits on the board
The top communication manager …
Transactional Leadership
Transformational Leadership
Inclusive Leadership
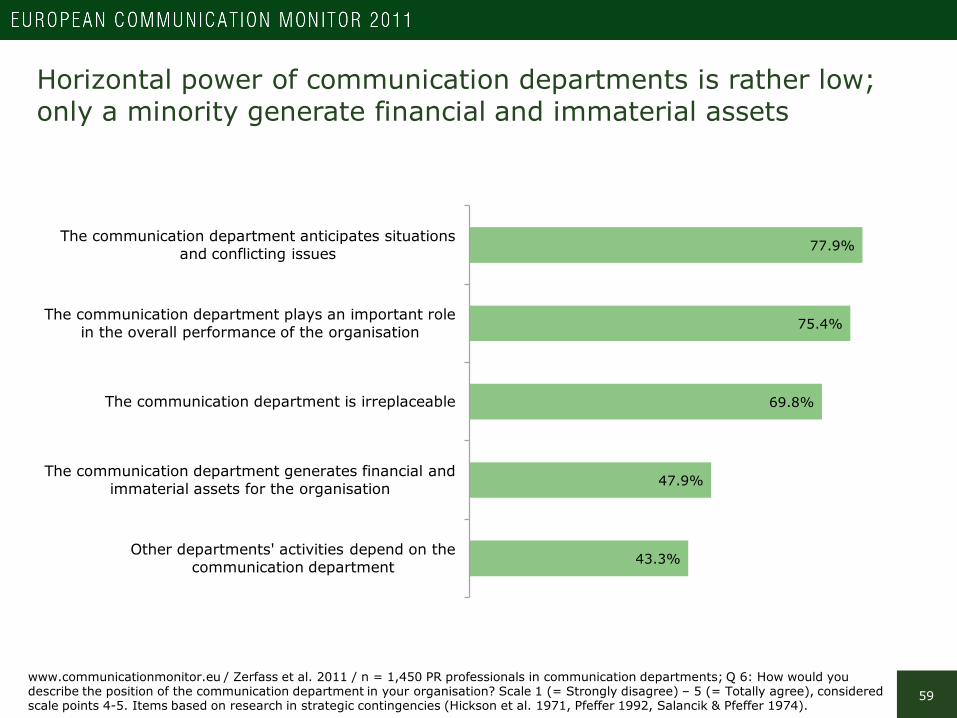
59
Horizontal power of communication departments is rather low;only a minority generate financial and immaterial assets
www.communicationmonitor.eu / Zerfass et al. 2011 / n = 1,450 PR professionals in communication departments; Q 6: How would you describe the position of the communication department in your organisation? Scale 1 (= Strongly disagree) – 5 (= Totally agree), considered scale points 4-5. Items based on research in strategic contingencies (Hickson et al. 1971, Pfeffer 1992, Salancik & Pfeffer 1974).
77.9%
75.4%
69.8%
47.9%
43.3%
The communication department anticipates situations and conflicting issues
The communication department plays an important role in the overall performance of the organisation
The communication department is irreplaceable
The communication department generates financial and immaterial assets for the organisation
Other departments' activities depend on the communication department

60
Anticipating situations and conflicting issues strengthens the internal position of communication departments
www.communicationmonitor.eu / Zerfass et al. 2011 / n = 1,450 PR professionals in communication departments; Q 6: How would you describe the position of the communication department in your organisation? Scale 1 (= Strongly disagree) – 5 (= Totally agree).Significant correlations between all items (Pearson correlation, 2-tailed, p≤0.01,).
The communication department plays an important role
in the overall performance of the organisation
The communication departmentanticipates situations and conflicting issues
The communication departmentgenerates financial and immaterial assets for the organisation
.463
The communication department is irreplaceable
.378
.442
.265
61
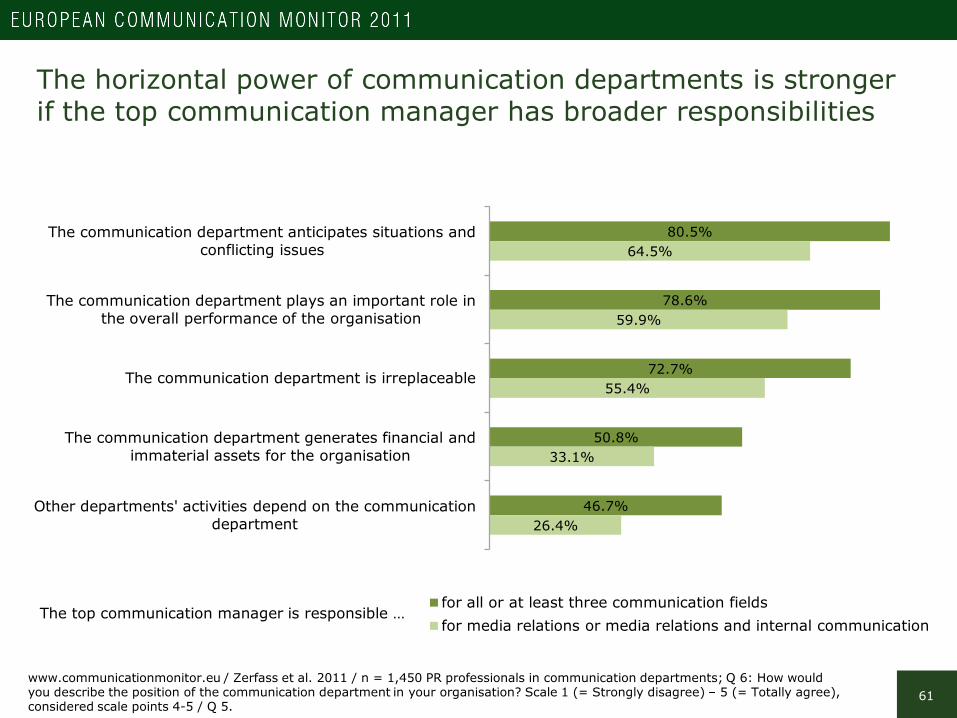
The horizontal power of communication departments is strongerif the top communication manager has broader responsibilities
www.communicationmonitor.eu / Zerfass et al. 2011 / n = 1,450 PR professionals in communication departments; Q 6: How would you describe the position of the communication department in your organisation? Scale 1 (= Strongly disagree) – 5 (= Totally agree), considered scale points 4-5 / Q 5.
80.5%
78.6%
72.7%
50.8%
46.7%
64.5%
59.9%
55.4%
33.1%
26.4%
The communication department anticipates situations and conflicting issues
The communication department plays an important role in the overall performance of the organisation
The communication department is irreplaceable
The communication department generates financial and immaterial assets for the organisation
Other departments' activities depend on the communication department
The top communication manager is responsible …for all or at least three communication fieldsfor media relations or media relations and internal communication

62
Influence of communication professionals in Europe:Three out of four are trusted advisers and involved in planning
77.9%are taken seriously by senior management (advisory influence)
+2.4% compared to 2010
76.9%are likely to be invited to senior-level meetings dealingwith organisational strategic planning (executive influence)
+4.8% compared to 2010
www.communicationmonitor.eu / Zerfass et al. 2011 / n = 1,449 PR professionals in communication departments; Q 7; Zerfaß et al. 2010 / nmax = 1,511; Q4: In your organisation, how seriously do senior managers take the recommendations of the communication function?; How likely is it, within your organisation, that communication would be invited to senior-level meetings dealing with organisational strategic planning? Scale 1-7; considered scale points: 5-7. Instrument adapted from US GAP VI survey (Swerling 2009).

63
Advisory and executive influence have grown during the last years
63%
65%
67%
69%
71%
73%
75%
77%
79%
2008 2009 2010 2011
Advisory influence Executive influence
www.communicationmonitor.eu / Zerfass et al. 2011 / n = 1,449 PR professionals in communication departments; Q 7; Zerfass et al. 2010 / nmax = 1,511; Q4 / Zerfass et al. 2009, nmax = 1,267; Q 3 / Zerfass et al. 2008, n = 1,027; Q 1 / Advisory influence: consistent wording 2008-2011 / Executive influence: wording in the questionnaire has been changed since 2010 in line with the US GAP surveys (Swerling 2009).
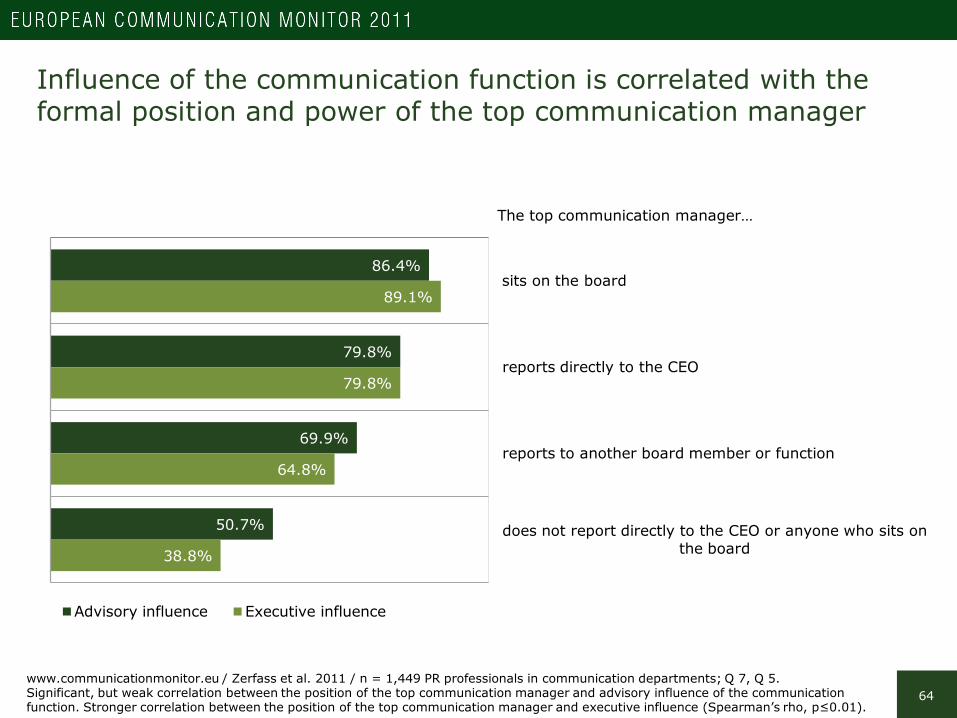
64www.communicationmonitor.eu / Zerfass et al. 2011 / n = 1,449 PR professionals in communication departments; Q 7, Q 5. Significant, but weak correlation between the position of the top communication manager and advisory influence of the communication function. Stronger correlation between the position of the top communication manager and executive influence (Spearman’s rho, p≤0.01).
Influence of the communication function is correlated with the formal position and power of the top communication manager
86.4%
79.8%
69.9%
50.7%
89.1%
79.8%
64.8%
38.8%
sits on the board
reports directly to the CEO
reports to another board member or function
does not report directly to the CEO or anyone who sits on the board
The top communication manager…
Advisory influence Executive influence
65
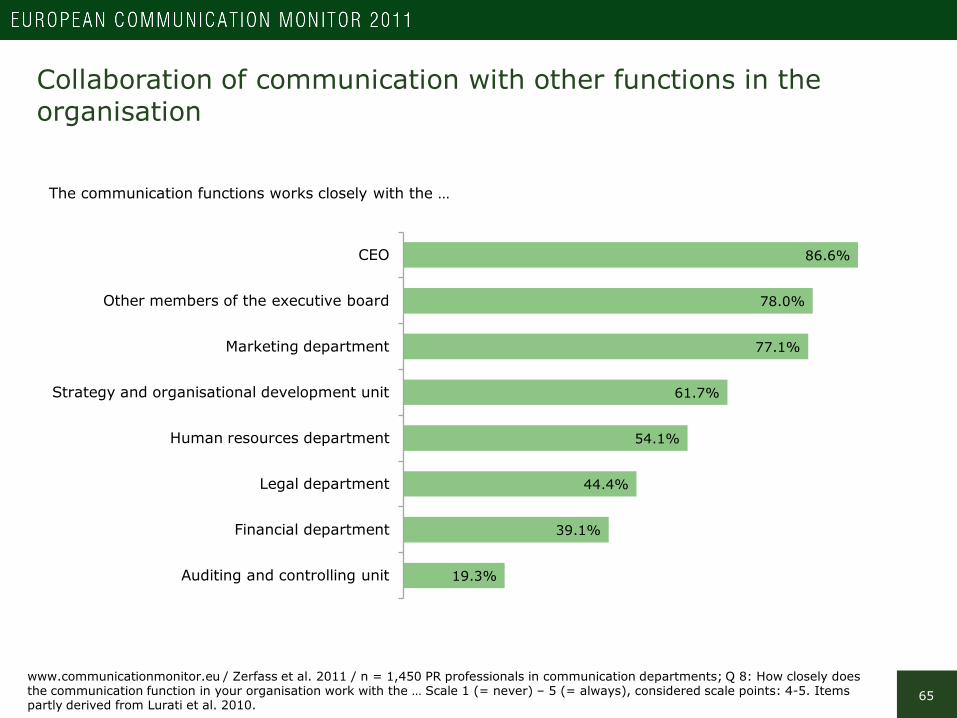
Collaboration of communication with other functions in the organisation
www.communicationmonitor.eu / Zerfass et al. 2011 / n = 1,450 PR professionals in communication departments; Q 8: How closely does the communication function in your organisation work with the … Scale 1 (= never) – 5 (= always), considered scale points: 4-5. Items partly derived from Lurati et al. 2010.
86.6%
78.0%
77.1%
61.7%
54.1%
44.4%
39.1%
19.3%
CEO
Other members of the executive board
Marketing department
Strategy and organisational development unit
Human resources department
Legal department
Financial department
Auditing and controlling unit
The communication functions works closely with the …

66
Collaboration with other functions in different types of organisations
Joint stock companies
CEO
Other members of the executive board
87.6% 81.2%
74.5%
Private companies
Governmental organisations
Non-profit organisations
81.2%
85.9%
77.6% 74.4%
92.6%
Human resources department 40.3%64.6% 57.7% 38.1%
Financial department 26.8%49.8% 35.0% 32.1%
Legal department
Marketing department
57.3% 33.6%
66.1%78.2%
40.5%
85.6% 76.3%
28.8%
Auditing and controlling unit 22.1%20.0% 15.3% 19.5%
Strategy and organisationaldevelopment unit 59.7%59.6% 62.9% 66.8%
www.communicationmonitor.eu / Zerfass et al. 2011 / n = 1,450 PR professionals in communication departments; Q 8: How closely does the communication function in your organisation work with the … Scale 1 (= never) – 5 (= always), considered scale points: 4-5 / Q 20. Items 3, 4, 5, 6, 7: Significant differences between the four types of organisations (chi-square test, p≤0.05).

67
Interpretation
Communication departments are influential, but lack many aspects of power
The communication function has gained more influence in Europe during the last years; in three out of four organisations communication is taken seriously be senior management and communication is likely to be involved in planning organisational strategies
Working relationships are especially close with the CEO (reported by 86.6 per cent of the respondents), followed by other members of the executive board and the marketing department (more than 75 per cent). Good links to the strategy people are hindered by rather weak connections to auditing and controlling units.
17.8 per cent of communication professionals are board members. However, this differs widely between various types of organisations, regions and countries in Europe. It is less prevalent in companies and in Western Europe.
Six out of ten top communication managers report directly to the CEO, and 83.4 per cent are responsible for all kind of public / media, marketing, internal, financial and lobbying communications or at least three of these fields. When leaders hold more responsibility they prefer an inclusive leadership style. The transactional style is prevalent when practitioners do not report to the board and restrict their functions to media relations.
However, these indicators of formal power are not always accompanied by horizontal power. It is clearly possible for the self reporting respondents to have power and no influence and vice versa. For example there are respondents who are responsible for a lot within the organisation but then 24.5 per cent of them don’t see the communication department as playing an important role in the overall performance of the company, and possibly more concerning 30.2 per cent think it is replaceable.

ROI of communication

69
Almost every second professional uses the term ‘return on investment’ when planning or evaluating communication
www.communicationmonitor.eu / Zerfass et al. 2011 / n = 2,209 PR professionals; Q 16: Do you regularly use the term ‘ROI’ or ‘return on investment’ when planning and evaluating communication activities? (1 = Yes, 2 = No, 3 = I don’t know the term) , Q 20. Significant differences between all hierarchical positions (chi-square test, p≤0.05).
Position Usage of the ROI concept
Head of communication, Agency CEO 53.7%
Unit leader 45.7%
Team member, consultant 34.5%
47.6%
46.5%
5.9%use the term 'return on investment'
do not use the term 'return on investment'
do not know the term 'return on investment'
70
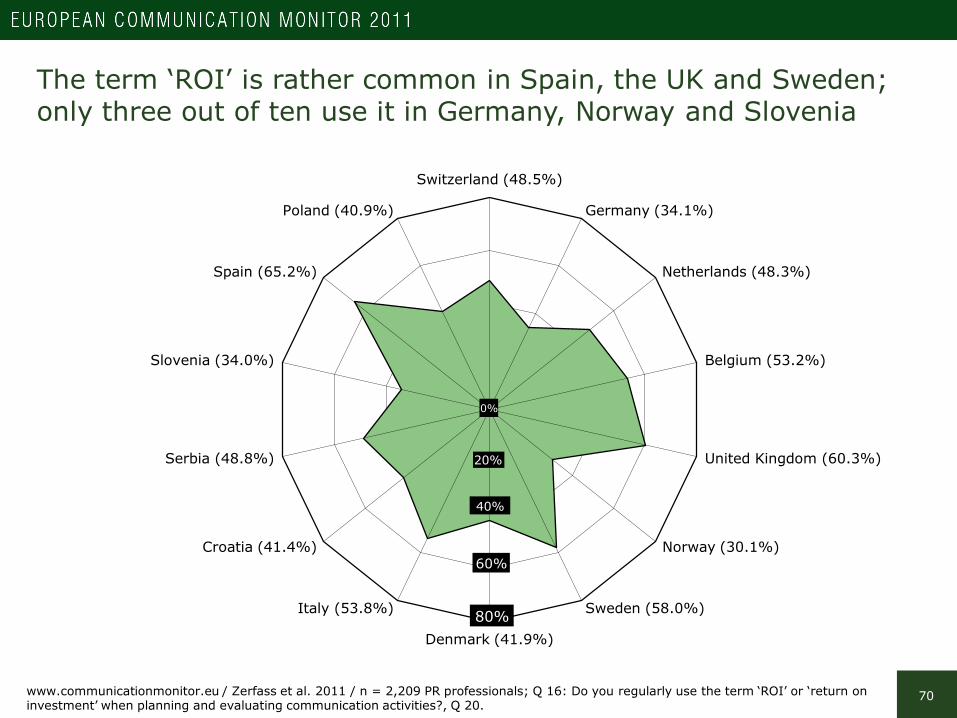
The term ‘ROI’ is rather common in Spain, the UK and Sweden; only three out of ten use it in Germany, Norway and Slovenia
Switzerland (48.5%)
Germany (34.1%)
Netherlands (48.3%)
Belgium (53.2%)
United Kingdom (60.3%)
Norway (30.1%)
Sweden (58.0%)
Denmark (41.9%)
Italy (53.8%)
Croatia (41.4%)
Serbia (48.8%)
Slovenia (34.0%)
Spain (65.2%)
Poland (40.9%)
40%
20%
0%
60%
80%
www.communicationmonitor.eu / Zerfass et al. 2011 / n = 2,209 PR professionals; Q 16: Do you regularly use the term ‘ROI’ or ‘return on investment’ when planning and evaluating communication activities?, Q 20.
71
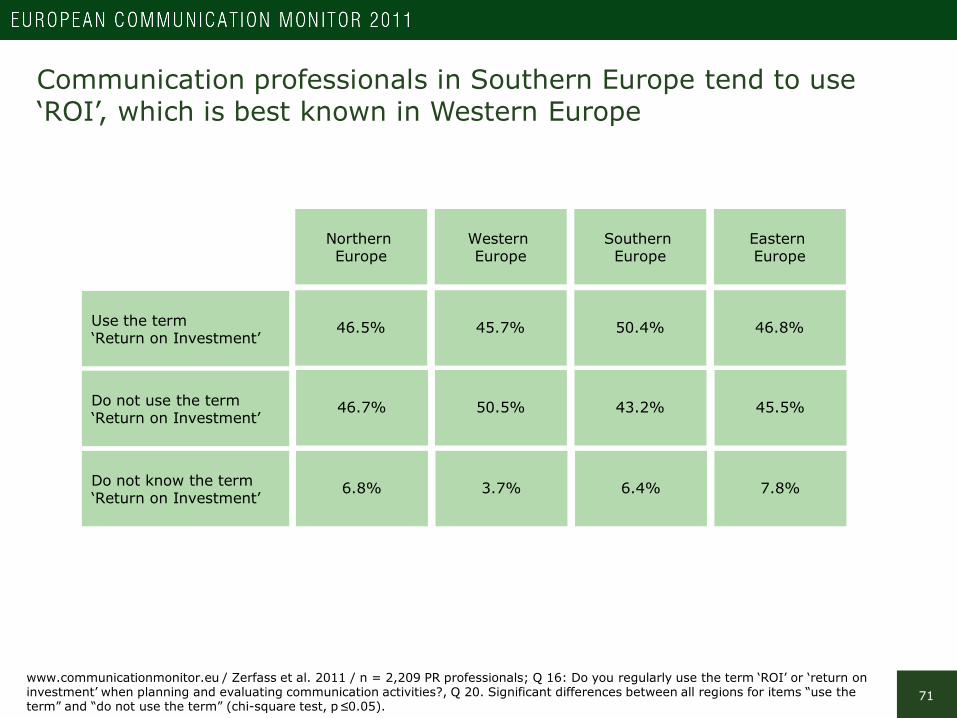
Communication professionals in Southern Europe tend to use ‘ROI’, which is best known in Western Europe
Northern Europe
46.5% 50.4%
43.2%
Western Europe
Southern Europe
Eastern Europe
46.7%
45.7%
50.5% 45.5%
46.8%
6.4%6.8% 3.7% 7.8%
Use the term ‘Return on Investment’
Do not use the term ‘Return on Investment’
Do not know the term ‘Return on Investment’
www.communicationmonitor.eu / Zerfass et al. 2011 / n = 2,209 PR professionals; Q 16: Do you regularly use the term ‘ROI’ or ‘return on investment’ when planning and evaluating communication activities?, Q 20. Significant differences between all regions for items “use the term” and “do not use the term” (chi-square test, p≤0.05).
72
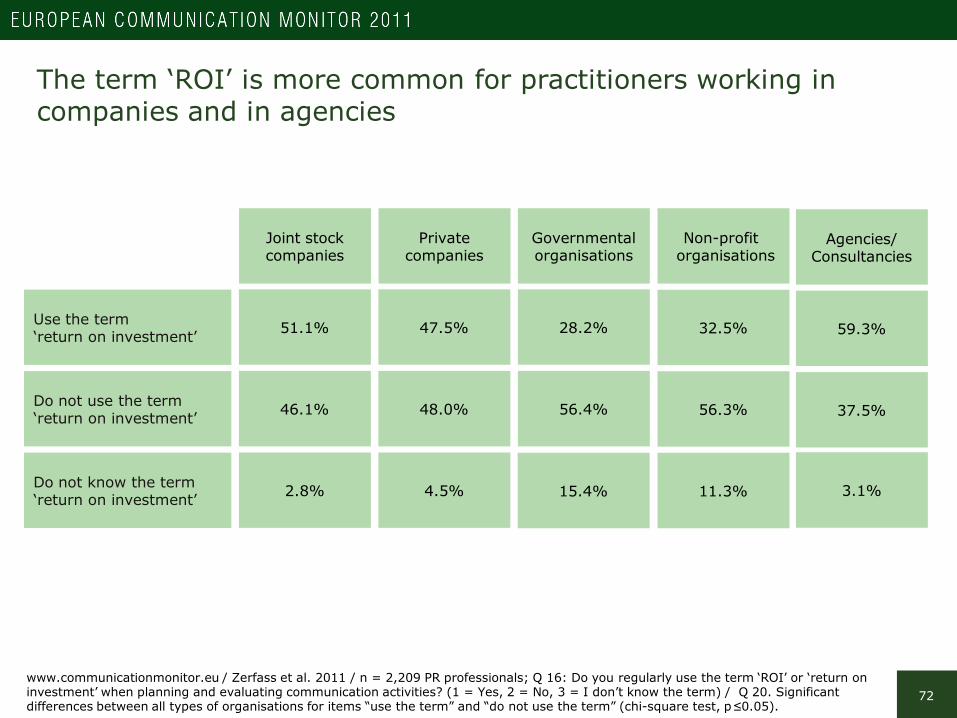
The term ‘ROI’ is more common for practitioners working in companies and in agencies
51.1% 47.5%Use the term ‘return on investment’
Do not use the term ‘return on investment’ 46.1% 48.0%
2.8% 4.5%Do not know the term ‘return on investment’
28.2%
56.4%
15.4%
32.5%
56.3%
11.3%
Joint stockcompanies
Privatecompanies
Governmentalorganisations
Non-profit organisations
59.3%
37.5%
3.1%
Agencies/Consultancies
www.communicationmonitor.eu / Zerfass et al. 2011 / n = 2,209 PR professionals; Q 16: Do you regularly use the term ‘ROI’ or ‘return on investment’ when planning and evaluating communication activities? (1 = Yes, 2 = No, 3 = I don’t know the term) / Q 20. Significant differences between all types of organisations for items “use the term” and “do not use the term” (chi-square test, p≤0.05).

73
Most communication professionals have an improperunderstanding of the ROI concept
www.communicationmonitor.eu / Zerfass et al. 2011 / n = 2,209 PR professionals; Q 16: Would you agree or disagree with the following statements? (1 = Agree, 2 = Disagree, 3 = I don’t know). “ROI is the ratio of financial profit …” is the standard economic definition for ROI; only statements marked with * are consistent with the standard definition of ROI. Items partly based on research on ROI concepts in communication. i.e. Gregory & Watson 2008, Likely, Rockland & Weiner 2006.
83.1%
72.5%
70.5%
62.8%
58.0%
52.8%
38.3%
ROI can be expressed in achievement of communication objectives
ROI requires financial assessments of the resources used for communication *
ROI can demonstrate the non-financial value of communication
ROI expresses communication's contribution to the formation of organisational strategy
ROI needs a standardised financial valuation of results achieved by communication *
ROI is the ratio of financial profit resulting from a communication activity against its actual cost *
ROI has to be defined in monetary terms *

74
More frequent and more accurate use of the term ‘ROI’ in communication agencies and consultancies
Communicationdepartments
42.8%
Agencies/Consultancies
59.3%
ROI is the ratio of financial profit resultingfrom a communication activity against its actual cost
51.3% 56.3%
Usage of the term ‘ROI’ or ‘return on investment’
www.communicationmonitor.eu / Zerfass et al. 2011 / n = 2,209 PR professionals; Q 16: Do you regularly use the term ‘ROI’ or ‘return on investment’ when planning and evaluating communication activities? (1 = Yes, 2 = No, 3 = I don’t know the term) / Q 20. Significant differences between communication departments and agencies regarding the two items displayed (chi-square test, p≤0.05).

75
Interpretation
Misleading use of the ROI concept in planning and evaluating communications
Communication professionals are ambiguous about ‘return on investment’, a concept propagated by a number of evaluation companies for proving the economic value of communication activities.
Almost every second practitioner claims to use the term, which is especially popular among heads of communication and agencies, in consultancies and companies. It is common for six out of ten professionals in Spain, the UK and Sweden.
A minority of professionals working in governmental organisations and in countries like Norway, Slovenia and Germany use ROI when planning and evaluating communications.
While ROI is clearly defined in economics as the ratio of financial profit resulting from an activity against its actual cost, most communication professionals think it can be expressed in achievement of communication objectives or be used to demonstrate the non-financial value of communication. Only 52.8 per cent agree with the standard definition, and even less know that ROI has to be defined in monetary terms.
The research shows that basic knowledge about management theories and accounting is missing in the profession. Using the ROI concept in an improper way is pointless and may even damage the reputation of the profession.
Strategic issues and trust

77
Strategic issues for communication management until 2014
Coping with the digital evolution and the social
web54.9%
Linking business strategy and communication
44.0%
Dealing with sustainable development and social
responsibility37.2%
Dealing with the demand for more transparency and active audiences
35.1%
Building and maintaining trust
30.1%
Supporting organisationalchange19.2%
Advancing public affairs and political
communication17.7%
Globalisation of communication strategies
17.2%
Establishing new methods to evaluate
communication16.3%
Advancing issues management and
corporate foresight13.0%
Developing CEO positioning and communication
9.6%
Supporting intercultural integration
5.9%
www.communicationmonitor.eu / Zerfass et al. 2011 / n = 2,209 PR professionals; Q 12: Here are some issues that might become relevant for public relations and communication management within the next three years. Please pick those three which are most important from your point of view.
78
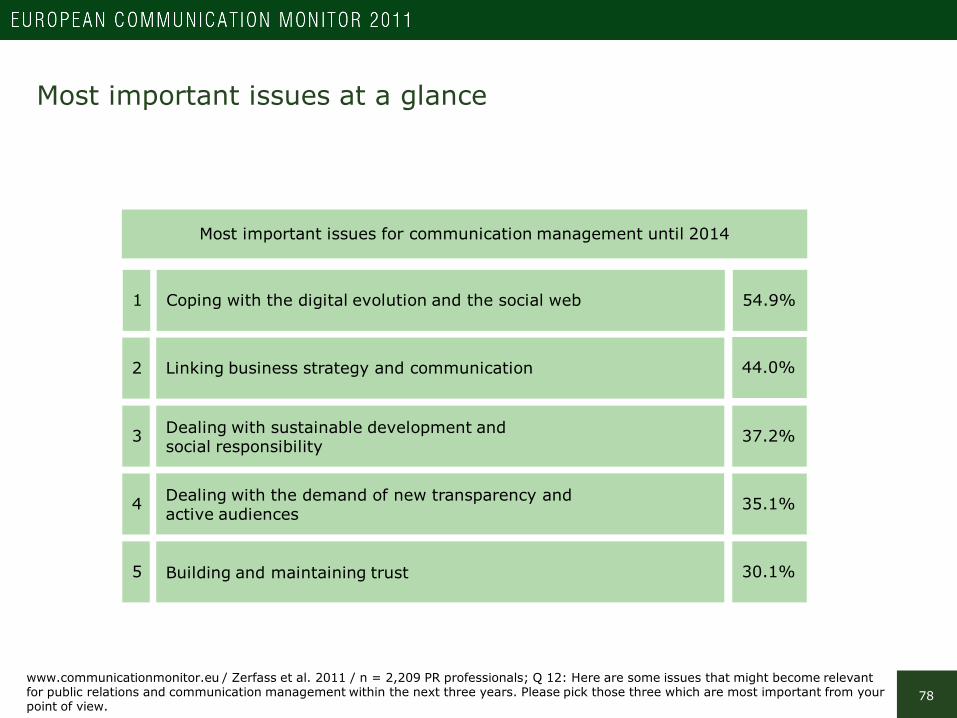
Most important issues at a glance
www.communicationmonitor.eu / Zerfass et al. 2011 / n = 2,209 PR professionals; Q 12: Here are some issues that might become relevant for public relations and communication management within the next three years. Please pick those three which are most important from your point of view.
Most important issues for communication management until 2014
1 Coping with the digital evolution and the social web
2 Linking business strategy and communication
3 Dealing with sustainable development and social responsibility
4 Dealing with the demand of new transparency andactive audiences
5 Building and maintaining trust
54.9%
44.0%
37.2%
35.1%
30.1%

79
Relevance of strategic issues compared to previous surveys
www.communicationmonitor.eu / Zerfass et al. 2011 / n = 2,209 PR professionals; Q 12; Zerfass et al. 2010 / n = 1,955; Q 7;Zerfass et al. 2009 / n = 1,863; Q 6.
54.9%
44.0%
37.2%
35.1%
30.1%
53.7%
43.6%
36.7%
33.1%
32.8%
45.0%
47.3%
38.0%
30.5%
34.6%
Coping with the digital evolution and the social web
Linking business strategy and communication
Dealing with sustainable development and social responsibility
Dealing with the demand for more transparency and active audiences
Building and maintaining trust
2011 2010 2009
80
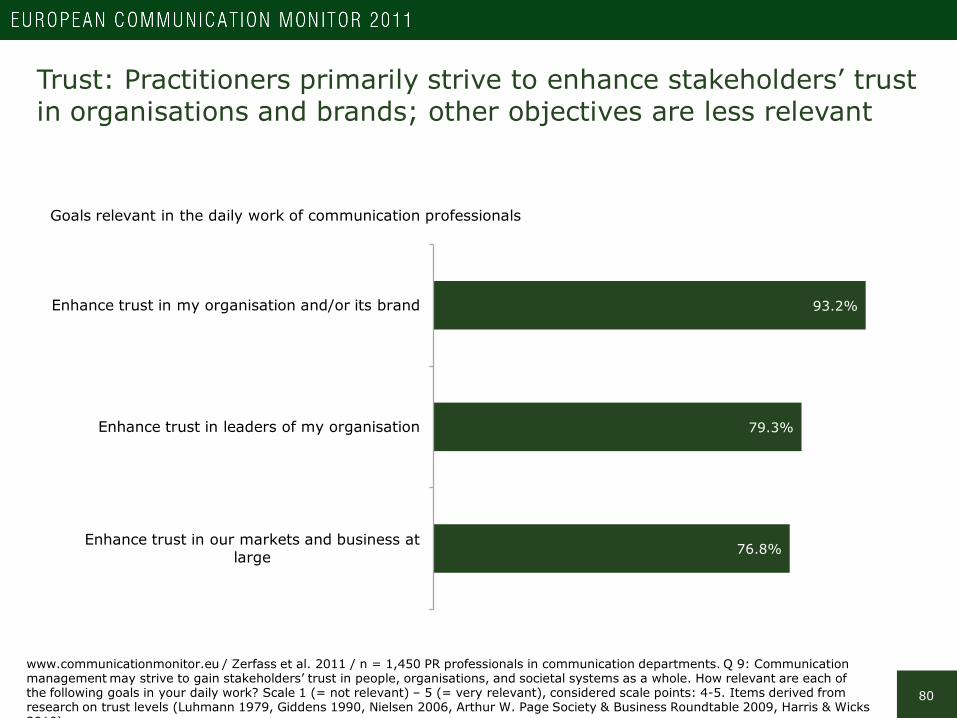
Trust: Practitioners primarily strive to enhance stakeholders’ trust in organisations and brands; other objectives are less relevant
www.communicationmonitor.eu / Zerfass et al. 2011 / n = 1,450 PR professionals in communication departments. Q 9: Communication management may strive to gain stakeholders’ trust in people, organisations, and societal systems as a whole. How relevant are each of the following goals in your daily work? Scale 1 (= not relevant) – 5 (= very relevant), considered scale points: 4-5. Items derived from research on trust levels (Luhmann 1979, Giddens 1990, Nielsen 2006, Arthur W. Page Society & Business Roundtable 2009, Harris & Wicks 2010)
93.2%
79.3%
76.8%
Enhance trust in my organisation and/or its brand
Enhance trust in leaders of my organisation
Enhance trust in our markets and business at large
Goals relevant in the daily work of communication professionals

81
Gaining stakeholders’ trust as a goal of communication management in various types of organisations
Enhance trust in leaders of my organisation
Enhance trust in my organisation and/or its brand
84.3% 75.8%
88.9%94.9%
74.2%
92.3% 95.3%
77.7%
Enhance trust in our markets or business at large
62.8%82.0% 78.8% 78.1%
Joint stock companies
Private companies
Governmental organisations
Non-profit organisations
www.communicationmonitor.eu / Zerfass et al. 2011 / n = 1,450 PR professionals in communication departments; Q 9: Communication management may strive to gain stakeholders’ trust in people, organisations, and societal systems as a whole. How relevant are each of the following goals in your daily work? Scale 1 (= not relevant) – 5 (= very relevant), considered scale points: 4-5 / Q 20. No significant differences between the different types of organisations (chi-square test, p≤0.05).

82
Gaining stakeholders’ trust in different European regions
Northern Europe
Enhance trust in leaders of my organisation
Enhance trust in my organisation and/or its brand
84.2% 74.9%
86.3%
Western Europe
Southern Europe
Eastern Europe
97.2%
77.4%
95.4% 92.6%
82.4%
Enhance trust in our markets or business at large
72.4%81.0% 77.6% 72.8%
www.communicationmonitor.eu / Zerfass et al. 2011 / n = 1,450 PR professionals in communication departments; Q 9: Communication management may strive to gain stakeholders’ trust in people, organisations, and societal systems as a whole. How relevant are each of the following goals in your daily work? Scale 1 (= not relevant) – 5 (= very relevant), considered scale points: 4-5 / Q 20. No significant differences between the four regions (chi-square test, p≤0.05).

83
Interpretation
Digital development and building trust in organisations are key challenges
Coping with the digital evolution and the social web continues to be the most importantissue for communication management in the next few years. 54.9 per cent of the respondents identified this challenge. The issue is valued more importantly in each annualsurvey, as is the related demand for more transparency and dealing with active audiences. Other issues are judged in the same way as before such as the second-ranking topic‘linking business strategy and communication’ while some have even lost importance, likeenhancing trust.
Three out of ten professionals state that building and maintaining trust is a major challengefor communication management within the next three years. When striving to gainstakeholders’ trust, almost every respondent (93.2 per cent) claims he or she wants to enhance trust in the organisation and/or its brands.
Alternative objects of trust like leaders of the organisation (people) and markets orbusinesses at large (societal systems) are less relevant; they are named by less than80 per cent of the respondents. However, enhancing trust in named people is more relevant in joint stock companies and in Northern Europe.

Development of disciplines and communication channels
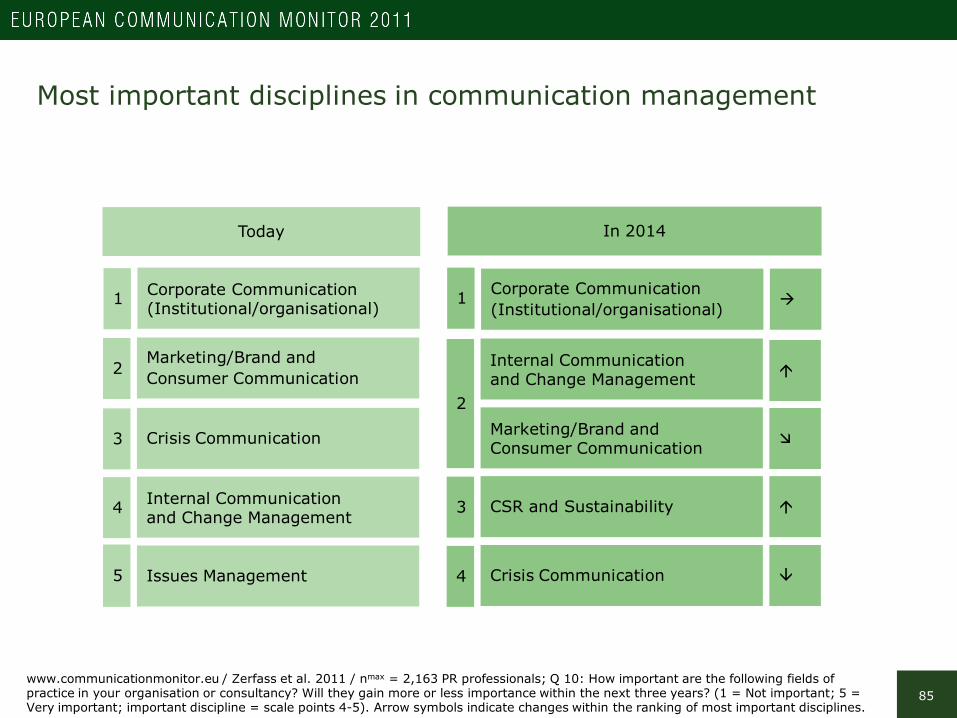
85www.communicationmonitor.eu / Zerfass et al. 2011 / nmax = 2,163 PR professionals; Q 10: How important are the following fields of practice in your organisation or consultancy? Will they gain more or less importance within the next three years? (1 = Not important; 5 = Very important; important discipline = scale points 4-5). Arrow symbols indicate changes within the ranking of most important disciplines.
Today In 2014
1 Corporate Communication(Institutional/organisational)
2Marketing/Brand and Consumer Communication
3 Crisis Communication
4 Internal Communication and Change Management
5 Issues Management
1 Corporate Communication(Institutional/organisational)
2
Internal Communication and Change Management
Marketing/Brand and Consumer Communication
3 CSR and Sustainability
4 Crisis Communication
Most important disciplines in communication management

86
Corporate communication and internal communication are steadily growing, while marketing has lost ground
www.communicationmonitor.eu / Zerfass et al. 2011 / nmax = 2,163 PR professionals; Q 10; Zerfass et al. 2010 / nmax = 1,926; Q 5;Zerfass et al. 2009 / nmax = 1,863; Q 4; Zerfass et al. 2008 / n = 1,524; Q 2; Zerfass et al. 2007 / n = 1,087; Q 3.
0%
10%
20%
30%
40%
50%
60%
70%
80%
90%
100%
2007 2008 2009 2010 2011 2012 (prediction)
2013 (prediction)
2014 (prediction)
Importance of fields of practice in communication management
Corporate Communication (Institutional/organisational) Marketing/Brand and Consumer CommunicationInternal Communication and Change Management Corporate Social Responsibility and SustainabilityCrisis Communication
87
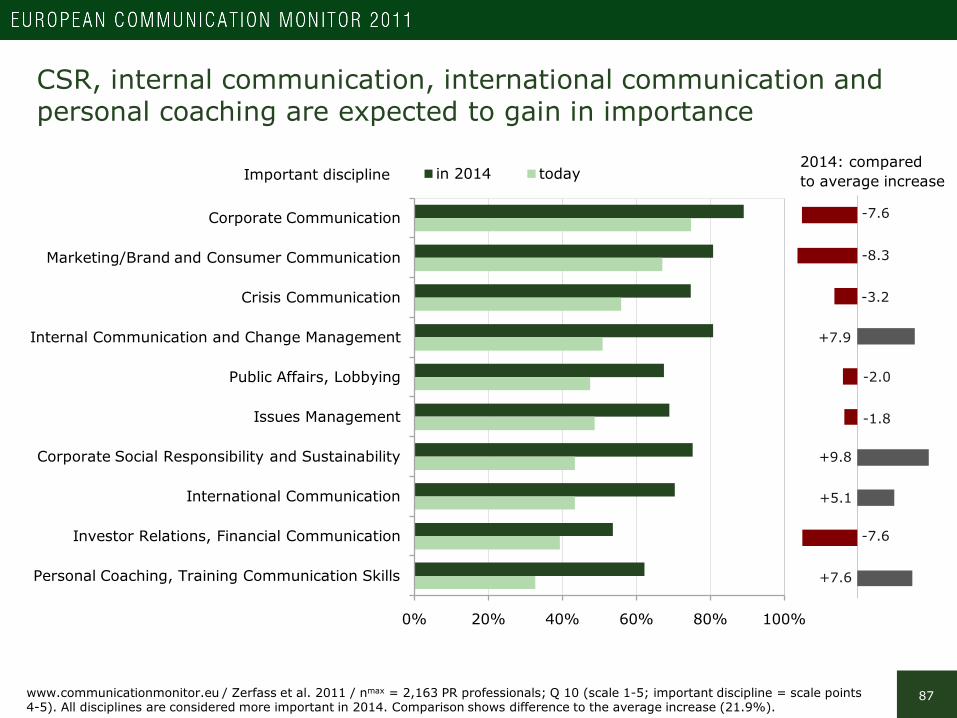
2014: compared to average increase
www.communicationmonitor.eu / Zerfass et al. 2011 / nmax = 2,163 PR professionals; Q 10 (scale 1-5; important discipline = scale points 4-5). All disciplines are considered more important in 2014. Comparison shows difference to the average increase (21.9%).
-7.6
-8.3
-3.2
+7.9
-2.0
-1.8
+9.8
+5.1
-7.6
+7.6
0% 20% 40% 60% 80% 100%
Corporate Communication
Marketing/Brand and Consumer Communication
Crisis Communication
Internal Communication and Change Management
Public Affairs, Lobbying
Issues Management
Corporate Social Responsibility and Sustainability
International Communication
Investor Relations, Financial Communication
Personal Coaching, Training Communication Skills
in 2014 today
CSR, internal communication, international communication and personal coaching are expected to gain in importance
Important discipline
88
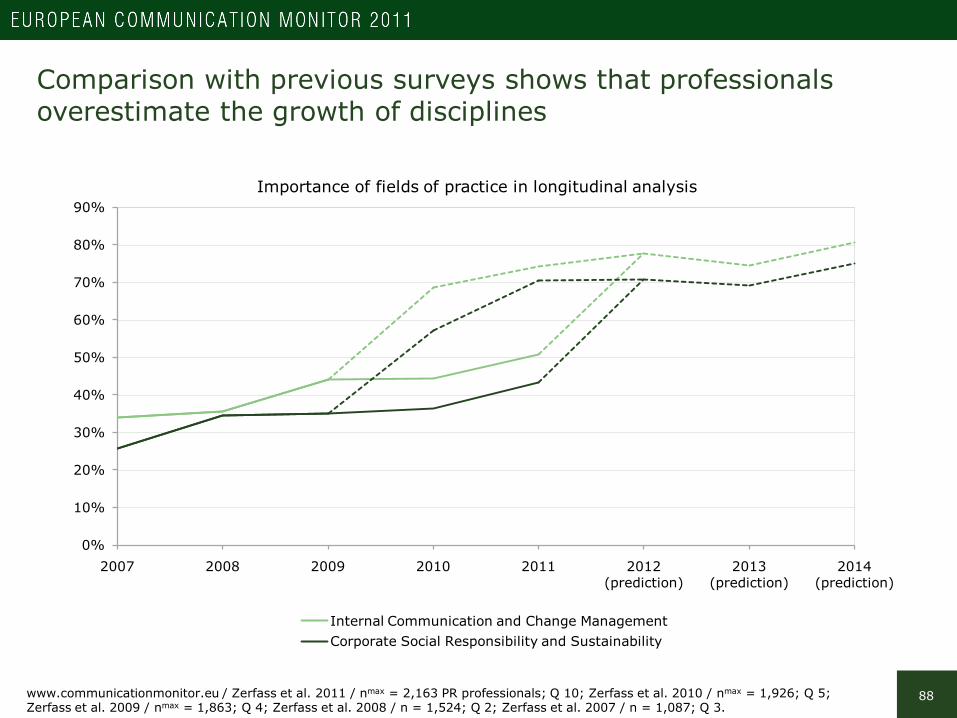
Comparison with previous surveys shows that professionalsoverestimate the growth of disciplines
www.communicationmonitor.eu / Zerfass et al. 2011 / nmax = 2,163 PR professionals; Q 10; Zerfass et al. 2010 / nmax = 1,926; Q 5;Zerfass et al. 2009 / nmax = 1,863; Q 4; Zerfass et al. 2008 / n = 1,524; Q 2; Zerfass et al. 2007 / n = 1,087; Q 3.
0%
10%
20%
30%
40%
50%
60%
70%
80%
90%
2007 2008 2009 2010 2011 2012 (prediction)
2013 (prediction)
2014 (prediction)
Internal Communication and Change ManagementCorporate Social Responsibility and Sustainability
Importance of fields of practice in longitudinal analysis
89
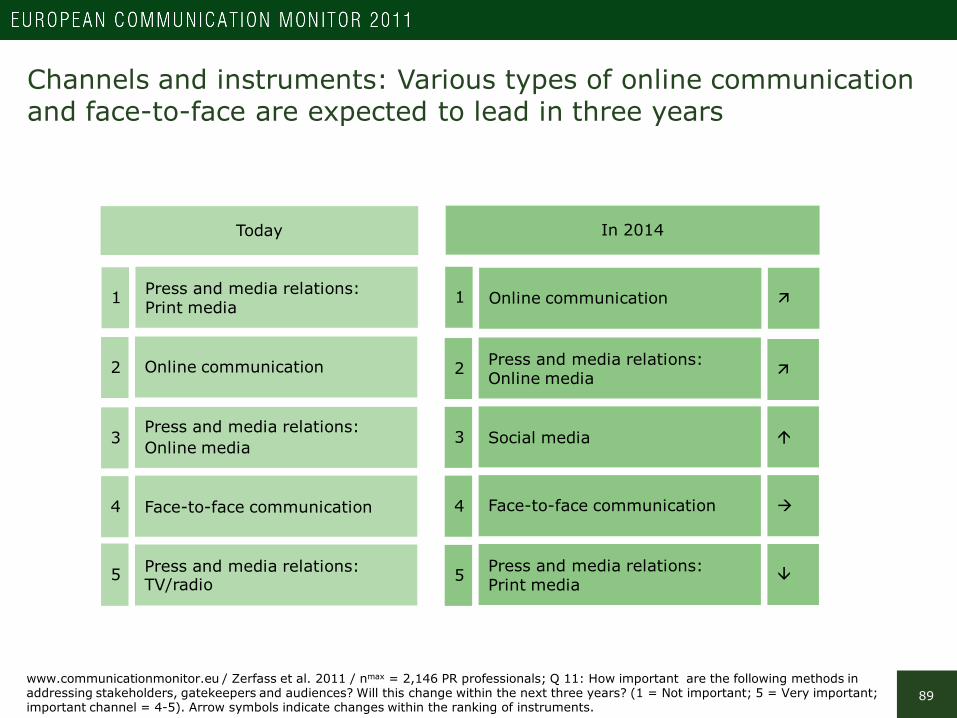
Channels and instruments: Various types of online communicationand face-to-face are expected to lead in three years
Today In 2014
1 Press and media relations: Print media
2 Online communication
3Press and media relations: Online media
4 Face-to-face communication
5 Press and media relations: TV/radio
1 Online communication
2 Press and media relations:Online media
3 Social media
4 Face-to-face communication
5 Press and media relations:Print media
www.communicationmonitor.eu / Zerfass et al. 2011 / nmax = 2,146 PR professionals; Q 11: How important are the following methods in addressing stakeholders, gatekeepers and audiences? Will this change within the next three years? (1 = Not important; 5 = Very important; important channel = 4-5). Arrow symbols indicate changes within the ranking of instruments.

90
Expected development of communication channels
www.communicationmonitor.eu / Zerfass et al. 2011 / nmax = 2,146 PR professionals; Q 11: How important are the following methods in addressing stakeholders, gatekeepers and audiences? Will this change within the next three years? (1 = not important; 5 = very important; important instrument = scale points 4-5.) Comparison shows difference to the average increase (11.1%).
2014: compared to average increase
-27.2
+4.5
-5.8
-7.8
+33.9
-4.8
+9.4
+1.9
+14.8
-9.3
-9.7
0% 20% 40% 60% 80% 100%
Addressing print media
Online communication
Face-to-face communication
Addressing online media
Addressing TV/radio
Events
Corporate publishing/media
Social media
Non-verbal communication
Paid information
Sponsoring
in 2014 todayImportant instrument

91
Online channels and instruments are continuously growing,while the importance of print media relations is declining
www.communicationmonitor.eu / Zerfass et al. 2011 / nmax = 2,146 PR professionals; Q 11; Zerfass et al. 2010 / nmax = 1,914; Q 6;Zerfass et al. 2009 / nmax = 1,863; Q 5; Zerfass et al. 2008 / n = 1,524; Q 3; Zerfass et al. 2007 / n = 1,087; Q 4.
0%
10%
20%
30%
40%
50%
60%
70%
80%
90%
100%
2007 2008 2009 2010 2011 2012 (prediction)
2013 (prediction)
2014 (prediction)
Addressing print media Online communication Addressing online media Social media
92
Predicted importance2008-2011
Realimportance2008-2011
-7.7% +2.9%Press and media relations: Print media
Online communication +33.6% +16.7%
+18.6% +10.2%Face-to-face communication
Social media +42.8% +24.2%
Variation
+10.6%
-16.9%
-8.4%
-18.6%
+8.0% +14.4%Press and media relations: Online media
Press and media relations: TV/radio +6.8% +6.5%
+15.1% +4.8%Events
Corporate publishing/media +43.0% +28.1%
+6.4%
-0.3%
-10.3%
-14.9%
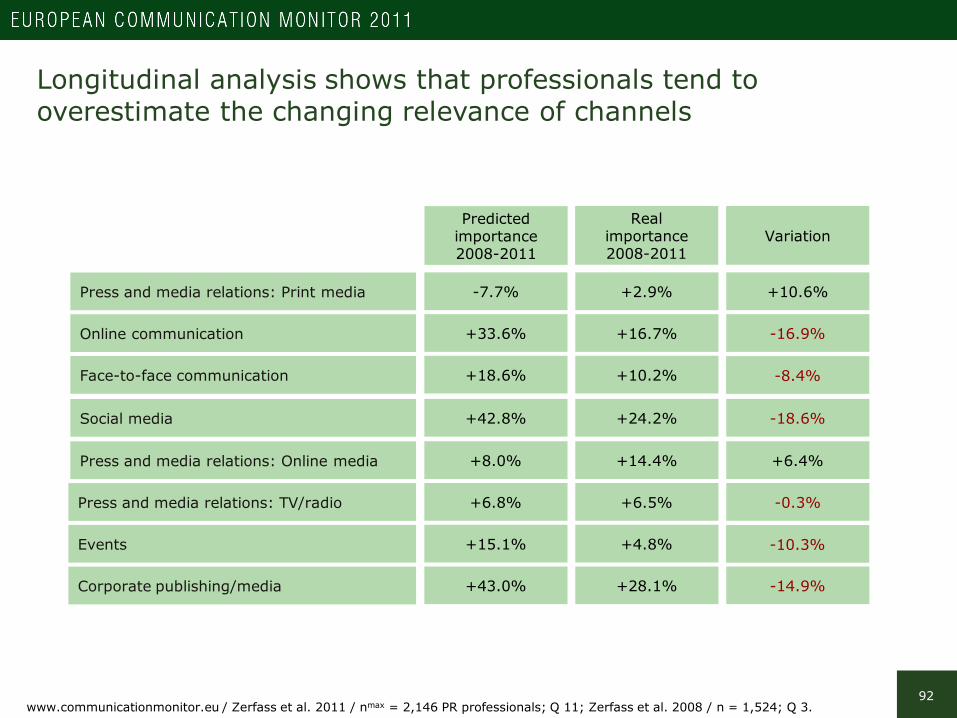
www.communicationmonitor.eu / Zerfass et al. 2011 / nmax = 2,146 PR professionals; Q 11; Zerfass et al. 2008 / n = 1,524; Q 3.
Longitudinal analysis shows that professionals tend to overestimate the changing relevance of channels

93
Valuation of communication instruments in different organisations
34.7% 32.9%
48.6%
17.3%
56.7%
55.7%
35.3%
69.3%
35.6%
34.5%
27.0%
35.7%
55.5%
66.3%
24.6%
65.8%
20.7%
49.0%
41.1%
25.0%
Joint stockcompanies
Social media
Sponsoring
Events
Face-to-face communication
Non-verbal communication
- addressing print media
- addressing TV/radio
- addressing online media
Corporate publishing/media
Online communication
Paid information 21.5%31.6% 29.4% 18.3%
88.7%
68.4%
77.7%
87.2%
66.1%
60.5%
49.9%
65.4%
41.3%
78.0%
50.3%
46.8%
62.3%
69.5%
80.6%
38.9%
77.3%76.1% 73.4% 82.5%
Press and media relations
Privatecompanies
Governmentalorganisations
Non-profitorganisations
294595 381 226n =
Important instruments today:
www.communicationmonitor.eu / Zerfass et al. 2011 / nmax = 1,146 PR professionals; Q 11. Significant differences between the four types of organisations for all items except addressing print media, addressing online media, online communication (chi-square test, p≤0.05).
94
Interpretation
Internal communication and online channels keep growing
In accordance with previous surveys, the respondents predict a changing relevance of the various disciplines within the broad range of strategic communication. Corporate communication (communication focused on the whole institution or organisation) will keepits leading role. Next to this, marketing and consumer communications are thought to be exactly as important as internal and change communication in three years’ time. Moreover, CSR and sustainability communications will continue their upswing.
Two disciplines to watch are international communication and personal coaching. Communication professionals predict a growth in importance above average; a stable trendsince the 2009 edition of this survey.
Several types of online instruments are expected to lead the media mix utilised by communication management in the near future. Online communication (websites, e-mail, intranet) is ranked number one, followed by media relations adressing online journalistsand social media channels. Face-to-face communication keeps its position, while press relations targeting print journalists is thought to be less relevant in 2014.
However, a longitudinal analysis reveals that communication professionals tend to overestimate the growth of disciplines and communication channels. While media relationsoriented towards online publications has gained stronger than expected, predictions givenin 2008 for the importance of social media and online communications in 2011 (Zerfass et al. 2008) were nearly twice the numbers really identified this year.

Social media: Governance, skills and activities
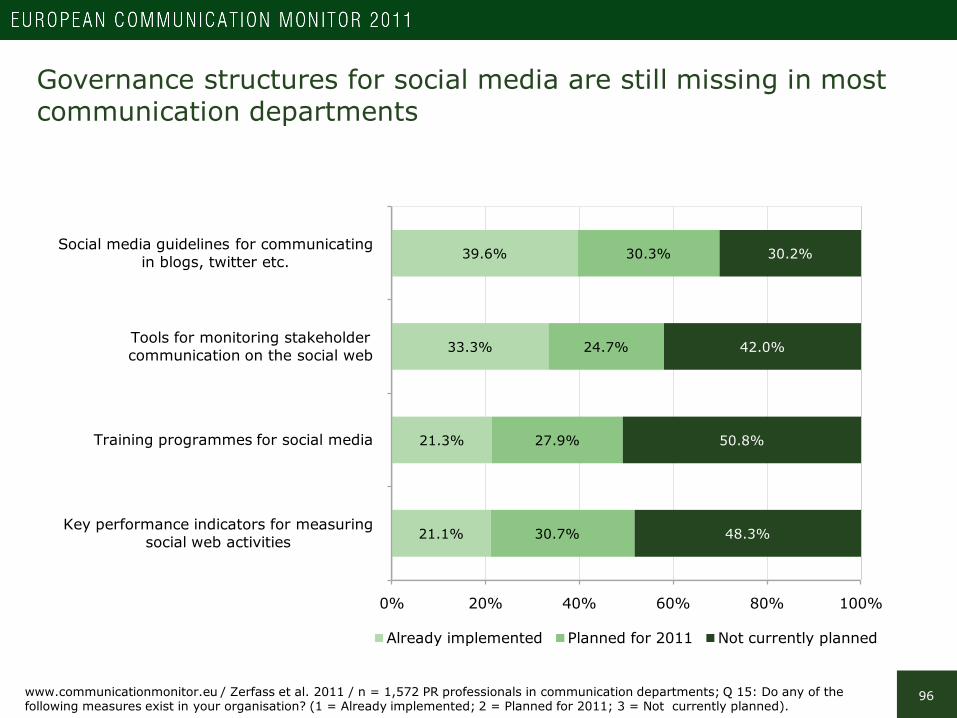
96
Governance structures for social media are still missing in mostcommunication departments
39.6%
33.3%
21.3%
21.1%
30.3%
24.7%
27.9%
30.7%
30.2%
42.0%
50.8%
48.3%
0% 20% 40% 60% 80% 100%
Social media guidelines for communicating in blogs, twitter etc.
Tools for monitoring stakeholder communication on the social web
Training programmes for social media
Key performance indicators for measuring social web activities
Already implemented Planned for 2011 Not currently planned
www.communicationmonitor.eu / Zerfass et al. 2011 / n = 1,572 PR professionals in communication departments; Q 15: Do any of the following measures exist in your organisation? (1 = Already implemented; 2 = Planned for 2011; 3 = Not currently planned).
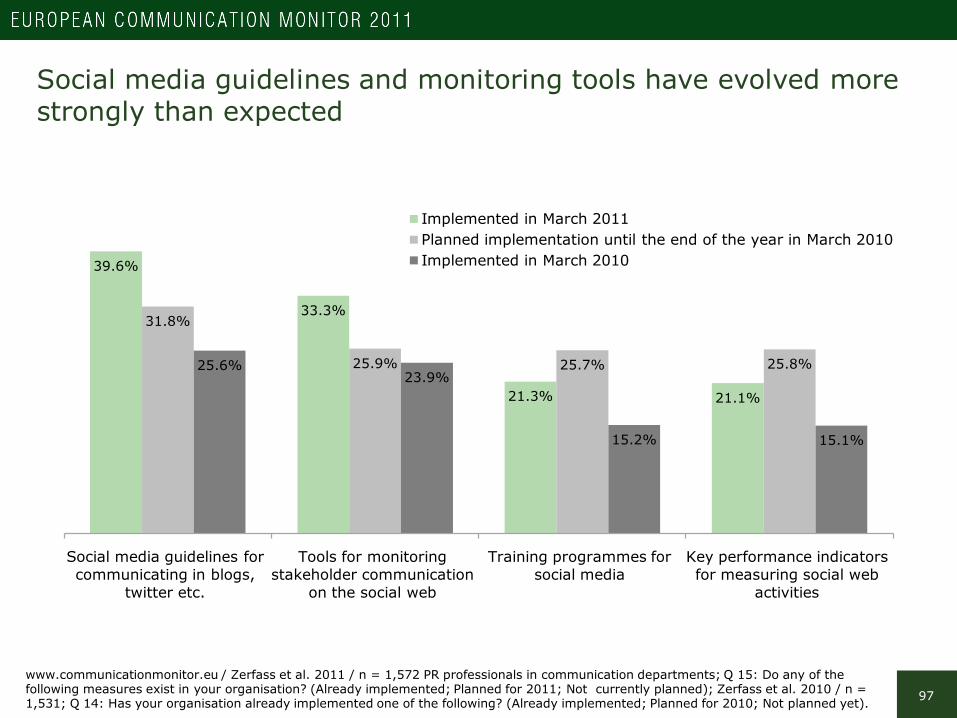
97
Social media guidelines and monitoring tools have evolved morestrongly than expected
39.6%
33.3%
21.3% 21.1%
31.8%
25.9% 25.7% 25.8%25.6%23.9%
15.2% 15.1%
Social media guidelines for communicating in blogs,
twitter etc.
Tools for monitoring stakeholder communication
on the social web
Training programmes for social media
Key performance indicators for measuring social web
activities
Implemented in March 2011Planned implementation until the end of the year in March 2010Implemented in March 2010
www.communicationmonitor.eu / Zerfass et al. 2011 / n = 1,572 PR professionals in communication departments; Q 15: Do any of the following measures exist in your organisation? (Already implemented; Planned for 2011; Not currently planned); Zerfass et al. 2010 / n = 1,531; Q 14: Has your organisation already implemented one of the following? (Already implemented; Planned for 2010; Not planned yet).

98
Sweden and the UK are at the cutting edge when it comes to implementing social media guidelines
Switzerland
Germany
Netherlands
Belgium
France
United Kingdom
Norway
SwedenDenmark
Italy
Serbia
Croatia
Slovenia
Spain
Poland
Social media guidelines for communicating in blogs, twitter etc.
Tools for monitoring stakeholder communication on the social web
Training programmes for social media
Key performance indicators for measuring social web activities
60%
40%
20%
0%
Already implemented:
www.communicationmonitor.eu / Zerfass et al. 2011 / n = 1,572 PR professionals in communication departments; Q 15: Do any of the following measures exist in your organisation? (1 = Already implemented; 2 = Planned for 2011; 3 = Not currently planned) / Q 20.
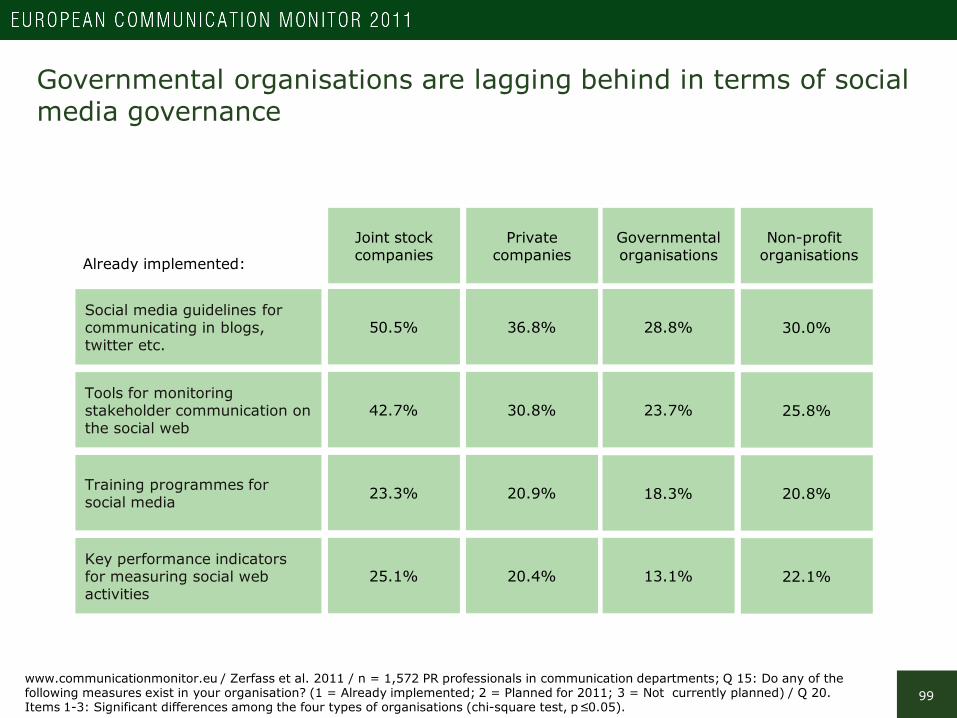
99
Governmental organisations are lagging behind in terms of socialmedia governance
50.5% 36.8%Social media guidelines for communicating in blogs, twitter etc.
Tools for monitoring stakeholder communication on the social web
42.7% 30.8%
23.3% 20.9%Training programmes for social media
Key performance indicators for measuring social web activities
25.1% 20.4%
28.8%
23.7%
18.3%
13.1%
30.0%
25.8%
20.8%
22.1%
Joint stockcompanies
Privatecompanies
Governmentalorganisations
Non-profit organisationsAlready implemented:
www.communicationmonitor.eu / Zerfass et al. 2011 / n = 1,572 PR professionals in communication departments; Q 15: Do any of the following measures exist in your organisation? (1 = Already implemented; 2 = Planned for 2011; 3 = Not currently planned) / Q 20. Items 1-3: Significant differences among the four types of organisations (chi-square test, p≤0.05).
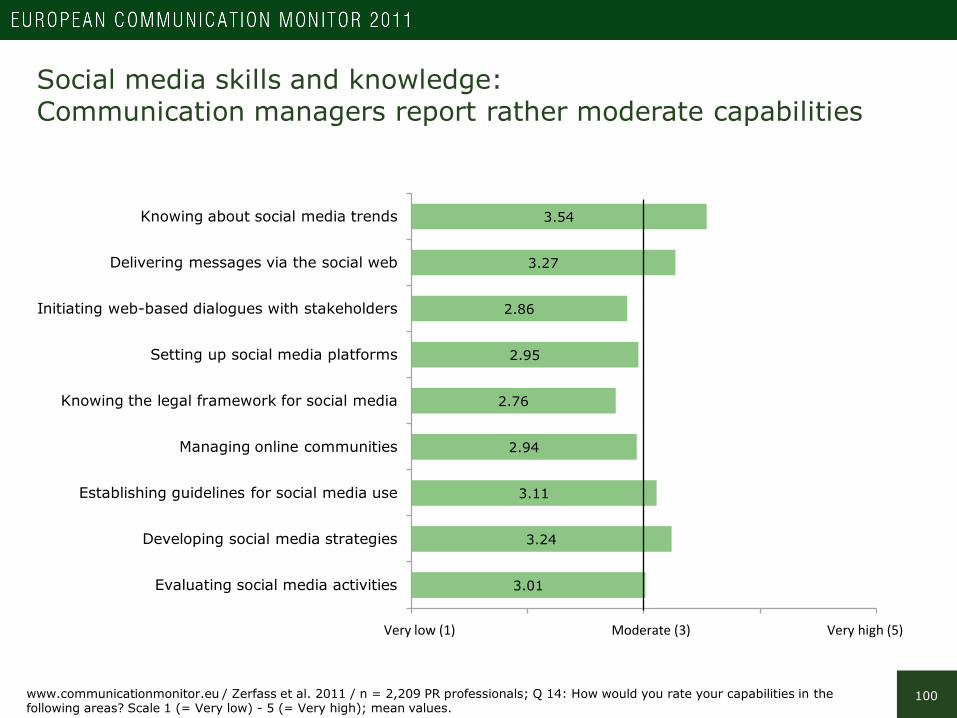
100
Social media skills and knowledge:Communication managers report rather moderate capabilities
www.communicationmonitor.eu / Zerfass et al. 2011 / n = 2,209 PR professionals; Q 14: How would you rate your capabilities in the following areas? Scale 1 (= Very low) - 5 (= Very high); mean values.
3.54
3.27
2.86
2.95
2.76
2.94
3.11
3.24
3.01
Knowing about social media trends
Delivering messages via the social web
Initiating web-based dialogues with stakeholders
Setting up social media platforms
Knowing the legal framework for social media
Managing online communities
Establishing guidelines for social media use
Developing social media strategies
Evaluating social media activities
Very low (1) Moderate (3) Very high (5)
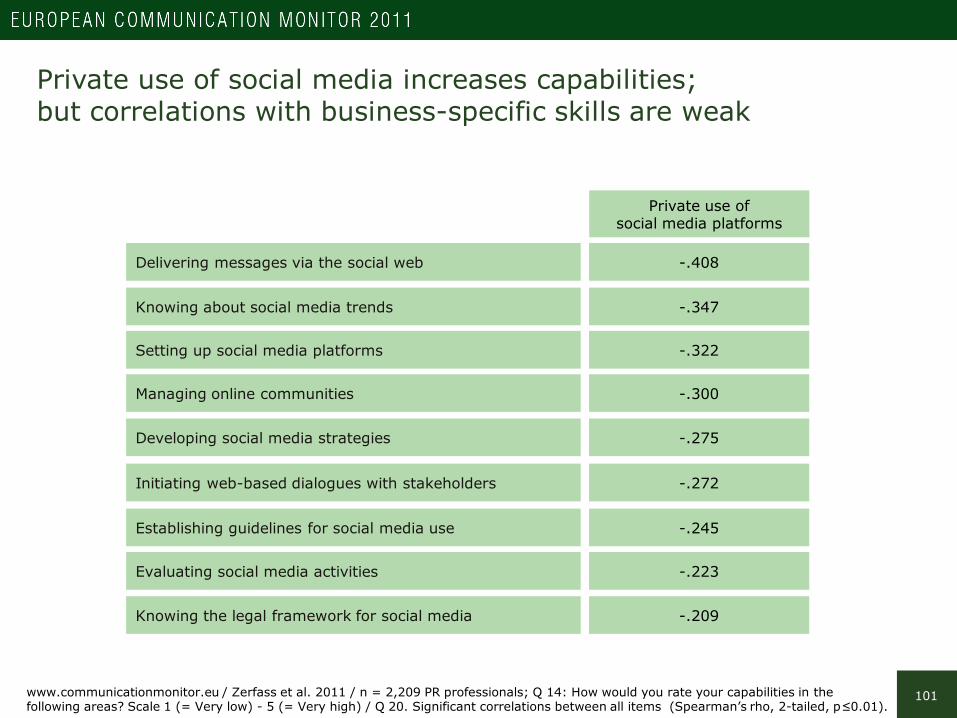
101
Private use of social media increases capabilities;but correlations with business-specific skills are weak
Private use ofsocial media platforms
-.347Knowing about social media trends
Delivering messages via the social web -.408
-.272Initiating web-based dialogues with stakeholders
Setting up social media platforms -.322
-.209Knowing the legal framework for social media
Managing online communities -.300
-.245Establishing guidelines for social media use
Developing social media strategies -.275
Evaluating social media activities -.223
www.communicationmonitor.eu / Zerfass et al. 2011 / n = 2,209 PR professionals; Q 14: How would you rate your capabilities in thefollowing areas? Scale 1 (= Very low) - 5 (= Very high) / Q 20. Significant correlations between all items (Spearman’s rho, 2-tailed, p≤0.01).

102
Online communication and social media activities:Importance has grown steadily during the last five years
11.5%
38.4%
54.4%
12.4%
44.0%
58.1%
19.5%
43.8%
58.6%
26.7%
56.8%
67.8%
40.5%
68.2%
74.8%
Social media (blogs, podcasts,communities)
Press and media relations addressing online media
Online communication (websites, e-mail, intranet)
2011 2010 2009 2008 2007
www.communicationmonitor.eu / Zerfass et al. 2011 / nmax = 2,146 PR professionals; Q 11; Zerfass et al. 2010 / nmax = 1,914; Q 6; Zerfasset al. 2009 / nmax = 1,863; Q 5; Zerfass et al. 2008 / n = 1,524; Q 3; Zerfass et al. 2007/n = 1,087; Q 4: How important are the following methods in addressing stakeholders, gatekeepers and audiences? (1 = Not important; 5 = Very important; important = scale points 4-5).
Important instruments for addressing stakeholders

103
49.8%
39.5%
28.3%
32.5%
27.9%
16.5%
21.5%
15.8%
14.0%
10.0%
44.6%
38.4%
30.9%
26.3%
17.2%
16.8%
9.5%
Online Communities (social networks)
Online videos (moving images)
Weblogs
Microblogs (Twitter)
Photo sharing
Social bookmarks
Slide sharing
Wikis
Podcasts (audio)
Virtual worlds2011 2010
www.communicationmonitor.eu / Zerfass et al. 2011 / n = 2,209 PR professionals; Q 13; Zerfass et al. 2010 / n = 1,955, Q 13: Can you indicate the level of importance for communication management today and in the next year of the following communication tools? Scale 1(= Not important) - 5 (= Very important); considered scale points 4-5. 2010 data not available for newly added items. Significant differences between assessments of channels in the 2010 and 2011 survey with the exeception of items ‘Podcasts’ and ‘Weblogs’ (T-test, p ≤ 0.01).
Social media channels: Online communities are leading the field; podcasts, wikis and weblogs have lost relevance
Important tools forcommunication management
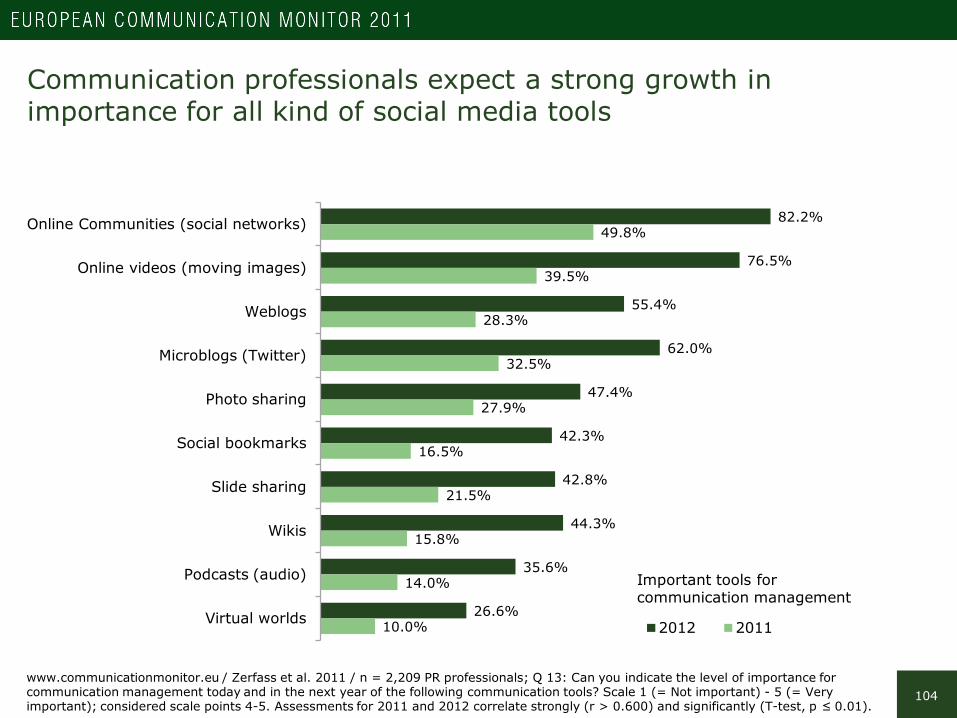
104
Communication professionals expect a strong growth in importance for all kind of social media tools
www.communicationmonitor.eu / Zerfass et al. 2011 / n = 2,209 PR professionals; Q 13: Can you indicate the level of importance for communication management today and in the next year of the following communication tools? Scale 1 (= Not important) - 5 (= Very important); considered scale points 4-5. Assessments for 2011 and 2012 correlate strongly (r > 0.600) and significantly (T-test, p ≤ 0.01).
82.2%
76.5%
55.4%
62.0%
47.4%
42.3%
42.8%
44.3%
35.6%
26.6%
49.8%
39.5%
28.3%
32.5%
27.9%
16.5%
21.5%
15.8%
14.0%
10.0%
Online Communities (social networks)
Online videos (moving images)
Weblogs
Microblogs (Twitter)
Photo sharing
Social bookmarks
Slide sharing
Wikis
Podcasts (audio)
Virtual worlds 2012 2011
Important tools for communication management

105
Private use of social media:18 per cent of communication professionals are not very active
www.communicationmonitor.eu / Zerfass et al. 2011 / n = 2,209 PR professionals; Q 20: How often do you use social media platforms (Facebook, Linked-In, Twitter, etc.) for private reasons in your leisure time?
56.1%
25.6%
13.6%
4.7% Daily
Several times per week
Less than once or once a week
Never
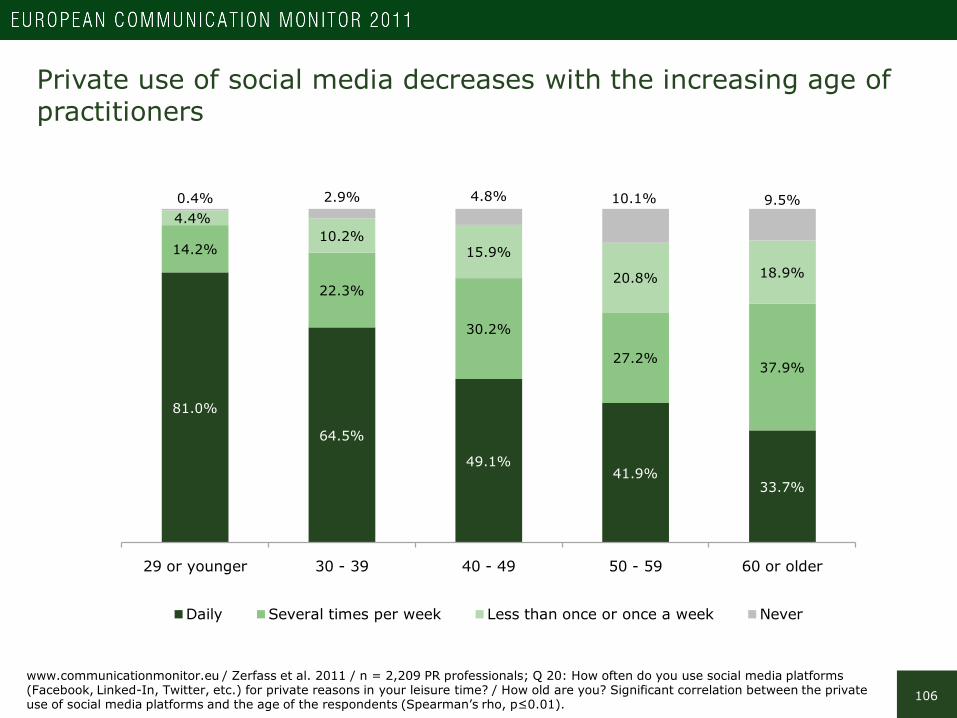
106
Private use of social media decreases with the increasing age of practitioners
www.communicationmonitor.eu / Zerfass et al. 2011 / n = 2,209 PR professionals; Q 20: How often do you use social media platforms (Facebook, Linked-In, Twitter, etc.) for private reasons in your leisure time? / How old are you? Significant correlation between the private use of social media platforms and the age of the respondents (Spearman’s rho, p≤0.01).
81.0%
64.5%
49.1%41.9%
33.7%
14.2%
22.3%
30.2%
27.2%37.9%
4.4%10.2%
15.9%
20.8% 18.9%
0.4% 2.9% 4.8% 10.1% 9.5%
29 or younger 30 - 39 40 - 49 50 - 59 60 or older
Daily Several times per week Less than once or once a week Never

107
Private use of social media is most common for practitioners working in non-profit organisations
www.communicationmonitor.eu / Zerfass et al. 2011 / n = 2,209 PR professionals; Q 20: How often do you use social media platforms (Facebook, Linked-In, Twitter, etc.) for private reasons in your leisure time? / Where do you work? Significant differences between all types of organisations (chi-square test, p≤0.05).
51.3% 52.4% 53.2%59.6%
29.0% 25.9% 24.7%21.7%
15.2% 18.0% 14.7% 12.5%
4.5% 3.7% 7.4% 6.3%
Joint stock companies Private companies Governmental organisations
Non-profit organisations
Never Less than once or once a week Several times per week Daily

108
Private use of social media differs significantly between European regions
Northern Europe
59.1% 57.9%
25.2%
Western Europe
Southern Europe
Eastern Europe
24.1%
49.9%
27.6% 25.1%
58.8%
11.2%13.5% 17.1% 12.1%
Daily
Several times per week
Less than once or once a week
5.7%2.8% 5.4% 4.8%Never
www.communicationmonitor.eu / Zerfass et al. 2011 / n = 2,209 PR professionals; Q 20: How often do you use social media platforms (Facebook, Linked-In, Twitter, etc.) for private reasons in your leisure time? / In which European state are you normally based?Significant differences between all groups (chi-square test, p≤0.05).
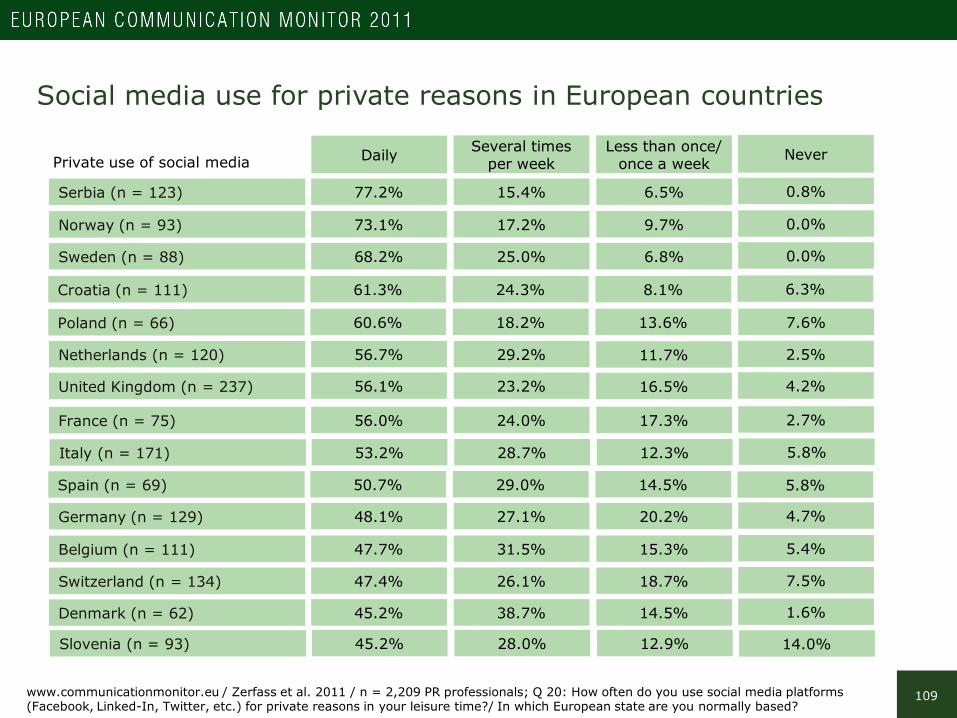
109
Social media use for private reasons in European countries
Daily Several times per week
47.4% 26.1%Switzerland (n = 134)
Germany (n = 129) 48.1% 27.1%
56.7% 29.2%Netherlands (n = 120)
France (n = 75) 56.0% 24.0%
Less than once/once a week
18.7%
20.2%
11.7%
17.3%
53.2% 28.7%Italy (n = 171)
Belgium (n = 111) 47.7% 31.5%
56.1% 23.2%United Kingdom (n = 237)
Norway (n = 93) 73.1% 17.2%
12.3%
15.3%
16.5%
9.7%
Sweden (n = 88) 68.2% 25.0% 6.8%
Denmark (n = 62) 45.2% 38.7% 14.5%
Serbia (n = 123) 77.2% 15.4% 6.5%
Private use of social media
Croatia (n = 111) 61.3% 24.3% 8.1%
Slovenia (n = 93) 45.2% 28.0% 12.9%
Spain (n = 69) 50.7% 29.0% 14.5%
Poland (n = 66) 60.6% 18.2% 13.6%
Never
7.5%
4.7%
2.5%
2.7%
5.8%
5.4%
4.2%
0.0%
0.0%
1.6%
0.8%
6.3%
14.0%
5.8%
7.6%
www.communicationmonitor.eu / Zerfass et al. 2011 / n = 2,209 PR professionals; Q 20: How often do you use social media platforms (Facebook, Linked-In, Twitter, etc.) for private reasons in your leisure time?/ In which European state are you normally based?

110
Interpretation
Skills and governance structures for social media are lagging behind its importance
The survey proves the tremendous growth in perceived importance of online channels in communication management. The number of professionals judging social media as an important instrument for addressing stakeholders has risen from 11.5 per cent in 2007 and 19.5 per cent in 2009 to 40.5 per cent in 2011. However, this is still a minority. Sixout of ten practitioners in Europe do not believe in social media, whereas controlled online activities (websites, e-mail) and online media relations are relevant for a clear majority.
Online communities (social networks) continue to be the most important social mediaplatform. Twitter is still growing. Podcasts, wikis and weblogs have lost relevance duringthe last twelve months.
Four out of ten communication departments report about the existence of social mediaguidelines. Every third organisation has established tools for monitoring the social web. This is a clear advancement since last year. However, key performance indicators to defineand evaluate measures of success and training programmes are less prevalent. Governancestructures for social media are still underdeveloped.
European communication professionals have only moderate social media skills. One reasonto consider is the private use of social media. Almost every fifth practitioner usesparticipative platforms only once a week or not at all. The survey reveals that a strongerprivate use leads to an increase of social media capabilities. As correlations are weaker withbusiness-specific skills, specialised training in those areas is indispensable.

Future qualification needs and training

112www.communicationmonitor.eu / Zerfass et al. 2011 / n = 2,209 PR professionals; Q 17: In your opinion, how important will the following knowledge areas and skills be viewed in five years time? Scale 1 (= Not important) – 5 (= Very important), considered scale points 4-5.
83.1%
81.8%
80.3%
78.6%
74.7%
71.7%
70.5%
70.3%
69.7%
68.9%
68.9%
66.7%
65.6%
59.8%
59.6%
55.2%
53.4%
53.3%
Effects of traditional and new media
Relationship building
Communication technologies
Public speaking and presentation
Coaching skills (enabling others to communicate)
Marketing and consumer insight
Organisational change and development
Ethical issues
Message production
Societal and political trends
Research, evaluation methods and forecasting
Initiating and moderating dialogues
Persuasion concepts and strategies
Global project management
Cross-cultural and cross-gender sensitivity
Legal requirements and issues
Finances, budgeting and accounting
Power and coalition building in organisations
Perceived importance of knowledge areas and skills for communication managers in five years time

113
Training programmes offered by organisations today
www.communicationmonitor.eu / Zerfass et al. 2011 / n = 2,209 PR professionals; Q 17: Does your organisation already offer training programmes in these fields?
41.2%
37.4%
21.2%
20.7%
19.2%
18.4%
17.2%
16.9%
16.2%
16.2%
15.8%
14.8%
14.8%
13.6%
13.6%
13.0%
12.7%
7.9%
Public speaking and presentationCoaching skills (enabling others to communicate)
Effects of traditional and new mediaCommunication technologies
Finances, budgeting and accountingGlobal project management
Relationship buildingEthical issues
Legal requirements and issuesMarketing and consumer insight
Cross-cultural and cross-gender sensitivityOrganisational change and development
Message productionResearch, evaluation methods and forecasting
Persuasion concepts and strategiesSocietal and political trends
Initiating and moderating dialoguesPower and coalition building in organisations

114
Large gap between qualification needs and training offered today
www.communicationmonitor.eu / Zerfass et al. 2011 / n = 2,209 PR professionals; Q 17: In your opinion, how important will the following knowledge areas and skills be viewed in five years time? / Does your organisation already offer training programmes in these fields? Scale 1 (= Not important) – 5 (= Very important), considered scale points 4-5.
83.1%
81.8%
80.3%
78.6%
74.7%
71.7%
70.5%
70.3%
21.2%
17.2%
20.7%
41.2%
37.4%
16.2%
14.8%
16.9%
Effects of traditional and new media
Relationship building
Communication technologies
Public speaking and presentation
Coaching skills (enabling others to communicate)
Marketing and consumer insight
Organisational change and development
Ethical issues
Percentage of respondents thinking that a certain knowledge area will be important in five years timePercentage of respondents whose organisation already offers training in a certain knowledge area

115
Qualification needs perceived in different types of organisations (1)
78.8% 84.7%
64.7%
79.4%
65.9%
80.1%
80.4%
78.1%
64.9%
84.4%
59.2%
87.8%Effects of traditional and new media
Relationship building
Persuasion concepts and strategies
Legal requirements and issues
Global project management
Coaching skills (enabling others to communicate)
Power and coalition building
Cross-cultural/cross-gender sensitivity
55.5%
76.0%
46.8%
62.9%
78.9%
64.4%
56.0%
73.2%
50.8%
54.7%
65.3%
47.5%
56.1%
70.9%
46.6%
60.9%
55.2%64.8% 62.4% 58.5%
Societal and political trends 69.2% 60.7% 73.6% 75.2%
290576 365 220n =
Knowledge areas important in five years:
www.communicationmonitor.eu / Zerfass et al. 2011 / n = 2,209 PR professionals; Q 17: In your opinion, how important will the following knowledge areas and skills be viewed in five years time? Scale 1 (= Not important) – 5 (= Very important), considered scale points 4-5 / Q 20. Significant differences between the types of organisations for items 1, 2, 4, 5 and 6 (chi-square test, p≤0.05).
Joint stockcompanies
Privatecompanies
Governmentalorganisations
Non-profitorganisations

116
Qualification needs perceived in different types of organisations (2)
68.8%75.9%
81.0% 79.6%
66.8%
82.9%
68.4%
81.3%
Ethical issues
Communication technologies
Finances, budgeting and accounting 47.3%55.9% 55.4% 48.2%
Joint stockcompanies
Privatecompanies
Governmentalorganisations
Non-profitorganisations
58.7%78.0%
70.1% 63.7%
78.0%
62.4%
65.8%
62.6%
Marketing and consumer insight
Initiating and moderating dialogues
Research, evaluation methods, forecasting 70.7%70.2% 66.8% 61.8%
69.9%75.7%
74.1% 66.8%
69.8%
66.3%
63.3%
70.8%
Organisational change and development
Message production
Public speaking and presentation 80.1%81.1% 75.6% 79.7%
290576 365 220n =
www.communicationmonitor.eu / Zerfass et al. 2011 / n = = 2,209 PR professionals; Q 17: In your opinion, how important will the following knowledge areas and skills be viewed in five years time? Scale 1 (= Not important) – 5 (= Very important). Considered scale points 4-5 / Q 20. No significant differences between the types of organisations (chi-square test, p≤0.05).
Knowledge areas important in five years:
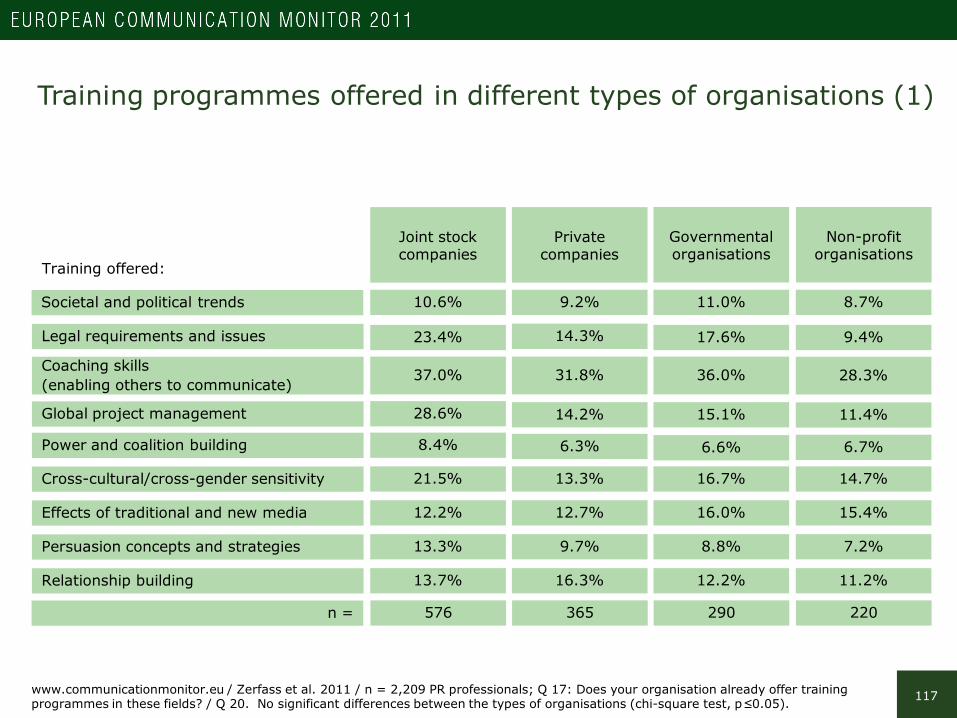
117
Training programmes offered in different types of organisations (1)
12.2% 16.0%
8.8%
12.2%
13.3%
13.7%
12.7%
16.3%
9.7%
11.2%
7.2%
15.4%Effects of traditional and new media
Relationship building
Persuasion concepts and strategies
Legal requirements and issues
Global project management
Coaching skills (enabling others to communicate)
Power and coalition building
Cross-cultural/cross-gender sensitivity
17.6%
36.0%
15.1%
23.4%
37.0%
28.6%
8.4%
31.8%
6.3%
14.3%
14.2%
6.6%
11.4%
28.3%
9.4%
6.7%
16.7%21.5% 13.3% 14.7%
Societal and political trends 10.6% 9.2% 11.0% 8.7%
290576 365 220n =
Training offered:
www.communicationmonitor.eu / Zerfass et al. 2011 / n = 2,209 PR professionals; Q 17: Does your organisation already offer training programmes in these fields? / Q 20. No significant differences between the types of organisations (chi-square test, p≤0.05).
Joint stockcompanies
Privatecompanies
Governmentalorganisations
Non-profitorganisations

118
Training programmes offered in different types of organisations (2)
14.4%25.6%
16.2% 17.7%
11.3%
17.8%
7.6%
16.5%
Ethical issues
Communication technologies
Finances, budgeting and accounting 16.7%28.0% 14.5% 13.6%
Joint stockcompanies
Privatecompanies
Governmentalorganisations
Non-profitorganisations
Training offered:
8.7%20.8%
11.6% 10.7%
15.1%
9.2%
8.3%
9.5%
Marketing and consumer insight
Initiating and moderating dialogues
Research, evaluation methods, forecasting 11.3%13.3% 8.1% 7.0%
11.7%18.8%
10.8% 10.2%
10.8%
7.9%
7.9%
8.8%
Organisational change and development
Message production
Public speaking and presentation 37.1%40.3% 33.8% 32.4%
290576 365 220n =
www.communicationmonitor.eu / Zerfass et al. 2011 / n = 2,209 PR professionals; Q 17: Does your organisation already offer training programmes in these fields? / Q 20. No significant differences between the types of organisations (chi-square test, p≤0.05).

119
Qualification needs perceived in various European regions (1)
84.9% 81.8%
71.3%
82.7%
63.0%
84.7%
81.2%
78.6%
62.6%
80.9%
63.8%
68.1%Effects of traditional and new media
Relationship building
Persuasion concepts and strategies
Legal requirements and issues
Global project management
Coaching skills (enabling others to communicate)
Power and coalition building
Cross-cultural/cross-gender sensitivity
56.5%
74.8%
64.5%
55.5%
76.0%
49.1%
47.7%
74.0%
55.0%
53.1%
65.9%
56.4%
56.8%
72.9%
56.7%
54.1%
60.4%59.0% 61.0% 54.1%
Societal and political trends 71.7% 68.4% 69.8% 59.6%
648571 610 216n =
Important knowledge fields in five years:
NorthernEurope
WesternEurope
SouthernEurope
EasternEurope
www.communicationmonitor.eu / Zerfass et al. 2011 / n = 2,209 PR professionals; Q 17: Does your organisation already offer training programmes in these fields? / Q 20. Significant differences between the four regions for items 4, 5 and 6 (chi-square test, p≤0.05).

120
Qualification needs perceived in various European regions (2)
75.4%70.4%
79.1% 85.6%
73.5%
82.5%
Ethical issues
Communication technologies
Finances, budgeting and accounting 58.2%49.9% 54.4%
73.6%73.3%
62.8% 68.0%
75.0%
69.6%
Marketing and consumer insight
Initiating and moderating dialogues
Research, evaluation methods, forecasting 75.3%69.3% 74.7%
72.9%70.6%
73.7% 72.2%
66.2%
64.4%
Organisational change and development
Message production
Public speaking and presentation 81.8%79.3% 78.1%
648571 216n =
NorthernEurope
WesternEurope
SouthernEurope
EasternEurope
www.communicationmonitor.eu / Zerfass et al. 2011 / n = 2,209 PR professionals; Q 17: Does your organisation already offer training programmes in these fields? / Q 20. No significant differences between the groups (chi-square test, p≤0.05).
Important knowledge fields in five years:
75.0%
63.5%
51.3%
68.2%
66.9%
59.6%
65.1%
69.3%
74.7%
610
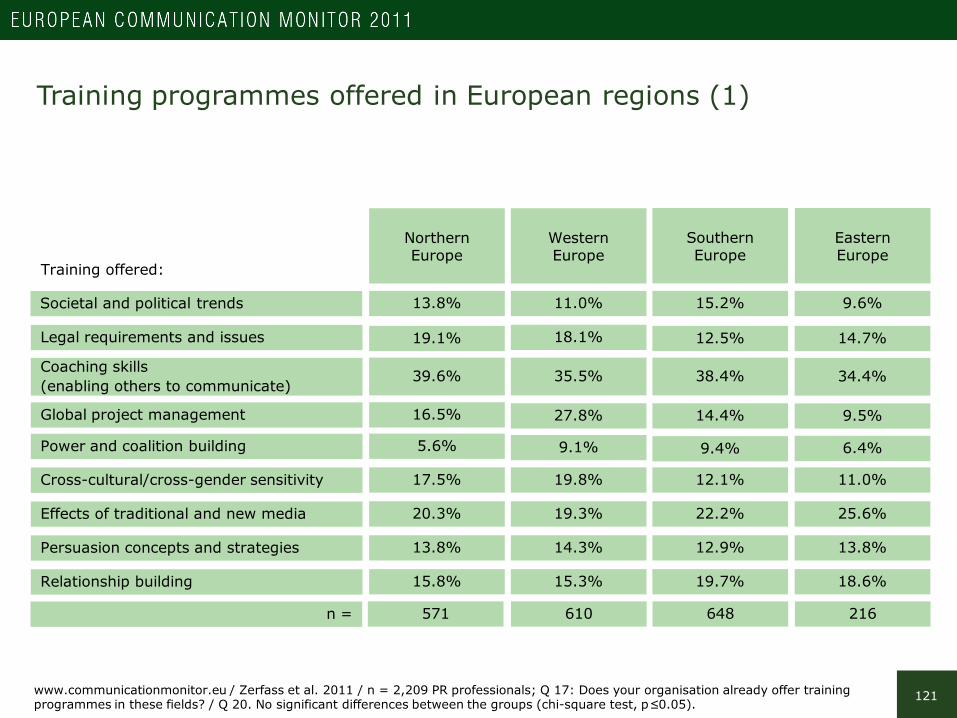
121
Training programmes offered in European regions (1)
20.3% 22.2%
12.9%
19.7%
13.8%
15.8%
19.3%
15.3%
14.3%
18.6%
13.8%
25.6%Effects of traditional and new media
Relationship building
Persuasion concepts and strategies
Legal requirements and issues
Global project management
Coaching skills (enabling others to communicate)
Power and coalition building
Cross-cultural/cross-gender sensitivity
12.5%
38.4%
14.4%
19.1%
39.6%
16.5%
5.6%
35.5%
9.1%
18.1%
27.8%
9.4%
9.5%
34.4%
14.7%
6.4%
12.1%17.5% 19.8% 11.0%
Societal and political trends 13.8% 11.0% 15.2% 9.6%
648571 610 216n =
Training offered:
NorthernEurope
WesternEurope
SouthernEurope
EasternEurope
www.communicationmonitor.eu / Zerfass et al. 2011 / n = 2,209 PR professionals; Q 17: Does your organisation already offer training programmes in these fields? / Q 20. No significant differences between the groups (chi-square test, p≤0.05).

122
Training programmes offered in European regions (2)
16.9%16.5%
17.2% 19.6%
18.4%
24.7%
14.2%
21.7%
Ethical issues
Communication technologies
Finances, budgeting and accounting 18.0%18.7% 22.0% 16.6%
Training offered:
19.9%13.2%
10.3% 16.7%
14.1%
11.9%
18.5%
10.6%
Marketing and consumer insight
Initiating and moderating dialogues
Research, evaluation methods, forecasting 13.9%13.3% 13.3% 14.7%
15.1%12.5%
15.9% 14.0%
18.4%
15.0%
9.6%
13.7%
Organisational change and development
Message production
Public speaking and presentation 43.2%39.2% 41.2% 40.5%
648571 610 216n =
NorthernEurope
WesternEurope
SouthernEurope
EasternEurope
www.communicationmonitor.eu / Zerfass et al. 2011 / n = 2,209 PR professionals; Q 17: Does your organisation already offer training programmes in these fields? / Q 20. No significant differences between the groups (chi-square test, p≤0.05).

123
Interpretation
Need for a variety of new qualifications needed and focused training programmes
In five years time, the most relevant knowledge areas for communication managers will be the effects of traditional and new media, relationship building and communication technologies, followed by hands-on skills like public speaking/presenting and coaching. More than three out of four respondents value these fields as important or very important.
Qualification needs differ significantly between various types of organisations and regions. For example, cross-cultural and gender sensitivity is especially important in joint-stock companies, while global project management is notably relevant in Western and Southern Europe.
Quite surprisingly, competencies relevant in organisational settings like power and coalition building, finances, budgeting and accounting as well as legal requirements are only mentioned by every second practitioner.
A comparison between the qualification needs identified and the training programmes offered by organisations today reveals large gaps in every field. Approximately 40 per cent of all organisations run public speaking, presentation and coaching programmes, but no other issue is dealt with by more than one out of five organisations. This leaves a broad range of possibilities for improvement.

Salaries

125
Basic annual salary of communication practitioners in Europe
www.communicationmonitor.eu / Zerfass et al. 2011 / n = 1,814 PR professionals; Q 20: In which of the following bands does your basic annual salary fall?
20.5%
9.0%
9.6%
9.4%
7.9%
6.9%
5.0%
6.3%
8.2%
6.2%
5.9%
2.8%
2.1%
Up to €30,000
€30,001 - €40,000
€40,001 - €50,000
€50,001 - €60,000
€60,001 - €70,000
€70,001 - €80,000
€80,001 - €90,000
€90,001 - €100,000
€100,001 - €125,000
€125,001 - €150,000
€150,001 - €200,000
€200,001 - €300,000
More than €300,000
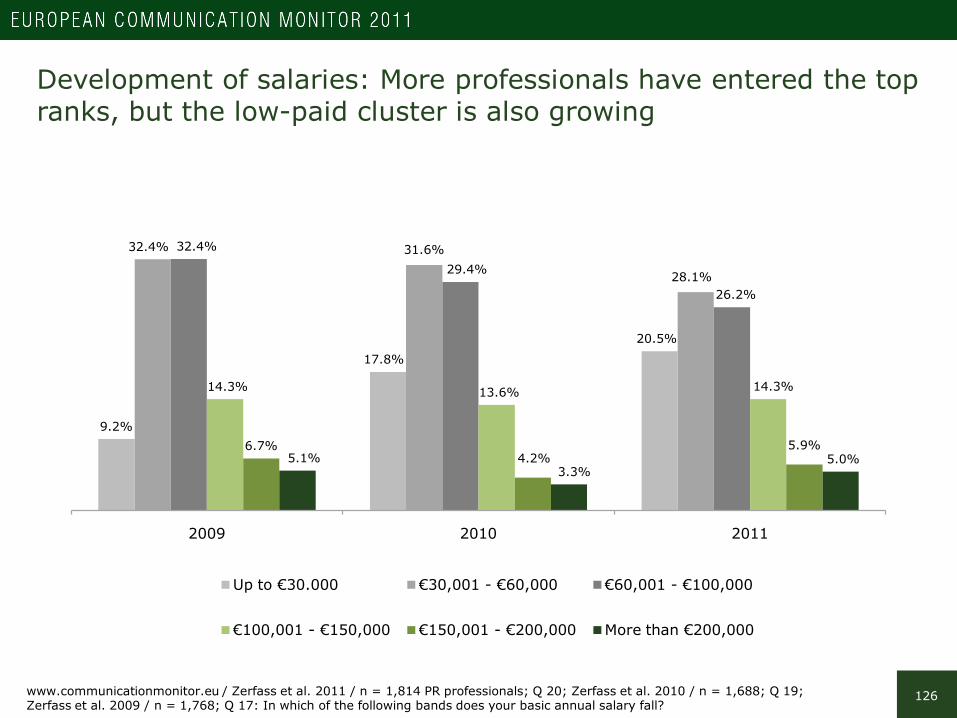
126
Development of salaries: More professionals have entered the top ranks, but the low-paid cluster is also growing
www.communicationmonitor.eu / Zerfass et al. 2011 / n = 1,814 PR professionals; Q 20; Zerfass et al. 2010 / n = 1,688; Q 19;Zerfass et al. 2009 / n = 1,768; Q 17: In which of the following bands does your basic annual salary fall?
9.2%
17.8%
20.5%
32.4% 31.6%
28.1%
32.4%
29.4%
26.2%
14.3% 13.6% 14.3%
6.7%4.2%
5.9%5.1%
3.3%5.0%
2009 2010 2011
Up to €30.000 €30,001 - €60,000 €60,001 - €100,000
€100,001 - €150,000 €150,001 - €200,000 More than €200,000

127
Every second EACD member will earn more than 100,000 Euros in 2011
www.communicationmonitor.eu / Zerfass et al. 2011 / n = 1,814 PR professionals; Q 20: In which of the following bands does your basic annual salary fall? / Are you a member of a professional organisation?
5.9%4.9% 4.6%
7.4%5.9% 6.5% 6.8%
9.6%
13.3%11.4%
13.6%
6.8%
3.4%
23.7%
9.9%10.7%
9.9%8.3% 7.0%
4.6%5.6%
7.0%
5.0%4.2%
1.9% 1.9%
EACD members Other professionals

128
Annual salary of top-level communicators in different regions(Head of Communication, Agency CEO)
www.communicationmonitor.eu / Zerfass et al. 2011 / n = 1,814 PR professionals; Q 20: In which of the following bands does your basic annual salary fall? / What is your position? / In which European state are you normally based?
0%
10%
20%
30%
40%
Western Europe Northern Europe Southern Europe Eastern Europe

129
Most professionals in Eastern and Southern Europe earn less than40,000 Euros annually
www.communicationmonitor.eu / Zerfass et al. 2011 / n = 1,814 PR professionals; Q 20: In which of the following bands does your basic annual salary fall? / In which European state are you normally based?
0%
10%
20%
30%
40%
50%
Western Europe Northern Europe Southern Europe Eastern Europe
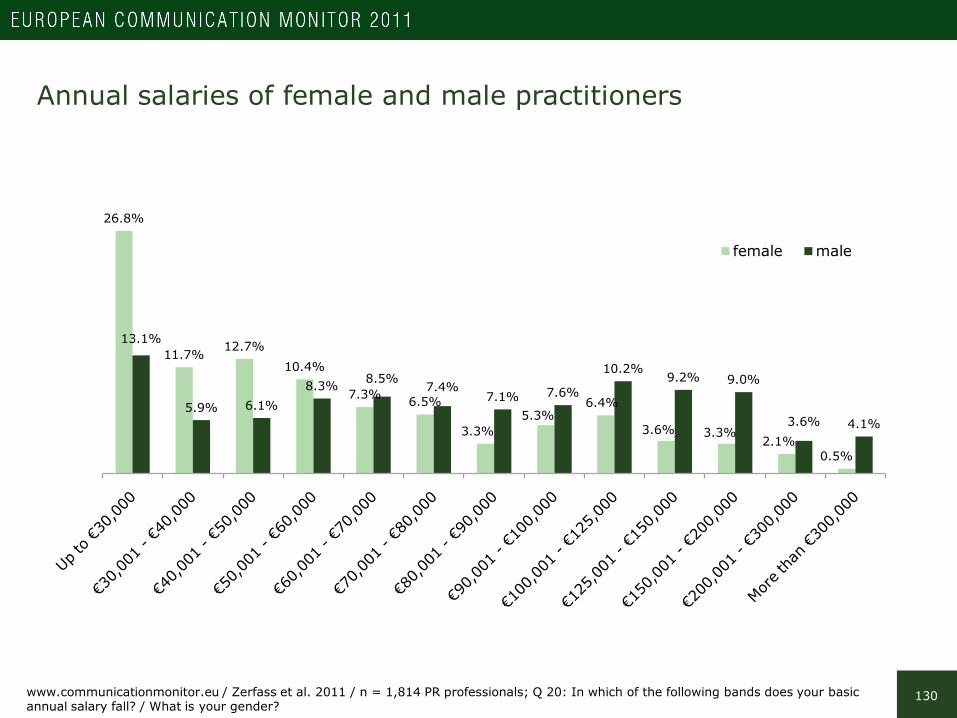
130
Annual salaries of female and male practitioners
www.communicationmonitor.eu / Zerfass et al. 2011 / n = 1,814 PR professionals; Q 20: In which of the following bands does your basic annual salary fall? / What is your gender?
26.8%
11.7%12.7%
10.4%
7.3% 6.5%
3.3%5.3%
6.4%
3.6% 3.3%2.1%
0.5%
13.1%
5.9% 6.1%8.3% 8.5%
7.4%7.1% 7.6%
10.2%9.2% 9.0%
3.6% 4.1%
female male
131
Interpretation
The number of high-earning communication managers has grown in Europe
The survey shows that the decline in salaries identified in 2010 has been stopped. A quarter of the professionals (25.2 per cent) has entered the top bands of 100.000 Euros or more basic income per year. Figures are almost the same as before the crisis in 2009.
While 5.0 per cent of the respondents will earn more than 200,000 Euros in 2011,a rather large group of 20.5 per cent reports a low annual income of up to 30.000 Euro.
The growth of the low-paid cluster may be explained by the fact that the regional background of participants is better balanced than in previous surveys. Compared to the 2010 study, this report is based on a higher number of questionnaires from SouthernEuropean countries and a lower number from Western Europe. Statistical analyses showthat practitioners in Eastern and Southern Europe tend to earn less.
Salaries of communication professionals differ widely throughout Europe. Also, the average salary (median) of women is lower than the income of their male counterpartson every hierarchical level. Members of the EACD (European Association of Communication Directors) are better paid – 10.2 per cent earn more than 150,000 Euro annually.

Annex
133
Authors & Research Team
Prof. Dr. Ansgar Zerfass
Professor of Communication Management, University of Leipzig, [email protected]
Ass. Prof. Dr. Piet Verhoeven
Associate Professor of Communication Science, University of Amsterdam, [email protected]
Prof. Dr. Ralph Tench
Professor of Communication, Leeds Metropolitan University, United [email protected]
Prof. Dr. Angeles Moreno
Professor of Public Relations and Communication Management,University Rey Juan Carlos, Madrid, [email protected]
Prof. Dr. Dejan Verčič
Professor of Public Relations and Communication Management,University of Ljubljana, [email protected]

134
Advisory board
Prof. Dr. Emanuele InvernizziIULM University, Milano, [email protected]
Prof. Dr. Valerie CarayolUniversity of Bordeaux 3, [email protected]
Prof. Dr. Francesco LuratiUniversity of Lugano, [email protected]
Prof. Finn Frandsen, M.A.Aarhus University, [email protected]
Prof. Dr. Øyvind IhlenUniversity of Oslo, [email protected]
Prof. Dr. Ryszard LawniczakPoznan University of Economics, [email protected]
135
References
Arthur W. Page Society & Business Roundtable Institute for Corporate Ethics (2009). The Dynamics of Public Trust in Business − EmergingOpportunities for Leaders. A Call to Action to Overcome the Present Crisis of Trust in Business (available at http://www.awpagesociety.com/images/uploads/public_trust_in_business.pdf). New York, Charlottesville: A. W. Page Society, Business Roundtable.
Ernest, R.C. (1985). Corporate cultures and effective planning. Personnel Administrator, Vol. 30 (3), 49-60.
Giddens, A. (1990). The Consequences of Modernity. Stanford (CA): Stanford University Press.
Gregory, A., & Watson, T. (2008). Defining the gap between research and practice in public relations programme evaluation – towards a new research agenda. Journal of Marketing Communications, 14 (5), 337-350.
Harris, J.D. & Wicks, A.C. (2010). Public Trust and Trust in Particular Firm Stakeholder Interactions. Corporate Reputation Review, Vol. 13,142-154.
Hickson, D.J.; Hinings, C.R., Lee, C.A., Schneck, R.E., & Pennings, J.M. (1971): A Strategic Contingencies' Theory of Intraorganizational Power. Administrative Science Quarterly, Vol. 16 (2), 216-229.
Likely, F., Rockland, D., & Weiner, M. (2006). Perspectives on ROI of media relations publicity efforts. Gainesville (FL): Institute for Public Relations. Available at www.instituteforpr.org.
Luhmann, N. (1979). Trust and Power, Chichester, New York: John Wiley and Sons.
Lurati, F., Aldyukhova, T., Dixius, U., & Reinhold, J. (2010). Swiss Corporate Communications and Public Relations Practice Monitor. Zurich, Lugano: Swiss Corporate Communications and Public Relations Observatory.
Nielsen, B. (2006). The Singular Character of Public Relations in a Global Economy. The Institute for Public Relations, International Distinguished Lecture. London: The Reform Club.
Giddens, A. (1990). The Consequences of Modernity. Stanford (CA): Stanford University Press.
Pfeffer, J. (1992): Understanding Power in Organizations. California Management Review, Vol. 34 (2), 29-50.
Salancik, G.R., & Pfeffer, J. (1974). The Bases and Use of Power in Organizational Decision Making: The Case of a University. Administrative Science Quarterly, Vol. 19 (4), 453-473.
Swerling, J. (2009). Questionnaire for Sixth Annual Public Relations Generally Accepted Practices (G.A.P.) Study, GAP VI. Los Angeles: University of Southern California. Unpublished document.
United Nations Statistics Division (2011). Composition of macro geographical (continental) regions, geographical sub regions, and selected economic and other groupings (revised 17 February 2011). New York: United Nations. Available at: http://unstats.un.org/unsd/methods/m49/m49regin.htm#europe.

136
References (continued)
Werder, K.P., & Holtzhausen, D. (2009). An Analysis of the Influence of Public Relations Department Leadership Style on Public Relations Strategy Use and Effectiveness. Journal of Public Relations Research, Vol. 21 (4), 404-427.
Werder, K.P., & Holtzhausen, D. (2011): Organizational Structures and Their Relationship with Communication Management Practices: A Public Relations Perspective from the United States. International Journal of Strategic Communication, Vol. 5 (2), 118-142.
Zerfass, A., Moreno, A., Tench, R., Vercic, D., & Verhoeven, P. (2008). European Communication Monitor 2008. Trends in Communication Management and Public Relations – Results and Implications. Brussels, Leipzig: EUPRERA, University of Leipzig. (available at: www.communicationmonitor.eu)
Zerfass, A., Moreno, A., Tench, R., Vercic, D., & Verhoeven, P. (2009). European Communication Monitor 2009. Trends in Communication Management and Public Relations – Results of a Survey in 34 Countries. Brussels: EACD, EUPRERA. (available at: www.communicationmonitor.eu)
Zerfass, A., Tench, R., Verhoeven, P., Verčič, D., & Moreno, A. (2010): European Communication Monitor 2010. Status Quo and Challenges for Public Relations in Europe. Results of an Empirical Survey in 46 Countries. Brussels: EACD, EUPRERA (available at: www.communicationmonitor.eu)
Zerfass, A., Van Ruler, B., Rogojinaru, A., Vercic, D., & Hamrefors, S. (2007). European Communication Monitor 2007. Trends in Communication Management and Public Relations – Results and Implications. Leipzig, Brussels: University of Leipzig, EUPRERA. (available at: www.communicationmonitor.eu)

137
Imprint
Publication
Zerfass, A., Verhoeven, P., Tench, R., Moreno, A., & Verčič, D. (2011): European Communication Monitor 2011.Empirical Insights into Strategic Communication in Europe. Results of an Empirical Survey in 43 Countries (Chart Version). Brussels: EACD, EUPRERA (available at: www.communicationmonitor.eu)
This set of charts is available as a free PDF document at www.communicationmonitor.euThe full report (text and charts) is available as a book published by Helios Media, ISBN 978-3-942263-12-2.
Publisher
EUPRERA European Public Relations Education and Research Association, www.euprera.org
Copyright
© 2011 by Ansgar Zerfass and the research team for the whole document and all parts, charts and data. The material presented in this document represents empirical insights and interpretation by the research team. It is intellectual property subject to international copyright.Illustration licensed by istockphoto.com. Title graphic provided by Helios Media.Permission is gained to quote from the content of this survey and reproduce any graphics, subject to the condition that the source including the internet address is clearly quoted and depicted on every chart. It is not allowed to use this data to illustrate promotional material for commercial services. Publishing this PDF document on websites run by third parties and storing this document in databases or on platforms which are only open to subscribers/members or charge payments for assessing information is not allowed. Please use a link to the official websitewww.communicationmonitor.eu instead.
Acknowledgements
Special thanks to Ronny Fechner M.A. and Katharina Simon B.Sc. (University of Leipzig) for their most valuable statistical and organisational assistance and to Grit Fiedler and Neil Cranswick (EACD, Brussels) for helpful suggestions and administrative support.
Contact
Please contact any member of the research team or the advisory board in your country/region if you are interested in discussing the insights ofthis survey or in joint research projects. Questions regarding the overall research, including sponsorship opportunities for future surveys, may bedirected to the lead researcher, Prof. Dr. Ansgar Zerfass, [email protected]