european commissionec.europa.eu/agriculture/rica/pdf/dairy_farms_report_2013_web.pdf · eu dairy...
TRANSCRIPT
Commission européenne/EuropeseCommissie, 1049 Bruxelles/Brussel, BELGIQUE/BELGIË — Tel. +3222991111
EUROPEAN COMMISSION DIRECTORATE-GENERAL FOR AGRICULTURE AND RURAL DEVELOPMENT Directorate L. Economic analysis, perspectives and evaluations L.3. Microeconomic analysis of EU agricultural holdings
Brussels, February 2014
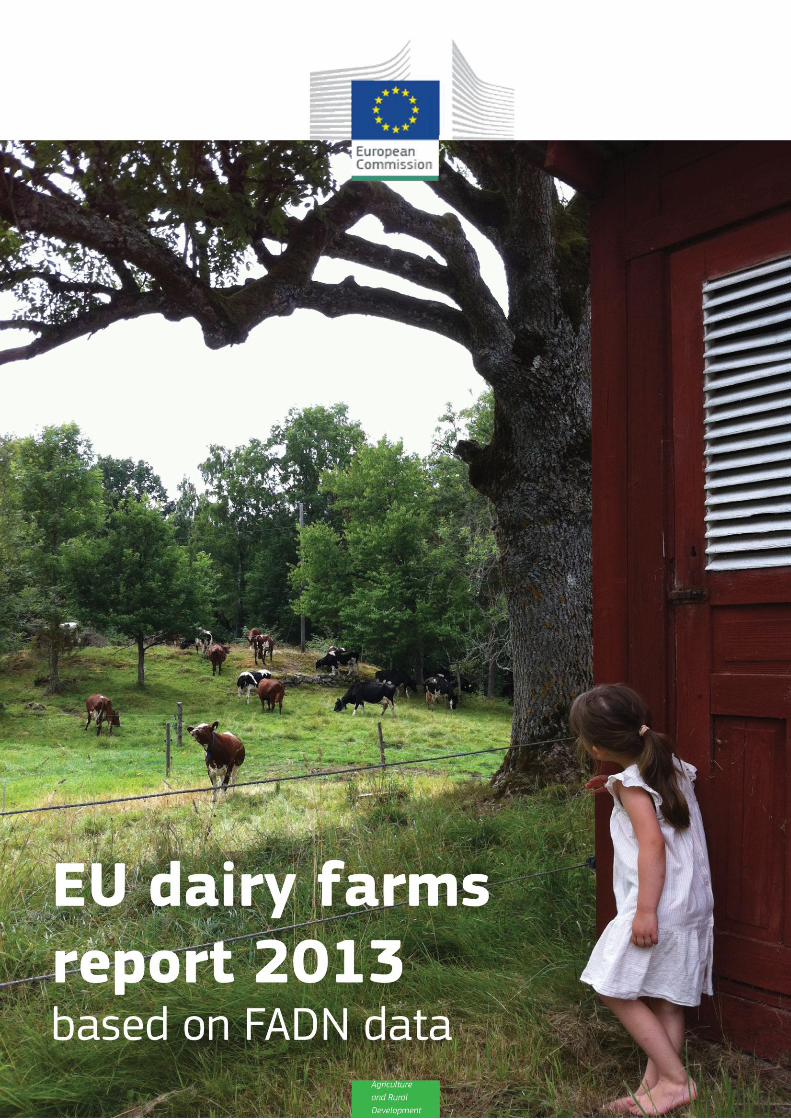
EU DAIRY FARMS REPORT 2013
Executive summary
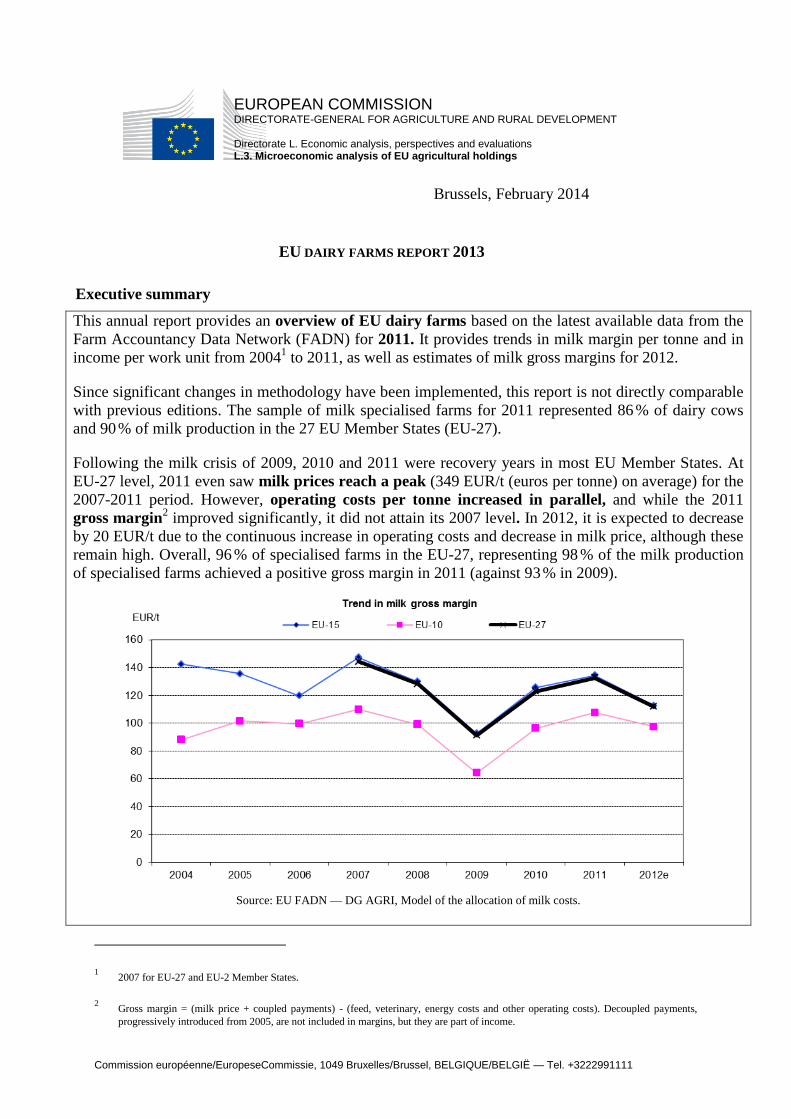
This annual report provides an overview of EU dairy farms based on the latest available data from the
Farm Accountancy Data Network (FADN) for 2011. It provides trends in milk margin per tonne and in
income per work unit from 20041 to 2011, as well as estimates of milk gross margins for 2012.
Since significant changes in methodology have been implemented, this report is not directly comparable
with previous editions. The sample of milk specialised farms for 2011 represented 86 % of dairy cows
and 90 % of milk production in the 27 EU Member States (EU-27).
Following the milk crisis of 2009, 2010 and 2011 were recovery years in most EU Member States. At
EU-27 level, 2011 even saw milk prices reach a peak (349 EUR/t (euros per tonne) on average) for the
2007-2011 period. However, operating costs per tonne increased in parallel, and while the 2011
gross margin2 improved significantly, it did not attain its 2007 level. In 2012, it is expected to decrease
by 20 EUR/t due to the continuous increase in operating costs and decrease in milk price, although these
remain high. Overall, 96 % of specialised farms in the EU-27, representing 98 % of the milk production
of specialised farms achieved a positive gross margin in 2011 (against 93 % in 2009).
Source: EU FADN — DG AGRI, Model of the allocation of milk costs.
1 2007 for EU-27 and EU-2 Member States.
2 Gross margin = (milk price + coupled payments) - (feed, veterinary, energy costs and other operating costs). Decoupled payments,
progressively introduced from 2005, are not included in margins, but they are part of income.

EU Dairy farms report 2013
2
The global picture is the same in the respective EU groups (see the graph above3). Even if gross margin
levels remain significantly different, the gap seems to be gradually narrowing between the 15 Member
States that belonged to the EU before 2004 (EU-15) and the 10 countries that joined the EU in 2004
(EU-10), as both the milk price and operating costs appear to be converging over time.
2010 and 2011 have been positive years in terms of income, with EU-27 milk specialised farms
obtaining a higher average Farm Net Value Added per Annual Work Unit (FNVA/AWU) than in 2007,
in both nominal and real terms. This result was the combined effect of an improvement in gross margin
and of a significant increase in milk production (+33 % since 2007). However, whereas dairy
specialised farms used to provide higher incomes per AWU than other types of farming, this has no
longer been the case after 2009: although their average income remains above the total average, they do
not rank in the top three types of farming.
Source: EU FADN — DG AGRI, ESTAT (HICP index EUR 2004).
In all EU groups, 2010 and 2011 have been characterised by a recovery in income following the drop
observed in 2009. As with gross margins, income levels varied among the EU groups (see the chart
above). FNVA/AWU in the EU-15 is almost four times higher than in the EU-10 and twelve times
higher than in the EU-2. In addition to the huge gap in macro variables (income levels, wage rates, other
costs and prices), huge differences in farm size (see charts below) explain this result. Again, the gap
between the EU-15 and EU-10 seems to be narrowing somewhat. In addition to convergence in margin,
production increased proportionally more in the EU-10 (+41 %) than in the EU-15 (+28 %) over the
period 2004-2011.4 The phasing-in of direct payments in the EU-10, which is still ongoing, also
contributed to this trend. In this EU group, direct payments and subsidies represented 49 % of the
FNVA/AWU of specialised dairy farms in 2011, but they also played a significant role in supporting
income in the EU-15 (40 %) and to a lesser extent in the EU-2 (23 %). In the latter group, the very low
apparent labour productivity is the main factor limiting income.
In 2012, the expected deterioration in the margins could lead to a decrease in income, as the quantity of
milk produced is expected to remain stable at EU-27 level.
3 As the margin results obtained for Romania are difficult to interpret, it has been decided not to present them until satisfactory
explanations are provided. This means that, except for the overall trend, no margin indicators are shown for the EU-2 aggregate.
4 Three-year average trend '2005' and '2010'.

EU Dairy farms report 2013
3
Source: EU FADN — DG AGRI, Model of the allocation of milk costs.
EU average results conceal a wide range of situations at national and regional levels, as illustrated in the
report.

EU Dairy farms report 2013
4
Table of contents
1. INTRODUCTION ....................................................................................................... 6
2. MILK SPECIALISED FARMS IN THE EU .............................................................. 6
3. ANALYSIS OF MILK MARGINS ............................................................................ 8
3.1. Breakdown by EU group ................................................................................... 9
3.1.1. EU-27 .................................................................................................. 9
3.1.2. EU-15 ................................................................................................ 12
3.1.3. EU-10 ................................................................................................ 15
3.1.4. EU-2 .................................................................................................. 18
3.2. Distribution of gross margin ........................................................................... 19
3.3. National level .................................................................................................. 19
3.3.1. EU-15 Member States ....................................................................... 20
3.3.2. EU-10 Member States ....................................................................... 23
3.3.3. EU-2 Member States ......................................................................... 25
3.4. Regional level .................................................................................................. 26
4. INCOME ANALYSIS .............................................................................................. 27
4.1. Breakdown by EU groups ............................................................................... 28
4.1.1. EU-27 ................................................................................................ 28
4.1.2. EU-15 ................................................................................................ 32
4.1.3. EU-10 ................................................................................................ 33
4.1.4. EU-2 .................................................................................................. 35
4.2. Distribution of FNVA/AWU ........................................................................... 36
4.3. National level .................................................................................................. 37
4.3.1. EU-15 Member States ....................................................................... 38
4.3.2. EU-10 Member States ....................................................................... 42
4.3.3. EU-2 Member States ......................................................................... 42
4.4. Regional level .................................................................................................. 43

EU Dairy farms report 2013
5
Box 1: The Farm Accountancy Data Network (FADN)
The FADN5 is a European system of sample surveys that take place each year and collect
structural and accountancy data relating to farms; the aim is to monitor the income and
business activities of agricultural holdings and to evaluate the impacts of the Common
Agricultural Policy (CAP).
The FADN survey covers only those farms exceeding a minimum economic size (threshold)
so as to cover the most relevant part of the agricultural activity of each EU Member State, i.e.
at least 90 % of the Standard Output and 90 % of Utilised Agricultural Area covered in the
Farm Structure Survey (FSS, Eurostat). For 2011, the sample consists of approximately
82 500 holdings in the EU-27, which represent 5.4 million farms (39 %) out of a total of some
14 million farms included in the FSS.
The survey is intended to provide representative data in three dimensions: by region,
economic size and type of farming. The FADN is the only harmonised source of micro-
economic data, which means that the accounting principles are the same in all EU Member
States.
The most recent FADN data available for this report are for the 2011 accounting year; this is
because of the time needed to collect, check and correct the data of all the EU Member States.
A significant change in the FADN methodology entered into force in 2010: the revised EU-
typology of farms (replacing standard gross margin by the standard output6) was integrated
into the FADN database. This report is the first edition based on the ‘Standard Output’
database, which is also the reason why time series only go back to 2004.7
5 For more information on FADN: http://ec.europa.eu/agriculture/rica/index.cfm .
6 See the FADN website for more information.
7 The plan is to integrate the new EU typology of farms into the FADN database back to 2000 in a second step.

EU Dairy farms report 2013
6
1. INTRODUCTION
This report provides an overview of EU dairy farms based on the latest available FADN
data, i.e. for 2011. Cost of production and gross margins for 2012 are also estimated. The
main feature of the five-year period 2007-2011 was the high level of volatility in agriculture
in general, and in the milk sector in particular, with both milk prices and input prices being
affected. Milk prices fell dramatically in mid-2008 following their sharp increase alongside a
general boom in agricultural prices in 2007. Producer prices recovered in 2010 and 2011 but
input prices, which had followed the trend in milk prices albeit with a time lag and to a
different extent, increased too.
This report provides an analysis of the economic situation of EU dairy farms. Chapter 2
describes the sample of milk specialised farms on which the results presented in this report
are based. The third section provides an analysis of milk margin by EU group and Member
State. The fourth section is dedicated to income analysis at EU and national level. Detailed
data by EU group, Member State and region are provided in the Annex, together with
explanations on the methodology.
2. MILK SPECIALISED FARMS IN THE EU
This study is based on farms mainly oriented towards milk production.8 Following changes in
the methodology, this sample of milk specialised farms increased substantially, in particular
in the EU-10 Member States. It now includes to some extent9 farms which were not
previously well covered, in particular large farms in Slovakia and the Czech Republic that
diversify their activities a great deal. The coverage of the sector thus improved. In the FADN
2011, the sample is made up of 15 030 farms, representing 665 954 farms in the EU-27 of
which 44 % are in the EU-15, 21 % in the EU-10 and 35 % in the EU-2.
The share of the milk production covered by specialised farms in the FADN is 94 % in the
EU-15 and 70 % in the EU-10 and the EU-2. There are big differences in coverage among
Member States: specialised farms in the FADN cover 54 % of the dairy cows reported to
Eurostat in the Czech Republic but more than 100 % in Ireland, Sweden and Finland.10
Globally, the FADN sample covers 86 % of the dairy cows, and the margin and
production costs are valid for 90 % of EU-27 milk production.11
There is significant diversity of milk farms across the EU (Table 1). Farms in the EU-15 are
much larger on average and have higher yields than in the EU-10 and EU-2. On
average, milk specialised farms in the EU-15 have 54 dairy cows, with a milk yield of
7 337 kg/cow, producing 396 t of milk per year, whereas in the EU-10 they have 19 dairy
cows, with a yield of 5 695 kg/cow, and produce 109 t of milk per year. Farm size is even
lower in the EU-2 where farms have 5 dairy cows on average, with a yield of 3 445 kg/cow,
8 See Annex I.
9 Provided that milk production is significant enough in the individual structure and actual output of the holdings.
10 This reflects a slight overrepresentation of the EU-FADN weighting system in these countries.
11 See also Table 2 and 3 in Annex I. The results for Cyprus and Greece are not displayed because the sample is too small (less than
15 holdings).
EU Dairy farms report 2013
7
and produce 16 t of milk per year. These data reflect the diversity of milk farm structures in
the EU-27, which are linked to the differences in natural potential and also in the social,
economic and regulatory context. In particular, the different national policies on milk quota
management are very likely to have had an impact on the level of restructuring within each
Member State.
Table 1: Structural information on milk specialised farms by Member State (2011)
Specialised milk farms
FADN 2011 Dairy
cows — LU
Forage area — ha
Total labour —
AWU
Share of family
labour — %
Milk yield — kg/cow
Milk production /farm —
tons
Milk price — €/ton
Share of national
milk production
— %
Belgium 56 47 1.82 98 % 7 090 398 338 84 %
Denmark 142 102 2.38 49 % 8 421 1 193 371 99 %
Germany 55 52 2.07 69 % 7 632 420 343 92 %
Greece . . . . . . . .
Spain 41 20 1.74 89 % 7 384 299 313 100 %
France 53 71 1.90 91 % 7 099 373 345 95 %
Ireland 62 57 1.62 86 % 5 461 337 329 99 %
Italy 45 23 2.03 80 % 6 924 314 460 95 %
Luxembourg 53 78 1.85 91 % 7 610 406 326 94 %
The Netherlands 82 48 1.73 89 % 8 019 654 394 99 %
Austria 16 26 1.54 97 % 6 604 105 349 86 %
Portugal 30 17 1.74 86 % 7 246 214 293 98 %
Finland 31 40 2.05 85 % 8 711 270 411 99 %
Sweden 62 87 2.25 73 % 8 546 534 386 99 %
The United Kingdom 119 101 2.58 63 % 7 432 885 315 99 %
EU 15 54 51 1.93 81 % 7 337 396 357 95 %
Cyprus . . . . . . . .
The Czech Republic 138 252 15.99 9 % 6 814 942 335 58 %
Estonia 81 178 5.79 19 % 7 445 606 313 99 %
Hungary 76 92 7.11 15 % 7 199 544 309 78 %
Lithuania 11 22 1.81 81 % 5 482 63 276 85 %
Latvia 16 43 2.18 68 % 5 595 90 279 96 %
Malta 56 4 2.36 86 % 6 664 371 463 99 %
Poland 16 13 1.91 94 % 5 319 86 286 83 %
Slovakia 217 788 29.57 2 % 5 732 1 242 334 55 %
Slovenia 19 16 2.14 99 % 5 519 107 310 91 %
EU 10 19 24 2.28 75 % 5 695 109 297 80 %
Bulgaria 13 8 2.18 67 % 3 140 40 311 89 %
Romania 4 2 1.34 96 % 3 524 14 323 72 %
EU 2 4 3 1.40 93 % 3 445 16 321 75 %
EU 27 29 29 1.82 82 % 6 905 203 349 93 %
Source: EU FADN, Eurostat production statistics, treatment DG AGRI. ".": data are not displayed, fewer than 15 farms in the
sample.
EU Dairy farms report 2013
8
3. ANALYSIS OF MILK MARGINS
This chapter highlights the main results for revenues, costs and margins of dairy activity.
They relate exclusively to the production of milk, without taking into account the by-products
(calf and dairy cow). They are expressed in terms of current euros per tonne (EUR/t) of milk
produced. The tables in Annex II show the detailed results by EU group, Member State and
region.12
Three different margin indicators are studied.13
The gross margin (over operating costs) is
generally used when making comparisons with alternative types of production (labour, land
and capital costs still have to be paid, whichever type of production is chosen). The net
margin (before own factors) is calculated as the gross margin minus depreciation and external
factors (wages, rent, interest paid). The net economic margin allows for assessment of the
residual revenue (profit or loss) obtained from production, after remuneration of all
production factors including imputed family factors (opportunity costs for family factors).
The method is summarised in Box 2 and detailed in Annex I.
Box 2: Summary of the method
The FADN database contains information about output and subsidies per product, but as far
as costs are concerned it only provides information relating to the farm as a whole. Hence, the
direct contribution of each enterprise to the farm income is not available, which means that
the cost of production by product have to be estimated. The EU FADN unit has built several
models to estimate costs and margins for the different products: arable crops, milk and beef,
and permanent crops. These models allocate farm costs to a particular product using different
ratios. Annex I gives details of the model for estimating milk cost of production and margins
which is used in this analysis (see Methodology 1).
Since 2008, imputed costs for unpaid family factors have been estimated (family labour costs
and own capital costs). The aim is to enable a comparison to be made between Member States
with different structures in terms of labour (share of family and paid labour), land
(rented/owned) and capital. The methodology for estimating the opportunity costs of family
labour, land and capital is explained in Annex I (see Methodology 2).
The output, operating costs and gross margin (over operating costs) for 2012 are estimated on
the basis of milk prices, milk yield indices and input price indices. It is assumed that
structures remain unchanged (e.g. the number of cows remains the same), but a change in
milk production resulting from a change in average yield per cow is taken into consideration.
The sources of the indices used are the following:
- for the milk price: the Commission’s Directorate-General for Agriculture (DG AGRI)
- for milk yield and input prices: Eurostat databases (agricultural production, agricultural
prices and price indices).
12 With the exception of Romanian and thus EU-2 data, which are not fully disclosed due to difficulty in interpreting the results obtained.
13 For a detailed definition of the margins and costs presented, please refer to the description of the milk model in Annex I.
EU Dairy farms report 2013
9
3.1. Breakdown by EU group
3.1.1. EU-27
With the highest milk price in five years, 2011 has been quite a good year in terms of gross
margin despite the simultaneous sharp rise in production costs. As this trend in costs
continues through 2012, a decrease in gross margin is expected in spite of the still high
milk prices.
At EU-27 level, the operating costs for milk production consist mainly of feed costs (around
50 % of operating costs, 70 % of which are for purchased feed and 30 % for home-grown
feed), together with energy, machinery and building upkeep and contract work, each
representing about 10 % of operating costs. Since the decoupling of direct support, revenues
from milk14
have depended mostly on the price and the quantity produced.15
In the short term,
gross margin is therefore mainly influenced by the milk price and feed costs.
Between 2007 and 2009, the average price for milk fell by 17 % while operating costs per
tonne remained stable. As a consequence, the average milk gross margin fell to 91 EUR/t
with coupled payments (Figure 1). Milk prices subsequently recovered, reaching their highest
level in five years in 2011. This more than compensated for the continuous increase in
operating costs (mostly feed and energy), which also hit their highest point in five years in
2011. As a consequence, 2010 and 2011 saw a recovery in gross margin, which reached
133 EUR/t with coupled payments in 2011. However, in 2012 slightly lower but still high
milk prices could not make up for continuously rising operating costs, and gross margin is
expected to fall by 20 EUR/t that year to 112 EUR/t with coupled payments. While 96 % of
milk specialised farms had a positive gross margin in 2011, this percentage is expected to
drop to 94 % in 2012.
The average net margin (gross margin minus depreciation and external factors, both of which
remained mostly unchanged) shows the same trend. After a sharp decrease between 2007 and
2009, it recovered in 2010 and 2011 to reach 43 EUR/t with coupled payments. After
deducting the estimated opportunity costs for family labour and capital, we obtain the net
economic margin, which also recovered to -36 EUR/t in 2011 with coupled payments. Not
only did it benefit from the positive trend in the other margins, but the opportunity costs for
own capital were halved as compared with 2009 following a decrease in the real interest
rate,16
the imputed family labour costs remaining stable. A negative net economic margin
means that on average farmers do not obtain what could be considered an adequate
remuneration for their own labour and capital.17
In 2011, it is estimated that 18 % of the EU-
27 specialised dairy farms achieved a positive net economic margin, representing 36 % of the
14 The decoupling also means that the link between milk margins and income of dairy producers is somewhat less obvious than in the
past.
15 Since the margins are presented per tonne of milk, the impact of the quantity produced is mostly visible in the income indicators.
16 See Methodology 2 for further explanation. The ‘real interest rate’ used to calculate own capital unpaid costs corresponds roughly to
the difference between the long-term interest rate and inflation. It should be noted that opportunity costs for family labour and own
capital are only estimates, however, and should be interpreted with caution.
17 It is worth noting that the margins presented in this section relate exclusively to the production of milk. The ‘by-products’ (calf and
dairy cow) are not taken into consideration although they are accounted for in the income part. According to a very rough estimate, they
would add around 35 EUR/t on the revenue side at EU-27 level in 2011.
EU Dairy farms report 2013
10
milk production of specialised farms. Given the trend in gross margin, net economic margin is
expected to deteriorate in 2012.

Commission européenne/EuropeseCommissie, 1049 Bruxelles/Brussel, BELGIQUE/BELGIË — Tel. +3222991111
Figure 1: Trend in cost of milk production and margins, EU-27
Source: EU FADN — DG AGRI, Model of the allocation of costs for milk.

Commission européenne/EuropeseCommissie, 1049 Bruxelles/Brussel, BELGIQUE/BELGIË — Tel. +3222991111
3.1.2. EU-15
Trends in the EU-15 were similar to those in the EU-27.
In the EU-15, 2011 saw the highest price for milk since 2004, at 357 EUR/t. When taking
into consideration the coupled payments (including aid under Article 68 since 2008), the
revenues from milk amount to 360 EUR/t on average. Yet the specific costs of production
increased too (+19 % in three-year average trend, ‘2010’ vs ‘2005’) and so did the non-
specific operating costs (+12 %). At 135 EUR/t with coupled payments, the resulting gross
margin is among the highest in the eight-year period (see Figure 5). 96 % of specialised farms
had a positive gross margin in 2011 but this percentage is expected to decrease again in 2012,
back to its 2009 level at 93 % of specialised farms (still representing 97 % of the EU-15 milk
production from specialised farms): even if milk prices remain high in 2012, (+1 % as
compared with 2007), the expected increase in operating costs (+19 %) would lead to a
decrease in gross margin (-24 % as compared with 2007).
Given that depreciation and external factor costs per tonne have remained stable since 2009,
net margin also recovered, reaching 42 EUR/t with coupled payments. However, the average
of the last three years (2009 to 2011) is significantly lower (-49 %) than the average of the
first three years studied (2004 to 2006), even though average milk prices are slightly higher
(+8 %).
In 2011, the imputed costs for family factors (family labour and own capital), reached their
lowest level over the studied period. The decrease in the real interest rate — the lowest since
2004 — meant that opportunity costs for own capital were low (Figure 4). Opportunity costs
for family labour per tonne also followed a downward trend, together with the share of family
in the labour force, while apparent labour productivity (milk production per AWU) has
increased continually since 2004 (Figure 2), which offsets the gain in imputed wage for
family labour (Figure 3).18
As a result, net economic margin with coupled payments,
although negative, is much less so than in the previous three years, and 22 % of the EU-15
specialised dairy farms achieved a positive net economic margin in 2011.
Figure 2: Apparent labour productivity
Figure 3: Imputed wage for family labour
Source: EU FADN — DG AGRI, Model of the allocation of costs for milk.
18 The increase in labour productivity decreases the cost of labour per tonne of milk, but increases the income
of family workers.

EU Dairy farms report 2013
13
Figure 4: Opportunity costs for own capital and real interest rate
Source: EU FADN — DG AGRI.
.

EU Dairy farms report 2013
14
Figure 5: Trend in cost of milk production and margins, EU-15
Source: EU FADN — DG AGRI, Model of the allocation of costs for milk.

EU Dairy farms report 2013
15
3.1.3. EU-10
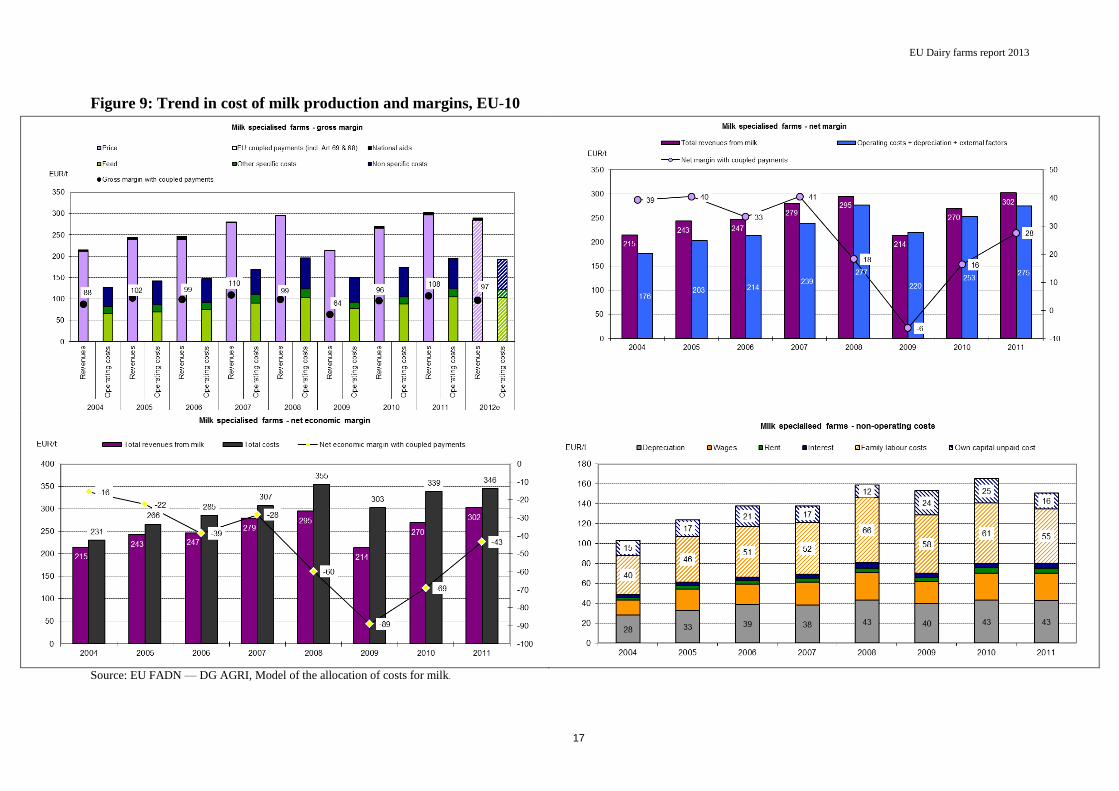
In 2011, the gross margin with coupled payments in the EU-10 recovered to its 2007 level,
in spite of a significant increase in the operating costs of production.
In the EU-10, 2011 was similar to 2008 in many respects. Firstly, in these two years the
average milk prices were the highest of the 2004-2011 period. In 2011, they were
complemented by a greater national aid so that total revenues from milk reached 302 EUR/t
on average. At the same time, operating costs almost returned to their 2008 peak, almost
reaching 200 EUR/t. The resulting average gross margin per tonne (108 EUR/t with coupled
payments) returned to its 2007 level (Figure 9). However, in 2011 less farms benefited from
these good performances than in 2007, with 94 % of EU-10 specialised dairy farms having a
positive gross margin, representing 95 % of the milk production, against 96 % in 2007. In
2012, the decrease in milk prices combined with sustained high production costs will
probably result in a decrease in gross margin, but to a lesser extent than in the EU-15 (-
11 EUR/t).
In line with the trend in gross margin, net margin also recovered between 2009 and 2011,
although to a lesser extent than the former, with external factor costs and depreciation per
tonne back to their 2008 level.
Overall, apparent labour productivity has been growing steadily since 2004 (+6 % per year,
Figure 6), but so did as well the imputed wage, which almost doubled over the period
(Figure 7). The resulting opportunity cost for family labour hovers around 60 EUR/t. The
opportunity cost for own capital decreased significantly following the trend in the real interest
rate (Figure 9). The net economic margin thus shows a recovery to an average of -43 EUR/t
with coupled payments in 2011. As in the EU-15, 35 % of milk from specialised dairy farms is
produced with a positive net economic margin.
Figure 6: Apparent labour productivity
Figure 7: Imputed wage for family labour
Source: EU FADN — DG AGRI, Model of the allocation of costs for milk.

EU Dairy farms report 2013
16
Figure 8: Opportunity cost for own capital and real interest rate
Source: EU FADN — DG AGRI, Model of the allocation of costs for milk.
EU Dairy farms report 2013
17
Figure 9: Trend in cost of milk production and margins, EU-10
Source: EU FADN — DG AGRI, Model of the allocation of costs for milk.

EU Dairy farms report 2013
18
3.1.4. EU-219
The EU-2 still lags behind significantly in terms of labour productivity.
In the EU-2, as in the other EU groups, milk prices reached their five-year peak in 2011
(Figure 10). Operating costs per tonne have also increased since 2009, especially feed costs
and non-specific costs although they remain quite low as compared with the other EU groups.
The average gross margin for 2011 therefore regained its 2007 level. It is however expected
to decrease significantly in 2012, following the decrease in milk price and above all the rise in
operating costs.
Depreciation has increased by 31 % since 2007, but has remained quite low compared with
the other EU groups. External factor costs per tonne also increased over the period, especially
wages, but were limited. Milk revenues increased proportionally more, producing a higher net
margin in 2011. The net economic margin also improved. It was however restricted by the
importance of family labour costs: due to the very small average size of the herd, family
labour costs remain extremely high (75 % of the non-operating costs). They rose quite
considerably in 2011: the increase in imputed wage is not being offset by the increase in
apparent labour productivity.
Figure 10: Trend in cost of milk production and margins, EU-2 (indices 2007=100)
Source: EU FADN — DG AGRI, Model of the allocation of costs for milk.
19 Due to difficulties in understanding the prices reported to the EU, only trends are displayed and commented in this section.
EU Dairy farms report 2013
19
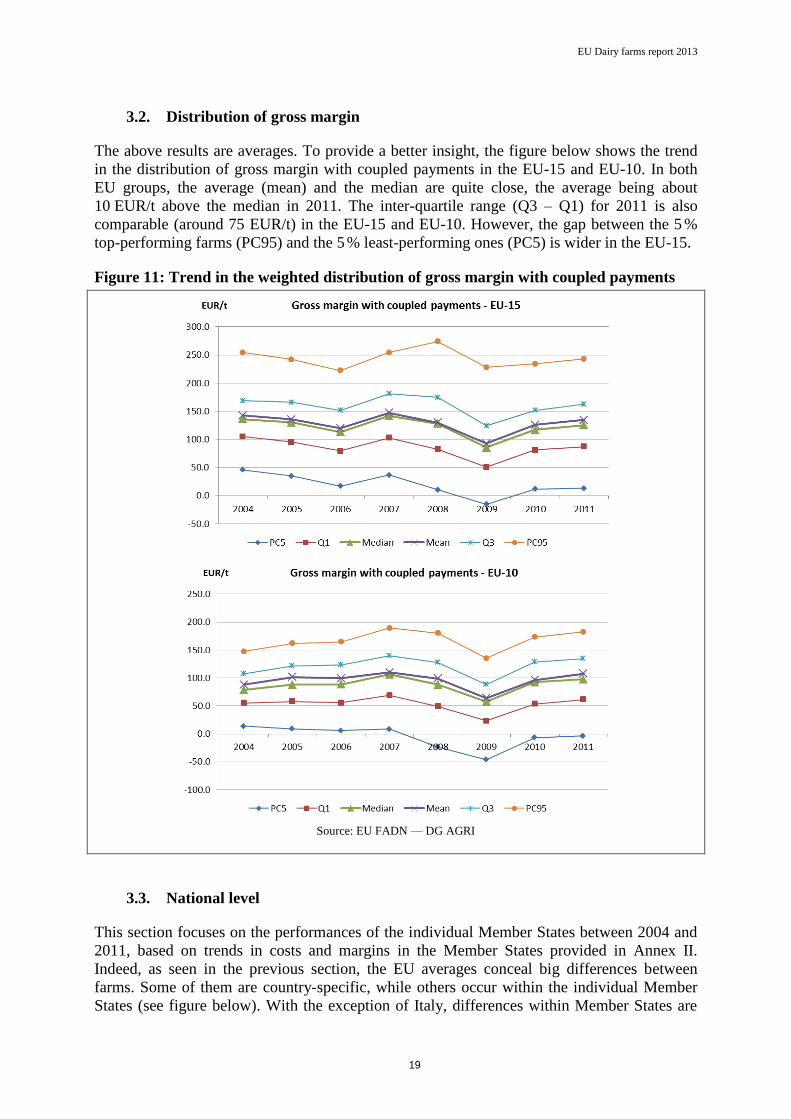
3.2. Distribution of gross margin
The above results are averages. To provide a better insight, the figure below shows the trend
in the distribution of gross margin with coupled payments in the EU-15 and EU-10. In both
EU groups, the average (mean) and the median are quite close, the average being about
10 EUR/t above the median in 2011. The inter-quartile range (Q3 – Q1) for 2011 is also
comparable (around 75 EUR/t) in the EU-15 and EU-10. However, the gap between the 5 %
top-performing farms (PC95) and the 5 % least-performing ones (PC5) is wider in the EU-15.
Figure 11: Trend in the weighted distribution of gross margin with coupled payments
Source: EU FADN — DG AGRI
3.3. National level
This section focuses on the performances of the individual Member States between 2004 and
2011, based on trends in costs and margins in the Member States provided in Annex II.
Indeed, as seen in the previous section, the EU averages conceal big differences between
farms. Some of them are country-specific, while others occur within the individual Member
States (see figure below). With the exception of Italy, differences within Member States are

EU Dairy farms report 2013
20
more marked in the EU-10 and EU-2 countries. It is worth noting that in Italy and Lithuania,
which both exhibit the highest average gross margins of their respective EU group
(250 EUR/t and 130 EUR/t respectively), the median gross margin is much lower (200 EUR/t,
and 78 EUR/t respectively), meaning that well over half the farms do not reach the average
gross margin.
Figure 12: Weighted boxplot of gross margin with coupled payments per Member State
— 2011
Source: EU FADN — DG AGRI. Extreme values are not displayed. The whiskers represent the percentiles 10 and 90. The
mean is a global ratio.
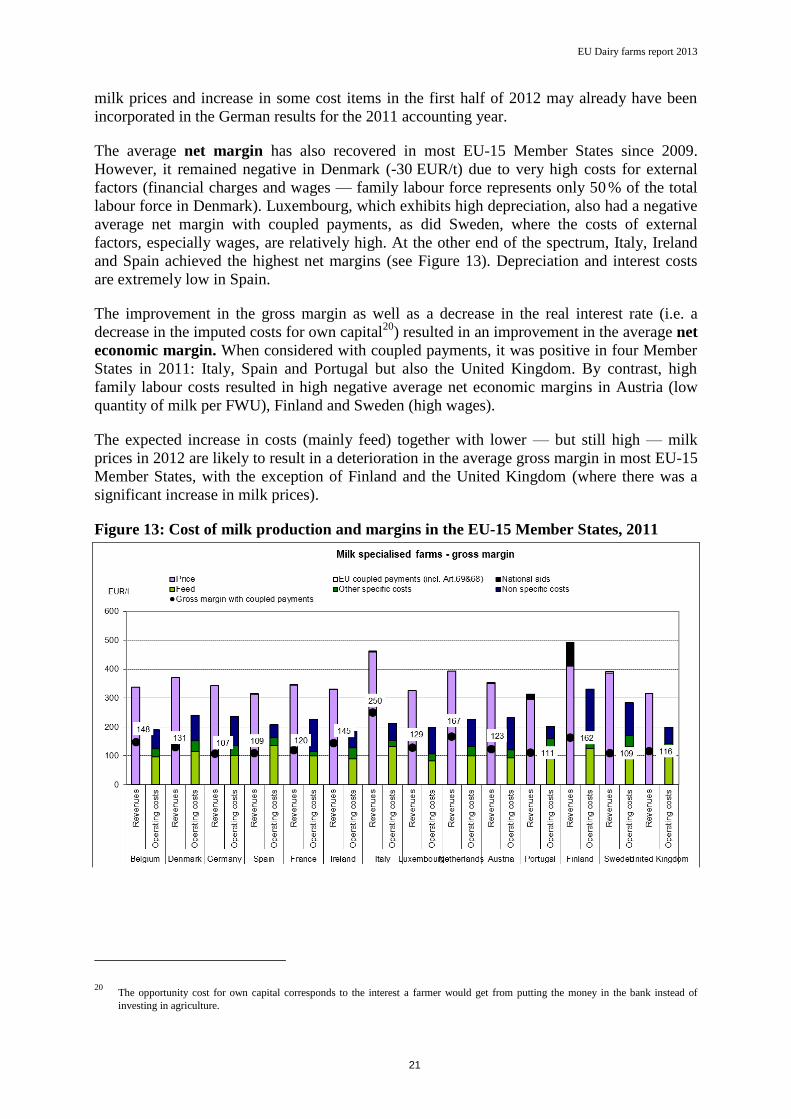
3.3.1. EU-15 Member States
In 2009 Ireland was the EU-15 Member State most affected by the crisis. By 2011, it had
also experienced the most spectacular recovery: expressed in index 2004=100, its average
gross margin with operating costs was 41 in 2009 and 103 in 2011. As in 2009, the milk price
was the main driver of this increase in gross margin, as Ireland had the lowest average
operating costs in the EU-15 and these increased only very moderately over this period.
Denmark, the Netherlands and Sweden also performed quite well — going from 50, 57 and
47 respectively in 2009 to 102, 108 and 90 in 2011 in index 2004 = 100, mostly thanks to the
increase in milk prices and also to relatively stable operating costs in Denmark. By contrast,
in Spain, Portugal and Finland gross margins have decreased since 2009. The milk price
has not risen significantly in any of these three countries since 2009, while the increase in
feed costs has been significant in the first two — where they represent around 65 % of the
operating costs — as has been the case for non-specific costs in Finland. However, thanks to
considerable coupled national aid (around 80 EUR/t), Finland remains in the top-three of the
EU-15 with regards to gross margins with coupled payments. The margins for Italy, with its
high value added products generating high prices and its limited costs, and for the
Netherlands — the other two countries in the top-three — were 250 EUR/t and 167 EUR/t
respectively. Germany, the major EU producer, had the lowest average gross margin with
coupled payments (107 EUR/t on average). It is worth noting, however, that the German data
correspond to the campaign year 2011/2012 whereas the data for the other Member States is
for the 2011 calendar year (January to December). Therefore, the effects of the slowdown in
EU Dairy farms report 2013
21
milk prices and increase in some cost items in the first half of 2012 may already have been
incorporated in the German results for the 2011 accounting year.
The average net margin has also recovered in most EU-15 Member States since 2009.
However, it remained negative in Denmark (-30 EUR/t) due to very high costs for external
factors (financial charges and wages — family labour force represents only 50 % of the total
labour force in Denmark). Luxembourg, which exhibits high depreciation, also had a negative
average net margin with coupled payments, as did Sweden, where the costs of external
factors, especially wages, are relatively high. At the other end of the spectrum, Italy, Ireland
and Spain achieved the highest net margins (see Figure 13). Depreciation and interest costs
are extremely low in Spain.
The improvement in the gross margin as well as a decrease in the real interest rate (i.e. a
decrease in the imputed costs for own capital20
) resulted in an improvement in the average net
economic margin. When considered with coupled payments, it was positive in four Member
States in 2011: Italy, Spain and Portugal but also the United Kingdom. By contrast, high
family labour costs resulted in high negative average net economic margins in Austria (low
quantity of milk per FWU), Finland and Sweden (high wages).
The expected increase in costs (mainly feed) together with lower — but still high — milk
prices in 2012 are likely to result in a deterioration in the average gross margin in most EU-15
Member States, with the exception of Finland and the United Kingdom (where there was a
significant increase in milk prices).
Figure 13: Cost of milk production and margins in the EU-15 Member States, 2011
20 The opportunity cost for own capital corresponds to the interest a farmer would get from putting the money in the bank instead of
investing in agriculture.

EU Dairy farms report 2013
22
Source: EU FADN — DG AGRI, Model of the allocation of costs for milk.
EU Dairy farms report 2013
23
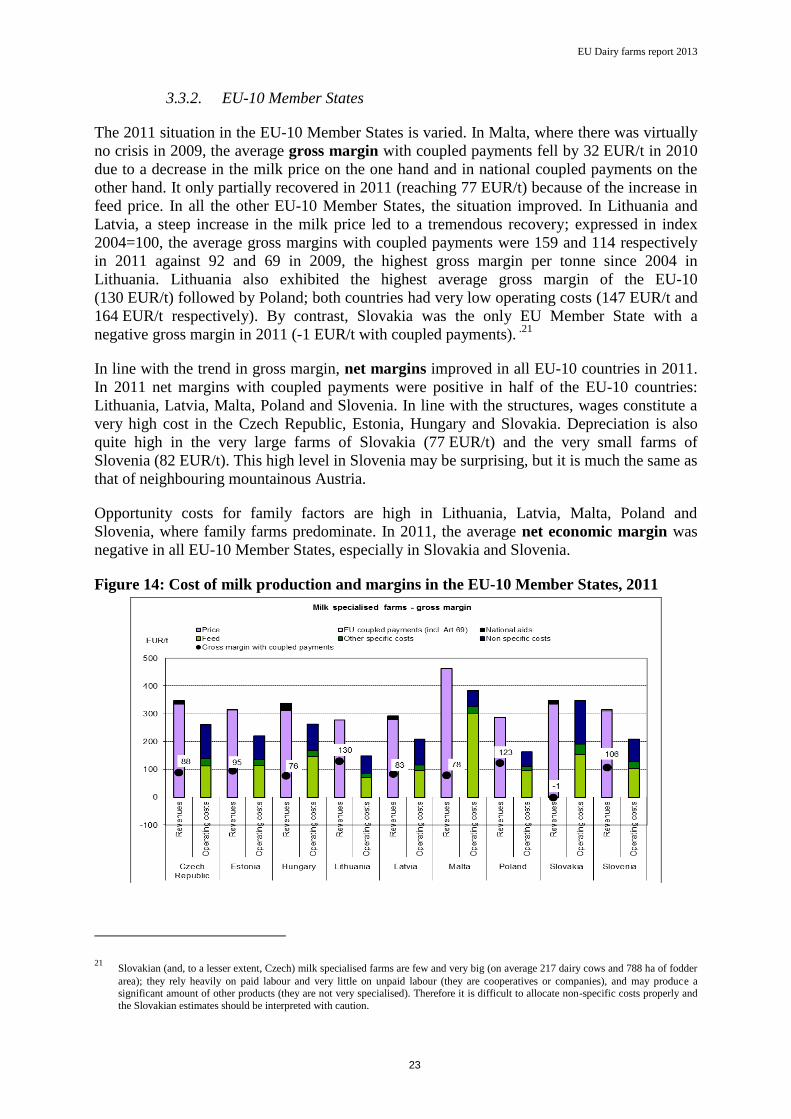
3.3.2. EU-10 Member States
The 2011 situation in the EU-10 Member States is varied. In Malta, where there was virtually
no crisis in 2009, the average gross margin with coupled payments fell by 32 EUR/t in 2010
due to a decrease in the milk price on the one hand and in national coupled payments on the
other hand. It only partially recovered in 2011 (reaching 77 EUR/t) because of the increase in
feed price. In all the other EU-10 Member States, the situation improved. In Lithuania and
Latvia, a steep increase in the milk price led to a tremendous recovery; expressed in index
2004=100, the average gross margins with coupled payments were 159 and 114 respectively
in 2011 against 92 and 69 in 2009, the highest gross margin per tonne since 2004 in
Lithuania. Lithuania also exhibited the highest average gross margin of the EU-10
(130 EUR/t) followed by Poland; both countries had very low operating costs (147 EUR/t and
164 EUR/t respectively). By contrast, Slovakia was the only EU Member State with a
negative gross margin in 2011 (-1 EUR/t with coupled payments). .21
In line with the trend in gross margin, net margins improved in all EU-10 countries in 2011.
In 2011 net margins with coupled payments were positive in half of the EU-10 countries:
Lithuania, Latvia, Malta, Poland and Slovenia. In line with the structures, wages constitute a
very high cost in the Czech Republic, Estonia, Hungary and Slovakia. Depreciation is also
quite high in the very large farms of Slovakia (77 EUR/t) and the very small farms of
Slovenia (82 EUR/t). This high level in Slovenia may be surprising, but it is much the same as
that of neighbouring mountainous Austria.
Opportunity costs for family factors are high in Lithuania, Latvia, Malta, Poland and
Slovenia, where family farms predominate. In 2011, the average net economic margin was
negative in all EU-10 Member States, especially in Slovakia and Slovenia.
Figure 14: Cost of milk production and margins in the EU-10 Member States, 2011
21 Slovakian (and, to a lesser extent, Czech) milk specialised farms are few and very big (on average 217 dairy cows and 788 ha of fodder
area); they rely heavily on paid labour and very little on unpaid labour (they are cooperatives or companies), and may produce a significant amount of other products (they are not very specialised). Therefore it is difficult to allocate non-specific costs properly and
the Slovakian estimates should be interpreted with caution.

EU Dairy farms report 2013
24
Source: EU FADN — DG AGRI, Model of the allocation of costs for milk.
EU Dairy farms report 2013
25
3.3.3. EU-2 Member States
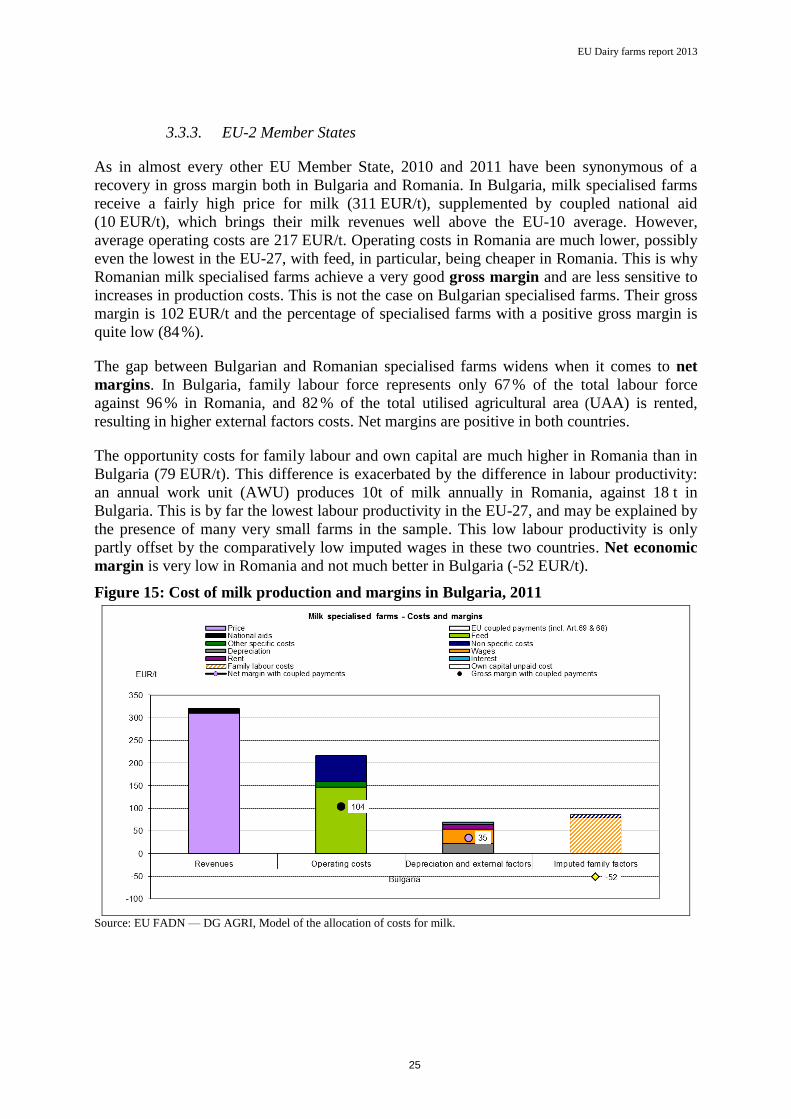
As in almost every other EU Member State, 2010 and 2011 have been synonymous of a
recovery in gross margin both in Bulgaria and Romania. In Bulgaria, milk specialised farms
receive a fairly high price for milk (311 EUR/t), supplemented by coupled national aid
(10 EUR/t), which brings their milk revenues well above the EU-10 average. However,
average operating costs are 217 EUR/t. Operating costs in Romania are much lower, possibly
even the lowest in the EU-27, with feed, in particular, being cheaper in Romania. This is why
Romanian milk specialised farms achieve a very good gross margin and are less sensitive to
increases in production costs. This is not the case on Bulgarian specialised farms. Their gross
margin is 102 EUR/t and the percentage of specialised farms with a positive gross margin is
quite low (84 %).
The gap between Bulgarian and Romanian specialised farms widens when it comes to net
margins. In Bulgaria, family labour force represents only 67 % of the total labour force
against 96 % in Romania, and 82 % of the total utilised agricultural area (UAA) is rented,
resulting in higher external factors costs. Net margins are positive in both countries.
The opportunity costs for family labour and own capital are much higher in Romania than in
Bulgaria (79 EUR/t). This difference is exacerbated by the difference in labour productivity:
an annual work unit (AWU) produces 10t of milk annually in Romania, against 18 t in
Bulgaria. This is by far the lowest labour productivity in the EU-27, and may be explained by
the presence of many very small farms in the sample. This low labour productivity is only
partly offset by the comparatively low imputed wages in these two countries. Net economic
margin is very low in Romania and not much better in Bulgaria (-52 EUR/t).
Figure 15: Cost of milk production and margins in Bulgaria, 2011
Source: EU FADN — DG AGRI, Model of the allocation of costs for milk.

EU Dairy farms report 2013
26
3.4. Regional level
As previously highlighted, there are also differences within Member States. The map below
shows the average gross margin per tonne with coupled payments by region. The best
performing regions are those with high average milk prices (e.g. in Italy), coupled support
(e.g. in Finland) or low costs (e.g. in Spain). More detailed results are available in annex II.
Map 1: Average gross margin per tonne with coupled payments by region, 2011
EU Dairy farms report 2013
27
4. INCOME ANALYSIS
As shown above, on average, the margins of the dairy activity on dairy specialised farms have
recovered since 2009. This chapter focuses on trends in the income of dairy specialised farms
at the level of the whole farm, thus also incorporating the results of other activities that may
be carried out on the farm. The following income indicators are studied:
– Farm Net Value Added (FNVA) equals total output (total production value), plus direct
payments minus intermediate consumption and depreciation. It represents the amount
available to remunerate all fixed production factors (land, labour and capital), either owned
by the farm or external.
– Farm Net Income (FNI) equals FNVA minus external factors, plus balance on subsidies
and taxes on investments. It is the amount available to remunerate family factors (labour,
land and capital).
– Remuneration of Family Labour (RFL) is calculated only for family farms.22
It equals FNI
minus the opportunity cost for own capital. It represents the amount available to
remunerate family labour.
These indicators are expressed per Annual Work Unit (AWU), for FNVA and FNI, or per
Family Work Unit (FWU) for RFL, to take account of the differences in the labour force
remunerated on the holding. All income indicators are calculated before deduction of income
taxes and expressed in current euros unless otherwise stated. Detailed tables are presented in
Annex II.
Box 3: What are the components of income on specialised milk farms?
Holdings have two sources of agricultural23
income: market and subsidies.
Income from the market:
- dairy enterprise: the margins associated with the production of milk are presented in the first
part of this report. However, since public support is no longer incorporated in the milk price,
it is not always easy to predict the income of specialised milk farms by looking solely at the
margins.
- coproducts of the dairy activity: in order to ensure comparability, the results presented in the
first part of this report relate to the production of milk stricto sensu. Because they could blur
the picture and make it difficult to interpret the results,24
the costs and revenues of products
directly linked to milk production (calves and cull dairy cows) are not taken into
consideration when calculating the margins. They are however part of the income calculation.
As an indication, cattle sales (be they dairy cattle or other cattle, including fattened animals)
account for 13.2 % of the total output25
of specialised milk farms at EU-27 level, with
differences between the Member States (from 7.6 % in Slovakia to 22.8 % in Ireland).
22 For the purpose of this report, ‘family farms’ are defined as farms employing an unpaid labour force, which usually corresponds to a
family labour force. 23
Farmers may have other sources of external income.
24 Besides, they are not always well reported in the farm return.
25 SE131, i.e. total output without compensating for differences in forage valuation.
EU Dairy farms report 2013
28
- other enterprises: the sample of specialised milk farms has been selected in such a way that
the dairy pole represents at least 40 % of the potential of production of the holding. Although
farms are quite specialised, especially in the EU-15, they may run other enterprises which
contribute to the total output of the farm and generate costs. These not only include crop
production, but also forestry and tourism (e.g. in Austria).
Subsidies, including decoupled payments, also contribute significantly to the income of
specialised dairy farms (see text).
4.1. Breakdown by EU groups
4.1.1. EU-27
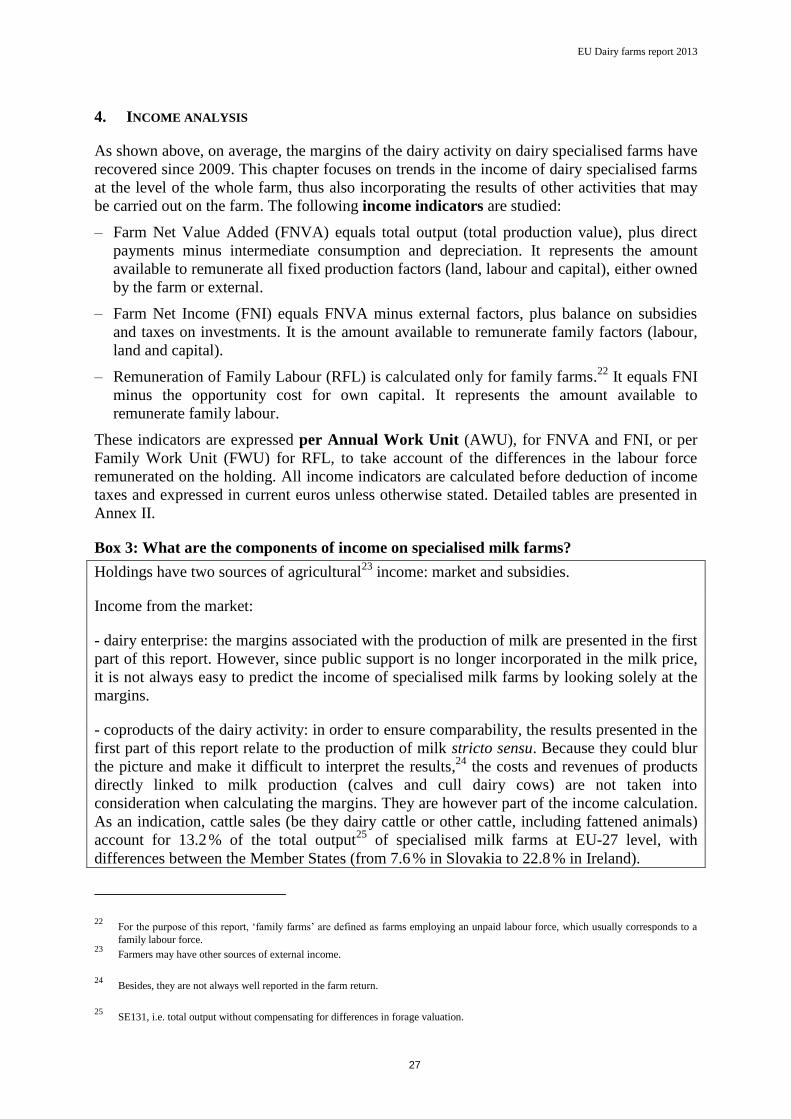
At EU-27 level, 2010 and 2011 were two consecutive very good years in terms of income.
In line with the positive trend in the margin indicators (Figure 16), not only have the income
indicators for milk specialised farms in the EU-27 recovered since 2009, they have also
reached their peak, even exceeding 2007 performances both in 2010 and 2011. The increase
in the milk price as well as in average milk production (+33 % since 2007) has resulted in a
rise in the milk output and subsequently in total output. This increase (+44 %), together with
the increase in subsidies (mostly the phasing-in of direct payments), has been significant
enough to outweigh the rise in intermediate consumption (+54 %). As a result, farm net value
added and farm net income have increased by 26 % and 21 % respectively since 2007 to
22 415 EUR/AWU and 15 629 EUR/AWU respectively, while the remuneration of family
labour has exceeded 1 000 EUR per month since 2010 (16 269 EUR/FWU on average in
2011).
Figure 16: Trends in the income of milk specialised farms, EU-27
Source: EU FADN — DG AGRI, Model of the allocation of costs for milk.
However these EU-27 results conceal substantial differences in income between the EU
groups (Figure 17). The FNVA/AWU is still almost four times higher in the EU-15 than in
the EU-10, and about twelve times higher than in the EU-2.
EU Dairy farms report 2013
29
Figure 17: Income of milk specialised farms by EU group, 2011
Source: EU FADN — DG AGRI, Model of the allocation of costs for milk.
As illustrated in Figure 18, once taken into account the huge gaps in the macro variables
(income level, wage rate, other costs and prices), the differences in income between the EU
groups have more to do with differences in farm size than in margin per tonne. Since the
decoupling of direct payments, these are no longer included in the gross margin but are part of
income. The increase in milk revenues (both milk price and milk production) means that the
share of direct payments and subsidies (first and second pillars, EU and national) in the
FNVA/AWU has decreased. In 2011 it was, on average, 40 % in the EU-15, 49 % in the EU-
10 and 23 % in the EU-2, where direct support is still being phased in.
Figure 18: FNVA/AWU and some variables by EU group, 2011
Source: EU FADN — DG AGRI, Model of the allocation of costs for milk.

EU Dairy farms report 2013
30
In 2011 as in the previous years, milk specialised farms showed results above the EU-27 total
average across all types of farming. Since 2009 however, they have no longer been in the top
three of types of farming for income (Figure 17). In 2011, they ranked fourth after
Granivores, Fieldcrops and Wine farms for FNVA/AWU. They regained third place for
FNI/AWU after Fieldcrops and Granivore. They ranked fifth after Granivores, Wine,
Fieldcrops and Horticulture farms for RFL/FWU, although remaining well above the EU-27
average. Therefore, whilst milk specialised farms may not have appeared the most attractive
in terms of income in 2011 at EU-27 level, they were in a better situation than some other
types of farming.

EU Dairy farms report 2013
31
Figure 19: Comparison of the income of milk farms with other farms, EU-27, 2011
Source: EU FADN — DG AGRI, Model of the allocation of costs for milk.
EU Dairy farms report 2013
32
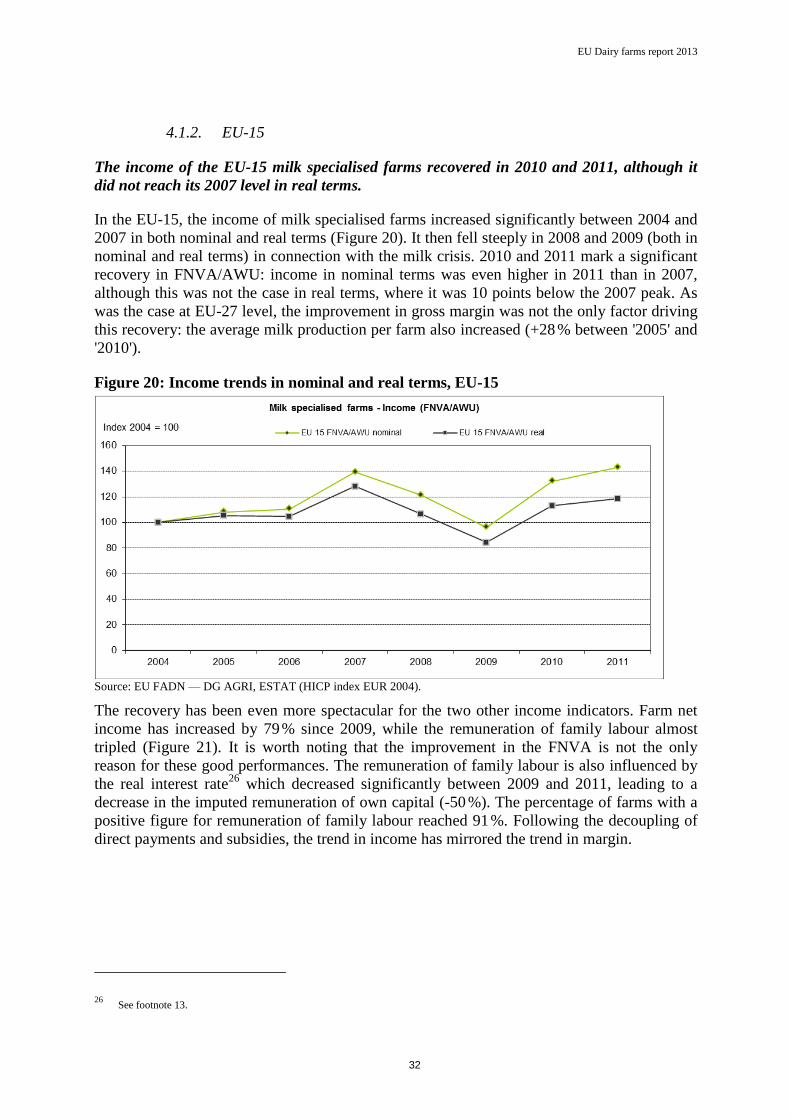
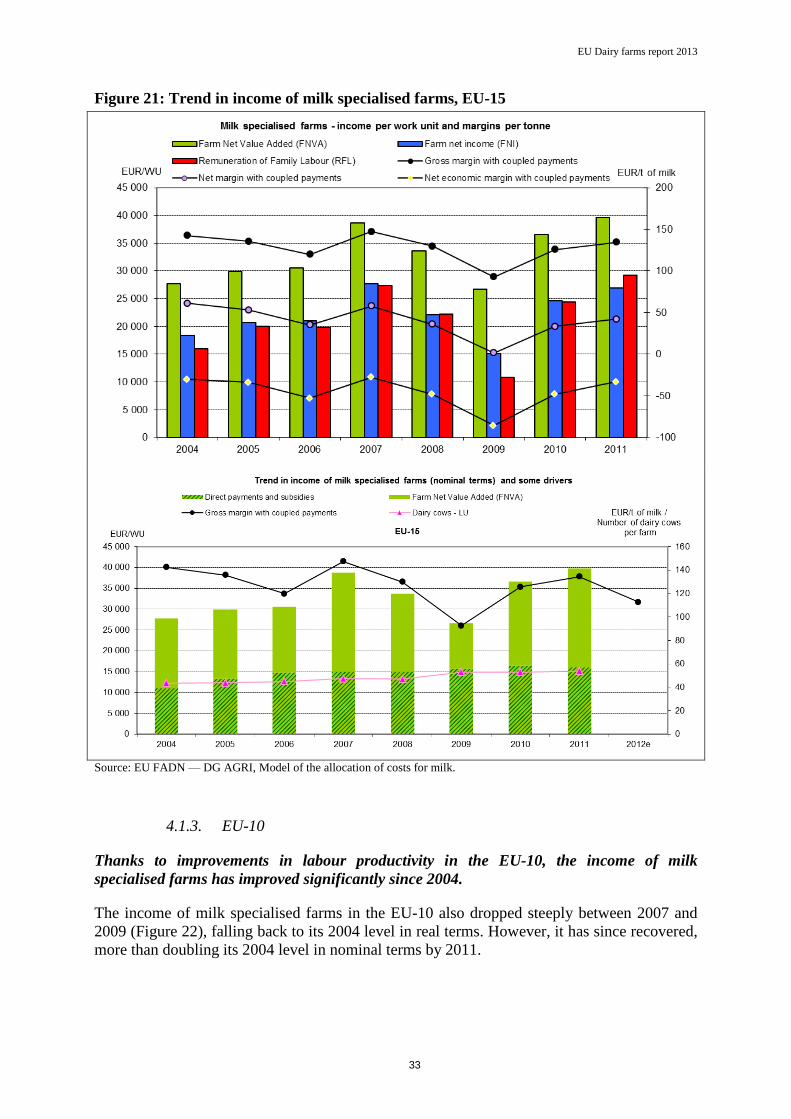
4.1.2. EU-15
The income of the EU-15 milk specialised farms recovered in 2010 and 2011, although it
did not reach its 2007 level in real terms.
In the EU-15, the income of milk specialised farms increased significantly between 2004 and
2007 in both nominal and real terms (Figure 20). It then fell steeply in 2008 and 2009 (both in
nominal and real terms) in connection with the milk crisis. 2010 and 2011 mark a significant
recovery in FNVA/AWU: income in nominal terms was even higher in 2011 than in 2007,
although this was not the case in real terms, where it was 10 points below the 2007 peak. As
was the case at EU-27 level, the improvement in gross margin was not the only factor driving
this recovery: the average milk production per farm also increased (+28 % between '2005' and
'2010').
Figure 20: Income trends in nominal and real terms, EU-15
Source: EU FADN — DG AGRI, ESTAT (HICP index EUR 2004).
The recovery has been even more spectacular for the two other income indicators. Farm net
income has increased by 79 % since 2009, while the remuneration of family labour almost
tripled (Figure 21). It is worth noting that the improvement in the FNVA is not the only
reason for these good performances. The remuneration of family labour is also influenced by
the real interest rate26
which decreased significantly between 2009 and 2011, leading to a
decrease in the imputed remuneration of own capital (-50 %). The percentage of farms with a
positive figure for remuneration of family labour reached 91 %. Following the decoupling of
direct payments and subsidies, the trend in income has mirrored the trend in margin.
26 See footnote 13.
EU Dairy farms report 2013
33
Figure 21: Trend in income of milk specialised farms, EU-15
Source: EU FADN — DG AGRI, Model of the allocation of costs for milk.
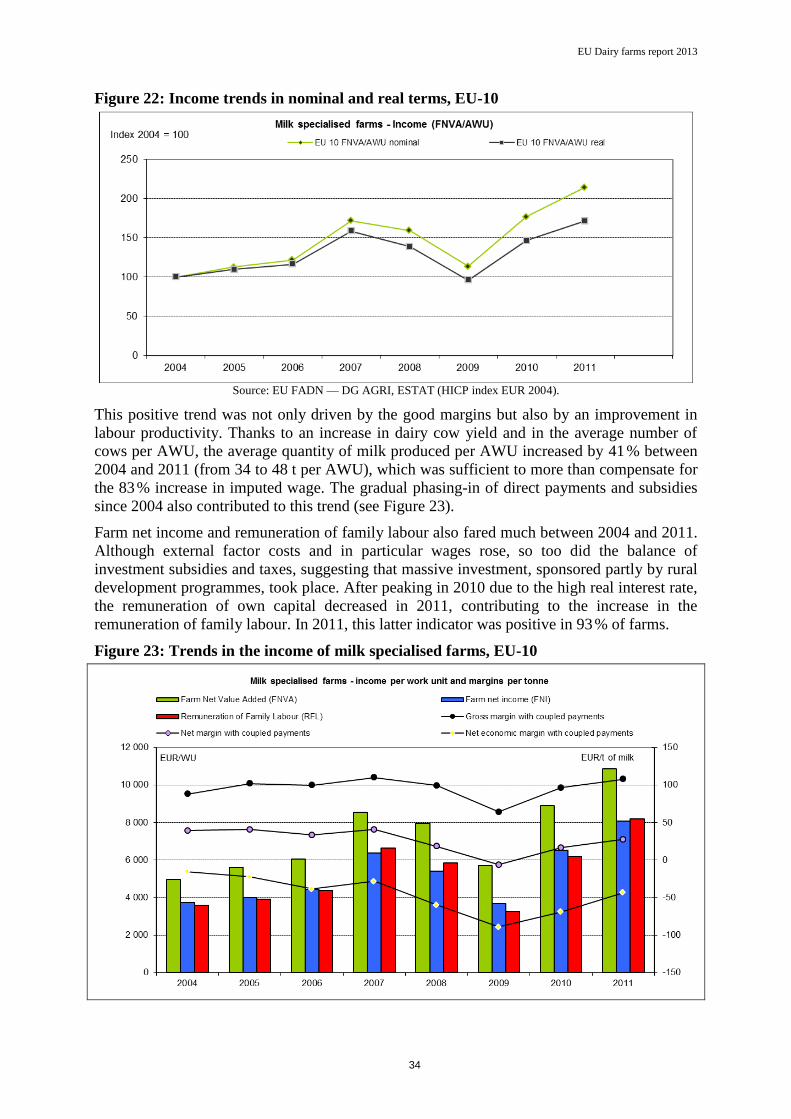
4.1.3. EU-10
Thanks to improvements in labour productivity in the EU-10, the income of milk
specialised farms has improved significantly since 2004.
The income of milk specialised farms in the EU-10 also dropped steeply between 2007 and
2009 (Figure 22), falling back to its 2004 level in real terms. However, it has since recovered,
more than doubling its 2004 level in nominal terms by 2011.
EU Dairy farms report 2013
34
Figure 22: Income trends in nominal and real terms, EU-10
Source: EU FADN — DG AGRI, ESTAT (HICP index EUR 2004).
This positive trend was not only driven by the good margins but also by an improvement in
labour productivity. Thanks to an increase in dairy cow yield and in the average number of
cows per AWU, the average quantity of milk produced per AWU increased by 41 % between
2004 and 2011 (from 34 to 48 t per AWU), which was sufficient to more than compensate for
the 83 % increase in imputed wage. The gradual phasing-in of direct payments and subsidies
since 2004 also contributed to this trend (see Figure 23).
Farm net income and remuneration of family labour also fared much between 2004 and 2011.
Although external factor costs and in particular wages rose, so too did the balance of
investment subsidies and taxes, suggesting that massive investment, sponsored partly by rural
development programmes, took place. After peaking in 2010 due to the high real interest rate,
the remuneration of own capital decreased in 2011, contributing to the increase in the
remuneration of family labour. In 2011, this latter indicator was positive in 93 % of farms.
Figure 23: Trends in the income of milk specialised farms, EU-10

EU Dairy farms report 2013
35
Source: EU FADN — DG AGRI, Model of the allocation of costs for milk.
4.1.4. EU-2
Income in the EU-2 is showing an even more positive trend than in the EU-10.
Although the 2009 milk crisis was less acute in the EU-2 than in the other EU groups, it had
an impact on the income of specialised dairy farmers. The recovery has since been significant,
and in 2011 the average FNVA/AWU showed an 86 % increase as compared with its 2007
level in nominal terms and 46 % in real terms (see Figure 24). Again, this can be explained by
the good performances in terms of margins, by the phasing-in of direct payments and by the
increase in labour productivity (see Figure 25). Nevertheless, FNVA per AWU
(3 491 EUR/AWU on average) remains much lower in the EU-2 than in the other EU groups.
Due to the large number of small to very small farms in the Romanian sample, and in view of
the weight of this Member State in the EU-2 aggregate, these results should be interpreted
with caution.
Figure 24: Income trends in nominal and real terms, EU-2
Source: EU FADN — DG AGRI, ESTAT (HICP index EUR 2004).

EU Dairy farms report 2013
36
Figure 25: Trend in the income of milk specialised farms, EU-2
Source: EU FADN — DG AGRI, Model of the allocation of costs for milk.
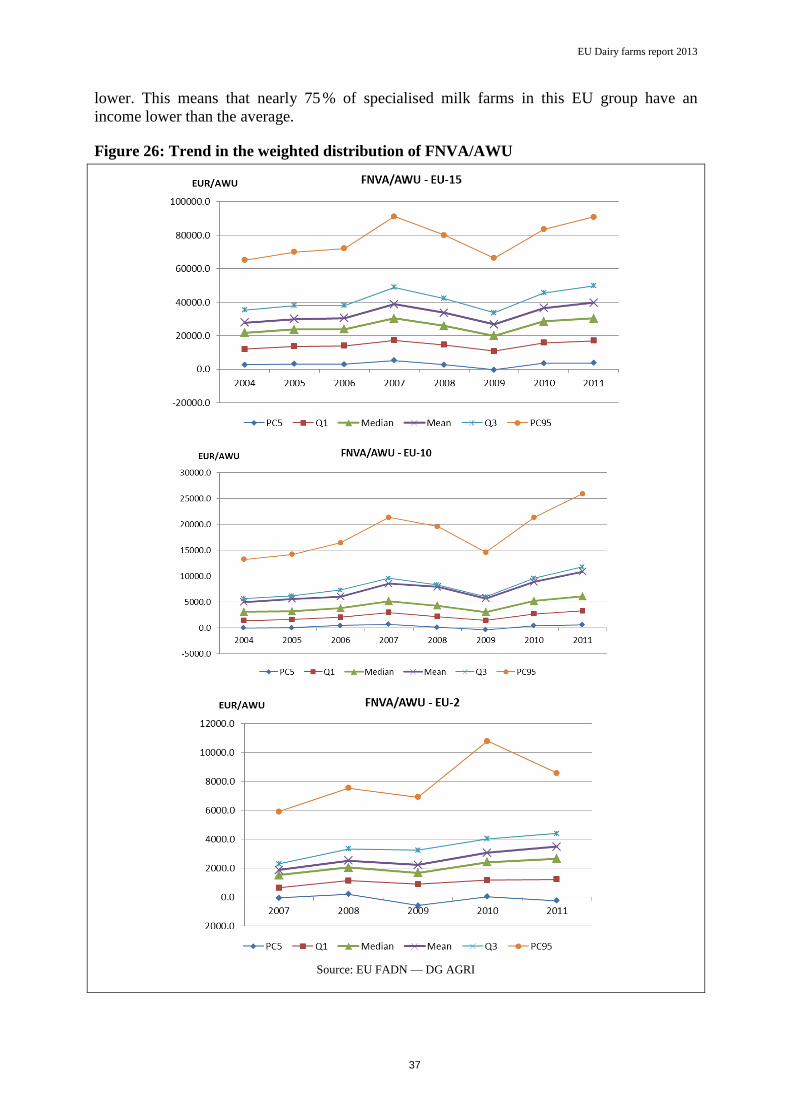
4.2. Distribution of FNVA/AWU
As was the case for margins, the average EU income results conceal big differences. The
figure below shows the trend in the distribution of weighted FNVA/AWU in the different EU
groups. The results show that the good performers have a marked effect on the average. This
is especially the case for the EU-10, where the average FNVA/AWU (10 849 EUR/AWU) is
closer to the third quartile than to the median (6 101 EUR/AWU), which is significantly
EU Dairy farms report 2013
37
lower. This means that nearly 75 % of specialised milk farms in this EU group have an
income lower than the average.
Figure 26: Trend in the weighted distribution of FNVA/AWU
Source: EU FADN — DG AGRI
EU Dairy farms report 2013
38
4.3. National level
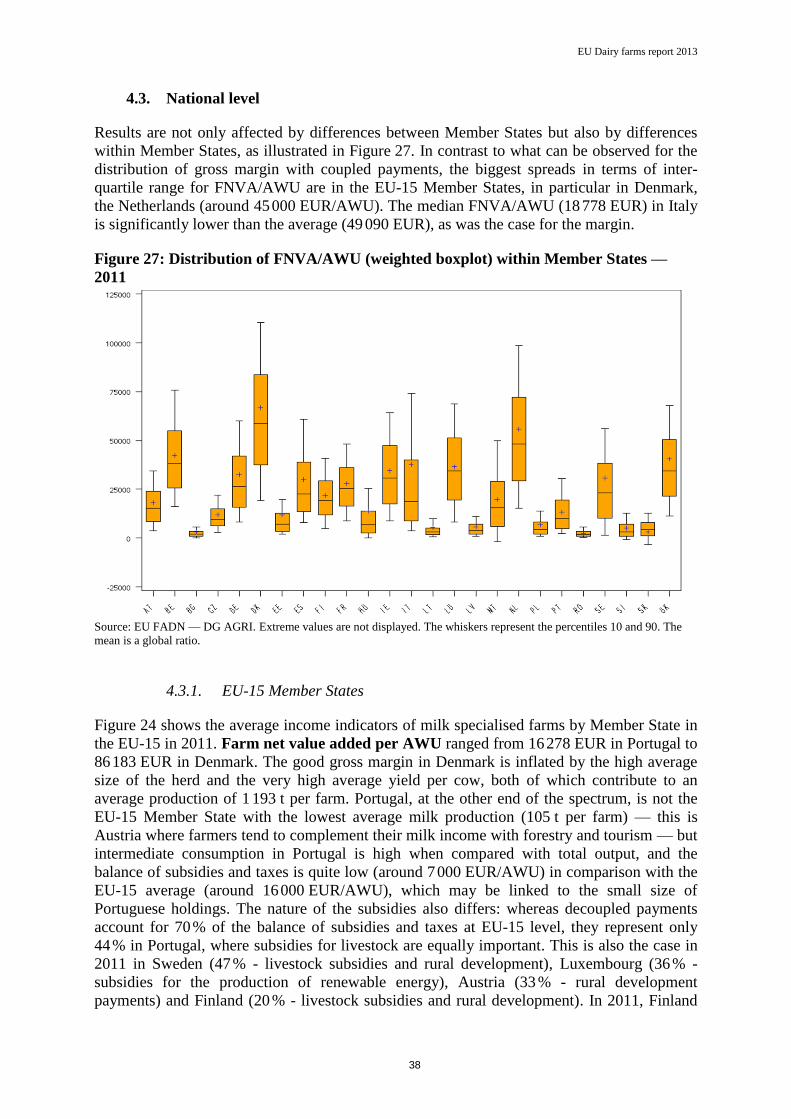
Results are not only affected by differences between Member States but also by differences
within Member States, as illustrated in Figure 27. In contrast to what can be observed for the
distribution of gross margin with coupled payments, the biggest spreads in terms of inter-
quartile range for FNVA/AWU are in the EU-15 Member States, in particular in Denmark,
the Netherlands (around 45 000 EUR/AWU). The median FNVA/AWU (18 778 EUR) in Italy
is significantly lower than the average (49 090 EUR), as was the case for the margin.
Figure 27: Distribution of FNVA/AWU (weighted boxplot) within Member States —
2011
Source: EU FADN — DG AGRI. Extreme values are not displayed. The whiskers represent the percentiles 10 and 90. The
mean is a global ratio.
4.3.1. EU-15 Member States
Figure 24 shows the average income indicators of milk specialised farms by Member State in
the EU-15 in 2011. Farm net value added per AWU ranged from 16 278 EUR in Portugal to
86 183 EUR in Denmark. The good gross margin in Denmark is inflated by the high average
size of the herd and the very high average yield per cow, both of which contribute to an
average production of 1 193 t per farm. Portugal, at the other end of the spectrum, is not the
EU-15 Member State with the lowest average milk production (105 t per farm) — this is
Austria where farmers tend to complement their milk income with forestry and tourism — but
intermediate consumption in Portugal is high when compared with total output, and the
balance of subsidies and taxes is quite low (around 7 000 EUR/AWU) in comparison with the
EU-15 average (around 16 000 EUR/AWU), which may be linked to the small size of
Portuguese holdings. The nature of the subsidies also differs: whereas decoupled payments
account for 70 % of the balance of subsidies and taxes at EU-15 level, they represent only
44 % in Portugal, where subsidies for livestock are equally important. This is also the case in
2011 in Sweden (47 % - livestock subsidies and rural development), Luxembourg (36 % -
subsidies for the production of renewable energy), Austria (33 % - rural development
payments) and Finland (20 % - livestock subsidies and rural development). In 2011, Finland

EU Dairy farms report 2013
39
was the only EU-15 country where subsidies were necessary to prevent a negative
FNVA/AWU.
Luxembourg’s dairy farmers also received a significant amount of investment subsidies, on
top of substantial subsidies for renewable energies, as compared with their colleagues from
other EU-15 Member States, although this was lower in 2011 than in the two previous years.
As a result of these payments, Luxembourg ranks fourth as regards farm net income with an
average of 34 944 EUR/AWU. Whereas Belgium, Italy, Ireland and the United Kingdom had
similar performances in terms of FNVA/AWU (between 44 800 and 48 700 EUR/AWU), Italy
and Ireland did better in terms of FNI/AWU. Both have low external factors costs, but Ireland
has higher rent and interest costs than Italy. Belgium has both high rent and interest costs,
while in the United Kingdom, the average amount for wages is among the highest in the EU-
15 (37 % of the labour force is paid labour force), after Sweden and above all, Denmark.
Financial costs in Denmark remained extremely high (44 231 EUR/AWU), which explains
why it had by far the highest FNVA/AWU (86 183 EUR/AWU) and the lowest FNI/AWU
(10 102 EUR/AWU on average), after deduction of external factors.
The remuneration of family labour was also the lowest in Denmark in 2011 —
12 747 EUR/FWU, slightly lower than in Portugal. Overall however, Portuguese ‘family’
farms appeared in better health, since 91 % of them achieved a positive figure for
remuneration of family labour, against only 62 % in Denmark. The figure exceeded 80 % in
all other EU-15 Member States, including Ireland where opportunity costs for own capital
remain very high due to the real interest rate. The EU-15 average was noticeably influenced
by the very good performances of the United Kingdom, Italy and the Benelux countries, the
only EU-15 Member States above it. France and Germany, however, are not too far off the
average, with around 27 500 EUR/FWU.

EU Dairy farms report 2013
40
Figure 28: Income indicators for milk farms in the EU-15 Member States, 201127
Source: EU FADN — DG AGRI, Model of the allocation of costs for milk.
27 On the green graph showing gross margin and FNVA/AWU, for Finland, only the total level (FNVA/AWU) is comparable with other
countries, as the total amount of direct payments and subsidies per AWU is actually higher than the FNVA/AWU.
EU Dairy farms report 2013
41
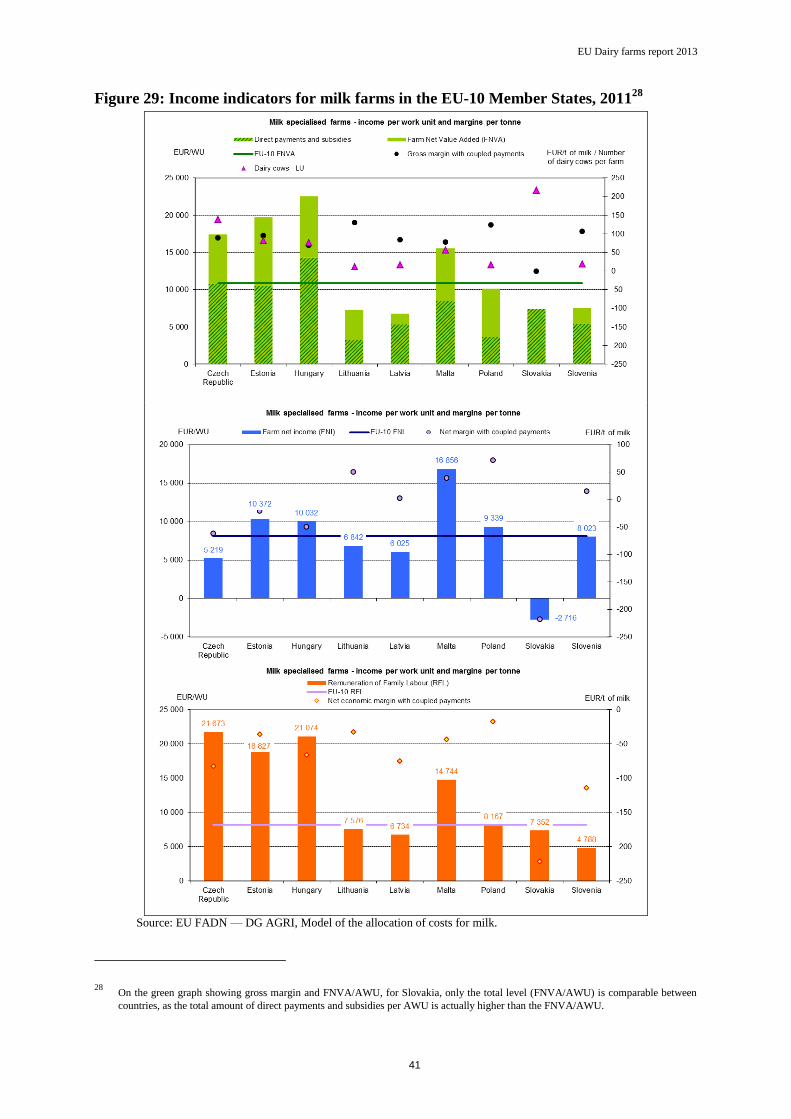
Figure 29: Income indicators for milk farms in the EU-10 Member States, 201128
Source: EU FADN — DG AGRI, Model of the allocation of costs for milk.
28 On the green graph showing gross margin and FNVA/AWU, for Slovakia, only the total level (FNVA/AWU) is comparable between
countries, as the total amount of direct payments and subsidies per AWU is actually higher than the FNVA/AWU.

EU Dairy farms report 2013
42
4.3.2. EU-10 Member States
Figure 29 shows the average income indicators for milk specialised farms by Member State in
the EU-10 in 2011. Malta, the Czech Republic, Estonia and Hungary achieve quite good
results, with an FNVA/AWU of between 15 587 EUR and 22 603 EUR. Lithuania and Poland,
despite their very good gross margin, are among the EU-10 Member States with the lowest
FNVA/AWU (7 310 EUR and 10 199 EUR respectively). Lithuanian farms are small (11 dairy
cows on average) and the average labour productivity is low (35 t/AWU). At the other end of
the spectrum, on the big cooperatives of Slovakia (217 dairy cows on average), labour
productivity is also limited (42 t/AWU) resulting in a low FNVA/AWU. Even in Malta and
Estonia, where the quantity of milk per AWU is the highest among the EU-10 Member States,
it remains much lower than the EU-15 average.
In contrast, wage costs tend to be higher than in the EU-15. This is particularly true in the
Czech Republic, Slovakia, Estonia and Hungary due to their structures, and even produces a
negative average farm net income in Slovakia. Family farms in Slovakia do not perform too
well either, having one of the lowest remuneration of family labour (7 352 EUR/FWU),
while neighbouring Czech Republic achieves an RFL of 21 673 EUR/FWU. The percentage
of specialised farms with a positive RFL varies considerably between the different countries.
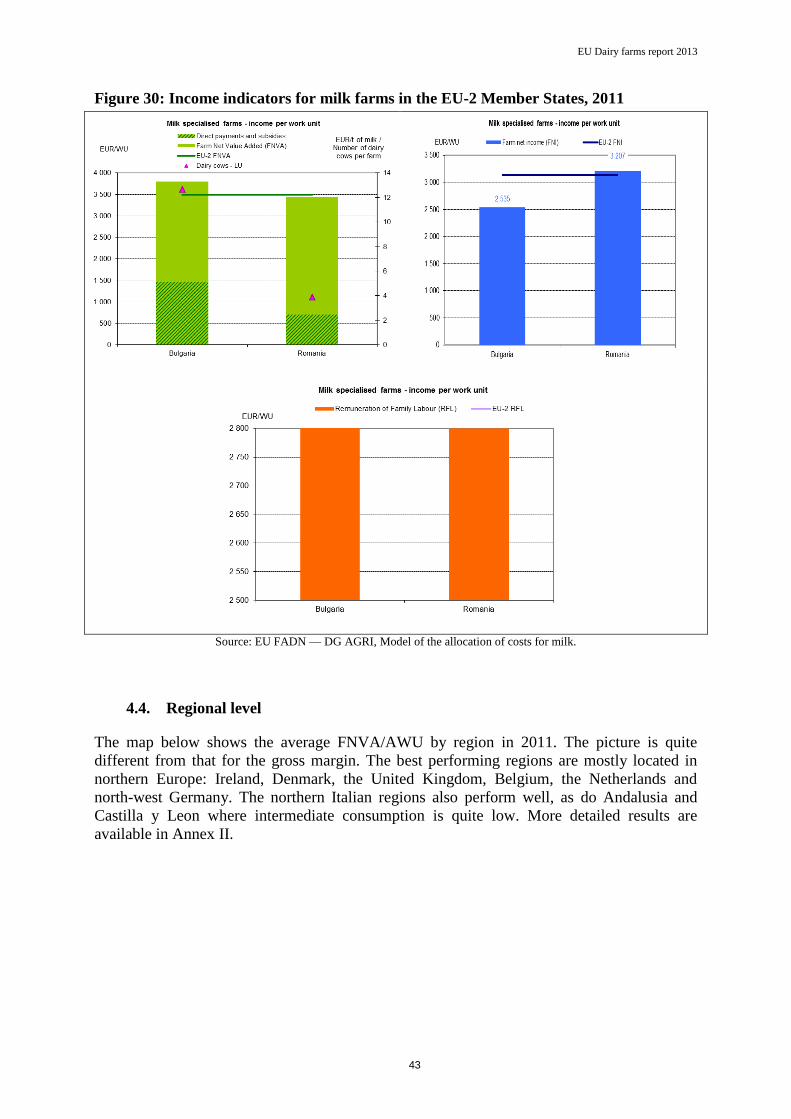
4.3.3. EU-2 Member States
In 2011, remuneration of family labour was similar in Bulgaria and Romania (around
2 800 EUR/FWU) (Figure 30). The farm net value added per AWU is also relatively
comparable for these two countries, although the result is due to low costs in Romania and to
higher output and subsidies in Bulgaria. The costs of external factors are significantly higher
in Bulgaria, resulting in lower farm net income. However, both countries remain below the
average income indicators for the EU-10 Member States. This can be explained by differences
in farm size (averaging 4 dairy cows in the EU-2 compared with 54 in the EU-15 and 19 in
the EU-10) and in direct payments and subsidies (the EU part of direct payments has not yet
been fully phased in).
EU Dairy farms report 2013
43
Figure 30: Income indicators for milk farms in the EU-2 Member States, 2011
Source: EU FADN — DG AGRI, Model of the allocation of costs for milk.
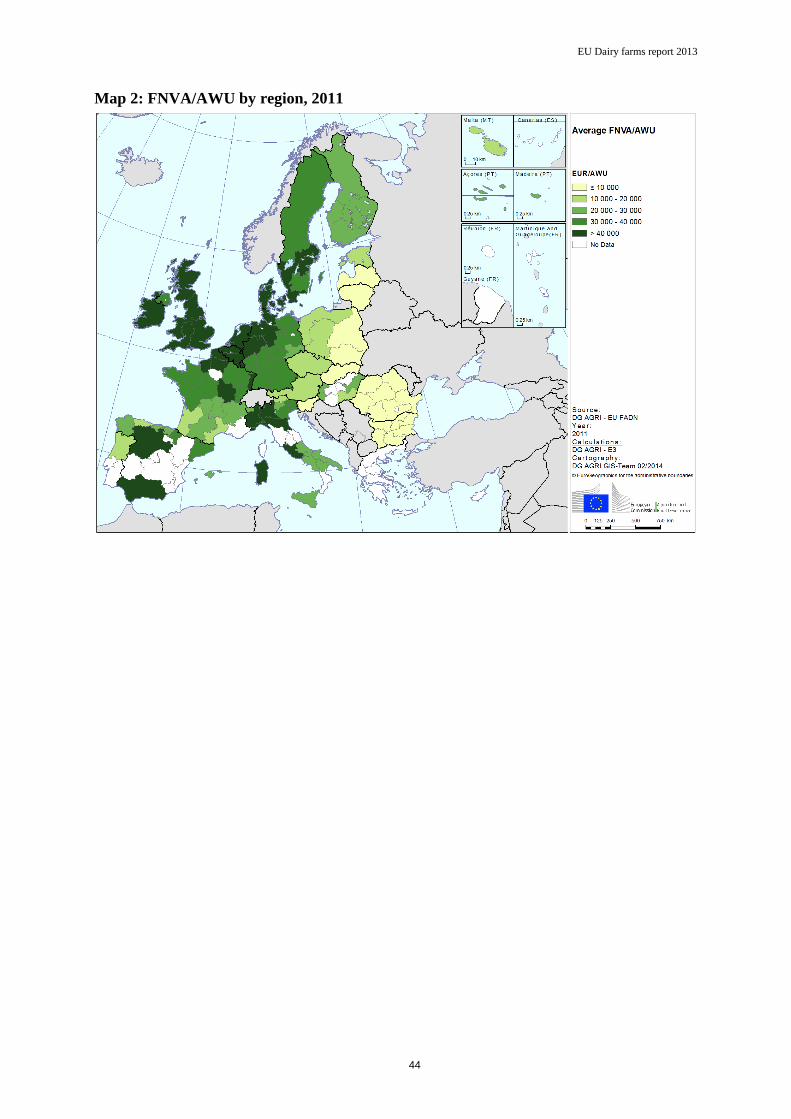
4.4. Regional level
The map below shows the average FNVA/AWU by region in 2011. The picture is quite
different from that for the gross margin. The best performing regions are mostly located in
northern Europe: Ireland, Denmark, the United Kingdom, Belgium, the Netherlands and
north-west Germany. The northern Italian regions also perform well, as do Andalusia and
Castilla y Leon where intermediate consumption is quite low. More detailed results are
available in Annex II.
EU Dairy farms report 2013
44
Map 2: FNVA/AWU by region, 2011
EU Dairy farms report 2013
45
ANNEX I
Methodology 1
The model for estimating milk production costs and margins
on the basis of FADN data
The FADN (Farm Accountancy Data Network) database contains information on output and
subsidies per enterprise; however, as regards costs, it only provides information referring to
the farm as a whole.29
In this context, the contribution of each enterprise to the farm income is
not directly available. Therefore production costs by product have to be estimated. The EU
FADN unit has constructed several models to estimate costs and margins, for a range of
different products: arable crops, milk and beef, and permanent crops. This note describes the
methodology used to estimate milk production costs and margins.
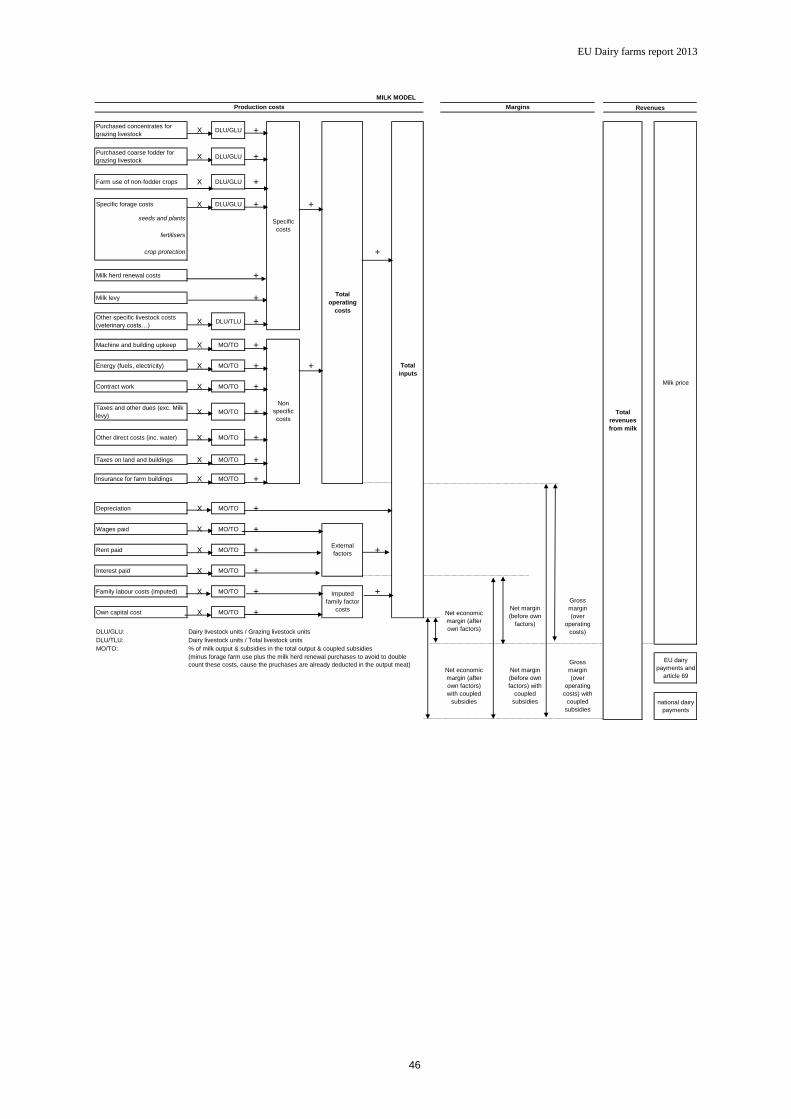
The allocation of costs
The following terminology is used with regard to costs:
– Operating costs, which include the following:
– Specific costs: for milk production, they cover purchased concentrates, purchased
coarse fodder, farm use of non-fodder crops, specific forage costs, milk herd renewal
costs, the milk levy and other specific livestock costs (veterinary etc.).
– Non-specific costs: upkeep of machinery and buildings, power (fuel and electricity),
contract work, taxes and other dues (excluding the milk levy), taxes on land and
buildings, insurance for farm buildings and other direct costs (including water as
regards the model for milk).
– Depreciation
– External factors: i.e. wages, rent and interest
– Imputed family factors, which cover: family labour cost and own capital cost (own land
cost + estimated cost for own capital except land – interest paid).
The costs are illustrated in the breakdown overleaf.
29 It is difficult for the accountant or the farmer to assess the proportion of water or electricity or fertilisers to
allocate to each activity, especially for mixed farms.
EU Dairy farms report 2013
46
Purchased concentrates for
grazing livestockX DLU/GLU +
Purchased coarse fodder for
grazing livestock X DLU/GLU +
Farm use of non-fodder crops X DLU/GLU +
Specific forage costs X DLU/GLU + +
seeds and plants
fertilisers
crop protection +
Milk herd renewal costs +
Milk levy +
Other specific livestock costs
(veterinary costs…)X DLU/TLU +
Machine and building upkeep X MO/TO +
Energy (fuels, electricity) X MO/TO + +
Contract work X MO/TO +
Taxes and other dues (exc. Milk
levy)X MO/TO +
Other direct costs (inc. water) X MO/TO +
Taxes on land and buildings X MO/TO +
Insurance for farm buildings X MO/TO +
Depreciation X MO/TO +
Wages paid X MO/TO +
Rent paid X MO/TO + +
Interest paid X MO/TO +
Family labour costs (imputed) X MO/TO + +
Own capital cost X MO/TO +
DLU/GLU: Dairy livestock units / Grazing livestock units
DLU/TLU: Dairy livestock units / Total livestock units
MO/TO: % of milk output & subsidies in the total output & coupled subsidies
EU dairy
payments and
article 69
national dairy
payments
Net margin
(before own
factors) with
coupled
subsidies
Gross
margin
(over
operating
costs) with
coupled
subsidies
Net economic
margin (after
own factors)
with coupled
subsidies
(minus forage farm use plus the milk herd renewal purchases to avoid to double
count these costs, cause the pruchases are already deducted in the output meat)
Total
operating
costs
External
factors
Imputed
family factor
costs Net margin
(before own
factors)
Total
inputs
Net economic
margin (after
own factors)
MILK MODEL
MarginsProduction costs
Total
revenues
from milk
Revenues
Milk price
Specific
costs
Gross
margin
(over
operating
costs)
Non
specific
costs

EU Dairy farms report 2013
47
The basis of the methodology is to allocate a share of the farm costs to milk production.
Different ratios are used:
– Dairy livestock units30
as a proportion of grazing livestock units (DLU/GLU on the
flow chart) is used to allocate grazing livestock feed costs;
– Dairy livestock units as a proportion of total livestock units (DLU/TLU) is used to
allocate other livestock specific costs;
– Milk output and subsidies as a proportion of total output31
plus linked subsidies
(MO/TO) is used to allocate non-specific inputs and fixed costs. Subsidies are taken
into account to enable the results to be compared over time since, from 2004 onwards,
part of the milk support that was previously included in the price has been allocated
via a direct payment. Moreover, this makes it possible to distinguish and to take better
account of the co-existence of beef production on farms where costs of milk
production are estimated (increasing the importance of direct aid support compared
with market price support in beef production). The total output (TO, denominator) is
also adjusted by deducting the value of home-grown fodder recorded in FADN and
adding the purchase costs for milk herd renewal (see below).
As the milk levy32
is directly linked to milk production only, it is fully allocated to the
costs of milk production.
Some disparities in FADN recording among Member States also have to be taken into
account in order to be able to make comparisons. Some Member States (generally from
the north of the EU) do not put a value on fodder in FADN, mainly because of the
difficulty of estimating production and the value of forage. Based on the principle that
forage production is simply an input for animal production, and that failure to record it
— either on the crop output side, or on the animal costs side — does not affect income,
no effort is made to estimate it. In other countries — generally those where fodder
production is more expensive — a value is assigned to the production of fodder. Even if
this difference is unlikely to affect margins, it can lead to biases when comparing costs
between Member States. To take account of the differences in records, fodder production
used on the farm is treated as follows for the purpose of the model:
– The value of the farm use of non-fodder plants (e.g. barley, rye, etc.) is maintained
in the item ‘Crops used for feed’, but the farm use value of all crops used as forage
(fodder roots, other fodder plants — e.g. silage of cereals, temporary grass, meadows
and pastures and rough grazing) is excluded.
– The value of fodder plants produced on the farm is estimated on the basis of the
specific costs of the crops (e.g. seeds, fertilisers, crop protection). Specific costs are
allocated to fodder production according to a ratio (fodder on total area). However,
some forage crops do not benefit from all inputs (e.g. there is no crop protection for
30 Dairy livestock units are defined as dairy cows and a share of total breeding heifers and young females.
This share is equal to dairy cows as a proportion of the total number of cows (dairy cows, cull dairy cows
and other cows).
31 Output after deduction of forage crops farm use.
32 In the previous model design, the milk levy was deducted from subsidies on the revenues side.
EU Dairy farms report 2013
48
temporary grass). Therefore, the area taken into account in the ratio varies according
to the input. The following table details the calculation. This item is called ‘Specific
forage costs’.
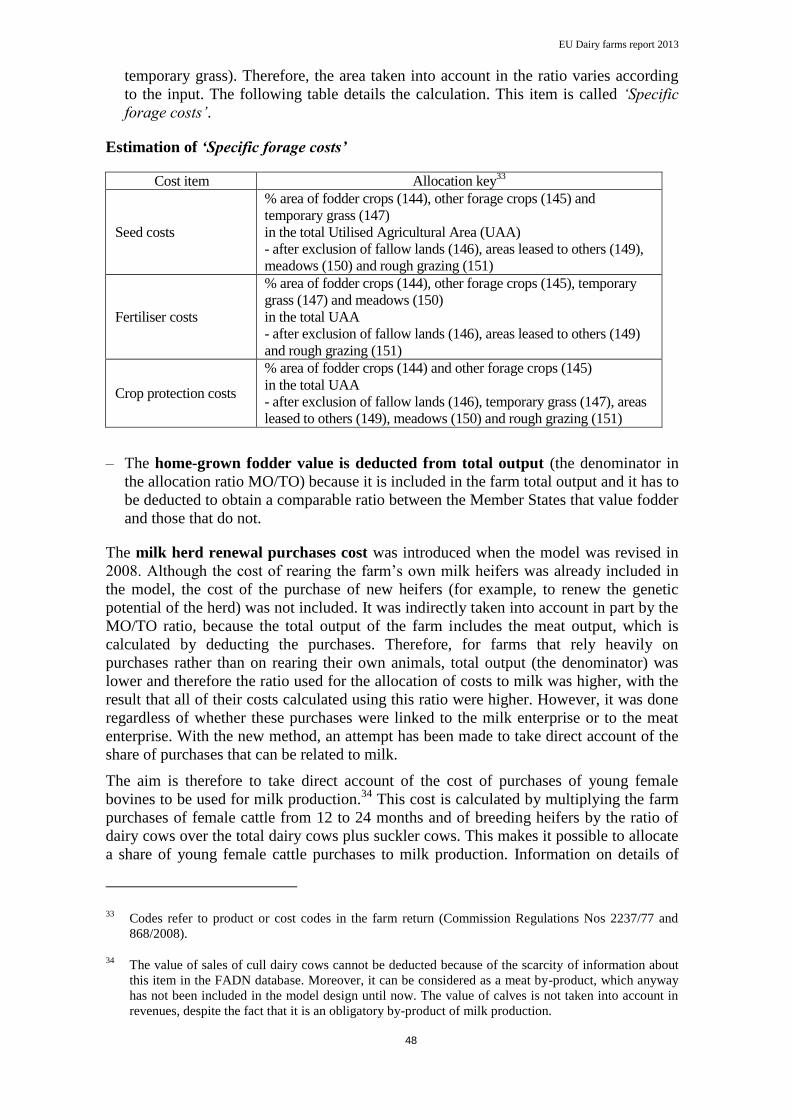
Estimation of ‘Specific forage costs’
Cost item Allocation key33
Seed costs
% area of fodder crops (144), other forage crops (145) and
temporary grass (147)
in the total Utilised Agricultural Area (UAA)
- after exclusion of fallow lands (146), areas leased to others (149),
meadows (150) and rough grazing (151)
Fertiliser costs
% area of fodder crops (144), other forage crops (145), temporary
grass (147) and meadows (150)
in the total UAA
- after exclusion of fallow lands (146), areas leased to others (149)
and rough grazing (151)
Crop protection costs
% area of fodder crops (144) and other forage crops (145)
in the total UAA
- after exclusion of fallow lands (146), temporary grass (147), areas
leased to others (149), meadows (150) and rough grazing (151)
– The home-grown fodder value is deducted from total output (the denominator in
the allocation ratio MO/TO) because it is included in the farm total output and it has to
be deducted to obtain a comparable ratio between the Member States that value fodder
and those that do not.
The milk herd renewal purchases cost was introduced when the model was revised in
2008. Although the cost of rearing the farm’s own milk heifers was already included in
the model, the cost of the purchase of new heifers (for example, to renew the genetic
potential of the herd) was not included. It was indirectly taken into account in part by the
MO/TO ratio, because the total output of the farm includes the meat output, which is
calculated by deducting the purchases. Therefore, for farms that rely heavily on
purchases rather than on rearing their own animals, total output (the denominator) was
lower and therefore the ratio used for the allocation of costs to milk was higher, with the
result that all of their costs calculated using this ratio were higher. However, it was done
regardless of whether these purchases were linked to the milk enterprise or to the meat
enterprise. With the new method, an attempt has been made to take direct account of the
share of purchases that can be related to milk.
The aim is therefore to take direct account of the cost of purchases of young female
bovines to be used for milk production.34
This cost is calculated by multiplying the farm
purchases of female cattle from 12 to 24 months and of breeding heifers by the ratio of
dairy cows over the total dairy cows plus suckler cows. This makes it possible to allocate
a share of young female cattle purchases to milk production. Information on details of
33 Codes refer to product or cost codes in the farm return (Commission Regulations Nos 2237/77 and
868/2008).
34 The value of sales of cull dairy cows cannot be deducted because of the scarcity of information about
this item in the FADN database. Moreover, it can be considered as a meat by-product, which anyway
has not been included in the model design until now. The value of calves is not taken into account in
revenues, despite the fact that it is an obligatory by-product of milk production.
EU Dairy farms report 2013
49
purchases of animals is available in FADN only from 2000 onwards; therefore this
estimate can only be made from 2000 onwards. Moreover, it is not obligatory and, in
practice, some Member States did not record it in the initial years after its introduction.35
This has to be taken into account when interpreting the results.
However, a correction should be made for total output (the denominator in the
allocation ratio MO/TO) to avoid double counting of these costs. The total output already
deducts all purchases of animals, so the calculated milk herd renewal costs should be
added back into the total output used in the allocation ratio MO/TO.
Another disparity in recording by Member States concerns depreciation of the milk
quota, which is applied in some Member States and not in others (in part because of
differences in milk quota management). Moreover, for the most recent accounting years,
specific instructions were given to Member States that depreciation of quotas should not be
entered in the FADN table related to capital.36
This means that depreciation is not taken into
account in the calculation of income. In order to be consistent with this principle and to
allow comparability over time and among Member States, our estimates apply a rule of non-
depreciation of milk quota. It should be noted that the cost of buying or renting milk quota
is covered (where it is not self-financed) by interest and rent paid.
The following FADN cost items have been included in the 2008 revision of the model:
– taxes and other dues (excluding the milk levy) (part of farming overheads, non-
specific costs),
– insurance on farm buildings (part of farming overheads, non-specific costs),
– taxes on land and buildings (part of farming overheads, non-specific costs).
The estimation of imputed unpaid family factors has also been included in the margin
and income calculation. The methodology used is explained in another annex.
Revenues from milk
Revenues from milk take into account:
– the value of sales of milk and milk products;
– EU dairy payments (11.81EUR/t of quota in 2004, 23.65EUR/t in 2005, 35.50EUR/t
in 2006 before decoupling; the actual implementation date of the payments depends
on the Member State), Article 69 payments for dairy (used in Spain) and Article 68
payments linked to dairy production;
– Any national dairy payments.
35 Milk herd renewal purchases cannot be estimated for Greece, Italy (2000-2005), Ireland (2000),
Finland (2000), Sweden (2000).
36 Document RI/CC 1256: Deprecation of quota should NOT be entered in Table G (Land and buildings,
deadstock, circulating capital), but may be entered in Table L.
EU Dairy farms report 2013
50
This means that the value of calves and of sales of cull dairy cows is not taken into account,
because no satisfactory method has been found to estimate this value on the basis of the current
data.
The margins
The following terminology is used in relation to margins:
– Gross margin (over operating costs): sales of milk and milk products minus
operating costs;
– Net margin (before own factors): sales of milk and milk products minus operating
costs, depreciation and external factors;
– Net economic margin (after own factors): sales of milk and milk products minus
operating costs, depreciation, external factors, and imputed unpaid family factors.
All the margins are displayed with and without coupled payments for milk (EU and
national). This makes it possible to simulate the removal of coupled payments.
The sample of farms
Given the estimation methodology, i.e. the need to allocate costs, to obtain reliable
estimations of production costs and margins it is necessary to focus on milk specialised
farms. Depending on the specific objectives of the analysis, different specialisation
criteria might be chosen. In general, the following criteria have been used:
– Farms covered by the following types of farming (TF): 41 Specialist dairying, 43
Cattle dairying, rearing and fattening combined, 71 Mixed livestock, mainly dairying,
81 Field crops — grazing livestock combined. The decision was made to include
farming types 43, 71 and 81 (and not only 41) in the sample so as to cover a larger
share of dairy cows, particularly in the new Member States.37
– A structural specialisation rate38
greater than 40 %. This criterion has been introduced
to make the sample of specialised farms more stable over years and therefore ensure
better comparability of results over time.39
37 See Table 5.
38 Structural specialisation rate: the potential contribution of the ‘cattle, dairying pole’ (as defined by
Commission Regulation (EC) No 1242/2008 establishing a Community typology for agricultural
holdings) to the total production of the farm i.e. the share of the milk sector in the total Standard
Output.
39 The comparability of results over time is however also affected by the extrapolating factors: as FADN
is a sample survey, the collected data need to be extrapolated against the population of farms reported
under the Farm Structure Survey (FSS). A new FSS is carried every three years and takes the form of a
census every ten years. Due to this update in the population used for extrapolation, the weight of a
given farm remaining in the sample may change quite significantly, thus affecting the average results
(in some Member States there appears to be a break in time series for structural information between

EU Dairy farms report 2013
51
– An actual specialisation rate40
greater than 35 %. This criterion has been kept41
to
make sure that in reality, milk production remains the main activity of the holding.
– A share of sales of milk and milk products in the milk output higher than 50 %.
– An average milk price at farm level of less than 900 EUR/t of milk, in order to
exclude farms producing buffaloes’ milk. These farms are mainly located in the two
Italian regions Lazio and Campania, essentially for the production of ‘Mozzarella di
buffala’. It was decided to exclude them because of their major differences in terms of
milk yield, price, costs and margins.
Moreover, given the use of different ratios for the allocation keys,42
some precautions are
necessary in order to prevent problems with estimates:
– Total output and total output plus subsidies should be strictly positive.
– Total output plus subsidies should be greater than milk output plus subsidies.
– Total output should be greater than milk output.43
Farms that do not meet these conditions are excluded from the sample used to estimate costs
and margins.
The results are presented in EUR/t of milk. They are the so-called ‘global ratio’, i.e. they
are obtained by dividing the average revenues, costs or margin in the Member State (or
region) by the average quantity of milk produced in that Member State (or region) (and
not by the weighted average of the individual ratio by farm).
2008 — extrapolated with FSS 2007 — and 2009 — extrapolated with FSS 2010). However,
extrapolating with the newest FSS population is deemed to provide more precise, actual results for the
most recent years, which is what matters for the purpose of this report.
40 Actual specialisation rate: the share of milk output and subsidies in total output and coupled subsidies
(forage farm use deducted) as reported in the farm accounts.
41 Although its threshold has been lowered (from 50 % to 35 %) as compared with the previous editions
of this report.
42 Allocation keys: dairy livestock units as a proportion of grazing livestock units, dairy livestock units as
a proportion of total livestock units, milk output and subsidies as a proportion of total output and
coupled subsidies, milk output as a proportion of total output.
43 The number of dairy cows and of grazing livestock units must also be greater than 0.
EU Dairy farms report 2013
52
Methodology 2
Estimation of imputed unpaid family factor costs — Method
Family labour cost: this is estimated on the basis of the wages which the owner
of the farm would have to pay to hire employees to do the work carried out by family
members.
It is estimated as the average regional wage per hour obtained in the FADN database44
multiplied by the number of hours worked by family workers on the farm.
It is commonly acknowledged that the number of hours of family workers is sometimes
overestimated. Thus the method uses a maximum of 3 000 hours per Annual Work Unit
(this is the equivalent of 8.2 hours a day, 365 days a year, and corresponds more or less
to the time that can be spent on a farm by dairy farmers).45
Using hours makes it possible to remunerate a manager more than an employee for
working more hours.
It is challenging to calculate a reliable estimate because records of hours worked on the
farm might be overestimated and it is not easy to determine what an appropriate
remuneration for family labour is. Farmers may indeed agree to be remunerated less than
they would be according to the average agricultural wage. They may consider farming a
way of life or benefit from other sources of income for their household (other gainful
activities directly related to the holding, spouse working outside the farm, etc.).
Own capital cost
– Own land cost: this is estimated on the basis of the rent that the owner of the
farm would have to pay if the land were rented instead of owned.
It is estimated as the owned area multiplied by the rent paid per ha on the same
farm or, if there is no rented land on the farm, by the average rent paid per ha in the
same region and for the same type of farming.46
– Cost of own capital (other than land): the cost of own capital (permanent
crops, buildings, machinery and equipment, forest land, livestock and crop
stocks) is estimated at its opportunity cost. That is how much money the farmer
could gain from investing the equivalent of its capital value in a bank.
The interest paid on the capital is not known, as this information is optional in the FADN
farm return. Nevertheless, to take into account the actual interest rate paid on the farm, a
‘weighted’ interest rate is calculated as the weighted average of this interest rate for debts
44 If there are not enough farms (fewer than 20) with paid labour at regional level, the national average is
taken into account.
45 A constraining factor of the estimation method is that if a farmer receiving a salary would probably
work less.
46 If there are not enough farms (fewer than 20) in a given region for a type of farming, the national rent
per hectare for the given type of farming is used (the TF8 classification is used).

EU Dairy farms report 2013
53
and the long term interest rate taken from the Global Insight database for the net worth. It
should be noted that if the ‘weighted’ interest rate is lower than the LT interest rate
(which means that the calculated rate of interest paid is lower than the LT interest rate),
the LT interest rate is used instead of the ‘weighted’ interest rate.
In the end, the own capital value (excluding land and land improvement) is estimated as
the average value of the assets (closing plus opening valuation divided by 2) multiplied
by the real interest rate.47
The correction is made by subtracting the inflation rate48
from
the nominal interest rate. A condition is applied to avoid negative real interest rates.
The total circulating capital is not valued because of the unreliability of this variable in
some Member States. Nevertheless, the crop stock value is taken into account.
To calculate the unpaid capital costs, in order to avoid double counting, we have to
deduct the interest paid from the sum of the own land cost and the cost of own capital
except land:
Imputed unpaid capital costs = own land cost + estimated cost for own capital except
land — interest paid (when interest paid is lower than the sum of own land and own
capital costs).
The total cost of imputed unpaid family factors is then the sum of family labour costs
and unpaid capital costs:
Imputed unpaid family factors = family labour cost + unpaid capital costs
Or
Imputed unpaid family factors = family labour cost + (own land cost + estimated cost for
own capital other than land – interest paid)
47 The increase in the value of assets is excluded from income calculations. For example, land
appreciates in value over time, which is one of the reasons why investors invest in land. This gain is
not included in income; therefore it would not be consistent to include it in the cost of capital. In
addition, in the FADN, assets are valued at replacement value. Depreciation is based on this
replacement value and therefore already takes into account the increase in prices (inflation).
Consequently, it would be double counting to include the inflation part of interest in the cost of
capital.
48 The inflation rate is based on the Eurostat annual average rate of change in Harmonised Indices of
Consumer Prices (HICPs) — available from 1997. Inflation rates based on price indexes of GDP and
gross fixed capital consumption have been tested, but they are very high and were leading to very high
negative costs for capital, mainly in the EU-10. An inflation rate calculated on the basis of price
indexes for gross fixed capital consumption has been tested, as it seemed to be more closely related to
assets. However, this rate has fluctuated widely over the years for certain Member States. In addition,
land is one of the most important assets which does not depreciate. Therefore the inflation rate of gross
fixed capital consumption must not have a closer relationship with the change in the price of
agricultural assets than with the consumer price indices.
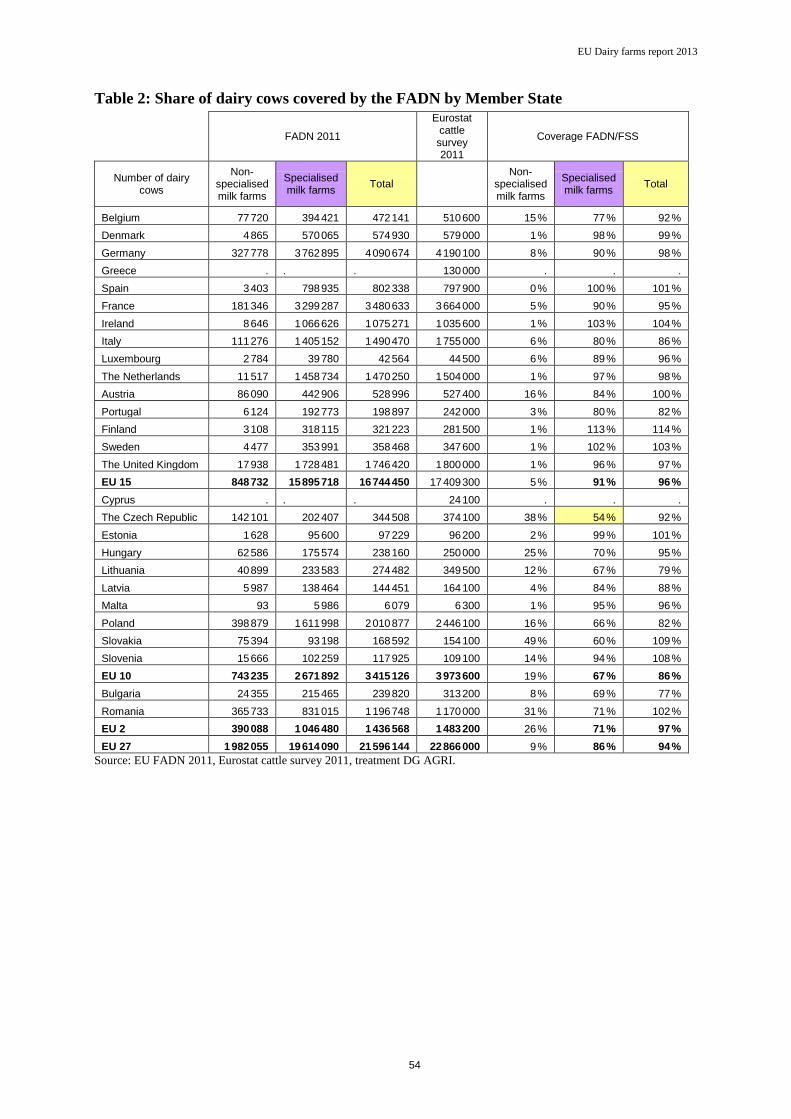
EU Dairy farms report 2013
54
Table 2: Share of dairy cows covered by the FADN by Member State
FADN 2011
Eurostat cattle survey 2011
Coverage FADN/FSS
Number of dairy cows
Non-specialised milk farms
Specialised milk farms
Total Non-
specialised milk farms
Specialised milk farms
Total
Belgium 77 720 394 421 472 141 510 600 15 % 77 % 92 %
Denmark 4 865 570 065 574 930 579 000 1 % 98 % 99 %
Germany 327 778 3 762 895 4 090 674 4 190 100 8 % 90 % 98 %
Greece . . . 130 000 . . .
Spain 3 403 798 935 802 338 797 900 0 % 100 % 101 %
France 181 346 3 299 287 3 480 633 3 664 000 5 % 90 % 95 %
Ireland 8 646 1 066 626 1 075 271 1 035 600 1 % 103 % 104 %
Italy 111 276 1 405 152 1 490 470 1 755 000 6 % 80 % 86 %
Luxembourg 2 784 39 780 42 564 44 500 6 % 89 % 96 %
The Netherlands 11 517 1 458 734 1 470 250 1 504 000 1 % 97 % 98 %
Austria 86 090 442 906 528 996 527 400 16 % 84 % 100 %
Portugal 6 124 192 773 198 897 242 000 3 % 80 % 82 %
Finland 3 108 318 115 321 223 281 500 1 % 113 % 114 %
Sweden 4 477 353 991 358 468 347 600 1 % 102 % 103 %
The United Kingdom 17 938 1 728 481 1 746 420 1 800 000 1 % 96 % 97 %
EU 15 848 732 15 895 718 16 744 450 17 409 300 5 % 91 % 96 %
Cyprus . . . 24 100 . . .
The Czech Republic 142 101 202 407 344 508 374 100 38 % 54 % 92 %
Estonia 1 628 95 600 97 229 96 200 2 % 99 % 101 %
Hungary 62 586 175 574 238 160 250 000 25 % 70 % 95 %
Lithuania 40 899 233 583 274 482 349 500 12 % 67 % 79 %
Latvia 5 987 138 464 144 451 164 100 4 % 84 % 88 %
Malta 93 5 986 6 079 6 300 1 % 95 % 96 %
Poland 398 879 1 611 998 2 010 877 2 446 100 16 % 66 % 82 %
Slovakia 75 394 93 198 168 592 154 100 49 % 60 % 109 %
Slovenia 15 666 102 259 117 925 109 100 14 % 94 % 108 %
EU 10 743 235 2 671 892 3 415 126 3 973 600 19 % 67 % 86 %
Bulgaria 24 355 215 465 239 820 313 200 8 % 69 % 77 %
Romania 365 733 831 015 1 196 748 1 170 000 31 % 71 % 102 %
EU 2 390 088 1 046 480 1 436 568 1 483 200 26 % 71 % 97 %
EU 27 1 982 055 19 614 090 21 596 144 22 866 000 9 % 86 % 94 %
Source: EU FADN 2011, Eurostat cattle survey 2011, treatment DG AGRI.
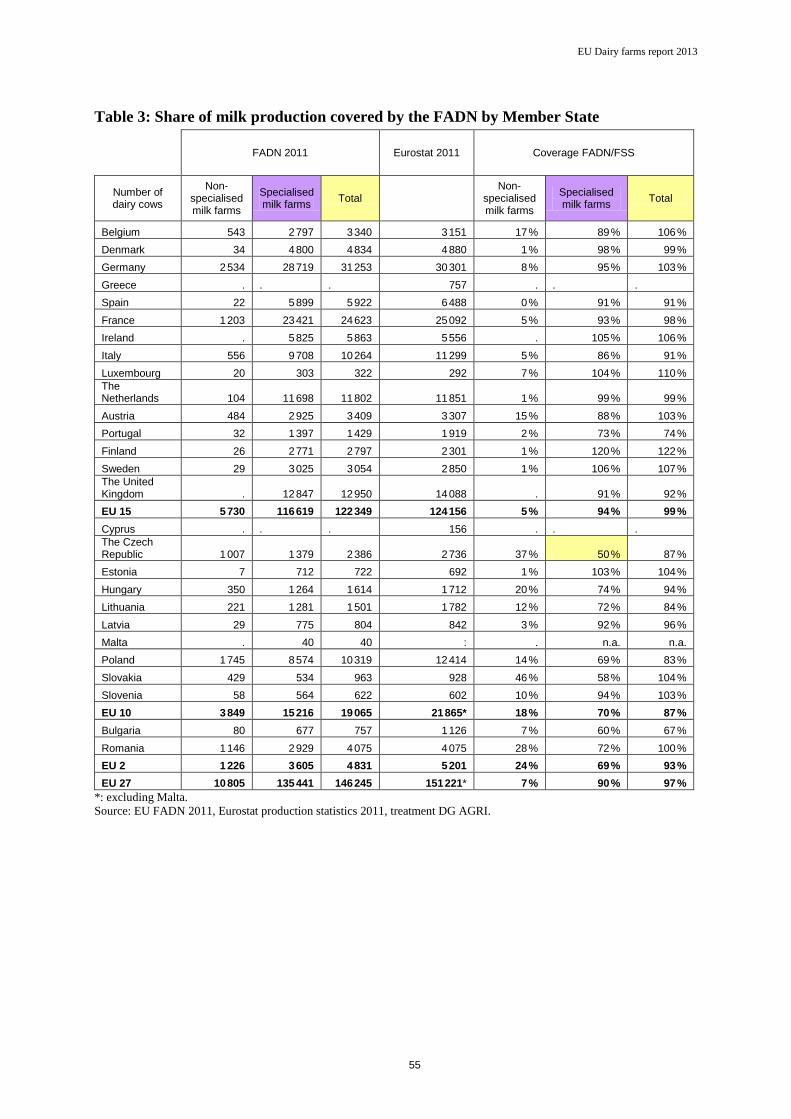
EU Dairy farms report 2013
55
Table 3: Share of milk production covered by the FADN by Member State
FADN 2011 Eurostat 2011 Coverage FADN/FSS
Number of dairy cows
Non-specialised milk farms
Specialised milk farms
Total Non-
specialised milk farms
Specialised milk farms
Total
Belgium 543 2 797 3 340 3 151 17 % 89 % 106 %
Denmark 34 4 800 4 834 4 880 1 % 98 % 99 %
Germany 2 534 28 719 31 253 30 301 8 % 95 % 103 %
Greece . . . 757 . . .
Spain 22 5 899 5 922 6 488 0 % 91 % 91 %
France 1 203 23 421 24 623 25 092 5 % 93 % 98 %
Ireland . 5 825 5 863 5 556 . 105 % 106 %
Italy 556 9 708 10 264 11 299 5 % 86 % 91 %
Luxembourg 20 303 322 292 7 % 104 % 110 %
The Netherlands 104 11 698 11 802 11 851 1 % 99 % 99 %
Austria 484 2 925 3 409 3 307 15 % 88 % 103 %
Portugal 32 1 397 1 429 1 919 2 % 73 % 74 %
Finland 26 2 771 2 797 2 301 1 % 120 % 122 %
Sweden 29 3 025 3 054 2 850 1 % 106 % 107 %
The United Kingdom . 12 847 12 950 14 088 . 91 % 92 %
EU 15 5 730 116 619 122 349 124 156 5 % 94 % 99 %
Cyprus . . . 156 . . .
The Czech Republic 1 007 1 379 2 386 2 736 37 % 50 % 87 %
Estonia 7 712 722 692 1 % 103 % 104 %
Hungary 350 1 264 1 614 1 712 20 % 74 % 94 %
Lithuania 221 1 281 1 501 1 782 12 % 72 % 84 %
Latvia 29 775 804 842 3 % 92 % 96 %
Malta . 40 40 : . n.a. n.a.
Poland 1 745 8 574 10 319 12 414 14 % 69 % 83 %
Slovakia 429 534 963 928 46 % 58 % 104 %
Slovenia 58 564 622 602 10 % 94 % 103 %
EU 10 3 849 15 216 19 065 21 865* 18 % 70 % 87 %
Bulgaria 80 677 757 1 126 7 % 60 % 67 %
Romania 1 146 2 929 4 075 4 075 28 % 72 % 100 %
EU 2 1 226 3 605 4 831 5 201 24 % 69 % 93 %
EU 27 10 805 135 441 146 245 151 221* 7 % 90 % 97 %
*: excluding Malta.
Source: EU FADN 2011, Eurostat production statistics 2011, treatment DG AGRI.

EU Dairy farms report 2013
56
Table 4: Share of milk production by Member State in the FADN 2011
Member State Share of milk production 2011
Belgium 2 %
Denmark 3 %
Germany 21 %
Greece -
Spain 4 %
France 17 %
Ireland 4 %
Italy 7 %
Luxembourg 0 %
The Netherlands 8 %
Austria 2 %
Portugal 1 %
Finland 2 %
Sweden 2 %
The United Kingdom 9 %
EU 15 84 %
Cyprus 0 %
The Czech Republic 2 %
Estonia 0 %
Hungary 1 %
Lithuania 1 %
Latvia 1 %
Malta 0 %
Poland 7 %
Slovakia 1 %
Slovenia 0 %
EU 10 13 %
Bulgaria 0 %
Romania 3 %
EU 2 3 %
EU 27 100 %
Source: EU FADN — DG AGRI.
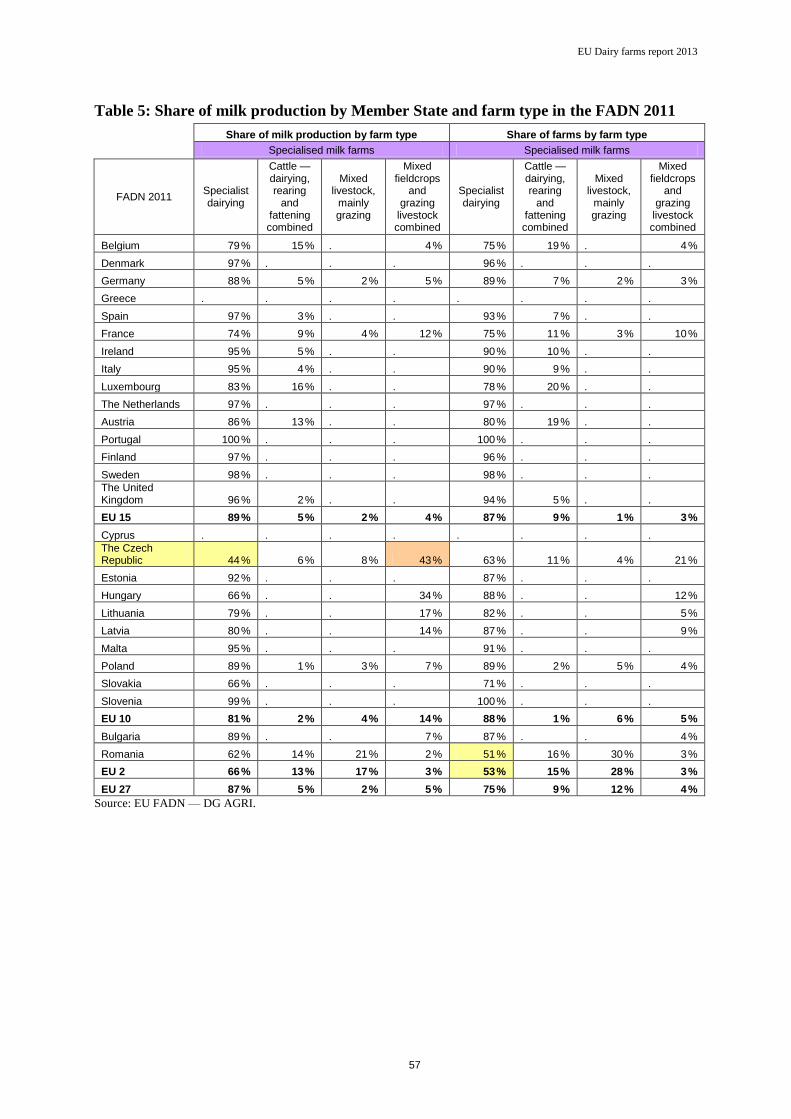
EU Dairy farms report 2013
57
Table 5: Share of milk production by Member State and farm type in the FADN 2011
Share of milk production by farm type Share of farms by farm type
Specialised milk farms Specialised milk farms
FADN 2011 Specialist dairying
Cattle — dairying, rearing
and fattening combined
Mixed livestock,
mainly grazing
Mixed fieldcrops
and grazing
livestock combined
Specialist dairying
Cattle — dairying, rearing
and fattening combined
Mixed livestock,
mainly grazing
Mixed fieldcrops
and grazing
livestock combined
Belgium 79 % 15 % . 4 % 75 % 19 % . 4 %
Denmark 97 % . . . 96 % . . .
Germany 88 % 5 % 2 % 5 % 89 % 7 % 2 % 3 %
Greece . . . . . . . .
Spain 97 % 3 % . . 93 % 7 % . .
France 74 % 9 % 4 % 12 % 75 % 11 % 3 % 10 %
Ireland 95 % 5 % . . 90 % 10 % . .
Italy 95 % 4 % . . 90 % 9 % . .
Luxembourg 83 % 16 % . . 78 % 20 % . .
The Netherlands 97 % . . . 97 % . . .
Austria 86 % 13 % . . 80 % 19 % . .
Portugal 100 % . . . 100 % . . .
Finland 97 % . . . 96 % . . .
Sweden 98 % . . . 98 % . . .
The United Kingdom 96 % 2 % . . 94 % 5 % . .
EU 15 89 % 5 % 2 % 4 % 87 % 9 % 1 % 3 %
Cyprus . . . . . . . .
The Czech Republic 44 % 6 % 8 % 43 % 63 % 11 % 4 % 21 %
Estonia 92 % . . . 87 % . . .
Hungary 66 % . . 34 % 88 % . . 12 %
Lithuania 79 % . . 17 % 82 % . . 5 %
Latvia 80 % . . 14 % 87 % . . 9 %
Malta 95 % . . . 91 % . . .
Poland 89 % 1 % 3 % 7 % 89 % 2 % 5 % 4 %
Slovakia 66 % . . . 71 % . . .
Slovenia 99 % . . . 100 % . . .
EU 10 81 % 2 % 4 % 14 % 88 % 1 % 6 % 5 %
Bulgaria 89 % . . 7 % 87 % . . 4 %
Romania 62 % 14 % 21 % 2 % 51 % 16 % 30 % 3 %
EU 2 66 % 13 % 17 % 3 % 53 % 15 % 28 % 3 %
EU 27 87 % 5 % 2 % 5 % 75 % 9 % 12 % 4 %
Source: EU FADN — DG AGRI.

EU Dairy farms report 2013
58
ANNEX II
Results by EU group, Member State and region.
Data as of 27/03/2014.

