european mineral statistics 2010-14 - bgs.ac.uk
TRANSCRIPT
European MineralStatistics
2010–14


BRITISH GEOLOGICAL SURVEY
European Mineral Statistics 2010–14 A product of the World Mineral Statistics database
By: T J Brown, S F Hobbs, N E Idoine, A J Mills, C E Wrighton and E R Raycraft
Additional production statistics by: T Bide, E A Deady and J Rippingale
Technical support: A C MacKenzie
Keyworth, Nottingham British Geological Survey 2016

ii
© NERC copyright 2016. All rights reserved. First Published 2016
BRITISH GEOLOGICAL SURVEY
Keyworth, Nottingham NG12 5GG 0115-936 3100
Murchison House, West Mains Road, Edinburgh EH9 3LA 0131-667 1000
London Information Office, Natural History Museum (Earth Galleries), Exhibition Road, London SW7 2DE. 020-7589 4090
The full range of Survey publications is available from the BGS Sales Desks at Nottingham, Edinburgh and London; see contact details above or shop online at www.geologyshop.com.
The London Information Office also maintains a reference collection of BGS publications, including maps, for consultation.
The Survey publishes an annual catalogue of its maps and other publications; this catalogue is available from any of the BGS Sales Desks.
The British Geological Survey carries out the geological survey of Great Britain and Northern Ireland (the latter as an agency service for the government of Northern Ireland), and of the surrounding continental shelf, as well as its basic research projects. It also undertakes programmes of British technical aid in geology in developing countries as arranged by the Department for International Development.
The British Geological Survey is a component body of the Natural Environment Research Council.
All communications regarding the content of this publication should be addressed to the Head of Science, Minerals, British Geological Survey, Keyworth, Nottingham NG12 5GG 0115 936 3495 Fax 0115 936 3520 E-mail [email protected]
The compilations presented in this book are copyright and may not be reproduced in any form without the permission of the Director, British Geological Survey.
Bibliographical reference BRITISH GEOLOGICAL SURVEY. 2016. European mineral statistics 2010–14. (Keyworth, Nottingham: British Geological Survey.)
Cover photograph: The recently opened Drakelands Mine, near Hemerdon, United Kingdom operated by Wolf Minerals Ltd. This world-class tungsten and tin mine was officially opened during a ceremony on 17 September 2015 and has a production capacity greater than 3,000 tpa of tungsten concentrate. © Wolf Minerals Ltd. (used with permission)
ISBN 978-0-85272-858-1 (Paperback) ISBN 978-0-85272-859-8 (Download)

iii
Commentary 1. Introduction Europe’s relatively restricted land mass has a remarkable variety of geological terranes. It includes ancient crystalline ‘shields’ and massifs, complex younger fold-belts penetrated by igneous intrusions, deep sedimentary basins containing coal, petroleum and other minerals, and landscapes profoundly modified by a recent ice age. As a consequence Europe has a rich endowment of all the major groups of minerals. In the nineteenth century the continent’s burgeoning industrial economies were built on its resources of metals and coal. The productive capacity of those resources was, with some exceptions, largely outgrown in the twentieth century but Europe continues to obtain a high proportion of its needs for industrial and construction minerals from within its own borders. In addition, a recent bonanza has been the discovery and exploitation of the offshore resources of petroleum and natural gas beneath the North Sea and other areas of the continental shelf.
During the industrial revolution of the eighteenth and nineteenth centuries the interest of sovereign states in their own economic and demographic performance led to the development of statism, that is, the direction and control of their internal affairs to a much greater degree than before. From statism came the concept of statistics – the numbers collected and compiled as the basis for such action by the state. Among many other things, almost all European countries compile annual statistics of national mineral production and trade and these form the basis of this European compilation1.
For many countries, from antiquity, the ownership of precious metals has been vested in the state or the sovereign and for the majority of European countries state ownership extends to all metals and high-value industrial minerals. Chiefly as a result, in Europe and the world as a whole, there is a direct correspondence between the unit value of a mineral commodity and the amount and accuracy of official statistical information available on it. At the extreme high end of the value range this relationship tends to break down so that data on gemstones and precious metals is less straightforward than that on base metals. However, as a rule the state does not claim ownership of low-value construction minerals, such as sand and gravel, crushed rock aggregate and others. Partly as a consequence, the statistics for such minerals tend to be less comprehensive, less reliable and more difficult to compile and compare than those for other minerals. It is ironic that with modern environmental concerns and pressures on land-use in Europe it is precisely these less well-documented minerals – their occurrence, production, trade and consumption – that are of greatest concern to local and national governments.
As far as possible, the statistics of production compiled by the BGS are the official data for the countries concerned, whose government departments and agencies compile and publish them on the basis of returns from annual, or more frequent, inquiries in the form of mandatory questionnaires to producers. Trade statistics published by BGS are invariably compiled, directly or indirectly, from official publications. Where official production data are not available, or where there is reasonable cause to doubt the accuracy or completeness of such data, information is sought from other sources such as geological survey organisations, chambers of mines, universities, trade associations and the primary producers themselves. Time and resources preclude double-checking in any but the most necessary of cases.
An increasing problem, particularly in Europe, is the invocation of rules that debar a government body from divulging national production data if there is only a small number of producers, the object being the maintenance of commercial confidentiality. However, we often find in such cases that the primary producers themselves are willing to release the information for publication. A further issue lies in the desire of governments, everywhere, to recover costs by asking for payment for official information – 1 For this compilation ‘Europe’ is defined as the 28 EU members (as of 1 July 2013), the EU associates Norway and Switzerland and the EU candidate countries Albania, Iceland, Macedonia, Montenegro, Serbia and Turkey; this group of 36 countries is for convenience referred to as ‘EU36’.
iv
which is often marketed through an agent. This situation is coupled with an increasing apparent disregard for the value (as distinct from the price) of impartial mineral statistics and a conviction that their compilation should be funded entirely by the users of the data, or by the industrial sector concerned. It is true that no other industrial sector has a statistical operation wholly dedicated to its physical (as opposed to financial) activities. The reason is that no other industrial sector is so crucial to the maintenance of civilisation and so little understood by the population at large.
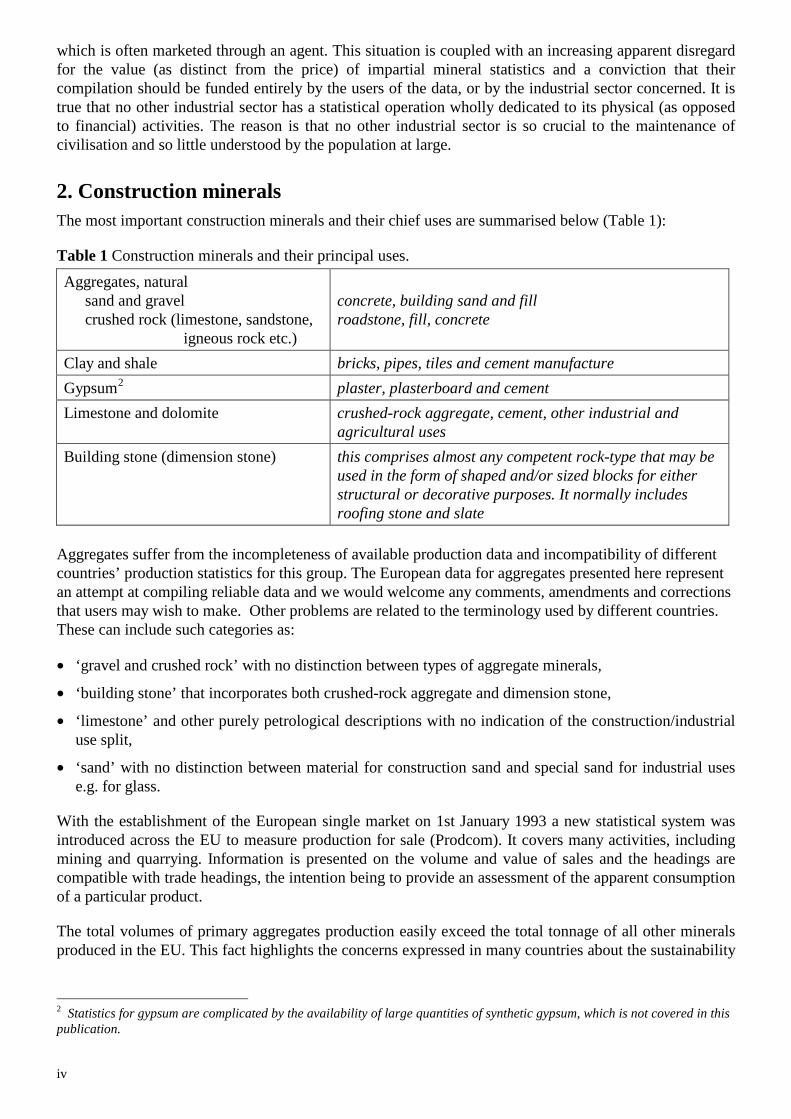
2. Construction minerals The most important construction minerals and their chief uses are summarised below (Table 1):
Table 1 Construction minerals and their principal uses. Aggregates, natural sand and gravel crushed rock (limestone, sandstone, igneous rock etc.)
concrete, building sand and fill roadstone, fill, concrete
Clay and shale bricks, pipes, tiles and cement manufacture Gypsum2 plaster, plasterboard and cement Limestone and dolomite crushed-rock aggregate, cement, other industrial and
agricultural uses Building stone (dimension stone) this comprises almost any competent rock-type that may be
used in the form of shaped and/or sized blocks for either structural or decorative purposes. It normally includes roofing stone and slate
Aggregates suffer from the incompleteness of available production data and incompatibility of different countries’ production statistics for this group. The European data for aggregates presented here represent an attempt at compiling reliable data and we would welcome any comments, amendments and corrections that users may wish to make. Other problems are related to the terminology used by different countries. These can include such categories as:
• ‘gravel and crushed rock’ with no distinction between types of aggregate minerals,
• ‘building stone’ that incorporates both crushed-rock aggregate and dimension stone,
• ‘limestone’ and other purely petrological descriptions with no indication of the construction/industrial use split,
• ‘sand’ with no distinction between material for construction sand and special sand for industrial uses e.g. for glass.
With the establishment of the European single market on 1st January 1993 a new statistical system was introduced across the EU to measure production for sale (Prodcom). It covers many activities, including mining and quarrying. Information is presented on the volume and value of sales and the headings are compatible with trade headings, the intention being to provide an assessment of the apparent consumption of a particular product.
The total volumes of primary aggregates production easily exceed the total tonnage of all other minerals produced in the EU. This fact highlights the concerns expressed in many countries about the sustainability
2 Statistics for gypsum are complicated by the availability of large quantities of synthetic gypsum, which is not covered in this publication.

v
of the resource, both in terms of tonnage remaining and also the land-use and environmental issues that are raised by the implicit need for the expansion of quarries to maintain the level of output.
All European countries consume construction minerals, generally in proportion to the size of their individual economies. The majority of the EU member countries are self-sufficient in supply of aggregate minerals but while some produce approximately equal quantities of sand and gravel and crushed rock aggregates others are, for obvious geological and topographic reasons, deficient in one or the other. For example, Netherlands lacks resources suitable for the production of hard rock aggregates while Austria, landlocked and without broad alluvial lowlands, is a net importer of sand and gravel. Simple statistical analysis, especially if only ‘gross’ national trade positions are examined, can be misleading: aggregates are low-cost minerals and are, as a result, sensitive to transport costs. They may be imported via a short cross-border route at lower cost than if they were carried a much greater distance within national borders.
For countries bordering the North Sea production of marine-dredged sand and gravel is a significant part of supply. Crushed rock produced from onshore sites is also conveyed by sea from Norway and Scotland.
It should also be borne in mind that recycled and secondary aggregates have become an increasingly important part of supply, in response to environmental constraints on the production of primary (quarried) material. The categorisation of these recycled and secondary aggregates varies from country to country and these materials are not included in this volume.
3. Industrial (non-construction) minerals These comprise a wide range of non-metallic, non-energy minerals used as feedstocks for manufacturing or industrial processing aids, exemplified by barytes, fluorspar, magnesite, kaolin (china clay), mica, and salt. The category includes metallic minerals used for non-metallic products, e.g. bauxite, chromite, ilmenite and also ‘construction minerals’ used for non-construction purposes, e.g. limestone. Unlike metals, where, whatever the extracted ore, the ultimate refined marketable product is produced to a few accepted standards for use in a variety of applications, industrial minerals depend to a great extent on their intrinsic ‘as mined’ physical and chemical qualities. Thus, for industrial minerals the two most significant variables are the grade of the deposit, that is how much useful mineral it contains, and the quality of the mineral, that is its suitability for specific end-uses. The quality may be a combination of physical properties such as particle size and shape, brightness, viscosity in suspension, specific gravity, hardness, strength and insulating properties. Several industrial minerals are valued purely for their chemical composition, for example, the essential plant nutrients potassium and phosphorus or the halogens chlorine and fluorine and many other elements used as chemical feedstocks.
It has been suggested that the point at which the value of a country’s industrial mineral production (including construction minerals) overtakes that of its metal (mine) production marks its transition to a mature industrial economy. Certainly this point was attained long ago for the major economies of Europe: the value of metal production in France, Germany, Italy and the UK is negligible compared to the value of industrial minerals output.
A problem for the compiler of statistics on industrial minerals is that many of them cannot be precisely defined, but grade into one another. Thus, kaolin grades into kaolinitic clay, bauxite into high-alumina clay, dolomite into limestone, and this has implications for the comparability of statistics between deposits and countries. Many industrial minerals are produced and marketed in either a ‘wet’, ‘dried’ or ‘calcined’ forms; this can markedly affect the weight of the material. In this compilation every effort has been made to ensure comparability between countries in this respect. Some mineral-derived elements may be obtained by a number of mineral-based but different routes: sulphur is obtained, in Europe, as a by-product from oil refining, from sour gas, from base metal smelting and as a primary product from pyrites

vi
(iron sulphide). Some semi-processed materials3 can be obtained from completely different sources, for example magnesia (magnesium oxide), which is produced from both magnesite and a combination of seawater and dolomite. Salt is a further example, being extracted as a solid (rock salt), as brine and by the evaporation of seawater.
European production of industrial minerals4 supplies a fairly high proportion of the continent’s requirements, in contrast to the position with metals. However, in the cases of several minerals, production is dominated by one country and the majority are still dependent on imports for all but a few of these minerals. The proportions of selected minerals produced by Europe are given in Table 2.
Table 2 EU36 production of selected industrial minerals as world percentages Industrial mineral % of world EU36 countries with >2% of world output in 2014 Feldspar 59.5 Turkey (30.1%), Italy, Spain, France Kaolin 32.6 Germany (16.5%), UK, Turkey, Czech Republic Salt 19.5 Germany (3.9%), Netherlands, France Diatomite 19.5 Denmark (5.2%), France, Turkey, Spain, Germany Bentonite 17.9 Greece (6.2%), Turkey, Germany Gypsum 20.3 Turkey (5.5%), Italy, Spain Talc 13.9 Finland (4.6%), France Potash 12.0 Germany (8.0%), Spain Magnesite 11.6 Turkey (5.5%) Mica 11.1 France (5.9%), Finland Barytes 5.4 Turkey (3.7%) Fluorspar 5.4 Spain (2.2%)
4. Metals Until the middle of the nineteenth century the demands of industry in Europe were met by indigenous metal mines but thereafter it became clear that the resources of other continents would become an important source of supply, having, as they did, very large and rich ore bodies that could be worked at relatively low cost. Initially, ores and concentrates were transported to Europe for processing. Many high-volume ores, notably iron ore, are still imported but smelting and refining of base metal concentrates has been increasingly undertaken at or near the sites of the overseas mines. Europe as a whole is now heavily dependent on extra-European sources of virtually all metals although recycling makes an important contribution and, as the statistical tables show, several European countries still have significant mine production of one or more metals.
European smelting and refining of imported ores and concentrates provides the bulk of supply for many metals. Refining in Europe of semi-processed materials from other continents is also significant. Ferro-alloys of a number of metals are produced in Europe but imports of the major types are an indispensable
3In the case of several oxides, hydroxides and salts the yardstick for inclusion in this compilation is that the material should be the basis for a further transformation process although the compilers accept that this criterion has been applied in a flexible way. 4 The tabulated statistics show that availability of reported data is much lower for industrial minerals than for metals, with many estimated totals being shown.

vii
part of total supply. The balance of metals supply is made up of imports of refined metal. It is emphasised that the situation of individual countries may vary widely from one to another, as the statistics indicate.
Certain European countries are major mine producers of particular metals, but the majority of European countries depend chiefly on imports from other continents. The overall EU36 position of mine production of selected metals in 2014 is shown in Table 3.
Table 3 EU36 mine production of selected metals as world percentages. Metal % world EU36 countries with >1% of world output in 2014 Chromium 19.4 Turkey (13.7%), Finland, Albania Silver 8.1 Poland (5.0%), Sweden Zinc 7.3 Ireland (2.1%), Sweden, Turkey Titanium 6.6 Norway (6.6%) Lead 6.4 Poland (1.5%), Sweden, Turkey Copper 5.5 Poland (2.3%) Tungsten 2.9 Spain (1.2%), Austria Nickel 2.8 Greece (1.0%) Gold 1.9 Turkey (1.0%) Iron 1.7 Sweden (1.1%)
5. Energy minerals These comprise petroleum, natural gas, coal and uranium. Statistics for production and trade of petroleum and coal are fairly complete and present few problems to compilers. However, the data for petroleum conceal the distribution of differing grades of crude oil. For example, although there are exports of petroleum from the EU36 countries, there is also a significant import of heavy crude which is a necessary requirement that cannot be supplied by the North Sea and other offshore fields.
‘Black coal’ or ‘hard coal’ is normally taken to mean bituminous coal and anthracite. ‘Brown coal’ comprises sub-bituminous coal and lignite. Black coals have a higher calorific value and lower volatile content than brown coals; the use of the latter is almost confined to burning in electricity generating stations. Within black coals a fundamental division is made into ‘steam coal’, for power generation, and ‘coking coal’, used for metallurgical purposes, predominantly iron smelting in blast furnaces.
The overall EU36 position with regard to production of energy minerals in 2014 is shown in Table 4.
Table 4 EU36 production of energy minerals as world percentages.
Mineral % world EU36 countries with > 1% of world output 2014
Coal 7.7 Germany (2.3%), Poland, Turkey
Natural gas 7.3 Norway (3.0%), Netherlands, United Kingdom
Petroleum 4.0 Norway (2.2%)

viii
Contents
Country index Albania 2 Lithuania 76 Austria 4 Luxembourg 79 Belgium 9 Macedonia 81 Bulgaria 15 Malta 83 Croatia 19 Montenegro 84 Cyprus 22 Netherlands 86 Czech Republic 24 Norway 92 Denmark 29 Poland 96 Estonia 33 Portugal 101 Finland 36 Romania 105 France 41 Serbia 109 Germany 47 Slovakia 112 Greece 54 Slovenia 116 Hungary 58 Spain 120 Iceland 62 Sweden 127 Ireland, Republic of 64 Switzerland 132 Italy 67 Turkey 136 Latvia 73 United Kingdom 141
Commodity index Aggregates 150 Manganese 277 Alumina 156 Mercury 281 Aluminium 157 Mica 283 Antimony 167 Molybdenum 286 Arsenic 169 Natural gas 297 Asbestos 170 Nepheline syenite 358 Barytes 171 Nickel 288 Bauxite 155 Niobium 334 Bentonite 174 Perlite 358 Bismuth 178 Petroleum 294 Borates 358 Phosphates 300 Bromine 179 Platinum 302 Cadmium 180 Potash 306 Cement 183 Pyrites 325 Chromium 190 Rare earths 311 Coal 194 Rheneium 359 Cobalt 201 Salt 314 Copper 214 Sand and gravel 150 Crushed rock 150 Selenium 359 Diamond 214 Silicon 246 Diatomite 218 Sillimanite 318 Feldspar 221 Silver 320 Ferro alloys 246 Strontium 360 Fluorspar 224 Sulphur 325 Fuller’s earth 174 Talc 331 Gold 227 Tantalum 334 Graphite 231 Tellurium 360 Gypsum 234 Tin 335 Iodine 239 Titanium 339 Iron ore 241 Tungsten 344 Iron and steel 244 Uranium 360 Kaolin 262 Vanadium 348 Lead 265 Wollastonite 361 Lithium 271 Zinc 349 Magnesia 273 Zirconium 356 Magnesite 277
Explanatory notes
The statistics in this publication are from the World Mineral Statistics database.
Coverage
European Mineral Statistics covers the majority of economically important, and internationally traded, mineral commodities. For each commodity constant efforts are made to ensure that as many producing and trading countries as possible are reported and that trade data cover all major traded forms. For some commodities, where statistics on production and trade are not publicly available, estimates are made.
Production
Metals Mine production of many metals is expressed in terms of metal content. This is clearly indicated adjacent to the commodity description. Unless otherwise specified, metal production statistics relate to metal recovered from both domestic and imported materials, whether primary or secondary, but exclude remelted material.

ix
Trade
Although every effort has been made to provide comprehensive coverage of trade statistics the resulting trade compilations depend on the nature of the data available. The fact that a country is not shown as trading in a particular commodity does not necessarily imply that there is no trade in that item. The commodity may not be separately identified in the available trade statistics or may not be traded in significant quantities.
Where an estimate for a trade statistic has been reconstructed from the imports/exports of other countries, the resulting figure may be conservative, as complete coverage of world trade is seldom available. Export statistics may include re-exports.
Tables showing trade in the following metals covered by Harmonised System Chapter 81 include under the term ‘metal’, unwrought and wrought forms, powder, alloys, waste and scrap, unless these are separately shown: antimony, bismuth, cadmium, chromium, cobalt, manganese, molybdenum, tantalum–niobium, titanium, tungsten, vanadium and zirconium. Trade tables of other metals include only unwrought forms under the term ‘metal’.
Exclusion of warranty
Use by recipients of information provided by the BGS, is at the recipients’ own risk. BGS has taken care to ensure that information provided is as free from error as is reasonably practical. In view of the disparate sources of information at BGS’s disposal, including such material donated to BGS, that BGS accepts in good faith as being accurate, the Natural Environment Research Council (NERC) gives no warranty, expressed or implied, as to the quality, accuracy, performance, and merchantability of the information supplied, or to the information’s suitability for any use whether made known to BGS or otherwise. NERC/BGS accepts no liability whatever in respect of loss, damage, injury or other occurrence however caused.
Acknowledgements
Compilation of this volume of mineral statistics has been possible only by obtaining information from a very large number of organisations throughout the world, chiefly home and overseas government departments and specialist national or international authorities concerned with particular sectors of the minerals or metals industries. To all these bodies the British Geological Survey expresses its grateful acknowledgement for the information made available, whether in published form or provided by direct correspondence.
Particular acknowledgement is made to the Mines Departments and other government agencies of many countries whose regular statements, yearbooks and other reports are worthy of direct consultations by readers in search of detail.
Specialist commodity organisations which have kindly allowed information to be reproduced include the International Copper Study Group, the International Lead and Zinc Study Group, the International Nickel Study Group, the Barytes Association and the International Fertilizer Industry Association Ltd. In a few instances, information on specific commodities has been obtained directly from company sources. The co-operation of other members of the International Consultative Group on Metal Statistics is also gratefully acknowledged.
Supplementary information is also obtained from publications dealing with a wider range of commodities such as Société de l'Industrie Minérale, Annuaire Statistique Mondial des Minerais et Métaux; World Bureau of Metal Statistics, World Metal Statistics and Metallstatistik; World Mining Data, publications of the Interstate Statistical Committee of the CIS, the United States Geological Survey, and the United Nations Statistics Division.

x
In addition, information has been obtained from the websites of the following organisations, companies, statistical offices and government departments: Agnico Eagle Mines; Altona Mining Ltd; Aluminium de Grece; Belvedere Resources Ltd; BP Plc; Dragon Mining; Endomines; Eurozinc Mining Corporation; First Quantum; Heidelberg Cement; Inmet Mining; Lapland Gold Miners; Lundin Mining; Nevsun; New Boliden; Norsk Hydro; Nyrstar; Outokumpu; Rio Narcea; Rio Tinto; UC Rusal; Talvivaara; Vargön Alloys AB; Xstrata; Energy Information Agency; European Aggregates Association; Eurofer; Eurostat; Kaolin & Plastic Clays Europe; World Nuclear Association; World Steel Association; Vereinigung der Osterreichishen Zementindustrie, Austria; Federation de l’Industrie Cimentiere Belge, Belgium; Statistics Belgium; Belgian Steel Federation; Czech Republic Statistical Office; Statistics Denmark; Danish Energy Agency, Denmark; Geological Survey of Finland; Fédération Française de l'Acier, France; Unicem, France; Infociments, France; Statistisches Bundesamt Deutschland, Germany; R W Silicium, Germany; BEB Erdgas und Erdol, Germany; Verband der Kali und Salzindustrie EV, Germany; National Statistical Service of Greece; Federacciai, Italy; Unione Petrolifera, Italy; Istituto Nazionale di Statistica, Italy; Statec, Luxembourg; Centraal Bureau voor de Statistiek, Netherlands; Netherlands Oil and Gas Portal; Statistisk Sentralbyra, Norway; Geological Survey of Norway; Norwegian Petroleum Directorate; Central Statistical Office of Poland; Polish Geological Institute, Poland; Instituto Nacional de Estatistica, Portugal; Ministry of Agriculture, Portugal; Vimetco, Romania; Statistical Office of the Republic of Slovenia; Unesid, Spain; Sveriges Geologiska Undersokning, Sweden; Jernkontoret, Sweden; Statistiska Centralbyran, Sweden; CemSuisse, Switzerland; Department for Business, Innovation and Skills, United Kingdom; Department of Energy and Climate Change, United Kingdom; Office for National Statistics, United Kingdom; The Crown Estate, United Kingdom.
Units
The Statistics shown in this volume are expressed in metric units. The following factors are given for converting to non-metric units:
tonnes × 0.9842 = long tons tonnes × 1.1023 = short tons kilograms × 2.2046 = pounds kilograms × 32.1507 = troy ounces cubic metres × 35.3147 = cubic feet 1 tonne of crude petroleum equals on average 7 barrels of crude petroleum 1 flask mercury = 34.5 kilograms 1 metric ton unit = 10 kilograms
Conversion of national currencies to pounds sterling has been made using the annual average factors shown for each country in International Financial Statistics published by the International Monetary Fund.
Symbols
... figures not available 0 quantity less than half unit shown — nil * estimated BGS British Geological Survey

xi
Table notes for country tables Aggregates – production (1) So far as possible, these statistics include construction
sands; gravel, pebbles, shingle and flint; crushed stone used for concrete aggregates, roadstone and other construction use; granules, chippings and powders
(2) Where official sources show more than one series for aggregates the higher series has generally been used in this compilation
(3) Where marine sands and gravels have been identified, these are included
(4) Information may be incomplete or absent due to reporting methods, confidentiality or lack of available information. All EU36 countries produce sand and gravel and crushed rock
(5) Production from many small operations are not officially compiled. The minimum number of employees for which establishments are required to report production varies between different countries and can also vary from year to year within a country
(6) Quantities of sand from sand and gravel operations may be discarded due to low demand. This may or may not be included in the statistics
Aggregates – exports and imports (1) These statistics include construction sands; pebbles,
gravel, shingle, flint; crushed rock; granules, chippings and powders covered by the Harmonised System codes 2505.90, 2517.10, 2517.41 and 2517.49
(2) Exports include marine dredged sand and gravel landed at foreign ports
Bauxite – production
(1) Including production of refractory bauxite Alumina – production
(1) Where possible figures show the alumina equivalent (Al2O3) of total hydrate produced, whether or not calcined
(2) The figures represent alumina produced from bauxite. Alumina-rich materials can also be derived from salt slags formed during the production of secondary aluminium
Primary aluminium – production (1) The figures are for primary aluminium only.
Aluminium can also be produced from secondary sources and may be recovered from salt slags
Bauxite, alumina and aluminium – exports and imports
(1) Except where alumina hydrate is separately specified, national trade figures for alumina can be considered as inclusive of hydrate
(2) The term 'unwrought' aluminium corresponds to item 7601 of the Harmonised System and comprises ingots, blocks, unwrought bars, etc.
(3) Metal traded in ferro-alloy form is included under Iron, Steel and Ferro-alloys
Antimony – mine production (1) Including antimony content of antimonial lead alloys White arsenic – production (1) Including calculated trioxide equivalent of arsenic
metal produced except where this would involve double counting
Arsenic – exports and imports (1) Data relating to arsenic are not fully recorded by many
countries Barytes – production (1) Small quantities of witherite may be included
Barytes – exports and imports (1) Trade in barytes is reported under item 2511 of the
Harmonised System and is described as ‘barytes and witherite’. However, only small quantities of witherite are traded
Bentonite and fuller’s earth – production (1) Bentonites consist of montmorillonite (one of the
smectite group of clay minerals) and occur in two main varieties, calcium bentonite, the most commonly occurring, and sodium bentonite, industrially the more important
(2) Calcium bentonite can be converted to sodium bentonite by a sodium-exchange process
(3) In some countries, such as the United Kingdom, calcium bentonite is known as fuller’s earth, a term which is also used to refer attapulgite, a mineralogically distinct clay mineral but exhibiting similar properties
Bentonite and fuller’s earth – exports and imports (1) See notes 1 - 3 under production (2) The figures refer to natural and sodium-exchanged
bentonite, Harmonised System 2508.10 (3) Activated bentonite and fuller’s earth, Harmonised
System 3802.90 are excluded (4) Some countries are believed to include sodium-
exchanged bentonite, often referred to as activated bentonite, under Harmonised System 3802.90, e.g. Italy, but these are not included
(5) From 2007 Harmonised System 2508.20, previously used in this table for fuller's earth, is no longer available
Bismuth – mine production (1) In some instances the figures are derived from reported
bismuth content of refined and impure metal plus recoverable in ores and concentrates exported
(2) Production for some countries may include bismuth produced from imported ores but it is thought that any resulting duplication is insignificant in the countries shown
Bromine – exports and imports (1) Trade in bromine is not separately distinguished from
other halogens by many countries Cadmium – production (1) Data exclude secondary metal Chromium – exports and imports (1) Metal traded in ferro-alloy form is included under Iron,
Steel and Ferro-alloys Coal – production (1) There is no international agreement as to the separate
definition of lignite and brown coal. In some cases they are distinguished. Elsewhere both may be aggregated under one or other term
Coal – exports (1) Excludes bunker shipments Cobalt – mine production (1) There is frequently a considerable disparity between
the cobalt content of ore raised and cobalt actually recovered
Cobalt metal – production (1) In addition, several countries including the United
Kingdom, Finland and France are known to produce substantial amounts of cobalt compounds

xii
Copper – smelter production (1) Primary metal in the form of blister and anode
produced from concentrates is shown, and may include copper produced from scrap but this is excluded when it can be separately identified
Refined copper – production (1) Figures relate to both primary and secondary refined
copper, whether electrolytic or fire refined. Metal recovered from secondary materials by remelting alone is excluded
Copper – exports and imports (1) The term ‘unwrought’ copper corresponds to items
7402, 7403 and 7405 of the Harmonised System and includes both unrefined (including blister) and refined copper
(2) The term ‘unwrought’, as used here, includes alloys unless these are separately specified. The term ‘scrap’ includes scrap alloys
Diamond – production (1) Synthetic diamond is excluded Diamond – exports and imports (1) Carats have been used as the unit except where the only
obtainable figure is the value. In these cases the national currency figure has been converted to £ sterling
(2) See explanatory notes regarding currency conversion (3) The term 'Dust' corresponds to item 7105.10 of the
Harmonised System and includes both natural and synthetic diamond dust
Gold – mine production (1) In several countries substantial amounts of gold
produced in small operations are not recorded in the official statistics
Gold – exports and imports (1) The term 'metal' includes both unwrought and partly
worked gold but excludes gold coin (2) Kilograms have been used as the unit except where the
only obtainable figure is the value. In these cases the national currency figure has been converted to £ sterling.
(3) See explanatory notes regarding currency conversion Graphite – production (1) Including all forms of amorphous and crystalline
graphite but excluding synthetic material Graphite – exports and imports (1) Excluding synthetic graphite Gypsum – production (1) Some countries produce large quantities of synthetic
gypsum. Where possible, this output is excluded Gypsum – exports & imports (1) The term ‘crude’ may include some anhydrite Pig iron – production (1) Sponge iron and direct reduced iron (DRI) are included
where these have been separately identified Crude steel – production (1) Figures include production from scrap unless otherwise
indicated Iron, steel and ferro-alloys – exports and imports (1) The term ‘ingots, blooms, billets’ corresponds to items
7206, 7207, 7218 and 7224 of the Harmonised System which includes those of alloy and high carbon steel
Kaolin – exports and imports (1) The term 'kaolin', as used here, includes kaolin and
kaolinitic clay Refined Lead – production (1) Figures relate to both primary and secondary refined
lead and include the lead content of antimonial lead Lead – exports and imports (1) The term ‘unwrought’ lead corresponds to item 7801 of
the Harmonised System and comprises base bullion, pigs, unwrought bars, etc
(2) The term ‘unwrought’, as used here, includes alloys unless these are separately identified.
Magnesite and magnesia – exports and imports (1) The term ‘magnesia’, as used here, includes dead-
burned, sintered and caustic-burned (caustic calcined) material
Manganese – exports and imports (1) Metal traded in ferro-alloy form is included under Iron,
Steel and Ferro-alloys Mercury – production (1) Several countries are believed to have unrecorded
production of mercury from copper electrowinning processes and by recovery from effluents
Mica – exports and imports (1) Data show unmanufactured mica and include sheet,
block, splittings, ground and waste, unless these are separately specified. Mica powder is included under the term ‘ground’
Molybdenum – exports and imports (1) Metal traded in ferro-alloy form is included under Iron,
Steel and Ferro-alloys Nickel – smelter/refinery production (1) Data relate to refined nickel plus the nickel content of
ferro-nickel, nickel oxide and nickel salts Nickel – exports and imports (1) The term ‘unwrought’ nickel corresponds to item 7502
of the Harmonised System which excludes all electro-plating anodes
(2) Metal traded in ferro-alloy form is included under Iron, Steel and Ferro-alloys
Crude petroleum – production (1) The figures include natural gas liquids Natural gas – production (1) Flared or reinjected gas is excluded as far as possible Natural Gas – exports and imports (1) This table includes both liquified natural gas (HS code:
271111) in tonnes and natural gas in gaseous state (HS code 271121) in tonnes of oil equivalent
(2) To convert figures from million tonnes (of oil equivalent) to billion m3, multiply by 1.11
Platinum group metals – production (1) Wherever possible, figures relate to quantities of
platinum group metals thought to be recovered from ores originating in the country stated
(2) Figures for metal production are only given for countries where recovery is thought to be based predominantly on domestic materials
(3) Concentrates produced in Spain are believed to be processed in China to recover platinum group metals

Platinum group metals – exports and imports (1) The term ‘Platinum’ and/or ‘Platinum metals’ includes
unwrought, partly worked and alloys (2) Kilograms have been used as the unit except where the
only obtainable figure is the value. In these cases the national currency figure has been converted to £ sterling.
(3) See explanatory notes regarding currency conversion Rare earths – exports and imports (1) Rare earths are taken to include yttrium and scandium Salt – production (1) Refined salt is excluded (2) Salt is known to be produced in many countries for
which statistics are not available. Sillimanite minerals – production (1) A number of other countries produce sillimanite
minerals but details of output are not reported (2) Production capacity for synthetic mullite also exists in
the United Kingdom but output is believed to be zero Sillimanite minerals – exports and imports (1) ‘Sillimanite minerals’ is understood to include any or
all of andalusite, kyanite, sillimanite and mullite Silver – exports and imports (1) Excluding silver coin but including silver shipped for
minting (2) The term ‘metal’ includes both unwrought and partly
worked silver and alloys Tantalum and niobium – exports and imports (1) Metal traded in ferro-alloy form is included under Iron,
Steel and Ferro-alloys Tin – smelter production (1) Figures include both primary and secondary metal (2) In addition to the countries listed, many countries
produce small amounts of secondary metal Tin – exports and imports (1) The term ‘unwrought’ tin corresponds to item 8001 of
the Harmonised System and comprises ingots, pigs, unwrought bars, sticks, etc.
Titanium minerals – production (1) The figures refer to gross tonnage of titanium
concentrates Titanium – exports and imports (1) Significant quantities of titanium slag are traded, but it
is not always possible to identify this material in national trade accounts
(2) So far as possible, the term ‘oxides’, includes oxides and oxide based pigments classified under Harmonised System items 2823 and 3206.10
(3) Metal traded in ferro-alloy form is included under Iron, steel and ferro-alloys
Tungsten – exports and imports (1) Significant amounts of tungsten are traded in the forms
of ammonium paratungstate (APT) and carbide. Though statistics are included where available, most countries do not separately distinguish these forms in their trade accounts
(2) Metal traded in ferro-alloy form is included under Iron, Steel and Ferro-alloys
Uranium – mine production (1) Excludes uranium production from decommissioning
operations. Vanadium – exports and imports (1) The term ‘pentoxide’ also includes vanadium oxides
and hydroxides, if any (2) Metal traded in ferro-alloy form is included under Iron,
Steel and Ferro-alloys Zinc – exports and imports (1) The term ‘unwrought’ zinc corresponds to item 7901 of
the Harmonised System and comprises blocks, pigs, slabs, etc
Zirconium – exports and imports (1) Metal traded in ferro-alloy form is included under Iron,
steel and ferro-alloys

STATISTICAL TABLES BY COUNTRY

2
Albania Albania
Production Commodity Units 2010 2011 2012 2013 2014
Chromium tonnes 334 467 330 938 365 749 529 592 678 803 Coal Lignite tonnes 3 000 100 — — — Copper, mine tonnes (metal content) 2 672 4 379 5 691 5 087 3 503 Gypsum tonnes * 80 000 * 80 000 91 021 126 349 108 733 Crude steel tonnes 390 000 464 000 390 000 312 000 637 905 Ferro-alloys Ferro-chrome tonnes 23 233 28 433 24 018 24 692 34 897 Nickel, mined tonnes (metal content) 1 954 914 750 2 151 4 791 Crude petroleum tonnes 742 012 894 530 1 029 319 1 203 638 1 342 451 Natural gas million m3 2 1 18 19 33 Salt Sea salt tonnes * 47 000 * 47 000 * 47 000 * 47 000 * 47 000
Exports Commodity Units 2010 2011 2012 2013 2014
Primary aggregates tonnes 887 8 321 24 363 2 517 1 724 Aluminium and bauxite Unwrought (a) tonnes 2 805 3 309 1 940 4 124 (b)* 6 000 Scrap tonnes 5 290 4 670 6 260 5 854 1 933 Cement Cement clinkers tonnes 87 590 (b)* 22 370 23 341 18 066 (b)* 310 Portland cement tonnes 511 681 674 037 1 026 560 997 924 22 552 Other cement tonnes 25 (b)* 350 (b)* 350 (b)* 210 (b)* 210 Chromium Ores and concentrates tonnes 428 385 346 792 427 092 756 361 479 445 Copper Ores and concentrates tonnes 24 820 31 481 36 482 38 311 205 Scrap tonnes 4 953 5 656 5 725 4 613 1 445 Gypsum Crude and calcined tonnes 1 955 791 2 019 7 439 ... Iron ore tonnes 277 026 606 577 191 531 191 934 479 445 Iron, steel and ferro-alloys Ferro-alloys tonnes 23 493 31 364 29 813 28 389 7 383 Ingots, blooms, billets tonnes 132 144 162 632 124 525 42 798 (b)* 103 700 Scrap tonnes 55 885 99 445 86 884 23 038 8 387 Lead Unwrought tonnes 2 914 1 568 1 117 811 ... Nickel Ores and concentrates tonnes ... ... 103 191 605 239 379 Scrap tonnes 1 7 477 7 ... Crude petroleum tonnes 537 315 696 762 1 000 850 1 251 513 (b)* 863 000 Salt tonnes 2 748 13 557 35 464 30 574 24 695 Sulphur and pyrites Pyrites tonnes ... ... 5 076 10 560 ...
Note(s) (a) Including alloys (b) BGS estimates, based on known imports into certain countries

3
Albania
Imports Commodity Units 2010 2011 2012 2013 2014
Primary aggregates tonnes 15 253 20 645 26 226 41 918 37 907 Aluminium and bauxite Bauxite tonnes 5 408 497 (b)* 1 ... (b)* 2 Unwrought (a) tonnes 7 198 7 718 9 946 10 631 (b)* 6 000 Scrap tonnes 1 268 1 234 548 1 802 (b)* 400 Barytes tonnes 320 1 192 2 665 363 13 Bentonite tonnes 1 059 1 549 373 377 262 Cement Cement clinkers tonnes 40 ... 5 260 79 661 (b) 150 900 Portland cement tonnes 593 883 384 655 284 837 122 507 (b) 81 800 Other cement tonnes 300 788 211 346 162 203 107 529 58 603 Chromium Ores and concentrates tonnes 4 651 7 477 ... ... ... Coal Anthracite tonnes 5 023 8 245 9 240 8 729 (b)* 500 Other coal tonnes 59 663 82 438 90 273 84 406 (b)* 79 800 Fluorspar tonnes 350 650 55 500 * — Gypsum Crude and calcined tonnes 2 115 1 644 1 153 1 022 391 Iron, steel and ferro-alloys Ferro-silico-manganese tonnes 3 354 4 145 4 217 3 095 (b)* 4 000 Ferro-silicon tonnes 484 1 447 915 618 (b)* 30 Other ferro-alloys tonnes 2 056 10 45 206 ... Scrap tonnes 292 096 312 746 211 910 201 240 376 Crude petroleum tonnes 21 972 28 163 276 ... ... Potash Other potassic fertilisers tonnes 650 88 48 30 ... Salt tonnes 15 415 22 903 14 098 9 647 19 787 Silver Metal kilograms 7 819 4 485 2 768 3 327 230
Note(s) (a) Including alloys (b) BGS estimates, based on known exports from certain countries
4
Austria Austria
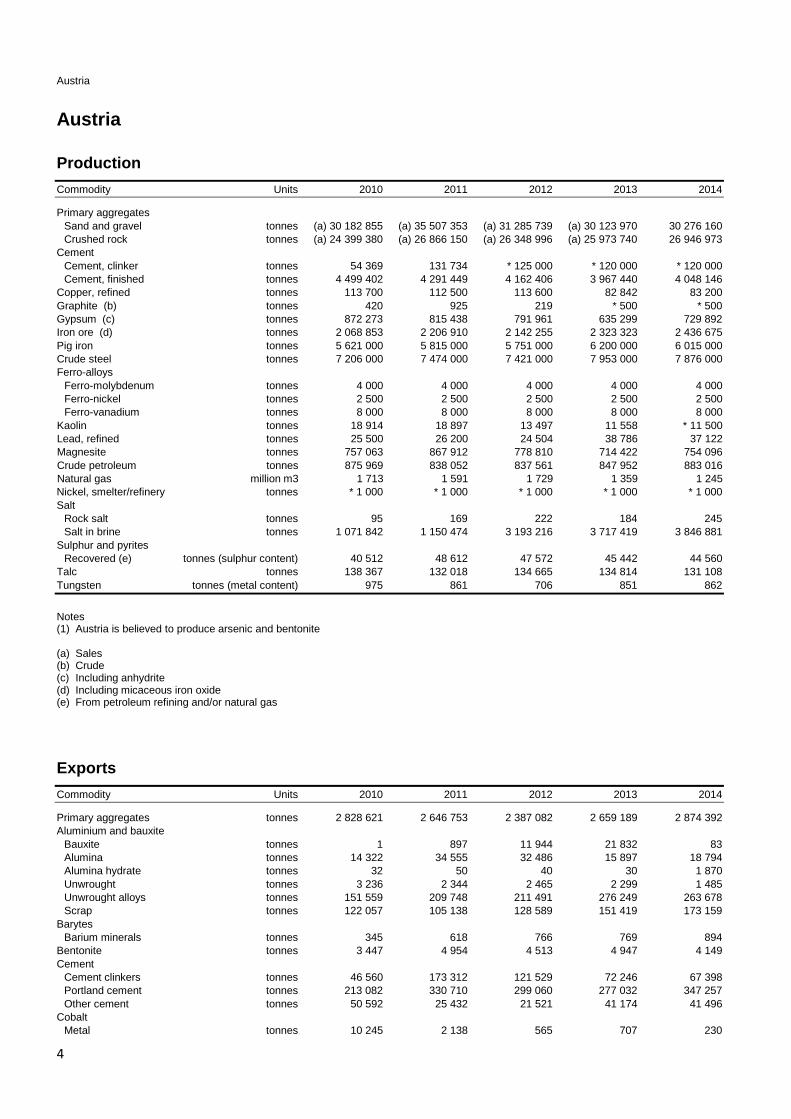
Production Commodity Units 2010 2011 2012 2013 2014
Primary aggregates Sand and gravel tonnes (a) 30 182 855 (a) 35 507 353 (a) 31 285 739 (a) 30 123 970 30 276 160 Crushed rock tonnes (a) 24 399 380 (a) 26 866 150 (a) 26 348 996 (a) 25 973 740 26 946 973 Cement Cement, clinker tonnes 54 369 131 734 * 125 000 * 120 000 * 120 000 Cement, finished tonnes 4 499 402 4 291 449 4 162 406 3 967 440 4 048 146 Copper, refined tonnes 113 700 112 500 113 600 82 842 83 200 Graphite (b) tonnes 420 925 219 * 500 * 500 Gypsum (c) tonnes 872 273 815 438 791 961 635 299 729 892 Iron ore (d) tonnes 2 068 853 2 206 910 2 142 255 2 323 323 2 436 675 Pig iron tonnes 5 621 000 5 815 000 5 751 000 6 200 000 6 015 000 Crude steel tonnes 7 206 000 7 474 000 7 421 000 7 953 000 7 876 000 Ferro-alloys Ferro-molybdenum tonnes 4 000 4 000 4 000 4 000 4 000 Ferro-nickel tonnes 2 500 2 500 2 500 2 500 2 500 Ferro-vanadium tonnes 8 000 8 000 8 000 8 000 8 000 Kaolin tonnes 18 914 18 897 13 497 11 558 * 11 500 Lead, refined tonnes 25 500 26 200 24 504 38 786 37 122 Magnesite tonnes 757 063 867 912 778 810 714 422 754 096 Crude petroleum tonnes 875 969 838 052 837 561 847 952 883 016 Natural gas million m3 1 713 1 591 1 729 1 359 1 245 Nickel, smelter/refinery tonnes * 1 000 * 1 000 * 1 000 * 1 000 * 1 000 Salt Rock salt tonnes 95 169 222 184 245 Salt in brine tonnes 1 071 842 1 150 474 3 193 216 3 717 419 3 846 881 Sulphur and pyrites Recovered (e) tonnes (sulphur content) 40 512 48 612 47 572 45 442 44 560 Talc tonnes 138 367 132 018 134 665 134 814 131 108 Tungsten tonnes (metal content) 975 861 706 851 862
Notes (1) Austria is believed to produce arsenic and bentonite (a) Sales (b) Crude (c) Including anhydrite (d) Including micaceous iron oxide (e) From petroleum refining and/or natural gas
Exports Commodity Units 2010 2011 2012 2013 2014
Primary aggregates tonnes 2 828 621 2 646 753 2 387 082 2 659 189 2 874 392 Aluminium and bauxite Bauxite tonnes 1 897 11 944 21 832 83 Alumina tonnes 14 322 34 555 32 486 15 897 18 794 Alumina hydrate tonnes 32 50 40 30 1 870 Unwrought tonnes 3 236 2 344 2 465 2 299 1 485 Unwrought alloys tonnes 151 559 209 748 211 491 276 249 263 678 Scrap tonnes 122 057 105 138 128 589 151 419 173 159 Barytes Barium minerals tonnes 345 618 766 769 894 Bentonite tonnes 3 447 4 954 4 513 4 947 4 149 Cement Cement clinkers tonnes 46 560 173 312 121 529 72 246 67 398 Portland cement tonnes 213 082 330 710 299 060 277 032 347 257 Other cement tonnes 50 592 25 432 21 521 41 174 41 496 Cobalt Metal tonnes 10 245 2 138 565 707 230

5
Austria
Exports continued
Commodity Units 2010 2011 2012 2013 2014
Chromium Ores and concentrates tonnes 4 1 163 413 9 88 Metal tonnes 72 60 111 68 48 Copper Scrap tonnes 52 702 55 454 60 033 50 784 57 316 Unwrought, unrefined tonnes 7 636 7 780 1 049 412 234 Unwrought, refined (a) tonnes 135 936 129 241 125 425 100 350 91 929 Diamond Unsorted Carats £191 000 £3 305 000 £17 000 ... ... Gem, cut Carats £3 564 000 £6 211 000 £3 657 000 £2 823 000 £5 864 000 Dust Carats £225 000 £66 000 £34 000 £122 000 £224 000 Diatomite tonnes 3 467 2 756 3 550 3 275 3 166 Feldspar tonnes 13 474 11 807 11 452 11 488 10 668 Gold Metal kilograms 27 800 22 500 18 000 16 600 14 300 Waste and scrap kilograms 5 900 2 900 1 600 2 800 6 700 Graphite tonnes 9 518 9 936 5 562 5 216 4 744 Gypsum Crude tonnes 19 124 23 007 18 485 24 898 26 761 Calcined tonnes 55 927 76 548 79 280 75 787 76 479 Iodine kilograms 564 413 10 652 200 500 Iron, steel and ferro-alloys Pig iron tonnes 4 476 3 74 776 1 989 Sponge and powder tonnes 1 195 653 49 019 46 756 10 889 Ferro-manganese tonnes 150 225 918 1 117 2 234 Ferro-silicon tonnes 538 1 233 663 1 227 830 Other ferro-alloys tonnes 1 930 232 710 182 19 Silicon metal tonnes 7 403 597 1 643 842 557 Ingots, blooms, billets tonnes 190 343 293 647 238 922 297 349 246 600 Scrap tonnes 1 034 398 950 865 1 008 503 963 641 1 055 948 Kaolin tonnes 27 908 6 588 6 958 6 318 5 944 Lead Unwrought tonnes 16 427 15 619 13 329 11 929 14 019 Scrap tonnes 871 729 983 1 521 2 053 Lithium Carbonate tonnes 170 166 9 13 24 Magnesite and magnesia Magnesite tonnes 989 780 774 559 488 Magnesia tonnes 39 589 79 519 71 453 70 253 64 204 Mercury (b) kilograms * 3 300 * 1 600 * 500 * 200 * 400 Mica tonnes 4 303 4 245 4 024 3 554 3 411 Molybdenum Metal (b) tonnes * 2 300 * 2 800 * 2 500 * 2 500 * 3 200 Nickel Unwrought (a) tonnes 208 234 351 305 626 Scrap tonnes 1 606 2 709 2 633 3 322 5 402 Natural gas tonnes 2 645 056 2 945 349 1 995 157 992 867 942 452 Platinum metals Platinum and platinum metals kilograms £83 434 000 £110 119 000 £105 895 000 £101 611 000 £72 848 000 Waste and scrap kilograms £1 070 000 £757 000 £733 000 £697 000 £389 000 Potash Potassic fertilisers tonnes 20 259 19 304 21 653 25 037 32 771 Rare earths Metals tonnes 258 452 500 532 475 Cerium compounds tonnes 1 936 1 167 888 1 102 946 Other rare earth compounds tonnes 8 658 4 902 5 696 6 166 7 552 Salt tonnes 500 126 392 506 404 069 475 453 508 940 Silver Metal kilograms 100 300 136 000 155 200 134 800 110 700 Sulphur and pyrites Pyrites tonnes 2 794 2 887 2 579 1 523 965 Sulphur, sublimed and precipitated tonnes 1 145 746 2 138 3 425 2 230 Talc tonnes 106 271 115 967 121 264 84 271 127 230 Tantalum and niobium Tantalum tonnes 27 29 21 112 187 Tin Unwrought (a) tonnes 60 98 103 118 112

6
Austria
Exports continued
Commodity Units 2010 2011 2012 2013 2014
Titanium Metal tonnes 129 224 317 159 609 Oxides tonnes 5 956 4 794 3 965 4 052 6 093 Tungsten Metal (b) tonnes * 3 000 * 2 400 * 2 200 * 1 900 * 2 000 Zinc Unwrought (a) tonnes 8 532 9 776 6 410 11 065 10 933 Scrap tonnes 5 757 8 583 8 591 10 440 10 077
Note(s) (a) Including alloys (b) BGS estimates, based on known imports into certain countries
Imports Commodity Units 2010 2011 2012 2013 2014
Primary aggregates tonnes 2 284 169 2 184 095 2 521 253 2 420 461 3 404 903 Aluminium and bauxite Bauxite tonnes 8 489 7 842 6 169 9 235 18 742 Alumina tonnes 47 681 53 232 40 520 20 675 21 841 Alumina hydrate tonnes 12 914 12 821 14 603 15 411 12 691 Unwrought tonnes 177 751 197 795 131 764 156 583 146 896 Unwrought alloys tonnes 239 493 280 502 314 594 235 575 242 352 Scrap tonnes 268 845 282 707 304 272 280 710 285 564 Antimony Metal tonnes 37 214 267 316 302 Oxide tonnes 249 204 156 164 288 Barytes tonnes 3 115 4 711 5 157 3 545 5 262 Bentonite tonnes 90 229 83 313 91 208 93 506 103 577 Bismuth Metal tonnes 130 138 139 175 166 Bromine kilograms 318 400 238 900 384 600 647 900 224 800 Cement Cement clinkers tonnes 407 616 393 132 297 009 262 939 261 617 Portland cement tonnes 637 550 913 116 797 976 749 455 639 189 Other cement tonnes 71 535 60 349 54 115 133 721 293 335 Chromium Ores and concentrates tonnes 54 945 20 921 33 317 29 138 32 916 Metal tonnes 6 109 7 868 4 854 4 365 1 424 Coal Anthracite tonnes 3 774 5 760 5 932 1 654 2 246 Other coal tonnes 3 614 354 3 359 294 3 339 262 3 178 153 3 158 357 Lignite tonnes 68 777 74 609 75 705 82 039 95 181 Briquettes tonnes 34 999 35 695 26 598 28 482 32 497 Cobalt Metal tonnes 653 718 730 1 363 785 Oxides tonnes 10 9 8 54 14 Copper Scrap tonnes 145 903 130 675 127 187 102 554 105 905 Unwrought, unrefined tonnes 36 218 44 412 42 637 21 970 27 007 Unwrought, refined tonnes 10 361 16 680 8 374 5 348 9 555 Unwrought alloys tonnes 1 412 1 376 2 183 2 567 2 868 Diamond Unsorted Carats £729 000 £3 371 000 £203 000 £108 000 £58 000 Gem, cut Carats £9 838 000 £19 112 000 £10 309 000 £9 666 000 £8 346 000 Industrial Carats £193 000 £5 500 £149 000 £132 000 £9 600 Dust Carats 30 000 000 38 000 000 30 500 000 44 000 000 28 000 000 Diatomite tonnes 13 324 12 798 12 452 12 827 12 983 Feldspar tonnes 2 433 2 804 2 442 2 094 2 468 Fluorspar tonnes 3 490 2 911 2 935 2 847 2 738 Gold Metal kilograms 56 600 63 500 47 300 54 400 45 100 Waste and scrap kilograms 1 400 2 400 3 300 6 900 11 900

7
Austria
Imports continued
Commodity Units 2010 2011 2012 2013 2014
Graphite tonnes 18 501 21 867 9 272 10 843 17 738 Gypsum Crude tonnes 22 432 84 817 36 806 67 145 123 475 Calcined tonnes 70 850 72 696 77 931 70 371 88 121 Iodine kilograms 213 000 198 500 147 200 195 100 322 300 Iron ore (a) tonnes 9 309 860 9 966 338 9 628 923 8 269 199 6 289 430 Iron, steel and ferro-alloys Pig iron tonnes 25 355 30 367 18 706 18 579 18 012 Sponge and powder tonnes 13 537 18 585 90 782 49 177 60 919 Ferro-chrome tonnes 29 355 38 422 35 000 31 026 34 149 Ferro-silico-magnesium tonnes 132 150 97 101 47 Ferro-manganese tonnes 17 840 21 671 21 540 27 737 35 023 Ferro-silico-manganese tonnes 22 976 19 931 18 862 17 957 17 995 Ferro-molybdenum tonnes 742 1 402 1 503 1 127 883 Ferro-nickel tonnes ... 973 906 971 889 Ferro-niobium tonnes 1 061 1 191 1 865 1 165 1 235 Ferro-phosphorus tonnes 1 232 2 497 610 761 266 Ferro-silicon tonnes 27 063 33 709 38 402 58 296 56 677 Ferro-titanium and ferro-silico-titanium tonnes 471 630 607 367 567 Ferro-tungsten and ferro-silico-tungsten tonnes 552 715 624 533 452 Ferro-vanadium tonnes 166 65 300 204 191 Other ferro-alloys tonnes 3 549 4 806 3 067 2 974 1 666 Silicon metal tonnes 11 497 10 180 7 189 8 773 8 278 Ingots, blooms, billets tonnes 159 527 186 929 196 328 155 829 314 537 Scrap tonnes 991 574 1 016 301 1 007 906 1 168 752 1 270 084 Kaolin tonnes 194 396 187 831 171 310 161 876 157 527 Lead Unwrought tonnes 19 391 31 675 29 938 40 143 45 566 Scrap tonnes 264 837 558 1 560 1 260 Lithium Carbonate tonnes 402 463 359 298 340 Magnesite and magnesia Magnesite tonnes 848 1 512 1 069 489 213 Magnesia tonnes 272 232 214 788 180 117 219 973 239 362 Manganese Ores and concentrates tonnes 152 334 222 198 223 Metal tonnes 16 696 21 123 21 692 20 665 25 822 Mica tonnes 874 656 625 493 339 Molybdenum Ores and concentrates tonnes ... ... — — 8 151 Metal tonnes 548 951 440 414 917 Nickel Scrap tonnes 440 527 1 917 4 359 4 375 Unwrought (b) tonnes 6 894 9 231 8 830 8 004 9 062 Oxides tonnes 15 8 247 63 7 Crude petroleum tonnes 6 770 069 7 358 582 7 463 478 7 831 498 7 663 094 Natural gas tonnes 8 697 934 9 390 448 10 043 171 7 317 311 7 096 338 Phosphate rock tonnes (c)* 160 000 61 030 (c)* 6 500 (c)* 106 (c)* 200 Platinum metals Platinum and platinum metals kilograms 1 400 4 100 500 2 600 1 100 Waste and scrap kilograms 100 21 400 1 100 700 5 500 Potash Sulphate tonnes 15 074 9 595 15 636 14 738 15 276 Chloride tonnes 105 299 102 028 132 302 125 318 146 317 Other potassic fertilisers tonnes 18 201 9 418 12 312 16 730 19 225 Rare earths Metals tonnes 550 325 442 595 429 Cerium compounds tonnes 1 766 1 310 696 979 765 Other rare earth compounds tonnes 3 375 1 646 802 1 630 1 973 Salt tonnes 293 799 291 187 162 790 314 374 132 360 Sillimanite minerals tonnes 2 089 2 224 3 093 1 941 1 289 Silver Metal kilograms 481 800 804 000 331 500 583 000 267 100 Sulphur and pyrites Pyrites tonnes 3 154 3 321 3 340 2 133 2 043 Sulphur tonnes 75 065 70 892 49 910 51 428 58 522 Sulphur, sublimed and precipitated tonnes 15 331 22 109 16 997 22 895 18 623
8
Austria
Imports continued
Commodity Units 2010 2011 2012 2013 2014
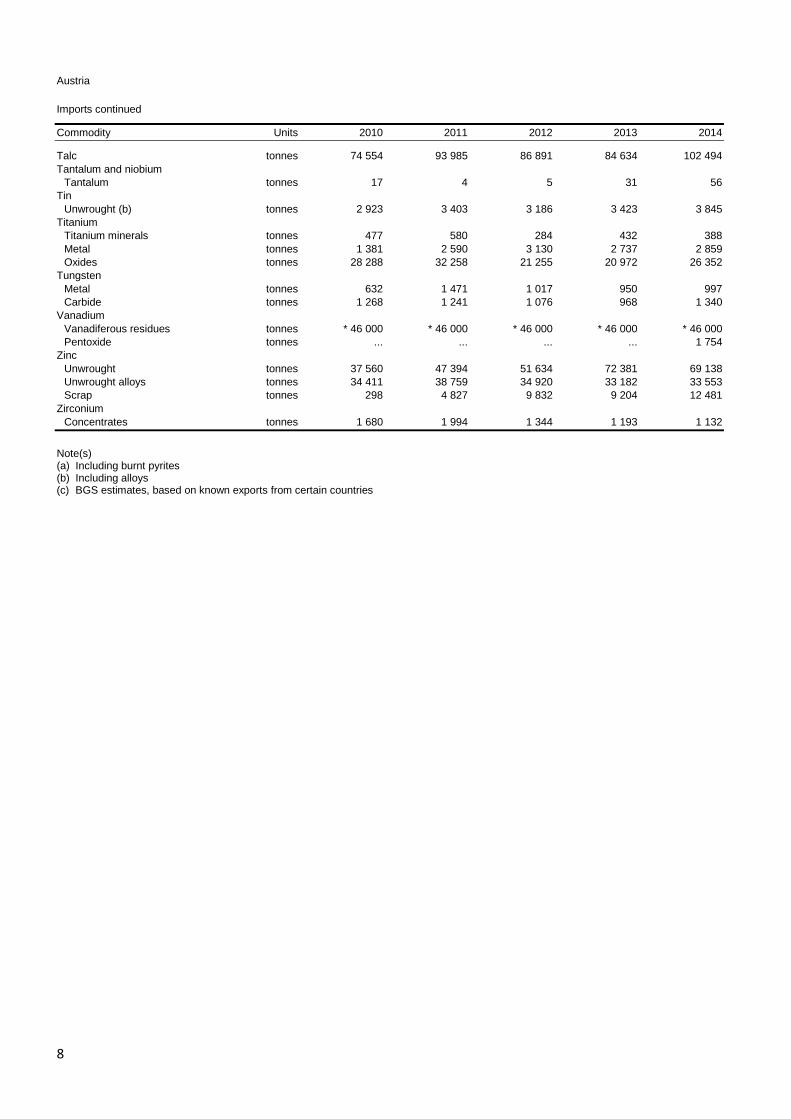
Talc tonnes 74 554 93 985 86 891 84 634 102 494 Tantalum and niobium Tantalum tonnes 17 4 5 31 56 Tin Unwrought (b) tonnes 2 923 3 403 3 186 3 423 3 845 Titanium Titanium minerals tonnes 477 580 284 432 388 Metal tonnes 1 381 2 590 3 130 2 737 2 859 Oxides tonnes 28 288 32 258 21 255 20 972 26 352 Tungsten Metal tonnes 632 1 471 1 017 950 997 Carbide tonnes 1 268 1 241 1 076 968 1 340 Vanadium Vanadiferous residues tonnes * 46 000 * 46 000 * 46 000 * 46 000 * 46 000 Pentoxide tonnes ... ... ... ... 1 754 Zinc Unwrought tonnes 37 560 47 394 51 634 72 381 69 138 Unwrought alloys tonnes 34 411 38 759 34 920 33 182 33 553 Scrap tonnes 298 4 827 9 832 9 204 12 481 Zirconium Concentrates tonnes 1 680 1 994 1 344 1 193 1 132
Note(s) (a) Including burnt pyrites (b) Including alloys (c) BGS estimates, based on known exports from certain countries

9
Belgium Belgium
Production Commodity Units 2010 2011 2012 2013 2014
Primary aggregates Sand and gravel tonnes * 22 000 000 * 23 000 000 * 21 000 000 * 21 000 000 * 19 000 000 Crushed rock tonnes * 44 000 000 * 49 000 000 * 46 000 000 * 46 000 000 * 45 000 000 Arsenic tonnes * 1 000 * 1 000 * 1 000 * 1 000 * 1 000 Cement Cement, clinker tonnes 858 871 * 700 000 726 690 911 116 * 900 000 Cement, finished tonnes 5 990 000 6 844 000 6 280 000 6 119 000 6 364 000 Cobalt (a) tonnes 2 600 3 187 4 200 5 415 5 850 Copper, refined tonnes 381 200 394 200 396 700 389 400 387 300 Indium tonnes * 30 * 30 * 30 * 30 * 30 Pig iron tonnes 4 688 000 4 700 000 4 073 000 4 343 000 4 335 000 Crude steel tonnes 7 973 000 8 026 000 7 301 000 7 127 000 7 331 000 Kaolin tonnes * 300 000 * 300 000 * 300 000 * 300 000 * 300 000 Lead, refined tonnes 121 000 119 000 119 000 129 429 133 252 Selenium metal tonnes * 200 * 200 * 200 * 200 * 200 Sulphur and pyrites Recovered (b)(c) tonnes (sulphur content) 353 000 396 500 382 100 396 900 * 400 000 Tin tonnes 9 946 10 008 11 350 10 346 9 718 Zinc, mine (d) tonnes 260 000 282 000 250 000 252 000 262 000
Notes (a) Some metal production in China is recorded in Belgium (b) From metal sulphide processing (c) From petroleum refining and/or natural gas (d) Years ended 31 March following that stated
Exports Commodity Units 2010 2011 2012 2013 2014
Primary aggregates tonnes 12 427 043 13 083 592 12 886 680 12 158 112 13 157 456 Aluminium and bauxite Bauxite tonnes 48 683 37 533 36 651 34 078 48 647 Alumina tonnes 7 516 21 284 5 218 28 210 9 675 Unwrought tonnes 257 888 150 542 95 405 166 743 169 124 Unwrought alloys tonnes 14 204 30 285 61 019 74 265 67 028 Scrap tonnes 274 819 321 484 311 716 286 908 285 743 Antimony Ores and concentrates tonnes 433 274 1 187 4 57 Metal tonnes 776 732 259 271 138 Oxide tonnes 10 599 10 417 7 818 7 751 8 555 Arsenic Metallic arsenic tonnes 114 120 191 104 79 Barytes Barium minerals tonnes 3 216 213 1 713 11 796 33 463 Bentonite tonnes 28 632 28 512 31 222 29 489 43 915 Bromine kilograms 12 619 000 25 002 100 25 239 600 27 339 200 21 651 100 Cadmium Metal tonnes 459 545 690 178 229 Oxide tonnes 4 413 3 734 3 764 2 767 2 189 Cement Cement clinkers tonnes 582 766 744 707 638 496 775 332 729 017 Portland cement tonnes 1 676 150 1 729 402 1 631 167 1 719 988 1 870 308 Other cement tonnes 410 909 353 126 253 759 239 879 182 001 Chromium Ores and concentrates tonnes 18 415 13 945 34 801 44 009 59 056 Metal tonnes 1 311 1 010 676 915 558

10
Belgium
Exports continued
Commodity Units 2010 2011 2012 2013 2014
Coal Anthracite tonnes 1 652 015 1 915 992 1 668 940 1 772 455 1 300 147 Other coal tonnes 4 211 655 2 560 811 3 566 699 2 502 987 1 407 064 Lignite tonnes 18 781 42 164 51 514 42 225 49 615 Briquettes tonnes 18 899 40 374 41 363 55 684 71 817 Cobalt Ore tonnes 633 2 431 362 175 197 Metal (a) tonnes * 4 400 * 2 400 * 2 300 * 2 500 * 2 900 Copper Ores and concentrates tonnes 4 549 2 046 3 242 1 874 696 Matte and cement tonnes 6 935 9 042 10 231 13 334 14 382 Unwrought, unrefined tonnes 42 836 40 660 27 586 37 012 24 804 Unwrought, refined tonnes 189 253 187 595 242 533 230 392 27 574 Unwrought alloys tonnes 12 116 11 763 12 436 12 049 12 270 Scrap tonnes 141 380 165 713 168 705 144 000 128 467 Diamond Gem, rough Carats 113 000 000 90 500 000 89 000 000 95 000 000 103 000 000 Gem, cut Carats £4 127 959 000 £4 673 765 000 £3 813 301 000 £4 408 390 000 £3 898 534 000 Industrial Carats £18 509 000 £21 037 000 £17 642 000 £15 435 000 £12 450 000 Dust Carats £13 948 000 £12 800 000 £11 590 000 £11 072 000 £10 437 000 Diatomite tonnes 3 004 3 122 2 690 3 566 3 547 Feldspar tonnes 64 317 417 2 830 170 Fluorspar tonnes 122 483 118 782 147 771 106 343 90 782 Gold Metal kilograms 22 842 6 200 12 900 18 100 16 400 Waste and scrap kilograms 173 700 67 800 58 600 70 800 7 965 500 Graphite tonnes 993 1 316 1 716 1 366 1 658 Gypsum Crude tonnes 92 533 101 382 72 899 81 189 84 022 Calcined tonnes 177 046 (a)* 195 000 (a)* 184 000 (a)* 187 000 (a)* 188 000 Iodine kilograms 3 989 500 3 584 800 3 391 900 4 457 300 5 356 700 Iron ore tonnes 366 331 455 069 76 216 7 694 1 918 Iron, steel and ferro-alloys Pig iron tonnes 254 854 255 067 232 381 218 946 171 376 Sponge and powder tonnes 35 395 10 029 14 734 22 163 19 703 Ferro-chrome tonnes 25 965 23 538 26 098 26 507 43 882 Ferro-silico-chrome tonnes 5 849 1 549 666 — 13 Ferro-manganese tonnes 26 544 41 161 43 319 30 129 15 544 Ferro-silico-manganese tonnes 48 652 47 762 10 280 4 867 2 927 Ferro-molybdenum tonnes 19 593 20 134 21 760 23 643 27 926 Ferro-nickel tonnes ... 775 675 57 122 Ferro-niobium tonnes ... 122 297 234 317 Ferro-phosphorus tonnes ... 117 211 632 1 091 Ferro-silicon tonnes 23 071 33 676 25 595 32 322 28 415 Ferro-titanium and ferro-silico-titanium tonnes ... 31 165 106 113 Ferro-tungsten and ferro-silico-tungsten tonnes ... 38 44 133 373 Ferro-vanadium tonnes ... 94 94 199 241 Other ferro-alloys tonnes 4 137 14 947 6 559 8 315 7 203 Silicon metal tonnes 8 522 8 396 2 327 2 127 1 910 Ingots, blooms, billets tonnes 487 535 484 510 336 540 288 335 211 596 Scrap tonnes 3 754 403 3 533 560 3 618 789 3 218 658 3 949 162 Kaolin tonnes 523 697 232 664 219 024 193 131 759 901 Lead Ores and concentrates tonnes 101 160 167 055 136 787 290 625 299 740 Unwrought tonnes 145 571 130 655 127 052 159 411 154 651 Scrap tonnes 21 479 18 945 18 051 17 405 19 041 Lithium Oxides tonnes 2 284 1 890 2 320 2 380 2 442 Carbonate tonnes 4 539 4 428 4 985 6 736 5 549 Magnesite and magnesia Magnesite tonnes 1 235 914 150 2 469 1 318 Magnesia tonnes 96 513 58 237 49 561 17 793 10 618 Manganese Ores and concentrates tonnes 4 444 9 982 4 236 7 751 5 003 Metal tonnes 1 185 1 625 1 447 2 959 4 828 Mercury kilograms 11 500 600 8 700 7 900 110 Mica tonnes 1 590 2 363 3 587 2 561 3 110

11
Belgium
Exports continued
Commodity Units 2010 2011 2012 2013 2014
Molybdenum Ores and concentrates tonnes 24 396 25 337 19 444 18 384 19 546 Metal tonnes 371 128 204 650 880 Oxides tonnes 83 366 688 59 116 Nickel Mattes, sinters etc tonnes 697 2 380 3 328 2 379 1 053 Unwrought tonnes 9 271 9 684 11 517 12 067 11 189 Unwrought alloys tonnes 1 357 1 838 3 838 14 106 12 268 Oxides tonnes 221 910 498 1 080 282 Scrap tonnes 3 443 7 430 2 407 2 953 11 773 Crude petroleum tonnes 2 593 653 2 278 613 2 085 993 2 149 195 2 472 878 Natural gas tonnes 12 091 105 24 078 554 14 990 395 21 292 092 11 318 364 Phosphate rock tonnes 30 744 62 021 63 004 66 964 46 172 Platinum metals Platinum and platinum metals kilograms 7 500 8 900 5 300 5 400 2 100 Waste and scrap kilograms 497 000 218 400 31 200 9 300 31 900 Potash Chloride tonnes 64 018 100 097 217 498 65 796 27 879 Rare earths Metals tonnes 476 110 134 171 202 Rare earth compounds tonnes 332 265 141 180 238 Salt tonnes 288 679 354 644 151 767 269 571 151 954 Sillimanite minerals tonnes 53 940 51 011 35 685 32 902 33 547 Silver Ores and concentrates kilograms 12 300 2 149 800 1 409 800 982 300 2 009 800 Metal kilograms 21 800 197 000 311 900 (a)* 152 906 1 600 Sulphur and pyrites Sulphur tonnes 21 533 34 087 10 274 9 828 27 977 Sulphur, sublimed and precipitated tonnes 193 83 119 298 85 Talc tonnes 128 526 125 040 109 253 114 645 102 599 Tantalum and niobium Tantalum tonnes 4 2 2 121 3 Tin Concentrates tonnes 127 95 107 114 509 Unwrought tonnes 5 114 4 261 7 428 11 881 11 217 Unwrought alloys tonnes 6 236 6 427 5 018 408 663 Scrap tonnes 207 1 195 308 2 496 2 483 Titanium Titanium minerals tonnes 106 478 116 859 119 931 96 990 104 513 Metal tonnes 895 1 405 1 560 1 336 1 038 Oxides tonnes 435 415 390 405 345 752 399 734 381 857 Tungsten Ores and concentrates tonnes 27 406 544 350 20 Metal tonnes 723 368 657 427 446 Carbide tonnes 92 92 77 82 43 Vanadium Pentoxide tonnes 80 * 116 65 7 3 Zinc Ores and concentrates tonnes 749 582 725 335 859 086 773 334 840 967 Unwrought tonnes 155 654 296 197 277 418 244 589 252 548 Unwrought alloys tonnes ... 154 258 140 766 155 488 183 718 Scrap tonnes 14 540 11 652 15 063 13 333 15 985 Zirconium Concentrates tonnes 17 417 12 021 13 246 17 228 9 173 Metal tonnes 187 272 186 197 274
Note(s) (a) BGS estimates, based on known imports into certain countries

12
Belgium Imports Commodity Units 2010 2011 2012 2013 2014
Primary aggregates tonnes 22 484 726 23 911 051 22 934 219 20 869 873 20 335 594 Aluminium and bauxite Bauxite tonnes 75 600 52 727 41 111 41 968 57 338 Alumina tonnes 19 028 20 406 25 501 21 092 22 643 Alumina hydrate tonnes 34 978 52 806 36 956 63 875 46 644 Unwrought tonnes 517 946 412 600 400 947 364 106 321 243 Unwrought alloys tonnes 193 103 218 350 159 147 168 240 147 383 Scrap tonnes 228 517 257 366 249 187 206 775 237 259 Antimony Ores and concentrates tonnes 5 — 1 — 5 864 Metal tonnes 10 280 9 451 7 195 7 613 7 216 Oxide tonnes 904 831 1 822 786 794 Arsenic Metallic arsenic tonnes 114 634 284 72 74 Barytes Barium minerals tonnes 5 637 4 294 12 095 7 961 36 304 Bentonite tonnes 72 971 91 291 68 771 71 394 77 905 Bismuth Metal tonnes 1 24 16 30 41 Bromine kilograms 18 693 500 28 221 500 28 260 600 27 220 500 29 495 400 Cadmium Metal tonnes 6 456 5 932 3 683 3 944 2 058 Oxide tonnes 43 109 7 32 111 Cement Cement clinkers tonnes 740 528 717 664 649 014 779 293 929 178 Portland cement tonnes 1 030 282 1 113 638 1 310 336 978 809 773 120 Other cement tonnes 172 609 158 441 163 298 138 660 141 542 Chromium Ores and concentrates tonnes 25 350 22 896 39 090 52 755 57 166 Metal tonnes 1 593 3 023 977 834 1 062 Coal Anthracite tonnes 2 660 267 3 382 132 2 377 808 2 077 612 1 862 605 Other coal tonnes 6 851 382 5 887 514 7 104 464 6 870 834 4 867 631 Lignite tonnes 362 257 411 424 425 918 474 879 495 571 Briquettes tonnes 27 379 53 793 40 447 60 486 65 614 Cobalt Ore tonnes 156 379 349 66 42 Metal tonnes 222 368 246 181 454 Copper Ores and concentrates tonnes 10 554 13 735 1 278 3 413 3 908 Matte and cement tonnes 29 857 41 741 40 104 (a)* 9 000 (a)* 14 000 Unwrought, unrefined tonnes 191 159 206 987 181 032 174 338 223 874 Unwrought, refined tonnes 61 447 34 734 71 465 59 309 50 215 Unwrought alloys tonnes 4 917 5 134 2 971 3 686 2 133 Scrap tonnes 272 816 255 661 303 702 307 373 293 141 Diamond Unsorted Carats £32 253 000 £40 264 000 £39 850 000 £309 925 000 £525 786 000 Gem, rough Carats 63 000 000 67 500 000 54 500 000 64 000 000 75 000 000 Gem, cut Carats 3 000 000 3 000 000 500 000 * 2 260 000 500 000 Industrial Carats 3 000 000 1 000 000 2 500 000 2 000 000 2 000 000 Dust Carats 61 000 000 58 000 000 68 500 000 57 500 000 68 500 000 Diatomite tonnes 11 813 10 815 7 143 7 753 9 287 Feldspar tonnes 24 495 22 623 17 062 18 181 17 998 Fluorspar tonnes 134 266 145 776 173 038 119 747 123 193 Gold Metal kilograms 10 100 9 100 9 400 10 900 10 700 Waste and scrap (a) kilograms * 557 000 * 495 000 * 726 000 * 602 000 * 486 000 Graphite tonnes 7 243 7 473 6 109 6 321 6 779 Gypsum Crude tonnes 616 338 683 957 838 204 641 842 802 877 Calcined tonnes 396 873 507 725 455 117 422 056 403 858 Iodine kilograms 4 087 700 3 814 500 4 663 100 4 773 300 5 909 800 Iron ore tonnes (b) 7 567 498 7 425 015 6 309 506 (b) 6 303 617 (b) 6 748 563

13
Belgium Imports continued
Commodity Units 2010 2011 2012 2013 2014
Iron, steel and ferro-alloys Pig iron tonnes 331 652 320 083 286 145 261 257 224 056 Sponge and powder tonnes 39 503 54 212 42 889 65 817 45 121 Ferro-chrome tonnes 263 715 248 006 275 926 312 300 288 703 Ferro-silico-chrome tonnes 1 950 10 437 19 741 5 569 314 Ferro-silico-magnesium tonnes 1 992 1 716 1 258 831 915 Ferro-manganese tonnes 48 471 69 017 70 732 59 929 32 382 Ferro-silico-manganese tonnes 72 195 77 001 28 938 29 946 22 453 Ferro-molybdenum tonnes 2 160 3 261 3 437 4 248 5 069 Ferro-nickel tonnes 48 017 64 242 40 217 45 403 53 439 Ferro-niobium tonnes 1 890 1 598 1 687 2 047 2 262 Ferro-phosphorus tonnes 2 612 1 459 1 227 1 536 2 042 Ferro-silicon tonnes 92 785 105 445 87 805 88 808 104 298 Ferro-titanium and ferro-silico-titanium tonnes 2 926 2 377 2 525 2 157 2 380 Ferro-tungsten and ferro-silico-tungsten tonnes 229 93 249 227 471 Ferro-vanadium tonnes 214 146 263 397 413 Other ferro-alloys tonnes 7 039 8 777 7 451 9 086 8 121 Silicon metal tonnes 23 566 21 688 10 440 13 602 16 044 Ingots, blooms, billets tonnes 2 554 975 2 916 336 2 458 279 1 634 190 1 811 792 Scrap tonnes 4 726 992 4 634 651 4 330 264 4 238 922 4 746 513 Kaolin tonnes 1 001 057 890 863 868 298 854 056 930 145 Lead Ores and concentrates tonnes 169 356 154 976 139 771 214 596 213 749 Unwrought tonnes 14 467 27 696 77 349 33 247 48 052 Scrap tonnes 31 992 33 219 26 023 24 479 29 470 Lithium Oxides tonnes 2 410 2 953 2 515 3 179 2 389 Carbonate tonnes 4 183 7 770 7 205 6 403 4 406 Magnesite and magnesia Magnesite tonnes 3 820 2 076 643 800 611 Magnesia tonnes 80 845 70 954 58 355 46 379 33 152 Manganese Ores and concentrates tonnes 49 731 49 393 50 509 51 271 49 950 Metal tonnes 4 377 5 466 4 636 5 946 10 178 Mercury kilograms 57 200 12 500 505 707 200 Mica Unmanufactured tonnes 2 636 2 395 4 331 1 893 2 402 Ground tonnes 4 086 4 722 3 314 3 803 3 452 Waste tonnes 8 120 1 212 929 1 114 Molybdenum Ores and concentrates tonnes 46 899 42 498 39 523 45 135 48 791 Metal tonnes 142 235 304 720 929 Oxides tonnes 694 1 204 1 659 1 542 862 Nickel Mattes, sinters etc tonnes 330 598 1 541 3 770 968 Scrap tonnes 918 1 553 1 907 2 109 787 Unwrought tonnes 15 052 19 170 19 032 19 343 20 768 Unwrought alloys tonnes 469 574 3 035 11 930 10 110 Oxides tonnes 700 1 033 576 1 322 284 Crude petroleum tonnes 35 234 358 34 059 177 35 087 312 32 729 841 37 638 864 Natural gas tonnes 14 144 704 13 250 074 12 979 827 12 670 698 13 060 915 Phosphate rock tonnes 1 114 210 1 076 842 1 038 397 946 026 876 395 Platinum metals Platinum and platinum metals kilograms 5 189 3 763 3 055 10 418 1 217 Potash Sulphate tonnes 21 604 6 225 15 461 7 775 27 690 Chloride tonnes 744 987 1 511 805 740 726 717 027 660 878 Other potassic fertilisers tonnes 13 668 13 771 3 794 5 567 6 126 Rare earths Metals tonnes 411 205 136 205 6 Cerium compounds tonnes 323 289 146 204 401 Other rare earth compounds tonnes 172 58 41 52 19 Ferro-cerium and other pyrophoric alloys tonnes 2 0 7 0 1 Salt tonnes 1 751 650 2 001 517 1 272 556 1 696 164 1 620 942 Sillimanite minerals Sillimanite minerals tonnes 53 115 50 427 32 683 31 070 38 669 Mullite tonnes 1 955 1 690 4 139 3 391 3 045
14
Belgium Imports continued
Commodity Units 2010 2011 2012 2013 2014
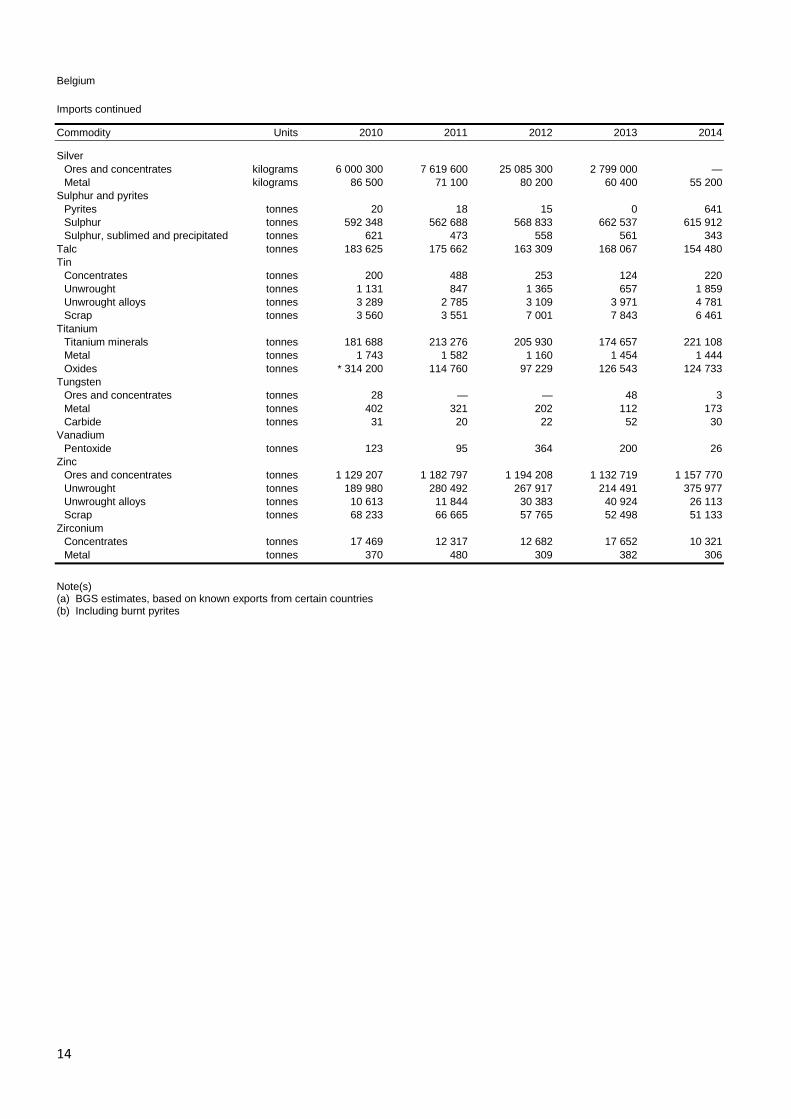
Silver Ores and concentrates kilograms 6 000 300 7 619 600 25 085 300 2 799 000 — Metal kilograms 86 500 71 100 80 200 60 400 55 200 Sulphur and pyrites Pyrites tonnes 20 18 15 0 641 Sulphur tonnes 592 348 562 688 568 833 662 537 615 912 Sulphur, sublimed and precipitated tonnes 621 473 558 561 343 Talc tonnes 183 625 175 662 163 309 168 067 154 480 Tin Concentrates tonnes 200 488 253 124 220 Unwrought tonnes 1 131 847 1 365 657 1 859 Unwrought alloys tonnes 3 289 2 785 3 109 3 971 4 781 Scrap tonnes 3 560 3 551 7 001 7 843 6 461 Titanium Titanium minerals tonnes 181 688 213 276 205 930 174 657 221 108 Metal tonnes 1 743 1 582 1 160 1 454 1 444 Oxides tonnes * 314 200 114 760 97 229 126 543 124 733 Tungsten Ores and concentrates tonnes 28 — — 48 3 Metal tonnes 402 321 202 112 173 Carbide tonnes 31 20 22 52 30 Vanadium Pentoxide tonnes 123 95 364 200 26 Zinc Ores and concentrates tonnes 1 129 207 1 182 797 1 194 208 1 132 719 1 157 770 Unwrought tonnes 189 980 280 492 267 917 214 491 375 977 Unwrought alloys tonnes 10 613 11 844 30 383 40 924 26 113 Scrap tonnes 68 233 66 665 57 765 52 498 51 133 Zirconium Concentrates tonnes 17 469 12 317 12 682 17 652 10 321 Metal tonnes 370 480 309 382 306
Note(s) (a) BGS estimates, based on known exports from certain countries (b) Including burnt pyrites

15
Bulgaria Bulgaria
Production Commodity Units 2010 2011 2012 2013 2014
Primary aggregates Sand and gravel tonnes 5 199 000 10 054 205 9 293 819 8 433 198 9 384 908 Crushed rock tonnes 16 876 900 17 979 678 18 281 353 18 963 207 21 786 053 Barytes tonnes 500 200 — 1 000 20 000 Bentonite tonnes 99 700 53 900 77 900 — * — Bismuth tonnes (metal content) * 3 * 3 * 3 * 3 * 3 Cadmium tonnes 389 427 363 * 360 * 360 Cement Cement, clinker tonnes 2 071 100 1 475 700 * 1 500 000 * 1 500 000 * 1 500 000 Cement, finished tonnes 1 981 971 1 889 502 1 754 204 1 796 021 1 762 366 Coal Lignite tonnes 27 148 300 34 496 200 31 040 700 26 459 300 29 129 000 Brown coal tonnes 2 321 200 2 743 500 2 556 700 2 301 500 2 200 000 Copper, mine (a) tonnes (metal content) 112 904 114 603 118 255 115 149 108 300 Copper, smelter tonnes 247 300 283 800 269 100 294 000 305 000 Copper, refined tonnes 216 000 226 100 226 000 230 100 234 000 Feldspar tonnes * 80 000 * 80 000 * 80 000 * 80 000 * 80 000 Fluorspar tonnes 10 31 800 69 700 82 500 * 82 500 Gold kilograms 4 489 5 302 7 058 7 385 7 899 Gypsum tonnes 109 200 114 800 113 700 119 100 * 119 000 Crude steel tonnes 744 000 835 000 633 000 523 000 612 000 Kaolin tonnes * 16 832 7 700 33 900 22 600 * 32 000 Lead, mine (a) tonnes (metal content) 12 705 14 369 15 949 16 914 15 600 Lead, refined tonnes 98 000 90 000 85 000 90 000 92 000 Manganese tonnes 106 000 85 600 39 100 103 600 * 75 000 Perlite tonnes — — 3 700 — * — Crude petroleum tonnes 22 400 21 400 23 600 27 400 * 26 100 Natural gas million m3 74 443 390 282 181 Salt tonnes 1 900 000 2 200 000 2 100 000 2 000 000 * 2 000 000 Silver kilograms (metal content) * 55 000 * 55 000 * 55 000 * 55 000 * 55 000 Sulphur and pyrites Recovered (b) tonnes (sulphur content) 379 000 411 800 375 800 392 200 * 392 000 Recovered (c) tonnes (sulphur content) 50 000 50 000 55 000 60 000 * 60 000 Vermiculite tonnes * 3 000 * 15 000 * 18 600 * 18 600 * 18 600 Zinc, mine (a) tonnes (metal content) 9 904 10 977 12 116 13 902 11 900 Slab Zinc tonnes 93 800 88 400 73 100 * 72 000 87 800
Notes (1) Bulgaria is believed to produce chromite and magnesite (a) Metal content of ore (b) From metal sulphide processing (c) From petroleum refining and/or natural gas
Exports Commodity Units 2010 2011 2012 2013 2014
Primary aggregates tonnes 262 166 325 857 513 135 377 613 392 669 Aluminium and bauxite Unwrought alloys tonnes 6 798 7 555 5 866 6 440 7 668 Scrap tonnes 31 728 26 302 25 579 22 765 23 585 Barytes Barium minerals tonnes 505 231 — 960 19 373 Bentonite tonnes 72 183 67 118 63 090 45 919 35 954 Bromine kilograms ... 0 0 25 200 100 Cadmium Metal tonnes 474 421 394 382 385

16
Bulgaria
Exports continued
Commodity Units 2010 2011 2012 2013 2014
Cement Cement clinkers tonnes 5 246 8 131 296 372 237 020 270 307 Portland cement tonnes 164 404 190 570 269 199 269 977 112 636 Other cement tonnes 1 772 6 516 21 341 4 713 3 833 Chromium Metal tonnes 2 603 304 91 142 Coal Anthracite tonnes 150 2 538 2 731 2 914 2 560 Other coal tonnes 76 358 123 691 130 739 129 657 63 232 Lignite tonnes 9 525 2 744 635 127 25 357 Copper Ores and concentrates tonnes 86 171 131 874 204 416 231 388 246 882 Matte and cement tonnes 5 048 5 827 4 565 3 967 2 217 Unwrought, unrefined tonnes 7 926 10 844 70 347 121 280 116 252 Unwrought, refined tonnes 206 309 353 450 (a) 202 925 (a) 199 742 (a) 196 880 Scrap tonnes 18 226 12 982 12 318 10 760 8 488 Feldspar tonnes 19 087 19 329 19 414 19 433 18 530 Fluorspar tonnes 821 33 60 986 4 670 Gypsum Crude and calcined tonnes 3 641 10 953 21 872 11 800 19 110 Iodine kilograms 600 600 500 400 500 Iron ore tonnes 1 — 26 823 2 776 156 101 Iron, steel and ferro-alloys Pig iron tonnes 1 141 854 1 249 2 157 1 777 Ferro-manganese tonnes ... 85 153 969 537 Ferro-silico-manganese tonnes 19 1 136 761 1 717 Ferro-molybdenum tonnes ... — — 576 240 Ferro-silicon tonnes 980 248 1 563 1 463 1 679 Other ferro-alloys tonnes 2 115 227 754 1 652 110 Ingots, blooms, billets tonnes 30 327 24 822 14 564 11 786 6 658 Scrap tonnes 949 000 850 898 730 749 610 990 398 988 Kaolin tonnes 159 669 197 114 193 385 200 655 214 229 Lead Ores and concentrates tonnes 4 611 9 331 2 120 6 896 12 174 Unwrought tonnes 78 977 68 472 64 354 73 577 83 056 Magnesite and magnesia Magnesite tonnes — 537 241 94 148 Manganese Ores and concentrates tonnes 163 257 91 110 76 140 50 390 73 996 Molybdenum Ores and concentrates tonnes ... ... 101 304 265 Metal tonnes 122 355 133 139 138 Nickel Scrap tonnes 1 220 2 ... 9 10 Natural gas tonnes (b)* 13 (b)* 5 (b)* 539 (b)* 864 1 416 Platinum metals Platinum and platinum metals kilograms 1 15 22 8 519 Waste and scrap (b) kilograms * 16 000 * 23 000 * 21 000 * 37 000 * 28 000 Salt tonnes 1 078 6 074 170 1 313 892 Silver Ores and concentrates kilograms ... 8 900 ... (b)* 1 449 000 3 469 100 Metal kilograms 37 300 35 200 49 000 52 600 50 200 Sulphur and pyrites Sulphur tonnes 40 286 38 097 41 601 45 592 39 738 Titanium Metal tonnes — 849 64 114 26 Oxides tonnes 584 987 408 258 274 Tungsten Metal tonnes 80 11 12 5 11 Zinc Unwrought (a) tonnes 81 332 71 894 57 768 54 272 60 880 Scrap tonnes 1 949 2 021 2 185 1 353 1 382
Note(s) (a) Including alloys (b) BGS estimates, based on known imports into certain countries
17
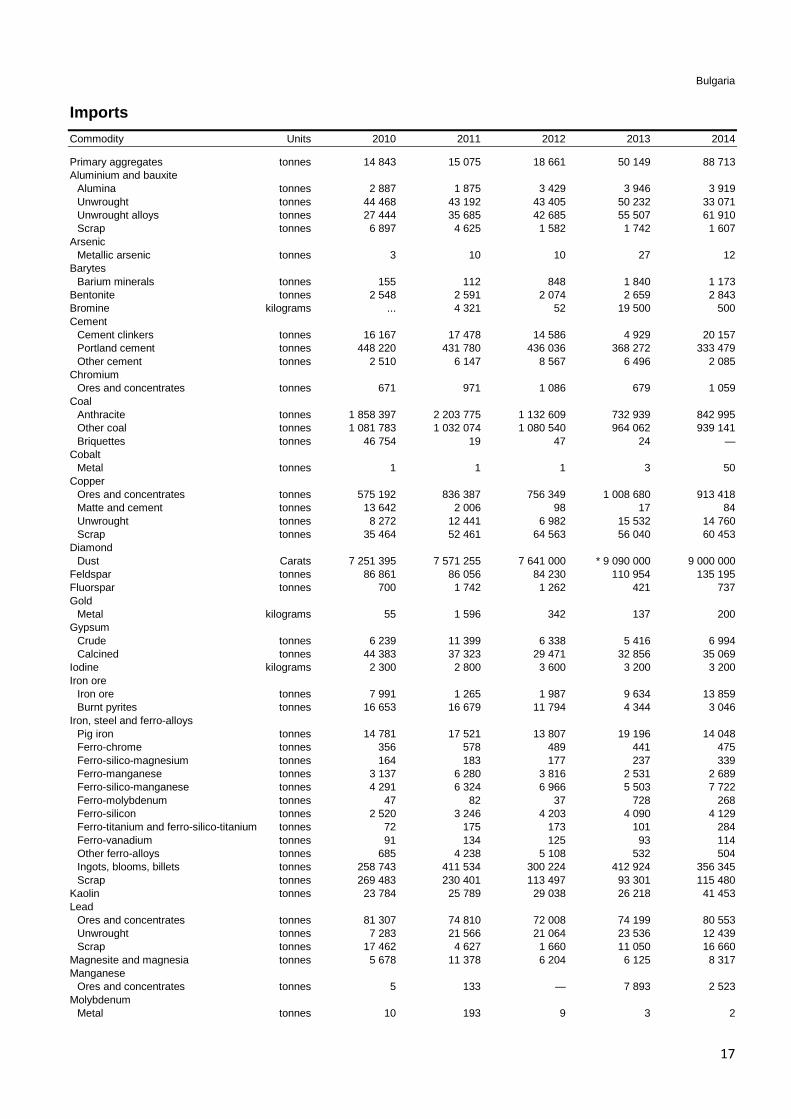
Bulgaria Imports Commodity Units 2010 2011 2012 2013 2014
Primary aggregates tonnes 14 843 15 075 18 661 50 149 88 713 Aluminium and bauxite Alumina tonnes 2 887 1 875 3 429 3 946 3 919 Unwrought tonnes 44 468 43 192 43 405 50 232 33 071 Unwrought alloys tonnes 27 444 35 685 42 685 55 507 61 910 Scrap tonnes 6 897 4 625 1 582 1 742 1 607 Arsenic Metallic arsenic tonnes 3 10 10 27 12 Barytes Barium minerals tonnes 155 112 848 1 840 1 173 Bentonite tonnes 2 548 2 591 2 074 2 659 2 843 Bromine kilograms ... 4 321 52 19 500 500 Cement Cement clinkers tonnes 16 167 17 478 14 586 4 929 20 157 Portland cement tonnes 448 220 431 780 436 036 368 272 333 479 Other cement tonnes 2 510 6 147 8 567 6 496 2 085 Chromium Ores and concentrates tonnes 671 971 1 086 679 1 059 Coal Anthracite tonnes 1 858 397 2 203 775 1 132 609 732 939 842 995 Other coal tonnes 1 081 783 1 032 074 1 080 540 964 062 939 141 Briquettes tonnes 46 754 19 47 24 — Cobalt Metal tonnes 1 1 1 3 50 Copper Ores and concentrates tonnes 575 192 836 387 756 349 1 008 680 913 418 Matte and cement tonnes 13 642 2 006 98 17 84 Unwrought tonnes 8 272 12 441 6 982 15 532 14 760 Scrap tonnes 35 464 52 461 64 563 56 040 60 453 Diamond Dust Carats 7 251 395 7 571 255 7 641 000 * 9 090 000 9 000 000 Feldspar tonnes 86 861 86 056 84 230 110 954 135 195 Fluorspar tonnes 700 1 742 1 262 421 737 Gold Metal kilograms 55 1 596 342 137 200 Gypsum Crude tonnes 6 239 11 399 6 338 5 416 6 994 Calcined tonnes 44 383 37 323 29 471 32 856 35 069 Iodine kilograms 2 300 2 800 3 600 3 200 3 200 Iron ore Iron ore tonnes 7 991 1 265 1 987 9 634 13 859 Burnt pyrites tonnes 16 653 16 679 11 794 4 344 3 046 Iron, steel and ferro-alloys Pig iron tonnes 14 781 17 521 13 807 19 196 14 048 Ferro-chrome tonnes 356 578 489 441 475 Ferro-silico-magnesium tonnes 164 183 177 237 339 Ferro-manganese tonnes 3 137 6 280 3 816 2 531 2 689 Ferro-silico-manganese tonnes 4 291 6 324 6 966 5 503 7 722 Ferro-molybdenum tonnes 47 82 37 728 268 Ferro-silicon tonnes 2 520 3 246 4 203 4 090 4 129 Ferro-titanium and ferro-silico-titanium tonnes 72 175 173 101 284 Ferro-vanadium tonnes 91 134 125 93 114 Other ferro-alloys tonnes 685 4 238 5 108 532 504 Ingots, blooms, billets tonnes 258 743 411 534 300 224 412 924 356 345 Scrap tonnes 269 483 230 401 113 497 93 301 115 480 Kaolin tonnes 23 784 25 789 29 038 26 218 41 453 Lead Ores and concentrates tonnes 81 307 74 810 72 008 74 199 80 553 Unwrought tonnes 7 283 21 566 21 064 23 536 12 439 Scrap tonnes 17 462 4 627 1 660 11 050 16 660 Magnesite and magnesia tonnes 5 678 11 378 6 204 6 125 8 317 Manganese Ores and concentrates tonnes 5 133 — 7 893 2 523 Molybdenum Metal tonnes 10 193 9 3 2

18
Bulgaria Imports continued
Commodity Units 2010 2011 2012 2013 2014
Nickel Unwrought (a) tonnes 125 201 172 160 167 Crude petroleum tonnes 5 355 541 4 999 511 5 901 767 5 726 184 5 073 523 Natural gas tonnes 2 003 357 2 551 044 1 925 287 1 688 459 1 643 658 Phosphate rock tonnes 455 539 570 288 535 571 410 404 577 889 Potash Potassic fertilisers tonnes 7 985 3 210 9 948 15 194 8 463 Salt tonnes 215 355 214 732 252 392 163 880 181 412 Silver Ores and concentrates kilograms 91 ... ... 88 200 ... Metal kilograms 2 408 4 300 12 800 4 900 3 400 Talc tonnes 512 985 956 960 862 Tin Unwrought (a) tonnes 47 359 215 353 136 Titanium Titanium minerals tonnes 506 486 735 — 26 Metal tonnes 19 46 127 89 75 Oxides tonnes 5 675 6 454 4 593 4 897 4 885 Tungsten Metal tonnes 86 16 30 21 21 Zinc Ores and concentrates tonnes 167 107 166 553 132 500 127 158 129 405 Unwrought (a) tonnes 1 761 2 765 6 878 2 765 8 846 Zirconium Concentrates tonnes 781 609 95 231 172
Note(s) (a) Including alloys

19
Croatia Croatia
Production Commodity Units 2010 2011 2012 2013 2014
Primary aggregates Sand and gravel tonnes 3 646 572 5 012 106 4 345 920 3 779 919 3 496 693 Bauxite tonnes 2 300 4 800 5 690 8 220 * 8 000 Primary aluminium tonnes 666 600 — — — Gypsum tonnes 248 675 231 008 182 557 114 450 120 055 Crude steel tonnes 103 429 162 709 1 016 135 000 159 000 Crude petroleum tonnes 748 791 664 440 620 835 620 795 558 327 Natural gas million m3 2 727 2 471 2 013 1 862 1 804 Salt tonnes 66 835 53 963 45 992 42 502 33 039 Sulphur and pyrites Recovered (a) tonnes (sulphur content) 6 834 14 725 17 411 15 902 19 384
Notes (a) From petroleum refining and/or natural gas
Exports Commodity Units 2010 2011 2012 2013 2014
Primary aggregates tonnes 1 858 348 992 712 586 991 556 143 821 856 Aluminium and bauxite Unwrought tonnes 2 338 2 674 2 161 2 553 2 472 Unwrought alloys tonnes 1 017 2 055 2 114 2 516 2 384 Scrap tonnes 22 346 23 009 23 867 19 095 20 454 Cement Cement clinkers tonnes 176 403 103 281 284 480 324 551 398 469 Portland cement tonnes 639 236 1 189 738 897 747 1 250 523 1 260 578 Other cement tonnes 601 470 180 836 102 405 146 025 201 659 Coal Hard coal tonnes (a) 1 156 (a) 488 (a) 10 733 (a) 20 914 Copper Scrap tonnes 13 329 12 597 14 016 11 319 10 669 Gold Metal kilograms 256 1 408 6 046 4 200 2 900 Waste and scrap kilograms ... ... ... 500 1 100 Iron, steel and ferro-alloys Ferro-alloys tonnes 6 526 5 254 2 368 73 131 Silicon metal tonnes 1 ... 6 3 912 5 055 Ingots, blooms, billets tonnes 2 495 30 004 4 041 78 244 117 777 Scrap tonnes 357 015 517 438 516 600 349 730 350 706 Lead Scrap tonnes 1 697 1 842 1 906 2 051 2 051 Natural gas tonnes 347 567 180 323 174 291 260 560 247 564 Platinum metals Waste and scrap kilograms 53 996 24 958 36 441 35 000 (b)* 32 700 Potash Chloride tonnes 3 212 217 1 033 77 Salt tonnes 20 721 24 561 21 548 26 247 19 141 Silver Metal kilograms 93 839 2 558 5 500 900 Sulphur and pyrites Sulphur tonnes 6 565 14 256 15 801 12 917 17 107 Titanium Oxides tonnes 117 172 42 519 983 Zinc Scrap tonnes 518 676 764 833 1 023
Note(s) (a) Including anthracite

20
Croatia Imports Commodity Units 2010 2011 2012 2013 2014
Primary aggregates tonnes 926 574 1 366 197 1 689 891 1 446 658 978 064 Aluminium and bauxite Bauxite tonnes 85 634 66 169 67 410 73 689 93 847 Alumina tonnes 936 1 552 889 954 2 457 Unwrought tonnes 50 354 45 493 54 040 38 781 21 086 Unwrought alloys tonnes 29 270 40 783 31 807 40 502 48 986 Barytes Barium minerals tonnes 710 125 2 225 1 105 847 Bentonite tonnes 7 852 16 906 5 394 6 391 4 746 Bromine (a) kilograms 67 120 168 22 911 45 Cement Cement clinkers tonnes 967 144 44 9 2 415 Portland cement tonnes 344 352 326 526 315 804 261 584 311 539 Other cement tonnes 7 619 4 200 1 001 1 197 6 537 Chromium Metal tonnes 419 345 404 177 14 Coal Anthracite tonnes 1 325 2 332 234 2 658 4 194 Other coal tonnes 1 111 497 1 090 562 874 882 1 178 367 956 749 Lignite tonnes 85 413 85 316 44 423 49 158 41 246 Briquettes tonnes 1 823 2 302 2 175 6 848 3 142 Copper Unwrought tonnes 944 1 627 3 447 2 894 3 063 Diatomite tonnes 402 555 616 598 652 Feldspar tonnes 14 763 14 001 11 676 11 503 12 223 Fluorspar tonnes 146 3 527 15 513 18 082 35 Gypsum Crude tonnes 1 608 11 421 13 269 37 283 36 261 Calcined tonnes 14 076 12 709 11 790 9 308 10 276 Iodine kilograms 204 233 195 400 900 Iron ore tonnes (b) 20 125 2 123 (b) 2 764 1 924 1 822 Iron, steel and ferro-alloys Pig iron tonnes 10 343 14 072 12 353 13 950 12 973 Ferro-chrome tonnes 54 61 46 25 544 Ferro-manganese tonnes 135 546 59 361 1 027 Ferro-silico-manganese tonnes 2 005 743 56 927 1 003 Ferro-phosphorus tonnes 168 196 192 184 164 Ferro-silicon tonnes 1 416 878 828 1 055 862 Other ferro-alloys tonnes 441 262 234 26 137 Silicon metal tonnes 95 208 347 16 466 2 295 Ingots, blooms, billets tonnes 6 514 1 943 14 199 2 139 2 142 Scrap tonnes 30 395 44 335 4 875 43 945 91 041 Kaolin tonnes 10 238 11 278 8 655 9 456 8 417 Magnesite and magnesia tonnes 1 208 1 061 710 2 019 1 083 Crude petroleum tonnes 3 517 452 2 838 313 2 324 685 2 461 651 1 851 207 Natural gas tonnes 587 846 579 005 971 008 1 032 104 768 131 Phosphate rock tonnes 51 010 67 007 56 303 48 227 37 285 Potash Chloride tonnes 132 471 102 879 115 375 75 526 90 036 Other potassic fertilisers tonnes 1 749 3 717 1 314 2 233 1 402 Rare earths Ferro-cerium and other pyrophoric alloys tonnes 106 133 116 52 29 Salt tonnes 287 609 190 963 201 542 256 162 155 427 Silver Metal kilograms 3 212 3 868 3 309 2 859 2 700 Sulphur and pyrites Sulphur tonnes 2 877 2 752 1 503 176 395 Sulphur, sublimed and precipitated tonnes 105 156 142 116 269 Talc tonnes 1 813 1 578 1 774 1 989 2 739 Titanium Oxides tonnes 3 000 2 911 2 194 3 257 2 954
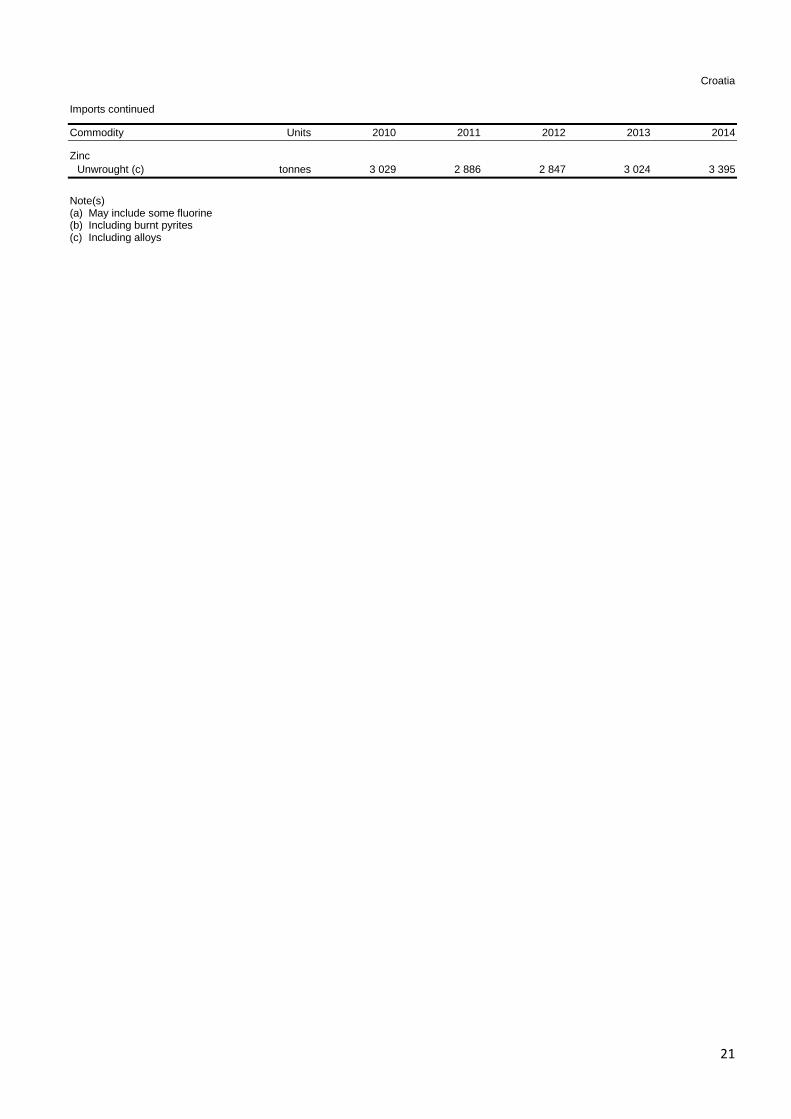
21
Croatia Imports continued
Commodity Units 2010 2011 2012 2013 2014
Zinc Unwrought (c) tonnes 3 029 2 886 2 847 3 024 3 395
Note(s) (a) May include some fluorine (b) Including burnt pyrites (c) Including alloys

22
Cyprus Cyprus
Production Commodity Units 2010 2011 2012 2013 2014
Primary aggregates Crushed rock tonnes 12 981 444 11 816 397 7 308 056 4 561 152 4 039 087 Bentonite tonnes 162 969 160 625 160 180 158 386 140 174 Cement Cement, clinker tonnes — — 23 363 807 041 1 106 605 Cement, finished tonnes 1 328 763 1 206 786 1 025 666 854 778 734 692 Copper, mine tonnes (metal content) 2 595 3 660 4 328 3 631 3 088 Copper, refined tonnes 2 595 3 660 4 328 3 631 3 088 Gypsum tonnes 333 000 335 000 327 800 315 000 347 600
Exports Commodity Units 2010 2011 2012 2013 2014
Primary aggregates tonnes — 2 78 67 2 Aluminium and bauxite Scrap tonnes 6 896 6 310 7 688 5 595 5 738 Bentonite tonnes 98 803 114 923 130 413 122 699 116 581 Cement Cement clinkers tonnes — — 6 535 739 613 963 022 Portland cement tonnes 12 866 42 438 248 521 343 434 233 978 Copper Unwrought tonnes 2 550 3 660 4 328 3 615 3 088 Scrap tonnes 4 619 4 086 5 435 3 511 2 910 Gold Metal kilograms 300 600 1 200 1 300 2 000 Gypsum Crude and calcined tonnes 250 034 248 284 249 250 248 863 297 086 Iodine kilograms ... ... ... ... 1 700 Iron, steel and ferro-alloys Scrap tonnes 96 654 138 529 136 351 103 981 78 944 Lead Scrap tonnes 252 465 237 1 056 1 494 Salt tonnes 7 929 6 260 5 765 2 308 5 290 Silver Metal kilograms 400 1 900 2 500 1 200 200
Imports Commodity Units 2010 2011 2012 2013 2014
Primary aggregates tonnes 2 648 1 517 16 792 1 432 1 716 Aluminium and bauxite Unwrought (a) tonnes 9 225 7 104 6 458 4 768 4 136 Barytes Barium minerals tonnes 5 58 2 848 — Bentonite tonnes 4 629 142 280 6 246 4 193 Cement Cement clinkers tonnes 29 579 69 780 6 498 10 100 3 307 Portland cement tonnes 2 512 545 416 466 91 Other cement tonnes 242 138 78 113 2 365 Coal Hard coal (b) tonnes 7 714 129 164 386 5 170 Diamond Gem, cut Carats £955 000 £976 000 £921 000 £697 000 £647 000 Industrial Carats £1 007 000 £944 000 £1 474 000 £1 137 000 £1 779 000
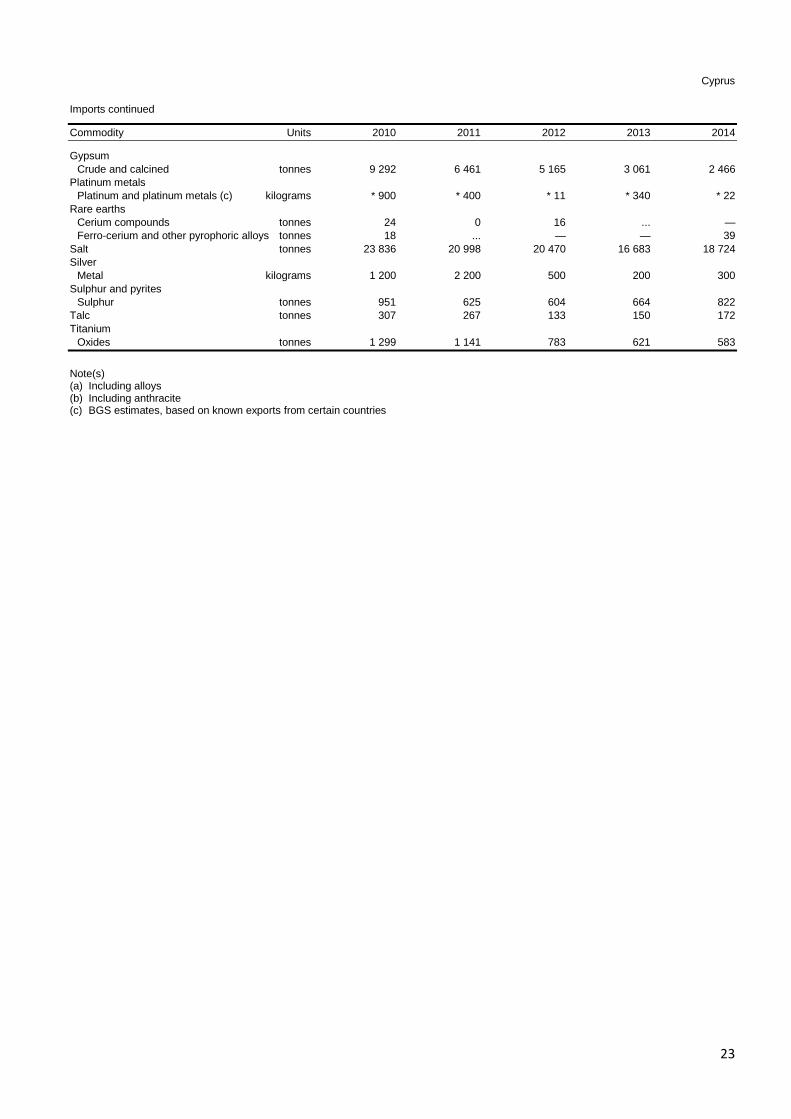
23
Cyprus
Imports continued
Commodity Units 2010 2011 2012 2013 2014
Gypsum Crude and calcined tonnes 9 292 6 461 5 165 3 061 2 466 Platinum metals Platinum and platinum metals (c) kilograms * 900 * 400 * 11 * 340 * 22 Rare earths Cerium compounds tonnes 24 0 16 ... — Ferro-cerium and other pyrophoric alloys tonnes 18 ... — — 39 Salt tonnes 23 836 20 998 20 470 16 683 18 724 Silver Metal kilograms 1 200 2 200 500 200 300 Sulphur and pyrites Sulphur tonnes 951 625 604 664 822 Talc tonnes 307 267 133 150 172 Titanium Oxides tonnes 1 299 1 141 783 621 583
Note(s) (a) Including alloys (b) Including anthracite (c) BGS estimates, based on known exports from certain countries
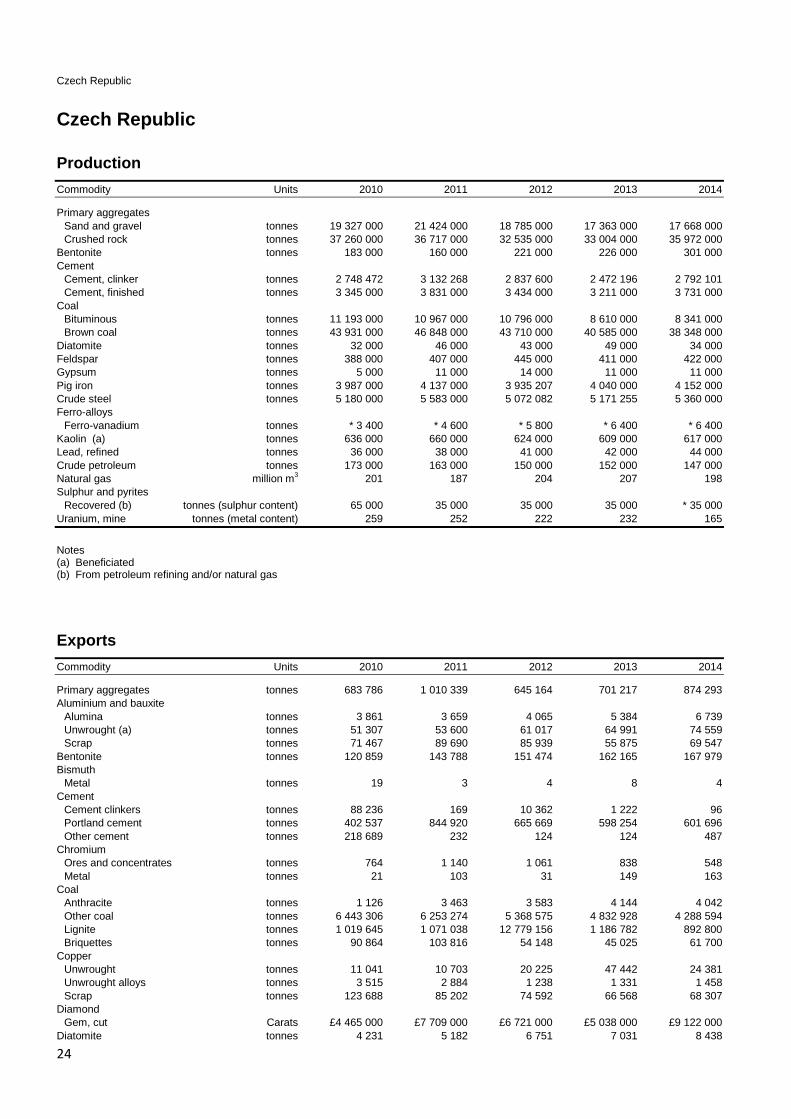
24
Czech Republic Czech Republic
Production Commodity Units 2010 2011 2012 2013 2014
Primary aggregates Sand and gravel tonnes 19 327 000 21 424 000 18 785 000 17 363 000 17 668 000 Crushed rock tonnes 37 260 000 36 717 000 32 535 000 33 004 000 35 972 000 Bentonite tonnes 183 000 160 000 221 000 226 000 301 000 Cement Cement, clinker tonnes 2 748 472 3 132 268 2 837 600 2 472 196 2 792 101 Cement, finished tonnes 3 345 000 3 831 000 3 434 000 3 211 000 3 731 000 Coal Bituminous tonnes 11 193 000 10 967 000 10 796 000 8 610 000 8 341 000 Brown coal tonnes 43 931 000 46 848 000 43 710 000 40 585 000 38 348 000 Diatomite tonnes 32 000 46 000 43 000 49 000 34 000 Feldspar tonnes 388 000 407 000 445 000 411 000 422 000 Gypsum tonnes 5 000 11 000 14 000 11 000 11 000 Pig iron tonnes 3 987 000 4 137 000 3 935 207 4 040 000 4 152 000 Crude steel tonnes 5 180 000 5 583 000 5 072 082 5 171 255 5 360 000 Ferro-alloys Ferro-vanadium tonnes * 3 400 * 4 600 * 5 800 * 6 400 * 6 400 Kaolin (a) tonnes 636 000 660 000 624 000 609 000 617 000 Lead, refined tonnes 36 000 38 000 41 000 42 000 44 000 Crude petroleum tonnes 173 000 163 000 150 000 152 000 147 000 Natural gas million m3 201 187 204 207 198 Sulphur and pyrites Recovered (b) tonnes (sulphur content) 65 000 35 000 35 000 35 000 * 35 000 Uranium, mine tonnes (metal content) 259 252 222 232 165
Notes (a) Beneficiated (b) From petroleum refining and/or natural gas
Exports Commodity Units 2010 2011 2012 2013 2014
Primary aggregates tonnes 683 786 1 010 339 645 164 701 217 874 293 Aluminium and bauxite Alumina tonnes 3 861 3 659 4 065 5 384 6 739 Unwrought (a) tonnes 51 307 53 600 61 017 64 991 74 559 Scrap tonnes 71 467 89 690 85 939 55 875 69 547 Bentonite tonnes 120 859 143 788 151 474 162 165 167 979 Bismuth Metal tonnes 19 3 4 8 4 Cement Cement clinkers tonnes 88 236 169 10 362 1 222 96 Portland cement tonnes 402 537 844 920 665 669 598 254 601 696 Other cement tonnes 218 689 232 124 124 487 Chromium Ores and concentrates tonnes 764 1 140 1 061 838 548 Metal tonnes 21 103 31 149 163 Coal Anthracite tonnes 1 126 3 463 3 583 4 144 4 042 Other coal tonnes 6 443 306 6 253 274 5 368 575 4 832 928 4 288 594 Lignite tonnes 1 019 645 1 071 038 12 779 156 1 186 782 892 800 Briquettes tonnes 90 864 103 816 54 148 45 025 61 700 Copper Unwrought tonnes 11 041 10 703 20 225 47 442 24 381 Unwrought alloys tonnes 3 515 2 884 1 238 1 331 1 458 Scrap tonnes 123 688 85 202 74 592 66 568 68 307 Diamond Gem, cut Carats £4 465 000 £7 709 000 £6 721 000 £5 038 000 £9 122 000 Diatomite tonnes 4 231 5 182 6 751 7 031 8 438
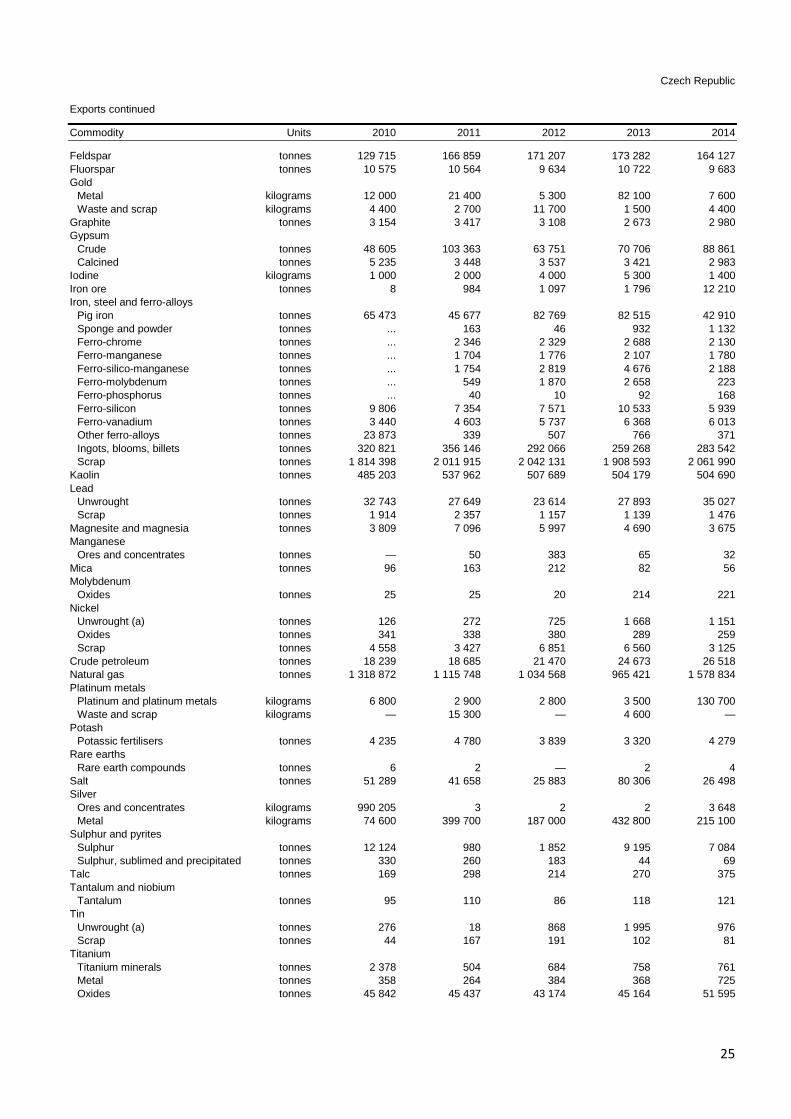
25
Czech Republic
Exports continued
Commodity Units 2010 2011 2012 2013 2014
Feldspar tonnes 129 715 166 859 171 207 173 282 164 127 Fluorspar tonnes 10 575 10 564 9 634 10 722 9 683 Gold Metal kilograms 12 000 21 400 5 300 82 100 7 600 Waste and scrap kilograms 4 400 2 700 11 700 1 500 4 400 Graphite tonnes 3 154 3 417 3 108 2 673 2 980 Gypsum Crude tonnes 48 605 103 363 63 751 70 706 88 861 Calcined tonnes 5 235 3 448 3 537 3 421 2 983 Iodine kilograms 1 000 2 000 4 000 5 300 1 400 Iron ore tonnes 8 984 1 097 1 796 12 210 Iron, steel and ferro-alloys Pig iron tonnes 65 473 45 677 82 769 82 515 42 910 Sponge and powder tonnes ... 163 46 932 1 132 Ferro-chrome tonnes ... 2 346 2 329 2 688 2 130 Ferro-manganese tonnes ... 1 704 1 776 2 107 1 780 Ferro-silico-manganese tonnes ... 1 754 2 819 4 676 2 188 Ferro-molybdenum tonnes ... 549 1 870 2 658 223 Ferro-phosphorus tonnes ... 40 10 92 168 Ferro-silicon tonnes 9 806 7 354 7 571 10 533 5 939 Ferro-vanadium tonnes 3 440 4 603 5 737 6 368 6 013 Other ferro-alloys tonnes 23 873 339 507 766 371 Ingots, blooms, billets tonnes 320 821 356 146 292 066 259 268 283 542 Scrap tonnes 1 814 398 2 011 915 2 042 131 1 908 593 2 061 990 Kaolin tonnes 485 203 537 962 507 689 504 179 504 690 Lead Unwrought tonnes 32 743 27 649 23 614 27 893 35 027 Scrap tonnes 1 914 2 357 1 157 1 139 1 476 Magnesite and magnesia tonnes 3 809 7 096 5 997 4 690 3 675 Manganese Ores and concentrates tonnes — 50 383 65 32 Mica tonnes 96 163 212 82 56 Molybdenum Oxides tonnes 25 25 20 214 221 Nickel Unwrought (a) tonnes 126 272 725 1 668 1 151 Oxides tonnes 341 338 380 289 259 Scrap tonnes 4 558 3 427 6 851 6 560 3 125 Crude petroleum tonnes 18 239 18 685 21 470 24 673 26 518 Natural gas tonnes 1 318 872 1 115 748 1 034 568 965 421 1 578 834 Platinum metals Platinum and platinum metals kilograms 6 800 2 900 2 800 3 500 130 700 Waste and scrap kilograms — 15 300 — 4 600 — Potash Potassic fertilisers tonnes 4 235 4 780 3 839 3 320 4 279 Rare earths Rare earth compounds tonnes 6 2 — 2 4 Salt tonnes 51 289 41 658 25 883 80 306 26 498 Silver Ores and concentrates kilograms 990 205 3 2 2 3 648 Metal kilograms 74 600 399 700 187 000 432 800 215 100 Sulphur and pyrites Sulphur tonnes 12 124 980 1 852 9 195 7 084 Sulphur, sublimed and precipitated tonnes 330 260 183 44 69 Talc tonnes 169 298 214 270 375 Tantalum and niobium Tantalum tonnes 95 110 86 118 121 Tin Unwrought (a) tonnes 276 18 868 1 995 976 Scrap tonnes 44 167 191 102 81 Titanium Titanium minerals tonnes 2 378 504 684 758 761 Metal tonnes 358 264 384 368 725 Oxides tonnes 45 842 45 437 43 174 45 164 51 595

26
Czech Republic
Exports continued
Commodity Units 2010 2011 2012 2013 2014
Tungsten Ores and concentrates tonnes ... ... ... 20 45 Metal tonnes 211 611 1 011 1 110 1 122 Carbide tonnes 803 903 863 949 1 174 Zinc Unwrought (a) tonnes 5 148 5 147 7 407 13 112 61 347 Scrap tonnes 4 798 4 189 4 432 3 364 3 276
Note(s) (a) Including alloys
Imports Commodity Units 2010 2011 2012 2013 2014
Primary aggregates tonnes 353 419 357 455 352 553 405 141 740 057 Aluminium and bauxite Bauxite tonnes 33 794 32 556 27 514 24 765 56 797 Alumina tonnes 7 407 7 980 7 682 9 089 10 222 Alumina hydrate tonnes 9 547 10 052 8 851 9 574 9 478 Unwrought tonnes 76 945 84 560 77 128 71 737 58 878 Unwrought alloys tonnes 135 648 153 819 141 484 166 166 208 080 Scrap tonnes 61 802 86 969 103 385 81 351 74 357 Antimony Metal tonnes 75 64 31 42 103 Oxide tonnes 379 356 411 367 375 Barytes Barium minerals tonnes 7 004 7 431 7 008 6 525 7 783 Bentonite tonnes 18 472 48 326 51 865 54 095 70 095 Bismuth Metal tonnes 106 264 110 101 110 Cadmium Oxide tonnes 464 487 439 415 380 Cement Cement clinkers tonnes 121 682 44 577 86 089 141 404 203 640 Portland cement tonnes 702 257 765 382 638 364 593 385 503 497 Other cement tonnes 48 336 31 074 26 875 9 941 8 143 Chromium Ores and concentrates tonnes 7 986 7 986 8 413 6 897 6 974 Metal tonnes 514 139 147 218 307 Coal Anthracite tonnes 24 471 95 762 121 247 183 417 88 545 Other coal tonnes 2 016 443 2 286 190 1 833 669 1 940 720 3 019 631 Lignite tonnes 49 426 91 889 350 322 304 216 1 358 543 Briquettes tonnes 137 933 157 513 156 682 167 695 135 442 Cobalt Metal tonnes 60 74 77 83 89 Oxides tonnes 20 20 32 57 38 Copper Unwrought tonnes 6 846 6 252 16 354 29 583 12 923 Unwrought alloys tonnes 3 674 3 388 1 867 2 400 2 663 Scrap tonnes 11 804 18 859 18 874 14 107 9 449 Diamond Gem, cut Carats 5 567 6 796 * 10 000 * 7 000 * 6 000 Dust Carats £1 704 000 £1 954 000 £2 057 000 £2 229 000 £1 873 000 Diatomite tonnes 2 753 3 263 3 829 3 694 6 927 Feldspar tonnes 6 298 6 527 4 735 5 920 5 575 Fluorspar tonnes 14 495 15 547 15 388 17 129 13 911 Gold Metal kilograms 2 600 23 800 3 600 5 500 5 100 Waste and scrap kilograms 84 000 192 500 245 400 12 200 14 800 Graphite tonnes 3 605 5 149 4 757 5 588 4 965
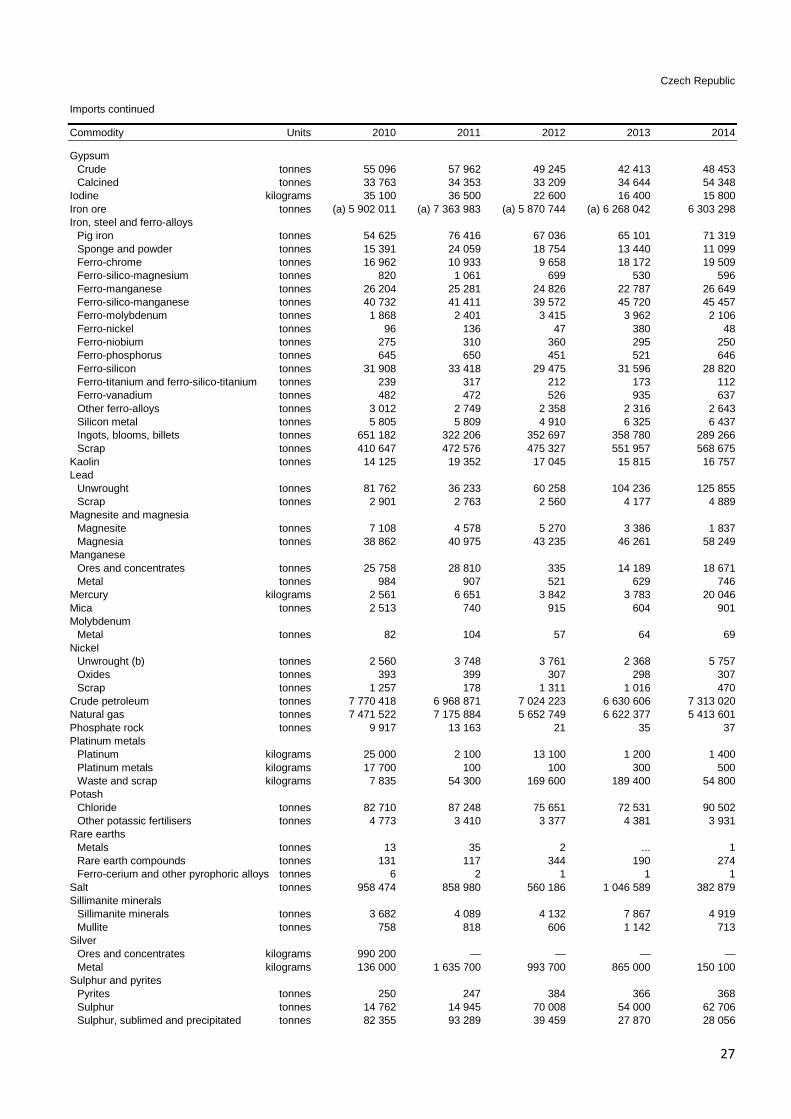
27
Czech Republic Imports continued
Commodity Units 2010 2011 2012 2013 2014
Gypsum Crude tonnes 55 096 57 962 49 245 42 413 48 453 Calcined tonnes 33 763 34 353 33 209 34 644 54 348 Iodine kilograms 35 100 36 500 22 600 16 400 15 800 Iron ore tonnes (a) 5 902 011 (a) 7 363 983 (a) 5 870 744 (a) 6 268 042 6 303 298 Iron, steel and ferro-alloys Pig iron tonnes 54 625 76 416 67 036 65 101 71 319 Sponge and powder tonnes 15 391 24 059 18 754 13 440 11 099 Ferro-chrome tonnes 16 962 10 933 9 658 18 172 19 509 Ferro-silico-magnesium tonnes 820 1 061 699 530 596 Ferro-manganese tonnes 26 204 25 281 24 826 22 787 26 649 Ferro-silico-manganese tonnes 40 732 41 411 39 572 45 720 45 457 Ferro-molybdenum tonnes 1 868 2 401 3 415 3 962 2 106 Ferro-nickel tonnes 96 136 47 380 48 Ferro-niobium tonnes 275 310 360 295 250 Ferro-phosphorus tonnes 645 650 451 521 646 Ferro-silicon tonnes 31 908 33 418 29 475 31 596 28 820 Ferro-titanium and ferro-silico-titanium tonnes 239 317 212 173 112 Ferro-vanadium tonnes 482 472 526 935 637 Other ferro-alloys tonnes 3 012 2 749 2 358 2 316 2 643 Silicon metal tonnes 5 805 5 809 4 910 6 325 6 437 Ingots, blooms, billets tonnes 651 182 322 206 352 697 358 780 289 266 Scrap tonnes 410 647 472 576 475 327 551 957 568 675 Kaolin tonnes 14 125 19 352 17 045 15 815 16 757 Lead Unwrought tonnes 81 762 36 233 60 258 104 236 125 855 Scrap tonnes 2 901 2 763 2 560 4 177 4 889 Magnesite and magnesia Magnesite tonnes 7 108 4 578 5 270 3 386 1 837 Magnesia tonnes 38 862 40 975 43 235 46 261 58 249 Manganese Ores and concentrates tonnes 25 758 28 810 335 14 189 18 671 Metal tonnes 984 907 521 629 746 Mercury kilograms 2 561 6 651 3 842 3 783 20 046 Mica tonnes 2 513 740 915 604 901 Molybdenum Metal tonnes 82 104 57 64 69 Nickel Unwrought (b) tonnes 2 560 3 748 3 761 2 368 5 757 Oxides tonnes 393 399 307 298 307 Scrap tonnes 1 257 178 1 311 1 016 470 Crude petroleum tonnes 7 770 418 6 968 871 7 024 223 6 630 606 7 313 020 Natural gas tonnes 7 471 522 7 175 884 5 652 749 6 622 377 5 413 601 Phosphate rock tonnes 9 917 13 163 21 35 37 Platinum metals Platinum kilograms 25 000 2 100 13 100 1 200 1 400 Platinum metals kilograms 17 700 100 100 300 500 Waste and scrap kilograms 7 835 54 300 169 600 189 400 54 800 Potash Chloride tonnes 82 710 87 248 75 651 72 531 90 502 Other potassic fertilisers tonnes 4 773 3 410 3 377 4 381 3 931 Rare earths Metals tonnes 13 35 2 ... 1 Rare earth compounds tonnes 131 117 344 190 274 Ferro-cerium and other pyrophoric alloys tonnes 6 2 1 1 1 Salt tonnes 958 474 858 980 560 186 1 046 589 382 879 Sillimanite minerals Sillimanite minerals tonnes 3 682 4 089 4 132 7 867 4 919 Mullite tonnes 758 818 606 1 142 713 Silver Ores and concentrates kilograms 990 200 — — — — Metal kilograms 136 000 1 635 700 993 700 865 000 150 100 Sulphur and pyrites Pyrites tonnes 250 247 384 366 368 Sulphur tonnes 14 762 14 945 70 008 54 000 62 706 Sulphur, sublimed and precipitated tonnes 82 355 93 289 39 459 27 870 28 056

28
Czech Republic Imports continued
Commodity Units 2010 2011 2012 2013 2014
Talc tonnes 9 570 12 686 8 827 9 735 14 617 Tantalum and niobium Tantalum tonnes 265 222 175 224 246 Tin Unwrought tonnes 319 479 478 353 707 Unwrought alloys tonnes 130 172 153 882 334 Titanium Titanium minerals tonnes 155 485 146 778 98 071 100 317 107 926 Metal tonnes 779 1 333 1 717 1 884 1 956 Oxides tonnes 8 857 9 372 7 763 8 863 10 398 Tungsten Ores and concentrates tonnes ... 314 799 100 6 Metal tonnes 677 367 968 506 437 Carbide tonnes 150 219 88 198 723 Vanadium Pentoxide tonnes 5 255 7 004 8 672 9 478 9 202 Zinc Unwrought tonnes 15 121 17 137 19 064 21 687 65 712 Unwrought alloys tonnes 11 653 10 590 11 947 8 524 8 852 Scrap tonnes 900 909 583 177 161 Zirconium Concentrates tonnes 303 955 595 682 767 Metal tonnes 37 34 24 46 187
Note(s) (a) Including burnt pyrites (b) Including alloys

29
Denmark
Denmark
Production Commodity Units 2010 2011 2012 2013 2014
Primary aggregates Sand and gravel tonnes 33 978 000 42 878 000 39 332 000 * 38 000 000 35 761 666 Crushed rock tonnes 240 000 337 000 293 000 243 000 223 000 Bentonite tonnes 23 832 38 300 30 330 56 355 66 388 Cement Cement, clinker tonnes 3 819 25 24 256 — 9 081 Cement, finished tonnes 1 566 624 1 852 804 1 817 334 1 852 445 1 876 095 Diatomite Moler (a) tonnes 124 000 126 000 111 000 128 125 118 750 Crude petroleum tonnes 12 090 000 10 909 000 9 968 000 8 657 000 8 159 150 Natural gas million m3 7 792 6 262 5 480 4 566 4 502 Salt tonnes 601 046 * 595 000 * 590 000 580 000 * 580 000 Sulphur and pyrites Recovered (b) tonnes (sulphur content) 3 246 3 045 3 925 3 599 4 435
Notes (1) Denmark is also believed to produce kaolin (a) Moler is an impure diatomite containing a large proportion of clay (b) From petroleum refining and/or natural gas
Exports Commodity Units 2010 2011 2012 2013 2014
Primary aggregates tonnes 907 149 961 853 1 224 741 1 433 979 1 612 849 Aluminium and bauxite Bauxite tonnes 3 279 6 769 9 432 4 600 386 Alumina tonnes 4 661 4 958 5 879 4 709 6 863 Unwrought alloys tonnes 9 515 7 382 7 440 7 896 6 579 Scrap tonnes 73 402 67 000 73 392 73 142 82 766 Barytes Barium minerals tonnes (a)* 50 (a)* 1 300 (a)* 300 (a)* 700 1 111 Bentonite tonnes 13 787 13 827 17 711 20 620 36 421 Cement Cement clinkers tonnes 11 884 2 689 24 658 598 10 929 Portland cement tonnes 731 730 813 938 767 554 754 399 781 786 Other cement tonnes 3 860 4 175 4 565 4 574 5 580 Chromium Metal tonnes 1 056 601 548 427 505 Coal Hard coal tonnes 61 612 153 532 (b) 10 585 (b) 80 771 (b) 166 259 Copper Scrap tonnes 30 006 33 289 27 276 29 167 32 745 Diamond Unsorted Carats ... 2 875 000 60 000 — — Gem, cut Carats 520 000 545 000 360 000 3 500 000 2 500 000 Industrial Carats 90 000 125 000 55 000 65 000 — Dust Carats 7 625 000 24 850 000 18 500 000 10 000 — Diatomite (a) tonnes * 57 300 * 56 800 * 42 700 * 55 700 * 57 000 Gold Metal kilograms 761 1 224 1 556 5 560 1 000 Waste and scrap kilograms 500 1 800 3 000 1 300 300 Gypsum Crude tonnes 2 211 63 5 155 126 15 Calcined tonnes 8 299 6 725 13 990 1 748 1 603

30
Denmark
Exports continued
Commodity Units 2010 2011 2012 2013 2014
Iron, steel and ferro-alloys Pig iron tonnes 239 1 102 1 681 674 579 Ferro-silicon tonnes 77 164 1 043 602 197 Other ferro-alloys tonnes 54 43 48 52 146 Ingots, blooms, billets tonnes 19 143 21 926 21 050 21 075 16 654 Scrap tonnes 1 596 485 1 554 808 1 359 467 1 245 646 1 690 566 Kaolin tonnes 607 1 370 1 489 1 245 966 Lead Unwrought tonnes 896 478 588 1 375 1 095 Scrap tonnes 3 485 4 118 4 167 5 165 6 160 Magnesite and magnesia Magnesia tonnes 522 497 179 437 376 Nickel Scrap tonnes 1 765 1 244 590 314 278 Crude petroleum tonnes 7 363 518 6 899 354 5 896 071 6 000 228 4 157 006 Natural gas (a) tonnes * 1 044 000 * 836 000 * 729 000 * 1 527 000 * 905 000 Platinum metals Platinum and platinum metals kilograms 200 100 200 600 300 Potash Chloride tonnes 69 2 123 2 579 2 628 5 425 Other potassic fertilisers tonnes 683 8 898 7 664 5 891 5 202 Salt tonnes 319 317 296 459 391 879 324 030 370 885 Silver Ores and concentrates kilograms ... 422 100 1 533 800 645 100 874 600 Metal kilograms 30 300 53 800 30 100 29 700 147 400 Sulphur and pyrites Sulphur tonnes 12 39 4 814 14 543 46 Talc tonnes 409 235 235 188 105 Tin Unwrought tonnes 1 208 81 98 141 Scrap tonnes 35 71 69 36 147 Titanium Metal tonnes 196 125 194 193 316 Oxides tonnes 820 5 792 10 732 10 385 10 131 Tungsten Metal tonnes 113 118 32 12 58 Zinc Unwrought (c) tonnes 318 635 789 1 060 727 Scrap tonnes 2 563 2 468 2 617 2 271 2 565
Note(s) (a) BGS estimates, based on known imports into certain countries (b) Including anthracite (c) Including alloys
Imports Commodity Units 2010 2011 2012 2013 2014
Primary aggregates tonnes 2 777 604 3 531 658 3 934 656 3 688 045 3 777 573 Aluminium and bauxite Bauxite tonnes 8 364 9 112 7 515 10 371 4 677 Alumina tonnes 22 484 21 012 25 210 28 552 29 012 Unwrought tonnes 523 742 2 730 19 795 33 056 Unwrought alloys tonnes 78 956 85 315 75 066 34 687 24 821 Scrap tonnes 5 175 5 891 5 267 13 785 6 419 Barytes Barium minerals tonnes 17 749 20 497 8 262 16 259 11 217 Bentonite tonnes 43 049 34 130 41 931 38 382 42 097 Cement Cement clinkers tonnes 23 732 29 888 24 464 25 822 27 510 Portland cement tonnes 180 249 244 007 211 379 209 012 208 431 Other cement tonnes 38 797 19 941 19 569 15 876 19 652
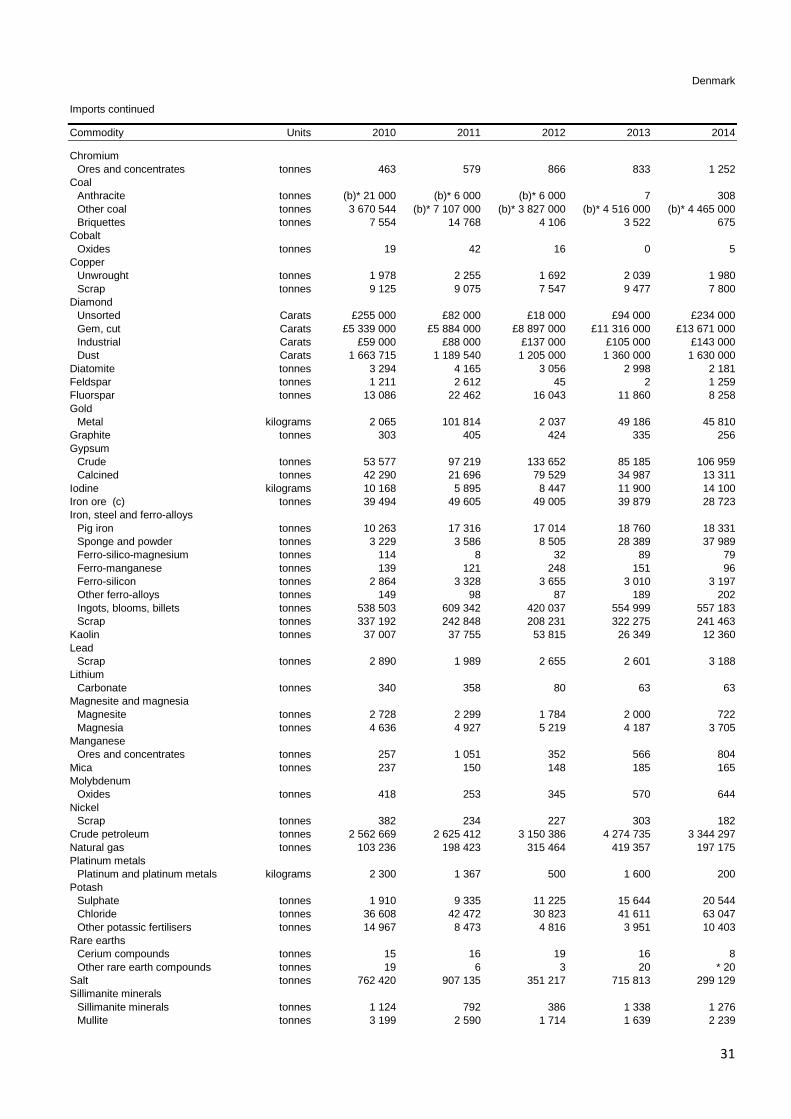
31
Denmark Imports continued
Commodity Units 2010 2011 2012 2013 2014
Chromium Ores and concentrates tonnes 463 579 866 833 1 252 Coal Anthracite tonnes (b)* 21 000 (b)* 6 000 (b)* 6 000 7 308 Other coal tonnes 3 670 544 (b)* 7 107 000 (b)* 3 827 000 (b)* 4 516 000 (b)* 4 465 000 Briquettes tonnes 7 554 14 768 4 106 3 522 675 Cobalt Oxides tonnes 19 42 16 0 5 Copper Unwrought tonnes 1 978 2 255 1 692 2 039 1 980 Scrap tonnes 9 125 9 075 7 547 9 477 7 800 Diamond Unsorted Carats £255 000 £82 000 £18 000 £94 000 £234 000 Gem, cut Carats £5 339 000 £5 884 000 £8 897 000 £11 316 000 £13 671 000 Industrial Carats £59 000 £88 000 £137 000 £105 000 £143 000 Dust Carats 1 663 715 1 189 540 1 205 000 1 360 000 1 630 000 Diatomite tonnes 3 294 4 165 3 056 2 998 2 181 Feldspar tonnes 1 211 2 612 45 2 1 259 Fluorspar tonnes 13 086 22 462 16 043 11 860 8 258 Gold Metal kilograms 2 065 101 814 2 037 49 186 45 810 Graphite tonnes 303 405 424 335 256 Gypsum Crude tonnes 53 577 97 219 133 652 85 185 106 959 Calcined tonnes 42 290 21 696 79 529 34 987 13 311 Iodine kilograms 10 168 5 895 8 447 11 900 14 100 Iron ore (c) tonnes 39 494 49 605 49 005 39 879 28 723 Iron, steel and ferro-alloys Pig iron tonnes 10 263 17 316 17 014 18 760 18 331 Sponge and powder tonnes 3 229 3 586 8 505 28 389 37 989 Ferro-silico-magnesium tonnes 114 8 32 89 79 Ferro-manganese tonnes 139 121 248 151 96 Ferro-silicon tonnes 2 864 3 328 3 655 3 010 3 197 Other ferro-alloys tonnes 149 98 87 189 202 Ingots, blooms, billets tonnes 538 503 609 342 420 037 554 999 557 183 Scrap tonnes 337 192 242 848 208 231 322 275 241 463 Kaolin tonnes 37 007 37 755 53 815 26 349 12 360 Lead Scrap tonnes 2 890 1 989 2 655 2 601 3 188 Lithium Carbonate tonnes 340 358 80 63 63 Magnesite and magnesia Magnesite tonnes 2 728 2 299 1 784 2 000 722 Magnesia tonnes 4 636 4 927 5 219 4 187 3 705 Manganese Ores and concentrates tonnes 257 1 051 352 566 804 Mica tonnes 237 150 148 185 165 Molybdenum Oxides tonnes 418 253 345 570 644 Nickel Scrap tonnes 382 234 227 303 182 Crude petroleum tonnes 2 562 669 2 625 412 3 150 386 4 274 735 3 344 297 Natural gas tonnes 103 236 198 423 315 464 419 357 197 175 Platinum metals Platinum and platinum metals kilograms 2 300 1 367 500 1 600 200 Potash Sulphate tonnes 1 910 9 335 11 225 15 644 20 544 Chloride tonnes 36 608 42 472 30 823 41 611 63 047 Other potassic fertilisers tonnes 14 967 8 473 4 816 3 951 10 403 Rare earths Cerium compounds tonnes 15 16 19 16 8 Other rare earth compounds tonnes 19 6 3 20 * 20 Salt tonnes 762 420 907 135 351 217 715 813 299 129 Sillimanite minerals Sillimanite minerals tonnes 1 124 792 386 1 338 1 276 Mullite tonnes 3 199 2 590 1 714 1 639 2 239

32
Denmark Imports continued
Commodity Units 2010 2011 2012 2013 2014
Silver Metal kilograms 620 284 160 312 132 719 381 138 283 638 Sulphur and pyrites Sulphur tonnes 7 051 6 123 4 173 4 339 4 253 Talc tonnes 7 013 6 276 6 883 6 469 6 025 Tin Unwrought (a) tonnes 110 136 195 173 170 Titanium Metal tonnes 674 1 723 1 948 1 036 1 255 Oxides tonnes 20 427 23 296 17 706 20 220 22 668 Zinc Unwrought tonnes 4 427 6 023 6 877 6 968 6 605 Unwrought alloys tonnes 1 310 954 923 1 343 1 239
Note(s) (a) Including alloys (b) BGS estimates, based on known exports from certain countries (c) Including burnt pyrites

33
Estonia Estonia
Production Commodity Units 2010 2011 2012 2013 2014
Primary aggregates Sand and gravel tonnes 3 469 220 3 568 680 3 954 600 5 201 380 5 078 160 Crushed rock tonnes 5 849 600 5 919 500 6 170 200 6 463 100 5 909 000 Cement Cement, clinker tonnes 537 000 719 000 714 600 691 400 721 000 Cement, finished tonnes 375 000 451 000 481 500 456 700 447 000 Crude steel tonnes — 1 185 157 200 Lead, refined tonnes 7 200 7 800 8 046 7 581 8 588 Crude petroleum (a) tonnes 2 080 000 2 173 132 2 180 313 2 379 253 2 359 463
Notes (a) From oil shale
Exports Commodity Units 2010 2011 2012 2013 2014
Primary aggregates tonnes 810 298 745 353 689 854 625 329 636 548 Aluminium and bauxite Bauxite tonnes ... 29 492 23 317 ... ... Unwrought (a) tonnes 4 132 52 1 220 1 090 1 014 Scrap tonnes 65 948 63 880 11 342 10 523 10 323 Antimony Metal tonnes 67 113 ... — — Cadmium Metal tonnes ... ... 564 378 386 Cement Cement clinkers tonnes 222 190 426 994 347 754 346 684 363 908 Portland cement tonnes 148 505 186 255 208 131 202 614 193 939 Other cement tonnes 488 752 1 107 3 28 Coal Hard coal tonnes (b) 16 452 (b) 2 312 (b) 741 1 0 Copper Unwrought tonnes 1 790 744 2 386 860 854 Scrap tonnes 6 915 5 171 5 549 5 820 5 733 Gold Metal kilograms 400 2 300 1 600 2 300 1 500 Gypsum Crude and calcined tonnes 87 105 1 781 1 282 956 Iodine kilograms ... ... ... 15 000 10 400 Iron, steel and ferro-alloys Ferro-manganese tonnes ... ... 36 45 108 Ferro-titanium and ferro-silico-titanium tonnes ... ... 502 1 641 7 480 Other ferro-alloys tonnes 124 142 474 489 270 Scrap tonnes 512 766 563 124 631 831 517 330 424 235 Kaolin tonnes 878 830 1 019 352 591 Lead Unwrought tonnes 10 624 11 513 11 042 10 334 10 739 Molybdenum Ores and concentrates tonnes 40 80 180 848 260 Nickel Unwrought tonnes (a) 2 2 539 (a) 2 (a) 24 Scrap tonnes 0 536 144 20 — Crude petroleum tonnes — 1 062 3 124 12 056 11 532 Platinum metals Platinum and platinum metals kilograms ... — 654 500 — Waste and scrap kilograms 7 700 9 100 8 800 103 800 133 700 Potash Potassic fertilisers tonnes 48 693 242 131 2

34
Estonia
Exports continued
Commodity Units 2010 2011 2012 2013 2014
Rare earths Metals tonnes 1 0 42 77 — Rare earth compounds tonnes 1 686 1 124 3 210 3 482 2 802 Salt tonnes 2 055 3 685 2 968 4 383 4 956 Silver Metal kilograms 200 4 600 1 600 1 400 900 Sulphur and pyrites Sulphur tonnes 45 621 — — — Tantalum and niobium Tantalum tonnes 34 76 49 24 38 Tin Scrap tonnes 120 56 121 276 143 Titanium Metal tonnes 26 33 23 41 58 Oxides tonnes 49 164 468 396 44 Tungsten Metal tonnes 1 ... 61 4 —
Note(s) (a) Including alloys (b) Including anthracite
Imports Commodity Units 2010 2011 2012 2013 2014
Primary aggregates tonnes 1 395 122 1 302 589 1 215 348 1 308 292 1 197 158 Aluminium and bauxite Unwrought (a) tonnes 3 176 2 231 2 811 902 907 Scrap tonnes 4 495 2 488 488 250 349 Bentonite tonnes 3 352 2 937 2 670 2 958 3 294 Cement Cement clinkers tonnes 13 474 (b)* 1 800 4 688 4 526 5 132 Portland cement tonnes 36 354 52 807 27 404 34 852 42 847 Other cement tonnes 827 1 545 13 043 31 565 42 817 Coal Hard coal (c) tonnes 77 300 89 422 81 082 58 945 82 302 Copper Unwrought tonnes 520 484 1 480 395 129 Scrap tonnes 391 335 508 801 2 001 Feldspar tonnes 94 109 17 881 2 477 88 Gold Metal kilograms 900 1 600 900 3 200 1 600 Gypsum Crude tonnes 11 295 11 922 16 772 13 952 24 475 Calcined tonnes 8 950 8 343 7 718 8 328 7 892 Iodine kilograms 13 157 258 39 5 024 10 400 Iron, steel and ferro-alloys Ferro-manganese tonnes 182 64 85 52 126 Ferro-niobium tonnes 438 374 411 410 462 Ferro-silicon tonnes 21 149 61 83 103 Ferro-titanium and ferro-silico-titanium tonnes ... ... 11 500 2 984 Other ferro-alloys tonnes 31 15 17 51 89 Scrap tonnes 8 434 12 230 8 305 25 634 103 833 Kaolin tonnes 881 211 8 568 3 090 3 326 Magnesite and magnesia Magnesia tonnes 297 382 380 528 596 Manganese Metal tonnes 576 85 — 71 24 Natural gas tonnes 491 806 478 288 452 299 535 232 382 921 Platinum metals Waste and scrap kilograms ... ... — 59 600 114 500

35
Estonia
Imports continued
Commodity Units 2010 2011 2012 2013 2014
Potash Chloride tonnes 1 517 1 898 2 438 3 120 4 669 Other potassic fertilisers tonnes 57 1 491 1 960 372 1 047 Rare earths Cerium compounds tonnes 24 501 545 300 235 Other rare earth compounds tonnes 2 105 3 616 4 499 4 494 6 057 Salt tonnes 73 254 85 105 73 248 43 617 65 197 Silver Metal kilograms 3 200 5 000 1 700 3 700 1 800 Sulphur and pyrites Sulphur tonnes 1 2 1 344 1 224 1 487 Talc tonnes 373 451 429 467 361 Tantalum and niobium Tantalum tonnes 37 20 1 — 8 Titanium Metal tonnes 82 5 683 2 229 3 985 Oxides tonnes 1 409 1 724 1 921 1 808 1 312 Zinc Unwrought (a) tonnes 5 978 8 887 4 987 664 705
Note(s) (a) Including alloys (b) BGS estimates, based on known exports from certain countries (c) Including anthracite

36
Finland Finland
Production Commodity Units 2010 2011 2012 2013 2014
Primary aggregates Sand and gravel tonnes * 36 000 000 * 36 000 000 * 34 000 000 * 34 000 000 * 32 000 000 Crushed rock tonnes * 48 000 000 * 53 000 000 * 54 000 000 * 49 000 000 * 47 000 000 Cement Cement, finished (a) tonnes 1 215 244 1 387 479 1 292 855 1 271 378 1 255 468 Chromium (b) tonnes 598 000 692 527 425 217 981 752 1 034 750 Cobalt, mine tonnes (metal content) * 140 480 * 1 381 2 061 2 104 Cobalt, metal tonnes 9 429 10 627 10 562 10 798 12 551 Copper, mine tonnes (metal content) 14 700 14 000 25 446 38 763 42 790 Copper, smelter tonnes 120 528 124 360 129 256 135 840 146 542 Copper, refined tonnes 112 687 124 360 129 256 135 840 146 542 Feldspar tonnes 28 013 26 292 43 124 47 636 46 233 Germanium tonnes 12 12 16 17 17 Gold kilograms 5 896 6 674 9 100 8 660 8 085 Pig iron tonnes 2 564 000 2 600 000 2 461 000 2 100 000 2 500 000 Crude steel tonnes 4 029 000 3 989 000 3 759 000 3 517 000 3 808 000 Ferro-alloys Ferro-chrome tonnes 238 000 231 000 229 000 434 000 441 000 Mercury kilograms 9 000 5 000 — — — Mica tonnes 13 809 12 896 12 112 11 244 11 973 Nickel, mine tonnes (metal content) 12 100 18 244 19 073 18 560 19 700 Nickel, smelter/refinery tonnes 49 772 49 823 46 275 44 498 42 750 Phosphate rock tonnes 817 289 869 694 858 005 877 189 946 234 Platinum metals kilograms Platinum kilograms (metal content) — — 429 946 1 060 Palladium kilograms (metal content) — — 379 766 808 Selenium metal tonnes 73 86 93 72 94 Silver kilograms (metal content) 11 020 11 160 10 479 14 226 12 830 Sulphur and pyrites Pyrites tonnes (sulphur content) 250 000 338 000 375 000 347 000 353 000 Recovered (c) tonnes (sulphur content) 269 449 319 971 329 831 315 958 336 168 Recovered (d) tonnes (sulphur content) 122 000 133 300 121 700 130 000 * 130 000 Talc tonnes 419 345 429 494 396 332 361 840 380 821 Wollastonite tonnes 12 100 11 500 * 11 500 * 11 500 * 11 500 Zinc, mine tonnes (metal content) 55 562 64 115 52 200 41 124 46 100 Slab zinc tonnes 307 144 307 352 314 742 311 686 302 000
Notes (1) Finland is believed to produce arsenic (a) Sales (b) Concentrates (c) From metal sulphide processing (d) From petroleum refining and/or natural gas
Exports Commodity Units 2010 2011 2012 2013 2014
Primary aggregates tonnes 1 396 025 2 020 822 953 926 712 702 772 390 Aluminium and bauxite Unwrought alloys tonnes 15 346 11 289 14 185 15 200 15 107 Scrap tonnes 33 304 38 862 43 221 48 252 51 067 Bentonite tonnes 0 61 27 123 540 Bromine kilograms ... 22 200 — — — Cement Portland cement tonnes 373 92 6 1 172 191 Chromium Ores and concentrates tonnes 8 291 5 231 4 575 3 424 148 Metal tonnes 1 813 2 366 1 950 2 542 174
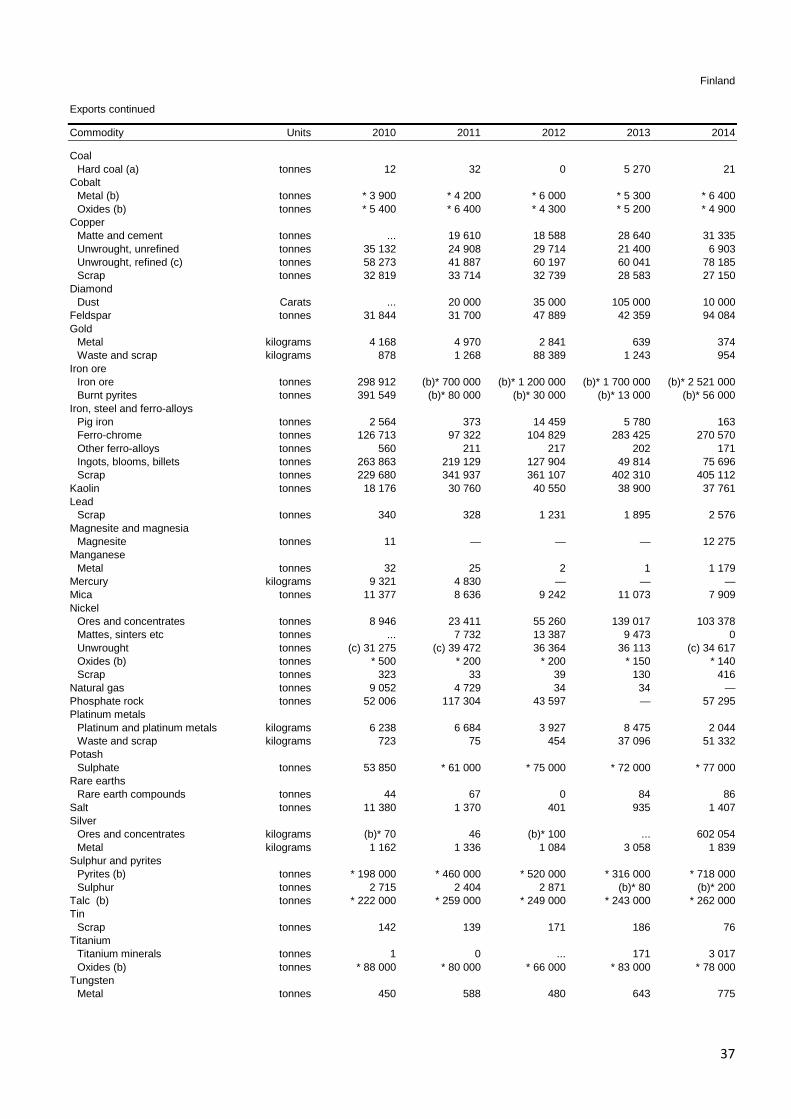
37
Finland
Exports continued
Commodity Units 2010 2011 2012 2013 2014
Coal Hard coal (a) tonnes 12 32 0 5 270 21 Cobalt Metal (b) tonnes * 3 900 * 4 200 * 6 000 * 5 300 * 6 400 Oxides (b) tonnes * 5 400 * 6 400 * 4 300 * 5 200 * 4 900 Copper Matte and cement tonnes ... 19 610 18 588 28 640 31 335 Unwrought, unrefined tonnes 35 132 24 908 29 714 21 400 6 903 Unwrought, refined (c) tonnes 58 273 41 887 60 197 60 041 78 185 Scrap tonnes 32 819 33 714 32 739 28 583 27 150 Diamond Dust Carats ... 20 000 35 000 105 000 10 000 Feldspar tonnes 31 844 31 700 47 889 42 359 94 084 Gold Metal kilograms 4 168 4 970 2 841 639 374 Waste and scrap kilograms 878 1 268 88 389 1 243 954 Iron ore Iron ore tonnes 298 912 (b)* 700 000 (b)* 1 200 000 (b)* 1 700 000 (b)* 2 521 000 Burnt pyrites tonnes 391 549 (b)* 80 000 (b)* 30 000 (b)* 13 000 (b)* 56 000 Iron, steel and ferro-alloys Pig iron tonnes 2 564 373 14 459 5 780 163 Ferro-chrome tonnes 126 713 97 322 104 829 283 425 270 570 Other ferro-alloys tonnes 560 211 217 202 171 Ingots, blooms, billets tonnes 263 863 219 129 127 904 49 814 75 696 Scrap tonnes 229 680 341 937 361 107 402 310 405 112 Kaolin tonnes 18 176 30 760 40 550 38 900 37 761 Lead Scrap tonnes 340 328 1 231 1 895 2 576 Magnesite and magnesia Magnesite tonnes 11 — — — 12 275 Manganese Metal tonnes 32 25 2 1 1 179 Mercury kilograms 9 321 4 830 — — — Mica tonnes 11 377 8 636 9 242 11 073 7 909 Nickel Ores and concentrates tonnes 8 946 23 411 55 260 139 017 103 378 Mattes, sinters etc tonnes ... 7 732 13 387 9 473 0 Unwrought tonnes (c) 31 275 (c) 39 472 36 364 36 113 (c) 34 617 Oxides (b) tonnes * 500 * 200 * 200 * 150 * 140 Scrap tonnes 323 33 39 130 416 Natural gas tonnes 9 052 4 729 34 34 — Phosphate rock tonnes 52 006 117 304 43 597 — 57 295 Platinum metals Platinum and platinum metals kilograms 6 238 6 684 3 927 8 475 2 044 Waste and scrap kilograms 723 75 454 37 096 51 332 Potash Sulphate tonnes 53 850 * 61 000 * 75 000 * 72 000 * 77 000 Rare earths Rare earth compounds tonnes 44 67 0 84 86 Salt tonnes 11 380 1 370 401 935 1 407 Silver Ores and concentrates kilograms (b)* 70 46 (b)* 100 ... 602 054 Metal kilograms 1 162 1 336 1 084 3 058 1 839 Sulphur and pyrites Pyrites (b) tonnes * 198 000 * 460 000 * 520 000 * 316 000 * 718 000 Sulphur tonnes 2 715 2 404 2 871 (b)* 80 (b)* 200 Talc (b) tonnes * 222 000 * 259 000 * 249 000 * 243 000 * 262 000 Tin Scrap tonnes 142 139 171 186 76 Titanium Titanium minerals tonnes 1 0 ... 171 3 017 Oxides (b) tonnes * 88 000 * 80 000 * 66 000 * 83 000 * 78 000 Tungsten Metal tonnes 450 588 480 643 775

38
Finland
Exports continued
Commodity Units 2010 2011 2012 2013 2014
Zinc Ores and concentrates tonnes 22 479 50 656 39 555 29 613 15 395 Unwrought (c) tonnes 266 738 265 686 271 313 272 632 263 422 Scrap tonnes 1 369 1 215 1 066 935 80
Note(s) (a) Including anthracite (b) BGS estimates, based on known imports into certain countries (c) Including alloys
Imports Commodity Units 2010 2011 2012 2013 2014
Primary aggregates tonnes 284 066 52 920 96 804 137 333 126 704 Aluminium and bauxite Bauxite tonnes 9 294 3 036 1 328 3 168 3 504 Alumina tonnes 2 401 2 422 2 479 3 057 2 571 Alumina hydrate tonnes 29 607 25 676 22 996 26 702 34 704 Unwrought tonnes 2 008 2 070 1 596 1 691 2 091 Unwrought alloys tonnes 37 539 37 589 32 897 33 081 36 068 Scrap tonnes 15 466 15 803 14 080 14 731 14 880 Barytes Barium minerals tonnes 4 406 4 383 4 101 3 988 4 847 Bentonite tonnes 16 293 21 194 24 913 26 294 26 397 Bromine kilograms 318 478 322 231 441 332 371 829 345 578 Cement Cement clinkers tonnes 14 191 16 790 7 512 2 912 1 368 Portland cement tonnes 587 410 549 673 498 577 401 067 422 293 Other cement tonnes 10 202 16 408 13 870 20 606 20 825 Chromium Ores and concentrates tonnes 9 197 20 853 9 372 3 726 2 527 Metal tonnes 139 194 139 94 137 Coal Hard coal (a) tonnes 5 919 757 6 972 540 3 954 916 5 064 181 5 436 916 Cobalt Ore tonnes 9 867 8 994 7 477 5 352 3 237 Metal tonnes 30 623 53 059 54 106 39 435 66 293 Oxides tonnes 233 172 298 154 26 Copper Ores and concentrates tonnes 458 174 415 365 424 982 391 822 423 149 Unwrought tonnes 4 212 4 711 6 366 2 330 5 284 Unwrought alloys tonnes 2 783 2 528 1 819 2 067 2 023 Scrap tonnes 6 967 7 726 9 839 7 444 15 832 Diamond Unsorted Carats £419 000 £315 000 £288 000 £228 000 £180 000 Gem, rough Carats £165 000 £131 000 £111 000 £41 000 ... Gem, cut Carats £3 575 000 £3 346 000 £3 201 000 £3 018 000 £1 992 000 Industrial Carats 65 000 520 000 20 000 40 000 20 000 Dust Carats 519 830 773 725 645 000 735 000 585 000 Diatomite tonnes 4 367 3 432 3 426 2 724 2 672 Feldspar tonnes 1 209 1 217 4 902 5 660 8 333 Fluorspar tonnes 16 740 17 605 16 818 15 398 17 582 Gold Metal kilograms 650 595 1 358 905 975 Gypsum Crude tonnes 235 787 182 082 223 784 150 748 119 917 Calcined tonnes 7 281 11 020 9 270 7 061 7 728 Iodine kilograms 1 443 1 174 856 719 794 Iron ore tonnes (b) 3 052 609 3 728 222 3 220 998 (b) 2 903 196 (b) 3 091 635

39
Finland
Imports continued
Commodity Units 2010 2011 2012 2013 2014
Iron, steel and ferro-alloys Pig iron tonnes 36 120 31 235 21 728 20 360 21 725 Sponge and powder tonnes 872 476 1 871 1 102 1 361 1 783 Ferro-chrome tonnes 7 055 8 274 33 392 6 865 7 949 Ferro-silico-magnesium tonnes 190 158 220 100 65 Ferro-manganese tonnes 10 595 11 784 10 170 9 005 10 661 Ferro-silico-manganese tonnes 30 204 30 169 * 22 000 30 757 31 309 Ferro-molybdenum tonnes 1 316 1 717 * 1 200 1 001 1 374 Ferro-nickel tonnes 25 746 40 962 * 51 000 35 930 75 230 Ferro-niobium tonnes 629 849 874 804 1 110 Ferro-phosphorus tonnes 543 499 325 537 374 Ferro-silicon tonnes 31 395 30 207 34 361 34 600 36 493 Ferro-titanium and ferro-silico-titanium tonnes 1 043 1 843 942 994 1 072 Ferro-vanadium tonnes 235 193 134 119 181 Other ferro-alloys tonnes 4 648 4 839 1 545 1 260 1 061 Silicon metal tonnes 1 390 1 281 845 1 821 5 370 Ingots, blooms, billets tonnes 18 268 17 119 10 111 12 616 4 205 Scrap tonnes 754 726 710 558 * 600 000 * 556 007 * 783 502 Kaolin tonnes 941 387 936 544 860 241 806 954 745 438 Lead Unwrought tonnes 1 512 2 446 3 821 4 146 4 245 Magnesite and magnesia Magnesite tonnes 118 576 568 264 — Magnesia tonnes 7 387 9 214 8 959 8 074 8 153 Manganese Ores and concentrates tonnes 21 961 3 792 329 248 229 Metal tonnes 2 134 2 123 2 144 1 747 1 818 Mercury kilograms 2 203 4 069 36 17 31 Mica tonnes 3 647 3 351 2 267 208 265 Molybdenum Ores and concentrates tonnes (c)* 1 724 (c)* 1 679 (c)* 2 013 3 864 5 531 Nickel Mattes, sinters etc tonnes 33 986 35 284 30 443 29 502 19 562 Ores and concentrates tonnes 217 164 276 892 276 587 240 116 307 179 Unwrought tonnes 14 558 9 946 — 7 878 1 233 Unwrought alloys tonnes 17 649 2 688 — 490 4 729 Crude petroleum tonnes 11 211 580 11 504 505 11 088 493 11 639 775 11 608 880 Natural gas tonnes 3 252 037 3 543 126 * 3 042 000 * 2 166 000 * 1 450 000 Phosphate rock tonnes 28 144 10 181 (c)* 52 41 664 (c)* 168 Platinum metals Platinum and platinum metals kilograms 385 356 57 429 107 271 246 Waste and scrap kilograms ... ... — — 1 777 Potash Chloride (d) tonnes 194 800 211 100 207 500 232 400 226 500 Other potassic fertilisers tonnes 117 4 602 1 100 9 192 Rare earths Cerium compounds tonnes 72 52 18 23 14 Other rare earth compounds tonnes 8 14 5 3 1 Ferro-cerium and other pyrophoric alloys tonnes 2 2 10 12 11 Salt tonnes 384 089 452 873 385 359 380 753 423 978 Silver Metal kilograms 50 681 26 764 19 618 13 828 14 647 Sulphur and pyrites Sulphur tonnes 21 676 38 923 29 283 16 558 25 298 Sulphur, sublimed and precipitated tonnes 3 4 43 210 163 Talc tonnes 1 202 1 929 1 624 1 153 961 Tantalum and niobium Tantalum tonnes * 0 * 0 * 0 * 87 * 9 Tin Unwrought (e) tonnes 188 136 124 77 249 Titanium Titanium minerals tonnes (c)* 20 (c)* 3 154 (c)* 20 39 888 (c)* 10 Metal tonnes 60 66 81 62 246 Oxides tonnes 15 571 15 533 13 638 14 391 13 669

40
Finland
Imports continued
Commodity Units 2010 2011 2012 2013 2014
Tungsten Metal tonnes 403 567 456 725 824 Zinc Ores and concentrates tonnes 559 918 547 265 558 963 611 240 557 413 Unwrought (e) tonnes 4 374 1 471 1 146 1 565 1 750
Note(s) (a) Including anthracite (b) Including burnt pyrites (c) BGS estimates, based on known exports from certain countries (d) K2O content (e) Including alloys
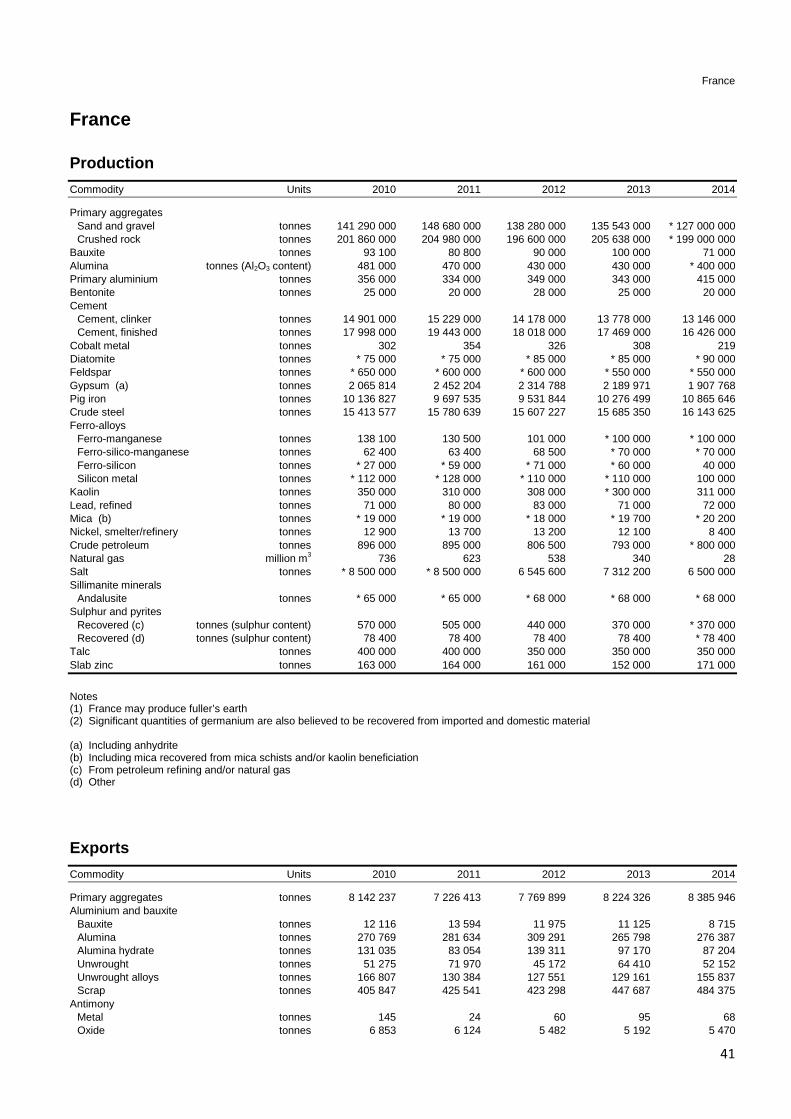
41
France France
Production Commodity Units 2010 2011 2012 2013 2014
Primary aggregates Sand and gravel tonnes 141 290 000 148 680 000 138 280 000 135 543 000 * 127 000 000 Crushed rock tonnes 201 860 000 204 980 000 196 600 000 205 638 000 * 199 000 000 Bauxite tonnes 93 100 80 800 90 000 100 000 71 000 Alumina tonnes (Al2O3 content) 481 000 470 000 430 000 430 000 * 400 000 Primary aluminium tonnes 356 000 334 000 349 000 343 000 415 000 Bentonite tonnes 25 000 20 000 28 000 25 000 20 000 Cement Cement, clinker tonnes 14 901 000 15 229 000 14 178 000 13 778 000 13 146 000 Cement, finished tonnes 17 998 000 19 443 000 18 018 000 17 469 000 16 426 000 Cobalt metal tonnes 302 354 326 308 219 Diatomite tonnes * 75 000 * 75 000 * 85 000 * 85 000 * 90 000 Feldspar tonnes * 650 000 * 600 000 * 600 000 * 550 000 * 550 000 Gypsum (a) tonnes 2 065 814 2 452 204 2 314 788 2 189 971 1 907 768 Pig iron tonnes 10 136 827 9 697 535 9 531 844 10 276 499 10 865 646 Crude steel tonnes 15 413 577 15 780 639 15 607 227 15 685 350 16 143 625 Ferro-alloys Ferro-manganese tonnes 138 100 130 500 101 000 * 100 000 * 100 000 Ferro-silico-manganese tonnes 62 400 63 400 68 500 * 70 000 * 70 000 Ferro-silicon tonnes * 27 000 * 59 000 * 71 000 * 60 000 40 000 Silicon metal tonnes * 112 000 * 128 000 * 110 000 * 110 000 100 000 Kaolin tonnes 350 000 310 000 308 000 * 300 000 311 000 Lead, refined tonnes 71 000 80 000 83 000 71 000 72 000 Mica (b) tonnes * 19 000 * 19 000 * 18 000 * 19 700 * 20 200 Nickel, smelter/refinery tonnes 12 900 13 700 13 200 12 100 8 400 Crude petroleum tonnes 896 000 895 000 806 500 793 000 * 800 000 Natural gas million m3 736 623 538 340 28 Salt tonnes * 8 500 000 * 8 500 000 6 545 600 7 312 200 6 500 000 Sillimanite minerals Andalusite tonnes * 65 000 * 65 000 * 68 000 * 68 000 * 68 000 Sulphur and pyrites Recovered (c) tonnes (sulphur content) 570 000 505 000 440 000 370 000 * 370 000 Recovered (d) tonnes (sulphur content) 78 400 78 400 78 400 78 400 * 78 400 Talc tonnes 400 000 400 000 350 000 350 000 350 000 Slab zinc tonnes 163 000 164 000 161 000 152 000 171 000
Notes (1) France may produce fuller’s earth (2) Significant quantities of germanium are also believed to be recovered from imported and domestic material (a) Including anhydrite (b) Including mica recovered from mica schists and/or kaolin beneficiation (c) From petroleum refining and/or natural gas (d) Other
Exports Commodity Units 2010 2011 2012 2013 2014
Primary aggregates tonnes 8 142 237 7 226 413 7 769 899 8 224 326 8 385 946 Aluminium and bauxite Bauxite tonnes 12 116 13 594 11 975 11 125 8 715 Alumina tonnes 270 769 281 634 309 291 265 798 276 387 Alumina hydrate tonnes 131 035 83 054 139 311 97 170 87 204 Unwrought tonnes 51 275 71 970 45 172 64 410 52 152 Unwrought alloys tonnes 166 807 130 384 127 551 129 161 155 837 Scrap tonnes 405 847 425 541 423 298 447 687 484 375 Antimony Metal tonnes 145 24 60 95 68 Oxide tonnes 6 853 6 124 5 482 5 192 5 470
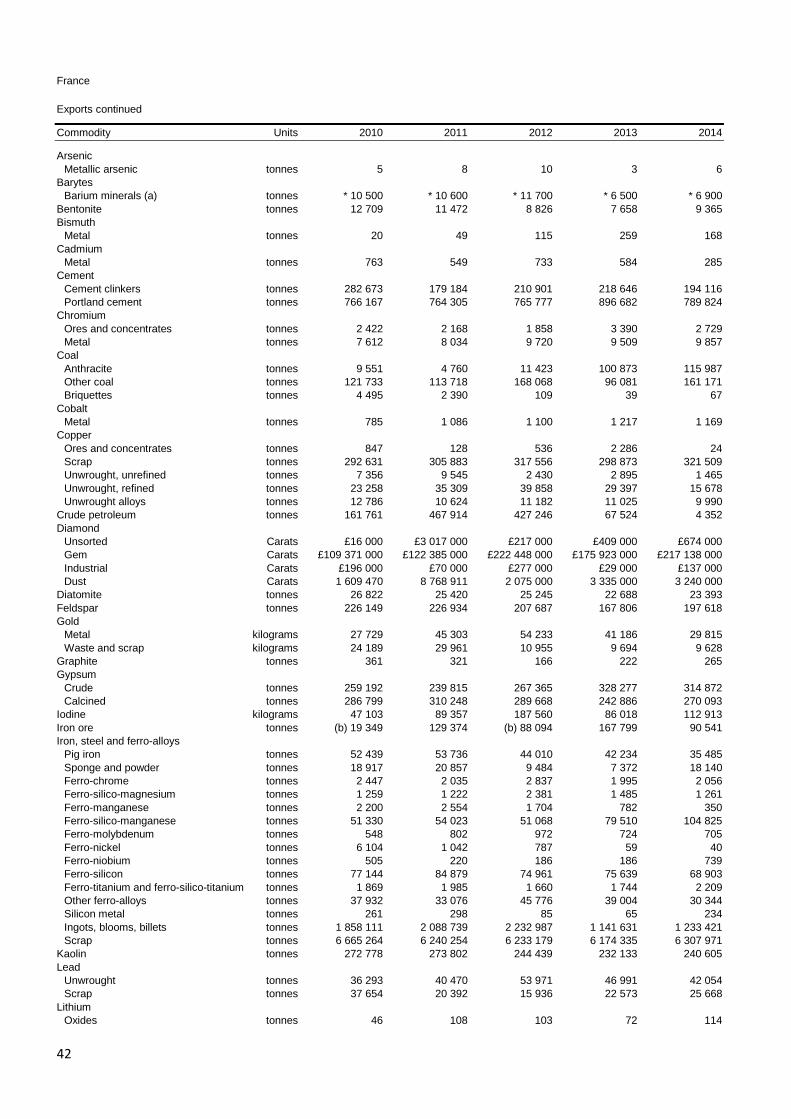
42
France
Exports continued
Commodity Units 2010 2011 2012 2013 2014
Arsenic Metallic arsenic tonnes 5 8 10 3 6 Barytes Barium minerals (a) tonnes * 10 500 * 10 600 * 11 700 * 6 500 * 6 900 Bentonite tonnes 12 709 11 472 8 826 7 658 9 365 Bismuth Metal tonnes 20 49 115 259 168 Cadmium Metal tonnes 763 549 733 584 285 Cement Cement clinkers tonnes 282 673 179 184 210 901 218 646 194 116 Portland cement tonnes 766 167 764 305 765 777 896 682 789 824 Chromium Ores and concentrates tonnes 2 422 2 168 1 858 3 390 2 729 Metal tonnes 7 612 8 034 9 720 9 509 9 857 Coal Anthracite tonnes 9 551 4 760 11 423 100 873 115 987 Other coal tonnes 121 733 113 718 168 068 96 081 161 171 Briquettes tonnes 4 495 2 390 109 39 67 Cobalt Metal tonnes 785 1 086 1 100 1 217 1 169 Copper Ores and concentrates tonnes 847 128 536 2 286 24 Scrap tonnes 292 631 305 883 317 556 298 873 321 509 Unwrought, unrefined tonnes 7 356 9 545 2 430 2 895 1 465 Unwrought, refined tonnes 23 258 35 309 39 858 29 397 15 678 Unwrought alloys tonnes 12 786 10 624 11 182 11 025 9 990 Crude petroleum tonnes 161 761 467 914 427 246 67 524 4 352 Diamond Unsorted Carats £16 000 £3 017 000 £217 000 £409 000 £674 000 Gem Carats £109 371 000 £122 385 000 £222 448 000 £175 923 000 £217 138 000 Industrial Carats £196 000 £70 000 £277 000 £29 000 £137 000 Dust Carats 1 609 470 8 768 911 2 075 000 3 335 000 3 240 000 Diatomite tonnes 26 822 25 420 25 245 22 688 23 393 Feldspar tonnes 226 149 226 934 207 687 167 806 197 618 Gold Metal kilograms 27 729 45 303 54 233 41 186 29 815 Waste and scrap kilograms 24 189 29 961 10 955 9 694 9 628 Graphite tonnes 361 321 166 222 265 Gypsum Crude tonnes 259 192 239 815 267 365 328 277 314 872 Calcined tonnes 286 799 310 248 289 668 242 886 270 093 Iodine kilograms 47 103 89 357 187 560 86 018 112 913 Iron ore tonnes (b) 19 349 129 374 (b) 88 094 167 799 90 541 Iron, steel and ferro-alloys Pig iron tonnes 52 439 53 736 44 010 42 234 35 485 Sponge and powder tonnes 18 917 20 857 9 484 7 372 18 140 Ferro-chrome tonnes 2 447 2 035 2 837 1 995 2 056 Ferro-silico-magnesium tonnes 1 259 1 222 2 381 1 485 1 261 Ferro-manganese tonnes 2 200 2 554 1 704 782 350 Ferro-silico-manganese tonnes 51 330 54 023 51 068 79 510 104 825 Ferro-molybdenum tonnes 548 802 972 724 705 Ferro-nickel tonnes 6 104 1 042 787 59 40 Ferro-niobium tonnes 505 220 186 186 739 Ferro-silicon tonnes 77 144 84 879 74 961 75 639 68 903 Ferro-titanium and ferro-silico-titanium tonnes 1 869 1 985 1 660 1 744 2 209 Other ferro-alloys tonnes 37 932 33 076 45 776 39 004 30 344 Silicon metal tonnes 261 298 85 65 234 Ingots, blooms, billets tonnes 1 858 111 2 088 739 2 232 987 1 141 631 1 233 421 Scrap tonnes 6 665 264 6 240 254 6 233 179 6 174 335 6 307 971 Kaolin tonnes 272 778 273 802 244 439 232 133 240 605 Lead Unwrought tonnes 36 293 40 470 53 971 46 991 42 054 Scrap tonnes 37 654 20 392 15 936 22 573 25 668 Lithium Oxides tonnes 46 108 103 72 114

43
France
Exports continued
Commodity Units 2010 2011 2012 2013 2014
Magnesite and magnesia Magnesite tonnes 274 207 250 195 458 Magnesia tonnes 52 553 35 543 38 098 53 989 61 368 Manganese Ores and concentrates (c) tonnes 152 425 125 827 118 915 130 333 36 460 Metal tonnes 717 805 1 081 582 135 Mercury kilograms 1 595 49 992 2 233 1 092 1 216 Mica tonnes 12 455 12 821 11 771 13 352 13 200 Molybdenum Ores and concentrates tonnes 205 352 81 30 157 Metal tonnes 47 36 317 262 1 025 Nickel Mattes, sinters etc tonnes 315 1 306 1 384 1 240 1 177 Unwrought tonnes 9 376 10 997 11 477 9 535 6 462 Unwrought alloys tonnes 1 307 1 875 1 818 2 517 3 707 Scrap tonnes 30 601 11 685 12 683 9 164 10 253 Natural gas tonnes 2 908 272 8 017 462 * 5 800 000 4 729 143 4 697 219 Phosphate rock (a) tonnes * 18 000 * 19 000 * 31 000 * 33 000 * 19 000 Platinum metals Platinum kilograms 1 884 2 566 4 139 4 662 16 425 Platinum metals kilograms 914 1 255 2 558 3 281 5 514 Waste and scrap kilograms 179 798 270 355 352 702 521 192 275 632 Potash Sulphate tonnes 17 085 25 238 17 335 3 224 982 Chloride tonnes 36 215 15 947 65 461 66 100 55 048 Other potassic fertilisers tonnes 1 788 2 772 3 714 2 660 1 276 Rare earths Metals tonnes 8 11 12 14 10 Rare earth compounds tonnes 3 411 2 789 2 097 1 878 843 Salt tonnes 297 909 190 124 147 441 207 111 148 107 Sillimanite minerals tonnes 49 011 55 316 43 751 43 457 50 394 Silver Ores and concentrates kilograms — 4 053 319 591 800 81 450 Metal kilograms 258 205 511 716 392 507 420 267 382 845 Sulphur and pyrites Sulphur tonnes 296 345 248 989 237 974 193 899 95 143 Sulphur, sublimed and precipitated tonnes 565 556 394 232 99 Talc tonnes 270 494 269 518 271 399 273 414 285 681 Tantalum and niobium Tantalum tonnes 20 25 41 138 42 Tin Concentrates tonnes 341 89 74 23 42 Unwrought tonnes 423 413 485 323 526 Unwrought alloys tonnes 143 178 145 170 79 Scrap tonnes 342 532 484 616 533 Titanium Metal tonnes 4 907 5 333 5 946 6 633 8 838 Oxides tonnes 129 197 140 278 114 715 127 319 111 622 Tungsten Ores and concentrates tonnes 2 3 — 1 335 189 Metal tonnes 473 589 962 566 559 Carbide tonnes 288 272 353 286 208 Zinc Ores and concentrates tonnes 49 652 54 609 62 111 97 317 81 569 Unwrought tonnes 79 727 105 934 80 747 73 557 119 045 Unwrought alloys tonnes 1 851 2 549 1 938 2 333 2 235 Scrap tonnes 51 755 42 736 42 231 47 478 118 445 Zirconium Concentrates tonnes 2 044 4 973 1 708 1 955 2 569
Note(s) (a) BGS estimates, based on known imports into certain countries (b) Including burnt pyrites (c) Including manganiferous iron ore
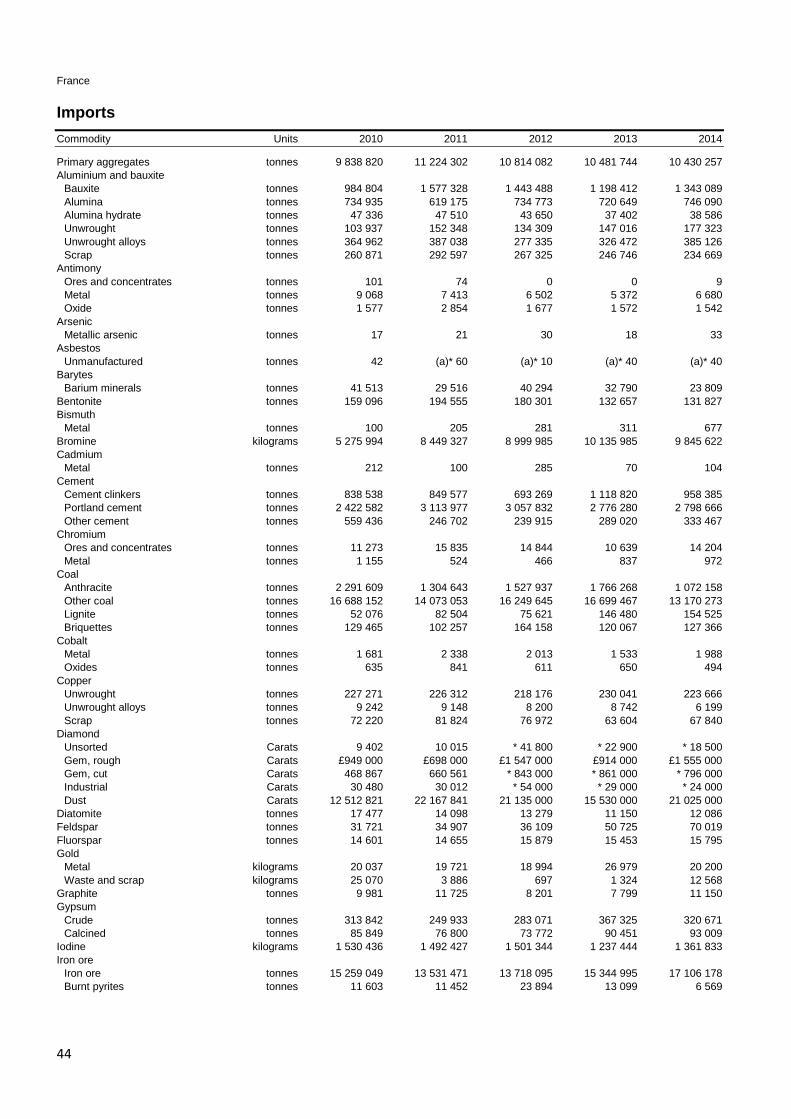
44
France Imports Commodity Units 2010 2011 2012 2013 2014
Primary aggregates tonnes 9 838 820 11 224 302 10 814 082 10 481 744 10 430 257 Aluminium and bauxite Bauxite tonnes 984 804 1 577 328 1 443 488 1 198 412 1 343 089 Alumina tonnes 734 935 619 175 734 773 720 649 746 090 Alumina hydrate tonnes 47 336 47 510 43 650 37 402 38 586 Unwrought tonnes 103 937 152 348 134 309 147 016 177 323 Unwrought alloys tonnes 364 962 387 038 277 335 326 472 385 126 Scrap tonnes 260 871 292 597 267 325 246 746 234 669 Antimony Ores and concentrates tonnes 101 74 0 0 9 Metal tonnes 9 068 7 413 6 502 5 372 6 680 Oxide tonnes 1 577 2 854 1 677 1 572 1 542 Arsenic Metallic arsenic tonnes 17 21 30 18 33 Asbestos Unmanufactured tonnes 42 (a)* 60 (a)* 10 (a)* 40 (a)* 40 Barytes Barium minerals tonnes 41 513 29 516 40 294 32 790 23 809 Bentonite tonnes 159 096 194 555 180 301 132 657 131 827 Bismuth Metal tonnes 100 205 281 311 677 Bromine kilograms 5 275 994 8 449 327 8 999 985 10 135 985 9 845 622 Cadmium Metal tonnes 212 100 285 70 104 Cement Cement clinkers tonnes 838 538 849 577 693 269 1 118 820 958 385 Portland cement tonnes 2 422 582 3 113 977 3 057 832 2 776 280 2 798 666 Other cement tonnes 559 436 246 702 239 915 289 020 333 467 Chromium Ores and concentrates tonnes 11 273 15 835 14 844 10 639 14 204 Metal tonnes 1 155 524 466 837 972 Coal Anthracite tonnes 2 291 609 1 304 643 1 527 937 1 766 268 1 072 158 Other coal tonnes 16 688 152 14 073 053 16 249 645 16 699 467 13 170 273 Lignite tonnes 52 076 82 504 75 621 146 480 154 525 Briquettes tonnes 129 465 102 257 164 158 120 067 127 366 Cobalt Metal tonnes 1 681 2 338 2 013 1 533 1 988 Oxides tonnes 635 841 611 650 494 Copper Unwrought tonnes 227 271 226 312 218 176 230 041 223 666 Unwrought alloys tonnes 9 242 9 148 8 200 8 742 6 199 Scrap tonnes 72 220 81 824 76 972 63 604 67 840 Diamond Unsorted Carats 9 402 10 015 * 41 800 * 22 900 * 18 500 Gem, rough Carats £949 000 £698 000 £1 547 000 £914 000 £1 555 000 Gem, cut Carats 468 867 660 561 * 843 000 * 861 000 * 796 000 Industrial Carats 30 480 30 012 * 54 000 * 29 000 * 24 000 Dust Carats 12 512 821 22 167 841 21 135 000 15 530 000 21 025 000 Diatomite tonnes 17 477 14 098 13 279 11 150 12 086 Feldspar tonnes 31 721 34 907 36 109 50 725 70 019 Fluorspar tonnes 14 601 14 655 15 879 15 453 15 795 Gold Metal kilograms 20 037 19 721 18 994 26 979 20 200 Waste and scrap kilograms 25 070 3 886 697 1 324 12 568 Graphite tonnes 9 981 11 725 8 201 7 799 11 150 Gypsum Crude tonnes 313 842 249 933 283 071 367 325 320 671 Calcined tonnes 85 849 76 800 73 772 90 451 93 009 Iodine kilograms 1 530 436 1 492 427 1 501 344 1 237 444 1 361 833 Iron ore Iron ore tonnes 15 259 049 13 531 471 13 718 095 15 344 995 17 106 178 Burnt pyrites tonnes 11 603 11 452 23 894 13 099 6 569

45
France Imports continued
Commodity Units 2010 2011 2012 2013 2014
Iron, steel and ferro-alloys Pig iron tonnes 139 186 160 336 140 321 187 416 150 165 Sponge and powder tonnes 52 795 84 787 38 973 72 852 37 697 Ferro-chrome tonnes 111 080 99 240 106 591 121 183 121 006 Ferro-silico-magnesium tonnes 1 047 1 102 483 572 672 Ferro-manganese tonnes 44 405 43 245 37 724 40 090 29 547 Ferro-silico-manganese tonnes 35 405 44 217 58 938 40 432 62 179 Ferro-molybdenum tonnes 3 720 4 857 4 441 4 081 4 091 Ferro-nickel tonnes 7 724 16 270 4 818 6 119 13 255 Ferro-niobium tonnes 2 195 2 225 1 608 1 673 2 103 Ferro-phosphorus tonnes 2 656 2 227 1 833 1 857 1 983 Ferro-silicon tonnes 51 906 65 306 54 824 52 768 68 493 Ferro-titanium and ferro-silico-titanium tonnes 5 457 5 756 3 958 4 314 4 549 Ferro-tungsten and ferro-silico-tungsten tonnes 343 378 303 328 275 Ferro-vanadium tonnes 1 065 1 113 811 815 705 Other ferro-alloys tonnes 16 247 15 035 8 602 11 741 12 485 Silicon metal tonnes 19 135 19 373 27 828 30 215 30 591 Ingots, blooms, billets tonnes 1 807 094 2 047 778 1 728 612 1 696 098 1 817 764 Scrap tonnes 2 450 993 2 682 258 2 732 380 2 377 000 2 480 652 Kaolin tonnes 231 779 220 764 223 649 198 892 175 767 Lead Unwrought tonnes 34 090 39 305 38 918 42 523 46 479 Scrap tonnes 12 848 15 182 14 265 2 941 3 273 Lithium Oxides tonnes 570 479 547 505 581 Carbonate tonnes 1 137 2 792 1 756 1 162 1 371 Magnesite and magnesia Magnesite tonnes 784 1 087 4 013 3 948 2 402 Magnesia tonnes 126 821 127 469 115 590 131 742 138 689 Manganese Ores and concentrates (b) tonnes 721 272 647 182 562 298 572 043 308 163 Metal tonnes 17 586 21 186 9 231 10 304 11 272 Mercury kilograms 19 073 1 406 252 180 402 Mica Unmanufactured tonnes 255 848 488 541 393 Ground tonnes 1 861 2 149 1 828 1 941 1 649 Molybdenum Ores and concentrates tonnes 1 209 1 764 1 575 1 653 2 228 Metal tonnes 888 1 098 942 998 1 072 Oxides tonnes 1 095 1 465 1 365 1 387 1 128 Nickel Mattes, sinters etc tonnes 19 921 19 954 19 395 19 053 12 042 Unwrought tonnes 13 964 21 693 24 002 16 608 20 214 Unwrought alloys tonnes 5 029 7 345 5 466 4 943 5 979 Oxides tonnes 524 412 114 66 56 Scrap tonnes 2 164 2 988 2 713 3 063 3 036 Crude petroleum tonnes 59 946 970 62 875 826 56 890 280 55 608 981 51 305 516 Natural gas tonnes 41 624 014 50 897 525 (a)* 37 000 000 35 767 086 29 549 860 Phosphate rock tonnes 305 259 264 541 312 023 229 553 260 572 Platinum metals Platinum kilograms 4 516 4 010 4 606 43 645 6 628 Palladium kilograms 2 706 25 607 7 919 10 272 10 355 Other platinum metals kilograms 300 270 264 1 308 950 Waste and scrap kilograms 143 885 296 178 122 641 411 440 329 640 Potash Sulphate tonnes 51 068 40 885 75 743 86 471 85 795 Chloride tonnes 1 049 344 1 003 299 901 717 826 150 902 959 Other potassic fertilisers tonnes 13 998 6 814 13 696 15 213 20 530 Rare earths Metals tonnes 372 506 280 338 191 Cerium compounds tonnes 5 687 1 867 3 940 * 1 900 * 500 Other rare earth compounds tonnes 1 408 1 359 1 301 1 396 574 Ferro-cerium and other pyrophoric alloys tonnes 83 388 940 242 932 Salt tonnes 1 653 101 1 622 835 705 665 1 157 520 643 237 Sillimanite minerals Sillimanite minerals tonnes 3 110 3 502 1 930 2 576 2 573 Mullite tonnes 2 663 3 831 2 919 2 948 2 650

46
France Imports continued
Commodity Units 2010 2011 2012 2013 2014
Silver Ores and concentrates kilograms 4 433 810 8 499 100 102 8 713 51 561 Metal kilograms 954 773 908 080 612 382 680 836 750 677 Sulphur and pyrites Pyrites tonnes 183 206 136 254 564 Sulphur tonnes 78 366 92 106 108 471 145 535 164 461 Sulphur, sublimed and precipitated tonnes 410 441 481 1 623 495 Talc tonnes 59 722 48 155 47 883 45 965 23 884 Tantalum and niobium Tantalum tonnes 22 39 49 39 18 Tin Unwrought tonnes 5 787 5 252 4 815 4 693 5 729 Unwrought alloys tonnes 389 283 266 305 224 Scrap tonnes 100 61 107 57 76 Titanium Titanium minerals tonnes 50 893 67 259 184 385 91 344 161 216 Metal tonnes 7 766 10 026 11 881 13 169 16 267 Oxides tonnes 148 994 138 687 123 037 129 659 139 199 Titanium slag tonnes 15 218 246 20 762 12 707 — Tungsten Ores and concentrates tonnes 2 4 14 619 69 283 77 Metal tonnes 867 1 027 619 534 1 022 Carbide tonnes 359 583 551 575 603 Vanadium Metal tonnes 84 104 119 80 94 Pentoxide tonnes 574 605 429 652 660 Zinc Ores and concentrates tonnes 222 580 234 060 288 110 306 850 320 668 Unwrought tonnes 131 993 151 988 126 771 120 553 119 879 Unwrought alloys tonnes 34 205 34 022 32 075 34 823 37 710 Scrap tonnes 3 003 3 853 23 591 58 552 53 540 Zirconium Concentrates tonnes 25 310 35 922 25 784 26 688 17 834 Metal tonnes 326 687 436 363 3 863
Note(s) (a) BGS estimates, based on known exports from certain countries (b) Including manganiferous iron ore

47
Germany
Germany
Production Commodity Units 2010 2011 2012 2013 2014
Primary aggregates Sand and gravel tonnes 239 000 000 252 000 000 235 300 000 228 000 000 238 000 000 Crushed rock tonnes 208 000 000 229 000 000 211 000 000 207 000 000 211 000 000 Alumina tonnes (Al2O3 content) * 1 000 000 * 1 000 000 * 1 000 000 * 1 000 000 * 1 000 000 Primary aluminium tonnes 402 480 432 472 410 413 492 368 530 700 Barytes tonnes 55 887 55 342 52 030 45 446 70 665 Bentonite tonnes 362 623 375 332 366 220 358 844 394 657 Bromine kilograms 1 500 000 1 600 000 1 600 000 1 500 000 1 500 000 Cadmium tonnes * 400 * 400 * 400 * 400 * 400 Cement Cement, clinker tonnes 22 996 000 24 775 000 24 581 000 23 127 000 23 871 000 Cement, finished tonnes 29 915 000 33 540 000 32 432 000 31 308 000 32 099 000 Coal Anthracite and Bituminous tonnes 14 110 000 12 960 000 11 558 000 8 260 000 8 340 000 Brown coal tonnes 169 402 544 176 502 048 185 432 000 182 995 337 178 177 703 Copper, refined tonnes 704 300 708 800 682 132 677 600 676 900 Copper, smelter tonnes 378 700 335 000 352 400 295 200 351 100 Diatomite tonnes 49 306 52 698 50 036 51 435 54 277 Feldspar tonnes 350 000 350 000 350 000 * 350 000 * 350 000 Fluorspar tonnes 59 086 65 619 54 202 48 744 35 270 Graphite tonnes — — 109 269 517 Gypsum (a) tonnes 1 822 000 2 021 000 1 949 000 1 778 000 1 802 000 Indium tonnes * 10 * 10 * 10 * 10 * 10 Iron ore (b)(c) tonnes 390 353 489 091 447 515 413 404 455 941 Pig iron tonnes 28 560 000 27 943 000 27 046 000 27 177 000 27 943 000 Crude steel tonnes 43 830 000 44 284 000 42 661 000 42 645 000 42 941 000 Ferro-alloys Ferro-chrome tonnes * 18 300 * 18 500 * 17 800 * 17 800 * 17 800 Other ferro-alloys tonnes * 9 200 9 985 8 248 * 8 200 * 8 200 Silicon metal tonnes 30 105 30 134 28 574 30 283 28 500 Kaolin (d) tonnes 4 578 097 4 898 516 4 398 796 4 348 562 4 275 422 Lead, refined tonnes 405 400 429 100 423 000 400 000 408 000 Crude petroleum tonnes 2 511 174 2 677 136 2 633 000 2 638 379 2 429 789 Natural gas million m3 13 666 12 952 11 706 10 678 10 060 Potash Potassic salts tonnes (K2O content) 3 023 941 3 214 696 3 149 386 3 075 201 3 126 913 Salt Rock salt tonnes 9 992 156 8 765 168 5 938 855 8 510 652 4 928 656 Brine salt tonnes 2 118 484 2 217 205 2 182 440 2 164 456 2 133 359 Salt in brine tonnes * 4 500 000 * 6 500 000 * 10 900 000 7 878 895 4 075 004 Selenium metal (e) tonnes * 650 * 700 * 650 * 700 * 700 Sulphur and pyrites Recovered (f) tonnes (sulphur content) 831 533 874 639 798 257 754 540 708 146 Recovered (g) tonnes (sulphur content) 520 220 542 210 493 169 464 776 437 677 Uranium, mine tonnes (metal content) * 8 52 50 27 33 Zinc, mine tonnes 165 000 170 000 169 000 162 000 165 000
Notes (1) Germany is also believed to produce strontium minerals and tellurium metal (a) Including anhydrite (b) Including manganiferous iron ore (c) Used as aggregate in the construction industry (d) Washed and dried (e) Includes selenium produced from imported material (f) From petroleum refining and/or natural gas (g) Other

48
Germany
Exports Commodity Units 2010 2011 2012 2013 2014
Primary aggregates tonnes 25 337 558 29 162 240 25 160 776 21 825 199 22 579 753 Aluminium and bauxite Bauxite tonnes 26 178 26 306 34 814 22 966 29 271 Alumina tonnes 424 236 372 191 369 337 374 471 291 433 Alumina hydrate tonnes 551 817 485 074 455 157 463 704 456 259 Unwrought tonnes 111 815 83 675 42 580 40 775 26 554 Unwrought alloys tonnes 361 396 374 917 361 850 383 882 381 113 Scrap tonnes 823 810 947 252 968 539 935 218 1 048 565 Antimony Metal tonnes 132 239 103 86 20 Oxide tonnes 961 1 132 688 669 662 Arsenic Metallic arsenic tonnes 57 66 128 40 24 Barytes Barium minerals (a) tonnes * 33 000 * 34 000 * 29 000 * 12 500 * 2 100 Bentonite tonnes 84 920 91 477 82 504 72 020 73 547 Bismuth Metal tonnes 178 210 195 86 386 Bromine kilograms 6 119 7 543 8 559 28 941 5 044 Cadmium Metal tonnes 523 348 379 450 584 Cement Cement clinkers tonnes 680 552 761 406 475 987 443 142 420 122 Portland cement tonnes 4 173 112 5 002 240 4 672 927 4 217 917 3 843 447 Other cement tonnes 2 010 734 2 159 075 1 794 724 1 664 700 1 911 501 Chromium Ores and concentrates tonnes 32 070 53 989 60 354 59 965 54 329 Metal tonnes 4 606 2 995 6 308 3 496 3 928 Coal Anthracite tonnes 222 458 165 471 166 704 198 318 169 161 Other coal tonnes 31 492 39 712 109 026 52 793 38 926 Lignite tonnes 696 279 789 315 1 134 350 919 347 1 030 211 Briquettes tonnes 463 102 467 383 450 270 386 161 1 582 748 Cobalt Ore tonnes 88 — 8 — 175 Metal tonnes 1 481 1 393 1 533 1 641 1 981 Oxides tonnes 102 113 84 53 122 Copper Ores and concentrates tonnes 48 761 54 856 57 074 47 039 51 395 Matte and cement tonnes 8 431 9 2 1 1 340 Unwrought, unrefined tonnes 104 1 446 2 014 6 688 10 028 Unwrought, refined tonnes 136 006 195 181 276 943 225 139 174 312 Unwrought alloys tonnes 13 276 12 276 14 578 14 422 14 261 Scrap tonnes 578 448 585 346 587 935 516 590 531 195 Diamond Unsorted (b) Carats £* 863 000 £* 489 000 £* 283 000 £* 3 271 000 £* 3 895 000 Gem Carats 161 687 155 370 129 830 126 640 98 997 Dust Carats 7 355 000 13 670 000 15 095 000 16 665 000 18 745 000 Diatomite tonnes 5 361 14 251 22 190 27 103 29 410 Feldspar tonnes 78 610 76 300 70 936 91 047 92 144 Fluorspar tonnes 33 487 45 955 38 029 37 087 31 758 Gold Metal kilograms 221 003 226 243 212 936 183 267 150 242 Waste and scrap kilograms 904 379 688 482 956 113 80 219 864 308 Graphite tonnes 20 583 15 600 12 721 13 601 16 994 Gypsum Crude tonnes 430 977 516 024 501 487 425 608 430 612 Calcined tonnes 1 558 288 1 333 953 1 444 714 1 156 749 1 162 927 Iodine kilograms 62 331 124 705 109 595 62 042 43 909 Iron ore Iron ore tonnes 22 373 54 555 42 763 50 451 113 172 Burnt pyrites tonnes 7 994 15 999 — — 5
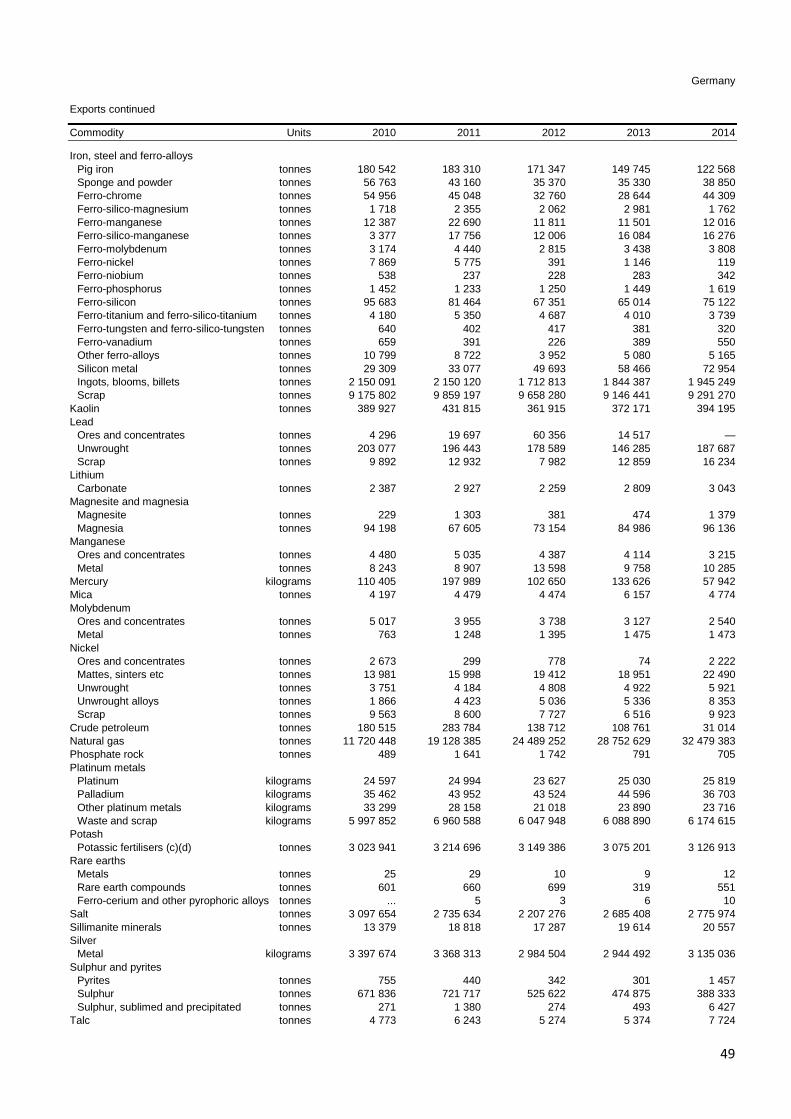
49
Germany Exports continued
Commodity Units 2010 2011 2012 2013 2014
Iron, steel and ferro-alloys Pig iron tonnes 180 542 183 310 171 347 149 745 122 568 Sponge and powder tonnes 56 763 43 160 35 370 35 330 38 850 Ferro-chrome tonnes 54 956 45 048 32 760 28 644 44 309 Ferro-silico-magnesium tonnes 1 718 2 355 2 062 2 981 1 762 Ferro-manganese tonnes 12 387 22 690 11 811 11 501 12 016 Ferro-silico-manganese tonnes 3 377 17 756 12 006 16 084 16 276 Ferro-molybdenum tonnes 3 174 4 440 2 815 3 438 3 808 Ferro-nickel tonnes 7 869 5 775 391 1 146 119 Ferro-niobium tonnes 538 237 228 283 342 Ferro-phosphorus tonnes 1 452 1 233 1 250 1 449 1 619 Ferro-silicon tonnes 95 683 81 464 67 351 65 014 75 122 Ferro-titanium and ferro-silico-titanium tonnes 4 180 5 350 4 687 4 010 3 739 Ferro-tungsten and ferro-silico-tungsten tonnes 640 402 417 381 320 Ferro-vanadium tonnes 659 391 226 389 550 Other ferro-alloys tonnes 10 799 8 722 3 952 5 080 5 165 Silicon metal tonnes 29 309 33 077 49 693 58 466 72 954 Ingots, blooms, billets tonnes 2 150 091 2 150 120 1 712 813 1 844 387 1 945 249 Scrap tonnes 9 175 802 9 859 197 9 658 280 9 146 441 9 291 270 Kaolin tonnes 389 927 431 815 361 915 372 171 394 195 Lead Ores and concentrates tonnes 4 296 19 697 60 356 14 517 — Unwrought tonnes 203 077 196 443 178 589 146 285 187 687 Scrap tonnes 9 892 12 932 7 982 12 859 16 234 Lithium Carbonate tonnes 2 387 2 927 2 259 2 809 3 043 Magnesite and magnesia Magnesite tonnes 229 1 303 381 474 1 379 Magnesia tonnes 94 198 67 605 73 154 84 986 96 136 Manganese Ores and concentrates tonnes 4 480 5 035 4 387 4 114 3 215 Metal tonnes 8 243 8 907 13 598 9 758 10 285 Mercury kilograms 110 405 197 989 102 650 133 626 57 942 Mica tonnes 4 197 4 479 4 474 6 157 4 774 Molybdenum Ores and concentrates tonnes 5 017 3 955 3 738 3 127 2 540 Metal tonnes 763 1 248 1 395 1 475 1 473 Nickel Ores and concentrates tonnes 2 673 299 778 74 2 222 Mattes, sinters etc tonnes 13 981 15 998 19 412 18 951 22 490 Unwrought tonnes 3 751 4 184 4 808 4 922 5 921 Unwrought alloys tonnes 1 866 4 423 5 036 5 336 8 353 Scrap tonnes 9 563 8 600 7 727 6 516 9 923 Crude petroleum tonnes 180 515 283 784 138 712 108 761 31 014 Natural gas tonnes 11 720 448 19 128 385 24 489 252 28 752 629 32 479 383 Phosphate rock tonnes 489 1 641 1 742 791 705 Platinum metals Platinum kilograms 24 597 24 994 23 627 25 030 25 819 Palladium kilograms 35 462 43 952 43 524 44 596 36 703 Other platinum metals kilograms 33 299 28 158 21 018 23 890 23 716 Waste and scrap kilograms 5 997 852 6 960 588 6 047 948 6 088 890 6 174 615 Potash Potassic fertilisers (c)(d) tonnes 3 023 941 3 214 696 3 149 386 3 075 201 3 126 913 Rare earths Metals tonnes 25 29 10 9 12 Rare earth compounds tonnes 601 660 699 319 551 Ferro-cerium and other pyrophoric alloys tonnes ... 5 3 6 10 Salt tonnes 3 097 654 2 735 634 2 207 276 2 685 408 2 775 974 Sillimanite minerals tonnes 13 379 18 818 17 287 19 614 20 557 Silver Metal kilograms 3 397 674 3 368 313 2 984 504 2 944 492 3 135 036 Sulphur and pyrites Pyrites tonnes 755 440 342 301 1 457 Sulphur tonnes 671 836 721 717 525 622 474 875 388 333 Sulphur, sublimed and precipitated tonnes 271 1 380 274 493 6 427 Talc tonnes 4 773 6 243 5 274 5 374 7 724

50
Germany Exports continued
Commodity Units 2010 2011 2012 2013 2014
Tantalum and niobium Tantalum tonnes 18 38 33 30 37 Tin Unwrought tonnes 1 253 1 348 1 223 1 215 1 715 Unwrought alloys tonnes 956 1 459 1 352 1 442 1 554 Scrap tonnes 1 440 1 175 1 141 1 067 1 222 Titanium Titanium minerals tonnes 22 384 18 932 13 648 51 517 5 623 Metal tonnes 9 351 13 954 12 561 13 824 14 096 Oxides tonnes 391 981 345 661 331 757 374 970 351 825 Tungsten Ores and concentrates tonnes 164 976 524 40 192 Metal tonnes 3 119 3 064 3 618 4 823 4 234 Vanadium Metal tonnes 248 429 560 487 369 Zinc Ores and concentrates tonnes 1 674 73 980 39 533 96 369 98 065 Unwrought tonnes 52 483 55 518 59 913 54 476 69 430 Unwrought alloys tonnes 31 857 31 170 29 775 27 985 24 342 Scrap tonnes 74 208 75 168 73 200 52 974 53 244 Zirconium Concentrates (a) tonnes * 10 800 * 10 800 * 7 500 * 6 300 * 5 700 Metal tonnes 384 792 735 896 853
Note(s) (a) BGS estimates, based on known imports into certain countries (b) BGS estimates, based on known value of imports to certain countries (c) K2O content (d) Including sulphate, chloride and other potassic fertilisers
Imports Commodity Units 2010 2011 2012 2013 2014
Primary aggregates tonnes 11 936 108 13 786 596 11 636 491 9 868 728 10 545 395 Aluminium and bauxite Bauxite tonnes 2 005 053 2 436 413 2 777 032 2 407 688 2 623 127 Alumina tonnes 661 379 654 946 476 257 832 700 639 868 Alumina hydrate tonnes 260 488 176 692 196 301 160 162 199 031 Unwrought tonnes 799 780 768 797 732 599 759 344 870 026 Unwrought alloys tonnes 1 591 991 1 810 035 1 750 733 1 759 155 1 819 650 Scrap tonnes 479 413 535 304 575 925 560 479 655 187 Antimony Ores and concentrates tonnes 11 8 6 922 1 202 Metal tonnes 494 456 376 462 280 Oxide tonnes 7 986 6 949 6 013 5 675 5 997 Arsenic Metallic arsenic tonnes 73 6 106 45 23 Asbestos Unmanufactured tonnes 72 88 554 78 — Barytes Barium minerals tonnes 263 839 291 716 237 254 171 262 106 647 Bentonite tonnes 386 261 447 793 450 850 489 843 472 491 Bismuth Metal tonnes 1 052 1 282 1 155 1 406 1 726 Bromine kilograms 657 303 722 036 783 214 669 944 769 231 Cadmium Metal tonnes 18 40 69 19 9 Oxide tonnes 625 489 653 621 507 Cement Cement clinkers tonnes 18 037 52 111 82 345 43 676 44 715 Portland cement tonnes 939 310 1 054 856 1 023 170 1 043 382 1 016 930 Other cement tonnes 255 027 217 931 218 486 273 164 275 562

51
Germany Imports continued
Commodity Units 2010 2011 2012 2013 2014
Chromium Ores and concentrates tonnes 101 972 180 377 188 783 191 488 141 895 Metal tonnes 4 783 5 931 6 887 7 596 7 163 Coal Anthracite tonnes 3 643 048 2 535 881 1 399 126 1 047 216 990 703 Other coal tonnes 34 850 251 40 187 648 41 993 809 49 515 475 56 054 138 Lignite tonnes 24 400 41 768 28 744 87 355 87 769 Briquettes tonnes 404 681 291 675 138 019 137 275 103 926 Cobalt Ore tonnes 115 170 128 76 65 Metal tonnes 3 864 4 946 4 505 4 309 4 679 Oxides tonnes 1 069 900 878 1 580 1 275 Copper Ores and concentrates tonnes 1 128 472 1 124 525 1 215 273 1 013 432 1 185 757 Matte and cement tonnes 12 739 2 742 2 415 1 867 3 007 Unwrought, unrefined tonnes 23 331 68 147 55 179 112 940 49 093 Unwrought, refined tonnes 743 934 737 763 702 577 685 731 664 537 Unwrought alloys tonnes 36 249 35 493 37 491 39 025 36 743 Scrap tonnes 626 442 647 084 655 895 617 454 657 301 Diamond Gem Carats 377 399 366 385 314 347 339 116 289 308 Industrial Carats 122 838 143 922 149 572 164 340 92 897 Dust Carats 64 065 000 89 060 000 94 175 000 91 750 000 100 160 000 Diatomite tonnes 43 487 39 892 42 122 43 006 44 967 Feldspar tonnes 139 663 153 713 109 157 129 123 155 411 Fluorspar tonnes 261 999 380 027 280 867 249 532 268 879 Gold Metal kilograms 192 815 162 289 133 260 149 337 112 065 Waste and scrap kilograms 1 396 280 2 680 174 2 568 174 1 997 032 2 320 541 Graphite tonnes 56 333 57 411 43 349 46 829 53 380 Gypsum Crude tonnes 29 132 26 182 21 712 16 062 19 377 Calcined tonnes 82 341 80 574 98 665 93 803 86 645 Iodine kilograms 1 422 575 1 576 165 1 700 953 1 771 622 1 656 931 Iron ore Iron ore tonnes 43 082 309 41 678 285 38 908 327 40 322 561 43 039 944 Burnt pyrites tonnes 3 077 4 513 23 495 13 696 10 335 Iron, steel and ferro-alloys Pig iron tonnes 421 287 589 302 614 096 533 932 489 961 Sponge and powder tonnes 500 970 326 097 210 328 461 742 653 438 Ferro-chrome tonnes 454 005 447 242 392 515 329 237 265 333 Ferro-silico-chrome tonnes 29 047 18 334 8 573 19 757 34 772 Ferro-silico-magnesium tonnes 2 972 6 208 4 528 3 412 3 088 Ferro-manganese tonnes 203 200 232 613 192 817 204 941 206 095 Ferro-silico-manganese tonnes 185 067 208 913 206 967 224 049 243 694 Ferro-molybdenum tonnes 16 375 18 760 16 934 17 025 17 850 Ferro-nickel tonnes 192 394 155 881 81 991 88 951 20 985 Ferro-niobium tonnes 5 923 6 579 6 297 5 857 6 540 Ferro-phosphorus tonnes 6 067 5 137 5 587 5 471 6 788 Ferro-silicon tonnes 272 466 298 352 248 310 227 634 253 921 Ferro-titanium and ferro-silico-titanium tonnes 8 754 9 818 9 912 9 423 10 785 Ferro-tungsten and ferro-silico-tungsten tonnes 787 977 1 010 1 313 1 345 Ferro-vanadium tonnes 5 034 5 305 5 096 4 962 5 613 Other ferro-alloys tonnes 11 783 15 982 21 651 14 401 14 036 Silicon metal tonnes 255 977 241 565 232 640 219 791 245 485 Ingots, blooms, billets tonnes 1 611 091 2 401 066 1 768 289 1 532 302 2 118 072 Scrap tonnes 5 305 194 6 658 407 5 737 878 5 656 924 5 292 669 Kaolin tonnes 715 770 705 107 625 826 629 989 624 461 Lead Ores and concentrates tonnes 184 018 205 464 228 444 258 922 266 438 Unwrought tonnes 157 301 157 653 148 576 149 465 144 872 Scrap tonnes 39 653 35 823 28 058 28 091 26 409 Lithium Oxides (a) tonnes * 1 800 * 1 700 * 1 300 * 1 600 * 1 766 Carbonate tonnes 6 486 5 735 6 064 5 977 6 015

52
Germany Imports continued
Commodity Units 2010 2011 2012 2013 2014
Magnesite and magnesia Magnesite tonnes 12 751 5 625 5 285 4 637 5 018 Magnesia tonnes 473 545 515 139 496 202 535 966 520 831 Manganese Ores and concentrates (b) tonnes 17 346 19 137 18 532 18 872 17 359 Metal tonnes 43 346 40 705 35 671 32 039 34 320 Mercury kilograms 104 241 134 666 52 469 46 484 19 254 Mica Unmanufactured tonnes 1 330 10 527 8 934 7 986 8 043 Ground tonnes 29 716 26 405 24 116 24 104 26 407 Waste tonnes 428 20 — — — Molybdenum Ores and concentrates tonnes 9 134 9 500 7 158 6 165 4 354 Metal tonnes 3 038 3 761 4 016 3 479 3 760 Oxides tonnes 2 890 2 699 2 385 2 423 2 619 Nickel Mattes, sinters etc tonnes 849 2 048 1 869 766 545 Ores and concentrates tonnes 1 667 1 184 8 185 1 637 3 042 Unwrought tonnes 69 282 68 023 73 360 66 360 60 726 Unwrought alloys tonnes 8 023 11 778 23 191 7 844 11 039 Oxides tonnes 621 476 608 532 510 Scrap tonnes 8 584 11 924 14 191 10 135 11 858 Crude petroleum tonnes 91 239 711 87 338 296 92 277 990 91 465 347 87 502 814 Natural gas tonnes 82 784 241 87 762 701 92 961 372 98 149 729 101 080 184 Phosphate rock tonnes 120 580 117 971 133 355 85 115 115 409 Platinum metals Platinum kilograms 40 983 38 019 32 874 33 128 38 066 Palladium kilograms 53 479 50 926 47 449 41 511 43 339 Other platinum metals kilograms 19 655 21 319 18 444 15 626 15 963 Waste and scrap kilograms 8 069 744 7 290 427 8 020 283 7 091 894 7 580 861 Potash Sulphate tonnes 20 786 22 490 21 559 19 889 22 579 Chloride tonnes 131 645 131 244 146 673 172 910 198 212 Other potassic fertilisers tonnes 8 065 11 726 7 729 14 129 13 004 Rare earths Metals tonnes 459 263 290 267 276 Cerium compounds tonnes 1 006 844 553 862 1 601 Other rare earth compounds tonnes 9 999 6 904 4 155 5 862 5 618 Ferro-cerium and other pyrophoric alloys tonnes 6 14 11 13 12 Salt tonnes 2 654 736 3 477 233 2 277 714 2 376 658 2 404 752 Sillimanite minerals Sillimanite minerals tonnes 47 738 48 748 54 045 50 227 70 963 Mullite tonnes 47 775 72 049 51 709 57 152 28 806 Silver Ores and concentrates kilograms 4 002 438 3 493 141 5 279 656 2 590 874 5 378 985 Metal kilograms 2 322 566 2 434 577 1 858 257 2 203 529 2 157 829 Sulphur and pyrites Pyrites tonnes 76 101 82 530 74 726 74 610 92 419 Sulphur tonnes 44 103 51 714 34 102 49 080 69 343 Sulphur, sublimed and precipitated tonnes 1 649 4 363 4 637 3 889 2 734 Talc tonnes 324 703 330 321 293 175 304 604 307 921 Tantalum and niobium Tantalum tonnes 231 376 221 178 151 Tin Unwrought tonnes 18 684 21 396 18 865 19 224 20 561 Unwrought alloys tonnes 316 112 196 186 163 Scrap tonnes 714 1 578 461 880 536 Titanium Titanium minerals tonnes 838 768 794 043 648 030 612 633 699 059 Metal tonnes 12 919 20 233 17 015 16 198 17 038 Oxides tonnes 309 500 329 073 264 304 309 892 321 016 Titanium slag tonnes 164 2 499 ... ... ... Tungsten Ores and concentrates tonnes 1 029 843 381 119 357 Metal tonnes 7 168 8 094 6 946 6 351 6 644 Carbide tonnes 2 544 3 105 2 478 2 337 2 678
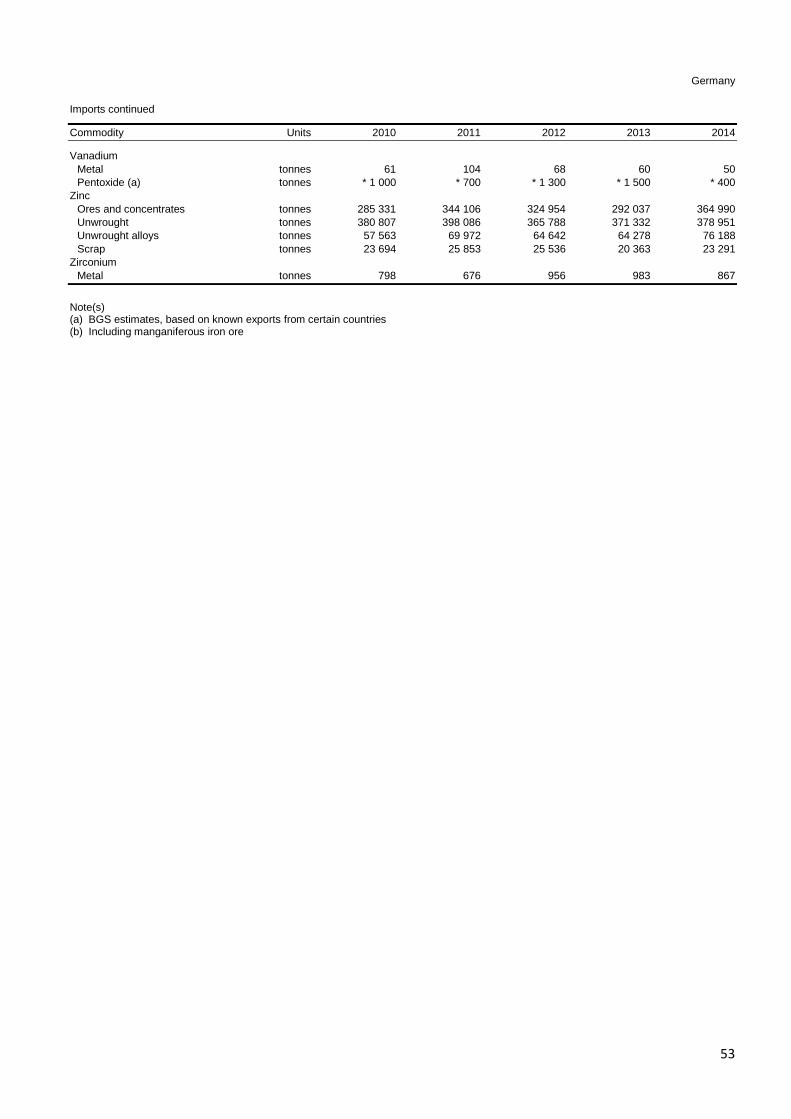
53
Germany Imports continued
Commodity Units 2010 2011 2012 2013 2014
Vanadium Metal tonnes 61 104 68 60 50 Pentoxide (a) tonnes * 1 000 * 700 * 1 300 * 1 500 * 400 Zinc Ores and concentrates tonnes 285 331 344 106 324 954 292 037 364 990 Unwrought tonnes 380 807 398 086 365 788 371 332 378 951 Unwrought alloys tonnes 57 563 69 972 64 642 64 278 76 188 Scrap tonnes 23 694 25 853 25 536 20 363 23 291 Zirconium Metal tonnes 798 676 956 983 867
Note(s) (a) BGS estimates, based on known exports from certain countries (b) Including manganiferous iron ore
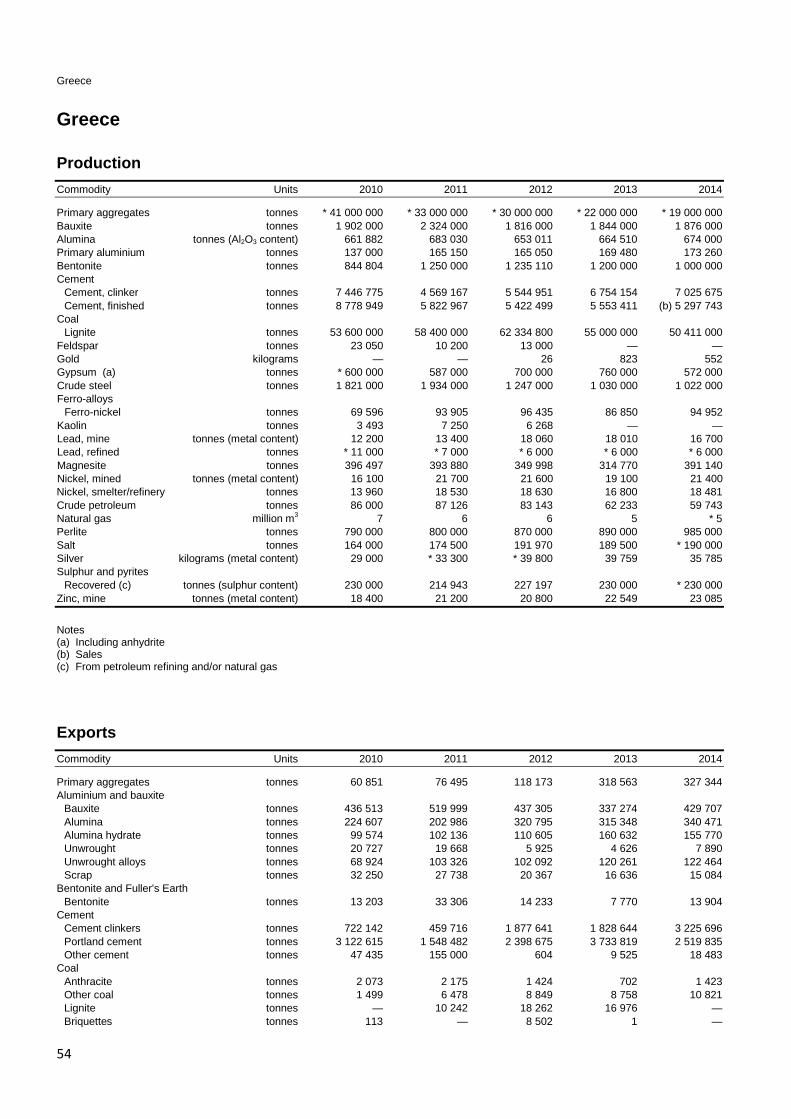
54
Greece Greece
Production Commodity Units 2010 2011 2012 2013 2014
Primary aggregates tonnes * 41 000 000 * 33 000 000 * 30 000 000 * 22 000 000 * 19 000 000 Bauxite tonnes 1 902 000 2 324 000 1 816 000 1 844 000 1 876 000 Alumina tonnes (Al2O3 content) 661 882 683 030 653 011 664 510 674 000 Primary aluminium tonnes 137 000 165 150 165 050 169 480 173 260 Bentonite tonnes 844 804 1 250 000 1 235 110 1 200 000 1 000 000 Cement Cement, clinker tonnes 7 446 775 4 569 167 5 544 951 6 754 154 7 025 675 Cement, finished tonnes 8 778 949 5 822 967 5 422 499 5 553 411 (b) 5 297 743 Coal Lignite tonnes 53 600 000 58 400 000 62 334 800 55 000 000 50 411 000 Feldspar tonnes 23 050 10 200 13 000 — — Gold kilograms — — 26 823 552 Gypsum (a) tonnes * 600 000 587 000 700 000 760 000 572 000 Crude steel tonnes 1 821 000 1 934 000 1 247 000 1 030 000 1 022 000 Ferro-alloys Ferro-nickel tonnes 69 596 93 905 96 435 86 850 94 952 Kaolin tonnes 3 493 7 250 6 268 — — Lead, mine tonnes (metal content) 12 200 13 400 18 060 18 010 16 700 Lead, refined tonnes * 11 000 * 7 000 * 6 000 * 6 000 * 6 000 Magnesite tonnes 396 497 393 880 349 998 314 770 391 140 Nickel, mined tonnes (metal content) 16 100 21 700 21 600 19 100 21 400 Nickel, smelter/refinery tonnes 13 960 18 530 18 630 16 800 18 481 Crude petroleum tonnes 86 000 87 126 83 143 62 233 59 743 Natural gas million m3 7 6 6 5 * 5 Perlite tonnes 790 000 800 000 870 000 890 000 985 000 Salt tonnes 164 000 174 500 191 970 189 500 * 190 000 Silver kilograms (metal content) 29 000 * 33 300 * 39 800 39 759 35 785 Sulphur and pyrites Recovered (c) tonnes (sulphur content) 230 000 214 943 227 197 230 000 * 230 000 Zinc, mine tonnes (metal content) 18 400 21 200 20 800 22 549 23 085
Notes (a) Including anhydrite (b) Sales (c) From petroleum refining and/or natural gas
Exports Commodity Units 2010 2011 2012 2013 2014
Primary aggregates tonnes 60 851 76 495 118 173 318 563 327 344 Aluminium and bauxite Bauxite tonnes 436 513 519 999 437 305 337 274 429 707 Alumina tonnes 224 607 202 986 320 795 315 348 340 471 Alumina hydrate tonnes 99 574 102 136 110 605 160 632 155 770 Unwrought tonnes 20 727 19 668 5 925 4 626 7 890 Unwrought alloys tonnes 68 924 103 326 102 092 120 261 122 464 Scrap tonnes 32 250 27 738 20 367 16 636 15 084 Bentonite and Fuller's Earth Bentonite tonnes 13 203 33 306 14 233 7 770 13 904 Cement Cement clinkers tonnes 722 142 459 716 1 877 641 1 828 644 3 225 696 Portland cement tonnes 3 122 615 1 548 482 2 398 675 3 733 819 2 519 835 Other cement tonnes 47 435 155 000 604 9 525 18 483 Coal Anthracite tonnes 2 073 2 175 1 424 702 1 423 Other coal tonnes 1 499 6 478 8 849 8 758 10 821 Lignite tonnes — 10 242 18 262 16 976 — Briquettes tonnes 113 — 8 502 1 —
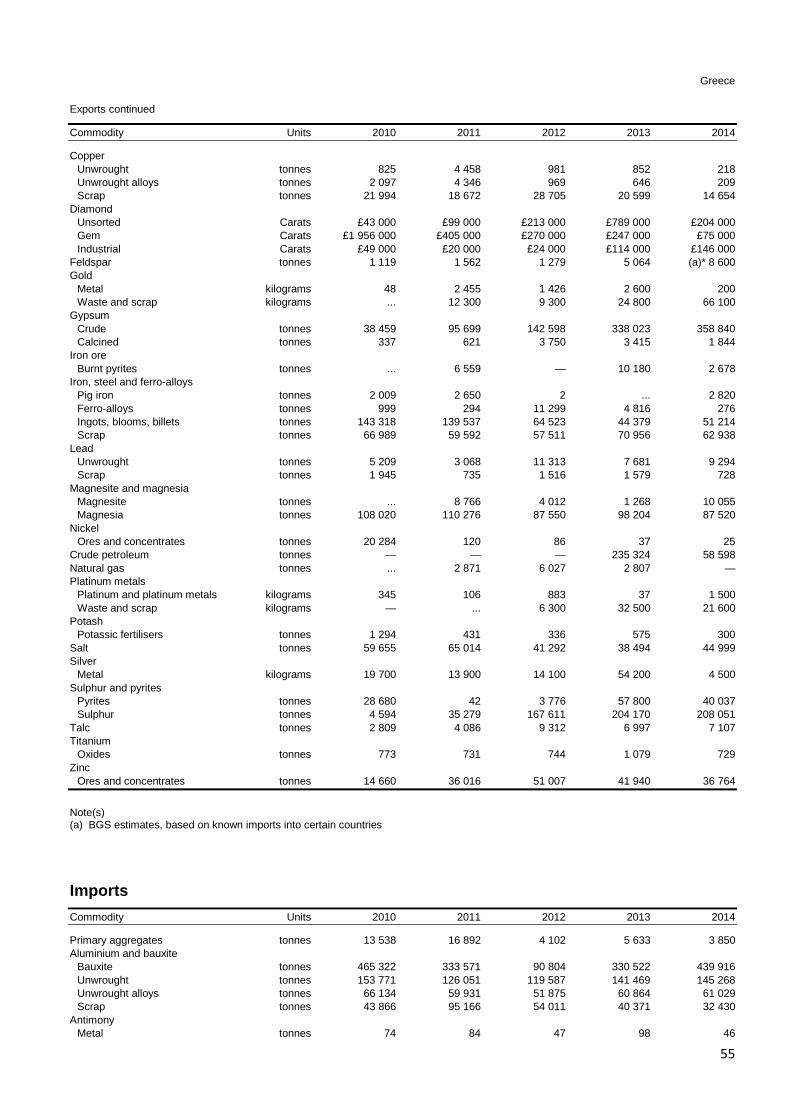
55
Greece
Exports continued
Commodity Units 2010 2011 2012 2013 2014
Copper Unwrought tonnes 825 4 458 981 852 218 Unwrought alloys tonnes 2 097 4 346 969 646 209 Scrap tonnes 21 994 18 672 28 705 20 599 14 654 Diamond Unsorted Carats £43 000 £99 000 £213 000 £789 000 £204 000 Gem Carats £1 956 000 £405 000 £270 000 £247 000 £75 000 Industrial Carats £49 000 £20 000 £24 000 £114 000 £146 000 Feldspar tonnes 1 119 1 562 1 279 5 064 (a)* 8 600 Gold Metal kilograms 48 2 455 1 426 2 600 200 Waste and scrap kilograms ... 12 300 9 300 24 800 66 100 Gypsum Crude tonnes 38 459 95 699 142 598 338 023 358 840 Calcined tonnes 337 621 3 750 3 415 1 844 Iron ore Burnt pyrites tonnes ... 6 559 — 10 180 2 678 Iron, steel and ferro-alloys Pig iron tonnes 2 009 2 650 2 ... 2 820 Ferro-alloys tonnes 999 294 11 299 4 816 276 Ingots, blooms, billets tonnes 143 318 139 537 64 523 44 379 51 214 Scrap tonnes 66 989 59 592 57 511 70 956 62 938 Lead Unwrought tonnes 5 209 3 068 11 313 7 681 9 294 Scrap tonnes 1 945 735 1 516 1 579 728 Magnesite and magnesia Magnesite tonnes ... 8 766 4 012 1 268 10 055 Magnesia tonnes 108 020 110 276 87 550 98 204 87 520 Nickel Ores and concentrates tonnes 20 284 120 86 37 25 Crude petroleum tonnes — — — 235 324 58 598 Natural gas tonnes ... 2 871 6 027 2 807 — Platinum metals Platinum and platinum metals kilograms 345 106 883 37 1 500 Waste and scrap kilograms — ... 6 300 32 500 21 600 Potash Potassic fertilisers tonnes 1 294 431 336 575 300 Salt tonnes 59 655 65 014 41 292 38 494 44 999 Silver Metal kilograms 19 700 13 900 14 100 54 200 4 500 Sulphur and pyrites Pyrites tonnes 28 680 42 3 776 57 800 40 037 Sulphur tonnes 4 594 35 279 167 611 204 170 208 051 Talc tonnes 2 809 4 086 9 312 6 997 7 107 Titanium Oxides tonnes 773 731 744 1 079 729 Zinc Ores and concentrates tonnes 14 660 36 016 51 007 41 940 36 764
Note(s) (a) BGS estimates, based on known imports into certain countries
Imports Commodity Units 2010 2011 2012 2013 2014
Primary aggregates tonnes 13 538 16 892 4 102 5 633 3 850 Aluminium and bauxite Bauxite tonnes 465 322 333 571 90 804 330 522 439 916 Unwrought tonnes 153 771 126 051 119 587 141 469 145 268 Unwrought alloys tonnes 66 134 59 931 51 875 60 864 61 029 Scrap tonnes 43 866 95 166 54 011 40 371 32 430 Antimony Metal tonnes 74 84 47 98 46

56
Greece
Imports continued
Commodity Units 2010 2011 2012 2013 2014
Arsenic Metallic arsenic tonnes 33 9 3 3 10 Barytes Barium minerals tonnes 1 318 2 277 1 222 2 667 1 396 Bentonite tonnes 3 668 7 193 5 831 4 125 4 436 Bismuth Metal tonnes 0 12 21 60 1 Cement Cement clinkers tonnes 12 100 34 712 65 317 87 439 122 637 Portland cement tonnes 206 164 159 514 49 204 24 791 41 196 Other cement tonnes 15 136 22 371 22 214 13 618 13 338 Coal Anthracite tonnes 48 783 117 406 21 961 21 083 26 932 Other coal tonnes 512 663 169 990 117 867 339 450 178 480 Lignite tonnes 87 707 165 417 206 384 163 191 117 979 Briquettes tonnes 62 12 986 53 028 61 330 21 867 Cobalt Metal tonnes 3 17 64 39 65 Copper Unwrought tonnes 63 684 54 258 54 080 54 806 58 503 Scrap tonnes 20 017 29 253 43 607 33 690 35 548 Diamond Unsorted Carats 910 000 525 000 135 000 685 000 305 000 Gem, rough Carats 558 241 292 617 * 86 000 * 49 000 ... Gem, cut Carats 7 000 000 2 000 000 4 500 000 4 000 000 1 140 000 Industrial Carats 4 375 000 3 680 000 2 150 000 220 000 380 000 Dust Carats (a)* 245 000 200 435 (a)* 125 000 (a)* 100 000 (a)* 165 000 Diatomite tonnes 668 623 647 424 557 Feldspar tonnes 12 195 9 469 20 6 128 8 643 Fluorspar tonnes 2 652 3 073 2 104 1 349 1 606 Gold Metal kilograms 1 055 500 346 12 373 6 793 Graphite tonnes 219 92 68 64 103 Gypsum Crude and calcined tonnes 1 759 1 400 3 714 4 576 6 799 Iodine kilograms 1 300 200 300 753 200 Iron, steel and ferro-alloys Pig iron tonnes 4 427 9 127 470 2 615 7 369 Sponge and powder tonnes 5 772 3 302 429 680 697 Ferro-chrome tonnes 693 1 217 1 304 1 174 1 425 Ferro-manganese tonnes 837 271 203 162 197 Ferro-silico-manganese tonnes 18 515 12 695 10 971 12 124 10 415 Ferro-silicon tonnes 4 888 4 361 2 924 2 623 2 496 Other ferro-alloys tonnes 849 167 156 401 838 Silicon metal tonnes 1 426 1 746 1 212 1 487 1 779 Ingots, blooms, billets tonnes 28 092 71 878 17 546 45 081 34 204 Scrap tonnes 1 008 235 935 510 413 394 301 661 457 959 Kaolin tonnes 31 132 14 336 7 454 8 808 8 254 Lead Unwrought tonnes 11 149 16 980 17 028 16 937 22 195 Scrap tonnes 1 692 2 136 2 183 915 1 032 Magnesite and magnesia Magnesite tonnes 3 603 14 704 14 475 21 012 15 425 Magnesia tonnes 2 198 7 506 1 442 882 899 Manganese Ores and concentrates tonnes 22 888 51 374 26 294 22 943 22 304 Metal tonnes 292 175 855 1 029 1 623 Mercury kilograms 211 1 200 7 500 900 2 400 Mica tonnes 169 175 155 211 165 Crude petroleum tonnes 19 064 118 13 010 825 20 102 882 20 292 638 20 907 404 Natural gas tonnes 3 520 510 4 233 660 3 927 266 2 835 500 2 127 817 Phosphate rock tonnes 252 644 220 591 140 205 156 936 182 902 Platinum metals Platinum and platinum metals kilograms 500 1 400 900 400 183

57
Greece
Imports continued
Commodity Units 2010 2011 2012 2013 2014
Potash Sulphate tonnes 39 155 26 686 26 621 24 778 19 421 Chloride tonnes 35 176 27 276 19 735 19 026 36 912 Other potassic fertilisers tonnes 3 240 8 166 2 947 2 276 192 Rare earths Rare earth compounds tonnes 3 4 11 12 3 Ferro-cerium and other pyrophoric alloys tonnes 65 62 169 20 1 Salt tonnes 144 367 173 050 154 435 146 686 117 853 Sillimanite minerals tonnes 44 220 94 425 1 008 Silver Metal kilograms 29 900 55 100 51 900 68 500 55 200 Sulphur and pyrites Sulphur tonnes 42 673 80 976 31 788 38 372 20 225 Talc tonnes 8 869 8 663 13 779 8 123 9 855 Tin Unwrought (b) tonnes 160 211 70 46 82 Titanium Titanium minerals tonnes 504 396 220 275 292 Metal tonnes 74 74 47 260 141 Oxides tonnes 19 003 19 447 12 378 16 796 16 158 Zinc Unwrought tonnes 20 735 9 706 9 762 8 833 6 619 Unwrought alloys tonnes 1 799 1 652 1 579 1 062 1 025
Note(s) (a) BGS estimates, based on known exports from certain countries (b) Including alloys

58
Hungary
Hungary
Production Commodity Units 2010 2011 2012 2013 2014
Primary aggregates Sand and gravel tonnes 25 059 000 23 361 598 * 22 250 000 * 27 252 746 * 42 445 000 Crushed rock tonnes 11 390 100 9 128 819 * 9 000 000 * 7 483 894 * 8 477 000 Bauxite tonnes 307 000 277 800 255 000 93 700 14 000 Alumina tonnes (Al2O3 content) * 139 000 * 132 000 * 111 000 * 81 000 * 1 000 Bentonite tonnes 17 200 22 931 1 392 7 397 * 10 500 Cement Cement, clinker tonnes * 1 500 000 1 167 942 1 332 354 1 065 349 * 1 100 000 Cement, finished tonnes * 2 560 000 * 2 200 000 * 2 300 000 * 2 300 000 * 2 200 000 Coal Lignite tonnes 8 202 859 8 800 783 8 438 000 8 834 000 8 918 000 Brown coal tonnes 813 403 699 129 875 944 718 700 636 000 Diatomite tonnes 1 197 1 309 1 229 456 * 500 Gypsum (a) tonnes 20 000 3 000 — — — Pig iron tonnes 1 325 000 1 315 000 1 229 000 600 000 801 000 Crude steel tonnes 1 681 000 1 729 000 1 543 000 883 000 1 152 000 Manganese tonnes 55 000 58 000 51 000 35 000 51 000 Perlite tonnes 70 990 70 900 72 364 64 944 * 65 000 Crude petroleum tonnes 735 900 657 000 700 931 626 890 * 600 000 Natural gas million m3 2 600 2 315 2 205 2 028 2 055 Sulphur and pyrites Recovered (b) tonnes (sulphur content) 55 000 60 000 65 000 58 000 * 54 000
Notes (a) Including anhydrite (b) From petroleum refining and/or natural gas
Exports Commodity Units 2010 2011 2012 2013 2014
Primary aggregates tonnes 1 191 521 1 137 425 1 003 456 1 122 883 1 144 496 Aluminium and bauxite Bauxite tonnes 738 207 208 548 10 479 Alumina tonnes 112 819 107 937 99 699 78 432 60 677 Alumina hydrate tonnes 92 011 71 834 64 000 51 224 43 330 Unwrought (a) tonnes 41 719 38 819 36 491 39 897 44 072 Scrap tonnes 51 508 66 599 68 156 78 773 75 901 Barytes Barium minerals tonnes ... ... 180 2 034 209 Bentonite tonnes 954 782 1 047 813 577 Cement Cement clinkers tonnes 296 25 203 686 8 551 8 515 Portland cement tonnes 185 279 277 497 269 382 231 601 215 190 Other cement tonnes 795 6 451 1 363 11 762 2 201 Coal Anthracite tonnes 9 151 5 077 210 11 24 Other coal tonnes 683 476 208 42 521 200 Lignite tonnes 3 390 4 886 4 539 14 179 24 593 Copper Unwrought, refined tonnes 24 786 5 867 10 432 4 448 Unwrought alloys tonnes 571 1 120 476 294 630 Scrap tonnes 15 319 31 459 37 048 35 024 31 929 Diamond Unsorted Carats 4 000 000 5 500 000 3 500 000 ... — Dust Carats ... 9 500 000 14 500 000 14 000 000 7 000 000 Gold Metal kilograms 1 827 2 214 2 529 2 535 900 Waste and scrap kilograms 2 221 600 2 665 300 2 115 900 11 900 17 200
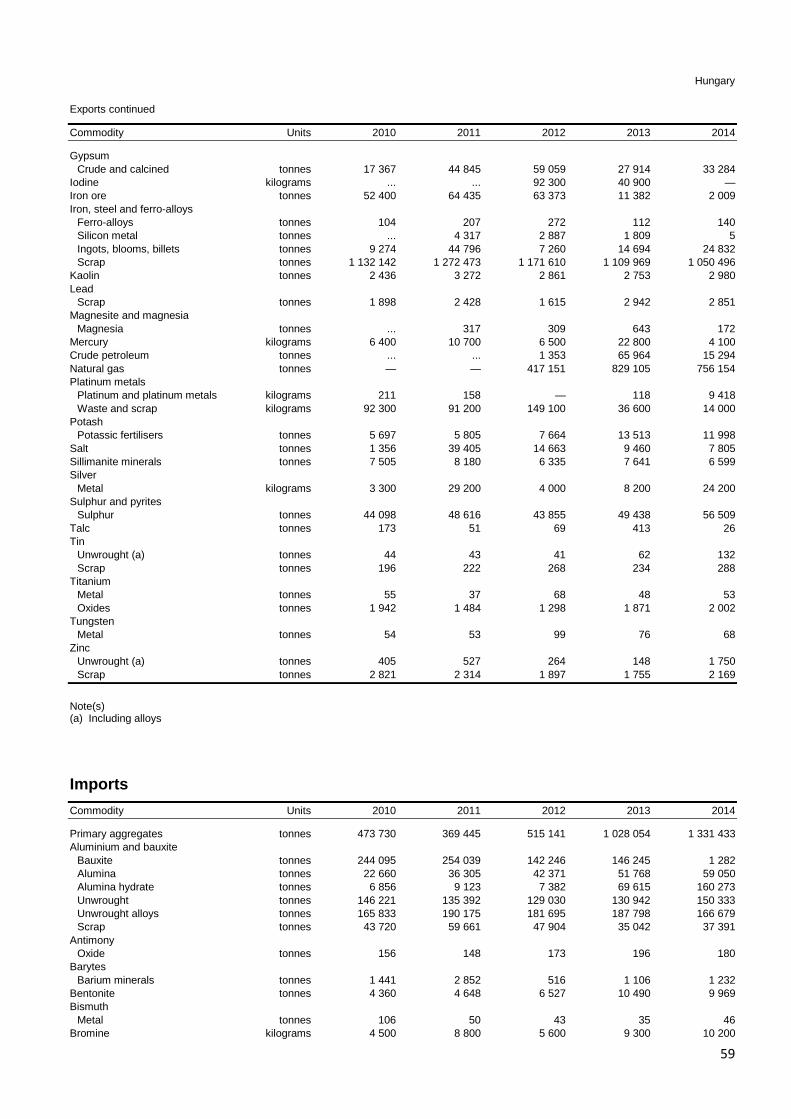
59
Hungary
Exports continued
Commodity Units 2010 2011 2012 2013 2014
Gypsum Crude and calcined tonnes 17 367 44 845 59 059 27 914 33 284 Iodine kilograms ... ... 92 300 40 900 — Iron ore tonnes 52 400 64 435 63 373 11 382 2 009 Iron, steel and ferro-alloys Ferro-alloys tonnes 104 207 272 112 140 Silicon metal tonnes ... 4 317 2 887 1 809 5 Ingots, blooms, billets tonnes 9 274 44 796 7 260 14 694 24 832 Scrap tonnes 1 132 142 1 272 473 1 171 610 1 109 969 1 050 496 Kaolin tonnes 2 436 3 272 2 861 2 753 2 980 Lead Scrap tonnes 1 898 2 428 1 615 2 942 2 851 Magnesite and magnesia Magnesia tonnes ... 317 309 643 172 Mercury kilograms 6 400 10 700 6 500 22 800 4 100 Crude petroleum tonnes ... ... 1 353 65 964 15 294 Natural gas tonnes — — 417 151 829 105 756 154 Platinum metals Platinum and platinum metals kilograms 211 158 — 118 9 418 Waste and scrap kilograms 92 300 91 200 149 100 36 600 14 000 Potash Potassic fertilisers tonnes 5 697 5 805 7 664 13 513 11 998 Salt tonnes 1 356 39 405 14 663 9 460 7 805 Sillimanite minerals tonnes 7 505 8 180 6 335 7 641 6 599 Silver Metal kilograms 3 300 29 200 4 000 8 200 24 200 Sulphur and pyrites Sulphur tonnes 44 098 48 616 43 855 49 438 56 509 Talc tonnes 173 51 69 413 26 Tin Unwrought (a) tonnes 44 43 41 62 132 Scrap tonnes 196 222 268 234 288 Titanium Metal tonnes 55 37 68 48 53 Oxides tonnes 1 942 1 484 1 298 1 871 2 002 Tungsten Metal tonnes 54 53 99 76 68 Zinc Unwrought (a) tonnes 405 527 264 148 1 750 Scrap tonnes 2 821 2 314 1 897 1 755 2 169
Note(s) (a) Including alloys
Imports Commodity Units 2010 2011 2012 2013 2014
Primary aggregates tonnes 473 730 369 445 515 141 1 028 054 1 331 433 Aluminium and bauxite Bauxite tonnes 244 095 254 039 142 246 146 245 1 282 Alumina tonnes 22 660 36 305 42 371 51 768 59 050 Alumina hydrate tonnes 6 856 9 123 7 382 69 615 160 273 Unwrought tonnes 146 221 135 392 129 030 130 942 150 333 Unwrought alloys tonnes 165 833 190 175 181 695 187 798 166 679 Scrap tonnes 43 720 59 661 47 904 35 042 37 391 Antimony Oxide tonnes 156 148 173 196 180 Barytes Barium minerals tonnes 1 441 2 852 516 1 106 1 232 Bentonite tonnes 4 360 4 648 6 527 10 490 9 969 Bismuth Metal tonnes 106 50 43 35 46 Bromine kilograms 4 500 8 800 5 600 9 300 10 200

60
Hungary
Imports continued
Commodity Units 2010 2011 2012 2013 2014
Cement Cement clinkers tonnes 69 469 67 770 43 196 68 506 128 882 Portland cement tonnes 495 045 785 166 710 516 978 968 1 019 495 Other cement tonnes 34 191 33 802 6 809 27 678 27 360 Chromium Metal tonnes 82 99 95 130 172 Coal Hard coal (a) tonnes 1 744 778 1 570 645 1 556 689 1 366 089 1 439 839 Lignite tonnes 297 335 318 792 224 685 187 326 139 549 Briquettes tonnes 14 352 11 018 21 885 31 443 17 784 Copper Unwrought, unrefined tonnes 772 1 272 1 502 1 102 1 114 Unwrought, refined tonnes 1 624 2 076 8 281 10 733 4 474 Unwrought alloys tonnes 1 241 1 471 1 434 1 036 1 006 Scrap tonnes 4 038 5 416 4 831 3 942 3 907 Diamond Gem, cut Carats £280 000 £657 000 £421 000 £80 000 £123 000 Industrial Carats £168 000 £675 000 £346 000 £153 000 £55 000 Dust Carats (b)* 8 910 000 (b)* 12 690 000 14 500 000 14 000 000 7 000 000 Diatomite tonnes 957 1 189 885 649 689 Feldspar tonnes 14 235 14 211 13 905 10 755 15 329 Fluorspar tonnes 2 662 4 152 3 014 3 984 3 326 Gold Metal kilograms 396 1 512 * 1 500 1 898 788 Gypsum Crude tonnes 5 362 5 198 5 241 3 608 2 777 Calcined tonnes 12 413 18 039 24 138 31 969 35 398 Iodine kilograms 2 700 6 100 4 000 8 000 12 600 Iron ore tonnes 1 985 510 1 780 865 (c) 1 632 969 (c) 845 366 1 267 611 Iron, steel and ferro-alloys Pig iron tonnes 7 158 5 662 5 527 5 079 8 122 Ferro-chrome tonnes 187 223 279 323 229 Ferro-manganese tonnes 12 015 16 011 12 255 5 753 8 770 Ferro-silico-manganese tonnes 724 1 785 225 1 191 1 553 Ferro-molybdenum tonnes 85 105 108 89 141 Ferro-niobium tonnes 75 141 111 71 116 Ferro-phosphorus tonnes 652 60 111 161 249 Ferro-silicon tonnes 3 630 3 999 2 969 2 275 2 429 Other ferro-alloys tonnes 569 312 410 263 545 Silicon metal tonnes 4 010 7 832 5 619 4 061 2 563 Ingots, blooms, billets tonnes 30 505 240 299 565 955 1 156 777 727 071 Scrap tonnes 56 974 68 566 34 219 51 899 75 819 Kaolin tonnes 24 175 29 736 23 099 26 053 30 157 Lead Unwrought tonnes 6 138 9 497 11 372 8 710 9 751 Magnesite and magnesia Magnesite tonnes 1 331 1 499 1 124 1 351 722 Magnesia tonnes 6 783 4 369 4 739 6 291 6 444 Manganese Ores and concentrates tonnes 198 159 142 304 229 Metal tonnes 336 461 500 589 659 Mercury kilograms 5 000 8 400 6 100 5 400 6 900 Molybdenum Metal tonnes 70 60 51 60 59 Nickel Unwrought tonnes (d) 346 (d) 35 (d) 47 (d) 159 302 Natural gas tonnes 5 858 735 5 788 348 5 509 482 6 064 192 7 844 861 Crude petroleum tonnes 5 310 899 5 935 772 5 489 453 5 741 800 6 057 010 Phosphate rock tonnes 1 305 1 028 312 215 24 Platinum metals Platinum and platinum metals kilograms 1 300 84 — 38 29 Potash Chloride tonnes 90 063 98 351 106 292 127 342 133 156 Other potassic fertilisers tonnes 5 760 6 161 5 449 5 141 7 798 Rare earths Cerium compounds tonnes 38 33 31 20 42 Other rare earth compounds tonnes 31 23 31 11 15

61
Hungary
Imports continued
Commodity Units 2010 2011 2012 2013 2014
Salt tonnes 704 143 800 950 540 297 841 520 599 639 Sillimanite minerals Sillimanite minerals tonnes 2 100 2 903 3 039 2 515 4 165 Mullite tonnes 1 348 1 854 1 352 1 364 1 174 Silver Metal kilograms 196 500 234 100 229 700 232 900 331 700 Sulphur and pyrites Sulphur tonnes 3 189 1 100 981 934 1 066 Sulphur, sublimed and precipitated tonnes 119 223 172 7 224 Talc tonnes 6 786 6 226 5 319 6 010 5 438 Tantalum and niobium Tantalum tonnes 32 0 0 0 2 Tin Unwrought (d) tonnes 231 156 205 253 227 Titanium Titanium minerals tonnes 2 677 2 410 3 038 3 254 3 214 Metal tonnes 84 134 116 143 149 Oxides tonnes 8 927 8 885 7 325 8 809 9 606 Tungsten Metal tonnes 54 67 56 78 70 Zinc Unwrought tonnes 8 806 9 478 9 838 8 660 10 895 Unwrought alloys tonnes 2 961 3 340 3 018 3 479 4 579 Zirconium Concentrates tonnes 2 455 1 765 1 965 1 444 1 209
Note(s) (a) Including anthracite (b) BGS estimates, based on known exports from certain countries (c) Including burnt pyrites (d) Including alloys

62
Iceland Iceland
Production Commodity Units 2010 2011 2012 2013 2014
Primary aggregates Sand and gravel tonnes 201 280 221 920 232 112 291 384 * 291 000 Primary aluminium tonnes 825 803 780 853 802 827 736 429 748 949 Ferro-alloys Ferro-silicon tonnes 114 230 120 076 131 818 125 204 109 739
Exports Commodity Units 2010 2011 2012 2013 2014
Primary aggregates tonnes 44 512 85 854 92 094 81 265 53 105 Aluminium and bauxite Unwrought tonnes 812 981 765 999 787 071 788 366 699 341 Scrap tonnes 10 136 6 397 3 799 3 672 6 062 Cement Portland cement tonnes 4 146 1 35 — Iron, steel and ferro-alloys Ferro-silicon tonnes 114 231 120 076 131 818 125 204 112 657 Other ferro-alloys tonnes 5 603 6 0 0 0 Ingots, blooms, billets tonnes ... 0 1 1 4 485 Scrap tonnes 37 328 38 954 28 581 40 564 48 112 Salt tonnes 1 093 1 402 694 1 228 1 356
Imports Commodity Units 2010 2011 2012 2013 2014
Primary aggregates tonnes 6 492 7 524 32 327 14 981 28 860 Aluminium and bauxite Alumina tonnes 1 612 188 1 539 080 1 590 521 1 646 175 1 583 285 Unwrought (a) tonnes 6 127 5 560 1 356 1 968 7 288 Bentonite tonnes 432 563 281 304 46 Cement Portland cement tonnes 24 481 26 714 64 565 82 861 95 935 Other cement tonnes 4 405 226 229 255 242 Coal Anthracite tonnes 101 220 103 822 103 989 125 109 100 096 Other coal (b) tonnes * 115 000 * 228 000 * 115 000 * 59 000 * 127 000 Diamond Gem, cut Carats 110 592 90 000 160 000 210 000 230 000 Industrial Carats * 76 000 125 000 75 000 105 000 70 000 Gypsum Crude and calcined tonnes 2 771 1 073 872 932 1 763 Iodine kilograms 9 24 278 159 1 316 Iron ore tonnes 36 318 42 846 19 251 22 916 11 088 Iron, steel and ferro-alloys Pig iron tonnes 1 148 841 844 792 1 833 Ferro-alloys tonnes 6 838 204 727 69 134 Silicon metal tonnes 4 366 3 204 4 816 6 377 7 469 Scrap tonnes 11 545 4 680 7 173 4 516 Magnesite and magnesia tonnes 1 3 2 365 232 Rare earths Metals tonnes 350 77 ... ... ... Salt tonnes 65 342 94 177 100 020 84 266 88 758

63
Iceland
Imports continued
Commodity Units 2010 2011 2012 2013 2014
Silver Metal kilograms 909 700 640 399 489 Titanium Metal tonnes 100 59 75 80 154
Note(s) (a) Including alloys (b) BGS estimates, based on known exports from certain countries

64
Ireland, Republic of
Ireland, Republic of
Production Commodity Units 2010 2011 2012 2013 2014
Primary aggregates Sand and gravel tonnes * 10 000 000 * 7 000 000 * 7 000 000 * 7 000 000 7 000 000 Crushed rock tonnes * 40 000 000 * 25 000 000 * 22 000 000 * 22 000 000 22 000 000 Alumina tonnes (Al2O3 content) 1 211 600 1 249 300 1 250 600 1 264 689 1 270 784 Cement Cement, finished tonnes * 2 290 000 * 1 700 000 1 573 000 1 450 000 1 500 000 Gypsum tonnes * 300 000 * 300 000 * 200 000 * 200 000 * 300 000 Lead, mine tonnes (metal content) 39 100 50 700 47 400 42 950 40 500 Lead, refined tonnes 19 000 18 000 16 000 17 000 17 200 Natural gas (a) million m3 402 357 381 343 354 Silver kilograms (metal content) 3 818 6 109 9 454 7 822 6 436 Zinc, mine tonnes (metal content) 342 500 344 000 337 500 326 700 282 600
Notes (a) Sales
Exports Commodity Units 2010 2011 2012 2013 2014
Primary aggregates tonnes 13 318 16 005 88 530 147 770 129 518 Aluminium and bauxite Alumina tonnes 1 542 563 1 794 148 1 616 065 1 867 541 1 846 540 Alumina hydrate tonnes 124 803 103 631 30 328 55 265 111 513 Unwrought alloys tonnes 2 576 3 109 2 684 3 095 3 148 Scrap tonnes 22 810 29 261 24 137 29 763 25 260 Cement Cement clinkers tonnes 1 — 16 698 0 — Portland cement tonnes 1 025 910 942 940 1 238 718 1 234 596 1 524 566 Other cement tonnes 8 787 1 158 971 1 074 595 Coal Hard coal tonnes 5 820 (a) 2 857 18 914 (a) 35 038 27 286 Briquettes tonnes 12 695 11 333 12 115 12 113 11 352 Cobalt Ore tonnes 184 68 177 144 162 Metal tonnes 234 125 234 272 310 Copper Scrap tonnes 13 172 10 168 10 046 9 601 10 287 Diamond Gem, rough Carats 10 000 100 000 — 5 000 — Gem, cut Carats 345 000 260 000 600 000 405 000 520 000 Industrial Carats 58 658 2 801 447 460 000 3 170 000 625 000 Dust Carats 65 787 012 283 458 829 ... 69 945 000 114 610 000 Gold Waste and scrap kilograms 10 480 9 268 68 063 179 072 24 283 Gypsum Crude tonnes 23 355 5 390 5 176 7 039 8 025 Calcined tonnes 15 129 21 274 16 585 16 699 18 723 Iodine kilograms — 2 589 — — — Iron, steel and ferro-alloys Sponge and powder tonnes ... 18 709 150 1 268 653 Ingots, blooms, billets tonnes 262 9 240 510 425 887 Scrap tonnes 484 871 609 985 517 800 447 391 447 669 Lead Ores and concentrates tonnes 62 729 64 470 80 910 70 125 71 545 Scrap tonnes 638 4 144 42 384 30 813 39 993 Magnesite and magnesia Magnesite tonnes 3 383 18 665 13 218 4 114 16 568 Magnesia tonnes 33 334 11 761 3 465 41 749 61 343

65
Ireland, Republic of
Exports continued
Commodity Units 2010 2011 2012 2013 2014
Nickel Scrap tonnes 557 269 208 188 162 Crude petroleum tonnes 96 46 629 62 — — Platinum metals Platinum and platinum metals kilograms * 213 * 295 * 268 549 984 Waste and scrap kilograms 5 440 1 763 3 496 1 775 2 012 Rare earths Ferro-cerium and other pyrophoric alloys tonnes ... ... ... 14 5 Salt tonnes 10 183 1 540 2 608 2 656 3 549 Silver Metal kilograms ... 263 824 608 666 Tin Unwrought tonnes (b) 689 — — — — Scrap tonnes 59 54 43 45 227 Zinc Ores and concentrates tonnes 588 143 660 259 647 444 615 916 531 029
Note(s) (a) Including anthracite (b) Including alloys
Imports Commodity Units 2010 2011 2012 2013 2014
Primary aggregates tonnes 652 594 695 162 817 052 840 968 963 667 Aluminium and bauxite Bauxite tonnes 4 111 457 4 215 019 4 169 784 4 434 990 4 424 292 Alumina tonnes 4 903 4 378 9 679 9 288 5 536 Antimony Metal tonnes 64 0 0 0 0 Bentonite tonnes 2 734 2 623 2 788 3 975 4 657 Bromine kilograms 743 38 566 675 501 1 568 Cement Cement clinkers tonnes 15 459 23 190 24 718 25 005 18 666 Portland cement tonnes 133 977 100 440 86 608 87 458 103 491 Other cement tonnes 4 974 4 112 4 375 5 793 4 229 Chromium Metal tonnes 83 179 40 77 82 Coal Anthracite tonnes 77 112 33 665 30 564 43 709 35 790 Other coal tonnes 1 601 294 2 149 095 2 028 332 2 300 643 1 731 529 Lignite tonnes 242 60 21 901 21 901 1 912 Briquettes tonnes 31 507 30 673 46 258 91 158 87 980 Cobalt Metal tonnes 756 601 743 701 3 117 Crude petroleum tonnes 2 931 391 2 720 968 2 843 575 2 989 606 2 776 466 Diamond Unsorted Carats £362 000 £320 000 £164 000 £172 000 £1 109 000 Gem, rough Carats 1 565 000 1 620 000 1 595 000 1 475 000 1 480 000 Gem, cut Carats 11 385 000 6 745 000 3 905 000 3 305 000 2 300 000 Industrial Carats 4 585 000 2 570 000 1 545 000 750 000 1 200 000 Dust Carats 86 782 073 737 418 949 358 020 000 405 650 000 526 160 000 Diatomite tonnes 640 699 965 683 439 Gold Metal kilograms £4 047 000 £5 356 000 £7 079 000 £11 757 000 £6 133 000 Gypsum Crude tonnes 20 637 2 731 10 715 10 688 38 603 Calcined tonnes 5 410 9 318 7 623 8 944 8 369 Iodine kilograms 13 311 22 220 32 305 23 685 31 919

66
Ireland, Republic of
Imports continued
Commodity Units 2010 2011 2012 2013 2014
Iron, steel and ferro-alloys Pig iron tonnes 1 345 946 797 797 131 Sponge and powder tonnes 989 1 176 1 216 698 443 Ferro-chrome tonnes 89 128 100 91 89 Other ferro-alloys tonnes 296 233 139 213 161 Ingots, blooms, billets tonnes 7 332 5 423 4 952 7 230 10 757 Scrap tonnes 4 030 3 310 6 565 3 496 3 171 Kaolin tonnes 4 039 3 414 3 377 3 489 3 457 Lead Unwrought tonnes 14 357 15 345 5 199 2 916 3 586 Scrap tonnes 12 074 12 305 14 089 16 874 16 884 Magnesite and magnesia Magnesite tonnes 5 535 6 333 1 731 7 853 2 054 Magnesia tonnes 39 638 49 122 48 779 43 182 44 472 Manganese Ores and concentrates (b) tonnes 54 9 565 31 19 37 Mercury kilograms 8 582 24 81 69 89 Mica tonnes 77 24 32 43 1 151 Nickel Unwrought (a) tonnes 1 503 1 748 568 409 181 Natural gas tonnes 4 738 918 4 430 360 4 282 222 4 372 123 4 111 051 Phosphate rock tonnes 5 328 264 327 55 3 476 Platinum metals Platinum and platinum metals kilograms 9 470 7 826 13 879 15 171 41 557 Potash Chloride tonnes 99 181 95 816 85 536 146 361 175 688 Other potassic fertilisers tonnes 7 570 2 011 5 249 6 697 3 933 Rare earths Rare earth compounds tonnes 8 85 3 2 4 Salt tonnes 172 053 308 884 105 270 131 516 131 561 Silver Metal kilograms 3 999 5 431 3 571 10 137 25 963 Talc tonnes 1 140 1 320 3 033 2 982 3 303 Tantalum and niobium Tantalum tonnes 85 0 1 0 1 Tin Unwrought (a) tonnes 157 117 22 17 24 Titanium Metal tonnes 414 202 432 1 297 1 558 Oxides tonnes 4 922 4 312 3 924 4 044 4 207 Tungsten Metal tonnes 91 76 121 101 141 Carbide tonnes 68 186 116 113 76 Zinc Unwrought (a) tonnes 2 104 2 358 2 058 2 481 2 579 Zirconium Concentrates tonnes 16 162 886 146 268 231
Note(s) (a) Including alloys (b) Including manganiferous iron ore

67
Italy
Italy
Production Commodity Units 2010 2011 2012 2013 2014
Primary aggregates Sand and gravel (a) tonnes 150 996 352 131 770 340 105 221 496 70 081 328 73 690 871 Crushed rock tonnes (a) 80 336 696 86 547 652 75 406 269 49 075 806 50 926 292 Primary aluminium tonnes 129 500 141 900 99 600 — — Barytes tonnes * 3 500 * 3 500 * 3 500 * 3 500 * 3 500 Bentonite tonnes 104 279 112 811 95 757 20 129 20 658 Cement Cement, clinker tonnes 22 670 724 22 282 388 18 700 700 15 691 270 15 133 894 Cement, finished tonnes 37 061 576 34 114 018 27 831 741 23 114 037 21 672 232 Copper, refined tonnes 1 800 7 600 7 700 4 900 7 900 Feldspar tonnes * 4 700 000 * 4 700 000 * 4 700 000 * 4 700 000 * 4 700 000 Gypsum (b) tonnes 4 441 109 3 642 897 3 200 920 3 192 186 8 551 200 Indium tonnes * 5 * 5 * 5 * 5 * 5 Pig iron tonnes 8 555 000 9 824 000 9 424 000 6 933 000 6 371 000 Crude steel tonnes 25 750 000 28 735 000 27 252 000 24 093 000 23 714 000 Ferro-alloys Ferro-manganese tonnes * 25 000 * 25 000 * 27 000 * 27 000 * 27 000 Ferro-silico-manganese tonnes 108 000 145 000 110 000 153 000 67 000 Kaolin tonnes * 180 000 * 180 000 * 180 000 * 180 000 * 180 000 Lead, refined tonnes 150 000 149 500 138 400 151 000 160 000 Perlite tonnes * 60 000 * 60 000 * 60 000 * 60 000 * 60 000 Crude petroleum tonnes 5 080 498 5 286 042 5 376 629 5 480 000 5 750 000 Natural gas million m3 7 900 8 300 8 540 7 710 7 280 Salt Rock salt and brine salt tonnes 4 006 882 2 912 128 2 862 440 2 672 340 2 560 441 Sulphur and pyrites Recovered (c) tonnes (sulphur content) 124 200 65 400 58 800 40 200 * 40 200 Recovered (d) tonnes (sulphur content) 600 000 620 000 540 000 510 000 * 510 000 Talc tonnes 140 000 140 000 140 000 162 234 * 165 000 Slab zinc tonnes 104 700 110 200 97 200 111 000 110 100
Notes (a) Sales (b) Including anhydrite (c) From metal sulphide processing (d) From petroleum refining and/or natural gas
Exports Commodity Units 2010 2011 2012 2013 2014
Primary aggregates tonnes 1 507 704 1 071 579 1 073 466 1 120 193 1 201 976 Aluminium and bauxite Bauxite tonnes 66 218 46 330 93 847 169 411 88 289 Alumina tonnes 17 056 16 821 3 424 4 411 7 746 Alumina hydrate tonnes 4 346 7 023 6 448 7 809 4 263 Unwrought tonnes 49 442 25 882 30 378 23 224 28 368 Unwrought alloys tonnes 220 237 286 525 311 381 322 614 342 526 Scrap tonnes 107 131 102 696 103 518 106 916 111 224 Antimony Ores and concentrates tonnes 960 898 1 311 1 669 1 970 Metal tonnes 19 80 2 7 61 Oxide tonnes 226 261 215 399 450 Barytes Barium minerals tonnes 1 906 2 623 4 898 4 427 5 735 Bentonite tonnes 257 173 214 775 225 729 224 684 235 922 Bismuth Metal tonnes 1 13 11 2 2 Cadmium Metal tonnes 3 104 1 722 363 3 3

68
Italy
Exports continued
Commodity Units 2010 2011 2012 2013 2014
Cement Cement clinkers tonnes 52 673 45 472 47 155 129 335 206 598 Portland cement tonnes 2 035 118 1 681 397 1 838 228 2 440 982 2 393 724 Other cement tonnes 393 746 250 624 200 038 162 360 192 682 Chromium Ores and concentrates tonnes 1 617 3 764 1 831 1 828 2 259 Coal Anthracite tonnes 12 817 17 611 12 841 13 515 19 808 Other coal tonnes 1 485 571 53 107 1 953 378 Briquettes tonnes 3 923 213 798 45 — Cobalt Metal tonnes 187 230 177 184 242 Oxides tonnes 206 224 188 390 422 Copper Matte and cement tonnes 61 1 333 1 041 5 550 Unwrought, unrefined tonnes 7 290 8 502 7 811 5 612 7 354 Unwrought, refined tonnes 8 648 13 506 21 312 12 227 4 818 Unwrought alloys tonnes 15 553 20 024 21 264 17 927 20 878 Scrap tonnes 167 424 174 068 181 600 172 601 174 345 Diamond Unsorted Carats 210 000 205 000 2 880 000 * 2 600 000 1 165 000 Gem, rough Carats 15 000 — 120 000 370 000 2 595 000 Gem, cut Carats 243 170 181 572 12 605 000 86 540 000 92 205 000 Industrial Carats 250 000 285 000 1 585 000 18 865 000 11 890 000 Dust Carats 15 054 770 14 873 656 10 850 000 7 825 000 6 280 000 Diatomite tonnes 6 716 2 226 1 229 1 458 1 373 Feldspar tonnes 194 763 288 246 220 404 261 124 235 591 Fluorspar tonnes 6 740 28 942 48 048 54 013 67 401 Gold Metal kilograms 109 762 176 952 200 363 138 471 103 143 Waste and scrap kilograms 154 845 1 006 7 001 10 283 3 990 Graphite tonnes 798 512 310 233 281 Gypsum Crude tonnes 12 035 9 614 8 383 35 889 289 213 Calcined tonnes 18 484 39 465 79 661 84 696 186 856 Iodine kilograms 24 722 20 112 22 559 26 637 128 186 Iron ore (a) tonnes 8 779 6 742 14 191 18 697 2 510 Iron, steel and ferro-alloys Pig iron tonnes 38 026 22 412 51 911 39 597 49 144 Sponge and powder tonnes 729 1 534 3 904 3 571 6 151 Ferro-chrome tonnes 5 020 5 639 3 399 4 180 5 291 Ferro-silico-chrome tonnes 48 57 — — 122 Ferro-silico-magnesium tonnes 33 27 114 527 92 Ferro-manganese tonnes 9 186 9 761 11 603 8 233 9 372 Ferro-silico-manganese tonnes 4 316 3 890 15 215 15 371 20 285 Ferro-molybdenum tonnes 149 41 1 048 368 607 Ferro-nickel tonnes 176 215 52 186 285 Ferro-silicon tonnes 6 329 8 642 7 741 10 028 10 964 Ferro-vanadium tonnes 6 124 324 78 335 Other ferro-alloys tonnes 809 770 644 923 748 Silicon metal tonnes 3 284 4 293 1 621 1 246 2 902 Ingots, blooms, billets tonnes 909 562 908 493 831 477 702 422 653 960 Scrap tonnes 422 731 317 626 324 451 253 587 268 714 Kaolin tonnes 36 208 27 994 21 393 24 241 29 178 Lead Unwrought tonnes 7 821 15 455 8 646 7 058 22 609 Scrap tonnes 9 776 10 173 14 804 11 681 12 877 Lithium Carbonate tonnes 49 105 73 84 133 Magnesite and magnesia Magnesite tonnes 2 535 3 236 2 902 2 305 3 372 Magnesia tonnes 7 393 6 194 7 283 7 237 6 997 Manganese Metal tonnes 716 963 897 600 470 Mercury kilograms 202 273 68 623 12 706 8 743 1 322 Mica tonnes 697 1 014 1 138 1 336 1 440

69
Italy
Exports continued
Commodity Units 2010 2011 2012 2013 2014
Molybdenum Ores and concentrates tonnes 1 523 2 299 3 153 2 503 6 023 Metal tonnes 911 443 409 76 728 Oxides tonnes 443 286 22 126 139 Nickel Unwrought (b) tonnes 2 408 2 097 2 182 2 766 2 898 Scrap tonnes 3 537 627 1 260 710 926 Crude petroleum tonnes 423 777 713 237 920 740 573 665 617 854 Natural gas tonnes 1 427 161 159 619 143 244 190 849 155 899 Phosphate rock tonnes 10 751 16 139 8 370 8 614 7 696 Platinum metals Platinum kilograms 10 408 9 982 10 071 9 791 12 296 Platinum metals kilograms 12 684 14 436 16 259 23 339 36 220 Waste and scrap kilograms 634 37 750 2 899 6 425 22 415 Potash Potassic fertilisers tonnes 13 629 8 702 8 551 9 426 9 698 Rare earths Metals tonnes 101 145 111 100 80 Rare earth compounds tonnes 236 322 353 319 250 Ferro-cerium and other pyrophoric alloys tonnes ... 3 6 4 3 Salt tonnes 919 673 1 017 938 473 826 776 645 459 773 Silver Ores and concentrates kilograms 38 — 1 112 3 538 Metal kilograms 715 501 995 384 979 652 1 024 151 1 027 173 Sulphur and pyrites Pyrites tonnes 13 698 16 032 11 114 13 741 13 208 Sulphur tonnes 286 954 285 891 249 274 212 188 146 971 Sulphur, sublimed and precipitated tonnes 22 485 55 740 17 021 5 279 20 028 Talc tonnes 143 236 135 418 140 618 144 432 141 343 Tin Unwrought (b) tonnes 367 383 582 869 370 Scrap tonnes 289 243 240 266 164 Titanium Metal tonnes 3 248 4 789 4 531 4 756 5 315 Oxides tonnes 27 450 26 181 22 039 37 137 35 730 Tungsten Ores and concentrates tonnes ... ... 0 0 62 Metal tonnes 925 1 091 1 060 687 858 Vanadium Metal tonnes 37 1 ... ... 477 Zinc Ores and concentrates tonnes 98 211 71 471 84 569 89 580 68 508 Unwrought tonnes 11 071 16 570 14 737 8 016 11 199 Unwrought alloys tonnes 6 377 9 385 10 029 8 415 7 417 Scrap tonnes 16 427 13 006 7 151 7 019 10 416 Zirconium Concentrates tonnes 41 784 44 252 11 012 2 832 3 500 Metal tonnes 136 34 137 27 17
Note(s) (a) Including burnt pyrites (b) Including alloys
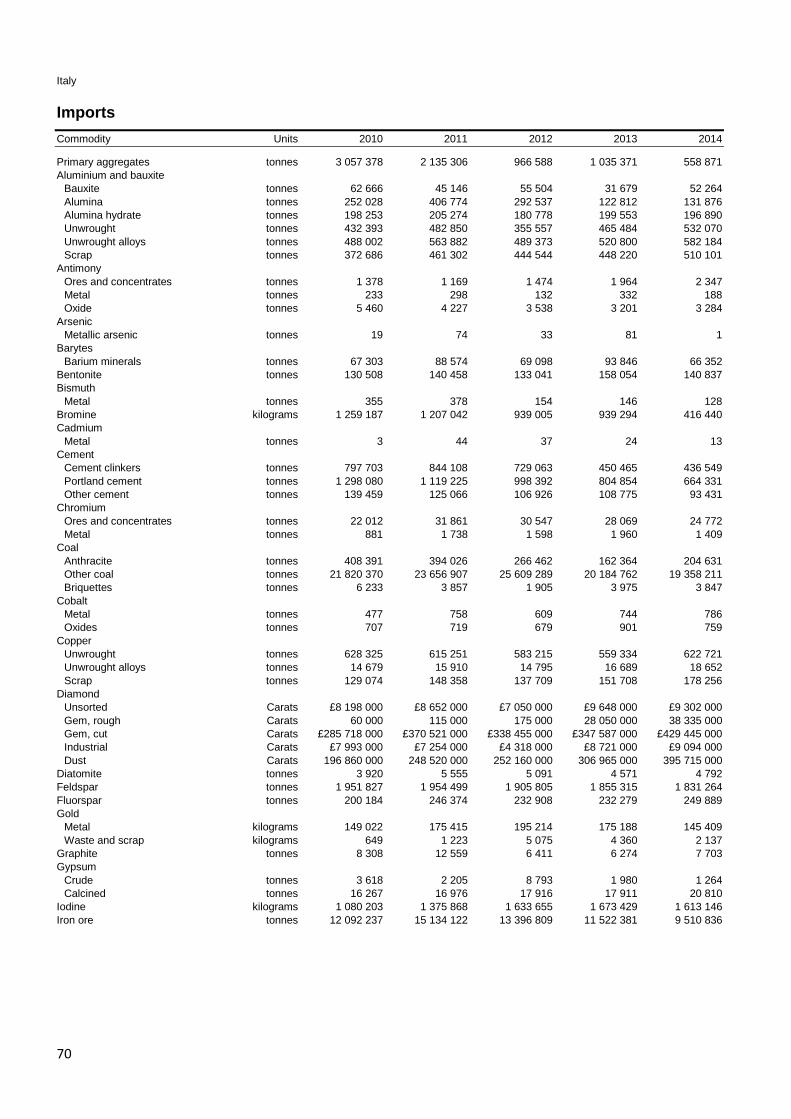
70
Italy
Imports Commodity Units 2010 2011 2012 2013 2014
Primary aggregates tonnes 3 057 378 2 135 306 966 588 1 035 371 558 871 Aluminium and bauxite Bauxite tonnes 62 666 45 146 55 504 31 679 52 264 Alumina tonnes 252 028 406 774 292 537 122 812 131 876 Alumina hydrate tonnes 198 253 205 274 180 778 199 553 196 890 Unwrought tonnes 432 393 482 850 355 557 465 484 532 070 Unwrought alloys tonnes 488 002 563 882 489 373 520 800 582 184 Scrap tonnes 372 686 461 302 444 544 448 220 510 101 Antimony Ores and concentrates tonnes 1 378 1 169 1 474 1 964 2 347 Metal tonnes 233 298 132 332 188 Oxide tonnes 5 460 4 227 3 538 3 201 3 284 Arsenic Metallic arsenic tonnes 19 74 33 81 1 Barytes Barium minerals tonnes 67 303 88 574 69 098 93 846 66 352 Bentonite tonnes 130 508 140 458 133 041 158 054 140 837 Bismuth Metal tonnes 355 378 154 146 128 Bromine kilograms 1 259 187 1 207 042 939 005 939 294 416 440 Cadmium Metal tonnes 3 44 37 24 13 Cement Cement clinkers tonnes 797 703 844 108 729 063 450 465 436 549 Portland cement tonnes 1 298 080 1 119 225 998 392 804 854 664 331 Other cement tonnes 139 459 125 066 106 926 108 775 93 431 Chromium Ores and concentrates tonnes 22 012 31 861 30 547 28 069 24 772 Metal tonnes 881 1 738 1 598 1 960 1 409 Coal Anthracite tonnes 408 391 394 026 266 462 162 364 204 631 Other coal tonnes 21 820 370 23 656 907 25 609 289 20 184 762 19 358 211 Briquettes tonnes 6 233 3 857 1 905 3 975 3 847 Cobalt Metal tonnes 477 758 609 744 786 Oxides tonnes 707 719 679 901 759 Copper Unwrought tonnes 628 325 615 251 583 215 559 334 622 721 Unwrought alloys tonnes 14 679 15 910 14 795 16 689 18 652 Scrap tonnes 129 074 148 358 137 709 151 708 178 256 Diamond Unsorted Carats £8 198 000 £8 652 000 £7 050 000 £9 648 000 £9 302 000 Gem, rough Carats 60 000 115 000 175 000 28 050 000 38 335 000 Gem, cut Carats £285 718 000 £370 521 000 £338 455 000 £347 587 000 £429 445 000 Industrial Carats £7 993 000 £7 254 000 £4 318 000 £8 721 000 £9 094 000 Dust Carats 196 860 000 248 520 000 252 160 000 306 965 000 395 715 000 Diatomite tonnes 3 920 5 555 5 091 4 571 4 792 Feldspar tonnes 1 951 827 1 954 499 1 905 805 1 855 315 1 831 264 Fluorspar tonnes 200 184 246 374 232 908 232 279 249 889 Gold Metal kilograms 149 022 175 415 195 214 175 188 145 409 Waste and scrap kilograms 649 1 223 5 075 4 360 2 137 Graphite tonnes 8 308 12 559 6 411 6 274 7 703 Gypsum Crude tonnes 3 618 2 205 8 793 1 980 1 264 Calcined tonnes 16 267 16 976 17 916 17 911 20 810 Iodine kilograms 1 080 203 1 375 868 1 633 655 1 673 429 1 613 146 Iron ore tonnes 12 092 237 15 134 122 13 396 809 11 522 381 9 510 836

71
Italy
Imports continued
Commodity Units 2010 2011 2012 2013 2014
Iron, steel and ferro-alloys Pig iron tonnes 1 018 615 1 288 014 1 106 558 1 517 045 1 689 784 Sponge and powder tonnes 278 989 540 005 551 034 732 306 703 570 Ferro-chrome tonnes 390 374 414 410 416 091 388 133 339 587 Ferro-silico-chrome tonnes 97 841 3 99 83 Ferro-silico-magnesium tonnes 1 943 1 683 2 125 2 586 2 086 Ferro-manganese tonnes 71 406 86 512 82 933 86 923 72 526 Ferro-silico-manganese tonnes 158 540 176 855 167 310 173 051 167 846 Ferro-molybdenum tonnes 6 141 8 541 9 547 10 710 12 009 Ferro-nickel tonnes 98 168 116 806 128 877 124 343 118 962 Ferro-niobium tonnes 2 751 2 521 2 619 2 490 2 223 Ferro-phosphorus tonnes 631 414 365 380 297 Ferro-silicon tonnes 137 031 160 561 118 880 129 155 124 794 Ferro-titanium and ferro-silico-titanium tonnes 3 876 3 819 3 139 2 418 2 574 Ferro-tungsten and ferro-silico-tungsten tonnes 247 252 269 298 309 Ferro-vanadium tonnes 1 901 2 330 2 367 2 011 1 885 Other ferro-alloys tonnes 7 325 9 198 7 117 8 392 9 250 Silicon metal tonnes 48 392 53 131 41 277 43 173 40 350 Ingots, blooms, billets tonnes 3 681 439 3 662 856 3 169 000 3 198 102 3 126 871 Scrap tonnes 4 609 403 5 752 270 5 271 612 4 957 195 5 144 643 Kaolin tonnes 823 461 707 622 681 595 686 567 722 977 Lead Ores and concentrates tonnes 20 0 9 419 39 748 73 037 Unwrought tonnes 111 301 109 458 89 266 71 393 93 413 Scrap tonnes 2 609 4 976 4 111 3 059 2 904 Lithium Oxides tonnes 175 148 143 121 160 Carbonate tonnes 1 123 1 369 1 052 1 241 1 116 Magnesite and magnesia Magnesite tonnes 21 454 27 347 13 774 8 223 5 153 Magnesia tonnes 143 725 133 451 120 185 105 816 107 610 Manganese Ores and concentrates (a) tonnes 55 284 81 629 107 907 27 243 27 243 Metal tonnes 5 788 5 759 5 804 6 274 5 095 Mercury kilograms 10 510 15 246 4 247 1 863 1 579 Mica Unmanufactured tonnes 136 209 205 187 141 Ground tonnes 3 854 3 849 3 489 3 329 3 572 Molybdenum Ores and concentrates tonnes 9 108 5 248 4 794 5 394 5 310 Metal tonnes 136 219 192 161 506 Oxides tonnes 276 199 187 128 114 Nickel Mattes, sinters etc tonnes 1 4 78 1 281 903 Unwrought tonnes 39 586 38 075 33 635 28 985 30 904 Unwrought alloys tonnes 1 171 1 314 2 626 9 793 6 651 Scrap tonnes 1 063 656 899 1 330 1 554 Natural gas tonnes 59 616 091 50 506 295 48 666 707 43 720 221 39 108 795 Crude petroleum tonnes 76 729 305 72 173 373 68 812 837 57 467 112 52 923 689 Phosphate rock tonnes 231 808 243 718 196 478 140 749 107 048 Platinum metals Platinum kilograms 12 545 10 630 7 417 8 436 15 766 Palladium kilograms 10 019 9 171 7 855 6 411 11 765 Other platinum metals kilograms 1 694 1 084 1 244 782 3 203 Waste and scrap kilograms 16 918 1 468 3 103 2 150 12 607 Potash Sulphate tonnes 88 593 58 418 52 568 59 966 43 124 Chloride tonnes 367 465 287 984 285 476 283 353 300 974 Other potassic fertilisers tonnes 8 415 1 368 511 416 481 Rare earths Metals tonnes 124 108 30 62 96 Cerium compounds tonnes 597 616 337 565 220 Other rare earth compounds tonnes 303 307 257 232 276 Ferro-cerium and other pyrophoric alloys tonnes 10 3 3 1 3 Salt tonnes 1 119 583 1 045 659 1 128 585 943 961 670 659

72
Italy
Imports continued
Commodity Units 2010 2011 2012 2013 2014
Sillimanite minerals Sillimanite minerals tonnes 14 473 17 937 11 720 10 465 16 054 Mullite tonnes 16 141 13 564 16 084 6 728 10 739 Silver Ores and concentrates kilograms 70 440 31 391 11 644 102 547 Metal kilograms 1 120 080 729 807 645 344 911 101 1 062 821 Sulphur and pyrites Pyrites tonnes 13 538 29 746 10 436 12 808 27 135 Sulphur tonnes 19 263 30 290 22 499 23 964 63 824 Sulphur, sublimed and precipitated tonnes 758 732 887 5 066 1 283 Talc tonnes 100 934 115 046 111 333 99 446 125 992 Tin Unwrought tonnes 3 828 4 936 3 375 3 617 3 981 Unwrought alloys tonnes 724 303 297 244 189 Scrap tonnes 60 220 22 35 68 Titanium Titanium minerals tonnes 98 978 111 842 (b)* 4 132 55 323 102 316 Metal tonnes 4 497 9 420 7 367 6 065 6 630 Oxides tonnes 160 361 164 708 137 976 143 083 155 263 Tungsten Metal tonnes 496 552 656 482 606 Carbide tonnes 279 440 240 380 531 Vanadium Pentoxide tonnes 53 45 117 231 304 Zinc Ores and concentrates tonnes 184 192 153 982 186 715 140 909 183 989 Unwrought tonnes 245 254 244 557 164 716 142 457 143 426 Unwrought alloys tonnes 34 595 39 554 31 434 48 303 49 733 Scrap tonnes 27 740 36 491 36 134 39 614 50 413 Zirconium Concentrates tonnes 98 214 81 360 40 897 56 430 55 743 Metal tonnes 144 184 135 141 80
Note(s) (a) Including manganiferous iron ore (b) BGS estimates, based on known exports from certain countries

73
Latvia
Latvia
Production Commodity Units 2010 2011 2012 2013 2014
Primary aggregates Sand and gravel tonnes 6 016 126 7 855 125 8 358 839 7 297 980 12 361 256 Crushed rock tonnes 1 375 197 2 050 976 2 072 775 2 664 580 2 229 552 Cement Cement, clinker tonnes 1 158 000 1 277 000 1 485 720 * 1 500 000 * 1 500 000 Cement, finished tonnes * 1 100 000 * 1 100 000 * 1 100 000 * 1 100 000 * 1 200 000 Gypsum (a) tonnes 176 510 215 950 252 714 272 340 * 280 000 Crude steel tonnes 655 000 568 000 805 000 198 000 * 190 000
Notes (a) Including anhydrite
Exports Commodity Units 2010 2011 2012 2013 2014
Primary aggregates tonnes 101 406 59 930 19 683 49 235 76 856 Aluminium and bauxite Alumina tonnes 140 64 225 115 744 14 622 85 Unwrought alloys tonnes 14 493 21 793 18 481 9 196 8 870 Scrap tonnes 5 461 4 414 4 876 4 771 7 090 Cement Cement clinkers tonnes 68 802 201 050 163 102 26 930 2 019 Portland cement tonnes 562 435 673 260 759 738 734 184 890 382 Other cement tonnes 76 250 176 237 107 Coal Hard coal (a) tonnes 3 136 26 100 13 823 32 847 44 891 Briquettes tonnes 3 262 6 402 4 007 2 772 2 483 Copper Unwrought tonnes — 642 4 314 6 428 2 341 Unwrought alloys tonnes 722 1 008 1 156 2 053 3 090 Scrap tonnes 7 106 13 679 8 494 7 847 7 362 Gold Metal kilograms 81 344 850 1 286 6 630 Gypsum Crude and calcined tonnes 38 596 47 016 84 358 97 074 92 767 Iodine kilograms 4 200 — 7 400 — — Iron, steel and ferro-alloys Ferro-chrome tonnes 4 051 9 502 30 189 13 006 10 095 Ferro-silico-chrome tonnes ... ... 233 121 6 849 Ferro-manganese tonnes 794 1 132 515 679 44 Ferro-silico-manganese tonnes 6 247 16 563 20 152 11 513 7 636 Ferro-silicon tonnes 11 029 23 706 13 874 26 207 20 202 Ingots, blooms, billets tonnes 2 442 5 045 72 535 32 687 629 Scrap tonnes 396 794 563 192 507 285 468 154 477 810 Lead Scrap tonnes 3 243 3 086 2 687 2 362 1 911 Nickel Scrap tonnes 3 108 2 284 150 291 304 Crude petroleum tonnes 524 42 208 45 767 5 690 105 267 Potash Chloride tonnes 39 28 1 427 137 1 952 Potassic fertilisers tonnes 357 535 1 344 1 070 1 092 Salt tonnes 23 172 35 545 21 741 25 536 21 949 Silver Metal kilograms 300 1 600 100 3 600 2 200 Tin Scrap tonnes 175 8 2 3 2
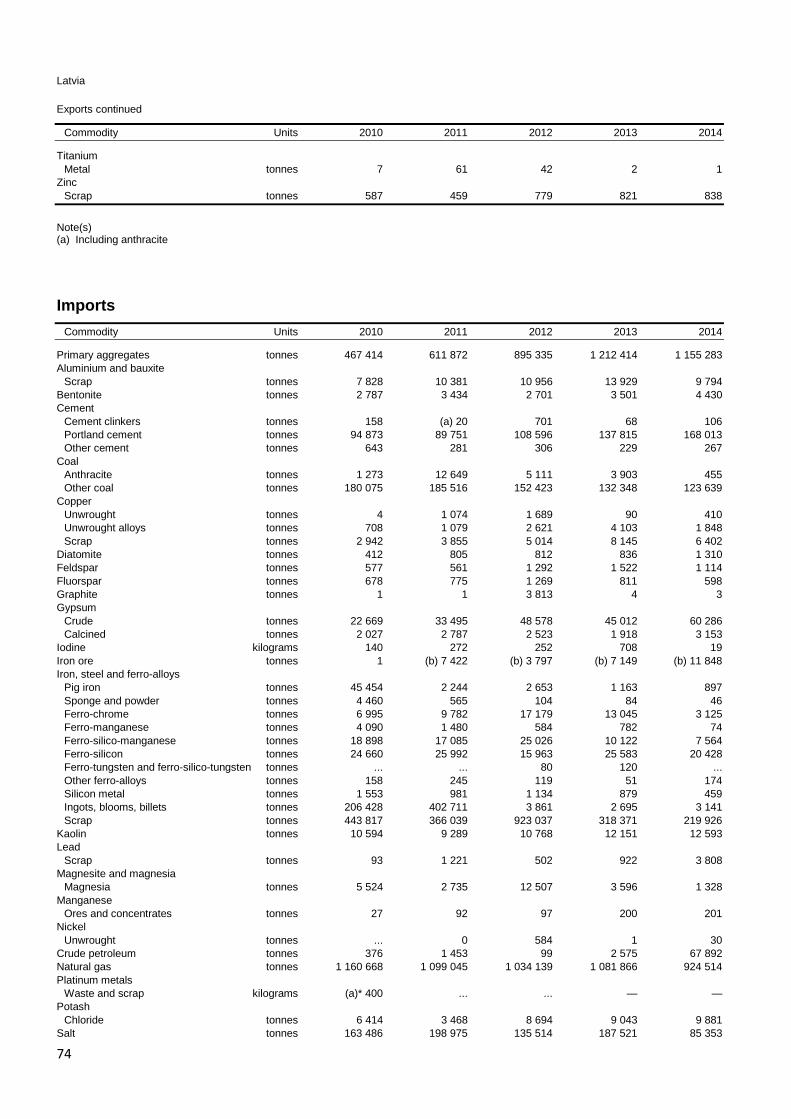
74
Latvia
Exports continued
Commodity Units 2010 2011 2012 2013 2014
Titanium Metal tonnes 7 61 42 2 1 Zinc Scrap tonnes 587 459 779 821 838
Note(s) (a) Including anthracite
Imports Commodity Units 2010 2011 2012 2013 2014
Primary aggregates tonnes 467 414 611 872 895 335 1 212 414 1 155 283 Aluminium and bauxite Scrap tonnes 7 828 10 381 10 956 13 929 9 794 Bentonite tonnes 2 787 3 434 2 701 3 501 4 430 Cement Cement clinkers tonnes 158 (a) 20 701 68 106 Portland cement tonnes 94 873 89 751 108 596 137 815 168 013 Other cement tonnes 643 281 306 229 267 Coal Anthracite tonnes 1 273 12 649 5 111 3 903 455 Other coal tonnes 180 075 185 516 152 423 132 348 123 639 Copper Unwrought tonnes 4 1 074 1 689 90 410 Unwrought alloys tonnes 708 1 079 2 621 4 103 1 848 Scrap tonnes 2 942 3 855 5 014 8 145 6 402 Diatomite tonnes 412 805 812 836 1 310 Feldspar tonnes 577 561 1 292 1 522 1 114 Fluorspar tonnes 678 775 1 269 811 598 Graphite tonnes 1 1 3 813 4 3 Gypsum Crude tonnes 22 669 33 495 48 578 45 012 60 286 Calcined tonnes 2 027 2 787 2 523 1 918 3 153 Iodine kilograms 140 272 252 708 19 Iron ore tonnes 1 (b) 7 422 (b) 3 797 (b) 7 149 (b) 11 848 Iron, steel and ferro-alloys Pig iron tonnes 45 454 2 244 2 653 1 163 897 Sponge and powder tonnes 4 460 565 104 84 46 Ferro-chrome tonnes 6 995 9 782 17 179 13 045 3 125 Ferro-manganese tonnes 4 090 1 480 584 782 74 Ferro-silico-manganese tonnes 18 898 17 085 25 026 10 122 7 564 Ferro-silicon tonnes 24 660 25 992 15 963 25 583 20 428 Ferro-tungsten and ferro-silico-tungsten tonnes ... ... 80 120 ... Other ferro-alloys tonnes 158 245 119 51 174 Silicon metal tonnes 1 553 981 1 134 879 459 Ingots, blooms, billets tonnes 206 428 402 711 3 861 2 695 3 141 Scrap tonnes 443 817 366 039 923 037 318 371 219 926 Kaolin tonnes 10 594 9 289 10 768 12 151 12 593 Lead Scrap tonnes 93 1 221 502 922 3 808 Magnesite and magnesia Magnesia tonnes 5 524 2 735 12 507 3 596 1 328 Manganese Ores and concentrates tonnes 27 92 97 200 201 Nickel Unwrought tonnes ... 0 584 1 30 Crude petroleum tonnes 376 1 453 99 2 575 67 892 Natural gas tonnes 1 160 668 1 099 045 1 034 139 1 081 866 924 514 Platinum metals Waste and scrap kilograms (a)* 400 ... ... — — Potash Chloride tonnes 6 414 3 468 8 694 9 043 9 881 Salt tonnes 163 486 198 975 135 514 187 521 85 353

75
Latvia
Imports continued
Commodity Units 2010 2011 2012 2013 2014
Silver Metal kilograms 791 2 300 1 400 7 900 2 400 Titanium Oxides tonnes 739 693 640 586 699 Zinc Unwrought (c) tonnes 383 249 662 402 3 637 Zirconium Concentrates tonnes ... ... 165 352 540
Note(s) (a) BGS estimates, based on known exports from certain countries (b) Including burnt pyrites (c) Including alloys
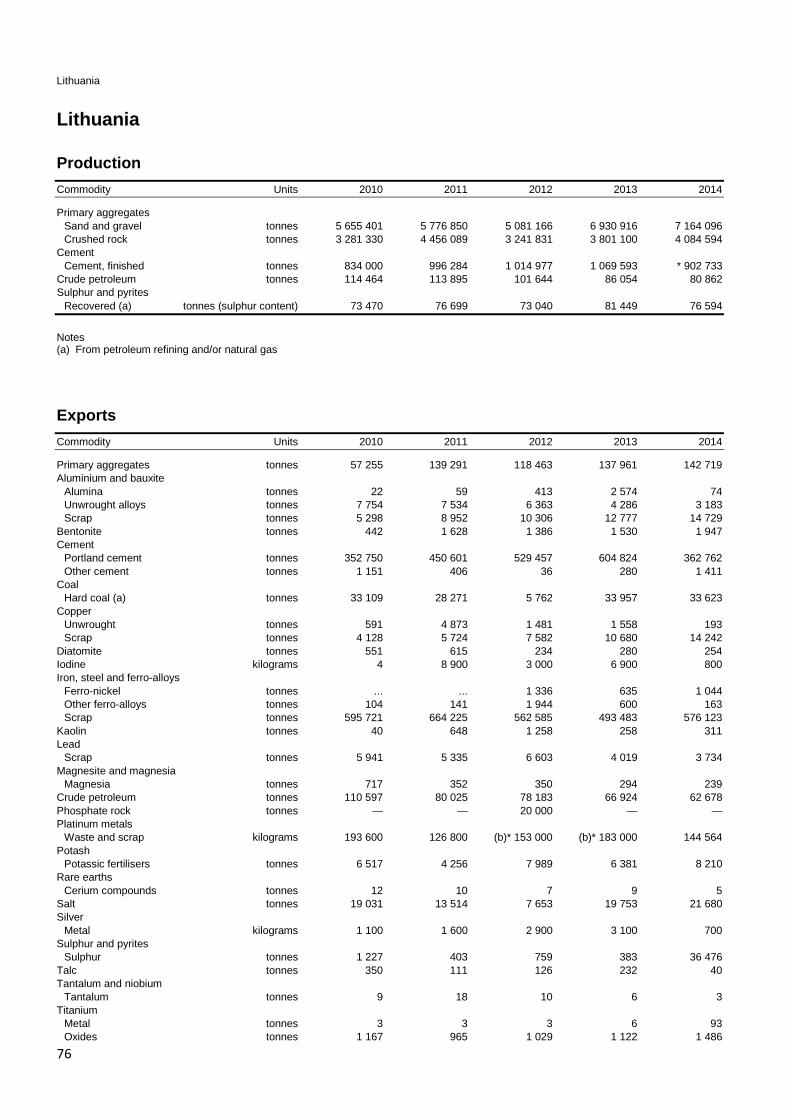
76
Lithuania
Lithuania
Production Commodity Units 2010 2011 2012 2013 2014
Primary aggregates Sand and gravel tonnes 5 655 401 5 776 850 5 081 166 6 930 916 7 164 096 Crushed rock tonnes 3 281 330 4 456 089 3 241 831 3 801 100 4 084 594 Cement Cement, finished tonnes 834 000 996 284 1 014 977 1 069 593 * 902 733 Crude petroleum tonnes 114 464 113 895 101 644 86 054 80 862 Sulphur and pyrites Recovered (a) tonnes (sulphur content) 73 470 76 699 73 040 81 449 76 594
Notes (a) From petroleum refining and/or natural gas
Exports Commodity Units 2010 2011 2012 2013 2014
Primary aggregates tonnes 57 255 139 291 118 463 137 961 142 719 Aluminium and bauxite Alumina tonnes 22 59 413 2 574 74 Unwrought alloys tonnes 7 754 7 534 6 363 4 286 3 183 Scrap tonnes 5 298 8 952 10 306 12 777 14 729 Bentonite tonnes 442 1 628 1 386 1 530 1 947 Cement Portland cement tonnes 352 750 450 601 529 457 604 824 362 762 Other cement tonnes 1 151 406 36 280 1 411 Coal Hard coal (a) tonnes 33 109 28 271 5 762 33 957 33 623 Copper Unwrought tonnes 591 4 873 1 481 1 558 193 Scrap tonnes 4 128 5 724 7 582 10 680 14 242 Diatomite tonnes 551 615 234 280 254 Iodine kilograms 4 8 900 3 000 6 900 800 Iron, steel and ferro-alloys Ferro-nickel tonnes ... ... 1 336 635 1 044 Other ferro-alloys tonnes 104 141 1 944 600 163 Scrap tonnes 595 721 664 225 562 585 493 483 576 123 Kaolin tonnes 40 648 1 258 258 311 Lead Scrap tonnes 5 941 5 335 6 603 4 019 3 734 Magnesite and magnesia Magnesia tonnes 717 352 350 294 239 Crude petroleum tonnes 110 597 80 025 78 183 66 924 62 678 Phosphate rock tonnes — — 20 000 — — Platinum metals Waste and scrap kilograms 193 600 126 800 (b)* 153 000 (b)* 183 000 144 564 Potash Potassic fertilisers tonnes 6 517 4 256 7 989 6 381 8 210 Rare earths Cerium compounds tonnes 12 10 7 9 5 Salt tonnes 19 031 13 514 7 653 19 753 21 680 Silver Metal kilograms 1 100 1 600 2 900 3 100 700 Sulphur and pyrites Sulphur tonnes 1 227 403 759 383 36 476 Talc tonnes 350 111 126 232 40 Tantalum and niobium Tantalum tonnes 9 18 10 6 3 Titanium Metal tonnes 3 3 3 6 93 Oxides tonnes 1 167 965 1 029 1 122 1 486

77
Lithuania
Exports continued
Commodity Units 2010 2011 2012 2013 2014
Tungsten Ores and concentrates tonnes ... ... ... 41 ... Metal tonnes — 178 18 17 53 Zinc Unwrought tonnes ... 330 618 432 1 283
Note(s) (a) Including anthracite (b) BGS estimates, based on known imports into certain countries
Imports Commodity Units 2010 2011 2012 2013 2014
Primary aggregates tonnes 849 462 1 046 066 991 388 1 678 898 2 028 733 Aluminium and bauxite Alumina tonnes 16 411 26 876 23 690 21 348 12 813 Scrap tonnes 2 460 6 014 3 238 3 682 2 721 Bentonite tonnes 4 378 6 250 6 656 7 366 9 361 Cement Cement clinkers tonnes 176 461 227 793 173 488 24 015 22 Portland cement tonnes 122 178 144 824 147 329 199 114 281 613 Other cement tonnes 390 502 479 671 1 555 Coal Anthracite tonnes 3 616 24 260 62 934 3 435 6 713 Other coal tonnes 313 355 368 099 256 651 416 369 325 951 Copper Unwrought tonnes 596 4 652 1 251 472 618 Scrap tonnes 436 634 2 505 5 696 7 662 Diatomite tonnes 744 1 174 865 1 187 2 136 Feldspar tonnes 6 265 10 278 6 700 1 405 1 478 Gold Waste and scrap kilograms — 64 453 12 202 — 15 800 Gypsum Crude tonnes 54 772 63 632 64 379 82 504 72 310 Calcined tonnes 17 377 18 503 19 211 19 504 25 502 Iodine kilograms 17 732 20 100 3 200 2 000 400 Iron, steel and ferro-alloys Ferro-manganese tonnes 51 39 6 38 106 Ferro-molybdenum tonnes — 3 936 3 5 Ferro-nickel tonnes ... 674 986 — 1 044 Ferro-silicon tonnes 102 40 40 46 34 Other ferro-alloys tonnes 40 38 1 500 1 087 46 Ingots, blooms, billets tonnes 4 270 5 384 4 536 7 537 8 864 Scrap tonnes 35 270 71 858 59 444 30 690 35 161 Kaolin tonnes 486 360 480 508 619 Lead Scrap tonnes 4 459 5 755 1 892 3 350 982 Magnesite and magnesia Magnesia tonnes 1 245 593 1 159 939 1 022 Molybdenum Metal tonnes 65 37 45 6 18 Crude petroleum tonnes 9 018 334 8 943 996 8 523 368 9 077 111 7 478 509 Natural gas tonnes 2 048 906 2 385 268 2 265 929 1 954 603 1 760 365 Phosphate rock tonnes 1 354 093 1 254 579 1 216 427 1 283 243 1 251 250 Platinum metals Waste and scrap kilograms 76 400 64 600 4 800 59 500 98 000 Potash Sulphate tonnes 2 581 7 069 6 267 4 521 3 127 Chloride tonnes 32 552 35 602 52 573 46 394 60 786 Other potassic fertilisers tonnes 4 112 1 837 98 162 Rare earths Rare earth compounds tonnes 14 11 10 11 4
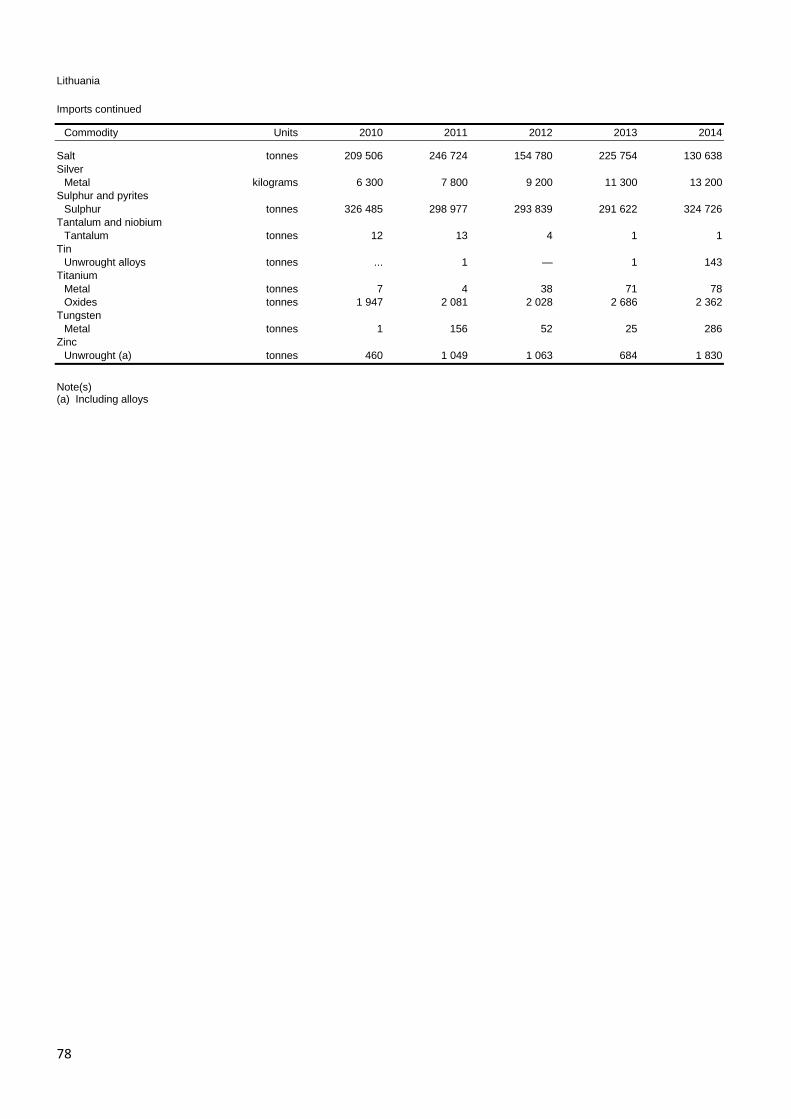
78
Lithuania
Imports continued
Commodity Units 2010 2011 2012 2013 2014
Salt tonnes 209 506 246 724 154 780 225 754 130 638 Silver Metal kilograms 6 300 7 800 9 200 11 300 13 200 Sulphur and pyrites Sulphur tonnes 326 485 298 977 293 839 291 622 324 726 Tantalum and niobium Tantalum tonnes 12 13 4 1 1 Tin Unwrought alloys tonnes ... 1 — 1 143 Titanium Metal tonnes 7 4 38 71 78 Oxides tonnes 1 947 2 081 2 028 2 686 2 362 Tungsten Metal tonnes 1 156 52 25 286 Zinc Unwrought (a) tonnes 460 1 049 1 063 684 1 830
Note(s) (a) Including alloys
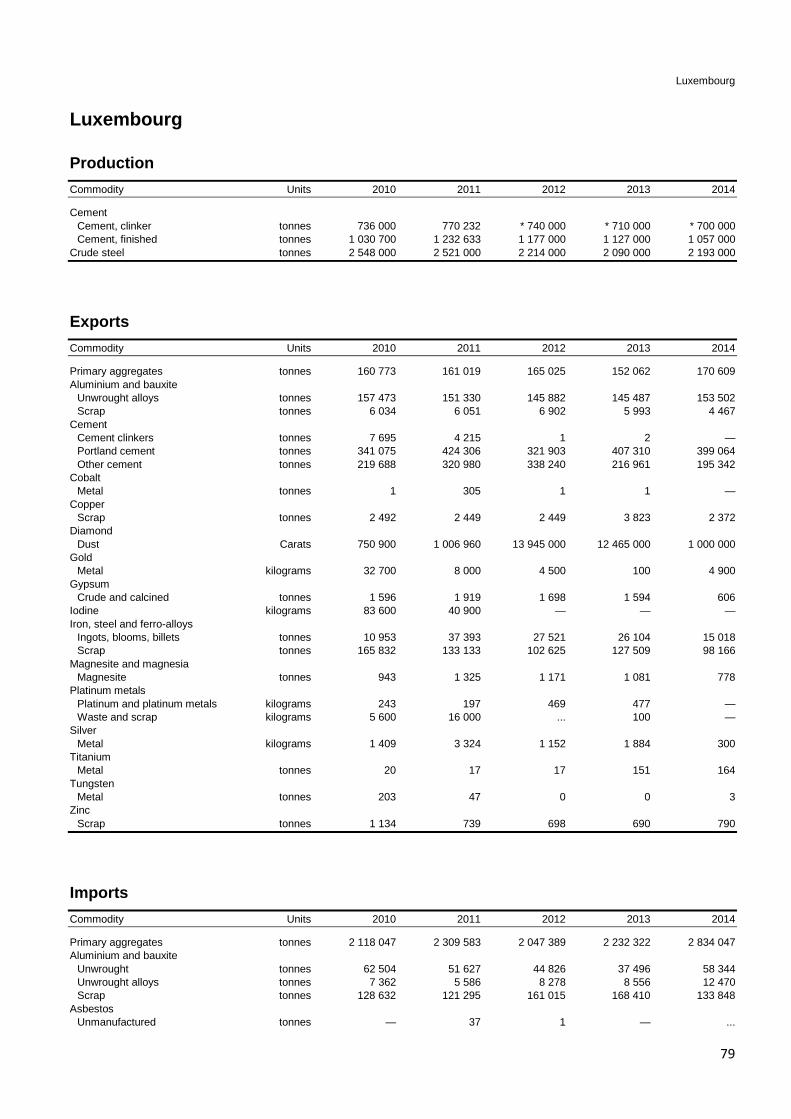
79
Luxembourg
Luxembourg
Production Commodity Units 2010 2011 2012 2013 2014
Cement Cement, clinker tonnes 736 000 770 232 * 740 000 * 710 000 * 700 000 Cement, finished tonnes 1 030 700 1 232 633 1 177 000 1 127 000 1 057 000 Crude steel tonnes 2 548 000 2 521 000 2 214 000 2 090 000 2 193 000
Exports Commodity Units 2010 2011 2012 2013 2014
Primary aggregates tonnes 160 773 161 019 165 025 152 062 170 609 Aluminium and bauxite Unwrought alloys tonnes 157 473 151 330 145 882 145 487 153 502 Scrap tonnes 6 034 6 051 6 902 5 993 4 467 Cement Cement clinkers tonnes 7 695 4 215 1 2 — Portland cement tonnes 341 075 424 306 321 903 407 310 399 064 Other cement tonnes 219 688 320 980 338 240 216 961 195 342 Cobalt Metal tonnes 1 305 1 1 — Copper Scrap tonnes 2 492 2 449 2 449 3 823 2 372 Diamond Dust Carats 750 900 1 006 960 13 945 000 12 465 000 1 000 000 Gold Metal kilograms 32 700 8 000 4 500 100 4 900 Gypsum Crude and calcined tonnes 1 596 1 919 1 698 1 594 606 Iodine kilograms 83 600 40 900 — — — Iron, steel and ferro-alloys Ingots, blooms, billets tonnes 10 953 37 393 27 521 26 104 15 018 Scrap tonnes 165 832 133 133 102 625 127 509 98 166 Magnesite and magnesia Magnesite tonnes 943 1 325 1 171 1 081 778 Platinum metals Platinum and platinum metals kilograms 243 197 469 477 — Waste and scrap kilograms 5 600 16 000 ... 100 — Silver Metal kilograms 1 409 3 324 1 152 1 884 300 Titanium Metal tonnes 20 17 17 151 164 Tungsten Metal tonnes 203 47 0 0 3 Zinc Scrap tonnes 1 134 739 698 690 790
Imports Commodity Units 2010 2011 2012 2013 2014
Primary aggregates tonnes 2 118 047 2 309 583 2 047 389 2 232 322 2 834 047 Aluminium and bauxite Unwrought tonnes 62 504 51 627 44 826 37 496 58 344 Unwrought alloys tonnes 7 362 5 586 8 278 8 556 12 470 Scrap tonnes 128 632 121 295 161 015 168 410 133 848 Asbestos Unmanufactured tonnes — 37 1 — ...

80
Luxembourg
Imports continued
Commodity Units 2010 2011 2012 2013 2014
Barytes Barium minerals tonnes 17 182 17 049 12 350 6 827 5 728 Bentonite tonnes 168 202 168 227 536 Cement Cement clinkers tonnes 27 238 34 532 34 703 8 589 10 615 Portland cement tonnes 34 642 42 548 37 740 67 220 103 013 Other cement tonnes 12 119 14 934 15 382 11 592 13 447 Coal Anthracite tonnes 24 834 16 256 10 994 10 869 10 465 Other coal tonnes 76 133 73 322 69 623 62 674 73 527 Lignite tonnes 7 090 7 710 8 620 3 483 3 687 Cobalt Metal tonnes 163 811 80 113 130 Copper Scrap tonnes 10 708 10 061 14 275 11 913 9 110 Diamond Unsorted Carats £20 000 £248 000 £262 000 £38 000 £23 000 Gem, cut Carats £418 000 £533 000 £861 000 £2 332 000 £1 664 000 Industrial Carats 105 000 35 000 860 000 360 000 330 000 Dust Carats £609 000 £471 000 £562 000 £552 000 £491 000 Diatomite tonnes 7 858 7 394 129 48 498 Fluorspar tonnes 983 887 795 739 937 Gold Metal kilograms 42 136 184 535 83 757 36 175 1 000 Waste and scrap kilograms 1 69 10 114 6 014 Gypsum Crude tonnes 50 104 69 918 63 994 61 079 63 371 Calcined tonnes 10 715 18 459 24 216 19 003 17 069 Iron, steel and ferro-alloys Ferro-manganese tonnes 910 1 317 1 193 1 032 2 028 Ferro-silico-manganese tonnes 27 116 29 053 29 843 29 419 28 497 Ferro-niobium tonnes 192 226 212 243 248 Ferro-silicon tonnes 3 428 3 828 3 642 3 337 3 081 Ferro-titanium and ferro-silico-titanium tonnes 33 63 81 108 394 Ferro-vanadium tonnes 292 328 298 308 396 Other ferro-alloys tonnes 581 788 716 942 757 Ingots, blooms, billets tonnes 407 419 370 786 237 293 131 957 137 643 Scrap tonnes 2 693 481 2 632 849 2 259 684 2 330 581 2 224 619 Kaolin tonnes 904 563 736 1 046 705 Magnesite and Magnesia tonnes 2 612 2 375 3 805 2 116 2 187 Natural gas tonnes 3 591 3 077 1 441 — 1 188 Platinum metals Platinum and platinum metals kilograms 1 633 438 329 301 1 798 Potash Potassic fertilisers tonnes 1 681 1 167 1 252 1 832 1 722 Rare earths Rare earth compounds tonnes 2 5 2 1 183 Ferro-cerium and other pyrophoric alloys tonnes 11 0 — — — Salt tonnes 77 304 91 033 24 059 86 365 41 338 Silver Metal kilograms 24 304 11 000 2 800 1 100 2 700 Sulphur and pyrites Sulphur tonnes 2 166 1 789 1 432 1 604 1 845 Tantalum and niobium Tantalum tonnes 1 1 1 52 1 Tin Scrap tonnes ... 3 95 105 — Titanium Metal tonnes 456 1 842 786 1 898 1 039 Oxides tonnes 1 481 1 534 1 494 13 393 15 235 Zinc Unwrought tonnes 9 232 6 819 7 461 7 080 5 664

81
Macedonia
Macedonia
Production Commodity Units 2010 2011 2012 2013 2014
Bentonite tonnes 7 084 8 918 2 355 18 520 11 691 Coal Lignite tonnes 6 583 074 7 902 084 7 309 546 6 633 560 6 469 819 Copper, mine tonnes (metal content) 7 912 7 555 9 506 9 802 8 187 Copper, refined tonnes — — 1 100 1 900 1 700 Feldspar tonnes 23 188 25 032 17 168 15 168 18 076 Gypsum (a) tonnes 143 118 162 984 157 844 162 661 156 492 Crude steel tonnes 344 866 348 576 225 224 145 633 196 454 Ferro-alloys Ferro-silico-manganese tonnes 36 705 50 756 14 179 — — Ferro-nickel tonnes 14 413 17 292 19 247 20 001 18 054 Ferro-silicon tonnes 30 044 56 167 42 402 72 279 73 014 Lead, mine tonnes (metal content) 41 293 37 295 39 184 42 826 43 810 Nickel, mined tonnes (metal content) * 1 800 * 3 600 * 1 700 — — Nickel, smelter/refinery tonnes 14 400 17 300 19 200 20 000 18 100 Silver kilograms (metal content) * 32 000 * 30 000 * 31 000 * 32 000 * 33 000 Talc tonnes 1 292 547 286 — — Zinc, mine tonnes (metal content) 32 872 28 132 28 037 30 907 31 570
Notes (a) Including anhydrite
Exports Commodity Units 2010 2011 2012 2013 2014
Primary aggregates tonnes ... 39 217 47 352 59 365 64 549 Aluminium and bauxite Scrap tonnes 2 351 2 432 2 724 2 833 2 479 Bentonite tonnes 3 310 3 730 3 635 3 237 2 544 Cement Cement clinkers tonnes ... 0 154 117 20 118 ... Portland cement tonnes 315 074 277 326 136 803 164 396 127 436 Other cement tonnes 1 027 ... ... ... 6 347 Copper Ores and concentrates tonnes 41 135 39 014 45 119 51 838 42 034 Unwrought tonnes 8 8 1 090 1 919 1 459 Scrap tonnes 576 2 845 2 221 2 144 2 151 Feldspar tonnes 21 924 25 111 14 857 15 477 17 675 Gypsum Crude and calcined tonnes 30 273 32 328 29 321 27 891 29 710 Iron, steel and ferro-alloys Ferro-manganese tonnes 50 4 209 21 57 Ferro-silico-manganese tonnes 31 344 46 254 22 482 441 4 Ferro-nickel tonnes 67 384 77 107 89 302 94 714 83 915 Ferro-silicon tonnes 19 491 52 684 41 131 71 956 78 486 Scrap tonnes 71 830 83 784 88 861 75 972 61 124 Lead Ores and concentrates tonnes 55 482 48 959 49 055 54 266 54 989 Unwrought tonnes 801 421 685 2 136 107 Nickel Ores and concentrates tonnes 60 181 25 579 16 219 3 575 4 Phosphate rock tonnes 1 056 651 709 529 553 Salt tonnes 2 666 5 456 4 898 3 195 3 318 Sulphur and pyrites Sulphur tonnes 1 653 877 197 170 ... Talc tonnes 636 648 380 618 368 Zinc Ores and concentrates tonnes 60 369 51 545 51 154 56 810 57 218 Scrap tonnes 739 313 103 144 230

82
Macedonia
Imports Commodity Units 2010 2011 2012 2013 2014
Primary aggregates tonnes 1 029 1 180 3 403 1 085 3 938 Aluminium and bauxite Unwrought (a) tonnes 2 839 2 642 2 785 2 856 3 034 Scrap tonnes 1 554 1 842 1 073 834 723 Bentonite tonnes 219 302 725 400 380 Cement Cement clinkers tonnes 1 191 8 932 (b)* 20 ... (b) — Portland cement tonnes 185 378 148 954 193 978 178 196 207 763 Other cement tonnes 1 213 409 501 545 692 Chromium Ores and concentrates tonnes 294 512 324 268 885 Coal Hard coal (c) tonnes 160 162 189 549 233 556 163 242 160 070 Lignite tonnes 23 409 42 052 27 024 51 273 27 958 Briquettes tonnes 7 623 22 546 18 209 90 103 54 187 Fluorspar tonnes 350 600 244 122 223 Graphite tonnes 875 911 648 764 678 Iron, steel and ferro-alloys Pig iron tonnes 1 823 1 382 1 075 967 1 079 Ferro-alloys tonnes 2 401 5 970 3 251 2 436 3 410 Ingots, blooms, billets tonnes 145 509 97 889 100 791 90 116 116 862 Scrap tonnes 292 049 318 612 157 401 55 654 153 264 Kaolin tonnes 4 985 3 815 1 440 1 497 3 046 Lead Unwrought tonnes 395 479 268 2 313 1 936 Magnesite and magnesia tonnes 11 266 9 418 5 547 2 115 5 533 Manganese Ores and concentrates tonnes 56 893 110 589 42 109 503 70 Nickel Ores and concentrates tonnes 1 210 300 1 393 490 1 518 156 1 259 734 1 391 103 Crude petroleum tonnes 852 361 685 090 258 896 51 521 — Natural gas tonnes 79 059 93 816 96 877 93 567 103 041 Platinum metals Platinum and platinum metals kilograms 2 420 7 649 9 910 13 443 21 219 Salt tonnes 42 011 39 986 49 248 43 611 34 013 Silver Metal kilograms 3 294 3 779 2 032 2 781 2 059 Titanium Oxides tonnes 504 502 455 546 528 Zinc Unwrought (a) tonnes 5 213 4 920 4 611 4 075 4 664
Note(s) (a) Including alloys (b) BGS estimates, based on known exports from certain countries (c) Including anthracite
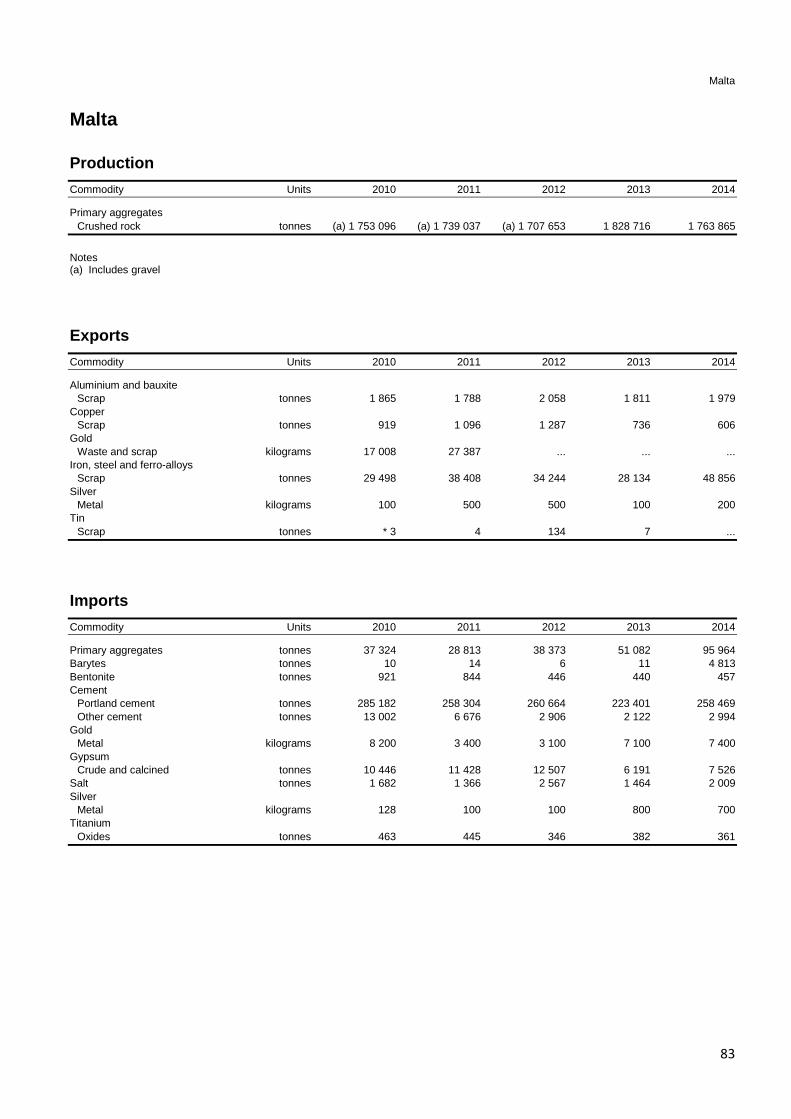
83
Malta
Malta
Production Commodity Units 2010 2011 2012 2013 2014
Primary aggregates Crushed rock tonnes (a) 1 753 096 (a) 1 739 037 (a) 1 707 653 1 828 716 1 763 865
Notes (a) Includes gravel
Exports Commodity Units 2010 2011 2012 2013 2014
Aluminium and bauxite Scrap tonnes 1 865 1 788 2 058 1 811 1 979 Copper Scrap tonnes 919 1 096 1 287 736 606 Gold Waste and scrap kilograms 17 008 27 387 ... ... ... Iron, steel and ferro-alloys Scrap tonnes 29 498 38 408 34 244 28 134 48 856 Silver Metal kilograms 100 500 500 100 200 Tin Scrap tonnes * 3 4 134 7 ...
Imports Commodity Units 2010 2011 2012 2013 2014
Primary aggregates tonnes 37 324 28 813 38 373 51 082 95 964 Barytes tonnes 10 14 6 11 4 813 Bentonite tonnes 921 844 446 440 457 Cement Portland cement tonnes 285 182 258 304 260 664 223 401 258 469 Other cement tonnes 13 002 6 676 2 906 2 122 2 994 Gold Metal kilograms 8 200 3 400 3 100 7 100 7 400 Gypsum Crude and calcined tonnes 10 446 11 428 12 507 6 191 7 526 Salt tonnes 1 682 1 366 2 567 1 464 2 009 Silver Metal kilograms 128 100 100 800 700 Titanium Oxides tonnes 463 445 346 382 361

84
Montenegro
Montenegro
Production Commodity Units 2010 2011 2012 2013 2014
Primary aggregates Sand and gravel tonnes 255 678 133 947 201 896 213 002 289 469 Crushed rock tonnes 265 066 167 405 112 630 143 179 137 299 Bauxite tonnes 61 205 158 614 — 61 154 155 153 Primary aluminium tonnes 82 043 92 838 74 813 47 951 42 767 Coal Lignite tonnes 1 937 847 1 972 671 1 706 302 1 692 535 1 655 045 Crude steel tonnes 48 272 61 164 28 161 19 723 * 15 000 Lead, mine tonnes (metal content) ... ... 1 958 2 453 2 755 Salt Sea salt tonnes 11 200 10 000 16 000 10 000 * 10 000 Zinc, mine tonnes (metal content) * 250 * 3 300 4 677 5 487 5 505
Exports Commodity Units 2010 2011 2012 2013 2014
Primary aggregates tonnes 112 522 32 451 15 527 45 091 50 500 Aluminium and bauxite Bauxite tonnes 85 623 127 268 26 354 100 291 68 378 Unwrought tonnes (a) 76 891 108 813 75 180 (a) 48 052 (a) 42 171 Scrap tonnes 2 045 2 357 2 356 2 337 2 071 Cement Portland cement tonnes ... 2 372 1 583 3 250 246 Coal Lignite tonnes 69 130 48 940 47 778 22 877 27 857 Copper Scrap tonnes 1 769 2 356 1 650 1 705 1 587 Iron, steel and ferro-alloys Ingots, blooms, billets tonnes 18 775 6 866 9 199 3 540 716 Scrap tonnes 28 570 55 204 43 998 56 423 51 429 Salt tonnes 14 316 1 560 1 845 2 158 692 Silver Metal kilograms ... — 14 372 42 403 Zinc Ores and concentrates tonnes 499 6 579 9 120 9 283 14 340
Note(s) (a) Including alloys
Imports Commodity Units 2010 2011 2012 2013 2014
Primary aggregates tonnes 26 703 12 574 4 709 1 933 9 860 Aluminium and bauxite Alumina tonnes 157 753 185 103 139 940 93 297 83 512 Cement Portland cement tonnes 266 063 250 759 248 013 267 715 288 075 Other cement tonnes 116 132 90 911 92 927 96 956 81 088 Diamond Dust carats 45 000 ... ... ... 10 000
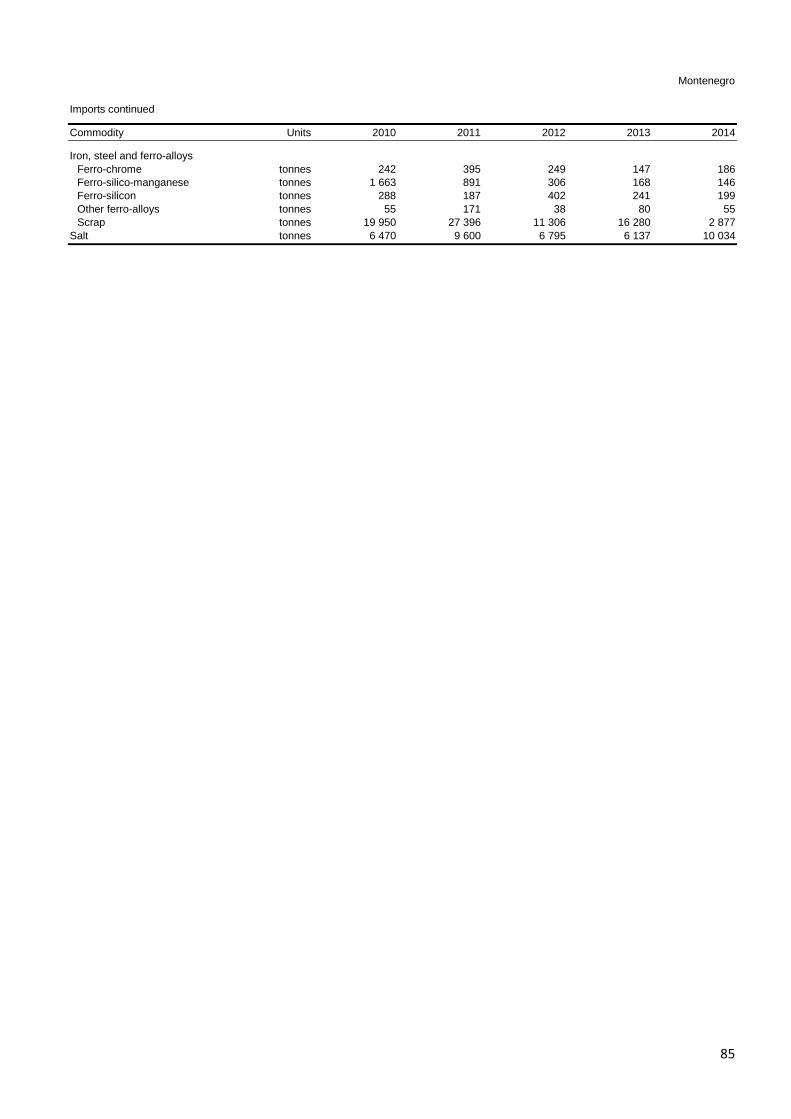
85
Montenegro
Imports continued
Commodity Units 2010 2011 2012 2013 2014
Iron, steel and ferro-alloys Ferro-chrome tonnes 242 395 249 147 186 Ferro-silico-manganese tonnes 1 663 891 306 168 146 Ferro-silicon tonnes 288 187 402 241 199 Other ferro-alloys tonnes 55 171 38 80 55 Scrap tonnes 19 950 27 396 11 306 16 280 2 877 Salt tonnes 6 470 9 600 6 795 6 137 10 034
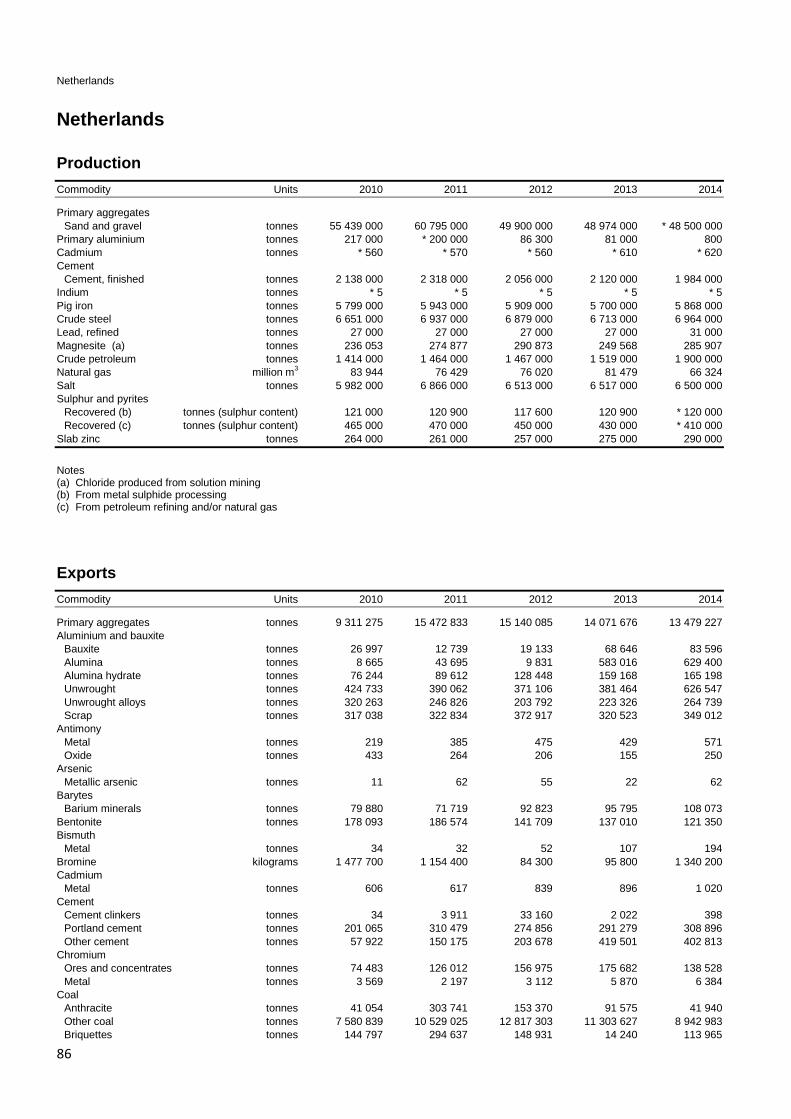
86
Netherlands
Netherlands
Production Commodity Units 2010 2011 2012 2013 2014
Primary aggregates Sand and gravel tonnes 55 439 000 60 795 000 49 900 000 48 974 000 * 48 500 000 Primary aluminium tonnes 217 000 * 200 000 86 300 81 000 800 Cadmium tonnes * 560 * 570 * 560 * 610 * 620 Cement Cement, finished tonnes 2 138 000 2 318 000 2 056 000 2 120 000 1 984 000 Indium tonnes * 5 * 5 * 5 * 5 * 5 Pig iron tonnes 5 799 000 5 943 000 5 909 000 5 700 000 5 868 000 Crude steel tonnes 6 651 000 6 937 000 6 879 000 6 713 000 6 964 000 Lead, refined tonnes 27 000 27 000 27 000 27 000 31 000 Magnesite (a) tonnes 236 053 274 877 290 873 249 568 285 907 Crude petroleum tonnes 1 414 000 1 464 000 1 467 000 1 519 000 1 900 000 Natural gas million m3 83 944 76 429 76 020 81 479 66 324 Salt tonnes 5 982 000 6 866 000 6 513 000 6 517 000 6 500 000 Sulphur and pyrites Recovered (b) tonnes (sulphur content) 121 000 120 900 117 600 120 900 * 120 000 Recovered (c) tonnes (sulphur content) 465 000 470 000 450 000 430 000 * 410 000 Slab zinc tonnes 264 000 261 000 257 000 275 000 290 000
Notes (a) Chloride produced from solution mining (b) From metal sulphide processing (c) From petroleum refining and/or natural gas
Exports Commodity Units 2010 2011 2012 2013 2014
Primary aggregates tonnes 9 311 275 15 472 833 15 140 085 14 071 676 13 479 227 Aluminium and bauxite Bauxite tonnes 26 997 12 739 19 133 68 646 83 596 Alumina tonnes 8 665 43 695 9 831 583 016 629 400 Alumina hydrate tonnes 76 244 89 612 128 448 159 168 165 198 Unwrought tonnes 424 733 390 062 371 106 381 464 626 547 Unwrought alloys tonnes 320 263 246 826 203 792 223 326 264 739 Scrap tonnes 317 038 322 834 372 917 320 523 349 012 Antimony Metal tonnes 219 385 475 429 571 Oxide tonnes 433 264 206 155 250 Arsenic Metallic arsenic tonnes 11 62 55 22 62 Barytes Barium minerals tonnes 79 880 71 719 92 823 95 795 108 073 Bentonite tonnes 178 093 186 574 141 709 137 010 121 350 Bismuth Metal tonnes 34 32 52 107 194 Bromine kilograms 1 477 700 1 154 400 84 300 95 800 1 340 200 Cadmium Metal tonnes 606 617 839 896 1 020 Cement Cement clinkers tonnes 34 3 911 33 160 2 022 398 Portland cement tonnes 201 065 310 479 274 856 291 279 308 896 Other cement tonnes 57 922 150 175 203 678 419 501 402 813 Chromium Ores and concentrates tonnes 74 483 126 012 156 975 175 682 138 528 Metal tonnes 3 569 2 197 3 112 5 870 6 384 Coal Anthracite tonnes 41 054 303 741 153 370 91 575 41 940 Other coal tonnes 7 580 839 10 529 025 12 817 303 11 303 627 8 942 983 Briquettes tonnes 144 797 294 637 148 931 14 240 113 965

87
Netherlands
Exports continued
Commodity Units 2010 2011 2012 2013 2014
Cobalt Metal tonnes 1 733 2 062 1 934 2 054 3 260 Oxides tonnes 144 67 132 45 21 Copper Ores and concentrates tonnes 0 0 6 540 56 629 91 185 Unwrought tonnes 20 175 34 435 59 260 27 722 25 173 Unwrought alloys tonnes 2 379 3 057 2 389 2 497 3 119 Scrap tonnes 283 847 315 437 328 463 295 139 326 278 Diamond Unsorted Carats £371 000 £1 799 000 £823 000 £308 000 £3 338 000 Gem, cut Carats £3 132 000 £16 418 000 £8 002 000 £10 206 000 £7 105 000 Industrial Carats £2 179 000 £1 282 000 £1 508 000 £2 148 000 £269 000 Dust Carats £51 000 £57 000 £97 000 £794 000 £2 552 000 Diatomite tonnes 359 633 807 864 604 Feldspar tonnes 105 112 281 228 533 Fluorspar tonnes 14 023 28 870 19 488 16 659 34 470 Gold Metal kilograms 34 851 50 559 37 629 31 713 20 606 Waste and scrap kilograms 57 680 112 629 123 769 58 592 44 029 Graphite tonnes 2 967 10 651 11 201 8 019 9 535 Gypsum Crude tonnes 15 773 42 080 36 388 39 777 32 497 Calcined tonnes 1 656 2 714 3 005 2 818 3 216 Iodine kilograms 124 797 152 295 122 569 502 562 704 006 Iron ore tonnes 121 426 208 469 49 903 241 379 140 232 Iron, steel and ferro-alloys Pig iron tonnes 111 189 133 861 184 975 78 365 105 754 Sponge and powder tonnes 359 625 745 26 189 37 091 Ferro-chrome tonnes 170 489 242 310 232 408 168 967 227 443 Ferro-silico-chrome tonnes 448 14 816 31 811 6 589 9 567 Ferro-manganese tonnes 35 353 66 053 57 013 88 182 78 639 Ferro-silico-manganese tonnes 66 085 62 737 99 228 124 570 127 457 Ferro-molybdenum tonnes 6 462 6 544 8 031 8 399 5 929 Ferro-nickel tonnes 6 264 7 514 10 306 23 130 40 420 Ferro-niobium tonnes 1 175 2 070 1 280 1 941 1 909 Ferro-silicon tonnes 219 244 238 469 226 217 112 552 143 357 Ferro-titanium and ferro-silico-titanium tonnes 10 510 13 620 10 357 11 011 14 667 Ferro-tungsten and ferro-silico-tungsten tonnes 727 1 155 990 1 663 1 436 Ferro-vanadium tonnes 1 909 2 343 1 772 1 525 3 156 Other ferro-alloys tonnes 50 903 16 535 15 559 7 145 10 167 Silicon metal tonnes 69 896 65 055 86 097 47 748 51 298 Ingots, blooms, billets tonnes 849 018 1 553 519 1 601 063 702 912 624 693 Scrap tonnes 5 541 773 5 692 223 5 635 229 5 517 477 5 295 208 Kaolin tonnes 33 923 24 652 25 254 26 668 29 800 Lead Ores and concentrates tonnes 63 921 94 100 46 688 41 266 63 529 Unwrought tonnes 12 971 16 989 14 432 17 260 48 573 Scrap tonnes 35 168 30 486 21 665 38 896 42 570 Lithium Oxides tonnes 116 365 303 492 314 Carbonate tonnes 160 300 567 266 229 Magnesite and magnesia Magnesite tonnes 423 744 31 99 1 304 Magnesia tonnes 139 516 402 976 370 287 273 416 266 591 Manganese Ores and concentrates tonnes 21 806 29 097 27 154 30 072 29 303 Metal tonnes 38 159 44 310 29 855 26 866 27 634 Mercury kilograms 195 272 72 020 67 263 64 995 1 806 Mica tonnes 1 687 2 396 1 986 1 897 2 246 Molybdenum Ores and concentrates tonnes 17 126 19 765 24 083 29 792 30 292 Metal tonnes 249 492 128 141 251 Oxides tonnes 6 429 6 434 6 407 7 319 6 956

88
Netherlands
Exports continued
Commodity Units 2010 2011 2012 2013 2014
Nickel Ores and concentrates tonnes 40 (b)* 11 3 787 (b)* 1 145 309 Mattes, sinters etc (b) tonnes * 1 800 * 2 400 * 1 400 * 980 * 490 Unwrought (a) tonnes 165 49 681 46 929 45 573 51 310 Oxides tonnes ... 1 456 1 398 1 433 1 205 Scrap tonnes 1 956 1 793 1 405 2 948 3 252 Crude petroleum tonnes 340 357 81 621 396 475 8 886 727 9 007 981 Phosphate rock tonnes 138 239 166 704 162 952 117 248 128 632 Platinum metals Platinum kilograms £14 634 000 £9 386 000 £10 282 000 £6 146 000 £7 996 000 Platinum metals kilograms £7 953 000 £7 261 000 £5 329 000 £6 817 000 £4 605 000 Waste and scrap kilograms 1 877 220 5 714 1 445 97 519 Potash Sulphate tonnes 7 854 45 711 27 002 27 259 202 718 Chloride tonnes 174 453 227 456 395 684 327 663 280 860 Other potassic fertilisers tonnes 15 619 45 766 31 642 33 173 30 626 Rare earths Metals tonnes 86 70 163 2 688 142 Rare earth compounds tonnes 177 327 341 256 223 Ferro-cerium and other pyrophoric alloys tonnes 49 18 32 14 5 Salt tonnes 3 456 740 2 631 255 2 456 168 4 304 382 4 290 537 Sillimanite minerals tonnes 6 907 23 239 13 447 18 958 6 494 Silver Ores and concentrates kilograms 1 458 6 944 123 — — Metal kilograms 216 182 624 589 241 614 555 475 160 451 Sulphur and pyrites Pyrites tonnes 56 610 101 114 84 734 13 367 45 579 Sulphur tonnes 480 968 469 819 561 995 395 938 441 806 Talc tonnes 173 042 147 492 150 456 145 912 166 925 Tantalum and niobium Tantalum tonnes 22 42 19 12 (b)* 128 Tin Unwrought tonnes 4 043 3 619 5 670 6 126 7 752 Unwrought alloys tonnes 856 357 314 338 446 Scrap tonnes 544 465 363 653 563 Titanium Titanium minerals tonnes 101 840 69 170 57 796 3 396 2 503 Metal tonnes 4 117 9 548 10 173 8 815 5 403 Oxides tonnes 31 385 11 305 14 836 114 285 119 100 Tungsten Ores and concentrates tonnes 104 0 0 63 197 Metal tonnes 406 255 119 84 123 Vanadium Pentoxide tonnes 122 186 328 492 314 Zinc Ores and concentrates tonnes 12 182 132 344 90 253 91 030 79 600 Unwrought tonnes 166 281 122 532 213 479 272 732 190 548 Unwrought alloys tonnes 42 182 52 382 39 626 48 484 68 830 Scrap tonnes 32 543 25 629 28 277 26 682 31 910 Zirconium Concentrates tonnes 11 091 13 351 9 959 9 514 11 493 Metal tonnes 110 108 147 75 32
Note(s) (a) Including alloys (b) BGS estimates, based on known imports into certain countries

89
Netherlands
Imports Commodity Units 2010 2011 2012 2013 2014
Primary aggregates tonnes 26 065 573 28 239 777 23 457 644 22 724 647 24 404 781 Aluminium and bauxite Bauxite tonnes 113 499 113 653 108 492 35 459 126 019 Alumina tonnes 692 413 955 665 626 715 792 007 804 607 Alumina hydrate tonnes 167 596 246 013 243 186 287 325 269 165 Unwrought tonnes 384 724 424 915 487 639 163 027 930 866 Unwrought alloys tonnes 462 371 537 289 464 926 444 992 463 212 Scrap tonnes 184 066 241 081 270 014 220 965 233 610 Antimony Metal tonnes 314 208 586 697 628 Oxide tonnes 57 454 26 729 18 315 16 031 1 708 Arsenic Metallic arsenic tonnes 95 104 — 109 196 Barytes Barium minerals tonnes 161 343 148 240 168 963 140 000 153 290 Bentonite tonnes 237 683 289 615 277 221 216 441 264 000 Bismuth Metal tonnes 259 192 427 694 981 Bromine kilograms 123 400 61 900 262 000 32 000 387 100 Cadmium Metal tonnes 102 1 15 36 35 Cement Cement clinkers tonnes 636 694 424 274 558 153 634 548 352 521 Portland cement tonnes 1 123 936 1 580 140 1 278 033 1 259 993 1 610 207 Other cement tonnes 1 136 163 1 475 035 1 488 241 1 271 302 1 115 885 Chromium Ores and concentrates tonnes 88 788 135 776 180 648 150 921 974 Metal tonnes 6 642 5 773 4 789 5 260 6 704 Coal Anthracite tonnes 44 958 225 184 257 485 160 206 111 094 Other coal tonnes 18 783 491 18 008 920 21 017 984 22 978 921 21 218 149 Lignite tonnes 21 933 15 824 22 991 16 285 22 108 Briquettes tonnes 132 281 429 514 1 398 836 2 702 367 2 591 227 Cobalt Metal tonnes 962 1 023 1 249 1 581 1 907 Oxides tonnes 118 596 16 7 5 516 Copper Ores and concentrates tonnes 40 99 2 529 66 783 29 507 Unwrought, unrefined tonnes 7 194 5 502 9 68 9 Unwrought, refined tonnes 26 982 41 659 25 369 21 677 18 982 Unwrought alloys tonnes 2 101 2 111 1 930 2 982 2 951 Scrap tonnes 144 426 204 327 214 211 166 106 147 516 Diamond Unsorted Carats £80 000 £192 000 £144 000 £885 000 £171 000 Gem, cut Carats £15 248 000 £35 316 000 £30 128 000 £33 465 000 £22 637 000 Industrial Carats £624 000 £1 393 000 £1 392 000 £2 340 000 £1 245 000 Dust Carats 290 475 2 074 815 820 000 14 150 000 30 820 000 Diatomite tonnes 4 641 6 034 6 232 6 445 43 518 Feldspar tonnes 15 721 9 071 57 431 85 487 64 185 Fluorspar tonnes 14 294 23 603 11 725 26 299 28 875 Gold Metal kilograms 37 888 38 349 35 027 38 821 19 861 Waste and scrap kilograms 110 465 188 490 117 52 603 308 Graphite tonnes 16 692 14 266 13 498 11 342 13 371 Gypsum Crude tonnes 203 179 307 971 280 623 349 844 415 489 Calcined tonnes 368 523 611 145 570 600 504 609 192 705 Iodine kilograms 16 031 1 352 421 811 065 1 174 000 947 209 Iron ore tonnes (a) 8 810 077 8 921 399 7 445 399 (a) 5 200 141 (a) 8 297 535

90
Netherlands
Imports continued
Commodity Units 2010 2011 2012 2013 2014
Iron, steel and ferro-alloys Pig iron tonnes 98 575 213 530 190 874 188 277 284 279 Sponge and powder tonnes 378 111 402 025 416 889 190 235 212 909 Ferro-chrome tonnes 93 919 123 284 76 613 264 401 177 341 Ferro-silico-chrome tonnes 2 838 525 353 6 227 1 427 Ferro-manganese tonnes 86 504 89 805 84 529 141 367 123 405 Ferro-silico-manganese tonnes 57 967 80 905 21 583 78 217 55 053 Ferro-molybdenum tonnes 4 643 7 753 4 548 3 397 3 466 Ferro-nickel tonnes 19 378 25 849 20 222 7 243 48 172 Ferro-niobium tonnes 920 1 354 1 397 78 1 695 Ferro-silicon tonnes 178 138 152 194 181 213 62 226 58 818 Ferro-titanium and ferro-silico-titanium tonnes 11 922 13 484 14 189 9 816 8 819 Ferro-tungsten and ferro-silico-tungsten tonnes 1 168 1 298 726 1 108 1 063 Ferro-vanadium tonnes 2 014 1 890 1 710 1 102 1 238 Other ferro-alloys tonnes 11 263 17 558 7 372 6 993 15 282 Silicon metal tonnes 82 599 75 664 81 148 100 682 134 485 Ingots, blooms, billets tonnes 536 157 1 335 875 1 040 244 404 473 742 121 Scrap tonnes 1 988 278 2 188 452 2 408 332 2 290 454 2 359 263 Kaolin tonnes 150 929 150 310 149 090 115 525 168 279 Lead Ores and concentrates tonnes 1 558 8 083 29 375 7 383 47 770 Unwrought tonnes 8 717 8 496 4 020 5 484 5 561 Scrap tonnes 21 255 16 886 15 622 10 578 8 823 Lithium Oxides tonnes 290 494 201 229 188 Carbonate tonnes 431 527 462 524 542 Magnesite and magnesia Magnesite tonnes 459 3 115 195 645 2 001 Magnesia tonnes 345 154 458 372 340 922 235 685 187 691 Manganese Ores and concentrates tonnes 23 045 33 555 66 281 38 141 414 471 Metal tonnes 50 866 35 618 40 131 30 706 25 735 Mercury kilograms 30 636 213 259 154 983 124 697 2 122 Mica Unmanufactured tonnes 191 419 418 540 158 Ground tonnes 21 756 20 744 4 632 4 504 5 565 Waste tonnes 748 462 24 0 ... Molybdenum Ores and concentrates tonnes 35 335 40 562 39 782 30 242 22 784 Metal tonnes 274 261 236 154 152 Oxides tonnes 594 865 596 617 648 Nickel Ores and concentrates tonnes 5 940 9 544 744 0 — Unwrought tonnes ... 50 510 32 005 41 856 45 272 Unwrought alloys tonnes 638 3 548 982 1 126 1 386 Oxides (b) tonnes * 50 * 70 * 150 * 253 * 96 Scrap tonnes 10 852 4 607 2 584 2 803 4 208 Crude petroleum tonnes 60 408 191 55 108 848 63 505 928 63 201 586 62 072 337 Natural gas (b) tonnes * 11 044 000 * 12 153 000 * 10 107 568 * 2 884 000 * 3 026 000 Phosphate rock tonnes 779 354 779 537 679 557 287 737 301 386 Platinum metals Platinum kilograms £25 740 000 £73 911 000 £79 002 000 £15 407 000 £10 591 546 Platinum metals kilograms £13 014 000 £54 486 000 £31 440 000 £10 916 000 £9 319 288 Waste and scrap kilograms 260 515 411 332 5 883 116 333 6 003 Potash Sulphate tonnes 21 982 56 536 66 497 118 050 246 261 Chloride tonnes 430 138 756 966 905 233 851 210 978 368 Other potassic fertilisers tonnes 1 542 26 231 24 569 80 844 103 051 Rare earths Metals tonnes 48 18 99 75 94 Cerium compounds tonnes 88 223 396 268 201 Other rare earth compounds tonnes 568 173 742 878 1 094 Ferro-cerium and other pyrophoric alloys tonnes 2 1 23 14 ... Salt tonnes 1 404 032 2 397 781 331 643 1 090 957 324 274 Sillimanite minerals Sillimanite minerals tonnes 3 576 13 342 13 177 24 417 20 577 Mullite tonnes 51 745 64 162 34 244 32 464 49 343

91
Netherlands
Imports continued
Commodity Units 2010 2011 2012 2013 2014
Silver Metal kilograms 304 219 338 239 301 089 321 318 179 287 Sulphur and pyrites Pyrites tonnes 48 1 593 329 1 481 3 288 Sulphur tonnes 49 399 229 496 80 459 117 195 96 545 Sulphur, sublimed and precipitated tonnes 4 7 3 736 1 22 Talc tonnes 178 312 199 302 182 898 213 095 249 040 Tantalum and niobium Tantalum tonnes 27 33 54 10 62 Tin Unwrought tonnes 13 967 11 303 7 453 11 803 11 282 Unwrought alloys tonnes 665 505 276 389 160 Scrap tonnes 606 524 424 3 655 1 678 Titanium Titanium minerals tonnes 238 199 196 960 158 679 83 675 114 468 Metal tonnes 5 330 6 094 5 709 5 902 4 678 Oxides tonnes 43 542 52 165 38 792 58 718 58 775 Tungsten Ores and concentrates (b) tonnes * 1 200 * 3 100 * 3 400 * 3 203 * 3 600 Metal tonnes 206 209 211 471 226 Vanadium Metal tonnes 21 6 ... 66 333 Pentoxide tonnes 204 888 558 1 240 3 465 Zinc Ores and concentrates tonnes 391 050 355 644 445 698 474 857 640 235 Unwrought tonnes 254 953 227 277 221 680 191 576 165 072 Unwrought alloys tonnes 19 827 13 356 8 029 24 859 12 532 Scrap tonnes 12 653 9 283 6 759 7 301 8 417 Zirconium Concentrates tonnes 23 981 43 560 17 070 6 651 19 942 Metal tonnes 188 297 211 152 206
Note(s) (a) Including burnt pyrites (b) BGS estimates, based on known exports from certain countries

92
Norway
Norway
Production Commodity Units 2010 2011 2012 2013 2014
Primary aggregates Sand and gravel tonnes 13 011 000 13 215 000 14 262 000 13 984 000 14 111 000 Crushed rock tonnes 54 134 000 63 855 000 67 670 000 66 259 000 64 828 000 Primary aluminium tonnes 1 090 000 1 201 000 1 110 900 1 154 900 1 250 000 Cadmium tonnes 300 309 * 310 * 310 * 310 Cement Cement, clinker tonnes 1 433 783 1 382 809 1 435 497 1 399 012 1 364 866 Cement, finished tonnes 1 467 363 1 579 505 1 661 157 1 694 150 1 693 379 Coal Bituminous (a) tonnes 1 685 000 1 640 000 1 325 000 2 135 000 1 701 000 Cobalt tonnes 3 208 3 067 2 969 3 348 3 582 Copper, smelter tonnes 36 200 36 000 37 891 37 461 35 813 Copper, refined tonnes 36 200 36 000 37 891 37 461 35 813 Feldspar tonnes 56 000 25 271 — — 154 Graphite tonnes 6 270 7 789 6 992 6 207 8 308 Gypsum (b)(c) tonnes 36 395 88 953 85 296 77 009 79 740 Iron ore tonnes 6 742 333 6 723 426 7 744 487 9 549 232 10 542 149 Pig iron tonnes 108 000 101 000 100 000 100 000 110 000 Crude steel tonnes 530 000 610 000 700 000 605 000 595 000 Ferro-alloys Ferro-manganese tonnes 297 300 337 900 325 900 320 000 * 285 000 Ferro-silico-manganese tonnes (c) 281 266 266 000 271 400 * 250 000 * 250 000 Ferro-silicon tonnes * 225 000 170 102 203 886 337 281 192 389 Silicon metal tonnes * 170 000 * 170 000 * 150 000 * 150 000 * 150 000 Molybdenum tonnes (metal content) ... ... 4 8 2 Nepheline Syenite tonnes 327 000 330 000 320 000 320 000 331 000 Nickel, mined tonnes (metal content) 348 339 351 296 290 Nickel, smelter/refinery tonnes 92 185 92 427 91 687 91 017 90 526 Crude petroleum tonnes 105 146 000 100 343 000 94 497 000 90 387 000 93 294 000 Natural gas million m3 107 800 101 697 114 918 108 746 108 820 Sulphur and pyrites Recovered (d) tonnes (sulphur content) 36 900 37 531 41 464 38 745 40 119 Recovered (e) tonnes (sulphur content) 22 000 19 000 20 000 22 000 * 22 000 Talc tonnes 6 392 8 191 7 983 8 459 * 8 000 Titanium Ilmenite tonnes 864 000 870 000 830 614 826 126 863 660 Slab zinc tonnes 148 862 153 200 152 647 143 444 165 600
Notes (a) Spitzbergen: not including production from mines controlled by Russia (b) Including anhydrite (c) Sales (d) From metal sulphide processing (e) From petroleum refining and/or natural gas
Exports Commodity Units 2010 2011 2012 2013 2014
Primary aggregates tonnes 16 877 617 20 858 955 19 761 572 18 103 600 18 944 242 Aluminium and bauxite Alumina tonnes 156 187 228 2 715 54 Unwrought tonnes 74 941 58 478 66 997 57 855 51 221 Unwrought alloys tonnes 1 420 662 1 370 411 1 287 135 1 196 035 1 275 484 Scrap tonnes 77 216 88 312 76 950 61 112 69 737 Barytes Barium minerals tonnes 12 071 8 008 9 954 13 246 10 729 Bentonite tonnes 3 726 318 1 318 494 623 Bismuth Metal tonnes 25 — — — —

93
Norway
Exports continued
Commodity Units 2010 2011 2012 2013 2014
Cadmium Metal tonnes 329 317 221 267 227 Cement Cement clinkers (a) tonnes * 150 000 * 251 000 * 104 000 * 40 000 * 2 500 Portland cement (a) tonnes * 144 000 * 94 000 * 138 000 * 148 000 * 179 000 Chromium Metal tonnes 97 78 202 61 35 Cobalt Metal tonnes 3 325 3 064 3 059 2 876 3 669 Copper Matte and cement tonnes 0 2 3 852 2 387 2 728 Unwrought tonnes 35 975 36 549 38 146 37 287 37 397 Scrap tonnes 37 829 45 889 55 842 57 357 53 906 Feldspar tonnes 55 637 30 617 4 821 9 146 5 698 Gold Metal kilograms 4 567 7 439 8 498 4 912 3 828 Waste and scrap kilograms 1 482 1 904 4 261 1 027 427 Gypsum Crude and calcined tonnes 36 298 85 598 90 159 77 012 79 729 Iodine kilograms — 13 250 1 127 — — Iron ore tonnes 1 803 242 2 435 415 3 659 210 3 567 408 4 016 143 Iron, steel and ferro-alloys Pig iron (a) tonnes * 118 000 * 110 000 * 91 000 * 118 000 * 126 000 Sponge and powder tonnes 678 169 1 269 3 722 3 986 Ferro-chrome (a) tonnes * 30 * 65 * 90 * 89 * 62 Ferro-manganese (a) tonnes * 332 000 * 379 000 * 370 000 * 825 000 * 332 000 Ferro-silico-manganese tonnes 245 095 246 808 277 070 279 907 302 037 Ferro-silicon tonnes 214 643 246 711 244 224 246 718 268 911 Other ferro-alloys tonnes 2 479 47 9 20 74 Silicon metal tonnes 162 649 154 191 161 468 174 217 191 221 Ingots, blooms, billets tonnes 64 474 92 475 163 423 87 907 54 323 Scrap tonnes 337 675 289 943 345 558 365 332 422 776 Kaolin tonnes 103 85 492 20 72 Lead Scrap tonnes 1 800 1 444 1 944 1 290 1 689 Manganese Ores and concentrates tonnes 10 709 2 600 39 355 8 211 2 100 Metal tonnes 112 462 95 0 — Mica tonnes 2 078 2 144 2 093 2 447 2 289 Nickel Ores and concentrates tonnes 4 818 7 598 7 969 5 433 5 397 Unwrought tonnes 91 813 92 705 91 591 89 413 86 210 Scrap tonnes 1 042 582 499 674 404 Crude petroleum tonnes 79 030 886 70 031 846 64 341 641 59 375 084 62 177 588 Natural gas tonnes 75 626 277 74 356 856 84 557 156 81 107 905 82 413 956 Phosphate rock tonnes 2 5 6 866 17 506 29 217 Platinum metals Platinum and platinum metals kilograms 9 714 11 951 13 707 10 088 9 262 Waste and scrap kilograms 157 937 36 399 63 560 19 969 3 814 Rare earths Metals tonnes — 19 5 54 — Rare earth compounds tonnes 30 23 13 35 15 Salt tonnes 12 609 5 775 17 053 9 211 14 597 Silver Metal kilograms 57 617 62 849 49 856 48 129 52 256 Talc tonnes 728 2 204 535 648 71 Titanium Titanium minerals (a) tonnes * 465 000 * 441 000 * 392 000 * 396 000 * 420 000 Metal tonnes 231 343 243 271 468 Oxides (a) tonnes * 35 000 * 35 000 * 31 000 * 35 000 * 38 000 Zinc Unwrought tonnes 122 649 119 770 115 789 109 485 125 164 Unwrought alloys tonnes 19 889 29 094 28 188 30 614 33 315
Note(s) (a) BGS estimates, based on known imports into certain countries

94
Norway
Imports Commodity Units 2010 2011 2012 2013 2014
Primary aggregates tonnes 82 706 98 721 107 087 83 631 53 541 Aluminium and bauxite Bauxite tonnes 8 645 459 746 485 475 Alumina tonnes 2 144 519 2 185 976 2 191 352 2 302 823 2 260 295 Alumina hydrate tonnes 35 379 53 224 50 386 47 789 52 105 Unwrought tonnes 512 340 450 432 298 464 286 320 334 875 Unwrought alloys tonnes 68 086 27 867 41 031 21 577 13 455 Scrap tonnes 38 039 42 078 31 750 32 529 32 927 Antimony Oxide tonnes 264 193 211 162 176 Barytes Barium minerals tonnes 149 510 139 620 124 210 159 682 154 378 Bentonite tonnes 14 506 12 668 11 620 16 045 24 565 Cement Cement clinkers tonnes 7 070 170 312 376 101 Portland cement tonnes 353 102 409 018 435 344 464 686 491 789 Other cement tonnes 21 621 25 809 28 533 31 974 28 655 Chromium Ores and concentrates (a) tonnes * 400 * 500 * 300 * 200 * 200 Metal tonnes 90 437 453 543 92 Coal Anthracite (b) tonnes 78 387 79 140 78 412 68 231 79 859 Other coal (a)(b) tonnes * 517 000 * 343 000 * 468 000 * 465 000 * 476 000 Cobalt Metal tonnes 2 132 684 5 090 2 678 4 Copper Unwrought tonnes 4 609 909 704 1 460 1 107 Scrap tonnes 9 891 12 856 12 073 11 674 10 891 Diamond Gem, cut Carats 8 545 5 284 * 4 400 * 6 800 * 6 500 Industrial Carats 160 000 140 000 285 000 130 000 340 000 Dust Carats ... ... 115 000 55 000 10 000 Diatomite tonnes 842 808 867 937 1 130 Feldspar tonnes 16 413 18 228 14 322 15 794 17 151 Gold Metal kilograms 969 1 220 1 338 1 007 1 018 Waste and scrap kilograms 4 127 5 415 4 915 3 928 4 000 Graphite tonnes 400 129 124 45 28 Gypsum Crude tonnes 84 359 94 824 79 789 78 521 88 089 Calcined tonnes 270 721 275 909 299 898 264 601 277 549 Iodine kilograms 1 708 338 1 663 657 1 759 025 2 035 784 2 057 520 Iron ore tonnes 148 809 127 127 92 702 74 266 49 445 Iron, steel and ferro-alloys Pig iron tonnes 1 498 10 709 9 749 7 650 3 445 Sponge and powder tonnes 575 39 665 36 216 28 156 7 197 Ferro-chrome tonnes 1 311 1 534 1 293 1 170 1 094 Ferro-manganese tonnes 5 303 5 254 1 200 124 237 Ferro-silico-manganese tonnes 548 0 2 197 — Ferro-molybdenum tonnes 121 172 133 142 130 Ferro-silicon tonnes 10 615 9 595 5 383 3 478 5 128 Other ferro-alloys tonnes 1 544 2 090 1 022 1 845 1 902 Silicon metal tonnes 49 349 53 897 28 196 19 763 27 475 Ingots, blooms, billets tonnes 4 733 5 411 5 977 8 395 7 601 Scrap tonnes 108 802 138 814 210 426 194 345 155 549 Kaolin tonnes 225 576 149 002 176 164 168 419 148 595 Lead Unwrought tonnes 6 449 7 713 8 071 9 630 8 902 Magnesite and magnesia Magnesia tonnes 10 987 8 714 9 795 8 060 6 830 Manganese Ores and concentrates tonnes 1 121 716 1 085 383 1 072 991 992 832 1 092 278 Metal tonnes 1 974 2 697 1 636 2 158 1 851

95
Norway
Imports continued
Commodity Units 2010 2011 2012 2013 2014
Mica Unmanufactured tonnes 1 224 1 573 1 964 2 027 500 Ground tonnes 1 179 294 285 193 797 Waste tonnes ... ... 82 355 896 Nickel Mattes, sinters etc tonnes 170 365 199 173 190 275 178 840 162 202 Unwrought (c) tonnes 235 246 250 175 131 Crude petroleum tonnes 1 508 241 1 238 531 1 305 413 1 815 872 1 220 705 Natural gas tonnes 4 393 1 005 444 36 23 Phosphate rock tonnes 9 638 6 499 — — — Platinum metals Platinum and platinum metals kilograms 1 425 1 430 758 955 813 Waste and scrap kilograms 1 362 1 160 1 403 1 225 1 290 Potash Sulphate (a) tonnes * 99 000 * 65 000 * 27 782 * 49 000 * 455 000 Chloride (a) tonnes * 377 000 * 354 000 * 395 133 * 371 000 * 389 000 Other potassic fertilisers tonnes 612 287 320 235 2 348 Rare earths Metals tonnes 148 552 438 439 361 Cerium compounds tonnes 1 13 3 — 3 Other rare earth compounds tonnes 8 9 9 17 11 Salt tonnes 1 042 489 1 106 066 1 052 197 1 029 977 954 563 Sillimanite minerals tonnes 3 456 3 208 3 626 2 767 2 520 Silver Ores and concentrates kilograms (a)* 1 100 (a)* 700 (a)* 4 700 ... ... Metal kilograms 57 422 49 727 47 768 27 060 36 991 Sulphur and pyrites Sulphur tonnes 2 897 3 051 2 725 2 614 2 838 Sulphur, sublimed and precipitated tonnes 11 515 11 627 12 685 12 848 11 188 Talc tonnes 8 356 8 364 8 374 10 586 11 702 Titanium Titanium minerals tonnes 45 018 25 003 ... 26 238 26 780 Metal tonnes 412 723 890 671 762 Oxides tonnes 10 115 10 376 8 093 7 214 7 115 Zinc Ores and concentrates tonnes 228 828 250 537 260 442 237 170 261 048 Unwrought (c) tonnes 1 376 1 013 2 313 205 279
Note(s) (a) BGS estimates, based on known exports from certain countries (b) Excludes coal imported from Spitzbergen (c) Including alloys

96
Poland
Poland
Production Commodity Units 2010 2011 2012 2013 2014
Primary aggregates Sand and gravel (a) tonnes * 157 236 000 * 176 000 000 * 145 000 000 * 141 000 000 * 136 000 000 Crushed rock tonnes 62 886 200 88 696 900 64 859 600 57 945 100 61 117 900 Bentonite tonnes 2 000 910 780 1 050 650 Cadmium tonnes 451 526 370 460 628 Cement Cement, clinker tonnes 11 767 782 13 629 500 11 807 300 10 855 278 11 865 500 Cement, finished tonnes 15 756 000 18 929 000 15 918 614 14 831 323 15 814 500 Coal Bituminous tonnes 76 727 802 76 447 604 79 854 904 68 399 000 65 969 000 Lignite tonnes 56 510 125 62 841 269 64 297 772 66 139 000 64 002 000 Copper, mine tonnes (metal content) 425 725 426 665 427 064 428 879 421 700 Copper, smelter tonnes 469 656 481 875 466 715 458 789 503 111 Copper, refined tonnes 547 074 571 041 565 834 565 155 576 876 Diatomite tonnes 1 000 580 600 600 590 Feldspar tonnes 513 700 538 800 487 200 483 000 * 485 000 Gold kilograms 500 400 469 431 226 Gypsum (b) tonnes 1 241 200 1 418 300 1 395 400 1 270 100 1 231 900 Pig iron tonnes 3 637 994 3 974 930 3 943 968 4 013 877 4 637 478 Crude steel tonnes 7 993 025 8 776 458 8 542 514 8 199 353 8 799 731 Ferro-alloys Ferro-manganese tonnes 800 800 800 820 * 820 Ferro-silico-manganese tonnes 100 400 200 100 * 100 Ferro-silicon tonnes 53 206 72 668 78 115 73 589 62 878 Other ferro-alloys tonnes 200 300 300 11 250 * 11 300 Kaolin (c) tonnes 125 000 163 600 137 800 166 000 * 165 000 Lead, mine tonnes (metal content) 48 050 67 003 64 342 79 480 83 150 Lead, refined tonnes 120 300 121 500 141 000 145 400 149 000 Magnesite tonnes 63 000 75 350 83 860 97 000 92 000 Nickel, mined tonnes (metal content) 570 850 840 570 780 Nickel, smelter/refinery tonnes 600 900 800 600 800 Crude petroleum tonnes 686 487 618 163 677 664 960 672 984 216 Natural gas million m3 5 666 5 825 5 783 5 790 5 660 Selenium tonnes 79 85 90 80 90 Platinum metals kilograms Platinum kilograms (metal content) 30 23 39 51 * 60 Palladium kilograms (metal content) 20 13 23 30 * 30 Rhenium tonnes 3 3 3 5 * 5 Salt Rock salt tonnes 1 221 700 1 233 800 782 500 1 310 500 763 100 Brine salt tonnes 2 464 400 2 633 300 2 732 200 2 735 500 2 705 100 Other salt tonnes 763 515 768 000 724 000 686 352 641 769 Silver kilograms (metal content) 1 183 000 1 167 000 1 149 000 1 161 114 1 384 000 Sulphur and pyrites Frasch tonnes (sulphur content) 516 700 657 100 702 190 526 290 605 420 Recovered (d) tonnes (sulphur content) 253 000 273 000 267 000 260 000 * 260 000 Recovered (e) tonnes (sulphur content) 250 075 259 000 285 000 * 280 000 * 280 000 Tin tonnes 602 82 1 375 1 900 2 253 Zinc, mine tonnes (metal content) 107 700 87 200 76 700 75 900 56 000 Slab Zinc tonnes 135 100 144 100 138 300 146 300 154 000
Notes (a) Includes an estimate for small producers (b) Including anhydrite (c) Washed (d) From metal sulphide processing (e) From petroleum refining and/or natural gas

97
Poland
Exports Commodity Units 2010 2011 2012 2013 2014
Primary aggregates tonnes 1 031 013 1 058 307 962 169 1 565 938 1 989 610 Aluminium and bauxite Bauxite tonnes 448 8 546 — 2 1 Unwrought (a) tonnes 103 803 111 421 118 356 153 672 218 895 Scrap tonnes 123 503 130 472 155 032 151 679 182 781 Bentonite tonnes 21 987 25 050 23 563 38 087 31 419 Bromine kilograms 9 800 7 100 3 600 5 400 5 100 Cadmium Metal tonnes 484 579 388 437 730 Cement Cement clinkers tonnes 89 692 46 295 99 977 147 787 241 114 Portland cement tonnes 415 187 358 847 303 667 419 673 524 213 Other cement tonnes 22 984 17 523 28 200 20 620 19 150 Chromium Ores and concentrates tonnes 425 3 604 536 373 923 Metal tonnes 7 948 7 135 2 977 4 423 5 980 Coal Anthracite tonnes 41 908 43 370 37 906 52 188 53 662 Other coal tonnes 10 323 041 676 364 5 257 817 10 805 260 8 815 725 Lignite tonnes 116 682 145 063 133 531 217 825 302 793 Briquettes tonnes 2 114 15 992 1 676 1 637 2 880 Copper Ores and concentrates tonnes — 1 3 1 27 646 Matte and cement tonnes 956 1 567 1 306 1 724 1 053 Unwrought tonnes 332 989 327 585 333 648 343 628 308 042 Unwrought alloys tonnes 1 180 1 260 2 571 2 279 2 270 Scrap tonnes 68 686 60 544 49 128 57 215 64 023 Diatomite tonnes 111 788 3 012 5 823 1 430 Feldspar tonnes 3 050 3 012 1 376 1 222 898 Fluorspar tonnes 22 10 — 31 336 Gold Metal kilograms 1 100 3 000 12 300 7 100 4 200 Waste and scrap kilograms 588 26 1 000 180 147 Graphite tonnes 233 505 977 796 600 Gypsum Crude and calcined tonnes 47 654 121 689 111 389 119 406 136 399 Iodine kilograms 16 400 4 000 3 700 2 700 4 000 Iron ore tonnes 16 130 4 400 1 573 29 699 97 832 Iron, steel and ferro-alloys Pig iron tonnes 17 340 21 122 79 889 49 925 83 488 Sponge and powder tonnes 5 293 16 519 7 185 7 040 6 990 Ferro-chrome tonnes 668 309 505 648 1 396 Ferro-silico-chrome tonnes 81 95 — 7 558 28 705 Ferro-manganese and ferro-silico- manganese tonnes 10 113 3 284 5 844 44 294 58 249 Ferro-molybdenum tonnes 991 3 379 2 605 3 550 205 Ferro-silicon tonnes 59 845 76 121 72 741 83 700 68 970 Ferro-vanadium tonnes 457 146 266 333 387 Other ferro-alloys tonnes 5 255 4 206 1 548 2 998 1 726 Silicon metal tonnes 845 1 390 1 674 2 161 1 425 Ingots, blooms, billets tonnes 490 919 846 908 618 682 360 816 715 244 Scrap tonnes 1 334 069 1 838 699 1 955 438 1 946 832 2 041 162 Kaolin tonnes 9 781 13 591 12 366 10 173 11 749 Lead Ores and concentrates tonnes 35 459 30 132 60 549 56 766 75 580 Unwrought tonnes 43 945 59 599 62 941 62 616 88 648 Scrap tonnes 1 668 1 010 1 392 1 282 1 304 Magnesite and magnesia Magnesia tonnes 1 013 550 3 303 5 873 6 066 Manganese Metal tonnes 2 875 41 97 198 313 Mercury kilograms 106 100 7 300 — — — Nickel Mattes, sinters etc tonnes 1 134 — — 28 2 Unwrought tonnes (a) 1 876 (a) 252 (a) 917 2 617 (a) 3 303 Scrap tonnes 416 749 709 319 369

98
Poland Exports continued
Commodity Units 2010 2011 2012 2013 2014
Crude petroleum tonnes 3 186 730 211 223 402 670 420 124 Phosphate rock tonnes 43 434 226 1 284 909 Platinum metals Platinum and platinum metals kilograms 1 100 2 400 400 900 900 Waste and scrap kilograms 300 3 400 63 900 425 200 538 900 Potash Potassic fertilisers tonnes 10 687 10 078 3 999 15 678 27 845 Rare earths Cerium compounds tonnes 7 86 1 9 20 Other rare earth compounds tonnes 4 66 3 4 5 Salt tonnes 572 595 515 723 393 235 625 660 307 444 Silver Metal kilograms 1 281 800 1 328 900 1 378 800 1 245 000 1 436 700 Sulphur and pyrites Sulphur tonnes 402 102 394 861 506 641 406 030 506 889 Sulphur, sublimed and precipitated tonnes 34 752 26 542 29 757 500 42 324 Talc tonnes 869 744 830 825 520 Tin Unwrought (a) tonnes 408 536 533 558 686 Titanium Metal tonnes 76 90 47 47 459 Oxides tonnes 20 996 23 401 20 201 20 329 14 517 Tungsten Ores and concentrates tonnes ... 314 ... 41 — Metal tonnes 154 179 89 348 304 Zinc Ores and concentrates tonnes 4 213 0 0 3 2 Unwrought tonnes 96 142 105 552 105 929 128 521 181 437 Unwrought alloys tonnes 6 280 6 939 6 541 9 137 13 607 Scrap tonnes 902 960 533 570 1 570
Note(s) (a) Including alloys
Imports Commodity Units 2010 2011 2012 2013 2014
Primary aggregates tonnes 5 014 564 9 022 494 5 766 695 3 143 654 3 680 582 Aluminium and bauxite Bauxite tonnes 48 664 45 672 51 430 46 961 44 237 Alumina tonnes 29 920 34 691 35 709 34 969 40 087 Alumina hydrate tonnes 31 406 26 536 25 912 28 557 27 653 Unwrought tonnes 125 567 125 147 112 325 99 308 86 261 Unwrought alloys tonnes 192 393 232 859 245 491 254 479 333 092 Scrap tonnes 84 622 98 484 108 168 175 534 206 825 Antimony Ores and concentrates tonnes 54 10 34 44 110 Metal tonnes 47 68 62 115 93 Oxide tonnes 1 044 1 026 949 841 922 Arsenic Metallic arsenic tonnes 42 45 44 39 25 Barytes Barium minerals tonnes 11 758 15 723 21 567 11 154 14 600 Bentonite tonnes 155 173 212 585 233 200 212 103 201 653 Bismuth Metal tonnes 34 23 24 33 31 Bromine kilograms 17 200 11 200 66 300 35 300 4 100 Cement Cement clinkers tonnes 100 352 19 900 7 873 11 334 26 189 Portland cement tonnes 565 893 932 507 695 629 659 111 763 618 Other cement tonnes 26 247 25 467 21 027 108 490 75 243

99
Poland
Imports continued
Commodity Units 2010 2011 2012 2013 2014
Chromium Ores and concentrates tonnes 15 672 30 863 27 723 30 554 26 625 Metal tonnes 2 692 4 530 76 416 256 Coal Anthracite tonnes 583 158 582 605 407 120 384 053 318 430 Other coal tonnes 13 127 065 14 090 331 9 652 129 10 434 564 10 005 485 Lignite tonnes 35 973 67 550 134 135 221 819 204 790 Briquettes tonnes 60 548 60 758 53 873 57 782 94 283 Cobalt Metal tonnes 52 47 52 48 73 Oxides tonnes 18 114 17 20 25 Copper Ores and concentrates tonnes 38 000 45 484 41 333 112 568 160 562 Unwrought, unrefined tonnes 33 717 23 581 22 766 17 481 13 833 Unwrought, refined tonnes 26 944 11 822 19 234 17 078 8 498 Unwrought alloys tonnes 2 813 2 939 4 229 2 693 2 718 Scrap tonnes 24 316 26 201 53 828 49 205 63 996 Diamond Unsorted Carats £208 000 £24 000 £289 000 £22 000 £286 000 Gem, cut Carats £2 128 000 £3 805 000 £2 532 000 £3 111 000 £4 680 000 Dust Carats £179 000 £273 000 £376 000 £388 000 £273 000 Diatomite tonnes 6 753 9 365 7 802 6 980 6 068 Feldspar tonnes 243 645 324 426 287 882 288 728 272 111 Fluorspar tonnes 11 013 12 239 11 747 9 106 10 698 Gold Metal kilograms 200 1 500 1 800 1 900 1 200 Graphite tonnes 6 933 10 267 6 833 7 317 7 742 Gypsum Crude tonnes 129 336 134 230 122 407 20 267 20 374 Calcined tonnes 53 613 47 261 39 845 43 204 50 895 Iodine kilograms 21 700 11 600 12 900 21 800 9 200 Iron ore tonnes 6 494 457 5 977 338 6 576 287 6 640 058 7 438 720 Iron, steel and ferro-alloys Pig iron tonnes 176 145 228 357 200 340 157 826 172 215 Sponge and powder tonnes 7 594 14 597 7 336 8 430 7 149 Ferro-chrome tonnes 7 785 8 042 9 413 19 247 27 396 Ferro-silico-magnesium tonnes 3 402 2 326 1 752 1 352 1 696 Ferro-manganese tonnes 30 721 45 192 31 083 64 426 45 459 Ferro-silico-manganese tonnes 56 882 65 816 60 667 71 356 114 736 Ferro-molybdenum tonnes 612 547 470 1 316 1 333 Ferro-nickel tonnes 4 ... 207 9 419 Ferro-niobium tonnes 395 279 379 278 316 Ferro-phosphorus tonnes 917 1 253 1 183 850 760 Ferro-silicon tonnes 21 576 18 457 15 818 23 324 28 620 Ferro-titanium and ferro-silico-titanium tonnes 194 259 291 291 276 Ferro-vanadium tonnes 370 10 447 621 828 Other ferro-alloys tonnes 4 351 5 856 6 451 4 766 6 093 Silicon metal tonnes 16 219 17 091 17 754 22 669 24 818 Ingots, blooms, billets tonnes 119 466 370 144 575 506 603 525 400 640 Scrap tonnes 374 076 409 454 383 472 510 652 485 705 Kaolin tonnes 117 914 143 476 138 026 146 430 135 599 Lead Unwrought tonnes 46 810 52 011 42 108 44 237 51 216 Scrap tonnes 7 154 6 673 4 980 10 330 11 539 Lithium Oxides tonnes 86 114 141 100 137 Carbonate tonnes 175 177 177 165 186 Magnesite and magnesia Magnesite tonnes 3 966 1 375 1 948 659 590 Magnesia tonnes 113 757 137 148 116 632 103 475 125 579 Manganese Ores and concentrates tonnes 4 345 4 509 4 951 5 459 52 330 Metal tonnes 1 514 436 764 1 030 1 378 Mercury kilograms 4 300 39 900 13 700 31 300 50 900 Mica tonnes 1 150 2 019 1 504 1 459 1 711
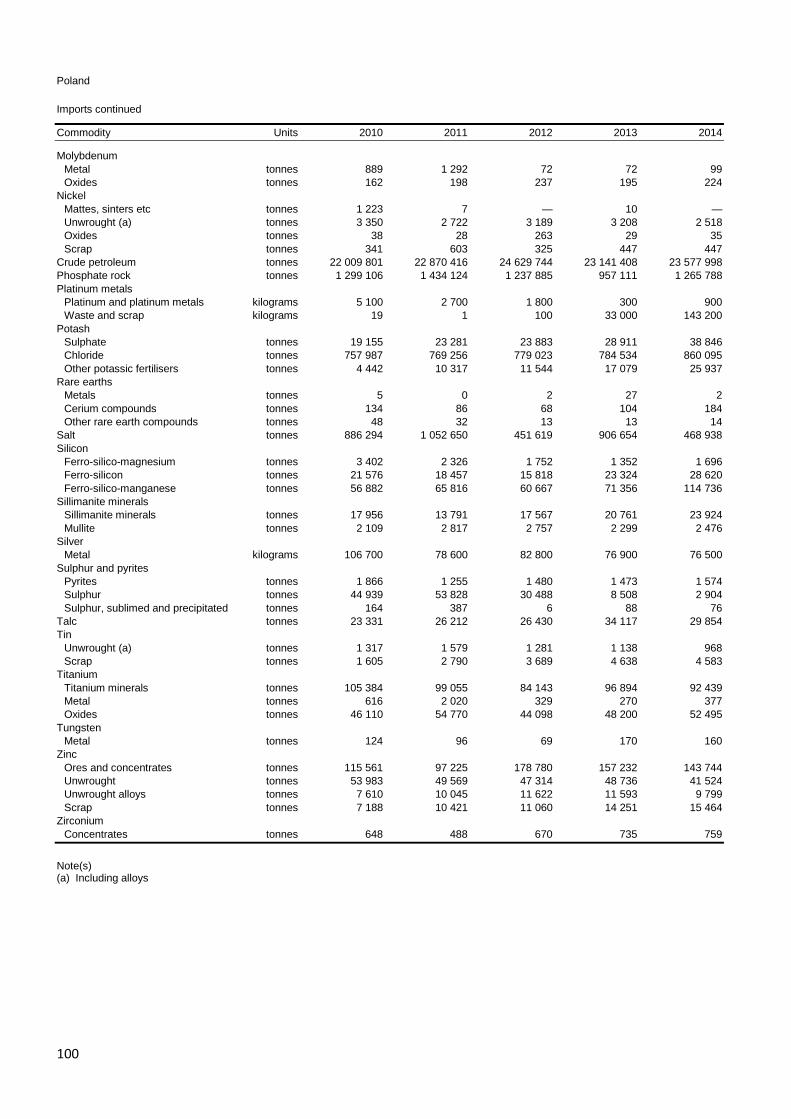
100
Poland
Imports continued
Commodity Units 2010 2011 2012 2013 2014
Molybdenum Metal tonnes 889 1 292 72 72 99 Oxides tonnes 162 198 237 195 224 Nickel Mattes, sinters etc tonnes 1 223 7 — 10 — Unwrought (a) tonnes 3 350 2 722 3 189 3 208 2 518 Oxides tonnes 38 28 263 29 35 Scrap tonnes 341 603 325 447 447 Crude petroleum tonnes 22 009 801 22 870 416 24 629 744 23 141 408 23 577 998 Phosphate rock tonnes 1 299 106 1 434 124 1 237 885 957 111 1 265 788 Platinum metals Platinum and platinum metals kilograms 5 100 2 700 1 800 300 900 Waste and scrap kilograms 19 1 100 33 000 143 200 Potash Sulphate tonnes 19 155 23 281 23 883 28 911 38 846 Chloride tonnes 757 987 769 256 779 023 784 534 860 095 Other potassic fertilisers tonnes 4 442 10 317 11 544 17 079 25 937 Rare earths Metals tonnes 5 0 2 27 2 Cerium compounds tonnes 134 86 68 104 184 Other rare earth compounds tonnes 48 32 13 13 14 Salt tonnes 886 294 1 052 650 451 619 906 654 468 938 Silicon Ferro-silico-magnesium tonnes 3 402 2 326 1 752 1 352 1 696 Ferro-silicon tonnes 21 576 18 457 15 818 23 324 28 620 Ferro-silico-manganese tonnes 56 882 65 816 60 667 71 356 114 736 Sillimanite minerals Sillimanite minerals tonnes 17 956 13 791 17 567 20 761 23 924 Mullite tonnes 2 109 2 817 2 757 2 299 2 476 Silver Metal kilograms 106 700 78 600 82 800 76 900 76 500 Sulphur and pyrites Pyrites tonnes 1 866 1 255 1 480 1 473 1 574 Sulphur tonnes 44 939 53 828 30 488 8 508 2 904 Sulphur, sublimed and precipitated tonnes 164 387 6 88 76 Talc tonnes 23 331 26 212 26 430 34 117 29 854 Tin Unwrought (a) tonnes 1 317 1 579 1 281 1 138 968 Scrap tonnes 1 605 2 790 3 689 4 638 4 583 Titanium Titanium minerals tonnes 105 384 99 055 84 143 96 894 92 439 Metal tonnes 616 2 020 329 270 377 Oxides tonnes 46 110 54 770 44 098 48 200 52 495 Tungsten Metal tonnes 124 96 69 170 160 Zinc Ores and concentrates tonnes 115 561 97 225 178 780 157 232 143 744 Unwrought tonnes 53 983 49 569 47 314 48 736 41 524 Unwrought alloys tonnes 7 610 10 045 11 622 11 593 9 799 Scrap tonnes 7 188 10 421 11 060 14 251 15 464 Zirconium Concentrates tonnes 648 488 670 735 759
Note(s) (a) Including alloys
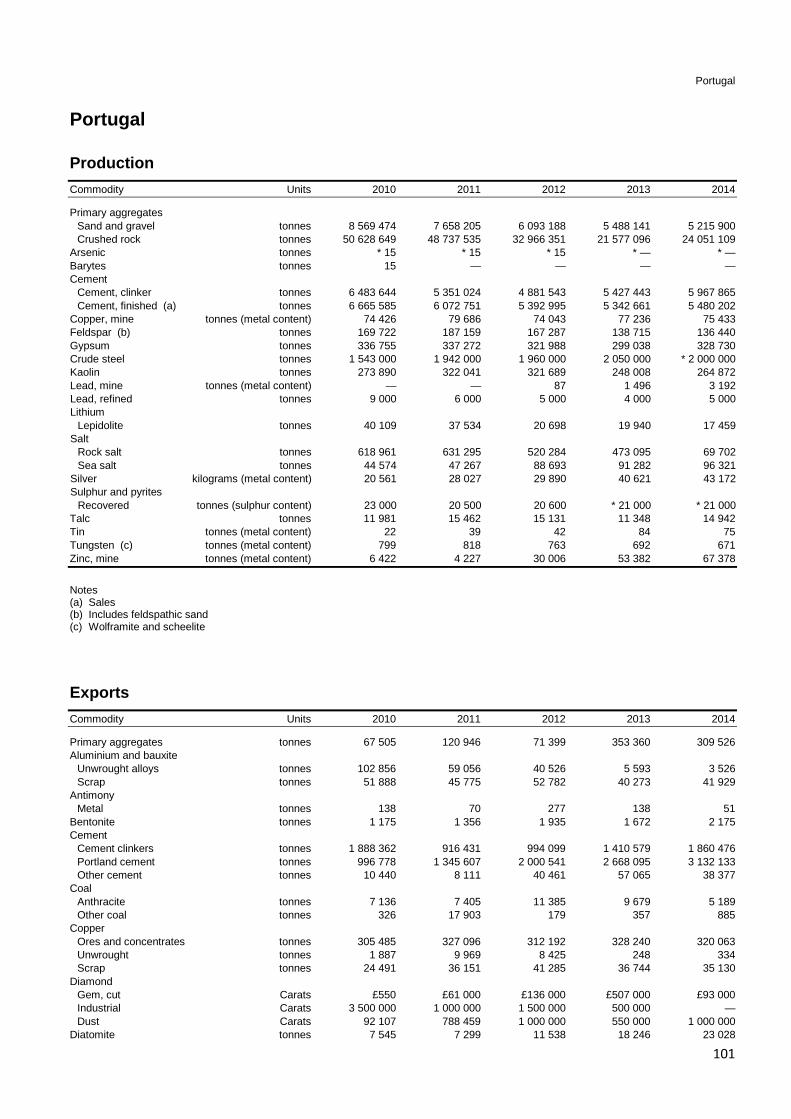
101
Portugal
Portugal
Production Commodity Units 2010 2011 2012 2013 2014
Primary aggregates Sand and gravel tonnes 8 569 474 7 658 205 6 093 188 5 488 141 5 215 900 Crushed rock tonnes 50 628 649 48 737 535 32 966 351 21 577 096 24 051 109 Arsenic tonnes * 15 * 15 * 15 * — * — Barytes tonnes 15 — — — — Cement Cement, clinker tonnes 6 483 644 5 351 024 4 881 543 5 427 443 5 967 865 Cement, finished (a) tonnes 6 665 585 6 072 751 5 392 995 5 342 661 5 480 202 Copper, mine tonnes (metal content) 74 426 79 686 74 043 77 236 75 433 Feldspar (b) tonnes 169 722 187 159 167 287 138 715 136 440 Gypsum tonnes 336 755 337 272 321 988 299 038 328 730 Crude steel tonnes 1 543 000 1 942 000 1 960 000 2 050 000 * 2 000 000 Kaolin tonnes 273 890 322 041 321 689 248 008 264 872 Lead, mine tonnes (metal content) — — 87 1 496 3 192 Lead, refined tonnes 9 000 6 000 5 000 4 000 5 000 Lithium Lepidolite tonnes 40 109 37 534 20 698 19 940 17 459 Salt Rock salt tonnes 618 961 631 295 520 284 473 095 69 702 Sea salt tonnes 44 574 47 267 88 693 91 282 96 321 Silver kilograms (metal content) 20 561 28 027 29 890 40 621 43 172 Sulphur and pyrites Recovered tonnes (sulphur content) 23 000 20 500 20 600 * 21 000 * 21 000 Talc tonnes 11 981 15 462 15 131 11 348 14 942 Tin tonnes (metal content) 22 39 42 84 75 Tungsten (c) tonnes (metal content) 799 818 763 692 671 Zinc, mine tonnes (metal content) 6 422 4 227 30 006 53 382 67 378
Notes (a) Sales (b) Includes feldspathic sand (c) Wolframite and scheelite
Exports Commodity Units 2010 2011 2012 2013 2014
Primary aggregates tonnes 67 505 120 946 71 399 353 360 309 526 Aluminium and bauxite Unwrought alloys tonnes 102 856 59 056 40 526 5 593 3 526 Scrap tonnes 51 888 45 775 52 782 40 273 41 929 Antimony Metal tonnes 138 70 277 138 51 Bentonite tonnes 1 175 1 356 1 935 1 672 2 175 Cement Cement clinkers tonnes 1 888 362 916 431 994 099 1 410 579 1 860 476 Portland cement tonnes 996 778 1 345 607 2 000 541 2 668 095 3 132 133 Other cement tonnes 10 440 8 111 40 461 57 065 38 377 Coal Anthracite tonnes 7 136 7 405 11 385 9 679 5 189 Other coal tonnes 326 17 903 179 357 885 Copper Ores and concentrates tonnes 305 485 327 096 312 192 328 240 320 063 Unwrought tonnes 1 887 9 969 8 425 248 334 Scrap tonnes 24 491 36 151 41 285 36 744 35 130 Diamond Gem, cut Carats £550 £61 000 £136 000 £507 000 £93 000 Industrial Carats 3 500 000 1 000 000 1 500 000 500 000 — Dust Carats 92 107 788 459 1 000 000 550 000 1 000 000 Diatomite tonnes 7 545 7 299 11 538 18 246 23 028
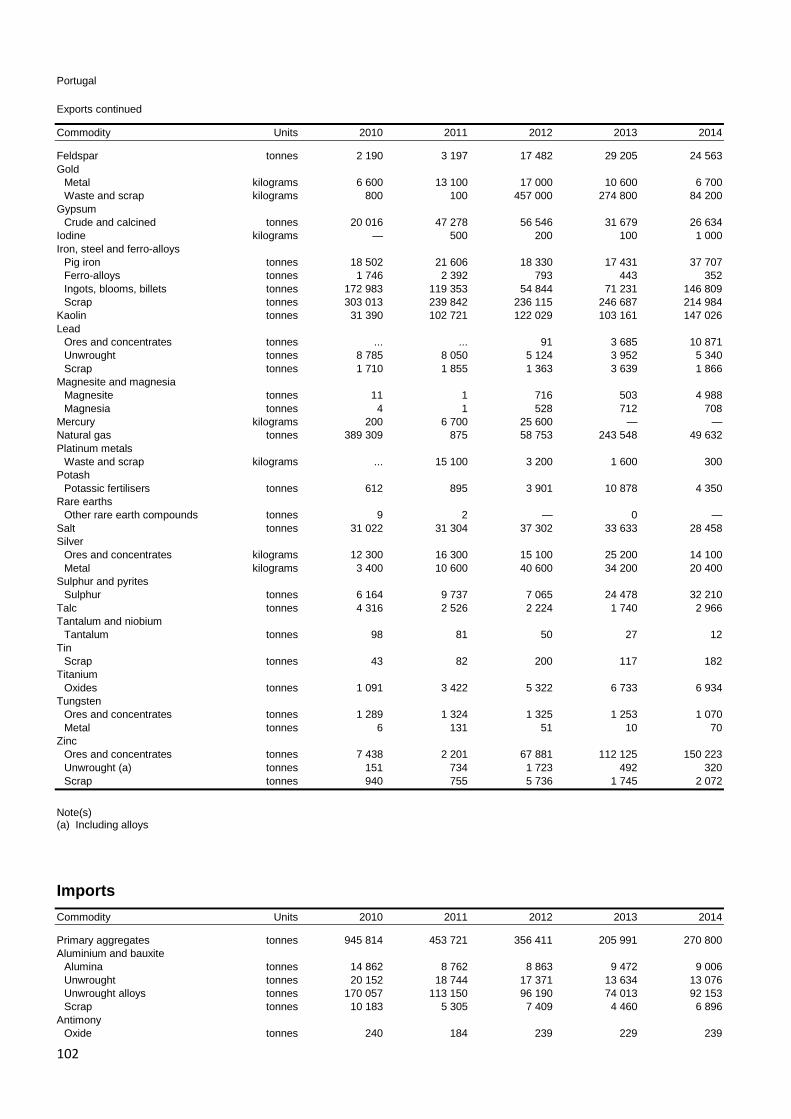
102
Portugal
Exports continued
Commodity Units 2010 2011 2012 2013 2014
Feldspar tonnes 2 190 3 197 17 482 29 205 24 563 Gold Metal kilograms 6 600 13 100 17 000 10 600 6 700 Waste and scrap kilograms 800 100 457 000 274 800 84 200 Gypsum Crude and calcined tonnes 20 016 47 278 56 546 31 679 26 634 Iodine kilograms — 500 200 100 1 000 Iron, steel and ferro-alloys Pig iron tonnes 18 502 21 606 18 330 17 431 37 707 Ferro-alloys tonnes 1 746 2 392 793 443 352 Ingots, blooms, billets tonnes 172 983 119 353 54 844 71 231 146 809 Scrap tonnes 303 013 239 842 236 115 246 687 214 984 Kaolin tonnes 31 390 102 721 122 029 103 161 147 026 Lead Ores and concentrates tonnes ... ... 91 3 685 10 871 Unwrought tonnes 8 785 8 050 5 124 3 952 5 340 Scrap tonnes 1 710 1 855 1 363 3 639 1 866 Magnesite and magnesia Magnesite tonnes 11 1 716 503 4 988 Magnesia tonnes 4 1 528 712 708 Mercury kilograms 200 6 700 25 600 — — Natural gas tonnes 389 309 875 58 753 243 548 49 632 Platinum metals Waste and scrap kilograms ... 15 100 3 200 1 600 300 Potash Potassic fertilisers tonnes 612 895 3 901 10 878 4 350 Rare earths Other rare earth compounds tonnes 9 2 — 0 — Salt tonnes 31 022 31 304 37 302 33 633 28 458 Silver Ores and concentrates kilograms 12 300 16 300 15 100 25 200 14 100 Metal kilograms 3 400 10 600 40 600 34 200 20 400 Sulphur and pyrites Sulphur tonnes 6 164 9 737 7 065 24 478 32 210 Talc tonnes 4 316 2 526 2 224 1 740 2 966 Tantalum and niobium Tantalum tonnes 98 81 50 27 12 Tin Scrap tonnes 43 82 200 117 182 Titanium Oxides tonnes 1 091 3 422 5 322 6 733 6 934 Tungsten Ores and concentrates tonnes 1 289 1 324 1 325 1 253 1 070 Metal tonnes 6 131 51 10 70 Zinc Ores and concentrates tonnes 7 438 2 201 67 881 112 125 150 223 Unwrought (a) tonnes 151 734 1 723 492 320 Scrap tonnes 940 755 5 736 1 745 2 072
Note(s) (a) Including alloys
Imports Commodity Units 2010 2011 2012 2013 2014
Primary aggregates tonnes 945 814 453 721 356 411 205 991 270 800 Aluminium and bauxite Alumina tonnes 14 862 8 762 8 863 9 472 9 006 Unwrought tonnes 20 152 18 744 17 371 13 634 13 076 Unwrought alloys tonnes 170 057 113 150 96 190 74 013 92 153 Scrap tonnes 10 183 5 305 7 409 4 460 6 896 Antimony Oxide tonnes 240 184 239 229 239

103
Portugal
Imports continued
Commodity Units 2010 2011 2012 2013 2014
Barytes Barium minerals tonnes 4 448 2 509 2 286 2 985 3 640 Bentonite tonnes 18 205 23 436 26 466 21 319 29 840 Cement Cement clinkers tonnes 34 216 5 037 3 930 1 044 224 Portland cement tonnes 238 605 238 605 220 968 308 064 374 506 Other cement tonnes 8 557 8 067 7 795 6 749 2 579 Chromium Ores and concentrates tonnes 2 108 2 727 2 639 2 206 2 529 Coal Anthracite tonnes 21 454 30 860 42 657 32 258 11 883 Other coal tonnes 2 648 704 3 592 502 4 999 817 4 182 028 4 419 070 Copper Unwrought tonnes 5 534 4 725 4 688 5 613 7 613 Scrap tonnes 8 819 7 973 5 169 6 797 8 104 Unwrought alloys tonnes 4 127 4 378 3 993 3 445 3 999 Diamond Gem, cut Carats £2 039 000 £3 732 000 £2 532 000 £2 414 000 £2 246 000 Industrial Carats £111 000 £122 000 £86 000 £65 000 £21 000 Dust Carats 9 509 385 10 215 655 5 245 000 4 775 000 8 930 000 Diatomite tonnes 2 284 2 340 2 242 2 702 2 840 Feldspar tonnes 63 675 49 902 61 516 79 625 80 517 Fluorspar tonnes 1 384 2 350 3 234 3 291 2 894 Gold Metal kilograms 1 500 1 200 800 700 1 500 Waste and scrap kilograms ... 49 685 18 835 19 509 55 945 Gypsum Crude tonnes 73 822 40 153 28 175 44 712 34 852 Calcined tonnes 270 783 237 788 167 437 133 151 123 507 Iodine kilograms 8 700 8 600 6 300 10 800 19 100 Iron, steel and ferro-alloys Pig iron tonnes 10 623 4 980 1 895 3 230 3 645 Sponge and powder tonnes 6 919 37 376 27 383 30 100 578 Ferro-chrome tonnes 810 683 617 770 960 Ferro-silico-magnesium tonnes 1 475 470 79 21 5 Ferro-manganese tonnes 856 722 683 593 623 Ferro-silico-manganese tonnes 4 396 9 877 15 041 13 097 9 481 Ferro-silicon tonnes 2 902 3 408 3 130 2 240 3 803 Other ferro-alloys tonnes 657 2 611 4 500 2 868 3 856 Silicon metal tonnes 753 950 1 182 606 770 Ingots, blooms, billets tonnes 28 583 33 675 33 266 31 844 35 388 Scrap tonnes 672 856 616 063 1 165 785 1 409 187 1 526 817 Kaolin tonnes 96 851 106 955 103 863 97 034 155 804 Lead Unwrought tonnes 5 593 9 403 8 661 13 630 13 263 Scrap tonnes 395 266 1 113 5 026 953 Magnesite and magnesia Magnesite tonnes 1 162 1 379 1 249 1 652 801 Magnesia tonnes 4 504 5 523 7 130 9 037 9 406 Manganese Ores and concentrates tonnes 68 56 168 38 205 Mercury kilograms 152 900 125 400 59 18 30 Mica tonnes 284 288 258 263 219 Nickel Unwrought tonnes 312 221 285 405 327 Crude petroleum tonnes 11 251 958 10 152 747 11 456 025 11 600 330 11 149 051 Natural gas tonnes 3 849 819 3 543 064 3 231 198 3 456 751 3 109 506 Phosphate rock tonnes 93 348 91 703 105 186 73 503 105 798 Platinum metals Platinum and platinum metals kilograms 796 245 * 800 * 900 205 Waste and scrap kilograms ... ... — 3 600 28 600 Potash Sulphate tonnes 3 840 4 405 10 798 27 020 10 290 Chloride tonnes 50 687 65 352 82 364 64 943 73 749 Other potassic fertilisers tonnes 1 899 2 596 5 395 8 477 3 952

104
Portugal
Imports continued
Commodity Units 2010 2011 2012 2013 2014
Rare earths Metals tonnes 1 87 — 1 1 Cerium compounds tonnes 7 8 7 6 1 Other rare earth compounds tonnes 5 18 3 3 3 Salt tonnes 172 107 144 688 182 585 149 922 227 884 Sillimanite minerals tonnes 466 641 2 241 794 962 Silver Metal kilograms 66 900 38 700 22 200 37 300 31 700 Sulphur and pyrites Sulphur tonnes 4 861 3 981 2 726 2 367 2 007 Talc tonnes 24 143 22 388 11 746 14 043 17 819 Tantalum and niobium Tantalum tonnes 41 44 33 23 6 Tin Unwrought tonnes 317 560 435 510 503 Unwrought alloys tonnes 100 19 13 23 52 Titanium Titanium minerals tonnes 714 807 429 517 885 Metal tonnes 26 28 38 32 95 Oxides tonnes 20 486 19 813 14 788 23 016 24 277 Tungsten Metal tonnes 277 206 151 147 70 Carbide tonnes 110 106 79 93 76 Zinc Unwrought tonnes 15 757 13 299 11 135 10 471 8 692 Unwrought alloys tonnes 4 522 3 967 4 601 6 084 6 585 Zirconium Concentrates tonnes 5 475 4 048 2 386 2 574 3 555
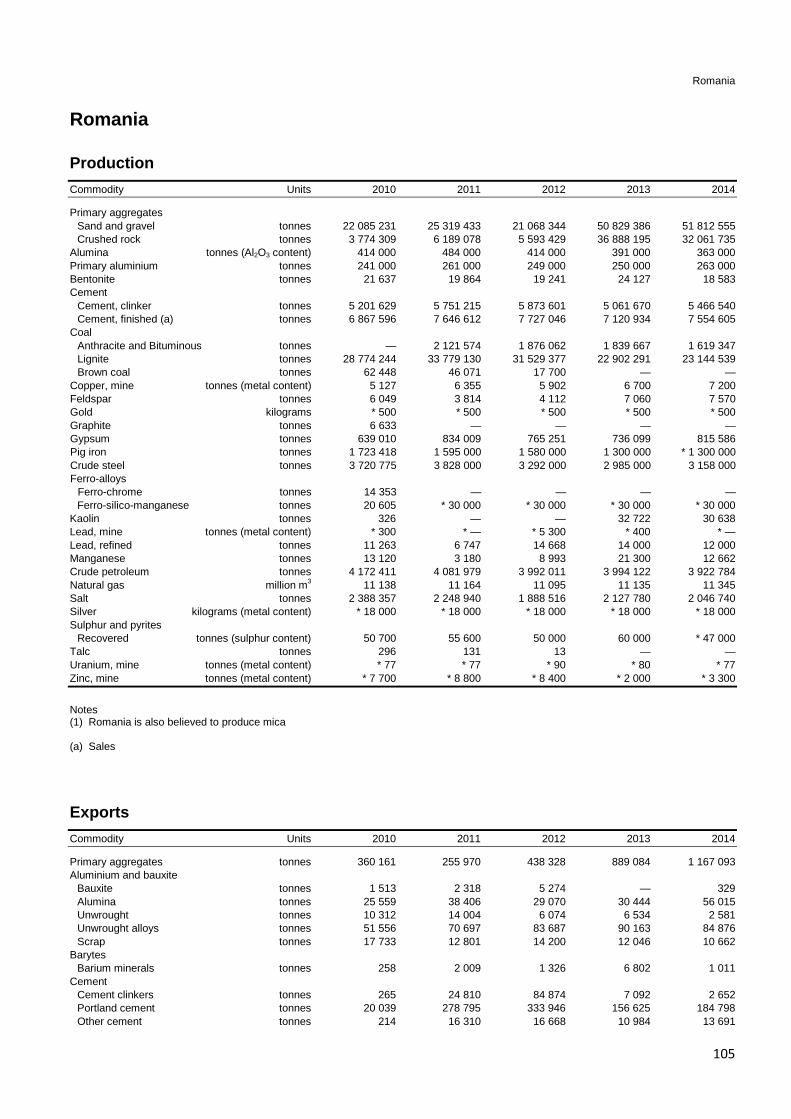
105
Romania
Romania
Production Commodity Units 2010 2011 2012 2013 2014
Primary aggregates Sand and gravel tonnes 22 085 231 25 319 433 21 068 344 50 829 386 51 812 555 Crushed rock tonnes 3 774 309 6 189 078 5 593 429 36 888 195 32 061 735 Alumina tonnes (Al2O3 content) 414 000 484 000 414 000 391 000 363 000 Primary aluminium tonnes 241 000 261 000 249 000 250 000 263 000 Bentonite tonnes 21 637 19 864 19 241 24 127 18 583 Cement Cement, clinker tonnes 5 201 629 5 751 215 5 873 601 5 061 670 5 466 540 Cement, finished (a) tonnes 6 867 596 7 646 612 7 727 046 7 120 934 7 554 605 Coal Anthracite and Bituminous tonnes — 2 121 574 1 876 062 1 839 667 1 619 347 Lignite tonnes 28 774 244 33 779 130 31 529 377 22 902 291 23 144 539 Brown coal tonnes 62 448 46 071 17 700 — — Copper, mine tonnes (metal content) 5 127 6 355 5 902 6 700 7 200 Feldspar tonnes 6 049 3 814 4 112 7 060 7 570 Gold kilograms * 500 * 500 * 500 * 500 * 500 Graphite tonnes 6 633 — — — — Gypsum tonnes 639 010 834 009 765 251 736 099 815 586 Pig iron tonnes 1 723 418 1 595 000 1 580 000 1 300 000 * 1 300 000 Crude steel tonnes 3 720 775 3 828 000 3 292 000 2 985 000 3 158 000 Ferro-alloys Ferro-chrome tonnes 14 353 — — — — Ferro-silico-manganese tonnes 20 605 * 30 000 * 30 000 * 30 000 * 30 000 Kaolin tonnes 326 — — 32 722 30 638 Lead, mine tonnes (metal content) * 300 * — * 5 300 * 400 * — Lead, refined tonnes 11 263 6 747 14 668 14 000 12 000 Manganese tonnes 13 120 3 180 8 993 21 300 12 662 Crude petroleum tonnes 4 172 411 4 081 979 3 992 011 3 994 122 3 922 784 Natural gas million m3 11 138 11 164 11 095 11 135 11 345 Salt tonnes 2 388 357 2 248 940 1 888 516 2 127 780 2 046 740 Silver kilograms (metal content) * 18 000 * 18 000 * 18 000 * 18 000 * 18 000 Sulphur and pyrites Recovered tonnes (sulphur content) 50 700 55 600 50 000 60 000 * 47 000 Talc tonnes 296 131 13 — — Uranium, mine tonnes (metal content) * 77 * 77 * 90 * 80 * 77 Zinc, mine tonnes (metal content) * 7 700 * 8 800 * 8 400 * 2 000 * 3 300
Notes (1) Romania is also believed to produce mica (a) Sales
Exports Commodity Units 2010 2011 2012 2013 2014
Primary aggregates tonnes 360 161 255 970 438 328 889 084 1 167 093 Aluminium and bauxite Bauxite tonnes 1 513 2 318 5 274 — 329 Alumina tonnes 25 559 38 406 29 070 30 444 56 015 Unwrought tonnes 10 312 14 004 6 074 6 534 2 581 Unwrought alloys tonnes 51 556 70 697 83 687 90 163 84 876 Scrap tonnes 17 733 12 801 14 200 12 046 10 662 Barytes Barium minerals tonnes 258 2 009 1 326 6 802 1 011 Cement Cement clinkers tonnes 265 24 810 84 874 7 092 2 652 Portland cement tonnes 20 039 278 795 333 946 156 625 184 798 Other cement tonnes 214 16 310 16 668 10 984 13 691
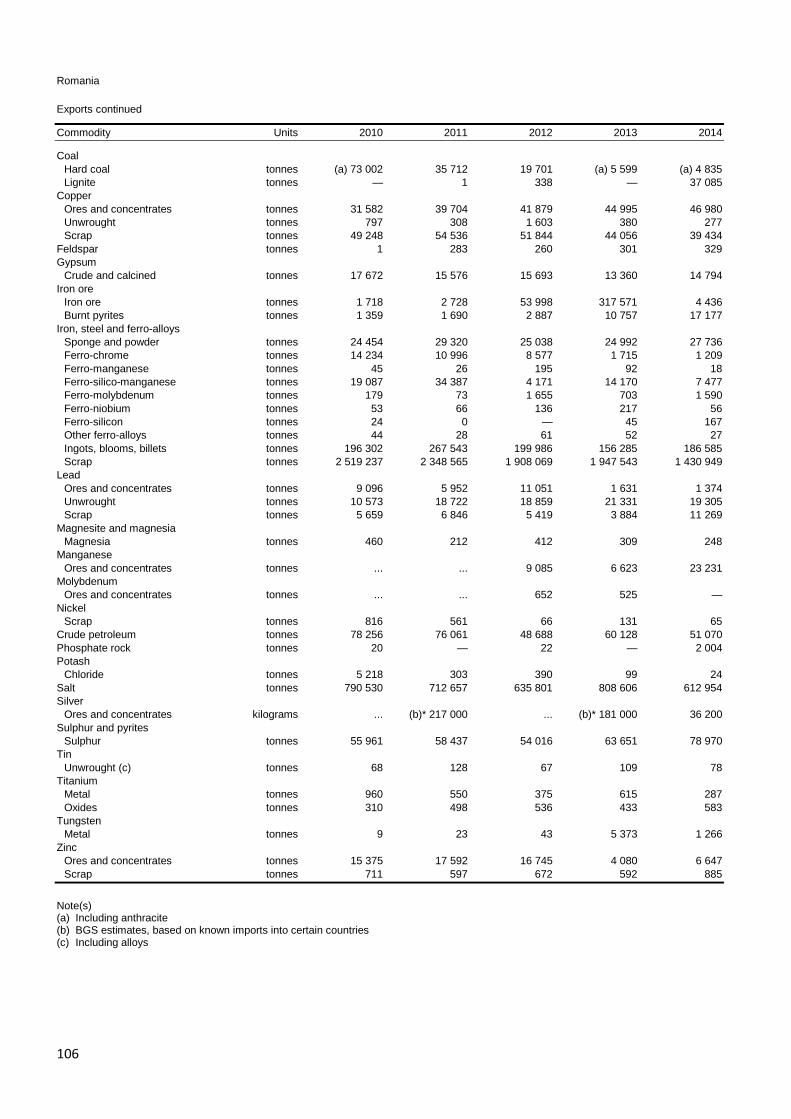
106
Romania
Exports continued
Commodity Units 2010 2011 2012 2013 2014
Coal Hard coal tonnes (a) 73 002 35 712 19 701 (a) 5 599 (a) 4 835 Lignite tonnes — 1 338 — 37 085 Copper Ores and concentrates tonnes 31 582 39 704 41 879 44 995 46 980 Unwrought tonnes 797 308 1 603 380 277 Scrap tonnes 49 248 54 536 51 844 44 056 39 434 Feldspar tonnes 1 283 260 301 329 Gypsum Crude and calcined tonnes 17 672 15 576 15 693 13 360 14 794 Iron ore Iron ore tonnes 1 718 2 728 53 998 317 571 4 436 Burnt pyrites tonnes 1 359 1 690 2 887 10 757 17 177 Iron, steel and ferro-alloys Sponge and powder tonnes 24 454 29 320 25 038 24 992 27 736 Ferro-chrome tonnes 14 234 10 996 8 577 1 715 1 209 Ferro-manganese tonnes 45 26 195 92 18 Ferro-silico-manganese tonnes 19 087 34 387 4 171 14 170 7 477 Ferro-molybdenum tonnes 179 73 1 655 703 1 590 Ferro-niobium tonnes 53 66 136 217 56 Ferro-silicon tonnes 24 0 — 45 167 Other ferro-alloys tonnes 44 28 61 52 27 Ingots, blooms, billets tonnes 196 302 267 543 199 986 156 285 186 585 Scrap tonnes 2 519 237 2 348 565 1 908 069 1 947 543 1 430 949 Lead Ores and concentrates tonnes 9 096 5 952 11 051 1 631 1 374 Unwrought tonnes 10 573 18 722 18 859 21 331 19 305 Scrap tonnes 5 659 6 846 5 419 3 884 11 269 Magnesite and magnesia Magnesia tonnes 460 212 412 309 248 Manganese Ores and concentrates tonnes ... ... 9 085 6 623 23 231 Molybdenum Ores and concentrates tonnes ... ... 652 525 — Nickel Scrap tonnes 816 561 66 131 65 Crude petroleum tonnes 78 256 76 061 48 688 60 128 51 070 Phosphate rock tonnes 20 — 22 — 2 004 Potash Chloride tonnes 5 218 303 390 99 24 Salt tonnes 790 530 712 657 635 801 808 606 612 954 Silver Ores and concentrates kilograms ... (b)* 217 000 ... (b)* 181 000 36 200 Sulphur and pyrites Sulphur tonnes 55 961 58 437 54 016 63 651 78 970 Tin Unwrought (c) tonnes 68 128 67 109 78 Titanium Metal tonnes 960 550 375 615 287 Oxides tonnes 310 498 536 433 583 Tungsten Metal tonnes 9 23 43 5 373 1 266 Zinc Ores and concentrates tonnes 15 375 17 592 16 745 4 080 6 647 Scrap tonnes 711 597 672 592 885
Note(s) (a) Including anthracite (b) BGS estimates, based on known imports into certain countries (c) Including alloys

107
Romania Imports Commodity Units 2010 2011 2012 2013 2014
Primary aggregates tonnes 248 484 370 249 512 538 331 523 256 239 Aluminium and bauxite Bauxite tonnes 1 277 587 1 271 274 1 297 303 1 064 823 1 162 356 Alumina tonnes 1 928 15 037 2 554 22 819 86 791 Alumina hydrate tonnes 10 412 5 768 2 841 537 1 001 Unwrought tonnes 2 163 3 024 2 751 10 877 13 824 Unwrought alloys tonnes 33 711 24 287 26 311 31 608 50 854 Scrap tonnes 83 381 62 768 66 878 92 702 83 977 Antimony Metal tonnes 61 43 9 55 18 Oxide tonnes 88 120 163 138 183 Arsenic Metallic arsenic tonnes 2 5 7 8 16 Asbestos Unmanufactured tonnes — ... 3 27 103 Barytes Barium minerals tonnes 8 501 15 598 16 874 23 859 20 836 Bentonite tonnes 4 825 6 341 8 463 8 787 7 789 Cement Cement clinkers tonnes 75 812 144 547 144 116 216 322 207 700 Portland cement tonnes 307 977 239 373 240 469 208 701 196 179 Other cement tonnes 22 004 21 297 18 626 14 882 19 494 Chromium Ores and concentrates tonnes 7 054 1 637 2 288 1 514 1 990 Metal tonnes 16 105 50 151 161 Coal Anthracite tonnes 72 776 148 260 137 388 143 627 131 807 Other coal tonnes 936 727 840 669 1 142 615 785 892 563 641 Lignite tonnes 718 1 706 3 492 2 611 387 705 Briquettes tonnes 96 428 197 197 511 128 Cobalt Oxides tonnes 41 79 27 32 25 Copper Unwrought tonnes 2 282 2 915 1 899 1 997 2 169 Scrap tonnes 2 443 3 218 2 355 6 279 2 098 Diatomite tonnes 2 269 2 459 1 827 2 583 2 046 Feldspar tonnes 36 924 45 421 47 688 39 447 41 451 Fluorspar tonnes 2 911 3 817 3 178 1 475 1 880 Graphite tonnes 204 742 601 182 210 Gypsum Crude tonnes 40 703 63 658 92 883 54 106 53 982 Calcined tonnes 47 912 50 866 43 118 36 964 61 892 Iodine kilograms 300 500 400 2 500 600 Iron ore Iron ore tonnes 2 848 921 2 186 674 2 023 063 2 545 657 2 225 618 Burnt pyrites tonnes 29 544 35 551 30 178 17 263 16 569 Iron, steel and ferro-alloys Pig iron tonnes 111 702 48 365 58 954 35 635 11 244 Sponge and powder tonnes 2 740 22 355 1 777 2 551 4 772 Ferro-chrome tonnes 1 500 2 856 2 564 1 911 2 803 Ferro-silico-magnesium tonnes 49 25 104 92 7 Ferro-manganese tonnes 15 530 18 136 21 039 19 489 21 826 Ferro-silico-manganese tonnes 19 151 24 215 19 093 10 013 17 029 Ferro-molybdenum tonnes 274 315 420 365 352 Ferro-niobium tonnes 55 132 177 172 116 Ferro-phosphorus tonnes 217 154 119 135 27 Ferro-silicon tonnes 9 859 9 602 10 392 8 149 7 881 Ferro-titanium and ferro-silico-titanium tonnes 183 412 284 250 209 Ferro-vanadium tonnes 153 166 166 211 167 Other ferro-alloys tonnes 1 255 1 495 635 677 886 Silicon metal tonnes 3 098 3 205 2 730 2 097 2 445 Ingots, blooms, billets tonnes 458 742 771 167 328 843 224 868 303 099 Scrap tonnes 5 501 8 416 49 468 17 655 6 274 Kaolin tonnes 51 754 56 871 60 170 62 370 69 190

108
Romania Imports continued
Commodity Units 2010 2011 2012 2013 2014
Lead Ores and concentrates tonnes 7 052 9 420 463 831 1 861 Unwrought tonnes 11 834 16 789 12 777 14 707 14 090 Magnesite and magnesia Magnesia tonnes 10 389 13 391 11 402 8 838 9 393 Manganese Ores and concentrates tonnes 87 880 66 285 244 13 77 Metal tonnes 220 588 415 517 698 Mercury kilograms 18 149 19 500 4 200 2 600 1 800 Mica Mica tonnes 785 1 077 810 1 039 841 Molybdenum Ores and concentrates tonnes 1 41 1 516 1 2 Metal tonnes 31 9 4 2 1 622 Nickel Unwrought (a) tonnes 456 224 190 216 193 Crude petroleum tonnes 5 821 640 5 451 662 5 127 631 5 299 043 6 727 423 Natural gas tonnes * 2 000 000 3 283 138 (b)* 200 000 (b)* 260 000 417 705 Phosphate rock tonnes 233 377 254 061 229 060 63 150 88 353 Potash Sulphate tonnes 13 726 6 936 17 559 32 233 20 486 Chloride tonnes 56 922 46 842 21 354 46 300 49 333 Other potassic fertilisers tonnes 425 683 1 279 1 161 1 253 Rare earths Rare earth compounds tonnes 5 1 2 1 4 Salt tonnes 81 441 114 500 94 288 107 859 106 703 Silver Metal (b) kilograms * 27 500 * 8 100 * 15 900 * 14 600 * 71 400 Sulphur and pyrites Sulphur tonnes 2 561 2 965 6 246 4 311 4 461 Sulphur, sublimed and precipitated tonnes 2 062 2 074 1 807 1 469 1 478 Talc tonnes 2 099 2 248 2 593 2 284 1 995 Tantalum and niobium Tantalum tonnes 0 * 0 0 * 60 * 81 Tin Unwrought (a) tonnes 85 125 91 120 165 Titanium Titanium minerals tonnes 2 095 5 393 1 354 1 721 1 930 Metal tonnes 771 541 776 801 543 Oxides tonnes 8 733 10 571 7 511 8 996 9 451 Tungsten Metal tonnes 79 50 63 45 32 Zinc Unwrought (a) tonnes 16 664 17 006 16 883 18 691 18 128 Scrap tonnes 246 439 1 628 1 101 1 046 Zirconium Metal tonnes 35 41 1 46 106
Note(s) (a) Including alloys (b) BGS estimate, based on known exports from certain countries

109
Serbia
Serbia
Production Commodity Units 2010 2011 2012 2013 2014
Cement Cement, clinker tonnes ... 1 529 226 1 264 333 1 121 538 1 122 964 Coal Bituminous tonnes 108 000 134 000 141 000 160 000 121 000 Lignite (a) tonnes 37 562 840 40 467 132 37 707 017 39 752 741 29 340 000 Brown coal tonnes 193 492 349 861 316 507 340 892 354 000 Copper, mine tonnes (metal content) 22 800 26 100 32 200 36 200 33 739 Copper, refined tonnes 22 200 28 400 34 700 35 800 33 175 Copper, smelter tonnes 20 000 28 200 36 800 41 300 40 898 Feldspar tonnes 253 23 586 19 927 * 20 000 * 20 000 Gold (b) kilograms 856 1 534 1 400 1 154 * 1 200 Pig iron tonnes 1 158 628 1 197 693 318 651 366 277 550 000 Crude steel tonnes 1 254 386 1 304 954 346 000 396 000 583 000 Kaolin tonnes 76 197 90 472 69 487 * 70 000 * 70 000 Lead, mine tonnes (metal content) 1 800 2 100 2 500 3 100 3 700 Crude petroleum tonnes 865 499 1 020 490 1 124 794 1 163 988 1 112 303 Natural gas million m3 423 616 672 660 631 Platinum metals kilograms Platinum kilograms (metal content) — 6 3 3 * 3 Palladium kilograms (metal content) 22 4 22 20 * 20 Salt tonnes 30 816 23 334 16 506 13 704 12 994 Selenium tonnes 11 13 13 16 * 16 Silver (c) kilograms (metal content) 4 384 7 380 8 388 * 8 400 * 8 400 Sulphur and pyrites Recovered (d) tonnes (sulphur content) 21 200 27 800 29 700 29 400 * 29 400 Zinc, mine tonnes (metal content) 2 600 3 100 6 000 5 800 7 100
Notes (a) Excluding production in Kosovo (b) Metal production (c) Smelter and/or refinery production (d) From metal sulphide processing
Exports Commodity Units 2010 2011 2012 2013 2014
Primary aggregates tonnes 127 309 497 637 485 266 211 015 263 545 Aluminium and bauxite Unwrought tonnes 17 602 15 353 10 130 10 713 7 933 Scrap tonnes 13 574 22 248 20 752 16 939 15 611 Asbestos Unmanufactured tonnes 1 306 ... ... ... Bentonite tonnes 4 823 11 903 2 972 3 367 65 Cement Portland cement tonnes 156 477 115 432 138 914 81 091 87 741 Coal Anthracite tonnes 4 434 2 507 160 3 009 60 Other coal tonnes 3 801 1 116 441 1 112 857 Lignite tonnes 112 009 32 337 28 266 51 729 13 798 Briquettes tonnes 8 724 573 53 62 273 39 254 Copper Ores and concentrates tonnes 1 666 2 234 4 276 4 158 12 038 Matte and cement tonnes 2 501 1 649 358 714 306 Unwrought tonnes 10 280 8 840 15 242 19 712 16 823 Unwrought alloys tonnes 641 704 370 1 308 1 624 Scrap tonnes 12 286 9 991 10 496 7 705 7 961 Iron ore Burnt pyrites tonnes 0 34 828 1 547 491 1 288 928 206 424

110
Serbia
Exports continued
Commodity Units 2010 2011 2012 2013 2014
Iron, steel and ferro-alloys Pig iron tonnes 70 090 46 629 374 860 910 ... Ingots, blooms, billets tonnes 20 547 111 080 187 578 266 510 266 038 Scrap tonnes 416 713 357 778 372 846 330 259 266 550 Kaolin tonnes 1 868 1 282 1 069 4 649 8 234 Lead Ores and concentrates tonnes 10 265 13 981 13 479 14 917 14 150 Unwrought tonnes 5 661 7 848 5 777 1 847 55 Magnesite and magnesia Magnesite tonnes 1 851 1 524 1 852 2 551 2 448 Magnesia tonnes 328 5 831 8 704 3 283 4 167 Potash Potassic fertilisers tonnes 690 3 672 3 546 2 288 957 Salt tonnes 16 290 13 362 5 073 9 987 9 861 Silver Metal kilograms 4 355 4 222 3 044 7 084 6 978 Sulphur and pyrites Sulphur tonnes 2 335 3 571 2 760 12 556 15 352 Zinc Ores and concentrates tonnes 14 921 23 247 22 559 25 416 24 149 Scrap tonnes 120 67 907 834 652
Imports Commodity Units 2010 2011 2012 2013 2014
Primary aggregates tonnes 15 910 8 759 9 907 14 742 19 854 Aluminium and bauxite Bauxite tonnes 10 972 7 800 5 976 3 807 736 Alumina tonnes 3 682 2 673 3 092 3 190 4 080 Unwrought tonnes 54 512 51 717 51 578 54 127 49 263 Unwrought alloys tonnes 13 600 15 834 14 446 17 668 19 465 Scrap tonnes 8 404 6 870 7 209 10 334 10 053 Barytes Barium minerals tonnes 421 1 494 3 468 2 491 1 578 Bentonite tonnes 1 683 1 804 5 294 3 906 3 296 Cement Cement clinkers tonnes 1 321 5 309 51 360 27 469 36 541 Portland cement tonnes 52 582 92 665 194 728 198 866 238 754 Other cement tonnes 728 784 664 1 979 1 536 Chromium Ores and concentrates tonnes 641 725 211 140 234 Coal Anthracite tonnes 18 056 16 456 13 988 21 017 32 254 Other coal tonnes 156 846 183 713 178 984 83 968 133 244 Lignite tonnes 307 250 615 026 716 035 321 145 457 613 Briquettes tonnes 11 130 8 975 18 239 6 699 4 169 Copper Ores and concentrates tonnes ... 3 063 0 (a)* 4 800 (a)* 12 600 Unwrought tonnes 37 129 26 995 14 679 8 262 4 152 Scrap tonnes 342 769 809 2 259 3 117 Crude petroleum tonnes 1 869 881 1 497 415 1 091 762 1 596 462 1 434 923 Diamond Dust Carats 550 000 885 000 425 000 580 000 485 000 Feldspar tonnes 10 139 11 864 11 302 9 794 13 208 Gypsum Crude tonnes 14 601 22 546 32 566 25 738 29 987 Calcined tonnes 9 276 9 962 9 096 7 441 8 292 Iodine kilograms 8 137 10 876 2 790 748 1 171 Iron ore tonnes 1 860 593 (b) 1 624 795 (b) 465 170 486 247 850 269
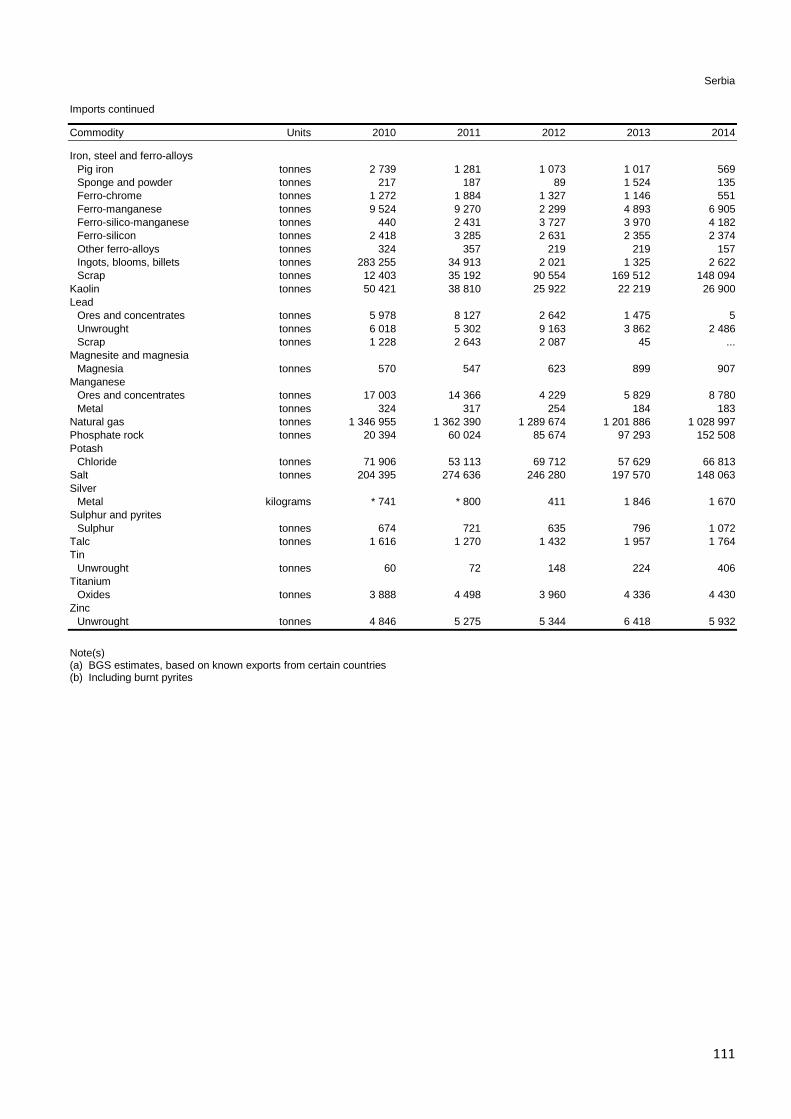
111
Serbia
Imports continued
Commodity Units 2010 2011 2012 2013 2014
Iron, steel and ferro-alloys Pig iron tonnes 2 739 1 281 1 073 1 017 569 Sponge and powder tonnes 217 187 89 1 524 135 Ferro-chrome tonnes 1 272 1 884 1 327 1 146 551 Ferro-manganese tonnes 9 524 9 270 2 299 4 893 6 905 Ferro-silico-manganese tonnes 440 2 431 3 727 3 970 4 182 Ferro-silicon tonnes 2 418 3 285 2 631 2 355 2 374 Other ferro-alloys tonnes 324 357 219 219 157 Ingots, blooms, billets tonnes 283 255 34 913 2 021 1 325 2 622 Scrap tonnes 12 403 35 192 90 554 169 512 148 094 Kaolin tonnes 50 421 38 810 25 922 22 219 26 900 Lead Ores and concentrates tonnes 5 978 8 127 2 642 1 475 5 Unwrought tonnes 6 018 5 302 9 163 3 862 2 486 Scrap tonnes 1 228 2 643 2 087 45 ... Magnesite and magnesia Magnesia tonnes 570 547 623 899 907 Manganese Ores and concentrates tonnes 17 003 14 366 4 229 5 829 8 780 Metal tonnes 324 317 254 184 183 Natural gas tonnes 1 346 955 1 362 390 1 289 674 1 201 886 1 028 997 Phosphate rock tonnes 20 394 60 024 85 674 97 293 152 508 Potash Chloride tonnes 71 906 53 113 69 712 57 629 66 813 Salt tonnes 204 395 274 636 246 280 197 570 148 063 Silver Metal kilograms * 741 * 800 411 1 846 1 670 Sulphur and pyrites Sulphur tonnes 674 721 635 796 1 072 Talc tonnes 1 616 1 270 1 432 1 957 1 764 Tin Unwrought tonnes 60 72 148 224 406 Titanium Oxides tonnes 3 888 4 498 3 960 4 336 4 430 Zinc Unwrought tonnes 4 846 5 275 5 344 6 418 5 932
Note(s) (a) BGS estimates, based on known exports from certain countries (b) Including burnt pyrites

112
Slovakia
Slovakia
Production Commodity Units 2010 2011 2012 2013 2014
Primary aggregates Sand and gravel tonnes 6 931 873 6 020 641 3 794 873 3 953 525 3 863 467 Crushed rock tonnes 14 909 400 13 834 800 10 157 400 8 526 598 10 188 851 Primary aluminium tonnes 163 000 162 840 160 662 163 000 168 000 Barytes tonnes 17 000 13 000 21 000 24 000 21 000 Bentonite tonnes 153 000 213 000 177 000 184 000 205 000 Cement Cement, clinker tonnes 1 607 025 1 823 306 1 490 768 * 1 500 000 * 1 500 000 Cement, finished tonnes 2 887 749 3 219 557 2 915 166 3 121 000 3 319 320 Coal Lignite tonnes 176 000 124 000 136 000 179 000 166 000 Brown coal tonnes 2 026 000 1 989 000 1 964 000 2 009 000 1 885 000 Copper, mine tonnes (metal content) 22 28 31 40 46 Feldspar tonnes — — — 5 000 6 000 Gold kilograms 534 398 546 533 582 Gypsum (a) tonnes 87 000 88 000 88 000 60 000 65 000 Pig iron tonnes 3 649 000 3 346 000 3 519 755 3 617 000 3 838 000 Crude steel tonnes 4 583 000 4 236 000 4 403 447 4 511 000 4 705 000 Ferro-alloys Ferro-silico-manganese tonnes 34 960 25 036 50 089 * 50 000 29 643 Ferro-silicon tonnes 26 419 32 304 32 726 41 664 44 030 Other ferro-alloys tonnes 38 860 18 575 20 059 * 20 000 26 505 Kaolin tonnes — 4 000 3 000 6 000 6 000 Lead, mine tonnes (metal content) 94 114 166 235 162 Magnesite tonnes 650 100 751 700 618 400 584 000 557 100 Perlite tonnes 23 000 23 000 24 000 16 000 17 000 Crude petroleum tonnes 16 000 18 000 14 000 13 000 13 000 Natural gas million m3 106 106 93 91 87 Silver kilograms (metal content) 320 330 441 508 437 Sulphur and pyrites Recovered (b) tonnes (sulphur content) 4 900 4 900 4 900 4 900 * 4 900 Recovered (c) tonnes (sulphur content) 73 200 83 300 76 200 85 300 * 85 300 Talc tonnes 7 000 7 000 2 000 10 000 3 000 Zinc, mine tonnes (metal content) 82 103 134 190 176
Notes (a) Including anhydrite (b) From metal sulphide processing (c) From petroleum refining and/or natural gas
Exports Commodity Units 2010 2011 2012 2013 2014
Primary aggregates (a) tonnes * 598 000 * 615 008 * 525 000 * 534 000 * 615 000 Aluminium and bauxite Unwrought tonnes 44 989 40 011 576 5 715 4 340 Unwrought alloys tonnes 111 769 118 485 80 141 164 465 153 108 Scrap tonnes 10 260 14 044 18 207 31 339 29 907 Barytes Barium minerals tonnes 641 230 197 10 831 9 549 Bentonite tonnes 32 981 85 760 98 257 144 198 159 650 Cement Cement clinkers tonnes 69 366 44 607 — 0 23 569 Portland cement tonnes 1 396 241 1 795 235 1 407 502 1 876 911 1 937 757 Other cement tonnes 21 660 10 28 77 28 Chromium Metal tonnes 777 83 2 2 —

113
Slovakia
Exports continued
Commodity Units 2010 2011 2012 2013 2014
Coal Anthracite tonnes 725 6 198 9 373 7 955 8 213 Other coal tonnes 5 128 2 552 10 9 463 1 159 Lignite tonnes 55 908 53 18 063 11 737 Briquettes tonnes 108 65 6 486 6 953 7 395 Copper Unwrought, unrefined tonnes 31 685 38 566 40 404 20 077 27 183 Unwrought, refined tonnes 2 597 4 435 2 751 13 189 15 161 Unwrought alloys tonnes 1 346 704 619 1 343 2 191 Scrap tonnes 15 550 19 522 23 250 25 452 19 682 Diamond Gem, cut Carats 7 000 000 3 000 000 500 000 75 000 65 000 Dust Carats 6 250 000 2 934 017 ... ... — Feldspar tonnes ... 58 1 1 532 4 857 Gold Metal kilograms 2 926 20 000 3 300 267 600 886 700 Waste and scrap kilograms 7 300 6 800 4 800 6 500 200 Iron ore tonnes 62 568 22 481 118 695 121 558 97 908 Iron, steel and ferro-alloys Pig iron tonnes 70 588 26 976 29 527 42 978 18 683 Ferro-chrome tonnes 10 029 11 189 12 893 10 802 9 185 Ferro-manganese tonnes 14 032 10 229 4 308 13 223 14 904 Ferro-silico-manganese tonnes 35 764 28 660 44 202 41 345 44 048 Ferro-molybdenum tonnes 78 2 416 172 98 24 Ferro-niobium tonnes 95 46 10 319 289 Ferro-silicon tonnes 19 656 31 004 26 389 39 296 42 123 Other ferro-alloys tonnes 3 295 3 180 4 930 6 277 8 190 Ingots, blooms, billets tonnes 631 135 221 697 413 032 128 932 306 932 Scrap tonnes 556 952 651 135 430 539 360 818 510 907 Kaolin tonnes 4 493 552 42 14 067 16 080 Lead Unwrought tonnes 250 539 373 1 577 4 178 Scrap tonnes 662 737 759 1 258 1 218 Magnesite and magnesia Magnesite (a) tonnes * 8 400 * 4 900 * 3 800 * 2 600 * 2 700 Magnesia tonnes 336 786 340 612 272 677 266 320 266 297 Manganese Ores and concentrates tonnes — 7 508 — — 3 029 Nickel Unwrought tonnes 68 84 — 1 095 2 147 Scrap tonnes 295 1 368 217 149 158 Crude petroleum tonnes 13 048 15 359 11 515 10 042 9 398 Natural gas tonnes 1 153 269 1 439 467 1 366 942 1 052 157 1 518 006 Platinum metals Platinum and platinum metals kilograms 5 800 84 100 29 400 1 800 2 100 Waste and scrap kilograms 111 764 97 152 30 600 Potash Potassic fertilisers tonnes 51 580 183 859 1 184 Salt tonnes 45 056 27 935 20 917 20 151 13 942 Silver Metal kilograms 39 100 15 100 31 500 28 800 37 900 Sulphur and pyrites Sulphur tonnes 448 1 998 2 456 2 075 2 528 Sulphur, sublimed and precipitated tonnes 72 910 82 785 74 817 86 343 74 490 Talc tonnes 47 38 25 939 1 019 Tin Unwrought tonnes (b) 8 11 688 1 968 (b) 526 Scrap tonnes 8 4 9 42 127 Titanium Metal tonnes 49 24 199 91 101 Tungsten Metal tonnes 4 9 43 296 1

114
Slovakia
Exports continued
Commodity Units 2010 2011 2012 2013 2014
Zinc Unwrought tonnes 7 903 2 836 3 421 2 385 8 410 Unwrought alloys tonnes 13 075 7 001 10 336 10 472 13 722
Note(s) (a) BGS estimates, based on known imports into certain countries (b) Including alloys
Imports Commodity Units 2010 2011 2012 2013 2014
Primary aggregates tonnes 666 380 527 259 419 992 385 376 225 339 Aluminium and bauxite Bauxite tonnes 4 233 6 136 6 087 9 087 6 772 Alumina tonnes 270 777 232 187 261 594 320 772 321 679 Unwrought tonnes 8 916 3 430 1 627 2 082 4 494 Unwrought alloys tonnes 37 657 40 885 37 654 46 976 56 446 Scrap tonnes 2 098 3 181 3 667 6 174 7 903 Asbestos Unmanufactured tonnes — 64 76 96 77 Bentonite tonnes 6 416 26 935 25 923 6 917 6 956 Cement Cement clinkers tonnes 6 380 9 706 5 840 29 373 33 807 Portland cement tonnes 256 358 281 910 266 308 300 277 376 153 Other cement tonnes 34 733 102 134 71 001 60 034 13 249 Chromium Ores and concentrates tonnes 4 546 5 542 3 562 5 459 5 204 Coal Anthracite tonnes 293 054 713 105 635 877 499 374 609 327 Other coal tonnes 3 063 331 3 177 887 3 245 231 3 133 715 3 125 690 Lignite tonnes 563 021 534 118 624 731 436 339 463 136 Briquettes tonnes 12 799 14 836 16 545 25 808 31 121 Cobalt Oxides tonnes 137 97 147 144 240 Copper Unwrought tonnes 6 153 7 531 8 665 10 099 18 795 Scrap tonnes 40 347 30 687 37 623 28 454 34 097 Diamond Gem, rough Carats £600 000 £406 000 £923 000 £57 000 £645 000 Gem, cut Carats £2 530 000 £2 720 000 £6 610 000 £2 750 000 £913 000 Industrial Carats 55 000 1 037 208 * 10 000 40 000 15 000 Dust Carats 18 560 000 325 000 * 600 000 160 000 275 000 Diatomite tonnes 784 415 461 498 473 Feldspar tonnes 5 886 5 590 5 518 5 809 5 499 Fluorspar tonnes 954 762 896 820 1 484 Gold Metal kilograms 220 470 189 400 523 800 120 600 1 124 900 Graphite tonnes 1 899 1 688 1 847 1 741 2 402 Gypsum Crude tonnes 74 512 80 966 70 308 99 454 104 686 Calcined tonnes 16 732 17 194 17 335 15 319 14 021 Iodine kilograms 325 500 300 500 400 Iron ore tonnes 5 796 813 5 103 229 5 404 215 5 647 197 6 012 384

115
Slovakia Imports continued
Commodity Units 2010 2011 2012 2013 2014
Iron, steel and ferro-alloys Pig iron tonnes 33 258 43 874 38 466 36 404 34 910 Sponge and powder tonnes 13 227 7 294 6 124 6 188 6 119 Ferro-chrome tonnes 6 829 6 684 8 014 7 056 5 056 Ferro-manganese tonnes 13 202 16 391 17 286 19 133 20 384 Ferro-silico-manganese tonnes 1 776 4 904 3 902 22 205 11 071 Ferro-molybdenum tonnes 140 374 252 213 194 Ferro-niobium tonnes 315 426 549 540 567 Ferro-phosphorus tonnes 282 629 463 307 511 Ferro-silicon tonnes 15 250 12 660 9 171 10 200 11 007 Ferro-titanium and ferro-silico-titanium tonnes 535 435 281 224 736 Ferro-vanadium tonnes 62 123 144 127 141 Other ferro-alloys tonnes 1 627 981 201 267 238 Silicon metal tonnes 6 309 7 196 6 329 6 735 7 887 Ingots, blooms, billets tonnes 10 020 24 162 7 314 12 664 10 131 Scrap tonnes 224 868 146 065 342 657 383 012 248 305 Kaolin tonnes 62 748 70 451 64 345 70 545 72 923 Lead Unwrought tonnes 136 563 697 252 2 583 Magnesite and magnesia Magnesite tonnes 3 916 4 960 (a)* 2 000 (a)* 3 000 (a)* 1 766 Magnesia tonnes 28 639 27 100 23 363 20 405 25 213 Manganese Ores and concentrates tonnes 146 434 130 519 144 936 127 764 54 955 Metal tonnes 442 659 228 207 304 Mercury kilograms 4 700 27 700 10 000 3 000 5 000 Nickel Scrap tonnes 52 312 35 1 35 Unwrought (b) tonnes 112 617 103 2 659 1 855 Crude petroleum tonnes 5 555 541 5 988 119 5 345 149 5 821 927 5 479 990 Natural gas tonnes 5 765 254 5 747 975 5 577 333 5 378 551 4 475 375 Phosphate rock tonnes 1 688 1 662 1 299 (a)* 1 000 142 Platinum metals Platinum kilograms 1 625 761 2 662 700 2 339 500 1 544 400 101 800 Palladium kilograms 2 702 4 400 4 800 500 3 300 Potash Chloride tonnes 22 561 24 631 23 613 18 670 12 171 Other potassic fertilisers tonnes 2 913 2 260 3 204 1 032 719 Rare earths Rare earth compounds tonnes 8 10 7 10 9 Salt tonnes 266 329 244 787 226 571 408 235 221 269 Sillimanite minerals tonnes 2 456 2 917 844 2 002 2 036 Silver Metal kilograms 55 300 * 47 000 268 700 97 800 168 400 Sulphur and pyrites Sulphur tonnes 3 855 3 173 3 115 3 571 3 773 Sulphur, sublimed and precipitated tonnes 864 1 510 735 576 64 Talc tonnes 719 380 470 1 098 2 679 Tin Unwrought (b) tonnes 2 087 2 120 2 091 4 119 2 577 Titanium Titanium minerals tonnes 0 1 2 4 6 847 Metal tonnes 956 2 271 643 778 801 Oxides tonnes 2 109 2 409 2 163 2 776 2 843 Tungsten Metal tonnes 366 5 398 5 331 2 207 50 Zinc Unwrought (b) tonnes 37 266 34 536 27 313 36 191 50 943
Note(s) (a) BGS estimates, based on known exports from certain countries (b) Including alloys
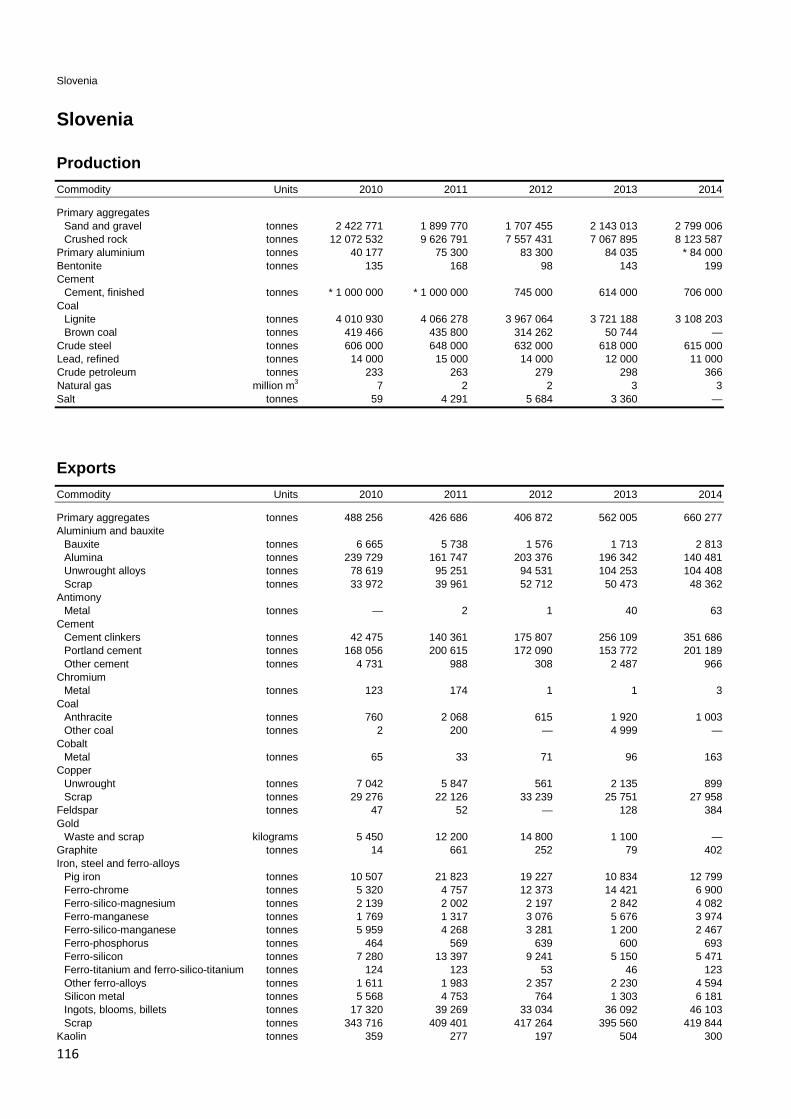
116
Slovenia
Slovenia
Production Commodity Units 2010 2011 2012 2013 2014
Primary aggregates Sand and gravel tonnes 2 422 771 1 899 770 1 707 455 2 143 013 2 799 006 Crushed rock tonnes 12 072 532 9 626 791 7 557 431 7 067 895 8 123 587 Primary aluminium tonnes 40 177 75 300 83 300 84 035 * 84 000 Bentonite tonnes 135 168 98 143 199 Cement Cement, finished tonnes * 1 000 000 * 1 000 000 745 000 614 000 706 000 Coal Lignite tonnes 4 010 930 4 066 278 3 967 064 3 721 188 3 108 203 Brown coal tonnes 419 466 435 800 314 262 50 744 — Crude steel tonnes 606 000 648 000 632 000 618 000 615 000 Lead, refined tonnes 14 000 15 000 14 000 12 000 11 000 Crude petroleum tonnes 233 263 279 298 366 Natural gas million m3 7 2 2 3 3 Salt tonnes 59 4 291 5 684 3 360 —
Exports Commodity Units 2010 2011 2012 2013 2014
Primary aggregates tonnes 488 256 426 686 406 872 562 005 660 277 Aluminium and bauxite Bauxite tonnes 6 665 5 738 1 576 1 713 2 813 Alumina tonnes 239 729 161 747 203 376 196 342 140 481 Unwrought alloys tonnes 78 619 95 251 94 531 104 253 104 408 Scrap tonnes 33 972 39 961 52 712 50 473 48 362 Antimony Metal tonnes — 2 1 40 63 Cement Cement clinkers tonnes 42 475 140 361 175 807 256 109 351 686 Portland cement tonnes 168 056 200 615 172 090 153 772 201 189 Other cement tonnes 4 731 988 308 2 487 966 Chromium Metal tonnes 123 174 1 1 3 Coal Anthracite tonnes 760 2 068 615 1 920 1 003 Other coal tonnes 2 200 — 4 999 — Cobalt Metal tonnes 65 33 71 96 163 Copper Unwrought tonnes 7 042 5 847 561 2 135 899 Scrap tonnes 29 276 22 126 33 239 25 751 27 958 Feldspar tonnes 47 52 — 128 384 Gold Waste and scrap kilograms 5 450 12 200 14 800 1 100 — Graphite tonnes 14 661 252 79 402 Iron, steel and ferro-alloys Pig iron tonnes 10 507 21 823 19 227 10 834 12 799 Ferro-chrome tonnes 5 320 4 757 12 373 14 421 6 900 Ferro-silico-magnesium tonnes 2 139 2 002 2 197 2 842 4 082 Ferro-manganese tonnes 1 769 1 317 3 076 5 676 3 974 Ferro-silico-manganese tonnes 5 959 4 268 3 281 1 200 2 467 Ferro-phosphorus tonnes 464 569 639 600 693 Ferro-silicon tonnes 7 280 13 397 9 241 5 150 5 471 Ferro-titanium and ferro-silico-titanium tonnes 124 123 53 46 123 Other ferro-alloys tonnes 1 611 1 983 2 357 2 230 4 594 Silicon metal tonnes 5 568 4 753 764 1 303 6 181 Ingots, blooms, billets tonnes 17 320 39 269 33 034 36 092 46 103 Scrap tonnes 343 716 409 401 417 264 395 560 419 844 Kaolin tonnes 359 277 197 504 300
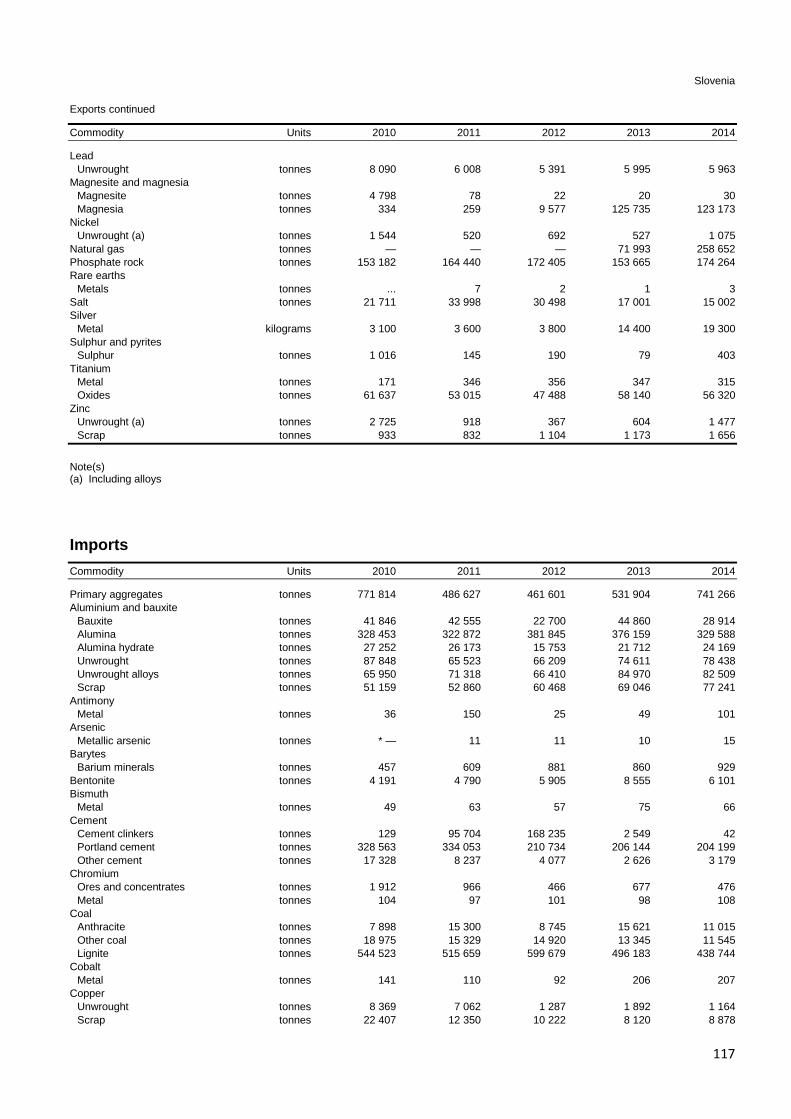
117
Slovenia
Exports continued
Commodity Units 2010 2011 2012 2013 2014
Lead Unwrought tonnes 8 090 6 008 5 391 5 995 5 963 Magnesite and magnesia Magnesite tonnes 4 798 78 22 20 30 Magnesia tonnes 334 259 9 577 125 735 123 173 Nickel Unwrought (a) tonnes 1 544 520 692 527 1 075 Natural gas tonnes — — — 71 993 258 652 Phosphate rock tonnes 153 182 164 440 172 405 153 665 174 264 Rare earths Metals tonnes ... 7 2 1 3 Salt tonnes 21 711 33 998 30 498 17 001 15 002 Silver Metal kilograms 3 100 3 600 3 800 14 400 19 300 Sulphur and pyrites Sulphur tonnes 1 016 145 190 79 403 Titanium Metal tonnes 171 346 356 347 315 Oxides tonnes 61 637 53 015 47 488 58 140 56 320 Zinc Unwrought (a) tonnes 2 725 918 367 604 1 477 Scrap tonnes 933 832 1 104 1 173 1 656
Note(s) (a) Including alloys
Imports Commodity Units 2010 2011 2012 2013 2014
Primary aggregates tonnes 771 814 486 627 461 601 531 904 741 266 Aluminium and bauxite Bauxite tonnes 41 846 42 555 22 700 44 860 28 914 Alumina tonnes 328 453 322 872 381 845 376 159 329 588 Alumina hydrate tonnes 27 252 26 173 15 753 21 712 24 169 Unwrought tonnes 87 848 65 523 66 209 74 611 78 438 Unwrought alloys tonnes 65 950 71 318 66 410 84 970 82 509 Scrap tonnes 51 159 52 860 60 468 69 046 77 241 Antimony Metal tonnes 36 150 25 49 101 Arsenic Metallic arsenic tonnes * — 11 11 10 15 Barytes Barium minerals tonnes 457 609 881 860 929 Bentonite tonnes 4 191 4 790 5 905 8 555 6 101 Bismuth Metal tonnes 49 63 57 75 66 Cement Cement clinkers tonnes 129 95 704 168 235 2 549 42 Portland cement tonnes 328 563 334 053 210 734 206 144 204 199 Other cement tonnes 17 328 8 237 4 077 2 626 3 179 Chromium Ores and concentrates tonnes 1 912 966 466 677 476 Metal tonnes 104 97 101 98 108 Coal Anthracite tonnes 7 898 15 300 8 745 15 621 11 015 Other coal tonnes 18 975 15 329 14 920 13 345 11 545 Lignite tonnes 544 523 515 659 599 679 496 183 438 744 Cobalt Metal tonnes 141 110 92 206 207 Copper Unwrought tonnes 8 369 7 062 1 287 1 892 1 164 Scrap tonnes 22 407 12 350 10 222 8 120 8 878

118
Slovenia
Imports continued
Commodity Units 2010 2011 2012 2013 2014
Diamond Dust Carats 1 656 306 1 423 460 990 000 1 280 000 1 040 000 Diatomite tonnes 718 623 397 394 414 Feldspar tonnes 14 954 13 168 6 012 5 963 5 782 Fluorspar tonnes 1 754 1 463 1 481 1 586 1 656 Gold Metal kilograms 1 100 1 700 1 100 800 300 Waste and scrap kilograms 5 400 5 600 1 800 2 300 1 300 Graphite tonnes 303 232 206 202 219 Gypsum Crude and calcined tonnes 8 557 7 003 6 132 5 411 5 853 Iodine kilograms 45 35 111 3 529 65 Iron, steel and ferro-alloys Pig iron tonnes 29 120 25 327 30 517 29 660 28 531 Sponge and powder tonnes 1 225 1 630 794 1 020 1 211 Ferro-chrome tonnes 26 575 36 528 36 673 51 232 38 659 Ferro-silico-magnesium tonnes 624 786 1 485 1 377 1 509 Ferro-manganese tonnes 6 175 5 763 6 318 8 882 7 342 Ferro-silico-manganese tonnes 8 810 7 697 7 477 5 608 7 487 Ferro-molybdenum tonnes 717 885 1 028 1 060 1 085 Ferro-nickel tonnes ... 42 ... — 605 Ferro-phosphorus tonnes 846 968 1 115 710 978 Ferro-silicon tonnes 13 114 15 739 15 371 12 419 12 310 Ferro-titanium and ferro-silico-titanium tonnes 230 232 228 219 306 Ferro-tungsten and ferro-silico-tungsten tonnes 99 136 65 60 62 Ferro-vanadium tonnes 481 449 413 471 516 Other ferro-alloys tonnes 1 795 1 645 1 714 1 433 2 224 Silicon metal tonnes 7 874 8 318 5 862 5 810 11 851 Ingots, blooms, billets tonnes 8 191 31 931 20 897 20 770 28 446 Scrap tonnes 495 432 561 713 552 363 539 994 579 017 Kaolin tonnes 27 287 28 779 22 614 23 877 25 248 Lead Unwrought tonnes 16 025 17 594 17 294 21 844 27 402 Scrap tonnes 3 812 3 611 3 741 4 117 5 055 Lithium Oxides tonnes 95 125 190 298 332 Magnesite and magnesia tonnes 7 279 64 675 109 365 128 518 129 116 Manganese Metal tonnes 433 420 483 417 486 Molybdenum Ores and concentrates tonnes 561 523 473 476 717 Nickel Unwrought (a) tonnes 2 967 3 230 4 304 4 469 4 190 Natural gas tonnes 828 674 736 641 662 178 719 982 802 609 Phosphate rock tonnes 153 160 164 442 172 406 153 649 174 270 Potash Potassic fertilisers tonnes 1 919 2 076 1 447 1 574 1 610 Rare earths Metals tonnes 98 26 55 61 65 Rare earth compounds tonnes 3 3 9 5 13 Salt tonnes 317 999 235 663 142 926 284 695 169 045 Sillimanite minerals tonnes 363 921 1 901 3 970 3 706 Silver Metal kilograms 24 100 29 700 25 100 26 900 21 200 Sulphur and pyrites Pyrites tonnes 645 836 921 959 957 Sulphur tonnes 57 411 56 490 51 225 54 707 57 575 Talc tonnes 10 793 4 489 4 413 4 618 4 311 Tin Unwrought (a) tonnes 118 70 62 89 93 Titanium Titanium minerals tonnes 25 081 54 387 20 208 19 761 48 861 Metal tonnes 400 964 739 844 694 Oxides tonnes 2 917 2 884 2 625 2 954 3 407 Titanium slag tonnes ... 39 644 57 097 54 482 58 063
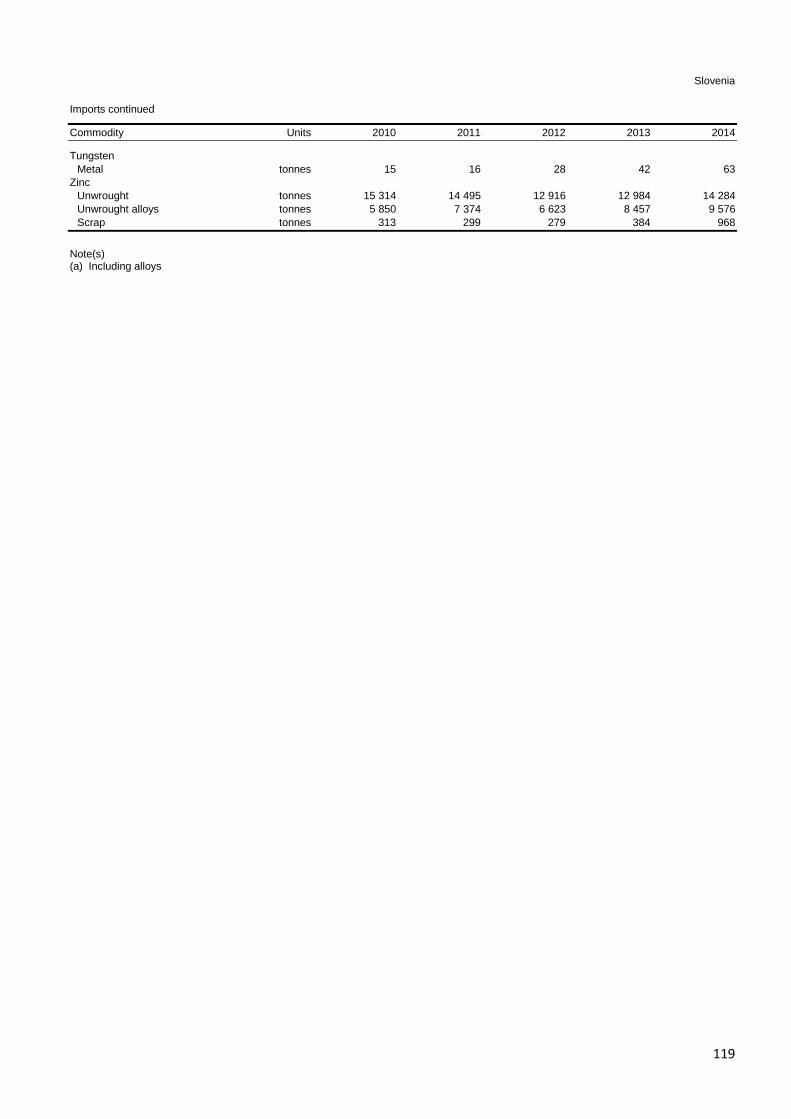
119
Slovenia
Imports continued
Commodity Units 2010 2011 2012 2013 2014
Tungsten Metal tonnes 15 16 28 42 63 Zinc Unwrought tonnes 15 314 14 495 12 916 12 984 14 284 Unwrought alloys tonnes 5 850 7 374 6 623 8 457 9 576 Scrap tonnes 313 299 279 384 968
Note(s) (a) Including alloys

120
Spain
Spain
Production Commodity Units 2010 2011 2012 2013 2014
Primary aggregates Sand and gravel tonnes 73 765 882 60 603 982 41 834 967 * 33 300 000 30 000 000 Crushed rock tonnes 180 105 140 143 579 886 96 056 496 * 67 800 000 65 000 000 Alumina tonnes (Al2O3 content) * 1 300 000 * 1 300 000 * 1 100 000 * 1 400 000 * 1 400 000 Primary aluminium tonnes 456 500 408 400 386 395 * 250 000 * 230 000 Barytes tonnes 2 050 — — — — Bentonite and Fuller's Earth Bentonite tonnes 157 001 110 371 96 605 102 726 * 100 000 Attapulgite tonnes 27 841 26 021 23 537 26 764 * 26 800 Sepiolite tonnes 557 862 566 270 622 372 599 352 555 581 Cement Cement, clinker tonnes 21 234 637 17 000 000 16 719 769 14 600 000 * 15 000 000 Cement, finished tonnes 26 161 660 22 178 237 15 938 965 * 13 700 000 * 14 000 000 Coal Anthracite tonnes 3 266 041 4 032 683 2 514 649 759 930 1 263 585 Bituminous tonnes 2 776 918 1 774 992 1 823 343 1 814 328 1 931 807 Sub-bituminous tonnes 2 443 677 2 358 372 1 826 680 1 870 569 1 347 849 Copper, mine tonnes (metal content) 54 335 68 511 97 452 104 600 103 900 Copper, smelter tonnes 259 119 260 730 270 200 212 000 294 100 Copper, refined tonnes 347 518 353 790 406 600 351 000 418 500 Diatomite (a) tonnes 64 346 83 624 60 777 53 713 59 619 Feldspar tonnes 691 894 662 418 530 238 592 908 * 600 000 Fluorspar tonnes 132 341 117 063 113 570 128 512 135 293 Gold kilograms — 529 1 529 1 994 1 800 Gypsum tonnes 6 990 249 7 825 747 6 359 923 7 388 699 * 7 000 000 Pig iron tonnes 3 572 000 3 540 000 3 081 000 3 949 000 3 958 000 Crude steel tonnes 16 343 000 15 504 000 13 639 000 14 252 000 14 163 000 Ferro-alloys Ferro-manganese tonnes 102 200 92 100 * 80 200 * 80 000 * 80 000 Ferro-silico-manganese tonnes 134 200 142 300 * 148 100 * 150 000 * 150 000 Ferro-silicon tonnes * 64 400 * 57 000 * 42 000 * 40 000 * 40 000 Silicon metal tonnes * 32 500 * 43 000 * 62 000 * 65 000 * 65 000 Kaolin (b) tonnes 310 993 384 179 402 251 410 717 350 000 Lead, mine tonnes (metal content) 229 5 705 3 800 2 200 1 200 Lead, refined tonnes 165 000 177 000 160 000 157 000 166 000 Lithium Lepidolite tonnes 7 824 — — — — Magnesite tonnes 462 959 577 725 649 977 836 269 840 000 Mica (c) tonnes 4 034 3 609 3 518 3 462 3 500 Nickel, mine tonnes (metal content) 6 296 — 2 398 7 574 8 631 Crude petroleum tonnes 121 528 99 925 143 526 367 569 305 263 Natural gas million m3 58 58 65 62 20 Potash Chloride tonnes (K2O content) 513 222 520 555 421 652 711 272 972 045 Salt Rock salt tonnes 3 115 940 3 096 383 2 785 959 2 973 993 * 3 000 000 Sea salt tonnes 1 242 718 1 314 529 1 222 060 1 221 018 1 320 000 Other salt tonnes 92 644 92 850 100 643 114 829 105 000 Silver kilograms (metal content) 20 800 29 900 32 943 * 31 000 * 31 000 Strontium minerals tonnes 83 035 97 102 96 888 90 972 128 077 Sulphur and pyrites Recovered (d) tonnes (sulphur content) 547 400 490 200 578 400 539 200 * 539 000 Recovered (e) tonnes (sulphur content) 480 000 520 000 545 000 515 000 * 515 000 Talc Pyrophyllite tonnes — 5 600 * — — — Talc tonnes 51 897 11 957 8 857 * — * — Tin tonnes (metal content) — 9 69 0 — Tungsten tonnes (metal content) 303 425 496 614 1 036 Wollastonite tonnes 6 000 7 417 10 918 16 738 15 298

121
Spain
Production continued
Commodity Units 2010 2011 2012 2013 2014
Zinc, mine tonnes (metal content) 17 323 33 197 28 634 30 428 26 756 Slab zinc tonnes 517 100 527 100 528 300 * 530 000 * 530 000
Notes (1) Spain is also believed to produce arsenic (a) Including Tripoli (b) Washed (c) Including mica recovered from mica schists and/or kaolin beneficiation (d) From metal sulphide processing (e) From petroleum refining and/or natural gas
Exports Commodity Units 2010 2011 2012 2013 2014
Primary aggregates tonnes 1 105 524 1 249 318 726 145 953 044 1 293 021 Aluminium and bauxite Alumina tonnes 299 703 391 516 426 925 636 058 709 781 Alumina hydrate tonnes 126 398 186 543 282 062 227 359 245 468 Unwrought tonnes 26 693 19 248 29 433 42 539 54 538 Unwrought alloys tonnes 148 884 175 112 181 026 174 067 200 991 Scrap tonnes 66 976 51 518 90 881 94 856 80 107 Antimony Metal tonnes 19 50 247 2 11 Oxide tonnes 1 716 1 784 1 204 2 361 2 457 Barytes Barium minerals tonnes 32 427 34 285 38 285 34 361 33 825 Bentonite tonnes 66 096 54 547 54 376 56 416 50 219 Sepiolite tonnes 443 594 502 083 531 475 ... ... Bismuth Metal tonnes 9 9 4 6 15 Bromine kilograms 15 627 86 311 10 480 72 396 5 303 Cement Cement clinkers tonnes 1 541 790 1 590 245 3 493 671 3 870 209 4 669 688 Portland cement tonnes 2 768 457 2 594 711 3 021 493 3 333 949 4 361 048 Other cement tonnes 87 864 174 167 117 257 194 554 119 739 Chromium Ores and concentrates tonnes 600 1 252 4 225 2 250 968 Metal tonnes 665 237 555 470 518 Coal Anthracite tonnes 337 930 337 833 240 630 351 794 278 244 Other coal tonnes 1 149 991 851 716 1 620 047 356 469 1 006 016 Cobalt Metal tonnes 4 25 72 6 11 Oxides tonnes 19 14 37 66 123 Copper Ores and concentrates tonnes 219 996 583 189 528 980 729 177 759 907 Matte and cement tonnes 25 17 596 9 413 0 149 Unwrought, unrefined tonnes 33 973 36 562 43 244 37 762 42 487 Unwrought, refined tonnes 78 030 90 279 146 942 113 585 160 941 Unwrought alloys tonnes 15 742 16 039 17 598 16 646 18 408 Scrap tonnes 102 236 87 122 159 419 156 511 150 874 Diamond Unsorted Carats £292 000 £154 000 £490 000 £390 000 £311 000 Gem, rough Carats ... £500 000 £130 000 £160 000 £153 000 Gem, cut Carats £7 350 000 £9 802 000 £9 021 000 £11 894 000 £9 086 000 Industrial Carats £210 000 £590 000 £42 000 £499 000 £82 000 Dust Carats 689 563 8 454 551 21 675 000 23 795 000 12 850 000 Diatomite tonnes 7 382 6 655 10 384 4 271 5 730 Feldspar tonnes 69 337 71 940 63 644 81 429 99 009 Fluorspar tonnes 1 680 3 312 5 519 12 754 5 735

122
Spain
Exports continued
Commodity Units 2010 2011 2012 2013 2014
Gold Metal kilograms 282 816 9 444 195 4 268 966 3 562 857 2 590 351 Waste and scrap kilograms 258 156 176 652 113 264 621 165 21 272 Graphite tonnes 5 369 6 142 5 184 1 620 446 Gypsum Crude tonnes 2 678 452 3 379 570 3 781 205 3 454 407 3 911 285 Calcined tonnes 165 424 170 384 135 464 188 096 151 664 Iodine kilograms 14 704 7 909 43 289 90 312 97 866 Iron ore (a) tonnes 9 079 165 589 184 056 270 073 60 022 Iron, steel and ferro-alloys Pig iron tonnes 2 998 7 023 11 831 17 049 9 620 Sponge and powder tonnes 2 658 3 233 3 000 3 659 5 565 Ferro-chrome tonnes 1 025 1 181 1 359 2 224 1 616 Ferro-silico-chrome tonnes 239 236 ... ... 323 Ferro-silico-magnesium tonnes 57 514 569 2 835 784 Ferro-manganese tonnes 52 296 37 866 42 486 71 628 83 903 Ferro-silico-manganese tonnes 58 097 65 469 66 101 58 380 45 196 Ferro-molybdenum tonnes 359 7 55 22 129 Ferro-nickel tonnes 4 2 47 28 2 272 Ferro-niobium tonnes 380 518 336 88 235 Ferro-phosphorus tonnes 57 167 250 391 294 Ferro-silicon tonnes 12 854 12 952 20 235 17 571 21 927 Ferro-titanium and ferro-silico-titanium tonnes 18 12 56 190 152 Other ferro-alloys tonnes 1 436 877 643 797 1 253 Silicon metal tonnes 18 463 21 864 20 690 19 644 15 884 Ingots, blooms, billets tonnes 337 566 194 482 134 781 253 033 113 488 Scrap tonnes 277 401 431 394 737 203 567 955 626 637 Kaolin tonnes 167 557 161 497 173 332 164 350 200 956 Lead Ores and concentrates tonnes 9 513 24 677 50 216 45 055 45 576 Unwrought tonnes 6 630 15 683 37 882 13 350 9 434 Scrap tonnes 6 781 5 029 3 361 7 505 3 436 Lithium Carbonate tonnes 176 268 100 2 477 6 770 Magnesite and magnesia Magnesite tonnes 410 573 1 081 798 970 Magnesia tonnes 222 825 256 523 256 824 234 020 233 754 Manganese Ores and concentrates tonnes 707 623 621 5 367 1 537 Metal tonnes 1 297 1 735 4 665 3 880 4 106 Mercury kilograms 964 922 824 421 950 824 1 008 952 1 123 184 Mica Unmanufactured tonnes 1 339 1 846 1 826 1 904 2 075 Ground tonnes 2 269 2 193 1 993 613 923 Molybdenum Metal tonnes 243 14 69 79 30 Nickel Ores and concentrates tonnes 106 913 26 597 20 739 100 228 133 552 Unwrought (b) tonnes 738 400 570 390 1 377 Oxides tonnes 11 1 104 125 232 Scrap tonnes 366 376 454 339 1 284 Crude petroleum tonnes 2 7 592 14 11 1 416 095 Natural gas tonnes 200 027 555 012 1 325 072 2 483 109 3 779 768 Phosphate rock tonnes 1 888 10 985 620 269 952 Platinum metals Platinum and platinum metals kilograms 2 347 1 255 21 889 467 717 322 509 Waste and scrap kilograms 291 877 163 420 68 805 106 813 601 265 Potash Sulphate tonnes 6 474 3 713 4 873 4 150 5 078 Chloride tonnes 609 429 688 599 737 088 852 298 859 278 Other potassic fertilisers tonnes 2 365 2 385 3 020 1 879 2 251 Rare earths Metals tonnes 97 51 1 2 2 Cerium compounds tonnes 51 62 8 25 38 Other rare earth compounds tonnes 34 32 9 9 6 Ferro-cerium and other pyrophoric alloys tonnes ... ... ... 11 72

123
Spain
Exports continued
Commodity Units 2010 2011 2012 2013 2014
Salt tonnes 1 311 257 1 311 383 807 026 1 496 873 1 145 725 Sillimanite minerals tonnes 288 358 796 1 585 1 514 Silver Ores and concentrates kilograms 377 9 847 30 748 896 1 278 Metal kilograms 417 381 383 412 626 782 670 633 13 855 475 Sulphur and pyrites Sulphur tonnes 138 168 361 188 438 368 456 025 396 507 Sulphur, sublimed and precipitated tonnes 612 289 264 165 660 Talc tonnes 11 206 28 971 9 844 8 823 8 391 Tantalum and niobium Tantalum tonnes 4 11 3 13 7 Tin Unwrought (b) tonnes 513 449 558 978 580 Scrap tonnes 376 4 543 2 436 932 817 Titanium Titanium minerals tonnes 2 405 650 4 011 297 227 Metal tonnes 1 928 1 698 1 779 2 896 1 888 Oxides tonnes 35 233 48 870 51 919 85 355 81 080 Tungsten Ores and concentrates tonnes 400 981 1 074 958 1 460 Metal tonnes 315 880 453 504 350 Vanadium Pentoxide tonnes 22 774 26 9 102 Zinc Ores and concentrates tonnes 104 276 122 372 133 163 92 125 71 193 Unwrought tonnes 318 527 351 378 359 605 303 548 291 072 Unwrought alloys tonnes 91 054 35 318 38 229 42 674 56 974 Scrap tonnes 37 362 15 625 8 283 17 625 8 669 Zirconium Concentrates tonnes 122 372 29 952 14 360 8 031 10 191 Metal tonnes 51 3 64 73 50
Note(s) (a) Including burnt pyrites (b) Including alloys
Imports Commodity Units 2010 2011 2012 2013 2014
Primary aggregates tonnes 1 029 946 694 299 618 871 475 414 594 772 Aluminium and bauxite Bauxite tonnes 3 325 099 3 080 295 3 693 740 3 510 247 3 806 558 Alumina tonnes 31 527 61 184 28 910 31 683 31 029 Alumina hydrate tonnes 29 317 22 917 16 162 13 491 21 749 Unwrought tonnes 119 589 110 612 107 320 122 958 171 163 Unwrought alloys tonnes 229 036 219 925 207 511 202 690 207 579 Scrap tonnes 111 942 125 190 155 371 176 445 200 411 Antimony Ores and concentrates tonnes 103 29 10 7 10 Metal tonnes 2 642 2 450 1 553 2 760 1 609 Oxide tonnes 516 494 720 630 606 Arsenic Metallic arsenic tonnes 96 93 143 117 209 Asbestos Unmanufactured tonnes — 6 28 51 (a)* 632 Barytes Barium minerals tonnes 106 637 70 896 49 674 47 798 60 311 Bentonite tonnes 114 371 163 119 114 421 103 691 114 219 Bismuth Metal tonnes 141 99 103 107 49 Bromine kilograms 222 746 250 417 188 015 181 058 215 251

124
Spain
Imports continued
Commodity Units 2010 2011 2012 2013 2014
Cadmium Metal tonnes 153 38 37 39 59 Cement Cement clinkers tonnes 1 334 019 490 339 80 228 106 170 103 630 Portland cement tonnes 637 040 450 416 363 065 274 456 320 675 Other cement tonnes 14 479 15 884 17 347 24 997 23 245 Chromium Ores and concentrates tonnes 5 579 9 262 10 487 6 644 9 276 Metal tonnes 1 878 2 350 1 479 1 438 1 854 Coal Anthracite tonnes 846 015 852 813 594 330 544 040 566 371 Other coal tonnes 10 983 379 15 315 861 21 819 298 13 118 931 15 828 967 Cobalt Metal tonnes 144 159 233 209 259 Oxides tonnes 1 543 1 837 1 941 2 053 1 881 Copper Ores and concentrates tonnes 1 229 136 1 482 090 1 517 856 1 575 657 1 788 742 Matte and cement tonnes 992 17 530 9 417 4 889 131 Unwrought, unrefined tonnes 518 12 747 685 209 347 Unwrought, refined tonnes 73 877 62 695 44 567 60 873 44 247 Unwrought alloys tonnes 4 014 6 998 4 109 4 549 4 075 Scrap tonnes 82 931 89 499 97 129 104 671 114 867 Diamond Unsorted Carats £1 814 000 £3 864 000 £2 441 000 £2 139 000 £3 635 000 Gem, rough Carats £312 000 £276 000 £487 000 £207 000 £303 000 Gem, cut Carats £26 488 000 £25 312 000 £24 197 000 £25 904 000 £24 854 000 Industrial Carats £275 000 £605 000 £774 000 £580 000 £1 174 000 Dust Carats 27 500 320 27 699 364 * 19 429 000 * 19 405 000 * 18 568 000 Diatomite tonnes 8 203 8 026 7 368 6 480 8 202 Feldspar tonnes 856 406 993 378 926 809 1 092 403 1 235 414 Fluorspar tonnes 12 008 14 198 16 542 23 713 31 466 Gold Metal kilograms 44 542 46 695 24 180 103 946 803 063 Waste and scrap kilograms 2 780 29 069 33 912 25 382 21 318 Graphite tonnes 34 268 10 765 5 579 4 736 4 828 Gypsum Crude tonnes 20 776 13 207 11 943 5 398 11 959 Calcined tonnes 6 021 5 799 5 548 12 354 14 797 Iodine kilograms 342 914 522 768 357 482 534 309 461 345 Iron ore (b) tonnes 5 873 927 5 143 562 4 475 772 6 260 115 5 699 476 Iron, steel and ferro-alloys Pig iron tonnes 442 656 315 904 274 202 219 240 278 949 Sponge and powder tonnes 636 496 640 549 487 073 724 592 657 961 Ferro-chrome tonnes 164 125 152 254 180 740 168 647 202 818 Ferro-silico-chrome tonnes 1 854 5 448 4 037 5 878 5 673 Ferro-silico-magnesium tonnes 1 567 2 139 2 696 1 935 1 946 Ferro-manganese tonnes 19 930 15 256 23 224 14 088 6 801 Ferro-silico-manganese tonnes 39 895 36 803 39 584 36 653 33 322 Ferro-molybdenum tonnes 6 446 6 943 10 662 7 733 4 690 Ferro-nickel tonnes 47 389 43 284 45 528 47 485 44 498 Ferro-niobium tonnes 983 1 334 1 000 3 627 20 093 Ferro-phosphorus tonnes 1 425 1 816 1 282 1 478 1 515 Ferro-silicon tonnes 27 581 29 894 28 149 30 794 74 775 Ferro-titanium and ferro-silico-titanium tonnes 1 203 1 120 957 1 575 1 376 Ferro-tungsten and ferro-silico-tungsten tonnes 55 60 1 079 187 161 Ferro-vanadium tonnes 1 088 1 094 964 3 595 1 057 Other ferro-alloys tonnes 6 138 8 566 7 401 7 581 7 618 Silicon metal tonnes 8 446 11 801 12 573 16 647 8 840 Ingots, blooms, billets tonnes 1 269 577 1 061 766 1 025 012 789 798 976 739 Scrap tonnes 5 708 900 4 764 338 4 348 807 4 851 614 4 928 152 Kaolin tonnes 1 061 703 1 055 912 856 355 1 016 611 1 078 541 Lead Ores and concentrates tonnes 10 946 6 698 4 651 1 536 1 682 Unwrought tonnes 110 316 114 428 122 913 110 576 94 173 Scrap tonnes 43 432 42 236 34 702 35 284 32 249
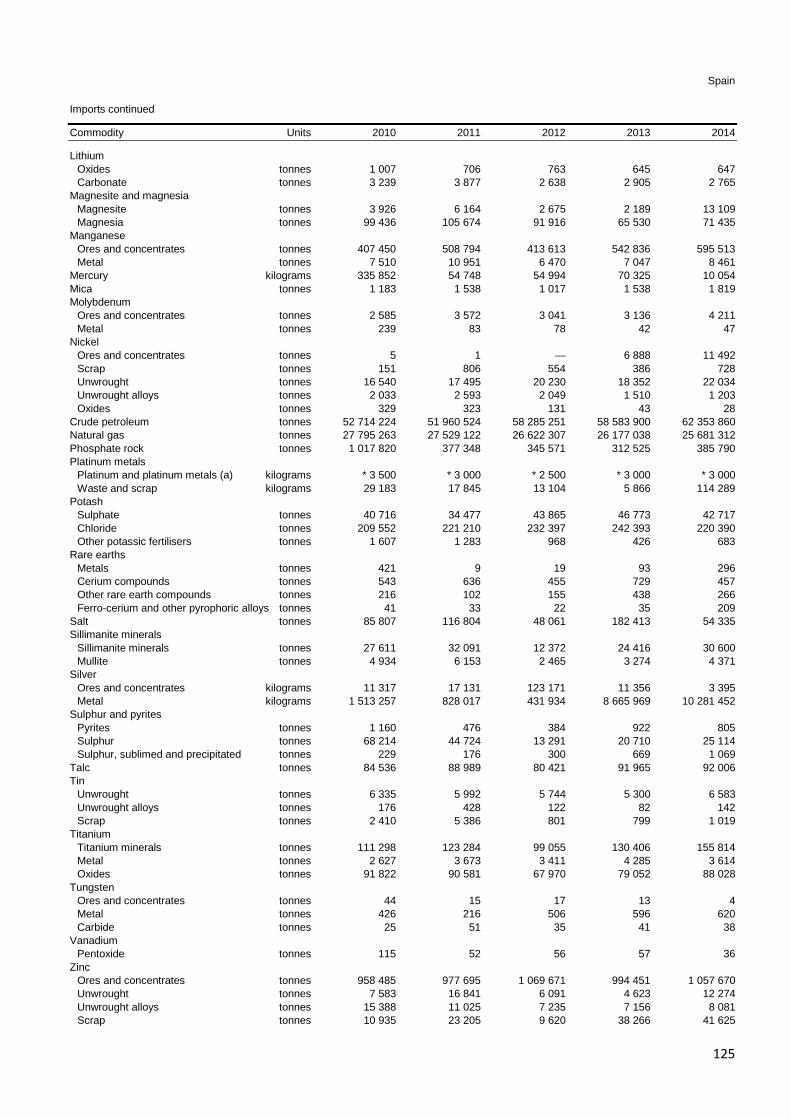
125
Spain
Imports continued
Commodity Units 2010 2011 2012 2013 2014
Lithium Oxides tonnes 1 007 706 763 645 647 Carbonate tonnes 3 239 3 877 2 638 2 905 2 765 Magnesite and magnesia Magnesite tonnes 3 926 6 164 2 675 2 189 13 109 Magnesia tonnes 99 436 105 674 91 916 65 530 71 435 Manganese Ores and concentrates tonnes 407 450 508 794 413 613 542 836 595 513 Metal tonnes 7 510 10 951 6 470 7 047 8 461 Mercury kilograms 335 852 54 748 54 994 70 325 10 054 Mica tonnes 1 183 1 538 1 017 1 538 1 819 Molybdenum Ores and concentrates tonnes 2 585 3 572 3 041 3 136 4 211 Metal tonnes 239 83 78 42 47 Nickel Ores and concentrates tonnes 5 1 — 6 888 11 492 Scrap tonnes 151 806 554 386 728 Unwrought tonnes 16 540 17 495 20 230 18 352 22 034 Unwrought alloys tonnes 2 033 2 593 2 049 1 510 1 203 Oxides tonnes 329 323 131 43 28 Crude petroleum tonnes 52 714 224 51 960 524 58 285 251 58 583 900 62 353 860 Natural gas tonnes 27 795 263 27 529 122 26 622 307 26 177 038 25 681 312 Phosphate rock tonnes 1 017 820 377 348 345 571 312 525 385 790 Platinum metals Platinum and platinum metals (a) kilograms * 3 500 * 3 000 * 2 500 * 3 000 * 3 000 Waste and scrap kilograms 29 183 17 845 13 104 5 866 114 289 Potash Sulphate tonnes 40 716 34 477 43 865 46 773 42 717 Chloride tonnes 209 552 221 210 232 397 242 393 220 390 Other potassic fertilisers tonnes 1 607 1 283 968 426 683 Rare earths Metals tonnes 421 9 19 93 296 Cerium compounds tonnes 543 636 455 729 457 Other rare earth compounds tonnes 216 102 155 438 266 Ferro-cerium and other pyrophoric alloys tonnes 41 33 22 35 209 Salt tonnes 85 807 116 804 48 061 182 413 54 335 Sillimanite minerals Sillimanite minerals tonnes 27 611 32 091 12 372 24 416 30 600 Mullite tonnes 4 934 6 153 2 465 3 274 4 371 Silver Ores and concentrates kilograms 11 317 17 131 123 171 11 356 3 395 Metal kilograms 1 513 257 828 017 431 934 8 665 969 10 281 452 Sulphur and pyrites Pyrites tonnes 1 160 476 384 922 805 Sulphur tonnes 68 214 44 724 13 291 20 710 25 114 Sulphur, sublimed and precipitated tonnes 229 176 300 669 1 069 Talc tonnes 84 536 88 989 80 421 91 965 92 006 Tin Unwrought tonnes 6 335 5 992 5 744 5 300 6 583 Unwrought alloys tonnes 176 428 122 82 142 Scrap tonnes 2 410 5 386 801 799 1 019 Titanium Titanium minerals tonnes 111 298 123 284 99 055 130 406 155 814 Metal tonnes 2 627 3 673 3 411 4 285 3 614 Oxides tonnes 91 822 90 581 67 970 79 052 88 028 Tungsten Ores and concentrates tonnes 44 15 17 13 4 Metal tonnes 426 216 506 596 620 Carbide tonnes 25 51 35 41 38 Vanadium Pentoxide tonnes 115 52 56 57 36 Zinc Ores and concentrates tonnes 958 485 977 695 1 069 671 994 451 1 057 670 Unwrought tonnes 7 583 16 841 6 091 4 623 12 274 Unwrought alloys tonnes 15 388 11 025 7 235 7 156 8 081 Scrap tonnes 10 935 23 205 9 620 38 266 41 625

126
Spain
Imports continued
Commodity Units 2010 2011 2012 2013 2014
Zirconium Concentrates tonnes 149 442 143 493 63 341 99 858 116 434 Metal tonnes 132 97 124 136 136
Note(s) (a) BGS estimates, based on known exports from certain countries (b) Including burnt pyrites

127
Sweden
Sweden
Production Commodity Units 2010 2011 2012 2013 2014
Primary aggregates Sand and gravel tonnes * 17 000 000 * 17 000 000 13 809 028 11 399 554 10 970 490 Crushed rock tonnes * 57 000 000 * 58 000 000 71 839 600 66 621 935 68 034 725 Primary aluminium tonnes 93 000 111 000 129 000 131 000 113 000 Cement Cement, clinker tonnes 1 790 784 * 1 750 000 * 1 750 000 * 1 750 000 * 1 750 000 Cement, finished tonnes 2 298 000 2 546 000 2 611 000 2 654 000 2 885 000 Copper, mine tonnes (metal content) 76 514 82 967 82 422 82 904 79 681 Copper, refined tonnes 190 497 219 316 214 050 206 193 217 337 Copper, smelter tonnes 141 500 161 500 151 100 140 400 150 000 Feldspar tonnes 22 000 30 000 27 000 30 000 27 000 Gold kilograms 6 285 5 994 6 015 6 530 6 849 Iron ore tonnes 28 797 000 30 840 000 32 198 000 37 411 000 35 759 000 Pig iron tonnes 3 447 000 3 240 000 2 805 000 2 896 000 3 078 000 Crude steel tonnes 4 845 600 4 867 000 4 326 000 4 404 000 4 539 000 Ferro-alloys Ferro-chrome tonnes 64 400 80 140 35 800 55 078 65 703 Lead, mine tonnes (metal content) 67 697 62 028 63 551 59 556 70 848 Lead, refined tonnes 59 179 52 438 61 528 68 713 68 708 Selenium metal tonnes 72 70 70 100 * 100 Silver kilograms (metal content) 302 145 301 959 309 337 341 346 382 611 Sulphur and pyrites Recovered (a) tonnes (sulphur content) 180 540 211 280 198 850 194 938 205 616 Recovered (b) tonnes (sulphur content) 83 947 92 973 93 442 64 587 86 538 Talc tonnes 4 000 3 000 — — — Tellurium metal tonnes — — 7 24 31 Zinc, mine tonnes (metal content) 198 687 194 021 188 325 176 582 221 841
Notes (a) From metal sulphide processing (b) From petroleum refining and/or natural gas
Exports Commodity Units 2010 2011 2012 2013 2014
Primary aggregates tonnes 2 248 515 1 624 154 1 602 379 1 234 782 1 079 882 Aluminium and bauxite Alumina tonnes 19 037 13 870 10 401 9 818 6 560 Unwrought (a) tonnes 190 589 183 681 188 936 172 557 175 092 Scrap tonnes 88 070 95 632 108 353 103 323 112 292 Bentonite tonnes 3 457 3 300 5 492 9 949 10 085 Bismuth Metal tonnes 11 1 — — — Cadmium Oxide tonnes 360 429 335 330 338 Cement Cement clinkers tonnes 505 585 267 884 391 898 357 876 132 346 Portland cement tonnes 467 559 590 443 782 362 752 187 1 166 546 Other cement tonnes 5 819 7 120 8 546 7 774 7 694 Chromium Metal tonnes 191 167 123 122 140 Cobalt Metal tonnes 220 99 200 364 223 Copper Ores and concentrates tonnes 24 8 010 4 266 4 — Unwrought tonnes 71 394 92 971 105 338 91 292 108 584 Unwrought alloys tonnes 8 563 5 615 3 585 4 773 4 738 Scrap tonnes 43 311 58 031 58 829 56 469 66 735

128
Sweden
Exports continued
Commodity Units 2010 2011 2012 2013 2014
Diamond Dust Carats 500 000 — — ... 2 000 000 Diatomite tonnes 829 1 098 1 214 1 116 1 138 Feldspar tonnes 11 251 19 258 16 831 14 081 21 413 Fluorspar tonnes 8 101 11 053 13 714 11 668 10 106 Gold Metal kilograms 14 700 12 900 16 600 15 100 14 600 Waste and scrap kilograms 5 100 21 000 9 700 2 400 21 900 Graphite tonnes 254 129 129 114 192 Gypsum Crude and calcined tonnes 8 155 3 865 4 466 6 522 7 375 Iodine kilograms 700 900 7 900 (b)* 500 (b)* 600 Iron ore tonnes 20 726 152 21 115 203 22 869 383 23 455 915 23 727 480 Iron, steel and ferro-alloys Pig iron tonnes 146 027 133 387 109 644 34 960 66 844 Sponge and powder tonnes 12 335 313 081 297 427 293 451 302 616 Ferro-chrome tonnes 51 010 2 752 2 525 37 393 43 515 Ferro-manganese and ferro-silico- manganese tonnes 3 517 3 581 2 835 2 395 2 826 Ferro-molybdenum tonnes 340 375 294 253 276 Ferro-niobium tonnes 475 622 771 743 1 062 Ferro-phosphorus tonnes 582 448 479 497 535 Ferro-silicon tonnes 6 905 6 903 15 630 20 102 12 954 Ferro-tungsten and ferro-silico-tungsten tonnes 5 25 165 403 219 Other ferro-alloys tonnes 68 75 78 56 162 Silicon metal tonnes 2 337 1 274 1 206 1 409 2 013 Ingots, blooms, billets tonnes 261 273 235 814 450 860 415 798 256 503 Scrap tonnes 1 352 399 1 484 197 1 543 542 1 317 282 1 490 281 Kaolin tonnes 23 103 16 444 7 032 769 605 Lead Ores and concentrates tonnes 111 153 73 996 68 646 43 506 64 208 Unwrought tonnes 55 501 54 370 51 796 71 771 66 869 Scrap tonnes 1 445 1 471 1 425 1 113 9 181 Magnesite and magnesia Magnesia tonnes 303 165 130 69 109 Nickel Unwrought (a) tonnes 497 599 1 690 385 1 021 Oxides tonnes 534 516 429 406 401 Scrap tonnes 1 022 1 137 13 853 1 265 1 396 Crude petroleum tonnes 2 3 105 22 040 2 797 699 Natural gas tonnes 21 6 159 475 13 416 25 221 Phosphate rock tonnes 125 2 253 1 826 1 558 2 536 Platinum metals Platinum and platinum metals kilograms £429 000 £1 203 000 £801 000 £1 550 000 £2 194 000 Waste and scrap kilograms 69 000 43 600 39 100 24 900 62 100 Potash Sulphate tonnes 93 796 84 381 69 205 79 724 99 551 Rare earths Cerium compounds tonnes 9 * 0 5 3 3 Salt tonnes 12 742 13 297 8 973 6 459 7 219 Silver Metal kilograms 412 900 428 500 480 100 457 100 501 000 Sulphur and pyrites Sulphur tonnes 2 768 3 980 10 145 13 751 11 598 Sulphur, sublimed and precipitated tonnes 11 564 10 344 5 248 1 601 2 380 Talc tonnes 9 014 8 308 4 598 4 915 3 598 Tin Unwrought (a) tonnes 163 52 32 46 56 Scrap tonnes 27 71 34 48 110 Titanium Metal tonnes 925 1 086 1 111 981 1 453 Oxides tonnes 20 567 18 331 16 429 15 109 16 125 Tungsten Ores and concentrates tonnes — 21 149 105 25 Metal tonnes 289 218 122 495 197 Carbide tonnes 401 186 109 87 28

129
Sweden
Exports continued
Commodity Units 2010 2011 2012 2013 2014
Zinc Ores and concentrates tonnes 362 085 374 501 343 725 333 534 411 944 Scrap tonnes 2 900 3 257 3 166 2 877 2 143
Note(s) (a) Including alloys (b) BGS estimates, based on known imports into certain countries
Imports Commodity Units 2010 2011 2012 2013 2014
Primary aggregates tonnes 533 148 802 173 944 006 924 873 988 134 Aluminium and bauxite Bauxite tonnes 6 660 10 460 12 271 13 074 15 944 Alumina tonnes 211 393 266 978 258 634 278 411 210 340 Alumina hydrate tonnes 95 073 77 121 64 907 66 055 68 803 Unwrought tonnes 35 506 22 371 26 948 22 447 38 605 Unwrought alloys tonnes 188 198 175 194 125 377 108 735 134 294 Scrap tonnes 48 508 47 458 49 270 59 064 72 278 Antimony Oxide tonnes 219 227 194 153 149 Barytes Barium minerals tonnes 4 406 4 224 3 947 2 666 3 510 Bentonite tonnes 200 422 214 173 231 973 189 875 237 429 Bismuth Metal tonnes 12 2 4 2 24 Cadmium Metal tonnes 825 1 127 1 172 1 108 1 529 Oxide tonnes 107 172 145 105 13 Cement Cement clinkers tonnes 36 629 58 132 5 230 8 044 76 665 Portland cement tonnes 348 431 419 332 391 030 403 823 455 351 Other cement tonnes 36 399 42 002 43 520 67 981 84 244 Chromium Ores and concentrates (a) tonnes * 169 000 * 128 600 * 135 900 * 79 000 * 221 900 Metal tonnes 4 999 6 598 6 139 5 490 3 870 Coal Anthracite tonnes 48 767 38 136 34 827 32 706 33 818 Other coal tonnes 3 236 437 2 971 646 2 218 768 2 499 142 2 729 091 Cobalt Metal tonnes 396 571 443 287 442 Copper Ores and concentrates tonnes 302 514 300 878 310 772 270 120 274 664 Unwrought, unrefined tonnes 3 100 5 843 6 690 7 826 6 903 Unwrought, refined tonnes 46 383 31 760 30 772 6 906 475 Unwrought alloys tonnes 5 181 3 186 2 588 3 222 3 362 Scrap tonnes 108 971 121 099 139 188 152 058 103 319 Diamond Unsorted Carats £125 000 £105 000 £178 000 £128 828 £148 000 Gem, cut Carats 9 615 12 118 * 8 000 * 8 000 * 8 000 Industrial Carats 26 277 5 390 * 8 100 * 12 000 * 23 000 Dust Carats 8 000 000 9 500 000 22 000 000 61 500 000 67 500 000 Diatomite tonnes 8 099 8 247 7 532 7 410 7 037 Feldspar tonnes 6 410 4 363 547 3 803 4 140 Fluorspar tonnes 9 451 14 980 10 729 6 815 10 717 Gold Metal kilograms £32 625 000 £42 028 000 £33 413 000 £38 738 665 £33 702 000 Waste and scrap kilograms £12 243 000 £33 337 000 £26 246 000 £1 074 504 £984 000 Graphite tonnes 1 315 1 129 779 893 844 Gypsum Crude tonnes 256 696 324 584 294 946 271 096 337 505 Calcined tonnes 73 865 58 751 48 111 60 279 64 079

130
Sweden
Imports continued
Commodity Units 2010 2011 2012 2013 2014
Iodine kilograms 1 100 1 800 8 600 1 700 2 900 Iron ore Iron ore tonnes 55 078 51 334 44 285 26 028 26 374 Burnt pyrites tonnes 16 743 24 561 22 191 ... 4 014 Iron, steel and ferro-alloys Pig iron tonnes 58 974 78 818 58 329 53 075 57 075 Sponge and powder tonnes 11 668 24 398 34 982 39 343 32 521 Ferro-chrome tonnes 90 630 74 988 56 996 64 917 69 787 Ferro-silico-chrome tonnes 1 805 4 133 803 1 251 1 901 Ferro-silico-magnesium tonnes 424 20 44 28 38 Ferro-manganese tonnes 60 577 57 927 45 423 36 501 35 293 Ferro-silico-manganese tonnes 9 099 11 586 15 965 15 241 18 638 Ferro-molybdenum tonnes 4 388 4 723 4 913 5 205 4 374 Ferro-nickel tonnes 7 995 10 119 10 119 11 819 16 693 Ferro-niobium tonnes 1 146 1 544 1 614 1 645 2 122 Ferro-phosphorus tonnes 415 632 584 671 657 Ferro-silicon tonnes 37 424 37 743 44 736 38 173 37 700 Ferro-titanium and ferro-silico-titanium tonnes 1 127 1 459 1 731 1 421 1 526 Ferro-vanadium tonnes 729 1 058 954 766 841 Other ferro-alloys tonnes 2 097 1 894 1 691 1 676 1 514 Silicon metal tonnes 6 818 5 375 6 112 8 391 9 264 Ingots, blooms, billets tonnes 193 605 203 669 151 187 121 328 168 391 Scrap tonnes 217 682 245 225 236 125 256 251 295 477 Kaolin tonnes 367 948 389 358 359 345 316 362 324 835 Lead Ores and concentrates tonnes 14 763 — — — 10 Unwrought tonnes 5 340 5 783 6 616 6 876 6 235 Scrap tonnes 9 464 8 401 9 624 9 282 9 572 Lithium Oxides tonnes 214 243 213 235 218 Carbonate tonnes 87 69 159 126 136 Magnesite and magnesia Magnesia tonnes 12 004 20 425 19 081 18 068 21 886 Manganese Ores and concentrates tonnes 522 438 412 504 535 Metal tonnes 3 815 5 241 3 438 4 838 5 889 Mercury kilograms 2 700 2 400 1 400 1 200 5 000 Mica tonnes 673 545 419 429 488 Molybdenum Ores and concentrates tonnes 5 487 5 893 6 110 5 988 6 218 Metal tonnes 644 360 356 160 172 Oxides tonnes 414 357 496 880 673 Nickel Mattes, sinters etc tonnes 1 239 1 723 1 008 777 179 Scrap tonnes 10 491 10 332 8 801 8 898 9 881 Unwrought tonnes 23 375 23 191 17 878 17 406 18 291 Unwrought alloys tonnes 397 216 542 1 226 839 Crude petroleum tonnes 18 236 284 17 988 419 20 429 251 15 900 863 17 390 820 Natural gas tonnes 1 066 174 899 467 816 561 804 417 745 739 Phosphate rock tonnes 3 869 12 968 10 687 4 831 4 244 Platinum metals Platinum and platinum metals kilograms £7 551 000 £8 430 000 £12 301 000 £8 081 000 £10 548 769 Waste and scrap kilograms 1 500 19 800 12 700 1 100 5 200 Potash Sulphate tonnes 1 789 2 551 1 340 1 855 1 663 Chloride tonnes 55 671 79 863 81 282 74 406 92 734 Other potassic fertilisers tonnes 5 858 9 276 8 187 5 193 2 719 Rare earths Metals tonnes 37 48 72 62 52 Cerium compounds tonnes 47 55 31 1 1 Other rare earth compounds tonnes 7 9 16 37 21 Salt tonnes 905 190 933 936 745 276 958 222 669 334 Sillimanite minerals tonnes 4 782 5 174 4 225 4 677 4 906 Silver Ores and concentrates kilograms ... (a)* 87 (a)* 131 ... 72 400 Metal kilograms 83 700 90 900 94 900 80 900 68 500

131
Sweden
Imports continued
Commodity Units 2010 2011 2012 2013 2014
Sulphur and pyrites Pyrites tonnes 874 825 744 820 754 Sulphur tonnes 56 961 65 296 42 457 34 206 48 378 Sulphur, sublimed and precipitated tonnes 200 145 130 138 555 Talc tonnes 25 998 22 202 22 507 18 259 18 149 Tin Unwrought (b) tonnes 435 189 149 201 180 Titanium Titanium minerals tonnes 1 854 645 629 661 1 569 Metal tonnes 1 936 2 390 2 245 2 072 2 323 Oxides tonnes 61 191 62 054 53 030 52 729 53 879 Tungsten Metal tonnes 179 302 538 407 280 Carbide tonnes 1 308 2 050 852 1 088 881 Zinc Unwrought tonnes 37 524 30 598 24 686 23 619 25 827 Unwrought alloys tonnes 5 905 6 282 5 907 6 536 6 910 Zirconium Metal tonnes 220 120 146 119 121
Note(s) (a) BGS estimates, based on known exports from certain countries (b) Including alloys

132
Switzerland
Switzerland
Production Commodity Units 2010 2011 2012 2013 2014
Primary aggregates Sand and gravel tonnes * 40 000 000 51 940 000 49 780 000 49 480 000 53 940 000 Crushed rock tonnes * 5 000 000 2 432 977 2 328 758 2 445 464 2 401 627 Cement Cement, finished (a) tonnes 4 553 077 4 687 138 4 395 084 4 563 931 4 583 355 Gypsum tonnes 335 000 300 000 297 000 284 000 242 000 Crude steel tonnes 1 320 000 1 400 000 * 1 450 000 * 1 530 000 * 1 500 000 Salt tonnes 643 000 478 324 492 700 560 076 418 389
Notes (a) Includes production in Liechtenstein
Exports Commodity Units 2010 2011 2012 2013 2014
Primary aggregates tonnes 193 312 188 183 274 029 215 232 222 546 Aluminium and bauxite Unwrought (a) tonnes 20 954 23 397 23 439 25 570 22 153 Scrap tonnes 131 819 138 643 141 836 149 337 157 396 Asbestos Unmanufactured tonnes 42 17 10 30 ... Cement Cement clinkers tonnes 6 983 104 35 350 45 Portland cement tonnes 103 952 63 262 72 143 142 900 151 319 Other cement tonnes 2 959 51 67 467 227 Chromium Metal tonnes 82 92 111 322 275 Cobalt Metal tonnes 80 97 113 125 103 Copper Unwrought tonnes 832 1 030 935 1 470 1 779 Scrap tonnes 75 973 84 373 86 964 80 104 82 237 Diamond Gem, rough Carats 14 892 3 628 5 000 5 000 5 000 Gem, cut Carats 357 976 435 272 145 000 110 000 140 000 Dust Carats 60 980 000 70 880 000 59 620 000 72 175 000 60 575 000 Diatomite tonnes 453 564 629 447 266 Gold Metal kilograms 1 605 359 1 867 822 1 627 583 2 853 431 1 824 340 Waste and scrap kilograms 105 407 94 837 71 297 162 383 154 409 Graphite tonnes 326 100 96 85 100 Gypsum Crude and calcined tonnes 8 536 8 606 7 283 5 386 4 597 Iodine kilograms 349 239 238 17 244 1 952 Iron, steel and ferro-alloys Sponge and powder tonnes 2 191 981 1 013 908 184 Ferro-alloys tonnes 1 191 1 299 848 1 026 874 Ingots, blooms, billets tonnes 66 642 85 201 70 375 74 934 74 578 Scrap tonnes 623 910 630 837 626 757 714 655 633 366 Kaolin tonnes 287 55 201 425 189 Lead Scrap tonnes 5 497 5 732 5 301 4 424 4 407 Lithium Oxides tonnes 190 1 83 91 92 Mercury kilograms 8 529 53 581 164 517 132 596 87 222 Nickel Unwrought (a) tonnes 173 130 62 63 103 Scrap tonnes 1 090 909 1 214 1 069 1 649

133
Switzerland
Exports continued
Commodity Units 2010 2011 2012 2013 2014
Platinum metals Platinum kilograms 72 006 63 853 64 331 53 309 30 715 Palladium kilograms 70 662 60 859 56 950 50 029 42 138 Other platinum metals kilograms 464 494 836 977 1 252 Waste and scrap kilograms 314 061 289 174 241 307 365 333 260 344 Rare earths Cerium compounds tonnes 2 9 5 3 4 Other rare earth compounds tonnes 1 1 5 1 1 Salt tonnes 67 537 71 525 58 820 70 945 61 889 Silver Metal kilograms 1 456 475 1 779 063 1 719 300 2 490 396 2 195 532 Sulphur and pyrites Sulphur tonnes 5 310 4 864 2 160 5 494 4 854 Tantalum and niobium Tantalum tonnes — 1 2 ... 23 Tin Scrap tonnes 118 131 169 102 112 Titanium Metal tonnes 805 868 724 887 1 038 Oxides tonnes 1 466 1 666 1 623 2 009 2 130 Tungsten Metal tonnes 476 398 400 323 448 Zinc Scrap tonnes 2 582 2 846 2 284 1 889 2 222
Note(s) (a) Including alloys
Imports Commodity Units 2010 2011 2012 2013 2014
Primary aggregates tonnes 8 010 059 8 566 572 8 611 775 8 315 656 8 687 660 Aluminium and bauxite Bauxite tonnes 6 718 11 898 10 924 10 792 5 779 Alumina tonnes 10 662 9 957 8 625 8 295 9 855 Alumina hydrate tonnes 20 697 19 131 17 473 16 761 16 310 Unwrought tonnes 148 099 166 853 159 296 162 271 169 257 Unwrought alloys tonnes 84 113 70 200 59 087 60 952 82 461 Scrap tonnes 33 341 36 829 43 797 50 969 52 345 Antimony Oxide tonnes 1 108 1 131 583 505 492 Barytes Barium minerals tonnes 3 020 3 156 3 359 3 429 3 434 Bentonite tonnes 20 362 19 316 19 203 19 982 19 037 Bismuth Metal tonnes 25 18 12 16 15 Cement Cement clinkers tonnes 74 946 46 117 2 580 62 514 82 786 Portland cement tonnes 465 699 538 979 526 305 588 965 642 843 Other cement tonnes 49 549 73 361 92 633 121 136 144 179 Chromium Ores and concentrates tonnes 1 051 809 1 359 1 253 643 Metal tonnes 74 71 93 147 104 Coal Anthracite tonnes 7 164 7 144 12 121 16 400 10 766 Other coal tonnes 124 096 92 473 129 051 128 071 29 523 Lignite tonnes 62 756 69 378 48 704 59 651 131 895 Briquettes tonnes 3 328 2 887 3 750 4 490 2 066 Cobalt Metal tonnes 318 298 260 222 320
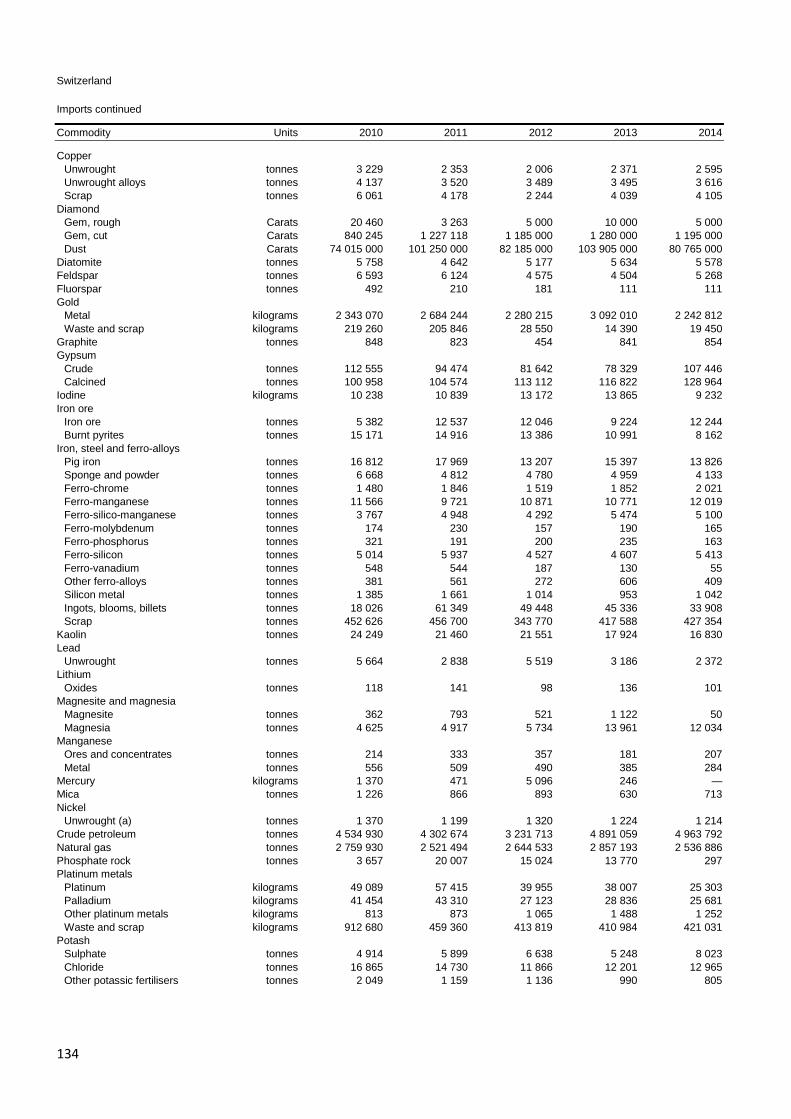
134
Switzerland
Imports continued
Commodity Units 2010 2011 2012 2013 2014
Copper Unwrought tonnes 3 229 2 353 2 006 2 371 2 595 Unwrought alloys tonnes 4 137 3 520 3 489 3 495 3 616 Scrap tonnes 6 061 4 178 2 244 4 039 4 105 Diamond Gem, rough Carats 20 460 3 263 5 000 10 000 5 000 Gem, cut Carats 840 245 1 227 118 1 185 000 1 280 000 1 195 000 Dust Carats 74 015 000 101 250 000 82 185 000 103 905 000 80 765 000 Diatomite tonnes 5 758 4 642 5 177 5 634 5 578 Feldspar tonnes 6 593 6 124 4 575 4 504 5 268 Fluorspar tonnes 492 210 181 111 111 Gold Metal kilograms 2 343 070 2 684 244 2 280 215 3 092 010 2 242 812 Waste and scrap kilograms 219 260 205 846 28 550 14 390 19 450 Graphite tonnes 848 823 454 841 854 Gypsum Crude tonnes 112 555 94 474 81 642 78 329 107 446 Calcined tonnes 100 958 104 574 113 112 116 822 128 964 Iodine kilograms 10 238 10 839 13 172 13 865 9 232 Iron ore Iron ore tonnes 5 382 12 537 12 046 9 224 12 244 Burnt pyrites tonnes 15 171 14 916 13 386 10 991 8 162 Iron, steel and ferro-alloys Pig iron tonnes 16 812 17 969 13 207 15 397 13 826 Sponge and powder tonnes 6 668 4 812 4 780 4 959 4 133 Ferro-chrome tonnes 1 480 1 846 1 519 1 852 2 021 Ferro-manganese tonnes 11 566 9 721 10 871 10 771 12 019 Ferro-silico-manganese tonnes 3 767 4 948 4 292 5 474 5 100 Ferro-molybdenum tonnes 174 230 157 190 165 Ferro-phosphorus tonnes 321 191 200 235 163 Ferro-silicon tonnes 5 014 5 937 4 527 4 607 5 413 Ferro-vanadium tonnes 548 544 187 130 55 Other ferro-alloys tonnes 381 561 272 606 409 Silicon metal tonnes 1 385 1 661 1 014 953 1 042 Ingots, blooms, billets tonnes 18 026 61 349 49 448 45 336 33 908 Scrap tonnes 452 626 456 700 343 770 417 588 427 354 Kaolin tonnes 24 249 21 460 21 551 17 924 16 830 Lead Unwrought tonnes 5 664 2 838 5 519 3 186 2 372 Lithium Oxides tonnes 118 141 98 136 101 Magnesite and magnesia Magnesite tonnes 362 793 521 1 122 50 Magnesia tonnes 4 625 4 917 5 734 13 961 12 034 Manganese Ores and concentrates tonnes 214 333 357 181 207 Metal tonnes 556 509 490 385 284 Mercury kilograms 1 370 471 5 096 246 — Mica tonnes 1 226 866 893 630 713 Nickel Unwrought (a) tonnes 1 370 1 199 1 320 1 224 1 214 Crude petroleum tonnes 4 534 930 4 302 674 3 231 713 4 891 059 4 963 792 Natural gas tonnes 2 759 930 2 521 494 2 644 533 2 857 193 2 536 886 Phosphate rock tonnes 3 657 20 007 15 024 13 770 297 Platinum metals Platinum kilograms 49 089 57 415 39 955 38 007 25 303 Palladium kilograms 41 454 43 310 27 123 28 836 25 681 Other platinum metals kilograms 813 873 1 065 1 488 1 252 Waste and scrap kilograms 912 680 459 360 413 819 410 984 421 031 Potash Sulphate tonnes 4 914 5 899 6 638 5 248 8 023 Chloride tonnes 16 865 14 730 11 866 12 201 12 965 Other potassic fertilisers tonnes 2 049 1 159 1 136 990 805

135
Switzerland
Imports continued
Commodity Units 2010 2011 2012 2013 2014
Rare earths Metals tonnes 4 5 21 11 5 Cerium compounds tonnes 31 18 15 11 14 Other rare earth compounds tonnes 16 12 17 40 38 Ferro-cerium and other pyrophoric alloys tonnes ... 5 3 23 1 Salt tonnes 37 731 58 307 23 179 27 569 9 701 Sillimanite minerals tonnes 1 162 1 596 1 079 1 580 1 169 Silver Ores and concentrates (b) kilograms * 24 000 * 115 000 * 30 000 * 31 000 * 22 000 Metal kilograms 1 746 243 2 155 625 2 397 273 1 935 822 1 279 130 Sulphur and pyrites Pyrites tonnes 185 128 131 116 248 Sulphur tonnes 17 414 13 072 14 257 14 183 14 121 Talc tonnes 8 490 7 666 6 975 7 377 7 074 Tin Unwrought (a) tonnes 863 737 799 857 835 Titanium Metal tonnes 971 1 081 1 177 1 207 1 463 Oxides tonnes 19 725 22 198 16 806 18 186 19 436 Tungsten Metal tonnes 143 226 234 176 156 Zinc Unwrought tonnes 15 521 12 747 11 702 11 554 10 560 Unwrought alloys tonnes 2 276 2 158 1 930 1 648 2 080
Note(s) (a) Including alloys (b) BGS estimates, based on known exports from certain countries

136
Turkey
Turkey
Production Commodity Units 2010 2011 2012 2013 2014
Bauxite tonnes 1 311 064 1 024 915 1 521 150 795 562 * 800 000 Alumina tonnes (Al2O3 content) * 160 000 * 210 000 * 220 000 * 186 000 * 190 000 Primary aluminium tonnes 54 100 56 400 43 700 32 200 30 400 Antimony tonnes (metal content) 1 403 2 340 7 119 4 512 * 4 500 Barytes tonnes 172 618 250 786 * 250 000 * 250 000 * 340 000 Bentonite and Fuller's Earth Bentonite tonnes 718 260 471 528 1 033 568 622 872 * 620 000 Sepiolite tonnes * 10 000 * 10 000 * 10 000 * 10 000 * 10 000 Borates tonnes 2 504 249 2 729 849 1 814 725 1 748 231 * 1 750 000 Cadmium tonnes — — — 12 * 12 Cement Cement, clinker tonnes 54 222 939 53 228 248 * 53 000 000 * 53 000 000 * 53 000 000 Cement, finished tonnes 70 800 657 66 656 800 67 019 400 72 687 000 71 239 000 Chromium tonnes 2 461 314 2 281 981 3 295 398 4 140 655 * 4 100 000 Coal Anthracite tonnes 6 312 137 5 619 316 3 358 843 * 3 100 000 * 3 100 000 Bituminous tonnes * 3 000 000 3 542 223 3 502 009 2 789 338 * 2 800 000 Lignite tonnes 86 943 392 79 968 510 75 036 558 * 75 000 000 * 75 000 000 Copper, mine tonnes (metal content) 79 900 92 500 104 300 120 500 122 000 Copper, refined tonnes 47 300 74 354 59 673 75 000 71 200 Copper, smelter tonnes * 25 000 * 30 600 * 35 500 * 35 800 * 35 100 Diatomite tonnes 18 448 45 187 86 403 84 751 * 85 000 Feldspar tonnes 6 281 597 7 076 068 7 076 068 7 090 677 7 609 692 Fluorspar tonnes 25 189 4 524 5 197 3 874 * 3 800 Gold kilograms 16 890 24 000 29 390 33 980 31 000 Graphite tonnes — 5 250 31 500 28 740 * 28 500 Gypsum tonnes 6 321 891 5 723 439 8 248 446 9 790 097 * 9 800 000 Iron ore tonnes 5 378 455 6 308 448 7 599 511 * 7 700 000 * 7 700 000 Pig iron tonnes 16 362 115 14 877 155 18 289 109 19 548 094 * 20 000 000 Crude steel tonnes 29 029 789 30 562 184 35 885 000 34 654 000 34 035 000 Ferro-alloys Ferro-chrome tonnes * 50 000 * 40 000 * 40 000 * 40 000 * 40 000 Ferro-silico-chrome tonnes * 3 000 * 3 000 * 3 000 * 3 000 * 3 000 Kaolin tonnes 787 287 1 229 352 988 081 1 027 189 734 072 Lead, mine tonnes (metal content) 39 000 38 682 57 017 76 638 62 190 Lead, refined tonnes * 42 000 * 48 000 * 50 000 * 50 000 * 55 000 Magnesite tonnes 2 316 763 2 588 276 2 475 828 2 597 465 * 2 600 000 Manganese tonnes 134 336 172 480 192 756 321 785 * 320 000 Mica tonnes 36 009 17 542 1 253 2 304 * 2 300 Molybdenum tonnes (metal content) — 3 — 1 * 1 Natural gas million m3 626 536 547 562 * 550 Nickel, mined tonnes (metal content) 2 539 848 3 805 1 076 2 400 Perlite tonnes 545 585 702 673 887 600 1 075 949 * 1 100 000 Crude petroleum tonnes 2 602 114 * 2 600 000 2 957 000 2 508 894 2 373 000 Salt tonnes 4 044 254 6 545 546 5 254 813 5 564 736 * 5 500 000 Silver kilograms (metal content) 363 520 246 500 193 890 189 600 205 000 Natural sodium carbonate tonnes 1 623 192 1 749 068 1 852 817 1 665 077 * 1 650 000 Sulphur and pyrites Pyrites tonnes (sulphur content) 55 152 56 780 52 080 45 348 * 40 000 Recovered (a)(b) tonnes (sulphur content) 72 900 72 900 72 900 * 72 900 * 72 900 Sulphur ore tonnes (sulphur content) 427 3 820 5 889 8 069 * 10 000 Talc Pyrophyllite tonnes 192 643 115 462 85 251 101 872 * 100 000 Talc tonnes 1 826 9 959 14 537 1 132 * 1 100 Zinc, mine tonnes (metal content) 195 500 158 057 195 793 195 025 210 152
Notes (a) From petroleum refining and/or natural gas (b) Other
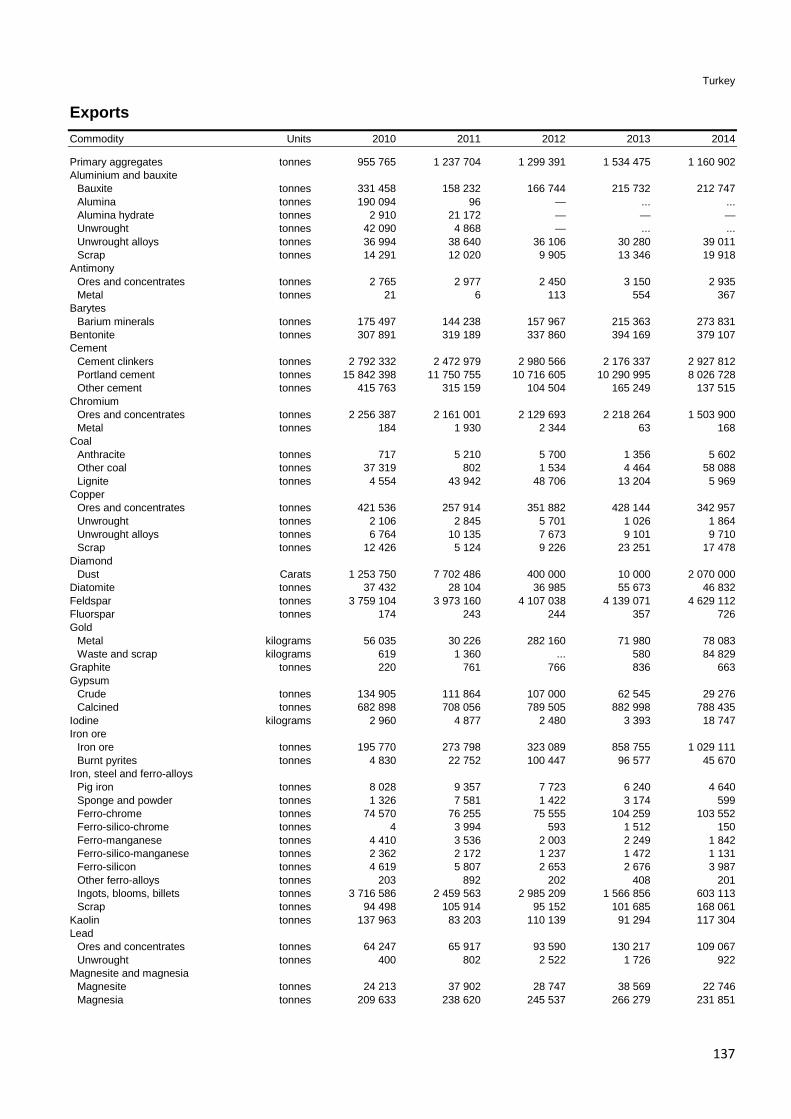
137
Turkey Exports Commodity Units 2010 2011 2012 2013 2014
Primary aggregates tonnes 955 765 1 237 704 1 299 391 1 534 475 1 160 902 Aluminium and bauxite Bauxite tonnes 331 458 158 232 166 744 215 732 212 747 Alumina tonnes 190 094 96 — ... ... Alumina hydrate tonnes 2 910 21 172 — — — Unwrought tonnes 42 090 4 868 — ... ... Unwrought alloys tonnes 36 994 38 640 36 106 30 280 39 011 Scrap tonnes 14 291 12 020 9 905 13 346 19 918 Antimony Ores and concentrates tonnes 2 765 2 977 2 450 3 150 2 935 Metal tonnes 21 6 113 554 367 Barytes Barium minerals tonnes 175 497 144 238 157 967 215 363 273 831 Bentonite tonnes 307 891 319 189 337 860 394 169 379 107 Cement Cement clinkers tonnes 2 792 332 2 472 979 2 980 566 2 176 337 2 927 812 Portland cement tonnes 15 842 398 11 750 755 10 716 605 10 290 995 8 026 728 Other cement tonnes 415 763 315 159 104 504 165 249 137 515 Chromium Ores and concentrates tonnes 2 256 387 2 161 001 2 129 693 2 218 264 1 503 900 Metal tonnes 184 1 930 2 344 63 168 Coal Anthracite tonnes 717 5 210 5 700 1 356 5 602 Other coal tonnes 37 319 802 1 534 4 464 58 088 Lignite tonnes 4 554 43 942 48 706 13 204 5 969 Copper Ores and concentrates tonnes 421 536 257 914 351 882 428 144 342 957 Unwrought tonnes 2 106 2 845 5 701 1 026 1 864 Unwrought alloys tonnes 6 764 10 135 7 673 9 101 9 710 Scrap tonnes 12 426 5 124 9 226 23 251 17 478 Diamond Dust Carats 1 253 750 7 702 486 400 000 10 000 2 070 000 Diatomite tonnes 37 432 28 104 36 985 55 673 46 832 Feldspar tonnes 3 759 104 3 973 160 4 107 038 4 139 071 4 629 112 Fluorspar tonnes 174 243 244 357 726 Gold Metal kilograms 56 035 30 226 282 160 71 980 78 083 Waste and scrap kilograms 619 1 360 ... 580 84 829 Graphite tonnes 220 761 766 836 663 Gypsum Crude tonnes 134 905 111 864 107 000 62 545 29 276 Calcined tonnes 682 898 708 056 789 505 882 998 788 435 Iodine kilograms 2 960 4 877 2 480 3 393 18 747 Iron ore Iron ore tonnes 195 770 273 798 323 089 858 755 1 029 111 Burnt pyrites tonnes 4 830 22 752 100 447 96 577 45 670 Iron, steel and ferro-alloys Pig iron tonnes 8 028 9 357 7 723 6 240 4 640 Sponge and powder tonnes 1 326 7 581 1 422 3 174 599 Ferro-chrome tonnes 74 570 76 255 75 555 104 259 103 552 Ferro-silico-chrome tonnes 4 3 994 593 1 512 150 Ferro-manganese tonnes 4 410 3 536 2 003 2 249 1 842 Ferro-silico-manganese tonnes 2 362 2 172 1 237 1 472 1 131 Ferro-silicon tonnes 4 619 5 807 2 653 2 676 3 987 Other ferro-alloys tonnes 203 892 202 408 201 Ingots, blooms, billets tonnes 3 716 586 2 459 563 2 985 209 1 566 856 603 113 Scrap tonnes 94 498 105 914 95 152 101 685 168 061 Kaolin tonnes 137 963 83 203 110 139 91 294 117 304 Lead Ores and concentrates tonnes 64 247 65 917 93 590 130 217 109 067 Unwrought tonnes 400 802 2 522 1 726 922 Magnesite and magnesia Magnesite tonnes 24 213 37 902 28 747 38 569 22 746 Magnesia tonnes 209 633 238 620 245 537 266 279 231 851

138
Turkey Exports continued
Commodity Units 2010 2011 2012 2013 2014
Manganese Ores and concentrates tonnes 51 731 100 172 118 953 310 479 126 140 Metal tonnes 4 952 12 3 535 1 468 943 Mercury kilograms 2 156 10 890 4 392 1 245 6 690 Mica tonnes 601 1 039 1 054 624 572 Molybdenum Ores and concentrates tonnes 160 266 — 1 498 1 522 Metal tonnes 42 64 11 22 2 Nickel Ores and concentrates tonnes 172 682 378 350 302 100 104 212 163 916 Unwrought tonnes (a) 292 (a) 96 (a) 204 (a) 223 373 Scrap tonnes 519 841 783 992 1 273 Crude petroleum (b) tonnes * 1 139 000 * 702 000 * 99 000 * 2 371 000 * 2 057 000 Natural gas tonnes 590 182 (b)* 653 000 (b)* 589 000 (b)* 498 000 (b)* 450 000 Phosphate rock tonnes 620 1 454 937 105 453 1 338 Platinum metals Platinum and platinum metals kilograms 5 124 2 765 589 4 743 695 Waste and scrap kilograms 4 491 5 332 13 244 550 1 236 Potash Potassic fertilisers tonnes 6 533 6 504 3 654 6 620 5 558 Rare earths Cerium compounds tonnes 5 10 5 9 23 Ferro-cerium and other pyrophoric alloys tonnes ... ... ... 50 21 Salt tonnes 262 050 417 596 66 690 90 656 159 791 Sillimanite minerals tonnes 2 623 3 357 4 444 6 278 22 Silver Metal kilograms 144 942 202 886 216 509 209 094 93 889 Sulphur and pyrites Pyrites tonnes 1 ... 48 1 243 14 730 Sulphur tonnes 279 822 56 143 59 116 47 765 62 847 Sulphur, sublimed and precipitated tonnes 21 068 7 949 8 757 9 454 6 221 Talc tonnes 2 865 2 711 2 635 3 401 3 380 Tantalum and niobium Tantalum tonnes 2 — 22 13 16 Titanium Metal tonnes 85 95 122 193 327 Oxides tonnes 2 650 3 170 2 538 2 749 2 821 Tungsten Metal tonnes 139 237 210 227 220 Zinc Ores and concentrates tonnes 392 725 316 714 412 744 399 384 422 982 Unwrought (a) tonnes 666 1 704 2 130 2 443 2 490 Scrap tonnes 1 536 2 997 2 960 1 903 1 469
Note(s) (a) Including alloys (b) BGS estimate, based on known imports into certain countries
Imports Commodity Units 2010 2011 2012 2013 2014
Primary aggregates tonnes 9 372 3 487 7 129 10 516 5 199 Aluminium and bauxite Bauxite tonnes 35 652 36 358 28 947 34 716 32 484 Alumina tonnes 15 772 15 434 14 740 19 709 21 272 Alumina hydrate tonnes 27 721 35 739 41 275 49 347 54 081 Unwrought tonnes 460 915 553 191 576 670 627 747 675 861 Unwrought alloys tonnes 281 588 332 228 356 862 362 548 418 621 Scrap tonnes 24 952 25 107 20 811 21 408 34 307 Antimony Ores and concentrates tonnes 82 121 0 11 13 Metal tonnes 219 245 256 273 249 Oxide tonnes 885 739 705 817 925

139
Turkey
Imports continued
Commodity Units 2010 2011 2012 2013 2014
Arsenic Metallic arsenic tonnes 55 10 49 78 143 Barytes Barium minerals tonnes 342 2 863 5 567 29 019 31 297 Bentonite tonnes 1 641 1 915 1 952 2 037 1 955 Bismuth Metal tonnes 11 16 7 15 10 Cement Cement clinkers tonnes 58 176 10 511 58 098 99 947 123 558 Portland cement tonnes 5 875 3 406 21 972 23 322 3 841 Other cement tonnes 6 168 10 847 7 142 6 982 8 117 Chromium Ores and concentrates tonnes 113 487 122 070 162 266 152 549 129 697 Metal tonnes 65 108 91 183 131 Coal Anthracite tonnes 972 425 990 996 854 104 665 244 783 126 Other coal tonnes 21 048 121 22 721 500 28 405 516 25 960 988 29 033 299 Lignite tonnes 5 339 — 75 7 103 — Cobalt Metal tonnes 145 171 159 190 190 Oxides tonnes 199 277 364 384 543 Copper Unwrought, unrefined tonnes 5 892 4 329 2 824 478 44 Unwrought, refined tonnes 332 482 337 337 348 938 362 854 363 801 Unwrought alloys tonnes 6 601 9 450 6 695 2 946 2 617 Scrap tonnes 3 943 6 181 3 806 3 663 10 600 Diamond Gem Carats 131 146 141 277 2 080 000 1 270 000 2 175 000 Industrial Carats 46 890 82 417 65 000 90 000 170 000 Dust Carats 25 190 000 31 125 000 36 995 000 34 835 000 36 360 000 Diatomite tonnes 1 319 1 702 2 124 2 247 2 290 Feldspar tonnes 39 953 34 726 47 361 39 456 41 695 Fluorspar tonnes 37 977 48 210 53 627 56 451 61 641 Gold Metal kilograms 64 105 128 367 157 629 350 563 192 182 Graphite tonnes 11 191 13 138 8 171 11 776 8 796 Gypsum Crude tonnes 232 713 375 169 295 462 347 834 310 438 Calcined tonnes 1 782 1 916 2 259 2 485 3 431 Iodine kilograms 3 218 6 641 6 163 4 423 5 561 Iron ore tonnes 7 220 977 6 644 310 7 842 126 8 114 387 8 543 994 Iron, steel and ferro-alloys Pig iron tonnes 557 398 1 137 729 1 376 572 982 579 912 961 Sponge and powder tonnes 284 608 180 591 387 667 510 327 223 419 Ferro-chrome tonnes 8 159 9 061 6 493 8 093 5 429 Ferro-silico-chrome tonnes 1 200 600 0 0 Ferro-silico-magnesium tonnes 786 1 344 2 064 1 910 1 280 Ferro-manganese tonnes 61 866 59 326 54 195 47 517 47 835 Ferro-silico-manganese tonnes 229 451 243 637 252 758 243 123 263 189 Ferro-molybdenum tonnes 1 577 1 091 1 181 1 106 1 125 Ferro-niobium tonnes 147 424 550 392 529 Ferro-phosphorus tonnes 1 050 1 035 1 117 817 684 Ferro-silicon tonnes 87 552 107 151 100 727 108 702 109 772 Ferro-titanium and ferro-silico-titanium tonnes 167 480 629 701 852 Ferro-vanadium tonnes 261 591 562 769 776 Other ferro-alloys tonnes 7 366 8 213 6 639 5 653 5 293 Silicon metal tonnes 9 978 10 363 10 777 7 215 9 814 Ingots, blooms, billets tonnes 2 350 758 2 157 532 3 355 265 5 429 936 4 777 554 Scrap tonnes 19 138 460 21 452 724 22 415 045 19 725 026 19 068 005 Kaolin tonnes 424 152 497 148 479 665 404 283 441 998 Lead Unwrought tonnes 73 057 85 131 99 137 91 337 105 082 Lithium Oxides tonnes 268 261 236 273 238 Carbonate tonnes 770 865 1 006 1 304 1 598 Magnesite and magnesia Magnesia tonnes 60 121 58 556 50 199 56 723 58 607

140
Turkey
Imports continued
Commodity Units 2010 2011 2012 2013 2014
Manganese Ores and concentrates tonnes 694 1 295 534 529 565 Metal tonnes 980 1 202 863 1 356 1 890 Mercury kilograms 719 9 772 3 143 1 490 3 476 Mica tonnes 317 508 285 483 407 Nickel Unwrought (a) tonnes 3 391 4 047 4 012 4 233 4 332 Oxides tonnes 144 108 104 170 189 Crude petroleum tonnes 16 873 392 18 049 163 19 479 238 20 091 078 17 481 481 Phosphate rock tonnes 686 966 814 382 711 627 745 424 911 012 Potash Sulphate tonnes 34 986 28 989 36 459 22 799 25 613 Chloride tonnes 82 923 93 471 94 930 116 098 151 935 Other potassic fertilisers tonnes 1 075 109 107 113 127 Rare earths Metals tonnes 14 13 10 5 8 Cerium compounds tonnes 233 128 120 160 103 Other rare earth compounds tonnes 13 8 4 11 11 Ferro-cerium and other pyrophoric alloys tonnes ... ... 13 18 107 Salt tonnes 154 536 254 045 248 663 (b)* 72 000 13 959 Sillimanite minerals Sillimanite minerals tonnes 5 466 6 907 6 905 9 434 11 122 Mullite tonnes 12 675 10 733 8 827 5 530 2 072 Silver Metal kilograms 90 064 209 909 226 227 299 109 316 698 Sulphur and pyrites Pyrites tonnes 480 323 142 205 329 Sulphur tonnes 141 478 161 866 151 955 136 430 127 648 Sulphur, sublimed and precipitated tonnes 592 292 382 302 118 Talc tonnes 20 026 26 952 23 496 28 004 23 085 Tin Unwrought (a) tonnes 2 558 2 707 2 195 2 420 2 581 Titanium Titanium minerals tonnes 7 390 9 454 7 328 9 292 9 281 Metal tonnes 298 357 356 556 642 Oxides tonnes 127 266 144 383 117 269 130 866 141 078 Tungsten Metal tonnes 74 70 71 46 72 Zinc Unwrought tonnes 182 598 201 409 224 683 234 744 237 999 Unwrought alloys tonnes 2 876 6 504 5 261 10 059 13 969 Zirconium Concentrates tonnes 4 823 4 770 3 268 4 130 4 808
Note(s) (a) Including alloys (b) BGS estimates, based on known exports from certain countries

141
United Kingdom
United Kingdom
Production Commodity Units 2010 2011 2012 2013 2014
Primary aggregates Sand and gravel tonnes 61 700 000 63 100 000 56 600 000 58 000 000 61 100 000 Crushed rock (a) tonnes 94 203 000 102 800 000 94 800 000 94 300 000 100 000 000 Primary aluminium tonnes 186 000 213 000 60 000 45 000 41 000 Barytes tonnes 34 099 31 000 30 000 * 30 000 * 44 000 Cement Cement, clinker tonnes 6 598 000 7 096 000 6 555 000 6 712 000 7 197 000 Cement, finished (b) tonnes 7 883 000 8 529 000 7 952 000 8 203 000 8 958 000 Coal Bituminous (c) tonnes 18 347 000 18 552 000 16 967 000 12 767 000 11 648 000 Fluorspar tonnes 26 420 — — 30 000 77 000 Gold kilograms 177 202 102 42 — Gypsum tonnes * 1 200 000 * 1 200 000 * 1 200 000 * 1 200 000 * 1 200 000 Indium tonnes * 5 * 5 * 5 * 5 * 5 Pig iron tonnes 7 233 000 6 625 000 7 183 100 9 471 000 9 705 000 Crude steel tonnes 9 708 000 9 478 000 9 579 100 11 857 500 12 120 000 Kaolin tonnes * 1 140 000 * 1 290 000 * 1 150 000 * 1 110 000 * 1 090 000 Lead, mine tonnes (metal content) (f) * 380 (d) 280 (d) 61 (f) * 100 (g) * 100 Lead, refined tonnes 301 000 275 000 311 930 329 200 267 000 Nickel, smelter/refinery tonnes 31 600 37 400 34 300 40 400 39 100 Crude petroleum tonnes 62 962 000 51 972 000 44 560 000 40 646 000 39 550 000 Natural gas million m3 59 707 47 733 41 054 38 475 38 517 Potash Chloride tonnes (K2O content) * 403 800 * 462 000 * 540 000 * 540 000 * 600 000 Salt tonnes 6 666 000 6 060 000 6 460 000 6 930 000 * 5 000 000 Silver kilograms (metal content) 506 531 230 82 — Sulphur and pyrites Recovered (e) tonnes (sulphur content) 162 000 165 000 158 000 313 000 134 000 Talc tonnes 2 633 3 708 3 667 2 947 4 907
Notes (1) United Kingdom is also believed to produce arsenic (2) Production capacity for synthetic mullite also exists in the United Kingdom but output is believed to be zero. (a) Includes small quantities for other purposes in Northern Ireland (b) Great Britain only. (c) Including anthracite (d) By-product of gold mining in Northern Ireland (e) From petroleum refining and/or natural gas (f) By product of Pennine fluorspar operations and of gold mining in Northern Ireland (g) By product of Pennine fluorspar operations
Exports Commodity Units 2010 2011 2012 2013 2014
Primary aggregates tonnes 10 992 431 10 800 338 8 823 773 9 223 542 8 700 345 Aluminium and bauxite Bauxite tonnes 3 140 5 936 2 929 4 804 4 339 Alumina tonnes 5 879 5 114 3 590 3 247 4 116 Alumina hydrate (a) tonnes * 2 100 * 2 600 * 10 700 * 1 600 * 1 900 Unwrought tonnes 43 665 49 959 9 597 8 510 6 364 Unwrought alloys tonnes 364 612 356 170 279 263 188 996 219 143 Scrap tonnes 443 466 440 399 445 730 402 060 452 620 Antimony Metal tonnes 77 57 237 425 525 Oxide tonnes 490 290 422 152 127 Barytes Barium minerals (b) tonnes 17 851 15 648 19 072 13 854 13 550

142
United Kingdom
Exports continued
Commodity Units 2010 2011 2012 2013 2014
Bentonite tonnes 41 323 38 478 39 535 37 694 31 347 Bismuth Metal tonnes 427 1 038 744 407 348 Bromine kilograms 780 704 1 472 523 1 377 726 645 676 751 037 Cadmium Metal tonnes 2 545 1 441 272 99 44 Cement Cement clinkers tonnes 5 500 15 531 31 458 24 056 21 059 Portland cement tonnes 134 223 121 537 239 058 85 405 68 225 Other cement tonnes 56 781 62 333 75 502 76 851 71 169 Chromium Ores and concentrates tonnes 297 168 50 50 57 Metal tonnes 7 441 8 017 7 737 7 061 7 216 Coal Anthracite tonnes 89 701 97 014 119 826 143 133 81 353 Other coal tonnes 615 067 502 581 417 654 456 259 343 800 Briquettes tonnes 89 125 117 025 150 783 106 890 108 844 Cobalt Unwrought tonnes 730 843 676 732 615 Metal tonnes 1 780 1 739 1 865 3 136 1 996 Oxides tonnes 1 267 820 1 179 1 493 1 434 Scrap tonnes 494 363 685 700 887 Copper Unwrought tonnes 9 048 18 145 25 145 17 538 1 198 Unwrought alloys tonnes 12 782 16 872 15 441 21 946 19 226 Scrap tonnes 421 868 513 394 373 943 291 924 295 741 Diamond Unsorted Carats 3 689 202 2 735 369 2 974 099 11 165 256 14 606 086 Gem, rough Carats 51 769 860 41 541 219 46 117 478 34 651 963 581 879 Gem, cut Carats 283 435 1 292 162 1 702 424 284 182 470 026 Industrial Carats 2 478 568 3 864 054 3 949 553 2 001 018 2 430 399 Dust Carats 113 451 535 42 269 921 32 288 331 28 709 324 19 103 486 Diatomite tonnes 1 650 797 659 497 734 Fluorspar tonnes 412 590 75 16 127 49 078 Gold Metal kilograms 293 153 775 261 266 572 1 736 966 1 890 797 Waste and scrap kilograms 496 924 272 597 1 928 197 388 290 726 210 Graphite tonnes 2 981 3 660 2 196 2 011 1 608 Gypsum Crude tonnes 3 330 3 428 4 036 4 745 4 296 Calcined tonnes 24 552 25 504 21 216 19 481 19 957 Iodine kilograms 393 005 234 182 370 132 190 878 304 611 Iron ore (c) tonnes 5 256 179 709 108 415 71 811 3 860 Iron, steel and ferro-alloys Pig iron tonnes 4 339 2 074 3 775 1 652 1 758 Sponge and powder tonnes 2 938 3 775 4 585 4 858 4 067 Ferro-alloys tonnes 45 314 43 918 49 357 47 949 47 413 Ferro-chrome tonnes 2 403 1 853 2 288 2 108 3 537 Ferro-silico-chrome tonnes 22 364 72 168 362 Ferro-silico-magnesium tonnes 366 338 327 240 119 Ferro-manganese tonnes 8 361 819 658 407 2 721 Ferro-silico-manganese tonnes 52 132 7 503 3 626 791 Ferro-molybdenum tonnes 11 248 12 948 12 421 11 922 12 491 Ferro-nickel tonnes 15 49 539 183 68 Ferro-niobium tonnes 224 179 257 162 195 Ferro-phosphorus tonnes 667 766 562 558 336 Ferro-silicon tonnes 2 958 6 594 4 659 5 109 3 400 Ferro-titanium and ferro-silico-titanium tonnes 15 197 17 662 18 040 22 652 22 831 Other ferro-alloys tonnes 3 802 2 213 2 030 814 562 Silicon metal tonnes 2 901 3 662 3 027 4 979 5 422 Ingots, blooms, billets tonnes 1 137 160 668 885 1 817 820 3 164 861 3 197 397 Scrap tonnes 7 507 853 7 744 411 7 160 639 6 777 534 6 934 918 Kaolin tonnes 1 722 335 1 157 780 1 039 460 1 003 841 984 272
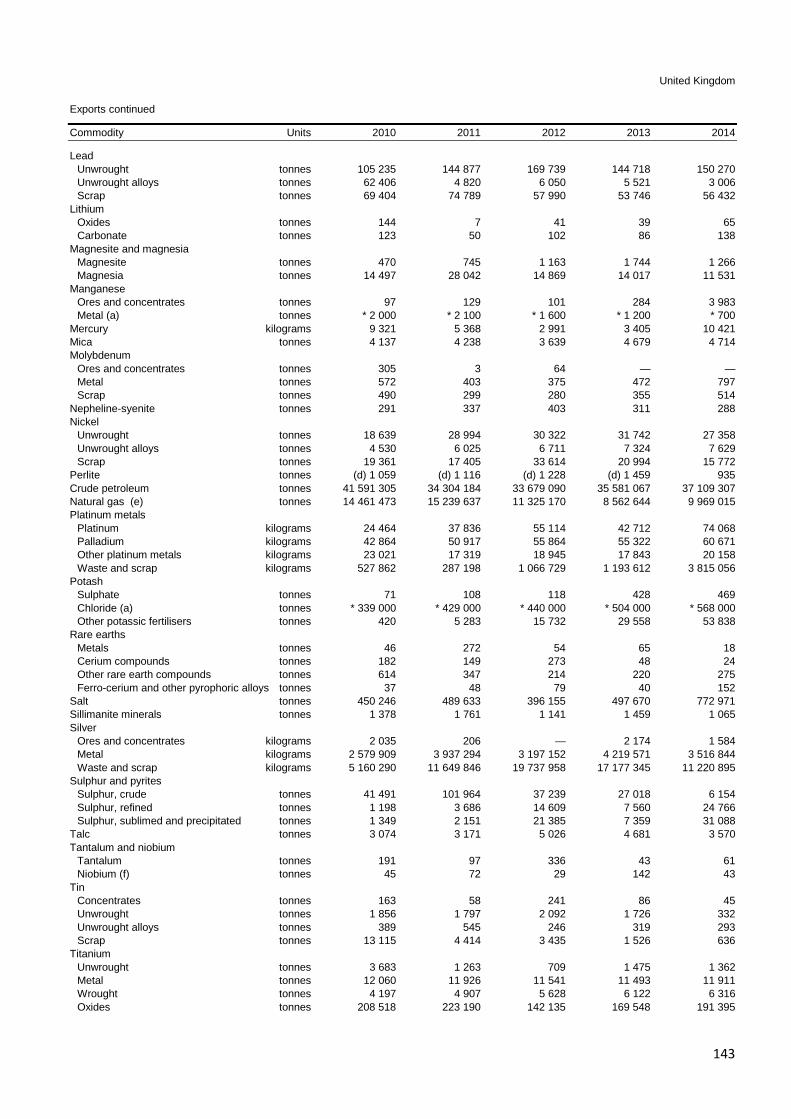
143
United Kingdom
Exports continued
Commodity Units 2010 2011 2012 2013 2014
Lead Unwrought tonnes 105 235 144 877 169 739 144 718 150 270 Unwrought alloys tonnes 62 406 4 820 6 050 5 521 3 006 Scrap tonnes 69 404 74 789 57 990 53 746 56 432 Lithium Oxides tonnes 144 7 41 39 65 Carbonate tonnes 123 50 102 86 138 Magnesite and magnesia Magnesite tonnes 470 745 1 163 1 744 1 266 Magnesia tonnes 14 497 28 042 14 869 14 017 11 531 Manganese Ores and concentrates tonnes 97 129 101 284 3 983 Metal (a) tonnes * 2 000 * 2 100 * 1 600 * 1 200 * 700 Mercury kilograms 9 321 5 368 2 991 3 405 10 421 Mica tonnes 4 137 4 238 3 639 4 679 4 714 Molybdenum Ores and concentrates tonnes 305 3 64 — — Metal tonnes 572 403 375 472 797 Scrap tonnes 490 299 280 355 514 Nepheline-syenite tonnes 291 337 403 311 288 Nickel Unwrought tonnes 18 639 28 994 30 322 31 742 27 358 Unwrought alloys tonnes 4 530 6 025 6 711 7 324 7 629 Scrap tonnes 19 361 17 405 33 614 20 994 15 772 Perlite tonnes (d) 1 059 (d) 1 116 (d) 1 228 (d) 1 459 935 Crude petroleum tonnes 41 591 305 34 304 184 33 679 090 35 581 067 37 109 307 Natural gas (e) tonnes 14 461 473 15 239 637 11 325 170 8 562 644 9 969 015 Platinum metals Platinum kilograms 24 464 37 836 55 114 42 712 74 068 Palladium kilograms 42 864 50 917 55 864 55 322 60 671 Other platinum metals kilograms 23 021 17 319 18 945 17 843 20 158 Waste and scrap kilograms 527 862 287 198 1 066 729 1 193 612 3 815 056 Potash Sulphate tonnes 71 108 118 428 469 Chloride (a) tonnes * 339 000 * 429 000 * 440 000 * 504 000 * 568 000 Other potassic fertilisers tonnes 420 5 283 15 732 29 558 53 838 Rare earths Metals tonnes 46 272 54 65 18 Cerium compounds tonnes 182 149 273 48 24 Other rare earth compounds tonnes 614 347 214 220 275 Ferro-cerium and other pyrophoric alloys tonnes 37 48 79 40 152 Salt tonnes 450 246 489 633 396 155 497 670 772 971 Sillimanite minerals tonnes 1 378 1 761 1 141 1 459 1 065 Silver Ores and concentrates kilograms 2 035 206 — 2 174 1 584 Metal kilograms 2 579 909 3 937 294 3 197 152 4 219 571 3 516 844 Waste and scrap kilograms 5 160 290 11 649 846 19 737 958 17 177 345 11 220 895 Sulphur and pyrites Sulphur, crude tonnes 41 491 101 964 37 239 27 018 6 154 Sulphur, refined tonnes 1 198 3 686 14 609 7 560 24 766 Sulphur, sublimed and precipitated tonnes 1 349 2 151 21 385 7 359 31 088 Talc tonnes 3 074 3 171 5 026 4 681 3 570 Tantalum and niobium Tantalum tonnes 191 97 336 43 61 Niobium (f) tonnes 45 72 29 142 43 Tin Concentrates tonnes 163 58 241 86 45 Unwrought tonnes 1 856 1 797 2 092 1 726 332 Unwrought alloys tonnes 389 545 246 319 293 Scrap tonnes 13 115 4 414 3 435 1 526 636 Titanium Unwrought tonnes 3 683 1 263 709 1 475 1 362 Metal tonnes 12 060 11 926 11 541 11 493 11 911 Wrought tonnes 4 197 4 907 5 628 6 122 6 316 Oxides tonnes 208 518 223 190 142 135 169 548 191 395
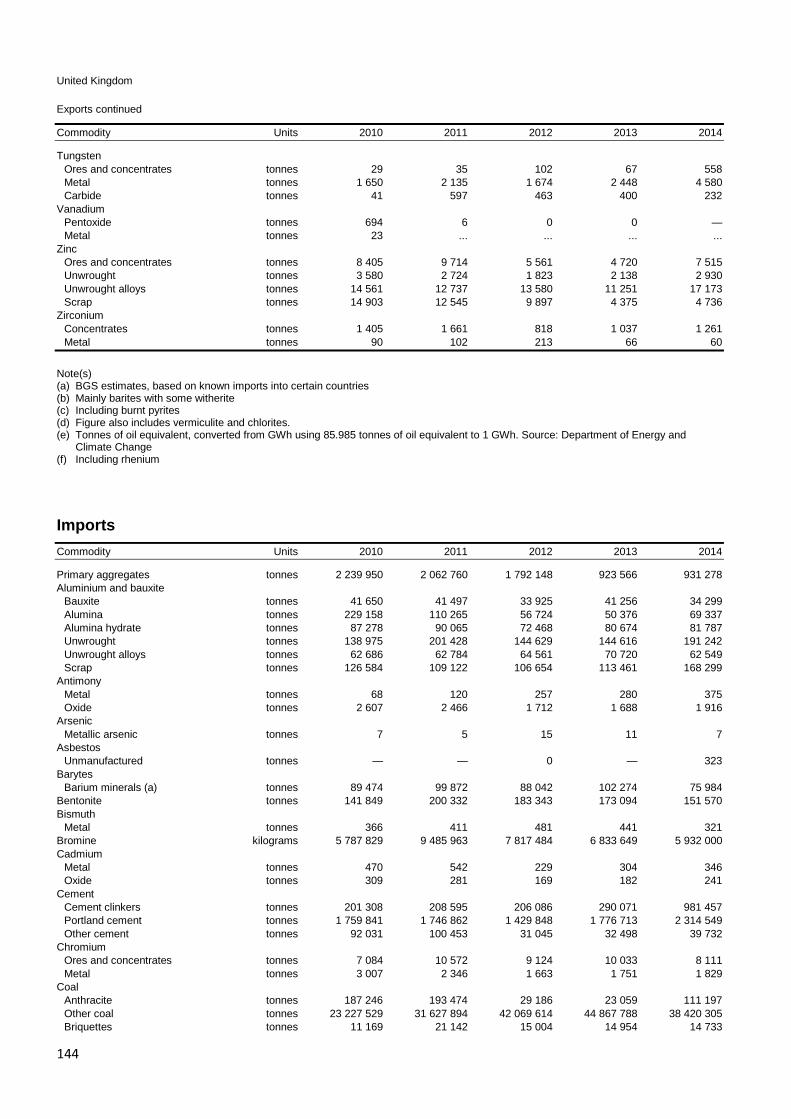
144
United Kingdom
Exports continued
Commodity Units 2010 2011 2012 2013 2014
Tungsten Ores and concentrates tonnes 29 35 102 67 558 Metal tonnes 1 650 2 135 1 674 2 448 4 580 Carbide tonnes 41 597 463 400 232 Vanadium Pentoxide tonnes 694 6 0 0 — Metal tonnes 23 ... ... ... ... Zinc Ores and concentrates tonnes 8 405 9 714 5 561 4 720 7 515 Unwrought tonnes 3 580 2 724 1 823 2 138 2 930 Unwrought alloys tonnes 14 561 12 737 13 580 11 251 17 173 Scrap tonnes 14 903 12 545 9 897 4 375 4 736 Zirconium Concentrates tonnes 1 405 1 661 818 1 037 1 261 Metal tonnes 90 102 213 66 60
Note(s) (a) BGS estimates, based on known imports into certain countries (b) Mainly barites with some witherite (c) Including burnt pyrites (d) Figure also includes vermiculite and chlorites. (e) Tonnes of oil equivalent, converted from GWh using 85.985 tonnes of oil equivalent to 1 GWh. Source: Department of Energy and
Climate Change (f) Including rhenium
Imports Commodity Units 2010 2011 2012 2013 2014
Primary aggregates tonnes 2 239 950 2 062 760 1 792 148 923 566 931 278 Aluminium and bauxite Bauxite tonnes 41 650 41 497 33 925 41 256 34 299 Alumina tonnes 229 158 110 265 56 724 50 376 69 337 Alumina hydrate tonnes 87 278 90 065 72 468 80 674 81 787 Unwrought tonnes 138 975 201 428 144 629 144 616 191 242 Unwrought alloys tonnes 62 686 62 784 64 561 70 720 62 549 Scrap tonnes 126 584 109 122 106 654 113 461 168 299 Antimony Metal tonnes 68 120 257 280 375 Oxide tonnes 2 607 2 466 1 712 1 688 1 916 Arsenic Metallic arsenic tonnes 7 5 15 11 7 Asbestos Unmanufactured tonnes — — 0 — 323 Barytes Barium minerals (a) tonnes 89 474 99 872 88 042 102 274 75 984 Bentonite tonnes 141 849 200 332 183 343 173 094 151 570 Bismuth Metal tonnes 366 411 481 441 321 Bromine kilograms 5 787 829 9 485 963 7 817 484 6 833 649 5 932 000 Cadmium Metal tonnes 470 542 229 304 346 Oxide tonnes 309 281 169 182 241 Cement Cement clinkers tonnes 201 308 208 595 206 086 290 071 981 457 Portland cement tonnes 1 759 841 1 746 862 1 429 848 1 776 713 2 314 549 Other cement tonnes 92 031 100 453 31 045 32 498 39 732 Chromium Ores and concentrates tonnes 7 084 10 572 9 124 10 033 8 111 Metal tonnes 3 007 2 346 1 663 1 751 1 829 Coal Anthracite tonnes 187 246 193 474 29 186 23 059 111 197 Other coal tonnes 23 227 529 31 627 894 42 069 614 44 867 788 38 420 305 Briquettes tonnes 11 169 21 142 15 004 14 954 14 733

145
United Kingdom
Imports continued
Commodity Units 2010 2011 2012 2013 2014
Cobalt Ore tonnes 143 124 125 137 151 Metal tonnes 5 963 6 093 6 197 5 215 4 560 Oxides tonnes 198 256 164 180 160 Copper Unwrought, unrefined tonnes 2 039 1 267 147 409 754 Unwrought, refined tonnes 40 708 34 627 38 674 34 723 19 339 Unwrought alloys tonnes 5 688 5 498 5 957 12 098 4 815 Scrap tonnes 27 495 29 010 27 214 25 055 28 243 Diamond Unsorted Carats 8 703 907 8 484 526 9 238 531 12 754 564 14 833 453 Gem, rough Carats 40 559 260 38 472 604 33 227 748 29 495 262 823 336 Gem, cut Carats 761 455 18 292 931 7 009 031 1 494 267 5 254 159 Industrial Carats 7 299 364 10 236 376 7 747 613 6 399 457 4 270 299 Dust Carats 111 136 020 32 411 894 26 886 717 25 157 153 25 481 253 Diatomite (b) tonnes 18 649 20 042 19 752 19 713 25 542 Feldspar tonnes 17 584 16 750 21 610 24 568 19 154 Fluorspar tonnes 1 294 45 327 19 739 (c)* 15 600 (c)* 12 100 Gold Metal kilograms 800 602 1 012 882 1 052 573 334 032 496 597 Waste and scrap kilograms 65 833 71 449 164 833 101 612 72 150 Graphite tonnes 6 989 6 869 4 114 4 951 5 277 Gypsum Crude tonnes 216 605 539 327 490 661 376 972 516 377 Calcined tonnes 54 209 46 526 47 545 33 620 41 106 Iodine kilograms 1 253 806 1 426 239 1 573 126 1 135 699 1 129 242 Iron ore tonnes 10 597 085 (d) 9 175 852 (d) 10 062 323 (d) 14 137 160 (d) 14 469 169 Iron, steel and ferro-alloys Pig iron tonnes 41 959 69 095 55 845 38 057 52 780 Sponge and powder tonnes 97 745 147 870 176 638 33 518 9 590 Ferro-alloys tonnes 208 817 225 819 212 787 216 722 235 941 Ferro-chrome tonnes 58 398 70 191 65 219 48 587 63 275 Ferro-silico-chrome tonnes 9 362 723 163 307 Ferro-silico-magnesium tonnes 931 1 328 1 360 1 211 948 Ferro-manganese tonnes 46 985 39 159 47 706 59 517 54 814 Ferro-silico-manganese tonnes 49 280 51 928 36 661 43 823 47 122 Ferro-molybdenum tonnes 322 573 458 259 303 Ferro-nickel tonnes 6 284 13 888 17 916 13 439 22 480 Ferro-niobium tonnes 859 395 250 987 1 029 Ferro-phosphorus tonnes 836 1 134 474 810 1 088 Ferro-silicon tonnes 43 703 45 918 39 351 42 966 43 209 Ferro-titanium and ferro-silico-titanium tonnes 274 187 902 687 805 Ferro-tungsten and ferro-silico-tungsten tonnes 48 44 34 30 47 Ferro-vanadium tonnes 340 368 246 339 450 Other ferro-alloys tonnes 595 388 1 520 3 904 158 Silicon metal tonnes 99 651 101 005 97 454 97 524 111 125 Ingots, blooms, billets tonnes 714 541 1 185 242 835 691 443 657 340 628 Scrap tonnes 270 986 423 744 284 986 302 580 351 436 Kaolin tonnes 95 865 102 396 88 505 85 534 92 426 Lead Unwrought tonnes 166 830 147 579 189 605 171 169 130 199 Scrap tonnes 8 858 4 792 3 317 4 169 7 236 Lithium Oxides tonnes 218 215 119 281 384 Carbonate tonnes 427 376 344 364 434 Magnesite and magnesia Magnesite tonnes 8 640 7 903 5 059 5 015 5 258 Magnesia tonnes 49 076 52 263 70 330 69 822 65 730 Manganese Ores and concentrates (e) tonnes 1 517 1 656 1 597 2 168 3 232 Metal tonnes 6 619 5 444 3 721 3 796 3 629 Mercury kilograms 22 065 425 21 138 41 836 4 259 Mica Unmanufactured tonnes 43 243 407 131 160 Ground tonnes 7 341 7 926 9 203 7 307 7 891 Waste tonnes 902 0 0 24 —

146
United Kingdom
Imports continued
Commodity Units 2010 2011 2012 2013 2014
Molybdenum Ores and concentrates tonnes 12 581 15 844 16 041 14 396 16 629 Metal tonnes 1 099 1 415 1 487 1 271 1 649 Oxides tonnes 1 638 2 316 1 971 2 101 2 723 Nepheline-syenite tonnes 39 092 35 573 30 744 36 080 33 646 Nickel Mattes, sinters etc tonnes 50 263 58 519 57 108 63 129 59 194 Unwrought tonnes 14 200 12 707 11 521 8 130 9 031 Unwrought alloys tonnes 3 310 4 644 4 771 4 309 3 771 Scrap tonnes 8 154 6 741 9 237 9 887 11 000 Perlite tonnes (f) 58 456 (f) 98 437 (f) 66 298 (f) 59 424 77 419 Crude petroleum tonnes 50 447 008 53 647 056 56 471 508 48 380 730 46 831 399 Natural gas (g) tonnes 50 244 561 50 045 076 46 191 572 45 144 017 39 999 792 Phosphate rock Calcium phosphates tonnes 68 902 86 333 90 653 89 196 90 439 Phosphate rock tonnes 9 873 15 885 15 314 3 186 3 515 Platinum metals Platinum kilograms 58 659 46 092 54 073 39 973 51 736 Palladium kilograms 73 184 42 167 59 803 49 348 34 191 Other platinum metals kilograms 9 487 7 768 4 374 6 953 5 339 Waste and scrap kilograms 819 769 1 556 736 2 163 943 1 186 431 838 025 Potash Sulphate tonnes 15 766 13 232 10 795 10 905 16 513 Chloride tonnes 270 096 153 141 161 388 149 121 201 039 Other potassic fertilisers tonnes 10 565 2 373 7 899 8 484 8 875 Rare earths Metals tonnes 119 79 65 128 127 Cerium compounds tonnes 1 119 1 713 485 633 603 Other rare earth compounds tonnes 322 629 518 654 591 Ferro-cerium and other pyrophoric alloys tonnes 150 79 14 50 28 Salt tonnes 1 288 253 1 814 865 418 028 738 670 356 289 Sillimanite minerals Sillimanite minerals tonnes 7 419 12 485 10 562 6 058 6 814 Mullite tonnes 8 276 3 491 4 588 3 746 7 306 Silver Ores and concentrates kilograms 9 737 1 209 6 287 72 454 394 649 Metal kilograms 3 278 015 3 686 011 8 525 994 6 097 865 4 740 438 Waste and scrap kilograms 4 137 096 13 713 610 5 946 307 6 668 845 5 107 834 Sulphur and pyrites Pyrites tonnes 2 581 1 734 168 435 962 Sulphur, crude tonnes 274 590 1 125 1 374 4 439 Sulphur, refined tonnes 10 201 10 391 8 670 8 485 7 885 Sulphur, sublimed and precipitated tonnes 767 691 698 946 6 647 Talc tonnes 50 309 53 339 57 751 53 099 63 815 Tantalum and niobium Tantalum tonnes 284 176 144 203 184 Niobium (h) tonnes 104 176 130 62 60 Tin Unwrought tonnes 4 327 4 186 3 850 3 484 4 318 Unwrought alloys tonnes 365 396 1 113 4 049 5 750 Scrap tonnes 196 121 147 69 7 Titanium Titanium minerals tonnes 90 622 32 127 117 860 104 134 210 722 Metal tonnes 20 681 69 844 33 943 27 099 30 278 Oxides tonnes 59 460 62 311 63 058 75 316 67 143 Tungsten Metal tonnes 1 676 1 999 1 888 1 906 1 958 Carbide tonnes 1 111 3 622 1 245 878 1 740 Vanadium Metal tonnes 197 376 261 199 168 Zinc Unwrought tonnes 97 066 85 516 77 847 98 448 113 410 Unwrought alloys tonnes 2 973 9 306 8 917 8 469 5 177 Scrap tonnes 447 339 412 533 1 412

147
United Kingdom
Imports continued
Commodity Units 2010 2011 2012 2013 2014
Zirconium Concentrates (i) tonnes 8 450 14 709 8 928 6 879 7 974 Metal tonnes 411 616 482 513 391
Note(s) (a) Mainly barites with some witherite (b) Officially recorded under the heading `Siliceous fossil meals and similar siliceous earths'. Excludes flux calcined diatomite (c) BGS estimates, based on known exports from certain countries (d) Including burnt pyrites (e) Including manganiferous iron ore (f) Figure also includes vermiculite and chlorites (g) Tonnes of oil equivalent. Converted from GWh to 1 tonne of oil equivalent. Source: Department of Energy and Climate Change (h) Including rhenium (i) Mainly zircon

148

STATISTICAL INFORMATION BY COMMODITY

150
Aggregates
Primary aggregates
• Primary aggregates are sand, gravel and crushed rock aggregates that are widely used in the construction industry. The trade data presented here are for crushed rock combined with sand and gravel.
• Aggregates data are very difficult to establish accurately. There are frequent inconsistencies in the way countries report aggregates production and trade. Different definitions for similar materials are commonplace, and many countries do not require production to be reported from quarries that have less than a certain number of employees.
• Aggregates are used primarily by the construction industry to build and maintain the physical infrastructure on which everyone depends: houses, offices, roads, schools, hospitals, railways, shops, flood defences, etc. Aggregates are either used directly, for example for drainage or fill purposes, or are used to manufacture concrete and asphalt.
Austria 2.6%Belgium 2.9%
Czech Republic 2.4%Denmark 1.6%
Finland 3.6%
France 14.7%
Germany 20.3%
Hungary 2.3%Italy 5.6%Netherlands 2.2%
Norway 3.6%
Others 8.1%
Poland 8.9%
Romania 3.8%
Spain 4.3%
Sweden 3.6%
Switzerland 2.5%
United Kingdom 7.1%
EU36 Production of aggregates 2014
Production of primary aggregates (sand and gravel and crushed rock) tonnes
Country 2010 2011 2012 2013 2014 Austria Sand and gravel (a) 30 182 855 (a) 35 507 353 (a) 31 285 739 (a) 30 123 970 30 276 160 Crushed rock (a) 24 399 380 (a) 26 866 150 (a) 26 348 996 (a) 25 973 740 26 946 973 Belgium Sand and gravel * 22 000 000 * 23 000 000 * 21 000 000 * 21 000 000 * 19 000 000 Crushed rock * 44 000 000 * 49 000 000 * 46 000 000 * 46 000 000 * 45 000 000 Bulgaria Sand and gravel 5 199 000 10 054 205 9 293 819 8 433 198 9 384 908 Crushed rock 16 876 900 17 979 678 18 281 353 18 963 207 21 786 053 Croatia Sand and gravel 3 646 572 5 012 106 4 345 920 3 779 919 3 496 693 Cyprus Crushed rock 12 981 444 11 816 397 7 308 056 4 561 152 4 039 087 Czech Republic Sand and gravel 19 327 000 21 424 000 18 785 000 17 363 000 17 668 000 Crushed rock 37 260 000 36 717 000 32 535 000 33 004 000 35 972 000 Denmark Sand and gravel 33 978 000 42 878 000 39 332 000 * 38 000 000 35 761 666 Crushed rock 240 000 337 000 293 000 243 000 223 000

151
Aggregates
Production continued tonnes
Country 2010 2011 2012 2013 2014 Estonia Sand and gravel 3 469 220 3 568 680 3 954 600 5 201 380 5 078 160 Crushed rock 5 849 600 5 919 500 6 170 200 6 463 100 5 909 000 Finland Sand and gravel * 36 000 000 * 36 000 000 * 34 000 000 * 34 000 000 * 32 000 000 Crushed rock * 48 000 000 * 53 000 000 * 54 000 000 * 49 000 000 * 47 000 000 France Sand and gravel 141 290 000 148 680 000 138 280 000 135 543 000 * 127 000 000 Crushed rock 201 860 000 204 980 000 196 600 000 205 638 000 * 199 000 000 Germany Sand and gravel 239 000 000 252 000 000 235 300 000 228 000 000 238 000 000 Crushed rock 208 000 000 229 000 000 211 000 000 207 000 000 211 000 000 Greece * 41 000 000 * 33 000 000 * 30 000 000 * 22 000 000 * 19 000 000 Hungary Sand and gravel 25 059 000 23 361 598 * 22 250 000 * 27 252 746 * 42 445 000 Crushed rock 11 390 100 9 128 819 * 9 000 000 * 7 483 894 * 8 477 000 Iceland Sand and gravel 201 280 221 920 232 112 291 384 * 291 000 Ireland, Republic of Sand and gravel * 10 000 000 * 7 000 000 * 7 000 000 * 7 000 000 7 000 000 Crushed rock * 40 000 000 * 25 000 000 * 22 000 000 * 22 000 000 22 000 000 Italy Sand and gravel (a) 150 996 352 131 770 340 105 221 496 70 081 328 73 690 871 Crushed rock (a) 80 336 696 86 547 652 75 406 269 49 075 806 50 926 292 Latvia Sand and gravel 6 016 126 7 855 125 8 358 839 7 297 980 12 361 256 Crushed rock 1 375 197 2 050 976 2 072 775 2 664 580 2 229 552 Lithuania Sand and gravel 5 655 401 5 776 850 5 081 166 6 930 916 7 164 096 Crushed rock 3 281 330 4 456 089 3 241 831 3 801 100 4 084 594 Malta Crushed rock (b) 1 753 096 (b) 1 739 037 (b) 1 707 653 1 828 716 1 763 865 Montenegro Sand and gravel 255 678 133 947 201 896 213 002 289 469 Crushed rock 265 066 167 405 112 630 143 179 137 299 Netherlands Sand and gravel 55 439 000 60 795 000 49 900 000 48 974 000 * 48 500 000 Norway Sand and gravel 13 011 000 13 215 000 14 262 000 13 984 000 14 111 000 Crushed rock 54 134 000 63 855 000 67 670 000 66 259 000 64 828 000 Poland Sand and gravel (c) * 157 236 000 * 176 000 000 * 145 000 000 * 141 000 000 * 136 000 000 Crushed rock 62 886 200 88 696 900 64 859 600 57 945 100 61 117 900 Portugal Sand and gravel 8 569 474 7 658 205 6 093 188 5 488 141 5 215 900 Crushed rock 50 628 649 48 737 535 32 966 351 21 577 096 24 051 109 Romania Sand and gravel 22 085 231 25 319 433 21 068 344 50 829 386 51 812 555 Crushed rock 3 774 309 6 189 078 5 593 429 36 888 195 32 061 735 Slovakia Sand and gravel 6 931 873 6 020 641 3 794 873 3 953 525 3 863 467 Crushed rock 14 909 400 13 834 800 10 157 400 8 526 598 10 188 851 Slovenia Sand and gravel 2 422 771 1 899 770 1 707 455 2 143 013 2 799 006 Crushed rock 12 072 532 9 626 791 7 557 431 7 067 895 8 123 587 Spain Sand and gravel 73 765 882 60 603 982 41 834 967 * 33 300 000 30 000 000 Crushed rock 180 105 140 143 579 886 96 056 496 * 67 800 000 65 000 000 Sweden Sand and gravel * 17 000 000 * 17 000 000 13 809 028 11 399 554 10 970 490 Crushed rock * 57 000 000 * 58 000 000 71 839 600 66 621 935 68 034 725 Switzerland Sand and gravel * 40 000 000 51 940 000 49 780 000 49 480 000 53 940 000 Crushed rock * 5 000 000 2 432 977 2 328 758 2 445 464 2 401 627
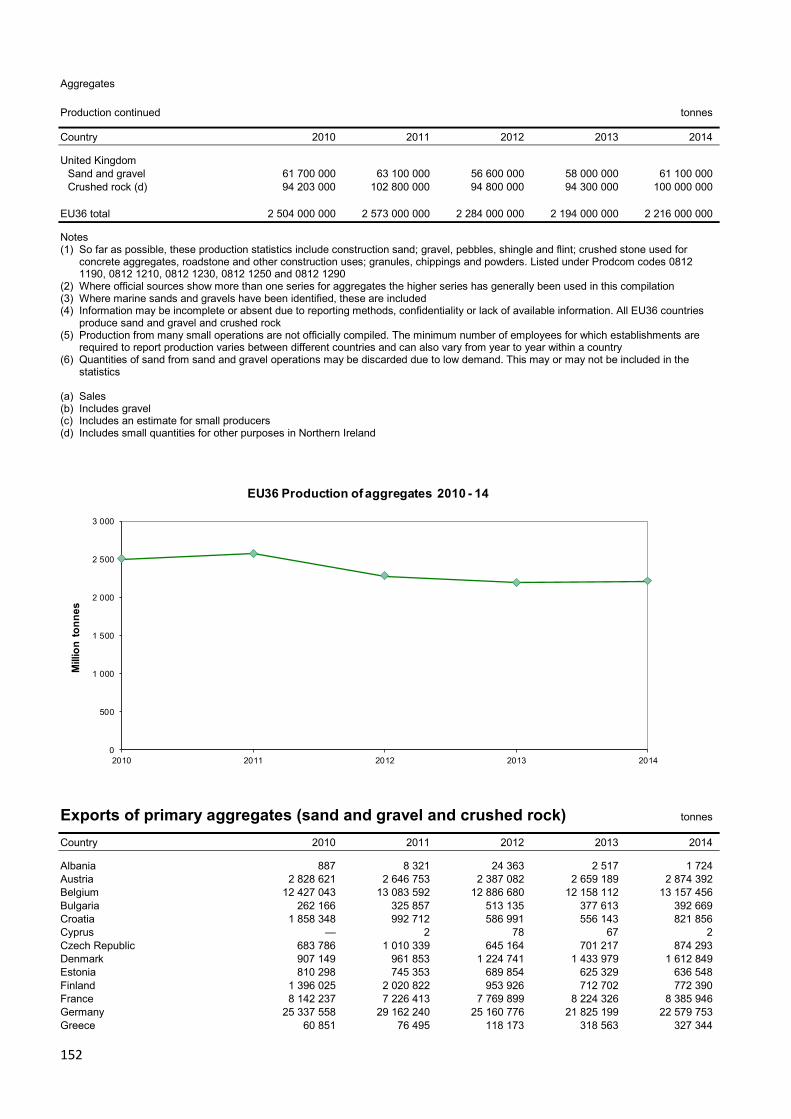
152
Aggregates
Production continued tonnes
Country 2010 2011 2012 2013 2014 United Kingdom Sand and gravel 61 700 000 63 100 000 56 600 000 58 000 000 61 100 000 Crushed rock (d) 94 203 000 102 800 000 94 800 000 94 300 000 100 000 000 EU36 total 2 504 000 000 2 573 000 000 2 284 000 000 2 194 000 000 2 216 000 000 Notes (1) So far as possible, these production statistics include construction sand; gravel, pebbles, shingle and flint; crushed stone used for
concrete aggregates, roadstone and other construction uses; granules, chippings and powders. Listed under Prodcom codes 0812 1190, 0812 1210, 0812 1230, 0812 1250 and 0812 1290
(2) Where official sources show more than one series for aggregates the higher series has generally been used in this compilation (3) Where marine sands and gravels have been identified, these are included (4) Information may be incomplete or absent due to reporting methods, confidentiality or lack of available information. All EU36 countries
produce sand and gravel and crushed rock (5) Production from many small operations are not officially compiled. The minimum number of employees for which establishments are
required to report production varies between different countries and can also vary from year to year within a country (6) Quantities of sand from sand and gravel operations may be discarded due to low demand. This may or may not be included in the
statistics (a) Sales (b) Includes gravel (c) Includes an estimate for small producers (d) Includes small quantities for other purposes in Northern Ireland
0
500
1 000
1 500
2 000
2 500
3 000
2010 2011 2012 2013 2014
Mill
ion
tonn
es
EU36 Production of aggregates 2010 - 14
Exports of primary aggregates (sand and gravel and crushed rock) tonnes Country 2010 2011 2012 2013 2014 Albania 887 8 321 24 363 2 517 1 724 Austria 2 828 621 2 646 753 2 387 082 2 659 189 2 874 392 Belgium 12 427 043 13 083 592 12 886 680 12 158 112 13 157 456 Bulgaria 262 166 325 857 513 135 377 613 392 669 Croatia 1 858 348 992 712 586 991 556 143 821 856 Cyprus — 2 78 67 2 Czech Republic 683 786 1 010 339 645 164 701 217 874 293 Denmark 907 149 961 853 1 224 741 1 433 979 1 612 849 Estonia 810 298 745 353 689 854 625 329 636 548 Finland 1 396 025 2 020 822 953 926 712 702 772 390 France 8 142 237 7 226 413 7 769 899 8 224 326 8 385 946 Germany 25 337 558 29 162 240 25 160 776 21 825 199 22 579 753 Greece 60 851 76 495 118 173 318 563 327 344

153
Aggregates
Exports continued tonnes Country 2010 2011 2012 2013 2014 Hungary 1 191 521 1 137 425 1 003 456 1 122 883 1 144 496 Iceland 44 512 85 854 92 094 81 265 53 105 Ireland, Republic of 13 318 16 005 88 530 147 770 129 518 Italy 1 507 704 1 071 579 1 073 466 1 120 193 1 201 976 Latvia 101 406 59 930 19 683 49 235 76 856 Lithuania 57 255 139 291 118 463 137 961 142 719 Luxembourg 160 773 161 019 165 025 152 062 170 609 Macedonia ... 39 217 47 352 59 365 64 549 Montenegro 112 522 32 451 15 527 45 091 50 500 Netherlands 9 311 275 15 472 833 15 140 085 14 071 676 13 479 227 Norway 16 877 617 20 858 955 19 761 572 18 103 600 18 944 242 Poland 1 031 013 1 058 307 962 169 1 565 938 1 989 610 Portugal 67 505 120 946 71 399 353 360 309 526 Romania 360 161 255 970 438 328 889 084 1 167 093 Serbia 127 309 497 637 485 266 211 015 263 545 Slovakia (a) * 598 000 * 615 008 * 525 000 * 534 000 * 615 000 Slovenia 488 256 426 686 406 872 562 005 660 277 Spain 1 105 524 1 249 318 726 145 953 044 1 293 021 Sweden 2 248 515 1 624 154 1 602 379 1 234 782 1 079 882 Switzerland 193 312 188 183 274 029 215 232 222 546 Turkey 955 765 1 237 704 1 299 391 1 534 475 1 160 902 United Kingdom 10 992 431 10 800 338 8 823 773 9 223 542 8 700 345
Notes (1) The figures in this table include construction sands; pebbles, gravel shingle, flint; crushed rock; granules, chippings and powders
covered by Harmonised System codes 2505.90, 2517.10, 2517.41 and 2517.49 (2) Exports include marine dredged sand and gravel landed at foreign ports (a) BGS estimates, based on known imports into certain countries
Imports of primary aggregates (sand and gravel and crushed rock) tonnes Country 2010 2011 2012 2013 2014 Albania 15 253 20 645 26 226 41 918 37 907 Austria 2 284 169 2 184 095 2 521 253 2 420 461 3 404 903 Belgium 22 484 726 23 911 051 22 934 219 20 869 873 20 335 594 Bulgaria 14 843 15 075 18 661 50 149 88 713 Croatia 926 574 1 366 197 1 689 891 1 446 658 978 064 Cyprus 2 648 1 517 16 792 1 432 1 716 Czech Republic 353 419 357 455 352 553 405 141 740 057 Denmark 2 777 604 3 531 658 3 934 656 3 688 045 3 777 573 Estonia 1 395 122 1 302 589 1 215 348 1 308 292 1 197 158 Finland 284 066 52 920 96 804 137 333 126 704 France 9 838 820 11 224 302 10 814 082 10 481 744 10 430 257 Germany 11 936 108 13 786 596 11 636 491 9 868 728 10 545 395 Greece 13 538 16 892 4 102 5 633 3 850 Hungary 473 730 369 445 515 141 1 028 054 1 331 433 Iceland 6 492 7 524 32 327 14 981 28 860 Ireland, Republic of 652 594 695 162 817 052 840 968 963 667 Italy 3 057 378 2 135 306 966 588 1 035 371 558 871 Latvia 467 414 611 872 895 335 1 212 414 1 155 283 Lithuania 849 462 1 046 066 991 388 1 678 898 2 028 733 Luxembourg 2 118 047 2 309 583 2 047 389 2 232 322 2 834 047 Macedonia 1 029 1 180 3 403 1 085 3 938 Malta 37 324 28 813 38 373 51 082 95 964 Montenegro 26 703 12 574 4 709 1 933 9 860 Netherlands 26 065 573 28 239 777 23 457 644 22 724 647 24 404 781 Norway 82 706 98 721 107 087 83 631 53 541 Poland 5 014 564 9 022 494 5 766 695 3 143 654 3 680 582 Portugal 945 814 453 721 356 411 205 991 270 800 Romania 248 484 370 249 512 538 331 523 256 239 Serbia 15 910 8 759 9 907 14 742 19 854

154
Aggregates
Imports continued tonnes Country 2010 2011 2012 2013 2014 Slovakia 666 380 527 259 419 992 385 376 225 339 Slovenia 771 814 486 627 461 601 531 904 741 266 Spain 1 029 946 694 299 618 871 475 414 594 772 Sweden 533 148 802 173 944 006 924 873 988 134 Switzerland 8 010 059 8 566 572 8 611 775 8 315 656 8 687 660 Turkey 9 372 3 487 7 129 10 516 5 199 United Kingdom 2 239 950 2 062 760 1 792 148 923 566 931 278
Notes (1) The figures in this table include construction sands; pebbles, gravel shingle, flint; crushed rock; granules, chippings and powders
covered by Harmonised System codes 2505.90, 2517.10, 2517.41 and 2517.49
Aggregates - EU36 trade in 2014
-25 -20 -15 -10 -5 0 5 10 15 20 25
NetherlandsBelgium
GermanyFrance
SwitzerlandDenmark
PolandAustria
LuxembourgLithuaniaHungaryEstonia
LatviaSwedenCroatia
Ireland, Republic ofUnited Kingdom
SloveniaCzech Republic
SpainItaly
PortugalRomaniaSlovakiaFinland
MaltaBulgariaNorwayAlbaniaIcelandSerbia
MontenegroTurkey
MacedoniaGreeceCyprus
Million tonnes
Imports Exports
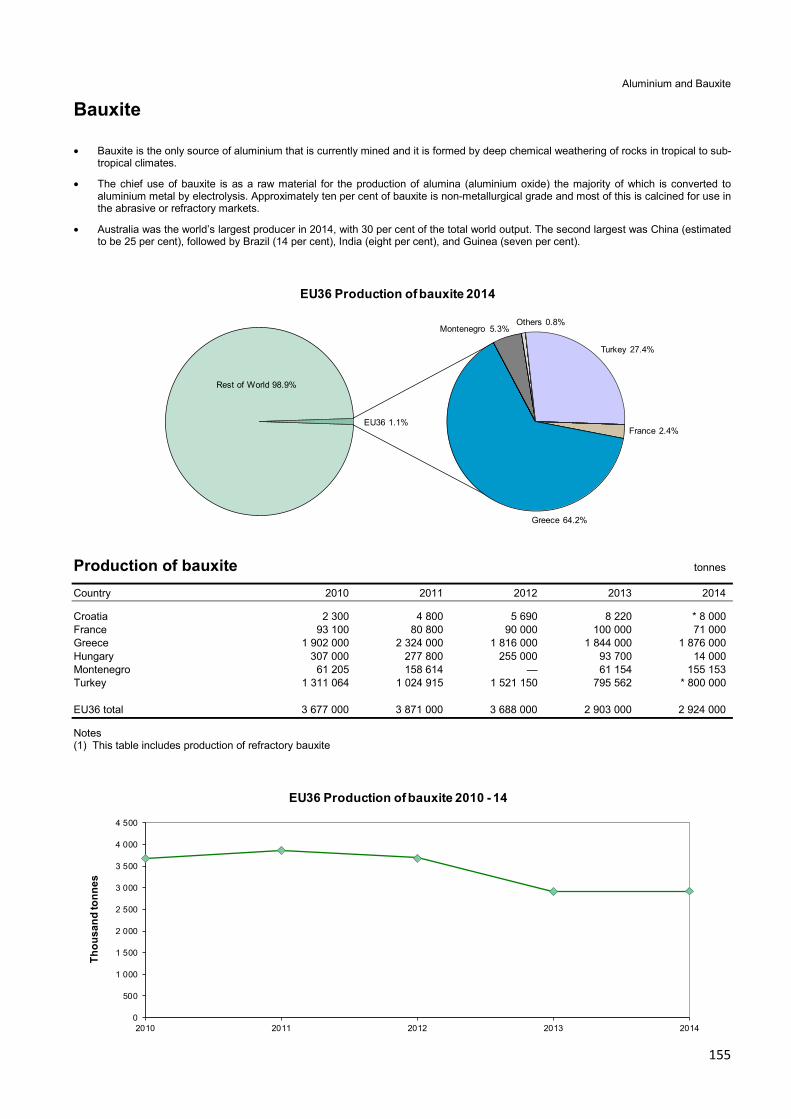
155
Aluminium and Bauxite
Bauxite
• Bauxite is the only source of aluminium that is currently mined and it is formed by deep chemical weathering of rocks in tropical to sub-tropical climates.
• The chief use of bauxite is as a raw material for the production of alumina (aluminium oxide) the majority of which is converted to aluminium metal by electrolysis. Approximately ten per cent of bauxite is non-metallurgical grade and most of this is calcined for use in the abrasive or refractory markets.
• Australia was the world’s largest producer in 2014, with 30 per cent of the total world output. The second largest was China (estimated to be 25 per cent), followed by Brazil (14 per cent), India (eight per cent), and Guinea (seven per cent).
Rest of World 98.9%
France 2.4%
Greece 64.2%
Montenegro 5.3%Others 0.8%
Turkey 27.4%
EU36 1.1%
EU36 Production of bauxite 2014
Production of bauxite tonnes Country 2010 2011 2012 2013 2014 Croatia 2 300 4 800 5 690 8 220 * 8 000 France 93 100 80 800 90 000 100 000 71 000 Greece 1 902 000 2 324 000 1 816 000 1 844 000 1 876 000 Hungary 307 000 277 800 255 000 93 700 14 000 Montenegro 61 205 158 614 — 61 154 155 153 Turkey 1 311 064 1 024 915 1 521 150 795 562 * 800 000 EU36 total 3 677 000 3 871 000 3 688 000 2 903 000 2 924 000
Notes (1) This table includes production of refractory bauxite
0
500
1 000
1 500
2 000
2 500
3 000
3 500
4 000
4 500
2010 2011 2012 2013 2014
Thou
sand
tonn
es
EU36 Production of bauxite 2010 - 14
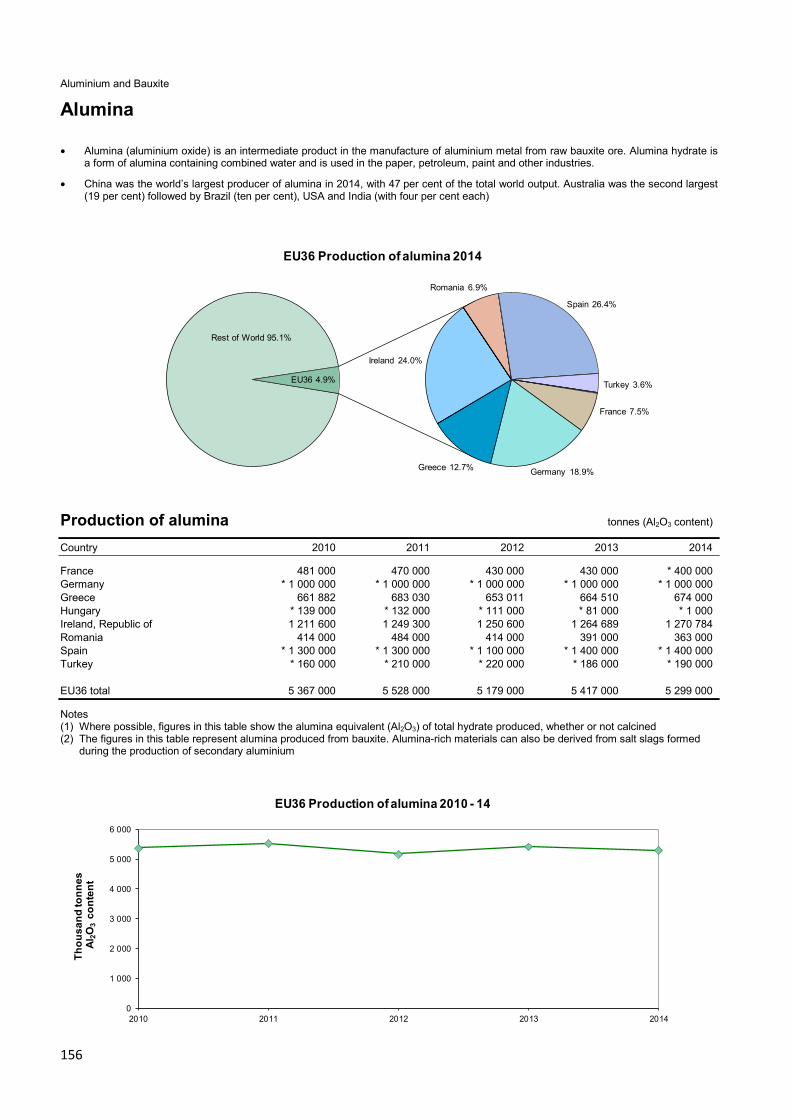
156
Aluminium and Bauxite
Alumina
• Alumina (aluminium oxide) is an intermediate product in the manufacture of aluminium metal from raw bauxite ore. Alumina hydrate is a form of alumina containing combined water and is used in the paper, petroleum, paint and other industries.
• China was the world’s largest producer of alumina in 2014, with 47 per cent of the total world output. Australia was the second largest (19 per cent) followed by Brazil (ten per cent), USA and India (with four per cent each)
Rest of World 95.1%
France 7.5%
Germany 18.9%Greece 12.7%
Ireland 24.0%
Romania 6.9%
Spain 26.4%
Turkey 3.6%EU36 4.9%
EU36 Production of alumina 2014
Production of alumina tonnes (Al2O3 content)
Country 2010 2011 2012 2013 2014 France 481 000 470 000 430 000 430 000 * 400 000 Germany * 1 000 000 * 1 000 000 * 1 000 000 * 1 000 000 * 1 000 000 Greece 661 882 683 030 653 011 664 510 674 000 Hungary * 139 000 * 132 000 * 111 000 * 81 000 * 1 000 Ireland, Republic of 1 211 600 1 249 300 1 250 600 1 264 689 1 270 784 Romania 414 000 484 000 414 000 391 000 363 000 Spain * 1 300 000 * 1 300 000 * 1 100 000 * 1 400 000 * 1 400 000 Turkey * 160 000 * 210 000 * 220 000 * 186 000 * 190 000 EU36 total 5 367 000 5 528 000 5 179 000 5 417 000 5 299 000 Notes (1) Where possible, figures in this table show the alumina equivalent (Al2O3) of total hydrate produced, whether or not calcined (2) The figures in this table represent alumina produced from bauxite. Alumina-rich materials can also be derived from salt slags formed
during the production of secondary aluminium
0
1 000
2 000
3 000
4 000
5 000
6 000
2010 2011 2012 2013 2014
Thou
sand
tonn
es
cont
ent
3O 2
Al
EU36 Production of alumina 2010 - 14

157
Aluminium and Bauxite
Aluminium metal
• Aluminium is a strong, lightweight metallic element that has many applications. The chief uses are in transportation, packaging and construction.
• China was the world’s largest producer in 2014, with 52 per cent of the total world output. The second largest was Russia (seven per cent), followed by Canada (five per cent), United Arab Emirates (four per cent) and the USA (three per cent).
Rest of World 92.3%
France 10.1%
Germany 13.0%Greece 4.2%
Iceland 18.3%
Norway 30.6%
Others 2.8%
Romania 6.4%
Slovakia 4.1%
Slovenia 2.1%
Spain 5.6%
Sweden 2.8%EU36 7.7%
EU36 Production of primary aluminium 2014
Production of primary aluminium tonnes Country 2010 2011 2012 2013 2014 Croatia 666 600 — — — France 356 000 334 000 349 000 343 000 415 000 Germany 402 480 432 472 410 413 492 368 530 700 Greece 137 000 165 150 165 050 169 480 173 260 Iceland 825 803 780 853 802 827 736 429 748 949 Italy 129 500 141 900 99 600 — — Montenegro 82 043 92 838 74 813 47 951 42 767 Netherlands 217 000 * 200 000 86 300 81 000 800 Norway 1 090 000 1 201 000 1 110 900 1 154 900 1 250 000 Romania 241 000 261 000 249 000 250 000 263 000 Slovakia 163 000 162 840 160 662 163 000 168 000 Slovenia 40 177 75 300 83 300 84 035 * 84 000 Spain 456 500 408 400 386 395 * 250 000 * 230 000 Sweden 93 000 111 000 129 000 131 000 113 000 Turkey 54 100 56 400 43 700 32 200 30 400 United Kingdom 186 000 213 000 60 000 45 000 41 000 EU36 total 4 474 000 4 637 000 4 211 000 3 980 000 4 091 000 Notes (1) The figures in this table are for primary aluminium only. Aluminium can also be produced from secondary sources and may be
recovered from salt slags

158
Aluminium and Bauxite
0
500
1 000
1 500
2 000
2 500
3 000
3 500
4 000
4 500
5 000
2010 2011 2012 2013 2014
Thou
sand
tonn
es
EU36 Production of primary aluminium 2010 - 14
Exports of bauxite, alumina and aluminium tonnes Country 2010 2011 2012 2013 2014 Albania Unwrought (a) 2 805 3 309 1 940 4 124 (b)* 6 000 Scrap 5 290 4 670 6 260 5 854 1 933 Austria Bauxite 1 897 11 944 21 832 83 Alumina 14 322 34 555 32 486 15 897 18 794 Alumina hydrate 32 50 40 30 1 870 Unwrought 3 236 2 344 2 465 2 299 1 485 Unwrought alloys 151 559 209 748 211 491 276 249 263 678 Scrap 122 057 105 138 128 589 151 419 173 159 Belgium Bauxite 48 683 37 533 36 651 34 078 48 647 Alumina 7 516 21 284 5 218 28 210 9 675 Unwrought 257 888 150 542 95 405 166 743 169 124 Unwrought alloys 14 204 30 285 61 019 74 265 67 028 Scrap 274 819 321 484 311 716 286 908 285 743 Bulgaria Unwrought alloys 6 798 7 555 5 866 6 440 7 668 Scrap 31 728 26 302 25 579 22 765 23 585 Croatia Unwrought 2 338 2 674 2 161 2 553 2 472 Unwrought alloys 1 017 2 055 2 114 2 516 2 384 Scrap 22 346 23 009 23 867 19 095 20 454 Cyprus Scrap 6 896 6 310 7 688 5 595 5 738 Czech Republic Alumina 3 861 3 659 4 065 5 384 6 739 Unwrought (a) 51 307 53 600 61 017 64 991 74 559 Scrap 71 467 89 690 85 939 55 875 69 547 Denmark Bauxite 3 279 6 769 9 432 4 600 386 Alumina 4 661 4 958 5 879 4 709 6 863 Unwrought alloys 9 515 7 382 7 440 7 896 6 579 Scrap 73 402 67 000 73 392 73 142 82 766 Estonia Bauxite ... 29 492 23 317 ... ... Unwrought (a) 4 132 52 1 220 1 090 1 014 Scrap 65 948 63 880 11 342 10 523 10 323 Finland Unwrought alloys 15 346 11 289 14 185 15 200 15 107 Scrap 33 304 38 862 43 221 48 252 51 067

159
Aluminium and Bauxite
Exports continued tonnes Country 2010 2011 2012 2013 2014 France Bauxite 12 116 13 594 11 975 11 125 8 715 Alumina 270 769 281 634 309 291 265 798 276 387 Alumina hydrate 131 035 83 054 139 311 97 170 87 204 Unwrought 51 275 71 970 45 172 64 410 52 152 Unwrought alloys 166 807 130 384 127 551 129 161 155 837 Scrap 405 847 425 541 423 298 447 687 484 375 Germany Bauxite 26 178 26 306 34 814 22 966 29 271 Alumina 424 236 372 191 369 337 374 471 291 433 Alumina hydrate 551 817 485 074 455 157 463 704 456 259 Unwrought 111 815 83 675 42 580 40 775 26 554 Unwrought alloys 361 396 374 917 361 850 383 882 381 113 Scrap 823 810 947 252 968 539 935 218 1 048 565 Greece Bauxite 436 513 519 999 437 305 337 274 429 707 Alumina 224 607 202 986 320 795 315 348 340 471 Alumina hydrate 99 574 102 136 110 605 160 632 155 770 Unwrought 20 727 19 668 5 925 4 626 7 890 Unwrought alloys 68 924 103 326 102 092 120 261 122 464 Scrap 32 250 27 738 20 367 16 636 15 084 Hungary Bauxite 738 207 208 548 10 479 Alumina 112 819 107 937 99 699 78 432 60 677 Alumina hydrate 92 011 71 834 64 000 51 224 43 330 Unwrought (a) 41 719 38 819 36 491 39 897 44 072 Scrap 51 508 66 599 68 156 78 773 75 901 Iceland Unwrought 812 981 765 999 787 071 788 366 699 341 Scrap 10 136 6 397 3 799 3 672 6 062 Ireland, Republic of Alumina 1 542 563 1 794 148 1 616 065 1 867 541 1 846 540 Alumina hydrate 124 803 103 631 30 328 55 265 111 513 Unwrought alloys 2 576 3 109 2 684 3 095 3 148 Scrap 22 810 29 261 24 137 29 763 25 260 Italy Bauxite 66 218 46 330 93 847 169 411 88 289 Alumina 17 056 16 821 3 424 4 411 7 746 Alumina hydrate 4 346 7 023 6 448 7 809 4 263 Unwrought 49 442 25 882 30 378 23 224 28 368 Unwrought alloys 220 237 286 525 311 381 322 614 342 526 Scrap 107 131 102 696 103 518 106 916 111 224 Latvia Alumina 140 64 225 115 744 14 622 85 Unwrought alloys 14 493 21 793 18 481 9 196 8 870 Scrap 5 461 4 414 4 876 4 771 7 090 Lithuania Alumina 22 59 413 2 574 74 Unwrought alloys 7 754 7 534 6 363 4 286 3 183 Scrap 5 298 8 952 10 306 12 777 14 729 Luxembourg Unwrought alloys 157 473 151 330 145 882 145 487 153 502 Scrap 6 034 6 051 6 902 5 993 4 467 Macedonia Scrap 2 351 2 432 2 724 2 833 2 479 Malta Scrap 1 865 1 788 2 058 1 811 1 979 Montenegro Bauxite 85 623 127 268 26 354 100 291 68 378 Unwrought (a) 76 891 108 813 75 180 (a) 48 052 (a) 42 171 Scrap 2 045 2 357 2 356 2 337 2 071
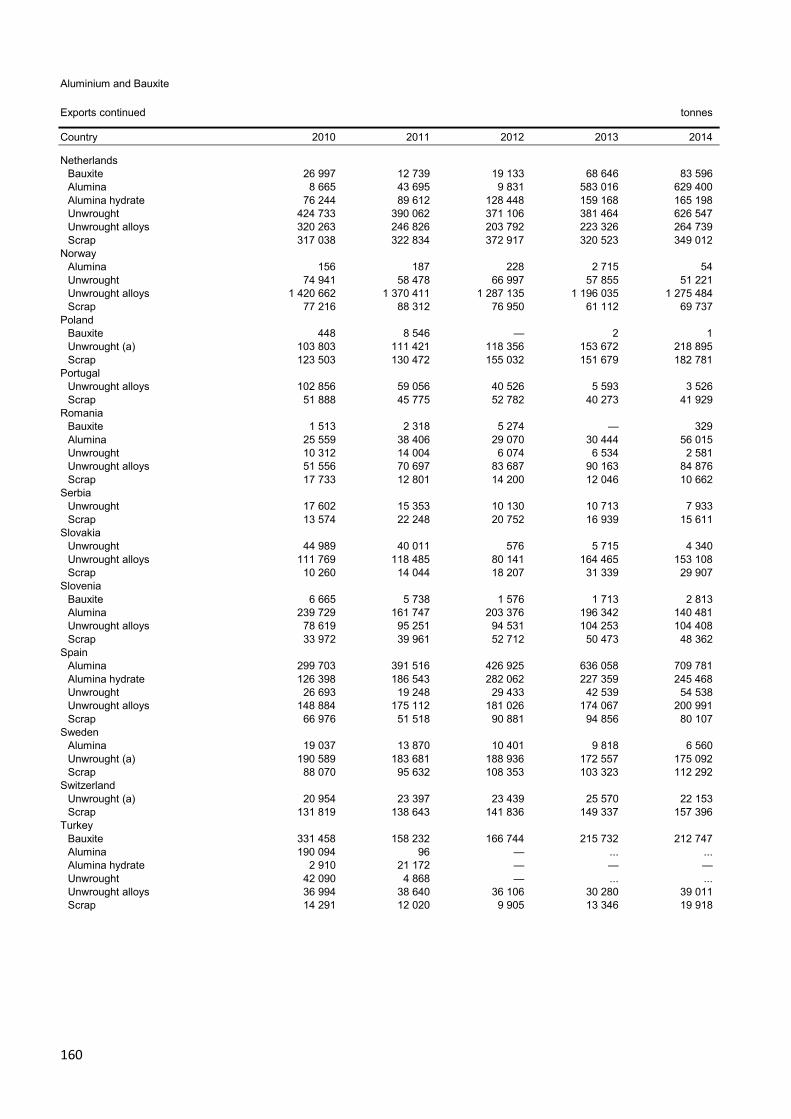
160
Aluminium and Bauxite
Exports continued tonnes Country 2010 2011 2012 2013 2014 Netherlands Bauxite 26 997 12 739 19 133 68 646 83 596 Alumina 8 665 43 695 9 831 583 016 629 400 Alumina hydrate 76 244 89 612 128 448 159 168 165 198 Unwrought 424 733 390 062 371 106 381 464 626 547 Unwrought alloys 320 263 246 826 203 792 223 326 264 739 Scrap 317 038 322 834 372 917 320 523 349 012 Norway Alumina 156 187 228 2 715 54 Unwrought 74 941 58 478 66 997 57 855 51 221 Unwrought alloys 1 420 662 1 370 411 1 287 135 1 196 035 1 275 484 Scrap 77 216 88 312 76 950 61 112 69 737 Poland Bauxite 448 8 546 — 2 1 Unwrought (a) 103 803 111 421 118 356 153 672 218 895 Scrap 123 503 130 472 155 032 151 679 182 781 Portugal Unwrought alloys 102 856 59 056 40 526 5 593 3 526 Scrap 51 888 45 775 52 782 40 273 41 929 Romania Bauxite 1 513 2 318 5 274 — 329 Alumina 25 559 38 406 29 070 30 444 56 015 Unwrought 10 312 14 004 6 074 6 534 2 581 Unwrought alloys 51 556 70 697 83 687 90 163 84 876 Scrap 17 733 12 801 14 200 12 046 10 662 Serbia Unwrought 17 602 15 353 10 130 10 713 7 933 Scrap 13 574 22 248 20 752 16 939 15 611 Slovakia Unwrought 44 989 40 011 576 5 715 4 340 Unwrought alloys 111 769 118 485 80 141 164 465 153 108 Scrap 10 260 14 044 18 207 31 339 29 907 Slovenia Bauxite 6 665 5 738 1 576 1 713 2 813 Alumina 239 729 161 747 203 376 196 342 140 481 Unwrought alloys 78 619 95 251 94 531 104 253 104 408 Scrap 33 972 39 961 52 712 50 473 48 362 Spain Alumina 299 703 391 516 426 925 636 058 709 781 Alumina hydrate 126 398 186 543 282 062 227 359 245 468 Unwrought 26 693 19 248 29 433 42 539 54 538 Unwrought alloys 148 884 175 112 181 026 174 067 200 991 Scrap 66 976 51 518 90 881 94 856 80 107 Sweden Alumina 19 037 13 870 10 401 9 818 6 560 Unwrought (a) 190 589 183 681 188 936 172 557 175 092 Scrap 88 070 95 632 108 353 103 323 112 292 Switzerland Unwrought (a) 20 954 23 397 23 439 25 570 22 153 Scrap 131 819 138 643 141 836 149 337 157 396 Turkey Bauxite 331 458 158 232 166 744 215 732 212 747 Alumina 190 094 96 — ... ... Alumina hydrate 2 910 21 172 — — — Unwrought 42 090 4 868 — ... ... Unwrought alloys 36 994 38 640 36 106 30 280 39 011 Scrap 14 291 12 020 9 905 13 346 19 918

161
Aluminium and Bauxite
Exports continued tonnes Country 2010 2011 2012 2013 2014 United Kingdom Bauxite 3 140 5 936 2 929 4 804 4 339 Alumina 5 879 5 114 3 590 3 247 4 116 Alumina hydrate (b) * 2 100 * 2 600 * 10 700 * 1 600 * 1 900 Unwrought 43 665 49 959 9 597 8 510 6 364 Unwrought alloys 364 612 356 170 279 263 188 996 219 143 Scrap 443 466 440 399 445 730 402 060 452 620
Notes (1) Except where alumina hydrate is separately specified, national trade figures for alumina can be considered as inclusive of hydrate (2) In this table the term 'unwrought' aluminium corresponds to item 7601 of the Harmonised System and comprises ingots, blocks,
unwrought bars, etc. (3) Metal traded in ferro-alloy form is included under iron, steel and ferro-alloys (a) Including alloys (b) BGS estimates, based on known imports into certain countries
Imports of bauxite, alumina and aluminium tonnes Country 2010 2011 2012 2013 2014 Albania Bauxite 5 408 497 (a)* 1 ... (a)* 2 Unwrought (b) 7 198 7 718 9 946 10 631 (a)* 6 000 Scrap 1 268 1 234 548 1 802 (a)* 400 Austria Bauxite 8 489 7 842 6 169 9 235 18 742 Alumina 47 681 53 232 40 520 20 675 21 841 Alumina hydrate 12 914 12 821 14 603 15 411 12 691 Unwrought 177 751 197 795 131 764 156 583 146 896 Unwrought alloys 239 493 280 502 314 594 235 575 242 352 Scrap 268 845 282 707 304 272 280 710 285 564 Belgium Bauxite 75 600 52 727 41 111 41 968 57 338 Alumina 19 028 20 406 25 501 21 092 22 643 Alumina hydrate 34 978 52 806 36 956 63 875 46 644 Unwrought 517 946 412 600 400 947 364 106 321 243 Unwrought alloys 193 103 218 350 159 147 168 240 147 383 Scrap 228 517 257 366 249 187 206 775 237 259 Bulgaria Alumina 2 887 1 875 3 429 3 946 3 919 Unwrought 44 468 43 192 43 405 50 232 33 071 Unwrought alloys 27 444 35 685 42 685 55 507 61 910 Scrap 6 897 4 625 1 582 1 742 1 607 Croatia Bauxite 85 634 66 169 67 410 73 689 93 847 Alumina 936 1 552 889 954 2 457 Unwrought 50 354 45 493 54 040 38 781 21 086 Unwrought alloys 29 270 40 783 31 807 40 502 48 986 Cyprus Unwrought (b) 9 225 7 104 6 458 4 768 4 136 Czech Republic Bauxite 33 794 32 556 27 514 24 765 56 797 Alumina 7 407 7 980 7 682 9 089 10 222 Alumina hydrate 9 547 10 052 8 851 9 574 9 478 Unwrought 76 945 84 560 77 128 71 737 58 878 Unwrought alloys 135 648 153 819 141 484 166 166 208 080 Scrap 61 802 86 969 103 385 81 351 74 357 Denmark Bauxite 8 364 9 112 7 515 10 371 4 677 Alumina 22 484 21 012 25 210 28 552 29 012 Unwrought 523 742 2 730 19 795 33 056 Unwrought alloys 78 956 85 315 75 066 34 687 24 821 Scrap 5 175 5 891 5 267 13 785 6 419

162
Aluminium and Bauxite
Imports continued tonnes Country 2010 2011 2012 2013 2014 Estonia Unwrought (b) 3 176 2 231 2 811 902 907 Scrap 4 495 2 488 488 250 349 Finland Bauxite 9 294 3 036 1 328 3 168 3 504 Alumina 2 401 2 422 2 479 3 057 2 571 Alumina hydrate 29 607 25 676 22 996 26 702 34 704 Unwrought 2 008 2 070 1 596 1 691 2 091 Unwrought alloys 37 539 37 589 32 897 33 081 36 068 Scrap 15 466 15 803 14 080 14 731 14 880 France Bauxite 984 804 1 577 328 1 443 488 1 198 412 1 343 089 Alumina 734 935 619 175 734 773 720 649 746 090 Alumina hydrate 47 336 47 510 43 650 37 402 38 586 Unwrought 103 937 152 348 134 309 147 016 177 323 Unwrought alloys 364 962 387 038 277 335 326 472 385 126 Scrap 260 871 292 597 267 325 246 746 234 669 Germany Bauxite 2 005 053 2 436 413 2 777 032 2 407 688 2 623 127 Alumina 661 379 654 946 476 257 832 700 639 868 Alumina hydrate 260 488 176 692 196 301 160 162 199 031 Unwrought 799 780 768 797 732 599 759 344 870 026 Unwrought alloys 1 591 991 1 810 035 1 750 733 1 759 155 1 819 650 Scrap 479 413 535 304 575 925 560 479 655 187 Greece Bauxite 465 322 333 571 90 804 330 522 439 916 Unwrought 153 771 126 051 119 587 141 469 145 268 Unwrought alloys 66 134 59 931 51 875 60 864 61 029 Scrap 43 866 95 166 54 011 40 371 32 430 Hungary Bauxite 244 095 254 039 142 246 146 245 1 282 Alumina 22 660 36 305 42 371 51 768 59 050 Alumina hydrate 6 856 9 123 7 382 69 615 160 273 Unwrought 146 221 135 392 129 030 130 942 150 333 Unwrought alloys 165 833 190 175 181 695 187 798 166 679 Scrap 43 720 59 661 47 904 35 042 37 391 Iceland Alumina 1 612 188 1 539 080 1 590 521 1 646 175 1 583 285 Unwrought (b) 6 127 5 560 1 356 1 968 7 288 Ireland, Republic of Bauxite 4 111 457 4 215 019 4 169 784 4 434 990 4 424 292 Alumina 4 903 4 378 9 679 9 288 5 536 Italy Bauxite 62 666 45 146 55 504 31 679 52 264 Alumina 252 028 406 774 292 537 122 812 131 876 Alumina hydrate 198 253 205 274 180 778 199 553 196 890 Unwrought 432 393 482 850 355 557 465 484 532 070 Unwrought alloys 488 002 563 882 489 373 520 800 582 184 Scrap 372 686 461 302 444 544 448 220 510 101 Latvia Scrap 7 828 10 381 10 956 13 929 9 794 Lithuania Alumina 16 411 26 876 23 690 21 348 12 813 Scrap 2 460 6 014 3 238 3 682 2 721 Luxembourg Unwrought 62 504 51 627 44 826 37 496 58 344 Unwrought alloys 7 362 5 586 8 278 8 556 12 470 Scrap 128 632 121 295 161 015 168 410 133 848 Macedonia Unwrought (b) 2 839 2 642 2 785 2 856 3 034 Scrap 1 554 1 842 1 073 834 723 Montenegro Alumina 157 753 185 103 139 940 93 297 83 512

163
Aluminium and Bauxite
Imports continued tonnes Country 2010 2011 2012 2013 2014 Netherlands Bauxite 113 499 113 653 108 492 35 459 126 019 Alumina 692 413 955 665 626 715 792 007 804 607 Alumina hydrate 167 596 246 013 243 186 287 325 269 165 Unwrought 384 724 424 915 487 639 163 027 930 866 Unwrought alloys 462 371 537 289 464 926 444 992 463 212 Scrap 184 066 241 081 270 014 220 965 233 610 Norway Bauxite 8 645 459 746 485 475 Alumina 2 144 519 2 185 976 2 191 352 2 302 823 2 260 295 Alumina hydrate 35 379 53 224 50 386 47 789 52 105 Unwrought 512 340 450 432 298 464 286 320 334 875 Unwrought alloys 68 086 27 867 41 031 21 577 13 455 Scrap 38 039 42 078 31 750 32 529 32 927 Poland Bauxite 48 664 45 672 51 430 46 961 44 237 Alumina 29 920 34 691 35 709 34 969 40 087 Alumina hydrate 31 406 26 536 25 912 28 557 27 653 Unwrought 125 567 125 147 112 325 99 308 86 261 Unwrought alloys 192 393 232 859 245 491 254 479 333 092 Scrap 84 622 98 484 108 168 175 534 206 825 Portugal Alumina 14 862 8 762 8 863 9 472 9 006 Unwrought 20 152 18 744 17 371 13 634 13 076 Unwrought alloys 170 057 113 150 96 190 74 013 92 153 Scrap 10 183 5 305 7 409 4 460 6 896 Romania Bauxite 1 277 587 1 271 274 1 297 303 1 064 823 1 162 356 Alumina 1 928 15 037 2 554 22 819 86 791 Alumina hydrate 10 412 5 768 2 841 537 1 001 Unwrought 2 163 3 024 2 751 10 877 13 824 Unwrought alloys 33 711 24 287 26 311 31 608 50 854 Scrap 83 381 62 768 66 878 92 702 83 977 Serbia Bauxite 10 972 7 800 5 976 3 807 736 Alumina 3 682 2 673 3 092 3 190 4 080 Unwrought 54 512 51 717 51 578 54 127 49 263 Unwrought alloys 13 600 15 834 14 446 17 668 19 465 Scrap 8 404 6 870 7 209 10 334 10 053 Slovakia Bauxite 4 233 6 136 6 087 9 087 6 772 Alumina 270 777 232 187 261 594 320 772 321 679 Unwrought 8 916 3 430 1 627 2 082 4 494 Unwrought alloys 37 657 40 885 37 654 46 976 56 446 Scrap 2 098 3 181 3 667 6 174 7 903 Slovenia Bauxite 41 846 42 555 22 700 44 860 28 914 Alumina 328 453 322 872 381 845 376 159 329 588 Alumina hydrate 27 252 26 173 15 753 21 712 24 169 Unwrought 87 848 65 523 66 209 74 611 78 438 Unwrought alloys 65 950 71 318 66 410 84 970 82 509 Scrap 51 159 52 860 60 468 69 046 77 241 Spain Bauxite 3 325 099 3 080 295 3 693 740 3 510 247 3 806 558 Alumina 31 527 61 184 28 910 31 683 31 029 Alumina hydrate 29 317 22 917 16 162 13 491 21 749 Unwrought 119 589 110 612 107 320 122 958 171 163 Unwrought alloys 229 036 219 925 207 511 202 690 207 579 Scrap 111 942 125 190 155 371 176 445 200 411 Sweden Bauxite 6 660 10 460 12 271 13 074 15 944 Alumina 211 393 266 978 258 634 278 411 210 340 Alumina hydrate 95 073 77 121 64 907 66 055 68 803 Unwrought 35 506 22 371 26 948 22 447 38 605 Unwrought alloys 188 198 175 194 125 377 108 735 134 294 Scrap 48 508 47 458 49 270 59 064 72 278
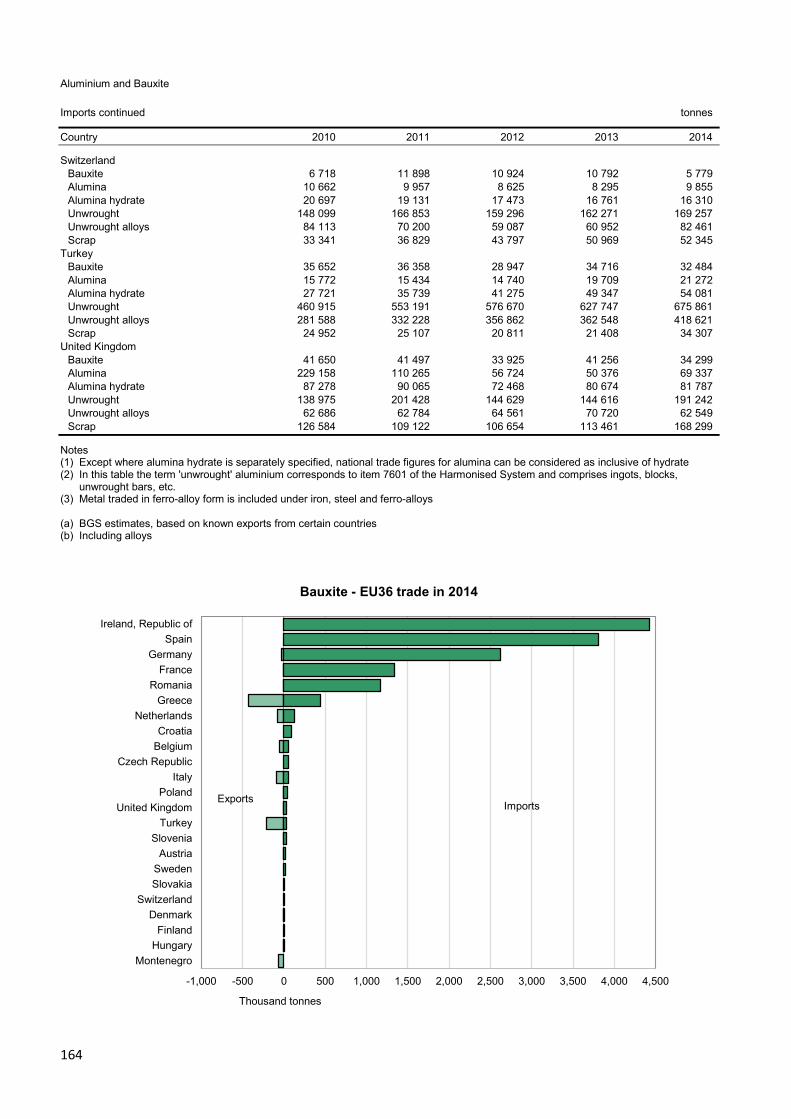
164
Aluminium and Bauxite
Imports continued tonnes Country 2010 2011 2012 2013 2014 Switzerland Bauxite 6 718 11 898 10 924 10 792 5 779 Alumina 10 662 9 957 8 625 8 295 9 855 Alumina hydrate 20 697 19 131 17 473 16 761 16 310 Unwrought 148 099 166 853 159 296 162 271 169 257 Unwrought alloys 84 113 70 200 59 087 60 952 82 461 Scrap 33 341 36 829 43 797 50 969 52 345 Turkey Bauxite 35 652 36 358 28 947 34 716 32 484 Alumina 15 772 15 434 14 740 19 709 21 272 Alumina hydrate 27 721 35 739 41 275 49 347 54 081 Unwrought 460 915 553 191 576 670 627 747 675 861 Unwrought alloys 281 588 332 228 356 862 362 548 418 621 Scrap 24 952 25 107 20 811 21 408 34 307 United Kingdom Bauxite 41 650 41 497 33 925 41 256 34 299 Alumina 229 158 110 265 56 724 50 376 69 337 Alumina hydrate 87 278 90 065 72 468 80 674 81 787 Unwrought 138 975 201 428 144 629 144 616 191 242 Unwrought alloys 62 686 62 784 64 561 70 720 62 549 Scrap 126 584 109 122 106 654 113 461 168 299
Notes (1) Except where alumina hydrate is separately specified, national trade figures for alumina can be considered as inclusive of hydrate (2) In this table the term 'unwrought' aluminium corresponds to item 7601 of the Harmonised System and comprises ingots, blocks,
unwrought bars, etc. (3) Metal traded in ferro-alloy form is included under iron, steel and ferro-alloys (a) BGS estimates, based on known exports from certain countries (b) Including alloys
Bauxite - EU36 trade in 2014
-1,000 -500 0 500 1,000 1,500 2,000 2,500 3,000 3,500 4,000 4,500
Ireland, Republic ofSpain
GermanyFrance
RomaniaGreece
NetherlandsCroatia
BelgiumCzech Republic
ItalyPoland
United KingdomTurkey
SloveniaAustria
SwedenSlovakia
SwitzerlandDenmark
FinlandHungary
Montenegro
Thousand tonnes
Imports Exports

165
Aluminium and Bauxite
Alumina and alumina hydrate - EU36 trade in 2014
-2,000 -1,500 -1,000 -500 0 500 1,000 1,500 2,000 2,500
NorwayIceland
NetherlandsGermany
FranceSlovenia
ItalySlovakiaSwedenHungary
United KingdomRomania
MontenegroTurkey
BelgiumPolandSpain
FinlandAustria
DenmarkSwitzerland
Czech RepublicLithuaniaPortugal
Ireland, Republic ofGreece
Thousand tonnes
Imports Exports
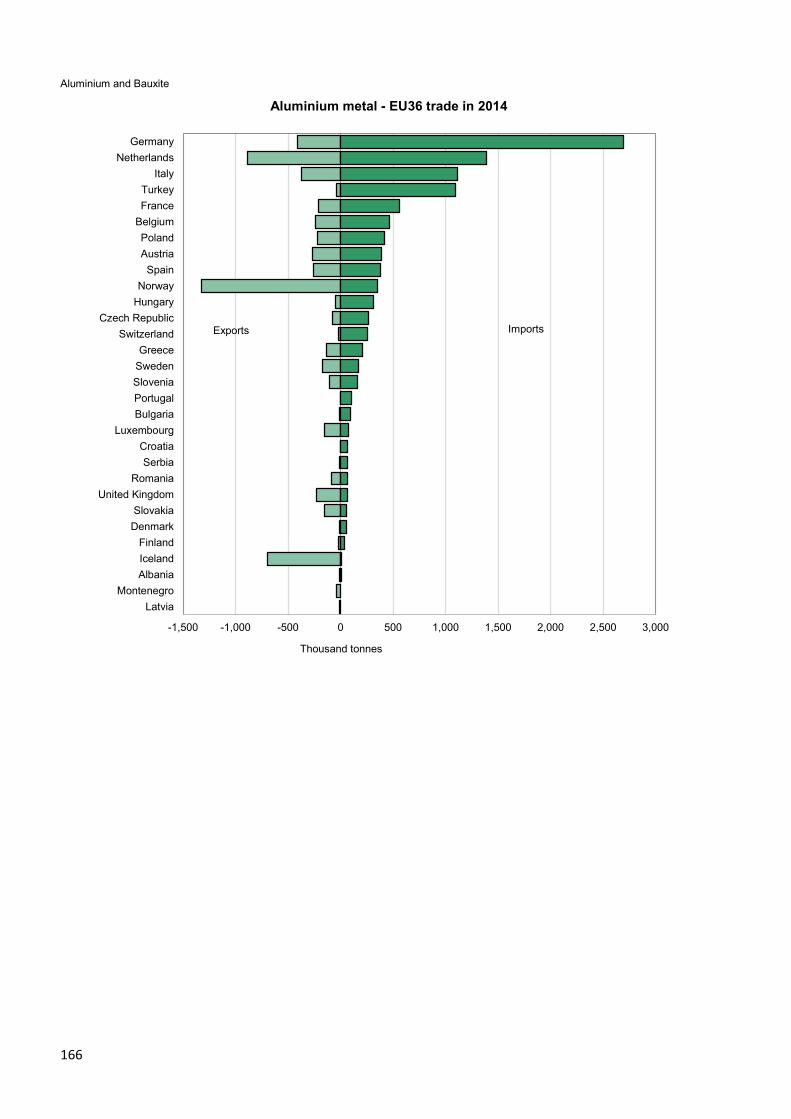
166
Aluminium and Bauxite
Aluminium metal - EU36 trade in 2014
-1,500 -1,000 -500 0 500 1,000 1,500 2,000 2,500 3,000
GermanyNetherlands
ItalyTurkeyFrance
BelgiumPolandAustriaSpain
NorwayHungary
Czech RepublicSwitzerland
GreeceSwedenSloveniaPortugalBulgaria
LuxembourgCroatiaSerbia
RomaniaUnited Kingdom
SlovakiaDenmark
FinlandIcelandAlbania
MontenegroLatvia
Thousand tonnes
Imports Exports

167
Antimony
Antimony
• Antimony is a toxic metallic element with several specialised uses. It is frequently alloyed with lead, where it greatly increases hardness and strength. Antimony is also used in semi-conductors and its compounds form excellent flame-retardants in cable sheaths.
• China was the largest mine producer of antimony in 2014, with 76 per cent of world production. The second largest were Tajikistan and Russia (with four per cent each), followed by Turkey and Bolivia (with three per cent each). Antimony is also produced as a by-product of lead refining in many countries.
Mine production of antimony tonnes (metal content) Country 2010 2011 2012 2013 2014
Turkey 1 403 2 340 7 119 4 512 * 4 500
Notes (1) This table includes antimony content of antimonial lead alloys (2) In addition, Hungary is believed to produce antimony
Exports of antimony tonnes Country 2010 2011 2012 2013 2014 Belgium Ores and concentrates 433 274 1 187 4 57 Metal 776 732 259 271 138 Oxide 10 599 10 417 7 818 7 751 8 555 Estonia Metal 67 113 ... — — France Metal 145 24 60 95 68 Oxide 6 853 6 124 5 482 5 192 5 470 Germany Metal 132 239 103 86 20 Oxide 961 1 132 688 669 662 Italy Ores and concentrates 960 898 1 311 1 669 1 970 Metal 19 80 2 7 61 Oxide 226 261 215 399 450 Netherlands Metal 219 385 475 429 571 Oxide 433 264 206 155 250 Portugal Metal 138 70 277 138 51 Slovenia Metal — 2 1 40 63 Spain Metal 19 50 247 2 11 Oxide 1 716 1 784 1 204 2 361 2 457 Turkey Ores and concentrates 2 765 2 977 2 450 3 150 2 935 Metal 21 6 113 554 367 United Kingdom Metal 77 57 237 425 525 Oxide 490 290 422 152 127

168
Antimony
Imports of antimony tonnes Country 2010 2011 2012 2013 2014 Austria Metal 37 214 267 316 302 Oxide 249 204 156 164 288 Belgium Ores and concentrates 5 — 1 — 5 864 Metal 10 280 9 451 7 195 7 613 7 216 Oxide 904 831 1 822 786 794 Czech Republic Metal 75 64 31 42 103 Oxide 379 356 411 367 375 France Ores and concentrates 101 74 0 0 9 Metal 9 068 7 413 6 502 5 372 6 680 Oxide 1 577 2 854 1 677 1 572 1 542 Germany Ores and concentrates 11 8 6 922 1 202 Metal 494 456 376 462 280 Oxide 7 986 6 949 6 013 5 675 5 997 Greece Metal 74 84 47 98 46 Hungary Oxide 156 148 173 196 180 Ireland, Republic of Metal 64 0 0 0 0 Italy Ores and concentrates 1 378 1 169 1 474 1 964 2 347 Metal 233 298 132 332 188 Oxide 5 460 4 227 3 538 3 201 3 284 Netherlands Metal 314 208 586 697 628 Oxide 57 454 26 729 18 315 16 031 1 708 Norway Oxide 264 193 211 162 176 Poland Ores and concentrates 54 10 34 44 110 Metal 47 68 62 115 93 Oxide 1 044 1 026 949 841 922 Portugal Oxide 240 184 239 229 239 Romania Metal 61 43 9 55 18 Oxide 88 120 163 138 183 Slovenia Metal 36 150 25 49 101 Spain Ores and concentrates 103 29 10 7 10 Metal 2 642 2 450 1 553 2 760 1 609 Oxide 516 494 720 630 606 Sweden Oxide 219 227 194 153 149 Switzerland Oxide 1 108 1 131 583 505 492 Turkey Ores and concentrates 82 121 0 11 13 Metal 219 245 256 273 249 Oxide 885 739 705 817 925 United Kingdom Metal 68 120 257 280 375 Oxide 2 607 2 466 1 712 1 688 1 916

169
Arsenic
Arsenic
• Arsenic is a toxic semi-metallic element produced and traded chiefly as ‘white arsenic’ (arsenic trioxide). Its principal uses are as compounds in wood preservatives and pesticides. Gallium arsenide is used in semi-conductors whilst arsenic metal has a number of minor uses.
• China was the largest producer of white arsenic in 2014 and is estimated to produce more than half of world output. Other significant producers are Morocco, Russia and Belgium.
Production of white arsenic tonnes Country 2010 2011 2012 2013 2014 Belgium * 1 000 * 1 000 * 1 000 * 1 000 * 1 000 Portugal * 15 * 15 * 15 *— *—
Notes (1) This table includes calculated trioxide equivalent of arsenic metal produced except where this would involve double counting (2) In addition to the countries listed, Austria, Finland, Hungary, Spain and the United Kingdom are believed to produce arsenic
Exports of metallic arsenic tonnes Country 2010 2011 2012 2013 2014 Belgium 114 120 191 104 79 France 5 8 10 3 6 Germany 57 66 128 40 24 Netherlands 11 62 55 22 62
Notes (1) This table does not purport to be comprehensive: data relating to arsenic are not fully recorded by many countries
Imports of metallic arsenic tonnes Country 2010 2011 2012 2013 2014 Belgium 114 634 284 72 74 Bulgaria 3 10 10 27 12 France 17 21 30 18 33 Germany 73 6 106 45 23 Greece 33 9 3 3 10 Italy 19 74 33 81 1 Netherlands 95 104 — 109 196 Poland 42 45 44 39 25 Romania 2 5 7 8 16 Slovenia * — 11 11 10 15 Spain 96 93 143 117 209 Turkey 55 10 49 78 143 United Kingdom 7 5 15 11 7
Notes (1) This table does not purport to be comprehensive: data relating to arsenic are not fully recorded by many countries

170
Asbestos
Asbestos
• Asbestos is a commercial term for six fibrous minerals of which chrysotile (white asbestos), the fibrous form of serpentine, is the only form of asbestos now worked. Asbestos was once highly sought after because of its unique combination of properties:
- non-combustibility - resistance to heat, friction, corrosion and acid/alkali attack - good thermal and sound insulation qualities - good dialectric properties
• Airborne asbestos fibres are a serious hazard to health and virtually all industrial use of asbestos has now ceased in Europe. The largest world producer is Russia with an estimated 53 per cent of the total world output, followed by China with an estimated 20 per cent. Other significant producers are Brazil (16 per cent) and Kazakhstan (11 per cent).
Exports of unmanufactured asbestos tonnes Country 2010 2011 2012 2013 2014 Serbia 1 306 ... ... ... Switzerland 42 17 10 30 ...
Imports of unmanufactured asbestos tonnes Country 2010 2011 2012 2013 2014 France 42 (a)* 60 (a)* 10 (a)* 40 (a)* 40 Germany 72 88 554 78 — Luxembourg — 37 1 — ... Romania — ... 3 27 103 Slovakia — 64 76 96 77 Spain — 6 28 51 (a)* 632 United Kingdom — — 0 — 323
Notes (a) BGS estimates, based on known exports from certain countries
Asbestos - EU36 trade in 2014
-100 0 100 200 300 400 500 600
SpainUnited Kingdom
RomaniaSlovakia
France
Tonnes
Exports Imports

171
Barytes
Barytes
• Barytes (barium sulphate) is used in a variety of industries that utilise its properties of high specific gravity, softness, non-abrasiveness, chemical neutrality and brightness. About 80 per cent of barytes production is used in the manufacture and utilisation of drilling fluids in oil and gas exploration.
• China was the world’s largest producer in 2014, with 44 per cent of the total world output. The second largest was India (15 per cent), followed by Morocco (11 per cent), USA (eight per cent) and Iran (five per cent).
Rest of World 94.6%
Bulgaria 4.0%
Germany 14.2%
Others 0.7%Slovakia 4.2%
Turkey 68.1%United Kingdom 8.8%
EU36 5.4%
EU36 Production of barytes 2014
Production of barytes tonnes Country 2010 2011 2012 2013 2014 Bulgaria 500 200 — 1 000 20 000 Germany 55 887 55 342 52 030 45 446 70 665 Italy * 3 500 * 3 500 * 3 500 * 3 500 * 3 500 Portugal 15 — — — — Slovakia 17 000 13 000 21 000 24 000 21 000 Spain 2 050 — — — — Turkey 172 618 250 786 * 250 000 * 250 000 * 340 000 United Kingdom 34 099 31 000 30 000 * 30 000 * 44 000 EU36 total 286 000 354 000 357 000 354 000 499 000 Notes (1) This table may include small quantities of witherite
0
100
200
300
400
500
600
2010 2011 2012 2013 2014
Thou
sand
tonn
es
EU36 Production of barytes 2010 - 14

172
Barytes
Exports of barytes tonnes
Country 2010 2011 2012 2013 2014 Austria 345 618 766 769 894 Belgium 3 216 213 1 713 11 796 33 463 Bulgaria 505 231 — 960 19 373 Denmark (a)* 50 (a)* 1 300 (a)* 300 (a)* 700 1 111 France (a) * 10 500 * 10 600 * 11 700 * 6 500 * 6 900 Germany (a) * 33 000 * 34 000 * 29 000 * 12 500 * 2 100 Hungary ... ... 180 2 034 209 Italy 1 906 2 623 4 898 4 427 5 735 Netherlands 79 880 71 719 92 823 95 795 108 073 Norway 12 071 8 008 9 954 13 246 10 729 Romania 258 2 009 1 326 6 802 1 011 Slovakia 641 230 197 10 831 9 549 Spain 32 427 34 285 38 285 34 361 33 825 Turkey 175 497 144 238 157 967 215 363 273 831 United Kingdom (b) 17 851 15 648 19 072 13 854 13 550
Notes (1) Trade in barytes is reported under item 2511 of the Harmonised System and is described as 'barytes and witherite'. However, only
small quantities of witherite are traded (a) BGS estimates, based on known imports into certain countries (b) Mainly barites with some witherite.
Imports of barytes tonnes Country 2010 2011 2012 2013 2014 Albania 320 1 192 2 665 363 13 Austria 3 115 4 711 5 157 3 545 5 262 Belgium 5 637 4 294 12 095 7 961 36 304 Bulgaria 155 112 848 1 840 1 173 Croatia 710 125 2 225 1 105 847 Cyprus 5 58 2 848 — Czech Republic 7 004 7 431 7 008 6 525 7 783 Denmark 17 749 20 497 8 262 16 259 11 217 Finland 4 406 4 383 4 101 3 988 4 847 France 41 513 29 516 40 294 32 790 23 809 Germany 263 839 291 716 237 254 171 262 106 647 Greece 1 318 2 277 1 222 2 667 1 396 Hungary 1 441 2 852 516 1 106 1 232 Italy 67 303 88 574 69 098 93 846 66 352 Luxembourg 17 182 17 049 12 350 6 827 5 728 Malta 10 14 6 11 4 813 Netherlands 161 343 148 240 168 963 140 000 153 290 Norway 149 510 139 620 124 210 159 682 154 378 Poland 11 758 15 723 21 567 11 154 14 600 Portugal 4 448 2 509 2 286 2 985 3 640 Romania 8 501 15 598 16 874 23 859 20 836 Serbia 421 1 494 3 468 2 491 1 578 Slovenia 457 609 881 860 929 Spain 106 637 70 896 49 674 47 798 60 311 Sweden 4 406 4 224 3 947 2 666 3 510 Switzerland 3 020 3 156 3 359 3 429 3 434 Turkey 342 2 863 5 567 29 019 31 297 United Kingdom (a) 89 474 99 872 88 042 102 274 75 984
Notes (1) Trade in barytes is reported under item 2511 of the Harmonised System and is described as 'barytes and witherite'. However, only
small quantities of witherite are traded (a) Mainly barites with some witherite.
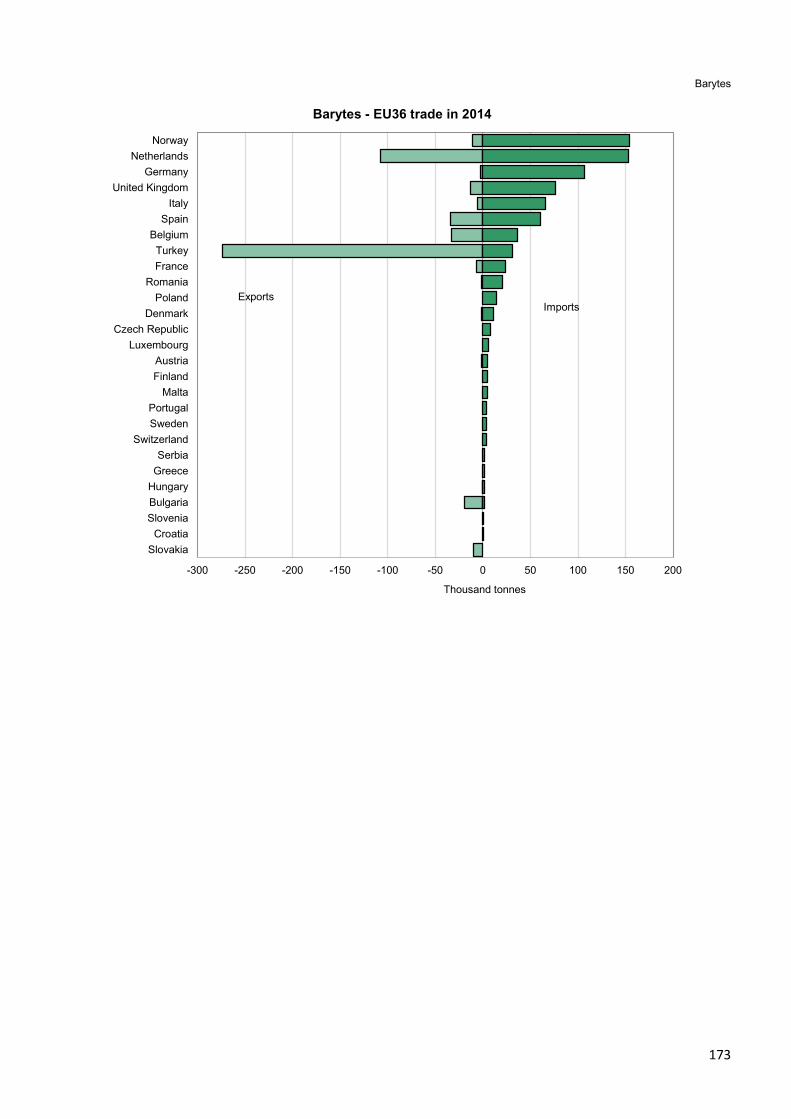
173
Barytes
Barytes - EU36 trade in 2014
-300 -250 -200 -150 -100 -50 0 50 100 150 200
NorwayNetherlands
GermanyUnited Kingdom
ItalySpain
BelgiumTurkeyFrance
RomaniaPoland
DenmarkCzech Republic
LuxembourgAustriaFinland
MaltaPortugalSweden
SwitzerlandSerbia
GreeceHungaryBulgariaSlovenia
CroatiaSlovakia
Thousand tonnes
Imports Exports

174
Bentonite and Fuller's Earth
Bentonite and fullers earth
• Bentonites consist of montmorillonite (a clay mineral) that occurs as two main varieties — calcium bentonite and the more commercially important sodium bentonite. In the UK the name fuller’s earth is given to calcium bentonite (and in the USA, attapulgite). Sepiolite is a fibrous clay that can be a substitute for bentonite. Calcium bentonite can be changed to sodium bentonite by the ion-exchange process. The main uses of bentonite and fuller’s earth take advantage of their natural sorptive and thixotropic properties. They are used as additions to drilling muds, in making foundry moulds, pelletising iron ore and in the manufacture of cat litter.
• USA was the world’s largest producer of bentonite in 2014, with an estimated 29 per cent of the total world output. The second largest was China (estimated at 22 per cent), followed by India (eight per cent) Greece (six per cent), Turkey and Mexico (four per cent each). The USA was also the largest producer of fuller’s earth.
Rest of World 82.1%
Cyprus 4.8%
Czech Republic 10.4%Germany 13.6%
Greece 34.5%
Others 4.7%Slovakia 7.1%
Spain 3.5%
Turkey 21.4%EU36 17.9%
EU36 Production of bentonite 2014
Rest of World 82.6%
Spain 98.3%
Turkey 1.7%
EU36 17.4%
EU36 Production of attapulgite and sepiolite 2014
Production of bentonite and fuller's earth tonnes Country 2010 2011 2012 2013 2014 Bulgaria Bentonite 99 700 53 900 77 900 — *— Cyprus Bentonite 162 969 160 625 160 180 158 386 140 174 Czech Republic Bentonite 183 000 160 000 221 000 226 000 301 000 Denmark Bentonite 23 832 38 300 30 330 56 355 66 388 France Bentonite 25 000 20 000 28 000 25 000 20 000

175
Bentonite and Fuller's Earth
Production continued tonnes Country 2010 2011 2012 2013 2014 Germany Bentonite 362 623 375 332 366 220 358 844 394 657 Greece Bentonite 844 804 1 250 000 1 235 110 1 200 000 1 000 000 Hungary Bentonite 17 200 22 931 1 392 7 397 * 10 500 Italy Bentonite 104 279 112 811 95 757 20 129 20 658 Macedonia Bentonite 7 084 8 918 2 355 18 520 11 691 Poland Bentonite 2 000 910 780 1 050 650 Romania Bentonite 21 637 19 864 19 241 24 127 18 583 Slovakia Bentonite 153 000 213 000 177 000 184 000 205 000 Slovenia Bentonite 135 168 98 143 199 Spain Bentonite 157 001 110 371 96 605 102 726 * 100 000 Attapulgite 27 841 26 021 23 537 26 764 * 26 800 Sepiolite 557 862 566 270 622 372 599 352 555 581 Turkey Bentonite 718 260 471 528 1 033 568 622 872 * 620 000 Sepiolite * 10 000 * 10 000 * 10 000 * 10 000 * 10 000 EU36 total Bentonite 2 883 000 3 019 000 3 546 000 3 006 000 2 910 000 Attapulgite and sepiolite 596 000 602 000 656 000 636 000 592 000
Notes (1) Bentonites consist of montmorillonite (one of the smectite group of clay minerals) and occur in two main varieties, calcium bentonite,
the most commonly occurring, and sodium bentonite, industrially the more important (2) Calcium bentonite can be converted to sodium bentonite by a sodium-exchange process (3) In some countries, such as the United Kingdom, calcium bentonite is known as fuller's earth, a term which is also used to refer
attapulgite, a mineralogically distinct clay mineral but exhibiting similar properties (4) In addition to the countries listed, Austria is believed to produce bentonite and France may produce fuller's earth
0
1 000
2 000
3 000
4 000
2010 2011 2012 2013 2014
Thou
sand
tonn
es
EU36 Production of bentonite, attapulgite and sepiolite 2010 - 14
Bentonite Attapulgite and sepiolite

176
Bentonite and Fuller's Earth
Exports of bentonite tonnes
Country 2010 2011 2012 2013 2014 Austria 3 447 4 954 4 513 4 947 4 149 Belgium 28 632 28 512 31 222 29 489 43 915 Bulgaria 72 183 67 118 63 090 45 919 35 954 Cyprus 98 803 114 923 130 413 122 699 116 581 Czech Republic 120 859 143 788 151 474 162 165 167 979 Denmark 13 787 13 827 17 711 20 620 36 421 Finland 0 61 27 123 540 France 12 709 11 472 8 826 7 658 9 365 Germany 84 920 91 477 82 504 72 020 73 547 Greece 13 203 33 306 14 233 7 770 13 904 Hungary 954 782 1 047 813 577 Italy 257 173 214 775 225 729 224 684 235 922 Lithuania 442 1 628 1 386 1 530 1 947 Macedonia 3 310 3 730 3 635 3 237 2 544 Netherlands 178 093 186 574 141 709 137 010 121 350 Norway 3 726 318 1 318 494 623 Poland 21 987 25 050 23 563 38 087 31 419 Portugal 1 175 1 356 1 935 1 672 2 175 Serbia 4 823 11 903 2 972 3 367 65 Slovakia 32 981 85 760 98 257 144 198 159 650 Spain Bentonite 66 096 54 547 54 376 56 416 50 219 Sepiolite 443 594 502 083 531 475 ... ... Sweden 3 457 3 300 5 492 9 949 10 085 Turkey 307 891 319 189 337 860 394 169 379 107 United Kingdom 41 323 38 478 39 535 37 694 31 347
Notes (1) See notes 1-3 to production table (2) The figures in this table refer to natural and sodium-exchanged bentonite, Harmonised System 2508.10 (3) Activated bentonite and fuller's earth, Harmonised System 3802.90, are excluded (4) Some countries are believed to include sodium-exchanged bentonite, often referred to as activated bentonite, under Harmonised
System 3802.90, e.g. Italy (5) From 2007 Harmonised System 2508.20, used previously in this table for fuller's earth, is no longer available
Imports of bentonite tonnes Country 2010 2011 2012 2013 2014 Albania 1 059 1 549 373 377 262 Austria 90 229 83 313 91 208 93 506 103 577 Belgium 72 971 91 291 68 771 71 394 77 905 Bulgaria 2 548 2 591 2 074 2 659 2 843 Croatia 7 852 16 906 5 394 6 391 4 746 Cyprus 4 629 142 280 6 246 4 193 Czech Republic 18 472 48 326 51 865 54 095 70 095 Denmark 43 049 34 130 41 931 38 382 42 097 Estonia 3 352 2 937 2 670 2 958 3 294 Finland 16 293 21 194 24 913 26 294 26 397 France 159 096 194 555 180 301 132 657 131 827 Germany 386 261 447 793 450 850 489 843 472 491 Greece 3 668 7 193 5 831 4 125 4 436 Hungary 4 360 4 648 6 527 10 490 9 969 Iceland 432 563 281 304 46 Ireland, Republic of 2 734 2 623 2 788 3 975 4 657 Italy 130 508 140 458 133 041 158 054 140 837 Latvia 2 787 3 434 2 701 3 501 4 430 Lithuania 4 378 6 250 6 656 7 366 9 361 Luxembourg 168 202 168 227 536 Macedonia 219 302 725 400 380 Malta 921 844 446 440 457 Netherlands 237 683 289 615 277 221 216 441 264 000 Norway 14 506 12 668 11 620 16 045 24 565 Poland 155 173 212 585 233 200 212 103 201 653

177
Bentonite and Fuller's Earth
Imports continued tonnes Country 2010 2011 2012 2013 2014 Portugal 18 205 23 436 26 466 21 319 29 840 Romania 4 825 6 341 8 463 8 787 7 789 Serbia 1 683 1 804 5 294 3 906 3 296 Slovakia 6 416 26 935 25 923 6 917 6 956 Slovenia 4 191 4 790 5 905 8 555 6 101 Spain 114 371 163 119 114 421 103 691 114 219 Sweden 200 422 214 173 231 973 189 875 237 429 Switzerland 20 362 19 316 19 203 19 982 19 037 Turkey 1 641 1 915 1 952 2 037 1 955 United Kingdom 141 849 200 332 183 343 173 094 151 570
Notes (1) See notes 1-3 to production table (2) The figures in this table refer to natural and sodium-exchanged bentonite, and fuller's earth, Harmonised System 2508.10 and 2508.20 (3) Activated bentonite and fuller's earth, Harmonised System 3802.90, are excluded (4) Some countries are believed to include sodium-exchanged bentonite, often referred to as activated bentonite, under Harmonised
System 3802.90, e.g. Italy, but these are not included in the table (5) From 2007 Harmonised System 2508.20, used in this table for fuller's earth, is no longer available
Bentonite and Fuller's earth - EU36 trade in 2014
-400 -300 -200 -100 0 100 200 300 400 500
GermanyNetherlands
SwedenPoland
United KingdomItaly
FranceSpain
AustriaBelgium
Czech RepublicDenmarkPortugalFinlandNorway
SwitzerlandHungary
LithuaniaRomaniaSlovakiaSlovenia
CroatiaIreland, Republic of
GreeceLatvia
CyprusSerbia
EstoniaBulgaria
TurkeyMacedonia
Thousand tonnes
Imports Exports

178
Bismuth
Bismuth
• Bismuth is a metallic element, chiefly used in its compound form, in pharmaceuticals and as metal in fusible (low-melting) alloys. It is also highly valued as a substitute for lead.
• China was the world’s largest producer in 2014, with an estimated 41 per cent of the total world output. The second largest was Mexico (28 per cent), followed by Japan (17 per cent) and Vietnam (estimated at 12 per cent). Bismuth is also produced as a by-product of lead and zinc refining.
Mine production of bismuth tonnes (metal content) Country 2010 2011 2012 2013 2014
Bulgaria * 3 * 3 * 3 * 3 * 3
Notes (1) The figures in this table are in some instances derived from reported bismuth content of refined and impure metal plus recoverable in
ores and concentrates exported (2) Production for some countries may include bismuth produced from imported ores but it is thought that any resulting duplication is insignificant in the countries shown
Exports of bismuth metal tonnes Country 2010 2011 2012 2013 2014 Czech Republic 19 3 4 8 4 France 20 49 115 259 168 Germany 178 210 195 86 386 Italy 1 13 11 2 2 Netherlands 34 32 52 107 194 Norway 25 — — — — Spain 9 9 4 6 15 Sweden 11 1 — — — United Kingdom 427 1 038 744 407 348
Imports of bismuth metal tonnes Country 2010 2011 2012 2013 2014 Austria 130 138 139 175 166 Belgium 1 24 16 30 41 Czech Republic 106 264 110 101 110 France 100 205 281 311 677 Germany 1 052 1 282 1 155 1 406 1 726 Greece 0 12 21 60 1 Hungary 106 50 43 35 46 Italy 355 378 154 146 128 Netherlands 259 192 427 694 981 Poland 34 23 24 33 31 Slovenia 49 63 57 75 66 Spain 141 99 103 107 49 Sweden 12 2 4 2 24 Switzerland 25 18 12 16 15 Turkey 11 16 7 15 10 United Kingdom 366 411 481 441 321

179
Bromine
Bromine
• Bromine is the only non-metallic element that is liquid at room temperature. It is strongly reactive and hazardous in pure forms and has a wide range of uses including medicines, fumigants, dyes, and pesticides.
• Bromine is almost entirely produced from processing sea-water. The USA was estimated to be the world’s largest producer in 2014, with 35 per cent of the total world output. The second largest was Israel (27 per cent), followed by China (17 per cent), Jordan (with an estimated 15 per cent) and Japan (five per cent).
Production of bromine kilograms Country 2010 2011 2012 2013 2014
Germany 1 500 000 1 600 000 1 600 000 1 500 000 1 500 000
Exports of bromine kilograms Country 2010 2011 2012 2013 2014 Belgium 12 619 000 25 002 100 25 239 600 27 339 200 21 651 100 Bulgaria ... 0 0 25 200 100 Finland ... 22 200 — — — Germany 6 119 7 543 8 559 28 941 5 044 Netherlands 1 477 700 1 154 400 84 300 95 800 1 340 200 Poland 9 800 7 100 3 600 5 400 5 100 Spain 15 627 86 311 10 480 72 396 5 303 United Kingdom 780 704 1 472 523 1 377 726 645 676 751 037
Notes (1) This table does not purport to be comprehensive: trade in bromine is not separately distinguished from other halogens by many
countries
Imports of bromine kilograms Country 2010 2011 2012 2013 2014 Austria 318 400 238 900 384 600 647 900 224 800 Belgium 18 693 500 28 221 500 28 260 600 27 220 500 29 495 400 Bulgaria ... 4 321 52 19 500 500 Croatia (a) 67 120 168 22 911 45 Finland 318 478 322 231 441 332 371 829 345 578 France 5 275 994 8 449 327 8 999 985 10 135 985 9 845 622 Germany 657 303 722 036 783 214 669 944 769 231 Hungary 4 500 8 800 5 600 9 300 10 200 Ireland, Republic of 743 38 566 675 501 1 568 Italy 1 259 187 1 207 042 939 005 939 294 416 440 Netherlands 123 400 61 900 262 000 32 000 387 100 Poland 17 200 11 200 66 300 35 300 4 100 Spain 222 746 250 417 188 015 181 058 215 251 United Kingdom 5 787 829 9 485 963 7 817 484 6 833 649 5 932 000
Notes (1) This table does not purport to be comprehensive: trade in bromine is not separately distinguished from other halogens by many
countries (a) May include some fluorine

180
Cadmium
Cadmium
• Cadmium is a highly toxic metallic element mostly produced as a by-product of zinc refining. The bulk of cadmium in use is in nickel-cadmium (NiCd) rechargeable batteries. Other major uses are in pigments and in metal coatings.
• China was the world’s largest producer in 2014, with an estimated 30 per cent of the total world output. The second largest was South Korea (23 per cent), followed by Japan and Kazakhstan (seven per cent each), and Mexico (six per cent).
Rest of World 90.7%
Bulgaria 15.5%
Germany 17.2%
Netherlands 26.6%
Norway 13.3% Others 0.5%
Poland 27.0%
EU36 9.3%
EU36 Production of cadmium 2014
Production of cadmium tonnes Country 2010 2011 2012 2013 2014 Bulgaria 389 427 363 * 360 * 360 Germany * 400 * 400 * 400 * 400 * 400 Netherlands * 560 * 570 * 560 * 610 * 620 Norway 300 309 * 310 * 310 * 310 Poland 451 526 370 460 628 Turkey — — — 12 * 12 EU36 total 2 100 2 200 2 000 2 200 2 300
Notes (1) Data in this table excludes secondary metal unless otherwise stated
0
500
1 000
1 500
2 000
2 500
2010 2011 2012 2013 2014
Tonn
es
EU36 Production of cadmium 2010 - 14

181
Cadmium
Exports of cadmium tonnes Country 2010 2011 2012 2013 2014 Belgium Metal 459 545 690 178 229 Oxide 4 413 3 734 3 764 2 767 2 189 Bulgaria Metal 474 421 394 382 385 Estonia Metal ... ... 564 378 386 France Metal 763 549 733 584 285 Germany Metal 523 348 379 450 584 Italy Metal 3 104 1 722 363 3 3 Netherlands Metal 606 617 839 896 1 020 Norway Metal 329 317 221 267 227 Poland Metal 484 579 388 437 730 Sweden Oxide 360 429 335 330 338 United Kingdom Metal 2 545 1 441 272 99 44
Imports of cadmium tonnes Country 2010 2011 2012 2013 2014 Belgium Metal 6 456 5 932 3 683 3 944 2 058 Oxide 43 109 7 32 111 Czech Republic Oxide 464 487 439 415 380 France Metal 212 100 285 70 104 Germany Metal 18 40 69 19 9 Oxide 625 489 653 621 507 Italy Metal 3 44 37 24 13 Netherlands Metal 102 1 15 36 35 Spain Metal 153 38 37 39 59 Sweden Metal 825 1 127 1 172 1 108 1 529 Oxide 107 172 145 105 13 United Kingdom Metal 470 542 229 304 346 Oxide 309 281 169 182 241

182
Cadmium Cadmium metal - EU36 trade in 2014
-1,500 -1,000 -500 0 500 1,000 1,500 2,000 2,500
Belgium
Sweden
United Kingdom
France
Spain
Netherlands
Italy
Germany
Poland
Norway
Estonia
Bulgaria
Tonnes
Imports Exports
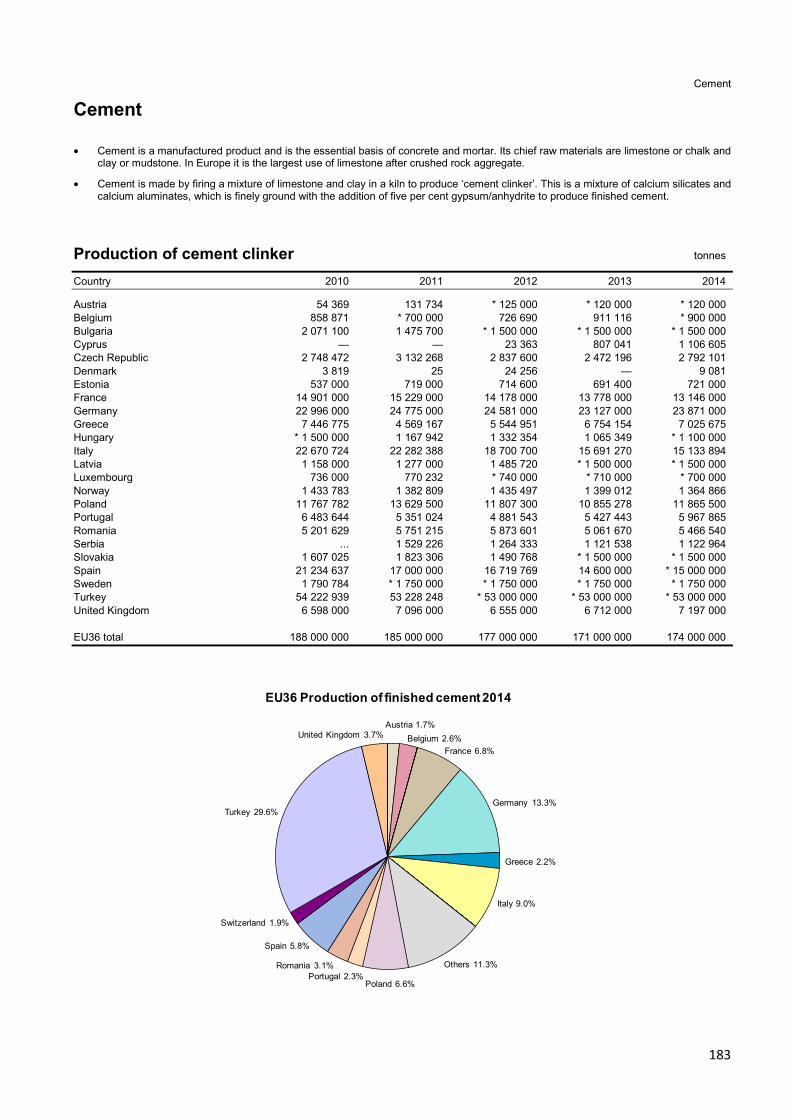
183
Cement
Cement
• Cement is a manufactured product and is the essential basis of concrete and mortar. Its chief raw materials are limestone or chalk and clay or mudstone. In Europe it is the largest use of limestone after crushed rock aggregate.
• Cement is made by firing a mixture of limestone and clay in a kiln to produce ‘cement clinker’. This is a mixture of calcium silicates and calcium aluminates, which is finely ground with the addition of five per cent gypsum/anhydrite to produce finished cement.
Production of cement clinker tonnes Country 2010 2011 2012 2013 2014 Austria 54 369 131 734 * 125 000 * 120 000 * 120 000 Belgium 858 871 * 700 000 726 690 911 116 * 900 000 Bulgaria 2 071 100 1 475 700 * 1 500 000 * 1 500 000 * 1 500 000 Cyprus — — 23 363 807 041 1 106 605 Czech Republic 2 748 472 3 132 268 2 837 600 2 472 196 2 792 101 Denmark 3 819 25 24 256 — 9 081 Estonia 537 000 719 000 714 600 691 400 721 000 France 14 901 000 15 229 000 14 178 000 13 778 000 13 146 000 Germany 22 996 000 24 775 000 24 581 000 23 127 000 23 871 000 Greece 7 446 775 4 569 167 5 544 951 6 754 154 7 025 675 Hungary * 1 500 000 1 167 942 1 332 354 1 065 349 * 1 100 000 Italy 22 670 724 22 282 388 18 700 700 15 691 270 15 133 894 Latvia 1 158 000 1 277 000 1 485 720 * 1 500 000 * 1 500 000 Luxembourg 736 000 770 232 * 740 000 * 710 000 * 700 000 Norway 1 433 783 1 382 809 1 435 497 1 399 012 1 364 866 Poland 11 767 782 13 629 500 11 807 300 10 855 278 11 865 500 Portugal 6 483 644 5 351 024 4 881 543 5 427 443 5 967 865 Romania 5 201 629 5 751 215 5 873 601 5 061 670 5 466 540 Serbia ... 1 529 226 1 264 333 1 121 538 1 122 964 Slovakia 1 607 025 1 823 306 1 490 768 * 1 500 000 * 1 500 000 Spain 21 234 637 17 000 000 16 719 769 14 600 000 * 15 000 000 Sweden 1 790 784 * 1 750 000 * 1 750 000 * 1 750 000 * 1 750 000 Turkey 54 222 939 53 228 248 * 53 000 000 * 53 000 000 * 53 000 000 United Kingdom 6 598 000 7 096 000 6 555 000 6 712 000 7 197 000 EU36 total 188 000 000 185 000 000 177 000 000 171 000 000 174 000 000
Austria 1.7%Belgium 2.6%
France 6.8%
Germany 13.3%
Greece 2.2%
Italy 9.0%
Others 11.3%
Poland 6.6%Portugal 2.3%
Romania 3.1%
Spain 5.8%
Switzerland 1.9%
Turkey 29.6%
United Kingdom 3.7%
EU36 Production of finished cement 2014

184
Cement
Production of finished cement tonnes Country 2010 2011 2012 2013 2014 Austria 4 499 402 4 291 449 4 162 406 3 967 440 4 048 146 Belgium 5 990 000 6 844 000 6 280 000 6 119 000 6 364 000 Bulgaria 1 981 971 1 889 502 1 754 204 1 796 021 1 762 366 Cyprus 1 328 763 1 206 786 1 025 666 854 778 734 692 Czech Republic 3 345 000 3 831 000 3 434 000 3 211 000 3 731 000 Denmark 1 566 624 1 852 804 1 817 334 1 852 445 1 876 095 Estonia 375 000 451 000 481 500 456 700 447 000 Finland (a) 1 215 244 1 387 479 1 292 855 1 271 378 1 255 468 France 17 998 000 19 443 000 18 018 000 17 469 000 16 426 000 Germany 29 915 000 33 540 000 32 432 000 31 308 000 32 099 000 Greece 8 778 949 5 822 967 5 422 499 5 553 411 (a) 5 297 743 Hungary * 2 560 000 * 2 200 000 * 2 300 000 * 2 300 000 * 2 200 000 Ireland, Republic of * 2 290 000 * 1 700 000 1 573 000 1 450 000 1 500 000 Italy 37 061 576 34 114 018 27 831 741 23 114 037 21 672 232 Latvia * 1 100 000 * 1 100 000 * 1 100 000 * 1 100 000 * 1 200 000 Lithuania 834 000 996 284 1 014 977 1 069 593 * 902 733 Luxembourg 1 030 700 1 232 633 1 177 000 1 127 000 1 057 000 Netherlands 2 138 000 2 318 000 2 056 000 2 120 000 1 984 000 Norway 1 467 363 1 579 505 1 661 157 1 694 150 1 693 379 Poland 15 756 000 18 929 000 15 918 614 14 831 323 15 814 500 Portugal (a) 6 665 585 6 072 751 5 392 995 5 342 661 5 480 202 Romania (a) 6 867 596 7 646 612 7 727 046 7 120 934 7 554 605 Slovakia 2 887 749 3 219 557 2 915 166 3 121 000 3 319 320 Slovenia * 1 000 000 * 1 000 000 745 000 614 000 706 000 Spain 26 161 660 22 178 237 15 938 965 * 13 700 000 * 14 000 000 Sweden 2 298 000 2 546 000 2 611 000 2 654 000 2 885 000 Switzerland (b) 4 553 077 4 687 138 4 395 084 4 563 931 4 583 355 Turkey 70 800 657 66 656 800 67 019 400 72 687 000 71 239 000 United Kingdom (c) 7 883 000 8 529 000 7 952 000 8 203 000 8 958 000 EU36 total 270 300 000 267 300 000 245 400 000 240 700 000 240 800 000 Notes (a) Sales (b) Includes production in Liechtenstein (c) Great Britain only.
0
50
100
150
200
250
300
2010 2011 2012 2013 2014
Mill
ion
tonn
es
EU36 Production of finished cement 2010 - 14

185
Cement
Exports of cement tonnes
Country 2010 2011 2012 2013 2014 Albania Cement clinkers 87 590 (a)* 22 370 23 341 18 066 (a)* 310 Portland cement 511 681 674 037 1 026 560 997 924 22 552 Other cement 25 (a)* 350 (a)* 350 (a)* 210 (a)* 210 Austria Cement clinkers 46 560 173 312 121 529 72 246 67 398 Portland cement 213 082 330 710 299 060 277 032 347 257 Other cement 50 592 25 432 21 521 41 174 41 496 Belgium Cement clinkers 582 766 744 707 638 496 775 332 729 017 Portland cement 1 676 150 1 729 402 1 631 167 1 719 988 1 870 308 Other cement 410 909 353 126 253 759 239 879 182 001 Bulgaria Cement clinkers 5 246 8 131 296 372 237 020 270 307 Portland cement 164 404 190 570 269 199 269 977 112 636 Other cement 1 772 6 516 21 341 4 713 3 833 Croatia Cement clinkers 176 403 103 281 284 480 324 551 398 469 Portland cement 639 236 1 189 738 897 747 1 250 523 1 260 578 Other cement 601 470 180 836 102 405 146 025 201 659 Cyprus Cement clinkers — — 6 535 739 613 963 022 Portland cement 12 866 42 438 248 521 343 434 233 978 Czech Republic Cement clinkers 88 236 169 10 362 1 222 96 Portland cement 402 537 844 920 665 669 598 254 601 696 Other cement 218 689 232 124 124 487 Denmark Cement clinkers 11 884 2 689 24 658 598 10 929 Portland cement 731 730 813 938 767 554 754 399 781 786 Other cement 3 860 4 175 4 565 4 574 5 580 Estonia Cement clinkers 222 190 426 994 347 754 346 684 363 908 Portland cement 148 505 186 255 208 131 202 614 193 939 Other cement 488 752 1 107 3 28 Finland Portland cement 373 92 6 1 172 191 France Cement clinkers 282 673 179 184 210 901 218 646 194 116 Portland cement 766 167 764 305 765 777 896 682 789 824 Germany Cement clinkers 680 552 761 406 475 987 443 142 420 122 Portland cement 4 173 112 5 002 240 4 672 927 4 217 917 3 843 447 Other cement 2 010 734 2 159 075 1 794 724 1 664 700 1 911 501 Greece Cement clinkers 722 142 459 716 1 877 641 1 828 644 3 225 696 Portland cement 3 122 615 1 548 482 2 398 675 3 733 819 2 519 835 Other cement 47 435 155 000 604 9 525 18 483 Hungary Cement clinkers 296 25 203 686 8 551 8 515 Portland cement 185 279 277 497 269 382 231 601 215 190 Other cement 795 6 451 1 363 11 762 2 201 Iceland Portland cement 4 146 1 35 — Ireland, Republic of Cement clinkers 1 — 16 698 0 — Portland cement 1 025 910 942 940 1 238 718 1 234 596 1 524 566 Other cement 8 787 1 158 971 1 074 595 Italy Cement clinkers 52 673 45 472 47 155 129 335 206 598 Portland cement 2 035 118 1 681 397 1 838 228 2 440 982 2 393 724 Other cement 393 746 250 624 200 038 162 360 192 682 Latvia Cement clinkers 68 802 201 050 163 102 26 930 2 019 Portland cement 562 435 673 260 759 738 734 184 890 382 Other cement 76 250 176 237 107

186
Cement
Exports continued tonnes
Country 2010 2011 2012 2013 2014 Lithuania Portland cement 352 750 450 601 529 457 604 824 362 762 Other cement 1 151 406 36 280 1 411 Luxembourg Cement clinkers 7 695 4 215 1 2 — Portland cement 341 075 424 306 321 903 407 310 399 064 Other cement 219 688 320 980 338 240 216 961 195 342 Macedonia Cement clinkers ... 0 154 117 20 118 ... Portland cement 315 074 277 326 136 803 164 396 127 436 Other cement 1 027 ... ... ... 6 347 Montenegro Portland cement ... 2 372 1 583 3 250 246 Netherlands Cement clinkers 34 3 911 33 160 2 022 398 Portland cement 201 065 310 479 274 856 291 279 308 896 Other cement 57 922 150 175 203 678 419 501 402 813 Norway Cement clinkers (a) * 150 000 * 251 000 * 104 000 * 40 000 * 2 500 Portland cement (a) * 144 000 * 94 000 * 138 000 * 148 000 * 179 000 Poland Cement clinkers 89 692 46 295 99 977 147 787 241 114 Portland cement 415 187 358 847 303 667 419 673 524 213 Other cement 22 984 17 523 28 200 20 620 19 150 Portugal Cement clinkers 1 888 362 916 431 994 099 1 410 579 1 860 476 Portland cement 996 778 1 345 607 2 000 541 2 668 095 3 132 133 Other cement 10 440 8 111 40 461 57 065 38 377 Romania Cement clinkers 265 24 810 84 874 7 092 2 652 Portland cement 20 039 278 795 333 946 156 625 184 798 Other cement 214 16 310 16 668 10 984 13 691 Serbia Portland cement 156 477 115 432 138 914 81 091 87 741 Slovakia Cement clinkers 69 366 44 607 — 0 23 569 Portland cement 1 396 241 1 795 235 1 407 502 1 876 911 1 937 757 Other cement 21 660 10 28 77 28 Slovenia Cement clinkers 42 475 140 361 175 807 256 109 351 686 Portland cement 168 056 200 615 172 090 153 772 201 189 Other cement 4 731 988 308 2 487 966 Spain Cement clinkers 1 541 790 1 590 245 3 493 671 3 870 209 4 669 688 Portland cement 2 768 457 2 594 711 3 021 493 3 333 949 4 361 048 Other cement 87 864 174 167 117 257 194 554 119 739 Sweden Cement clinkers 505 585 267 884 391 898 357 876 132 346 Portland cement 467 559 590 443 782 362 752 187 1 166 546 Other cement 5 819 7 120 8 546 7 774 7 694 Switzerland Cement clinkers 6 983 104 35 350 45 Portland cement 103 952 63 262 72 143 142 900 151 319 Other cement 2 959 51 67 467 227 Turkey Cement clinkers 2 792 332 2 472 979 2 980 566 2 176 337 2 927 812 Portland cement 15 842 398 11 750 755 10 716 605 10 290 995 8 026 728 Other cement 415 763 315 159 104 504 165 249 137 515 United Kingdom Cement clinkers 5 500 15 531 31 458 24 056 21 059 Portland cement 134 223 121 537 239 058 85 405 68 225 Other cement 56 781 62 333 75 502 76 851 71 169
Notes (a) BGS estimates, based on known imports into certain countries

187
Cement
Imports of cement tonnes Country 2010 2011 2012 2013 2014 Albania Cement clinkers 40 ... 5 260 79 661 (a) 150 900 Portland cement 593 883 384 655 284 837 122 507 (a) 81 800 Other cement 300 788 211 346 162 203 107 529 58 603 Austria Cement clinkers 407 616 393 132 297 009 262 939 261 617 Portland cement 637 550 913 116 797 976 749 455 639 189 Other cement 71 535 60 349 54 115 133 721 293 335 Belgium Cement clinkers 740 528 717 664 649 014 779 293 929 178 Portland cement 1 030 282 1 113 638 1 310 336 978 809 773 120 Other cement 172 609 158 441 163 298 138 660 141 542 Bulgaria Cement clinkers 16 167 17 478 14 586 4 929 20 157 Portland cement 448 220 431 780 436 036 368 272 333 479 Other cement 2 510 6 147 8 567 6 496 2 085 Croatia Cement clinkers 967 144 44 9 2 415 Portland cement 344 352 326 526 315 804 261 584 311 539 Other cement 7 619 4 200 1 001 1 197 6 537 Cyprus Cement clinkers 29 579 69 780 6 498 10 100 3 307 Portland cement 2 512 545 416 466 91 Other cement 242 138 78 113 2 365 Czech Republic Cement clinkers 121 682 44 577 86 089 141 404 203 640 Portland cement 702 257 765 382 638 364 593 385 503 497 Other cement 48 336 31 074 26 875 9 941 8 143 Denmark Cement clinkers 23 732 29 888 24 464 25 822 27 510 Portland cement 180 249 244 007 211 379 209 012 208 431 Other cement 38 797 19 941 19 569 15 876 19 652 Estonia Cement clinkers 13 474 (a)* 1 800 4 688 4 526 5 132 Portland cement 36 354 52 807 27 404 34 852 42 847 Other cement 827 1 545 13 043 31 565 42 817 Finland Cement clinkers 14 191 16 790 7 512 2 912 1 368 Portland cement 587 410 549 673 498 577 401 067 422 293 Other cement 10 202 16 408 13 870 20 606 20 825 France Cement clinkers 838 538 849 577 693 269 1 118 820 958 385 Portland cement 2 422 582 3 113 977 3 057 832 2 776 280 2 798 666 Other cement 559 436 246 702 239 915 289 020 333 467 Germany Cement clinkers 18 037 52 111 82 345 43 676 44 715 Portland cement 939 310 1 054 856 1 023 170 1 043 382 1 016 930 Other cement 255 027 217 931 218 486 273 164 275 562 Greece Cement clinkers 12 100 34 712 65 317 87 439 122 637 Portland cement 206 164 159 514 49 204 24 791 41 196 Other cement 15 136 22 371 22 214 13 618 13 338 Hungary Cement clinkers 69 469 67 770 43 196 68 506 128 882 Portland cement 495 045 785 166 710 516 978 968 1 019 495 Other cement 34 191 33 802 6 809 27 678 27 360 Iceland Portland cement 24 481 26 714 64 565 82 861 95 935 Other cement 4 405 226 229 255 242 Ireland, Republic of Cement clinkers 15 459 23 190 24 718 25 005 18 666 Portland cement 133 977 100 440 86 608 87 458 103 491 Other cement 4 974 4 112 4 375 5 793 4 229

188
Cement
Imports continued tonnes Country 2010 2011 2012 2013 2014 Italy Cement clinkers 797 703 844 108 729 063 450 465 436 549 Portland cement 1 298 080 1 119 225 998 392 804 854 664 331 Other cement 139 459 125 066 106 926 108 775 93 431 Latvia Cement clinkers 158 (a) 20 701 68 106 Portland cement 94 873 89 751 108 596 137 815 168 013 Other cement 643 281 306 229 267 Lithuania Cement clinkers 176 461 227 793 173 488 24 015 22 Portland cement 122 178 144 824 147 329 199 114 281 613 Other cement 390 502 479 671 1 555 Luxembourg Cement clinkers 27 238 34 532 34 703 8 589 10 615 Portland cement 34 642 42 548 37 740 67 220 103 013 Other cement 12 119 14 934 15 382 11 592 13 447 Macedonia Cement clinkers 1 191 8 932 (a)* 20 ... (a) — Portland cement 185 378 148 954 193 978 178 196 207 763 Other cement 1 213 409 501 545 692 Malta Portland cement 285 182 258 304 260 664 223 401 258 469 Other cement 13 002 6 676 2 906 2 122 2 994 Montenegro Portland cement 266 063 250 759 248 013 267 715 288 075 Other cement 116 132 90 911 92 927 96 956 81 088 Netherlands Cement clinkers 636 694 424 274 558 153 634 548 352 521 Portland cement 1 123 936 1 580 140 1 278 033 1 259 993 1 610 207 Other cement 1 136 163 1 475 035 1 488 241 1 271 302 1 115 885 Norway Cement clinkers 7 070 170 312 376 101 Portland cement 353 102 409 018 435 344 464 686 491 789 Other cement 21 621 25 809 28 533 31 974 28 655 Poland Cement clinkers 100 352 19 900 7 873 11 334 26 189 Portland cement 565 893 932 507 695 629 659 111 763 618 Other cement 26 247 25 467 21 027 108 490 75 243 Portugal Cement clinkers 34 216 5 037 3 930 1 044 224 Portland cement 238 605 238 605 220 968 308 064 374 506 Other cement 8 557 8 067 7 795 6 749 2 579 Romania Cement clinkers 75 812 144 547 144 116 216 322 207 700 Portland cement 307 977 239 373 240 469 208 701 196 179 Other cement 22 004 21 297 18 626 14 882 19 494 Serbia Cement clinkers 1 321 5 309 51 360 27 469 36 541 Portland cement 52 582 92 665 194 728 198 866 238 754 Other cement 728 784 664 1 979 1 536 Slovakia Cement clinkers 6 380 9 706 5 840 29 373 33 807 Portland cement 256 358 281 910 266 308 300 277 376 153 Other cement 34 733 102 134 71 001 60 034 13 249 Slovenia Cement clinkers 129 95 704 168 235 2 549 42 Portland cement 328 563 334 053 210 734 206 144 204 199 Other cement 17 328 8 237 4 077 2 626 3 179 Spain Cement clinkers 1 334 019 490 339 80 228 106 170 103 630 Portland cement 637 040 450 416 363 065 274 456 320 675 Other cement 14 479 15 884 17 347 24 997 23 245 Sweden Cement clinkers 36 629 58 132 5 230 8 044 76 665 Portland cement 348 431 419 332 391 030 403 823 455 351 Other cement 36 399 42 002 43 520 67 981 84 244

189
Cement
Imports continued tonnes Country 2010 2011 2012 2013 2014 Switzerland Cement clinkers 74 946 46 117 2 580 62 514 82 786 Portland cement 465 699 538 979 526 305 588 965 642 843 Other cement 49 549 73 361 92 633 121 136 144 179 Turkey Cement clinkers 58 176 10 511 58 098 99 947 123 558 Portland cement 5 875 3 406 21 972 23 322 3 841 Other cement 6 168 10 847 7 142 6 982 8 117 United Kingdom Cement clinkers 201 308 208 595 206 086 290 071 981 457 Portland cement 1 759 841 1 746 862 1 429 848 1 776 713 2 314 549 Other cement 92 031 100 453 31 045 32 498 39 732
Notes (a) BGS estimates, based on known exports from certain countries
Cement - EU36 trade in 2014
-10 -8 -6 -4 -2 0 2 4
FranceNetherlands
United KingdomGermanyHungary
AustriaBelgiumPoland
SwitzerlandItaly
SwedenNorway
Czech RepublicFinland
SlovakiaPortugal
MontenegroSpain
BulgariaCroatia
LithuaniaMalta
SerbiaDenmarkRomania
MacedoniaSlovenia
LatviaAlbania
LuxembourgIreland, Republic of
IcelandEstoniaGreeceTurkeyCyprus
Million tonnes
Imports Exports

190
Chromium
Chromium ores and concentrates
• Chromium is a hard metallic element that is an essential component of stainless steel and other alloy steels, where it is used in the form of the alloy ferro-chromium. It is also used extensively in superalloys and metal plating. Its compounds are important pigments and the natural mineral chromite is used in refractories.
• South Africa was the world’s largest producer in 2014, with 47 per cent of the total world output. The second largest was Kazakhstan (18 per cent), followed by Turkey (with an estimated 14 per cent), India (six per cent), and Finland (three per cent).
Rest of World 80.6%
Albania 11.7%Finland 17.8%
Turkey 70.5%
EU36 19.4%
EU36 Production of chromium ores and concentrates 2014
Production of chromium ores and concentrates tonnes Country 2010 2011 2012 2013 2014 Albania 334 467 330 938 365 749 529 592 678 803 Finland (a) 598 000 692 527 425 217 981 752 1 034 750 Turkey 2 461 314 2 281 981 3 295 398 4 140 655 * 4 100 000 EU36 total 3 394 000 3 305 000 4 086 000 5 652 000 5 814 000 Notes (1) In addition to the countries listed, Bulgaria is believed to produce chromite (a) Concentrates
0
1 000
2 000
3 000
4 000
5 000
6 000
7 000
2010 2011 2012 2013 2014
Thou
sand
tonn
es
EU36 Production of chromium ores and concentrates 2010 - 14

191
Chromium
Exports of chromium tonnes Country 2010 2011 2012 2013 2014 Albania Ores and concentrates 428 385 346 792 427 092 756 361 479 445 Austria Ores and concentrates 4 1 163 413 9 88 Metal 10 245 2 138 565 707 230 Belgium Ores and concentrates 18 415 13 945 34 801 44 009 59 056 Metal 1 311 1 010 676 915 558 Bulgaria Metal 2 603 304 91 142 Czech Republic Ores and concentrates 764 1 140 1 061 838 548 Metal 21 103 31 149 163 Denmark Metal 1 056 601 548 427 505 Finland Ores and concentrates 8 291 5 231 4 575 3 424 148 Metal 1 813 2 366 1 950 2 542 174 France Ores and concentrates 2 422 2 168 1 858 3 390 2 729 Metal 7 612 8 034 9 720 9 509 9 857 Germany Ores and concentrates 32 070 53 989 60 354 59 965 54 329 Metal 4 606 2 995 6 308 3 496 3 928 Italy Ores and concentrates 1 617 3 764 1 831 1 828 2 259 Netherlands Ores and concentrates 74 483 126 012 156 975 175 682 138 528 Metal 3 569 2 197 3 112 5 870 6 384 Norway Metal 97 78 202 61 35 Poland Ores and concentrates 425 3 604 536 373 923 Metal 7 948 7 135 2 977 4 423 5 980 Slovakia Metal 777 83 2 2 — Slovenia Metal 123 174 1 1 3 Spain Ores and concentrates 600 1 252 4 225 2 250 968 Metal 665 237 555 470 518 Sweden Metal 191 167 123 122 140 Switzerland Metal 82 92 111 322 275 Turkey Ores and concentrates 2 256 387 2 161 001 2 129 693 2 218 264 1 503 900 Metal 184 1 930 2 344 63 168 United Kingdom Ores and concentrates 297 168 50 50 57 Metal 7 441 8 017 7 737 7 061 7 216
Notes (1) Metal traded in ferro-alloy form is included under iron, steel and ferro-alloys
Imports of chromium tonnes Country 2010 2011 2012 2013 2014 Albania Ores and concentrates 4 651 7 477 ... ... ... Austria Ores and concentrates 54 945 20 921 33 317 29 138 32 916 Metal 6 109 7 868 4 854 4 365 1 424

192
Chromium
Imports continued tonnes Country 2010 2011 2012 2013 2014 Belgium Ores and concentrates 25 350 22 896 39 090 52 755 57 166 Metal 1 593 3 023 977 834 1 062 Bulgaria Ores and concentrates 671 971 1 086 679 1 059 Croatia Metal 419 345 404 177 14 Czech Republic Ores and concentrates 7 986 7 986 8 413 6 897 6 974 Metal 514 139 147 218 307 Denmark Ores and concentrates 463 579 866 833 1 252 Finland Ores and concentrates 9 197 20 853 9 372 3 726 2 527 Metal 139 194 139 94 137 France Ores and concentrates 11 273 15 835 14 844 10 639 14 204 Metal 1 155 524 466 837 972 Germany Ores and concentrates 101 972 180 377 188 783 191 488 141 895 Metal 4 783 5 931 6 887 7 596 7 163 Hungary Metal 82 99 95 130 172 Ireland, Republic of Metal 83 179 40 77 82 Italy Ores and concentrates 22 012 31 861 30 547 28 069 24 772 Metal 881 1 738 1 598 1 960 1 409 Macedonia Ores and concentrates 294 512 324 268 885 Netherlands Ores and concentrates 88 788 135 776 180 648 150 921 974 Metal 6 642 5 773 4 789 5 260 6 704 Norway Ores and concentrates (a) * 400 * 500 * 300 * 200 * 200 Metal 90 437 453 543 92 Poland Ores and concentrates 15 672 30 863 27 723 30 554 26 625 Metal 2 692 4 530 76 416 256 Portugal Ores and concentrates 2 108 2 727 2 639 2 206 2 529 Romania Ores and concentrates 7 054 1 637 2 288 1 514 1 990 Metal 16 105 50 151 161 Serbia Ores and concentrates 641 725 211 140 234 Slovakia Ores and concentrates 4 546 5 542 3 562 5 459 5 204 Slovenia Ores and concentrates 1 912 966 466 677 476 Metal 104 97 101 98 108 Spain Ores and concentrates 5 579 9 262 10 487 6 644 9 276 Metal 1 878 2 350 1 479 1 438 1 854 Sweden Ores and concentrates (a) * 169 000 * 128 600 * 135 900 * 79 000 * 221 900 Metal 4 999 6 598 6 139 5 490 3 870 Switzerland Ores and concentrates 1 051 809 1 359 1 253 643 Metal 74 71 93 147 104 Turkey Ores and concentrates 113 487 122 070 162 266 152 549 129 697 Metal 65 108 91 183 131

193
-1,600 -1,400 -1,200 -1,000 -800 -600 -400 -200 0 200 400
SwedenGermany
TurkeyBelgiumAustriaPoland
ItalyFranceSpain
United KingdomCzech Republic
SlovakiaPortugalFinland
RomaniaNetherlands
Albania
Thousand tonnes
Imports Exports
-10 -8 -6 -4 -2 0 2 4 6 8
GermanyNetherlands
SwedenSpain
United KingdomAustria
ItalyBelgiumFrance
Czech RepublicPoland
HungaryRomania
FinlandTurkey
SloveniaSwitzerland
NorwayIreland, Republic of
CroatiaDenmarkBulgaria
Thousand tonnes
Imports Exports
Chromium
Imports continued tonnes Country 2010 2011 2012 2013 2014 United Kingdom Ores and concentrates 7 084 10 572 9 124 10 033 8 111 Metal 3 007 2 346 1 663 1 751 1 829
Notes (1) Metal traded in ferro-alloy form is included under iron, steel and ferro-alloys (a) BGS estimates, based on known exports from certain countries
Chromium ores and concentrates - EU36 trade in 2014
Chromium metal - EU36 trade in 2014
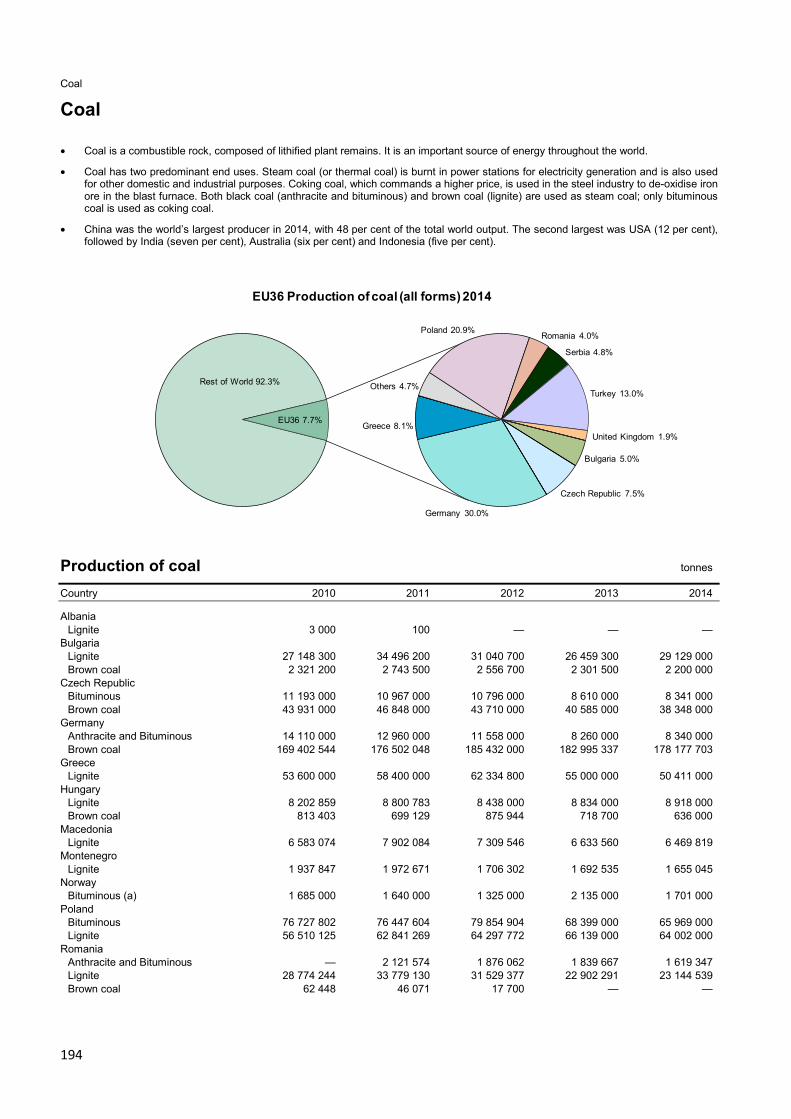
194
Coal
Coal
• Coal is a combustible rock, composed of lithified plant remains. It is an important source of energy throughout the world.
• Coal has two predominant end uses. Steam coal (or thermal coal) is burnt in power stations for electricity generation and is also used for other domestic and industrial purposes. Coking coal, which commands a higher price, is used in the steel industry to de-oxidise iron ore in the blast furnace. Both black coal (anthracite and bituminous) and brown coal (lignite) are used as steam coal; only bituminous coal is used as coking coal.
• China was the world’s largest producer in 2014, with 48 per cent of the total world output. The second largest was USA (12 per cent), followed by India (seven per cent), Australia (six per cent) and Indonesia (five per cent).
Rest of World 92.3%
Bulgaria 5.0%
Czech Republic 7.5%
Germany 30.0%
Greece 8.1%
Others 4.7%
Poland 20.9% Romania 4.0%
Serbia 4.8%
Turkey 13.0%
United Kingdom 1.9%
EU36 7.7%
EU36 Production of coal (all forms) 2014
Production of coal tonnes Country 2010 2011 2012 2013 2014 Albania Lignite 3 000 100 — — — Bulgaria Lignite 27 148 300 34 496 200 31 040 700 26 459 300 29 129 000 Brown coal 2 321 200 2 743 500 2 556 700 2 301 500 2 200 000 Czech Republic Bituminous 11 193 000 10 967 000 10 796 000 8 610 000 8 341 000 Brown coal 43 931 000 46 848 000 43 710 000 40 585 000 38 348 000 Germany Anthracite and Bituminous 14 110 000 12 960 000 11 558 000 8 260 000 8 340 000 Brown coal 169 402 544 176 502 048 185 432 000 182 995 337 178 177 703 Greece Lignite 53 600 000 58 400 000 62 334 800 55 000 000 50 411 000 Hungary Lignite 8 202 859 8 800 783 8 438 000 8 834 000 8 918 000 Brown coal 813 403 699 129 875 944 718 700 636 000 Macedonia Lignite 6 583 074 7 902 084 7 309 546 6 633 560 6 469 819 Montenegro Lignite 1 937 847 1 972 671 1 706 302 1 692 535 1 655 045 Norway Bituminous (a) 1 685 000 1 640 000 1 325 000 2 135 000 1 701 000 Poland Bituminous 76 727 802 76 447 604 79 854 904 68 399 000 65 969 000 Lignite 56 510 125 62 841 269 64 297 772 66 139 000 64 002 000 Romania Anthracite and Bituminous — 2 121 574 1 876 062 1 839 667 1 619 347 Lignite 28 774 244 33 779 130 31 529 377 22 902 291 23 144 539 Brown coal 62 448 46 071 17 700 — —

195
Coal
Production continued tonnes Country 2010 2011 2012 2013 2014 Serbia Bituminous 108 000 134 000 141 000 160 000 121 000 Lignite (b) 37 562 840 40 467 132 37 707 017 39 752 741 29 340 000 Brown coal 193 492 349 861 316 507 340 892 354 000 Slovakia Lignite 176 000 124 000 136 000 179 000 166 000 Brown coal 2 026 000 1 989 000 1 964 000 2 009 000 1 885 000 Slovenia Lignite 4 010 930 4 066 278 3 967 064 3 721 188 3 108 203 Brown coal 419 466 435 800 314 262 50 744 — Spain Anthracite 3 266 041 4 032 683 2 514 649 759 930 1 263 585 Bituminous 2 776 918 1 774 992 1 823 343 1 814 328 1 931 807 Sub-bituminous 2 443 677 2 358 372 1 826 680 1 870 569 1 347 849 Turkey Anthracite 6 312 137 5 619 316 3 358 843 * 3 100 000 * 3 100 000 Bituminous * 3 000 000 3 542 223 3 502 009 2 789 338 * 2 800 000 Lignite 86 943 392 79 968 510 75 036 558 * 75 000 000 * 75 000 000 United Kingdom Bituminous (c) 18 347 000 18 552 000 16 967 000 12 767 000 11 648 000 EU36 total 670 600 000 702 600 000 694 200 000 647 800 000 621 100 000 Notes (1) There is no international agreement as to the separate definition of lignite and brown coal. In some cases they are distinguished.
Elsewhere both may be aggregated under one or other term (a) Spitzbergen: not including production from mines controlled by Russia (b) Excluding production in Kosovo (c) Including anthracite
0
100
200
300
400
500
600
700
800
2010 2011 2012 2013 2014
Mill
ion
tonn
es
EU36 Production of coal (all forms) 2010 - 14

196
Coal
Exports of coal tonnes
Country 2010 2011 2012 2013 2014 Belgium Anthracite 1 652 015 1 915 992 1 668 940 1 772 455 1 300 147 Other coal 4 211 655 2 560 811 3 566 699 2 502 987 1 407 064 Lignite 18 781 42 164 51 514 42 225 49 615 Briquettes 18 899 40 374 41 363 55 684 71 817 Bulgaria Anthracite 150 2 538 2 731 2 914 2 560 Other coal 76 358 123 691 130 739 129 657 63 232 Lignite 9 525 2 744 635 127 25 357 Croatia Hard coal (a) 1 156 (a) 488 (a) 10 733 (a) 20 914 Czech Republic Anthracite 1 126 3 463 3 583 4 144 4 042 Other coal 6 443 306 6 253 274 5 368 575 4 832 928 4 288 594 Lignite 1 019 645 1 071 038 12 779 156 1 186 782 892 800 Briquettes 90 864 103 816 54 148 45 025 61 700 Denmark Hard coal 61 612 153 532 (a) 10 585 (a) 80 771 (a) 166 259 Estonia Hard coal (a) 16 452 (a) 2 312 (a) 741 1 0 Finland Hard coal (a) 12 32 0 5 270 21 France Anthracite 9 551 4 760 11 423 100 873 115 987 Other coal 121 733 113 718 168 068 96 081 161 171 Briquettes 4 495 2 390 109 39 67 Germany Anthracite 222 458 165 471 166 704 198 318 169 161 Other coal 31 492 39 712 109 026 52 793 38 926 Lignite 696 279 789 315 1 134 350 919 347 1 030 211 Briquettes 463 102 467 383 450 270 386 161 1 582 748 Greece Anthracite 2 073 2 175 1 424 702 1 423 Other coal 1 499 6 478 8 849 8 758 10 821 Lignite — 10 242 18 262 16 976 — Briquettes 113 — 8 502 1 — Hungary Anthracite 9 151 5 077 210 11 24 Other coal 683 476 208 42 521 200 Lignite 3 390 4 886 4 539 14 179 24 593 Ireland, Republic of Hard coal 5 820 (a) 2 857 18 914 (a) 35 038 27 286 Briquettes 12 695 11 333 12 115 12 113 11 352 Italy Anthracite 12 817 17 611 12 841 13 515 19 808 Other coal 1 485 571 53 107 1 953 378 Briquettes 3 923 213 798 45 — Latvia Hard coal (a) 3 136 26 100 13 823 32 847 44 891 Briquettes 3 262 6 402 4 007 2 772 2 483 Lithuania Hard coal (a) 33 109 28 271 5 762 33 957 33 623 Montenegro Lignite 69 130 48 940 47 778 22 877 27 857 Netherlands Anthracite 41 054 303 741 153 370 91 575 41 940 Other coal 7 580 839 10 529 025 12 817 303 11 303 627 8 942 983 Briquettes 144 797 294 637 148 931 14 240 113 965 Poland Anthracite 41 908 43 370 37 906 52 188 53 662 Other coal 10 323 041 676 364 5 257 817 10 805 260 8 815 725 Lignite 116 682 145 063 133 531 217 825 302 793 Briquettes 2 114 15 992 1 676 1 637 2 880 Portugal Anthracite 7 136 7 405 11 385 9 679 5 189 Other coal 326 17 903 179 357 885

197
Coal
Exports continued tonnes
Country 2010 2011 2012 2013 2014 Romania Hard coal (a) 73 002 35 712 19 701 (a) 5 599 (a) 4 835 Lignite — 1 338 — 37 085 Serbia Anthracite 4 434 2 507 160 3 009 60 Other coal 3 801 1 116 441 1 112 857 Lignite 112 009 32 337 28 266 51 729 13 798 Briquettes 8 724 573 53 62 273 39 254 Slovakia Anthracite 725 6 198 9 373 7 955 8 213 Other coal 5 128 2 552 10 9 463 1 159 Lignite 55 908 53 18 063 11 737 Briquettes 108 65 6 486 6 953 7 395 Slovenia Anthracite 760 2 068 615 1 920 1 003 Other coal 2 200 — 4 999 — Spain Anthracite 337 930 337 833 240 630 351 794 278 244 Other coal 1 149 991 851 716 1 620 047 356 469 1 006 016 Turkey Anthracite 717 5 210 5 700 1 356 5 602 Other coal 37 319 802 1 534 4 464 58 088 Lignite 4 554 43 942 48 706 13 204 5 969 United Kingdom Anthracite 89 701 97 014 119 826 143 133 81 353 Other coal 615 067 502 581 417 654 456 259 343 800 Briquettes 89 125 117 025 150 783 106 890 108 844
Notes (1) This table excludes bunker shipments (a) Including anthracite
Imports of coal tonnes
Country 2010 2011 2012 2013 2014 Albania Anthracite 5 023 8 245 9 240 8 729 (a)* 500 Other coal 59 663 82 438 90 273 84 406 (a)* 79 800 Austria Anthracite 3 774 5 760 5 932 1 654 2 246 Other coal 3 614 354 3 359 294 3 339 262 3 178 153 3 158 357 Lignite 68 777 74 609 75 705 82 039 95 181 Briquettes 34 999 35 695 26 598 28 482 32 497 Belgium Anthracite 2 660 267 3 382 132 2 377 808 2 077 612 1 862 605 Other coal 6 851 382 5 887 514 7 104 464 6 870 834 4 867 631 Lignite 362 257 411 424 425 918 474 879 495 571 Briquettes 27 379 53 793 40 447 60 486 65 614 Bulgaria Anthracite 1 858 397 2 203 775 1 132 609 732 939 842 995 Other coal 1 081 783 1 032 074 1 080 540 964 062 939 141 Briquettes 46 754 19 47 24 — Croatia Anthracite 1 325 2 332 234 2 658 4 194 Other coal 1 111 497 1 090 562 874 882 1 178 367 956 749 Lignite 85 413 85 316 44 423 49 158 41 246 Briquettes 1 823 2 302 2 175 6 848 3 142 Cyprus Hard coal (b) 7 714 129 164 386 5 170

198
Coal
Imports continued tonnes
Country 2010 2011 2012 2013 2014 Czech Republic Anthracite 24 471 95 762 121 247 183 417 88 545 Other coal 2 016 443 2 286 190 1 833 669 1 940 720 3 019 631 Lignite 49 426 91 889 350 322 304 216 1 358 543 Briquettes 137 933 157 513 156 682 167 695 135 442 Denmark Anthracite (a)* 21 000 (a)* 6 000 (a)* 6 000 7 308 Other coal 3 670 544 (a)* 7 107 000 (a)* 3 827 000 (a)* 4 516 000 (a)* 4 465 000 Briquettes 7 554 14 768 4 106 3 522 675 Estonia Hard coal (b) 77 300 89 422 81 082 58 945 82 302 Finland Hard coal (b) 5 919 757 6 972 540 3 954 916 5 064 181 5 436 916 France Anthracite 2 291 609 1 304 643 1 527 937 1 766 268 1 072 158 Other coal 16 688 152 14 073 053 16 249 645 16 699 467 13 170 273 Lignite 52 076 82 504 75 621 146 480 154 525 Briquettes 129 465 102 257 164 158 120 067 127 366 Germany Anthracite 3 643 048 2 535 881 1 399 126 1 047 216 990 703 Other coal 34 850 251 40 187 648 41 993 809 49 515 475 56 054 138 Lignite 24 400 41 768 28 744 87 355 87 769 Briquettes 404 681 291 675 138 019 137 275 103 926 Greece Anthracite 48 783 117 406 21 961 21 083 26 932 Other coal 512 663 169 990 117 867 339 450 178 480 Lignite 87 707 165 417 206 384 163 191 117 979 Briquettes 62 12 986 53 028 61 330 21 867 Hungary Hard coal (b) 1 744 778 1 570 645 1 556 689 1 366 089 1 439 839 Lignite 297 335 318 792 224 685 187 326 139 549 Briquettes 14 352 11 018 21 885 31 443 17 784 Iceland Anthracite 101 220 103 822 103 989 125 109 100 096 Other coal (a) * 115 000 * 228 000 * 115 000 * 59 000 * 127 000 Ireland, Republic of Anthracite 77 112 33 665 30 564 43 709 35 790 Other coal 1 601 294 2 149 095 2 028 332 2 300 643 1 731 529 Lignite 242 60 21 901 21 901 1 912 Briquettes 31 507 30 673 46 258 91 158 87 980 Italy Anthracite 408 391 394 026 266 462 162 364 204 631 Other coal 21 820 370 23 656 907 25 609 289 20 184 762 19 358 211 Briquettes 6 233 3 857 1 905 3 975 3 847 Latvia Anthracite 1 273 12 649 5 111 3 903 455 Other coal 180 075 185 516 152 423 132 348 123 639 Lithuania Anthracite 3 616 24 260 62 934 3 435 6 713 Other coal 313 355 368 099 256 651 416 369 325 951 Luxembourg Anthracite 24 834 16 256 10 994 10 869 10 465 Other coal 76 133 73 322 69 623 62 674 73 527 Lignite 7 090 7 710 8 620 3 483 3 687 Macedonia Hard coal (b) 160 162 189 549 233 556 163 242 160 070 Lignite 23 409 42 052 27 024 51 273 27 958 Briquettes 7 623 22 546 18 209 90 103 54 187 Netherlands Anthracite 44 958 225 184 257 485 160 206 111 094 Other coal 18 783 491 18 008 920 21 017 984 22 978 921 21 218 149 Lignite 21 933 15 824 22 991 16 285 22 108 Briquettes 132 281 429 514 1 398 836 2 702 367 2 591 227 Norway Anthracite (c) 78 387 79 140 78 412 68 231 79 859 Other coal (a)(c) * 517 000 * 343 000 * 468 000 * 465 000 * 476 000

199
Coal
Imports continued tonnes
Country 2010 2011 2012 2013 2014 Poland Anthracite 583 158 582 605 407 120 384 053 318 430 Other coal 13 127 065 14 090 331 9 652 129 10 434 564 10 005 485 Lignite 35 973 67 550 134 135 221 819 204 790 Briquettes 60 548 60 758 53 873 57 782 94 283 Portugal Anthracite 21 454 30 860 42 657 32 258 11 883 Other coal 2 648 704 3 592 502 4 999 817 4 182 028 4 419 070 Romania Anthracite 72 776 148 260 137 388 143 627 131 807 Other coal 936 727 840 669 1 142 615 785 892 563 641 Lignite 718 1 706 3 492 2 611 387 705 Briquettes 96 428 197 197 511 128 Serbia Anthracite 18 056 16 456 13 988 21 017 32 254 Other coal 156 846 183 713 178 984 83 968 133 244 Lignite 307 250 615 026 716 035 321 145 457 613 Briquettes 11 130 8 975 18 239 6 699 4 169 Slovakia Anthracite 293 054 713 105 635 877 499 374 609 327 Other coal 3 063 331 3 177 887 3 245 231 3 133 715 3 125 690 Lignite 563 021 534 118 624 731 436 339 463 136 Briquettes 12 799 14 836 16 545 25 808 31 121 Slovenia Anthracite 7 898 15 300 8 745 15 621 11 015 Other coal 18 975 15 329 14 920 13 345 11 545 Lignite 544 523 515 659 599 679 496 183 438 744 Spain Anthracite 846 015 852 813 594 330 544 040 566 371 Other coal 10 983 379 15 315 861 21 819 298 13 118 931 15 828 967 Sweden Anthracite 48 767 38 136 34 827 32 706 33 818 Other coal 3 236 437 2 971 646 2 218 768 2 499 142 2 729 091 Switzerland Anthracite 7 164 7 144 12 121 16 400 10 766 Other coal 124 096 92 473 129 051 128 071 29 523 Lignite 62 756 69 378 48 704 59 651 131 895 Briquettes 3 328 2 887 3 750 4 490 2 066 Turkey Anthracite 972 425 990 996 854 104 665 244 783 126 Other coal 21 048 121 22 721 500 28 405 516 25 960 988 29 033 299 Lignite 5 339 — 75 7 103 — United Kingdom Anthracite 187 246 193 474 29 186 23 059 111 197 Other coal 23 227 529 31 627 894 42 069 614 44 867 788 38 420 305 Briquettes 11 169 21 142 15 004 14 954 14 733
Notes (a) BGS estimates, based on known exports from certain countries (b) Including anthracite (c) Excludes coal imported from Spitzbergen

200
Coal
Coal - EU36 trade in 2014
-10 -5 0 5 10 15 20 25 30 35 40 45 50 55 60
GermanyUnited Kingdom
TurkeyNetherlands
ItalySpain
FrancePoland
BelgiumFinland
Czech RepublicDenmarkPortugalSlovakia
AustriaSweden
Ireland, Republic ofBulgariaHungaryRomania
CroatiaSerbia
NorwaySloveniaGreece
LithuaniaMacedonia
IcelandSwitzerland
Latvia
Millons tonnes
Imports Exports
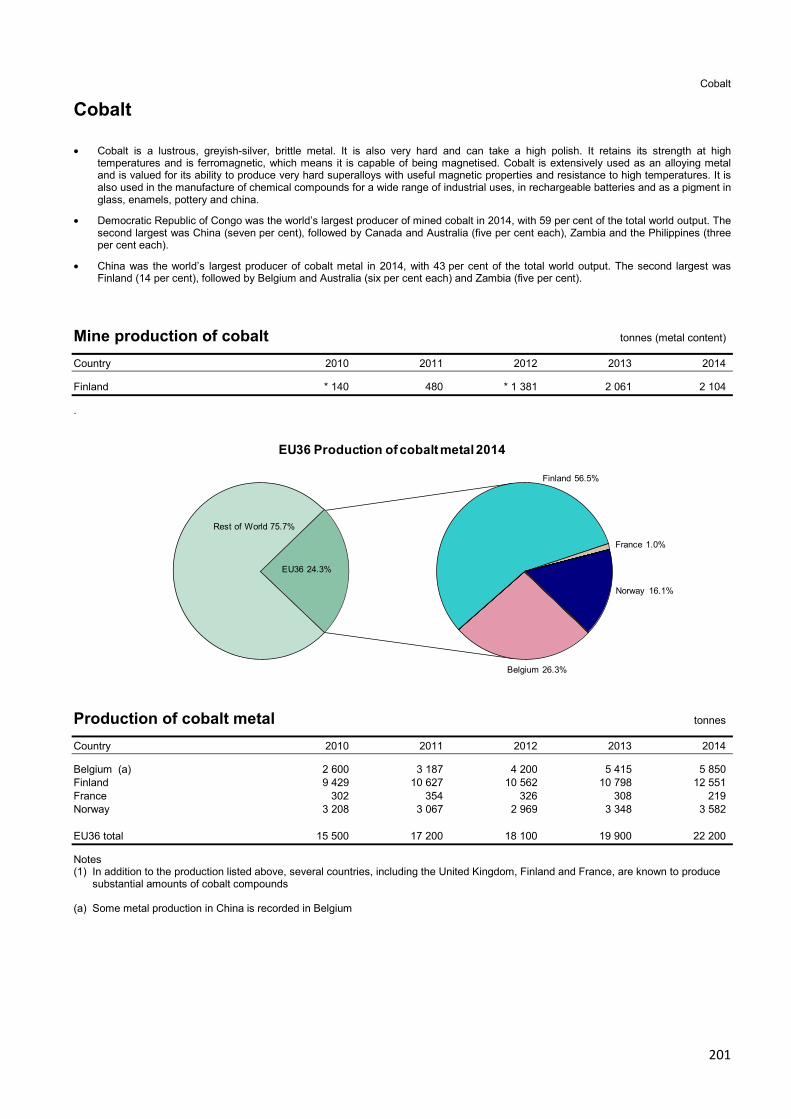
201
Cobalt
Cobalt
• Cobalt is a lustrous, greyish-silver, brittle metal. It is also very hard and can take a high polish. It retains its strength at high temperatures and is ferromagnetic, which means it is capable of being magnetised. Cobalt is extensively used as an alloying metal and is valued for its ability to produce very hard superalloys with useful magnetic properties and resistance to high temperatures. It is also used in the manufacture of chemical compounds for a wide range of industrial uses, in rechargeable batteries and as a pigment in glass, enamels, pottery and china.
• Democratic Republic of Congo was the world’s largest producer of mined cobalt in 2014, with 59 per cent of the total world output. The second largest was China (seven per cent), followed by Canada and Australia (five per cent each), Zambia and the Philippines (three per cent each).
• China was the world’s largest producer of cobalt metal in 2014, with 43 per cent of the total world output. The second largest was Finland (14 per cent), followed by Belgium and Australia (six per cent each) and Zambia (five per cent).
Mine production of cobalt tonnes (metal content) Country 2010 2011 2012 2013 2014 Finland * 140 480 * 1 381 2 061 2 104
.
Rest of World 75.7%
Belgium 26.3%
Finland 56.5%
France 1.0%
Norway 16.1%
EU36 24.3%
EU36 Production of cobalt metal 2014
Production of cobalt metal tonnes Country 2010 2011 2012 2013 2014 Belgium (a) 2 600 3 187 4 200 5 415 5 850 Finland 9 429 10 627 10 562 10 798 12 551 France 302 354 326 308 219 Norway 3 208 3 067 2 969 3 348 3 582 EU36 total 15 500 17 200 18 100 19 900 22 200 Notes (1) In addition to the production listed above, several countries, including the United Kingdom, Finland and France, are known to produce substantial amounts of cobalt compounds (a) Some metal production in China is recorded in Belgium
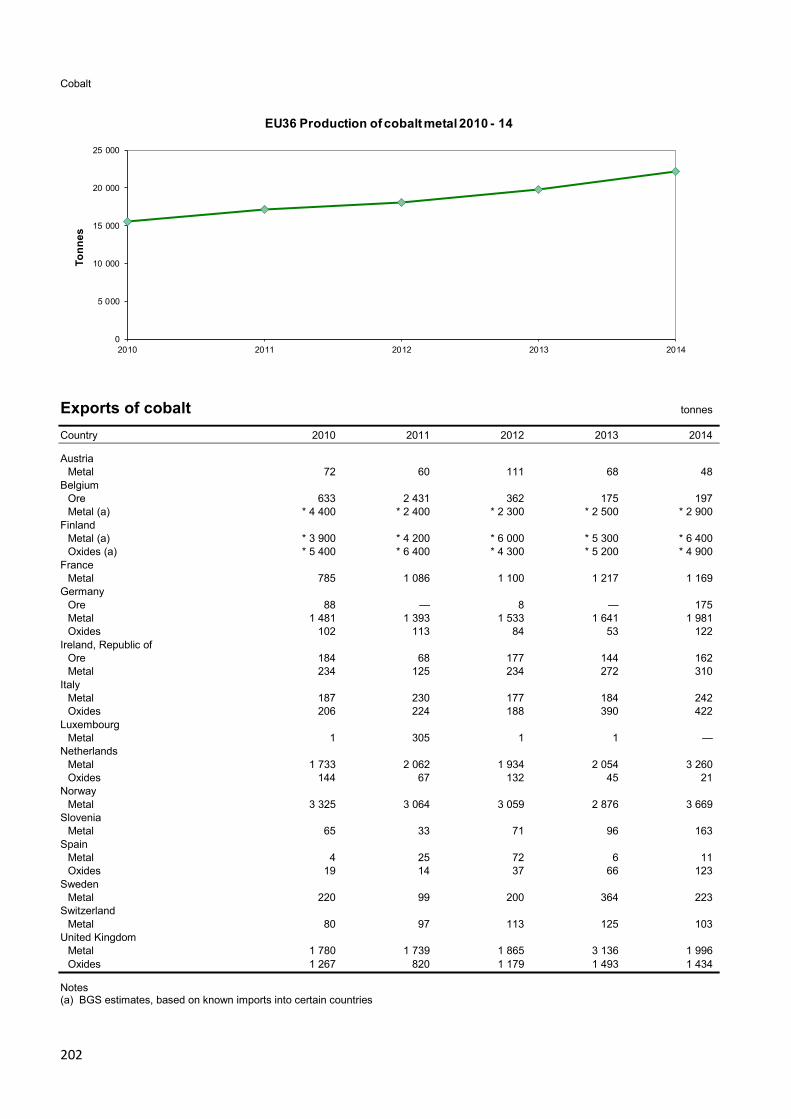
202
Cobalt
0
5 000
10 000
15 000
20 000
25 000
2010 2011 2012 2013 2014
Tonn
es
EU36 Production of cobalt metal 2010 - 14
Exports of cobalt tonnes Country 2010 2011 2012 2013 2014 Austria Metal 72 60 111 68 48 Belgium Ore 633 2 431 362 175 197 Metal (a) * 4 400 * 2 400 * 2 300 * 2 500 * 2 900 Finland Metal (a) * 3 900 * 4 200 * 6 000 * 5 300 * 6 400 Oxides (a) * 5 400 * 6 400 * 4 300 * 5 200 * 4 900 France Metal 785 1 086 1 100 1 217 1 169 Germany Ore 88 — 8 — 175 Metal 1 481 1 393 1 533 1 641 1 981 Oxides 102 113 84 53 122 Ireland, Republic of Ore 184 68 177 144 162 Metal 234 125 234 272 310 Italy Metal 187 230 177 184 242 Oxides 206 224 188 390 422 Luxembourg Metal 1 305 1 1 — Netherlands Metal 1 733 2 062 1 934 2 054 3 260 Oxides 144 67 132 45 21 Norway Metal 3 325 3 064 3 059 2 876 3 669 Slovenia Metal 65 33 71 96 163 Spain Metal 4 25 72 6 11 Oxides 19 14 37 66 123 Sweden Metal 220 99 200 364 223 Switzerland Metal 80 97 113 125 103 United Kingdom Metal 1 780 1 739 1 865 3 136 1 996 Oxides 1 267 820 1 179 1 493 1 434
Notes (a) BGS estimates, based on known imports into certain countries

203
Cobalt
Imports of cobalt tonnes Country 2010 2011 2012 2013 2014 Austria Metal 653 718 730 1 363 785 Oxides 10 9 8 54 14 Belgium Ore 156 379 349 66 42 Metal 222 368 246 181 454 Bulgaria Metal 1 1 1 3 50 Czech Republic Metal 60 74 77 83 89 Oxides 20 20 32 57 38 Denmark Oxides 19 42 16 0 5 Finland Ore 9 867 8 994 7 477 5 352 3 237 Metal 30 623 53 059 54 106 39 435 66 293 Oxides 233 172 298 154 26 France Metal 1 681 2 338 2 013 1 533 1 988 Oxides 635 841 611 650 494 Germany Ore 115 170 128 76 65 Metal 3 864 4 946 4 505 4 309 4 679 Oxides 1 069 900 878 1 580 1 275 Greece Metal 3 17 64 39 65 Ireland, Republic of Metal 756 601 743 701 3 117 Italy Metal 477 758 609 744 786 Oxides 707 719 679 901 759 Luxembourg Metal 163 811 80 113 130 Netherlands Metal 962 1 023 1 249 1 581 1 907 Oxides 118 596 16 7 5 516 Norway Metal 2 132 684 5 090 2 678 4 Poland Metal 52 47 52 48 73 Oxides 18 114 17 20 25 Romania Oxides 41 79 27 32 25 Slovakia Oxides 137 97 147 144 240 Slovenia Metal 141 110 92 206 207 Spain Metal 144 159 233 209 259 Oxides 1 543 1 837 1 941 2 053 1 881 Sweden Metal 396 571 443 287 442 Switzerland Metal 318 298 260 222 320 Turkey Metal 145 171 159 190 190 Oxides 199 277 364 384 543 United Kingdom Ore 143 124 125 137 151 Metal 5 963 6 093 6 197 5 215 4 560 Oxides 198 256 164 180 160
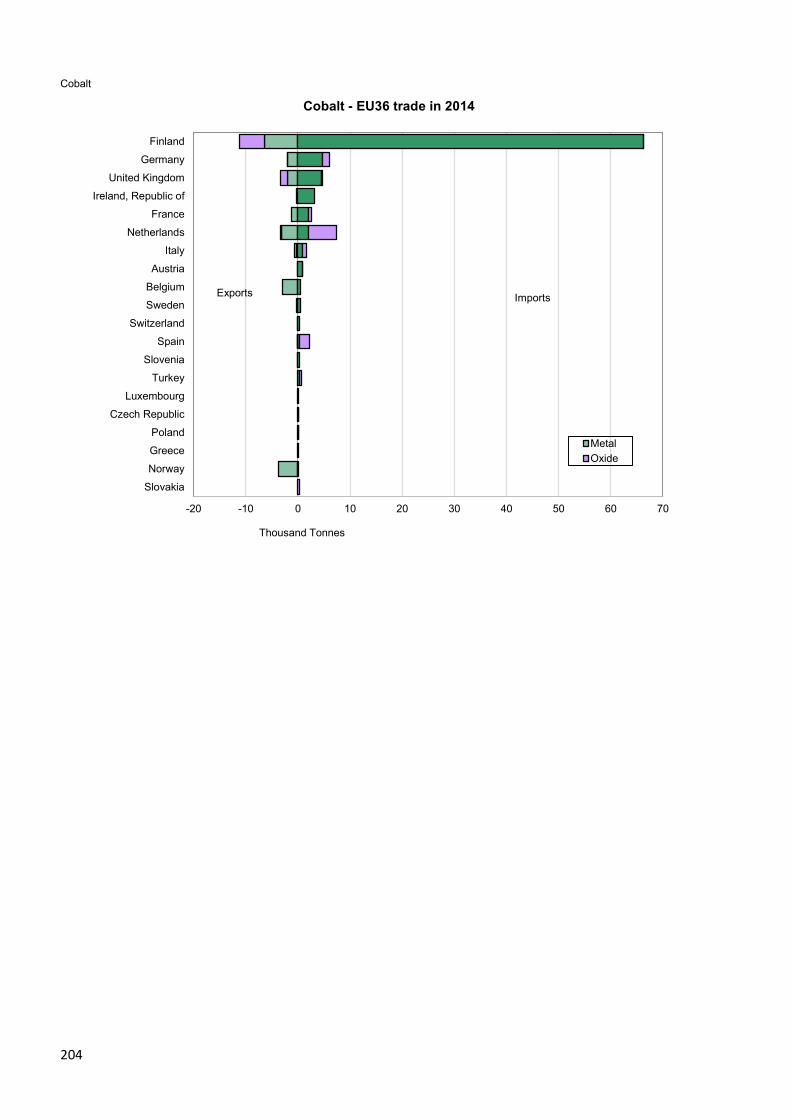
204
Cobalt Cobalt - EU36 trade in 2014
-20 -10 0 10 20 30 40 50 60 70
Finland
Germany
United Kingdom
Ireland, Republic of
France
Netherlands
Italy
Austria
Belgium
Sweden
Switzerland
Spain
Slovenia
Turkey
Luxembourg
Czech Republic
Poland
Greece
Norway
Slovakia
Thousand Tonnes
MetalOxide
Imports Exports
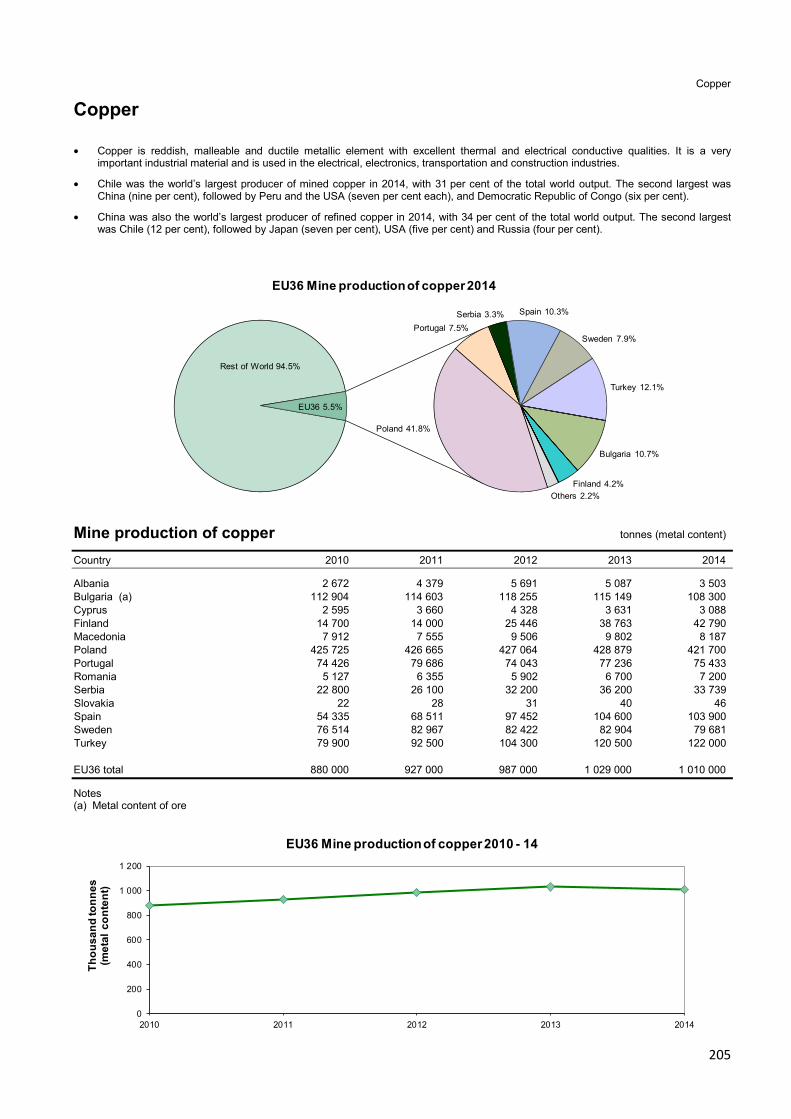
205
Copper
Copper
• Copper is reddish, malleable and ductile metallic element with excellent thermal and electrical conductive qualities. It is a very important industrial material and is used in the electrical, electronics, transportation and construction industries.
• Chile was the world’s largest producer of mined copper in 2014, with 31 per cent of the total world output. The second largest was China (nine per cent), followed by Peru and the USA (seven per cent each), and Democratic Republic of Congo (six per cent).
• China was also the world’s largest producer of refined copper in 2014, with 34 per cent of the total world output. The second largest was Chile (12 per cent), followed by Japan (seven per cent), USA (five per cent) and Russia (four per cent).
Rest of World 94.5%
Bulgaria 10.7%
Finland 4.2%Others 2.2%
Poland 41.8%
Portugal 7.5%Serbia 3.3% Spain 10.3%
Sweden 7.9%
Turkey 12.1%
EU36 5.5%
EU36 Mine production of copper 2014
Mine production of copper tonnes (metal content) Country 2010 2011 2012 2013 2014 Albania 2 672 4 379 5 691 5 087 3 503 Bulgaria (a) 112 904 114 603 118 255 115 149 108 300 Cyprus 2 595 3 660 4 328 3 631 3 088 Finland 14 700 14 000 25 446 38 763 42 790 Macedonia 7 912 7 555 9 506 9 802 8 187 Poland 425 725 426 665 427 064 428 879 421 700 Portugal 74 426 79 686 74 043 77 236 75 433 Romania 5 127 6 355 5 902 6 700 7 200 Serbia 22 800 26 100 32 200 36 200 33 739 Slovakia 22 28 31 40 46 Spain 54 335 68 511 97 452 104 600 103 900 Sweden 76 514 82 967 82 422 82 904 79 681 Turkey 79 900 92 500 104 300 120 500 122 000 EU36 total 880 000 927 000 987 000 1 029 000 1 010 000
Notes (a) Metal content of ore
0
200
400
600
800
1 000
1 200
2010 2011 2012 2013 2014
Thou
sand
tonn
es
(met
al c
onte
nt)
EU36 Mine production of copper 2010 - 14

206
Copper
Rest of World 89.1%
Bulgaria 16.4%
Finland 7.9%
Germany 18.9%
Norway 1.9%
Poland 27.0%Serbia 2.2%
Spain 15.8%
Sweden 8.1%
Turkey 1.9%
EU36 10.9%
EU36 Smelter production of copper 2014
Smelter production of copper tonnes Country 2010 2011 2012 2013 2014 Bulgaria 247 300 283 800 269 100 294 000 305 000 Finland 120 528 124 360 129 256 135 840 146 542 Germany 378 700 335 000 352 400 295 200 351 100 Norway 36 200 36 000 37 891 37 461 35 813 Poland 469 656 481 875 466 715 458 789 503 111 Serbia 20 000 28 200 36 800 41 300 40 898 Spain 259 119 260 730 270 200 212 000 294 100 Sweden 141 500 161 500 151 100 140 400 150 000 Turkey * 25 000 * 30 600 * 35 500 * 35 800 * 35 100 EU36 total 1 698 000 1 742 000 1 749 000 1 651 000 1 862 000
Notes (1) This table shows primary metal in the form of blister and anode produced from concentrates, and may include copper produced from
scrap but this is excluded when it can be separately identified
.
0
200
400
600
800
1 000
1 200
1 400
1 600
1 800
2 000
2010 2011 2012 2013 2014
Thou
sand
tonn
es
EU36 Smelter production of copper 2010 - 14

207
Copper
Rest of World 87.2%
Austria 2.9%
Belgium 13.4%Bulgaria 8.1%
Finland 5.1%
Germany 23.4%
Others 5.3%
Poland 19.9%
Spain 14.5%
Sweden 7.5%EU36 12.8%
EU36 Production of refined copper 2014
Production of refined copper tonnes Country 2010 2011 2012 2013 2014 Austria 113 700 112 500 113 600 82 842 83 200 Belgium 381 200 394 200 396 700 389 400 387 300 Bulgaria 216 000 226 100 226 000 230 100 234 000 Cyprus 2 595 3 660 4 328 3 631 3 088 Finland 112 687 124 360 129 256 135 840 146 542 Germany 704 300 708 800 682 132 677 600 676 900 Italy 1 800 7 600 7 700 4 900 7 900 Macedonia — — 1 100 1 900 1 700 Norway 36 200 36 000 37 891 37 461 35 813 Poland 547 074 571 041 565 834 565 155 576 876 Serbia 22 200 28 400 34 700 35 800 33 175 Spain 347 518 353 790 406 600 351 000 418 500 Sweden 190 497 219 316 214 050 206 193 217 337 Turkey 47 300 74 354 59 673 75 000 71 200 EU36 total 2 723 000 2 860 000 2 880 000 2 797 000 2 894 000
Notes (1) Figures relate to both primary and secondary refined copper, whether electrolytic or fire refined. Metal recovered from secondary
materials by remelting alone is excluded
0
500
1 000
1 500
2 000
2 500
3 000
3 500
2010 2011 2012 2013 2014
Thou
sand
tonn
es
EU36 Production of refined copper 2010 - 14

208
Copper
Exports of copper tonnes Country 2010 2011 2012 2013 2014 Albania Ores and concentrates 24 820 31 481 36 482 38 311 205 Scrap 4 953 5 656 5 725 4 613 1 445 Austria Unwrought, unrefined 7 636 7 780 1 049 412 234 Unwrought, refined (a) 135 936 129 241 125 425 100 350 91 929 Scrap 52 702 55 454 60 033 50 784 57 316 Belgium Ores and concentrates 4 549 2 046 3 242 1 874 696 Matte and cement 6 935 9 042 10 231 13 334 14 382 Unwrought, unrefined 42 836 40 660 27 586 37 012 24 804 Unwrought, refined 189 253 187 595 242 533 230 392 27 574 Unwrought alloys 12 116 11 763 12 436 12 049 12 270 Scrap 141 380 165 713 168 705 144 000 128 467 Bulgaria Ores and concentrates 86 171 131 874 204 416 231 388 246 882 Matte and cement 5 048 5 827 4 565 3 967 2 217 Unwrought, unrefined 7 926 10 844 70 347 121 280 116 252 Unwrought, refined 206 309 353 450 (a) 202 925 (a) 199 742 (a) 196 880 Scrap 18 226 12 982 12 318 10 760 8 488 Croatia Scrap 13 329 12 597 14 016 11 319 10 669 Cyprus Unwrought 2 550 3 660 4 328 3 615 3 088 Scrap 4 619 4 086 5 435 3 511 2 910 Czech Republic Unwrought 11 041 10 703 20 225 47 442 24 381 Unwrought alloys 3 515 2 884 1 238 1 331 1 458 Scrap 123 688 85 202 74 592 66 568 68 307 Denmark Scrap 30 006 33 289 27 276 29 167 32 745 Estonia Unwrought 1 790 744 2 386 860 854 Scrap 6 915 5 171 5 549 5 820 5 733 Finland Matte and cement ... 19 610 18 588 28 640 31 335 Unwrought, unrefined 35 132 24 908 29 714 21 400 6 903 Unwrought, refined (a) 58 273 41 887 60 197 60 041 78 185 Scrap 32 819 33 714 32 739 28 583 27 150 France Ores and concentrates 847 128 536 2 286 24 Unwrought, unrefined 7 356 9 545 2 430 2 895 1 465 Unwrought, refined 23 258 35 309 39 858 29 397 15 678 Unwrought alloys 12 786 10 624 11 182 11 025 9 990 Scrap 292 631 305 883 317 556 298 873 321 509 Germany Ores and concentrates 48 761 54 856 57 074 47 039 51 395 Matte and cement 8 431 9 2 1 1 340 Unwrought, unrefined 104 1 446 2 014 6 688 10 028 Unwrought, refined 136 006 195 181 276 943 225 139 174 312 Unwrought alloys 13 276 12 276 14 578 14 422 14 261 Scrap 578 448 585 346 587 935 516 590 531 195 Greece Unwrought 825 4 458 981 852 218 Unwrought alloys 2 097 4 346 969 646 209 Scrap 21 994 18 672 28 705 20 599 14 654 Hungary Unwrought, refined 24 786 5 867 10 432 4 448 Unwrought alloys 571 1 120 476 294 630 Scrap 15 319 31 459 37 048 35 024 31 929 Ireland, Republic of Scrap 13 172 10 168 10 046 9 601 10 287

209
Copper
Exports continued tonnes Country 2010 2011 2012 2013 2014 Italy Matte and cement 61 1 333 1 041 5 550 Unwrought, unrefined 7 290 8 502 7 811 5 612 7 354 Unwrought, refined 8 648 13 506 21 312 12 227 4 818 Unwrought alloys 15 553 20 024 21 264 17 927 20 878 Scrap 167 424 174 068 181 600 172 601 174 345 Latvia Unwrought — 642 4 314 6 428 2 341 Unwrought alloys 722 1 008 1 156 2 053 3 090 Scrap 7 106 13 679 8 494 7 847 7 362 Lithuania Unwrought 591 4 873 1 481 1 558 193 Scrap 4 128 5 724 7 582 10 680 14 242 Luxembourg Scrap 2 492 2 449 2 449 3 823 2 372 Macedonia Ores and concentrates 41 135 39 014 45 119 51 838 42 034 Unwrought 8 8 1 090 1 919 1 459 Scrap 576 2 845 2 221 2 144 2 151 Malta Scrap 919 1 096 1 287 736 606 Montenegro Scrap 1 769 2 356 1 650 1 705 1 587 Netherlands Ores and concentrates 0 0 6 540 56 629 91 185 Unwrought 20 175 34 435 59 260 27 722 25 173 Unwrought alloys 2 379 3 057 2 389 2 497 3 119 Scrap 283 847 315 437 328 463 295 139 326 278 Norway Matte and cement 0 2 3 852 2 387 2 728 Unwrought 35 975 36 549 38 146 37 287 37 397 Scrap 37 829 45 889 55 842 57 357 53 906 Poland Ores and concentrates — 1 3 1 27 646 Matte and cement 956 1 567 1 306 1 724 1 053 Unwrought 332 989 327 585 333 648 343 628 308 042 Unwrought alloys 1 180 1 260 2 571 2 279 2 270 Scrap 68 686 60 544 49 128 57 215 64 023 Portugal Ores and concentrates 305 485 327 096 312 192 328 240 320 063 Unwrought 1 887 9 969 8 425 248 334 Scrap 24 491 36 151 41 285 36 744 35 130 Romania Ores and concentrates 31 582 39 704 41 879 44 995 46 980 Unwrought 797 308 1 603 380 277 Scrap 49 248 54 536 51 844 44 056 39 434 Serbia Ores and concentrates 1 666 2 234 4 276 4 158 12 038 Matte and cement 2 501 1 649 358 714 306 Unwrought 10 280 8 840 15 242 19 712 16 823 Unwrought alloys 641 704 370 1 308 1 624 Scrap 12 286 9 991 10 496 7 705 7 961 Slovakia Unwrought, unrefined 31 685 38 566 40 404 20 077 27 183 Unwrought, refined 2 597 4 435 2 751 13 189 15 161 Unwrought alloys 1 346 704 619 1 343 2 191 Scrap 15 550 19 522 23 250 25 452 19 682 Slovenia Unwrought 7 042 5 847 561 2 135 899 Scrap 29 276 22 126 33 239 25 751 27 958 Spain Ores and concentrates 219 996 583 189 528 980 729 177 759 907 Matte and cement 25 17 596 9 413 0 149 Unwrought, unrefined 33 973 36 562 43 244 37 762 42 487 Unwrought, refined 78 030 90 279 146 942 113 585 160 941 Unwrought alloys 15 742 16 039 17 598 16 646 18 408 Scrap 102 236 87 122 159 419 156 511 150 874

210
Copper
Exports continued tonnes Country 2010 2011 2012 2013 2014 Sweden Ores and concentrates 24 8 010 4 266 4 — Unwrought 71 394 92 971 105 338 91 292 108 584 Unwrought alloys 8 563 5 615 3 585 4 773 4 738 Scrap 43 311 58 031 58 829 56 469 66 735 Switzerland Unwrought 832 1 030 935 1 470 1 779 Scrap 75 973 84 373 86 964 80 104 82 237 Turkey Ores and concentrates 421 536 257 914 351 882 428 144 342 957 Unwrought 2 106 2 845 5 701 1 026 1 864 Unwrought alloys 6 764 10 135 7 673 9 101 9 710 Scrap 12 426 5 124 9 226 23 251 17 478 United Kingdom Unwrought 9 068 18 145 25 145 17 538 1 198 Unwrought alloys 12 782 16 872 15 441 21 946 19 226 Scrap 421 868 513 394 373 943 291 924 295 741
Notes (1) In this table the term 'unwrought' copper corresponds to items 7402, 7403, 7405 of the Harmonised System and includes both unrefined (including blister) and refined copper (2) The term 'unwrought' as used here includes alloys unless these are separately specified. The term 'scrap' includes scrap alloys (a) Including alloys
Imports of copper tonnes Country 2010 2011 2012 2013 2014 Austria Unwrought, unrefined 36 218 44 412 42 637 21 970 27 007 Unwrought, refined 10 361 16 680 8 374 5 348 9 555 Unwrought alloys 1 412 1 376 2 183 2 567 2 868 Scrap 145 903 130 675 127 187 102 554 105 905 Belgium Ores and concentrates 10 554 13 735 1 278 3 413 3 908 Matte and cement 29 857 41 741 40 104 (a)* 9 000 (a)* 14 000 Unwrought, unrefined 191 159 206 987 181 032 174 338 223 874 Unwrought, refined 61 447 34 734 71 465 59 309 50 215 Unwrought alloys 4 917 5 134 2 971 3 686 2 133 Scrap 272 816 255 661 303 702 307 373 293 141 Bulgaria Ores and concentrates 575 192 836 387 756 349 1 008 680 913 418 Matte and cement 13 642 2 006 98 17 84 Unwrought 8 272 12 441 6 982 15 532 14 760 Scrap 35 464 52 461 64 563 56 040 60 453 Croatia Unwrought 944 1 627 3 447 2 894 3 063 Czech Republic Unwrought 6 846 6 252 16 354 29 583 12 923 Unwrought alloys 3 674 3 388 1 867 2 400 2 663 Scrap 11 804 18 859 18 874 14 107 9 449 Denmark Unwrought 1 978 2 255 1 692 2 039 1 980 Scrap 9 125 9 075 7 547 9 477 7 800 Estonia Unwrought 520 484 1 480 395 129 Scrap 391 335 508 801 2 001 Finland Ores and concentrates 458 174 415 365 424 982 391 822 423 149 Unwrought 4 212 4 711 6 366 2 330 5 284 Unwrought alloys 2 783 2 528 1 819 2 067 2 023 Scrap 6 967 7 726 9 839 7 444 15 832

211
Copper
Imports continued tonnes Country 2010 2011 2012 2013 2014 France Unwrought 227 271 226 312 218 176 230 041 223 666 Unwrought alloys 9 242 9 148 8 200 8 742 6 199 Scrap 72 220 81 824 76 972 63 604 67 840 Germany Ores and concentrates 1 128 472 1 124 525 1 215 273 1 013 432 1 185 757 Matte and cement 12 739 2 742 2 415 1 867 3 007 Unwrought, unrefined 23 331 68 147 55 179 112 940 49 093 Unwrought, refined 743 934 737 763 702 577 685 731 664 537 Unwrought alloys 36 249 35 493 37 491 39 025 36 743 Scrap 626 442 647 084 655 895 617 454 657 301 Greece Unwrought 63 684 54 258 54 080 54 806 58 503 Scrap 20 017 29 253 43 607 33 690 35 548 Hungary Unwrought, unrefined 772 1 272 1 502 1 102 1 114 Unwrought, refined 1 624 2 076 8 281 10 733 4 474 Unwrought alloys 1 241 1 471 1 434 1 036 1 006 Scrap 4 038 5 416 4 831 3 942 3 907 Italy Unwrought 628 325 615 251 583 215 559 334 622 721 Unwrought alloys 14 679 15 910 14 795 16 689 18 652 Scrap 129 074 148 358 137 709 151 708 178 256 Latvia Unwrought 4 1 074 1 689 90 410 Unwrought alloys 708 1 079 2 621 4 103 1 848 Scrap 2 942 3 855 5 014 8 145 6 402 Lithuania Unwrought 596 4 652 1 251 472 618 Scrap 436 634 2 505 5 696 7 662 Luxembourg Scrap 10 708 10 061 14 275 11 913 9 110 Netherlands Ores and concentrates 40 99 2 529 66 783 29 507 Unwrought, unrefined 7 194 5 502 9 68 9 Unwrought, refined 26 982 41 659 25 369 21 677 18 982 Unwrought alloys 2 101 2 111 1 930 2 982 2 951 Scrap 144 426 204 327 214 211 166 106 147 516 Norway Unwrought 4 609 909 704 1 460 1 107 Scrap 9 891 12 856 12 073 11 674 10 891 Poland Ores and concentrates 38 000 45 484 41 333 112 568 160 562 Unwrought, unrefined 33 717 23 581 22 766 17 481 13 833 Unwrought, refined 26 944 11 822 19 234 17 078 8 498 Unwrought alloys 2 813 2 939 4 229 2 693 2 718 Scrap 24 316 26 201 53 828 49 205 63 996 Portugal Unwrought 5 534 4 725 4 688 5 613 7 613 Unwrought alloys 4 127 4 378 3 993 3 445 3 999 Scrap 8 819 7 973 5 169 6 797 8 104 Romania Unwrought 2 282 2 915 1 899 1 997 2 169 Scrap 2 443 3 218 2 355 6 279 2 098 Serbia Ores and concentrates ... 3 063 0 (a)* 4 800 (a)* 12 600 Unwrought 37 129 26 995 14 679 8 262 4 152 Scrap 342 769 809 2 259 3 117 Slovakia Unwrought 6 153 7 531 8 665 10 099 18 795 Scrap 40 347 30 687 37 623 28 454 34 097 Slovenia Unwrought 8 369 7 062 1 287 1 892 1 164 Scrap 22 407 12 350 10 222 8 120 8 878

212
Copper
Imports continued tonnes Country 2010 2011 2012 2013 2014 Spain Ores and concentrates 1 229 136 1 482 090 1 517 856 1 575 657 1 788 742 Matte and cement 992 17 530 9 417 4 889 131 Unwrought, unrefined 518 12 747 685 209 347 Unwrought, refined 73 877 62 695 44 567 60 873 44 247 Unwrought alloys 4 014 6 998 4 109 4 549 4 075 Scrap 82 931 89 499 97 129 104 671 114 867 Sweden Ores and concentrates 302 514 300 878 310 772 270 120 274 664 Unwrought, unrefined 3 100 5 843 6 690 7 826 6 903 Unwrought, refined 46 383 31 760 30 772 6 906 475 Unwrought alloys 5 181 3 186 2 588 3 222 3 362 Scrap 108 971 121 099 139 188 152 058 103 319 Switzerland Unwrought 3 229 2 353 2 006 2 371 2 595 Unwrought alloys 4 137 3 520 3 489 3 495 3 616 Scrap 6 061 4 178 2 244 4 039 4 105 Turkey Unwrought, unrefined 5 892 4 329 2 824 478 44 Unwrought, refined 332 482 337 337 348 938 362 854 363 801 Unwrought alloys 6 601 9 450 6 695 2 946 2 617 Scrap 3 943 6 181 3 806 3 663 10 600 United Kingdom Unwrought, unrefined 2 039 1 267 147 409 754 Unwrought, refined 40 708 34 627 38 674 34 723 19 339 Unwrought alloys 5 688 5 498 5 957 12 098 4 815 Scrap 27 495 29 010 27 214 25 055 28 243
Notes (1) In this table the term 'unwrought' copper corresponds to items 7402, 7403, 7405 of the Harmonised System and includes both unrefined (including blister) and refined copper (2) The term 'unwrought' as used here includes alloys unless these are separately specified. The term 'scrap' includes scrap alloys (a) BGS estimates, based on known exports from certain countries

213
Copper
Copper - EU36 trade in 2014
-1 000 -500 0 500 1 000 1 500
GermanyItaly
TurkeyBelgiumFranceGreece
SpainAustriaPoland
United KingdomNetherlands
SlovakiaCzech Republic
BulgariaPortugalSwedenFinland
HungarySwitzerland
SerbiaCroatiaLatvia
RomaniaDenmarkSloveniaNorway
LithuaniaEstonia
MontenegroCyprus
MacedoniaAlbania
MaltaIreland, Republic of
Luxembourg
Thousand tonnes
MetalScrap
ImportsExports

214
Diamond
Diamond
• Diamond is a polymorph of carbon and is the hardest substance known. It is used mainly in jewellery, abrasives and cutting tools.
• Russia was the world’s largest producer in 2014, with 31 per cent of the total world output. The second largest is Botswana (with 20 per cent), followed by the Democratic Republic of Congo (12 per cent), Canada (ten per cent), Australia and Angola (seven per cent each).
Exports of diamond Carats Country 2010 2011 2012 2013 2014 Austria Unsorted £191 000 £3 305 000 £17 000 ... ... Gem, cut £3 564 000 £6 211 000 £3 657 000 £2 823 000 £5 864 000 Dust £225 000 £66 000 £34 000 £122 000 £224 000 Belgium Gem, rough 113 000 000 90 500 000 89 000 000 95 000 000 103 000 000 Gem, cut £4 127 959 000 £4 673 765 000 £3 813 301 000 £4 408 390 000 £3 898 534 000 Industrial £18 509 000 £21 037 000 £17 642 000 £15 435 000 £12 450 000 Dust £13 948 000 £12 800 000 £11 590 000 £11 072 000 £10 437 000 Czech Republic Gem, cut £4 465 000 £7 709 000 £6 721 000 £5 038 000 £9 122 000 Denmark Unsorted ... 2 875 000 60 000 — — Gem, cut 520 000 545 000 360 000 3 500 000 2 500 000 Industrial 90 000 125 000 55 000 65 000 — Dust 7 625 000 24 850 000 18 500 000 10 000 — Finland Dust ... 20 000 35 000 105 000 10 000 France Unsorted £16 000 £3 017 000 £217 000 £409 000 £674 000 Gem £109 371 000 £122 385 000 £222 448 000 £175 923 000 £217 138 000 Industrial £196 000 £70 000 £277 000 £29 000 £137 000 Dust 1 609 470 8 768 911 2 075 000 3 335 000 3 240 000 Germany Unsorted (a) * £863 000 * £489 000 * £283 000 * £3 271 000 * £3 895 000 Gem 161 687 155 370 129 830 126 640 98 997 Dust 7 355 000 13 670 000 15 095 000 16 665 000 18 745 000 Greece Unsorted £43 000 £99 000 £213 000 £789 000 £204 000 Gem £1 956 000 £405 000 £270 000 £247 000 £75 000 Industrial £49 000 £20 000 £24 000 £114 000 £146 000 Hungary Unsorted 4 000 000 5 500 000 3 500 000 ... — Dust ... 9 500 000 14 500 000 14 000 000 7 000 000 Ireland, Republic of Gem, rough 10 000 100 000 — 5 000 — Gem, cut 345 000 260 000 600 000 405 000 520 000 Industrial 58 658 2 801 447 460 000 3 170 000 625 000 Dust 65 787 012 283 458 829 ... 69 945 000 114 610 000 Italy Unsorted 210 000 205 000 2 880 000 * 2 600 000 1 165 000 Gem, rough 15 000 — 120 000 370 000 2 595 000 Gem, cut 243 170 181 572 12 605 000 86 540 000 92 205 000 Industrial 250 000 285 000 1 585 000 18 865 000 11 890 000 Dust 15 054 770 14 873 656 10 850 000 7 825 000 6 280 000 Luxembourg Dust 750 900 1 006 960 13 945 000 12 465 000 1 000 000 Netherlands Unsorted £371 000 £1 799 000 £823 000 £308 000 £3 338 000 Gem, cut £3 132 000 £16 418 000 £8 002 000 £10 206 000 £7 105 000 Industrial £2 179 000 £1 282 000 £1 508 000 £2 148 000 £269 000 Dust £51 000 £57 000 £97 000 £794 000 £2 552 000

215
Diamond
Exports continued Carats Country 2010 2011 2012 2013 2014 Portugal Gem, cut £550 £61 000 £136 000 £507 000 £93 000 Industrial 3 500 000 1 000 000 1 500 000 500 000 — Dust 92 107 788 459 1 000 000 550 000 1 000 000 Slovakia Gem, cut 7 000 000 3 000 000 500 000 75 000 65 000 Dust 6 250 000 2 934 017 ... ... — Spain Unsorted £292 000 £154 000 £490 000 £390 000 £311 000 Gem, rough ... £500 000 £130 000 £160 000 £153 000 Gem, cut £7 350 000 £9 802 000 £9 021 000 £11 894 000 £9 086 000 Industrial £210 000 £590 000 £42 000 £499 000 £82 000 Dust 689 563 8 454 551 21 675 000 23 795 000 12 850 000 Sweden Dust 500 000 — — ... 2 000 000 Switzerland Gem, rough 14 892 3 628 5 000 5 000 5 000 Gem, cut 357 976 435 272 145 000 110 000 140 000 Dust 60 980 000 70 880 000 59 620 000 72 175 000 60 575 000 Turkey Dust 1 253 750 7 702 486 400 000 10 000 2 070 000 United Kingdom Unsorted 3 689 202 2 735 369 2 974 099 11 165 256 14 606 086 Gem, rough 51 769 860 41 541 219 46 117 478 34 651 963 581 879 Gem, cut 283 435 1 292 162 1 702 424 284 182 470 026 Industrial 2 478 568 3 864 054 3 949 553 2 001 018 2 430 399 Dust 113 451 535 42 269 921 32 288 331 28 709 324 19 103 486
Notes (1) Carats have been used as the unit in this table except where the only obtainable figure is the value. In these cases the national
currency figure has been converted to £ sterling (2) See explanatory notes at the front of the volume regarding currency conversion (3) In this table the term 'Dust' corresponds to item 7105.10 of the Harmonised System and includes both natural and synthetic diamond
dust (a) BGS estimates, based on known value of imports to certain countries
Imports of diamond Carats Country 2010 2011 2012 2013 2014 Austria Unsorted £729 000 £3 371 000 £203 000 £108 000 £58 000 Gem, cut £9 838 000 £19 112 000 £10 309 000 £9 666 000 £8 346 000 Industrial £193 000 £5 500 £149 000 £132 000 £9 600 Dust 30 000 000 38 000 000 30 500 000 44 000 000 28 000 000 Belgium Unsorted £32 253 000 £40 264 000 £39 850 000 £309 925 000 £525 786 000 Gem, rough 63 000 000 67 500 000 54 500 000 64 000 000 75 000 000 Gem, cut 3 000 000 3 000 000 500 000 * 2 260 000 500 000 Industrial 3 000 000 1 000 000 2 500 000 2 000 000 2 000 000 Dust 61 000 000 58 000 000 68 500 000 57 500 000 68 500 000 Bulgaria Dust 7 251 395 7 571 255 7 641 000 * 9 090 000 9 000 000 Cyprus Gem, cut £955 000 £976 000 £921 000 £697 000 £647 000 Industrial £1 007 000 £944 000 £1 474 000 £1 137 000 £1 779 000 Czech Republic Gem, cut 5 567 6 796 * 10 000 * 7 000 * 6 000 Dust £1 704 000 £1 954 000 £2 057 000 £2 229 000 £1 873 000 Denmark Unsorted £255 000 £82 000 £18 000 £94 000 £234 000 Gem, cut £5 339 000 £5 884 000 £8 897 000 £11 316 000 £13 671 000 Industrial £59 000 £88 000 £137 000 £105 000 £143 000 Dust 1 663 715 1 189 540 1 205 000 1 360 000 1 630 000

216
Diamond
Imports continued Carats Country 2010 2011 2012 2013 2014 Finland Unsorted £419 000 £315 000 £288 000 £228 000 £180 000 Gem, rough £165 000 £131 000 £111 000 £41 000 ... Gem, cut £3 575 000 £3 346 000 £3 201 000 £3 018 000 £1 992 000 Industrial 65 000 520 000 20 000 40 000 20 000 Dust 519 830 773 725 645 000 735 000 585 000 France Unsorted 9 402 10 015 * 41 800 * 22 900 * 18 500 Gem, rough £949 000 £698 000 £1 547 000 £914 000 £1 555 000 Gem, cut 468 867 660 561 * 843 000 * 861 000 * 796 000 Industrial 30 480 30 012 * 54 000 * 29 000 * 24 000 Dust 12 512 821 22 167 841 21 135 000 15 530 000 21 025 000 Germany Gem 377 399 366 385 314 347 339 116 289 308 Industrial 122 838 143 922 149 572 164 340 92 897 Dust 64 065 000 89 060 000 94 175 000 91 750 000 100 160 000 Greece Unsorted 910 000 525 000 135 000 685 000 305 000 Gem, rough 558 241 292 617 * 86 000 * 49 000 ... Gem, cut 7 000 000 2 000 000 4 500 000 4 000 000 1 140 000 Industrial 4 375 000 3 680 000 2 150 000 220 000 380 000 Dust (a)* 245 000 200 435 (a)* 125 000 (a)* 100 000 (a)* 165 000 Hungary Gem, cut £280 000 £657 000 £421 000 £80 000 £123 000 Industrial £168 000 £675 000 £346 000 £153 000 £55 000 Dust (a)* 8 910 000 (a)* 12 690 000 14 500 000 14 000 000 7 000 000 Iceland Gem, cut 110 592 90 000 160 000 210 000 230 000 Industrial * 76 000 125 000 75 000 105 000 70 000 Ireland, Republic of Unsorted £362 000 £320 000 £164 000 £172 000 £1 109 000 Gem, rough 1 565 000 1 620 000 1 595 000 1 475 000 1 480 000 Gem, cut 11 385 000 6 745 000 3 905 000 3 305 000 2 300 000 Industrial 4 585 000 2 570 000 1 545 000 750 000 1 200 000 Dust 86 782 073 737 418 949 358 020 000 405 650 000 526 160 000 Italy Unsorted £8 198 000 £8 652 000 £7 050 000 £9 648 000 £9 302 000 Gem, rough 60 000 115 000 175 000 28 050 000 38 335 000 Gem, cut £285 718 000 £370 521 000 £338 455 000 £347 587 000 £429 445 000 Industrial £7 993 000 £7 254 000 £4 318 000 £8 721 000 £9 094 000 Dust 196 860 000 248 520 000 252 160 000 306 965 000 395 715 000 Luxembourg Unsorted £20 000 £248 000 £262 000 £38 000 £23 000 Gem, cut £418 000 £533 000 £861 000 £2 332 000 £1 664 000 Industrial 105 000 35 000 860 000 360 000 330 000 Dust £609 000 £471 000 £562 000 £552 000 £491 000 Montenegro Dust 45 000 ... ... ... 10 000 Netherlands Unsorted £80 000 £192 000 £144 000 £885 000 £171 000 Gem, cut £15 248 000 £35 316 000 £30 128 000 £33 465 000 £22 637 000 Industrial £624 000 £1 393 000 £1 392 000 £2 340 000 £1 245 000 Dust 290 475 2 074 815 820 000 14 150 000 30 820 000 Norway Gem, cut 8 545 5 284 * 4 400 * 6 800 * 6 500 Industrial 160 000 140 000 285 000 130 000 340 000 Dust ... ... 115 000 55 000 10 000 Poland Unsorted £208 000 £24 000 £289 000 £22 000 £286 000 Gem, cut £2 128 000 £3 805 000 £2 532 000 £3 111 000 £4 680 000 Dust £179 000 £273 000 £376 000 £388 000 £273 000 Portugal Gem, cut £2 039 000 £3 732 000 £2 532 000 £2 414 000 £2 246 000 Industrial £111 000 £122 000 £86 000 £65 000 £21 000 Dust 9 509 385 10 215 655 5 245 000 4 775 000 8 930 000

217
Diamond
Imports continued Carats Country 2010 2011 2012 2013 2014 Serbia Dust 550 000 885 000 425 000 580 000 485 000 Slovakia Gem, rough £600 000 £406 000 £923 000 £57 000 £645 000 Gem, cut £2 530 000 £2 720 000 £6 610 000 £2 750 000 £913 000 Industrial 55 000 1 037 208 * 10 000 40 000 15 000 Dust 18 560 000 325 000 * 600 000 160 000 275 000 Slovenia Dust 1 656 306 1 423 460 990 000 1 280 000 1 040 000 Spain Unsorted £1 814 000 £3 864 000 £2 441 000 £2 139 000 £3 635 000 Gem, rough £312 000 £276 000 £487 000 £207 000 £303 000 Gem, cut £26 488 000 £25 312 000 £24 197 000 £25 904 000 £24 854 000 Industrial £275 000 £605 000 £774 000 £580 000 £1 174 000 Dust 27 500 320 27 699 364 * 19 429 000 * 19 405 000 * 18 568 000 Sweden Unsorted £125 000 £105 000 £178 000 £128 828 £148 000 Gem, cut 9 615 12 118 * 8 000 * 8 000 * 8 000 Industrial 26 277 5 390 * 8 100 * 12 000 * 23 000 Dust 8 000 000 9 500 000 22 000 000 61 500 000 67 500 000 Switzerland Gem, rough 20 460 3 263 5 000 10 000 5 000 Gem, cut 840 245 1 227 118 1 185 000 1 280 000 1 195 000 Dust 74 015 000 101 250 000 82 185 000 103 905 000 80 765 000 Turkey Gem 131 146 141 277 2 080 000 1 270 000 2 175 000 Industrial 46 890 82 417 65 000 90 000 170 000 Dust 25 190 000 31 125 000 36 995 000 34 835 000 36 360 000 United Kingdom Unsorted 8 703 907 8 484 526 9 238 531 12 754 564 14 833 453 Gem, rough 40 559 260 38 472 604 33 227 748 29 495 262 823 336 Gem, cut 761 455 18 292 931 7 009 031 1 494 267 5 254 159 Industrial 7 299 364 10 236 376 7 747 613 6 399 457 4 270 299 Dust 111 136 020 32 411 894 26 886 717 25 157 153 25 481 253
Notes (1) Carats have been used as the unit in this table except where the only obtainable figure is the value. In these cases the national figure
has been converted to £ sterling (2) See explanatory notes at the front of the volume regarding currency conversion (3) In this table the term 'Dust' corresponds to item 7105.10 of the Harmonised System and includes both natural and synthetic diamond
dust (a) BGS estimates, based on known exports from certain countries

218
Diatomite
Diatomite
• Diatomite is a siliceous sedimentary rock composed of the skeletons of fossilised diatoms (microscopic plants). Clay content of the rock has a strong control on the quality of the diatomite. Diatomite is valued for its high porosity, chemical inertness and ability to absorb liquids. It is used in industry in high-quality filters and as an industrial absorbent.
• USA was the world’s largest producer in 2014, with 35 per cent of the total world output. The second largest was China (19 per cent), followed by Peru (seven per cent) and Denmark (five per cent).
Rest of World 80.5%
Czech Republic 7.7%
Denmark 26.8%
France 20.3%
Germany 12.3% Others 0.2%
Spain 13.5%
Turkey 19.2%EU36 19.5%
EU36 Production of diatomite 2014
Production of diatomite tonnes Country 2010 2011 2012 2013 2014 Czech Republic 32 000 46 000 43 000 49 000 34 000 Denmark Moler (a) 124 000 126 000 111 000 128 125 118 750 France * 75 000 * 75 000 * 85 000 * 85 000 * 90 000 Germany 49 306 52 698 50 036 51 435 54 277 Hungary 1 197 1 309 1 229 456 * 500 Poland 1 000 580 600 600 590 Spain (b) 64 346 83 624 60 777 53 713 59 619 Turkey 18 448 45 187 86 403 84 751 * 85 000 EU36 total 365 000 430 000 438 000 453 000 443 000
Notes (a) Moler is an impure diatomite containing a large proportion of clay (b) Including Tripoli
0
50
100
150
200
250
300
350
400
450
500
2010 2011 2012 2013 2014
Thou
sand
tonn
es
EU36 Production of diatomite 2010 - 14

219
Diatomite
Exports of diatomite tonnes Country 2010 2011 2012 2013 2014 Austria 3 467 2 756 3 550 3 275 3 166 Belgium 3 004 3 122 2 690 3 566 3 547 Czech Republic 4 231 5 182 6 751 7 031 8 438 Denmark (a) * 57 300 * 56 800 * 42 700 * 55 700 * 57 000 France 26 822 25 420 25 245 22 688 23 393 Germany 5 361 14 251 22 190 27 103 29 410 Italy 6 716 2 226 1 229 1 458 1 373 Lithuania 551 615 234 280 254 Netherlands 359 633 807 864 604 Poland 111 788 3 012 5 823 1 430 Portugal 7 545 7 299 11 538 18 246 23 028 Spain 7 382 6 655 10 384 4 271 5 730 Sweden 829 1 098 1 214 1 116 1 138 Switzerland 453 564 629 447 266 Turkey 37 432 28 104 36 985 55 673 46 832 United Kingdom 1 650 797 659 497 734
Notes (a) BGS estimates, based on known imports into certain countries
Imports of diatomite tonnes Country 2010 2011 2012 2013 2014 Austria 13 324 12 798 12 452 12 827 12 983 Belgium 11 813 10 815 7 143 7 753 9 287 Croatia 402 555 616 598 652 Czech Republic 2 753 3 263 3 829 3 694 6 927 Denmark 3 294 4 165 3 056 2 998 2 181 Finland 4 367 3 432 3 426 2 724 2 672 France 17 477 14 098 13 279 11 150 12 086 Germany 43 487 39 892 42 122 43 006 44 967 Greece 668 623 647 424 557 Hungary 957 1 189 885 649 689 Ireland, Republic of 640 699 965 683 439 Italy 3 920 5 555 5 091 4 571 4 792 Latvia 412 805 812 836 1 310 Lithuania 744 1 174 865 1 187 2 136 Luxembourg 7 858 7 394 129 48 498 Netherlands 4 641 6 034 6 232 6 445 43 518 Norway 842 808 867 937 1 130 Poland 6 753 9 365 7 802 6 980 6 068 Portugal 2 284 2 340 2 242 2 702 2 840 Romania 2 269 2 459 1 827 2 583 2 046 Slovakia 784 415 461 498 473 Slovenia 718 623 397 394 414 Spain 8 203 8 026 7 368 6 480 8 202 Sweden 8 099 8 247 7 532 7 410 7 037 Switzerland 5 758 4 642 5 177 5 634 5 578 Turkey 1 319 1 702 2 124 2 247 2 290 United Kingdom 18 649 20 042 19 752 19 713 25 542

220
Diatomite
Diatomite - EU36 trade in 2014
-60 -50 -40 -30 -20 -10 0 10 20 30 40 50
GermanyNetherlands
United KingdomAustriaFrance
BelgiumSpain
SwedenCzech Republic
PolandSwitzerland
ItalyPortugalFinlandTurkey
DenmarkLithuaniaRomania
LatviaNorway
HungaryCroatiaGreece
LuxembourgSlovakia
Ireland, Republic ofSlovenia
Thousand tonnes
Imports Exports

221
Feldspar
Feldspar
• Feldspar is an abundant rock-forming alumino-silicate mineral. It is an essential component of glass and ceramic manufacture where it behaves as a flux and adds hardness, durability and resistance to corrosion.
• Turkey was the world’s largest producer in 2014, with 30 per cent of the total world output. The second largest was Italy (19 per cent), followed by China (eight per cent), India (seven per cent) and Thailand (six per cent).
Rest of World 40.5%
Czech Republic 2.8%
France 3.7%
Italy 31.2%
Others 4.6%Poland 3.2%
Spain 4.0%
Turkey 50.5%EU36 59.5%
EU36 Production of feldspar 2014
Production of feldspar tonnes Country 2010 2011 2012 2013 2014 Bulgaria * 80 000 * 80 000 * 80 000 * 80 000 * 80 000 Czech Republic 388 000 407 000 445 000 411 000 422 000 Finland 28 013 26 292 43 124 47 636 46 233 France * 650 000 * 600 000 * 600 000 * 550 000 * 550 000 Germany 350 000 350 000 350 000 * 350 000 * 350 000 Greece 23 050 10 200 13 000 — — Italy * 4 700 000 * 4 700 000 * 4 700 000 * 4 700 000 * 4 700 000 Macedonia 23 188 25 032 17 168 15 168 18 076 Norway 56 000 25 271 — — 154 Poland 513 700 538 800 487 200 483 000 * 485 000 Portugal (a) 169 722 187 159 167 287 138 715 136 440 Romania 6 049 3 814 4 112 7 060 7 570 Serbia 253 23 586 19 927 * 20 000 * 20 000 Slovakia — — — 5 000 6 000 Spain 691 894 662 418 530 238 592 908 * 600 000 Sweden 22 000 30 000 27 000 30 000 27 000 Turkey 6 281 597 7 076 068 7 076 068 7 090 677 7 609 692 EU36 total 13 983 000 14 746 000 14 560 000 14 521 000 15 058 000
Notes (a) Includes feldspathic sand

222
Feldspar
0
2 000
4 000
6 000
8 000
10 000
12 000
14 000
16 000
2010 2011 2012 2013 2014
Thou
sand
tonn
es
EU36 Production of feldspar 2010 - 14
Exports of feldspar tonnes Country 2010 2011 2012 2013 2014 Austria 13 474 11 807 11 452 11 488 10 668 Belgium 64 317 417 2 830 170 Bulgaria 19 087 19 329 19 414 19 433 18 530 Czech Republic 129 715 166 859 171 207 173 282 164 127 Finland 31 844 31 700 47 889 42 359 94 084 France 226 149 226 934 207 687 167 806 197 618 Germany 78 610 76 300 70 936 91 047 92 144 Greece 1 119 1 562 1 279 5 064 (a)* 8 600 Italy 194 763 288 246 220 404 261 124 235 591 Macedonia 21 924 25 111 14 857 15 477 17 675 Netherlands 105 112 281 228 533 Norway 55 637 30 617 4 821 9 146 5 698 Poland 3 050 3 012 1 376 1 222 898 Portugal 2 190 3 197 17 482 29 205 24 563 Romania 1 283 260 301 329 Slovakia ... 58 1 1 532 4 857 Slovenia 47 52 — 128 384 Spain 69 337 71 940 63 644 81 429 99 009 Sweden 11 251 19 258 16 831 14 081 21 413 Turkey 3 759 104 3 973 160 4 107 038 4 139 071 4 629 112
Notes (a) BGS estimates, based on known imports into certain countries
Imports of feldspar tonnes Country 2010 2011 2012 2013 2014 Austria 2 433 2 804 2 442 2 094 2 468 Belgium 24 495 22 623 17 062 18 181 17 998 Bulgaria 86 861 86 056 84 230 110 954 135 195 Croatia 14 763 14 001 11 676 11 503 12 223 Czech Republic 6 298 6 527 4 735 5 920 5 575 Denmark 1 211 2 612 45 2 1 259 Estonia 94 109 17 881 2 477 88 Finland 1 209 1 217 4 902 5 660 8 333 France 31 721 34 907 36 109 50 725 70 019 Germany 139 663 153 713 109 157 129 123 155 411 Greece 12 195 9 469 20 6 128 8 643

223
Feldspar
Imports continued tonnes Country 2010 2011 2012 2013 2014 Hungary 14 235 14 211 13 905 10 755 15 329 Italy 1 951 827 1 954 499 1 905 805 1 855 315 1 831 264 Latvia 577 561 1 292 1 522 1 114 Lithuania 6 265 10 278 6 700 1 405 1 478 Netherlands 15 721 9 071 57 431 85 487 64 185 Norway 16 413 18 228 14 322 15 794 17 151 Poland 243 645 324 426 287 882 288 728 272 111 Portugal 63 675 49 902 61 516 79 625 80 517 Romania 36 924 45 421 47 688 39 447 41 451 Serbia 10 139 11 864 11 302 9 794 13 208 Slovakia 5 886 5 590 5 518 5 809 5 499 Slovenia 14 954 13 168 6 012 5 963 5 782 Spain 856 406 993 378 926 809 1 092 403 1 235 414 Sweden 6 410 4 363 547 3 803 4 140 Switzerland 6 593 6 124 4 575 4 504 5 268 Turkey 39 953 34 726 47 361 39 456 41 695 United Kingdom 17 584 16 750 21 610 24 568 19 154
Feldspar - EU36 trade in 2014
-5,000 -4,000 -3,000 -2,000 -1,000 0 1,000 2,000
ItalySpain
PolandGermanyBulgariaPortugal
FranceNetherlands
TurkeyRomania
United KingdomBelgiumNorway
HungarySerbia
CroatiaGreeceFinland
SloveniaCzech Republic
SlovakiaSwitzerland
SwedenAustria
Macedonia
Thousand tonnes
Imports Exports

224
Fluorspar
Fluorspar
• Fluorspar is the commercial name for the mineral fluorite (calcium fluoride) and it is an important raw material source of fluorine. Most fluorspar production is used in the manufacture of hydrofluoric acid which is used primarily in the pharmaceutical and agrichemical industries. Fluorspar is also used in steel and aluminium manufacture.
• China was the world’s largest producer in 2014, with 58 per cent of the total world output. The second largest was Mexico (18 per cent), followed by Mongolia (five per cent) and South Africa (four per cent).
Rest of World 94.6%
Bulgaria 24.7%Germany 10.6%
Spain 40.5%
Turkey 1.1%
United Kingdom 23.1%
EU36 5.4%
EU36 Production of fluorspar 2014
Production of fluorspar tonnes Country 2010 2011 2012 2013 2014 Bulgaria 10 31 800 69 700 82 500 * 82 500 Germany 59 086 65 619 54 202 48 744 35 270 Spain 132 341 117 063 113 570 128 512 135 293 Turkey 25 189 4 524 5 197 3 874 * 3 800 United Kingdom 26 420 — — 30 000 77 000 EU36 total 243 000 219 000 243 000 294 000 334 000
0
50
100
150
200
250
300
350
400
2010 2011 2012 2013 2014
Thou
sand
tonn
es
EU36 Production of fluorspar 2010 - 14

225
Fluorspar
Exports of fluorspar tonnes
Country 2010 2011 2012 2013 2014 Belgium 122 483 118 782 147 771 106 343 90 782 Bulgaria 821 33 60 986 4 670 Czech Republic 10 575 10 564 9 634 10 722 9 683 Germany 33 487 45 955 38 029 37 087 31 758 Italy 6 740 28 942 48 048 54 013 67 401 Netherlands 14 023 28 870 19 488 16 659 34 470 Poland 22 10 — 31 336 Spain 1 680 3 312 5 519 12 754 5 735 Sweden 8 101 11 053 13 714 11 668 10 106 Turkey 174 243 244 357 726 United Kingdom 412 590 75 16 127 49 078
Imports of fluorspar tonnes Country 2010 2011 2012 2013 2014 Albania 350 650 55 500 * — Austria 3 490 2 911 2 935 2 847 2 738 Belgium 134 266 145 776 173 038 119 747 123 193 Bulgaria 700 1 742 1 262 421 737 Croatia 146 3 527 15 513 18 082 35 Czech Republic 14 495 15 547 15 388 17 129 13 911 Denmark 13 086 22 462 16 043 11 860 8 258 Finland 16 740 17 605 16 818 15 398 17 582 France 14 601 14 655 15 879 15 453 15 795 Germany 261 999 380 027 280 867 249 532 268 879 Greece 2 652 3 073 2 104 1 349 1 606 Hungary 2 662 4 152 3 014 3 984 3 326 Italy 200 184 246 374 232 908 232 279 249 889 Latvia 678 775 1 269 811 598 Luxembourg 983 887 795 739 937 Macedonia 350 600 244 122 223 Netherlands 14 294 23 603 11 725 26 299 28 875 Poland 11 013 12 239 11 747 9 106 10 698 Portugal 1 384 2 350 3 234 3 291 2 894 Romania 2 911 3 817 3 178 1 475 1 880 Slovakia 954 762 896 820 1 484 Slovenia 1 754 1 463 1 481 1 586 1 656 Spain 12 008 14 198 16 542 23 713 31 466 Sweden 9 451 14 980 10 729 6 815 10 717 Switzerland 492 210 181 111 111 Turkey 37 977 48 210 53 627 56 451 61 641 United Kingdom 1 294 45 327 19 739 (a)* 15 600 (a)* 12 100
Notes (a) BGS estimates, based on known exports from certain countries

226
Fluorspar
Fluorspar - EU36 trade in 2014
-100 -50 0 50 100 150 200 250 300
GermanyItaly
BelgiumTurkeySpain
NetherlandsFinlandFrance
Czech RepublicUnited Kingdom
SwedenPoland
DenmarkHungaryPortugal
AustriaRomaniaSloveniaGreece
SlovakiaLuxembourg
BulgariaLatvia
Thousand tonnes
Imports Exports

227
Gold
Gold
• Gold is a soft, malleable metallic element unaffected by air or most reagents. It is highly valued as an investment commodity, in jewellery and in specialist electronic applications.
• China was the world’s largest producer in 2014, with 15 per cent of the total world output. The second largest was Australia (nine per cent), followed Russia (eight per cent), USA (seven per cent), Canada, South Africa and Peru (five per cent each).
Rest of World 98.1%
Bulgaria 13.5%
Finland 13.8%Others 3.2%Serbia 2.0%
Spain 3.1%
Sweden 11.7%
Turkey 52.8%
EU36 1.9%
EU36 Mine production of gold 2014
Mine production of gold kilograms Country 2010 2011 2012 2013 2014
Bulgaria 4 489 5 302 7 058 7 385 7 899 Finland 5 896 6 674 9 100 8 660 8 085 Greece — — 26 823 552 Poland 500 400 469 431 226 Romania * 500 * 500 * 500 * 500 * 500 Serbia (a) 856 1 534 1 400 1 154 * 1 200 Slovakia 534 398 546 533 582 Spain — 529 1 529 1 994 1 800 Sweden 6 285 5 994 6 015 6 530 6 849 Turkey 16 890 24 000 29 390 33 980 31 000 United Kingdom 177 202 102 42 — EU36 total 36 000 46 000 56 000 62 000 59 000
Notes (1) In several countries substantial amounts of gold produced in small operations are not recorded in the official statistics used when
compiling this table (a) Metal production

228
Gold
0
10 000
20 000
30 000
40 000
50 000
60 000
70 000
2010 2011 2012 2013 2014
Kilo
gram
s (m
etal
con
tent
)
EU36 Mine production of gold 2010 - 14
Exports of gold kilograms Country 2010 2011 2012 2013 2014 Austria Metal 27 800 22 500 18 000 16 600 14 300 Waste and scrap 5 900 2 900 1 600 2 800 6 700 Belgium Metal 22 842 6 200 12 900 18 100 16 400 Waste and scrap 173 700 67 800 58 600 70 800 7 965 500 Croatia Metal 256 1 408 6 046 4 200 2 900 Waste and scrap ... ... ... 500 1 100 Cyprus Metal 300 600 1 200 1 300 2 000 Czech Republic Metal 12 000 21 400 5 300 82 100 7 600 Waste and scrap 4 400 2 700 11 700 1 500 4 400 Denmark Metal 761 1 224 1 556 5 560 1 000 Waste and scrap 500 1 800 3 000 1 300 300 Estonia Metal 400 2 300 1 600 2 300 1 500 Finland Metal 4 168 4 970 2 841 639 374 Waste and scrap 878 1 268 88 389 1 243 954 France Metal 27 729 45 303 54 233 41 186 29 815 Waste and scrap 24 189 29 961 10 955 9 694 9 628 Germany Metal 221 003 226 243 212 936 183 267 150 242 Waste and scrap 904 379 688 482 956 113 80 219 864 308 Greece Metal 48 2 455 1 426 2 600 200 Waste and scrap ... 12 300 9 300 24 800 66 100 Hungary Metal 1 827 2 214 2 529 2 535 900 Waste and scrap 2 221 600 2 665 300 2 115 900 11 900 17 200 Ireland, Republic of Waste and scrap 10 480 9 268 68 063 179 072 24 283 Italy Metal 109 762 176 952 200 363 138 471 103 143 Waste and scrap 154 845 1 006 7 001 10 283 3 990 Latvia Metal 81 344 850 1 286 6 630

229
Gold
Exports continued kilograms Country 2010 2011 2012 2013 2014 Luxembourg Metal 32 700 8 000 4 500 100 4 900 Malta Waste and scrap 17 008 27 387 ... ... ... Netherlands Metal 34 851 50 559 37 629 31 713 20 606 Waste and scrap 57 680 112 629 123 769 58 592 44 029 Norway Metal 4 567 7 439 8 498 4 912 3 828 Waste and scrap 1 482 1 904 4 261 1 027 427 Poland Metal 1 100 3 000 12 300 7 100 4 200 Waste and scrap 588 26 1 000 180 147 Portugal Metal 6 600 13 100 17 000 10 600 6 700 Waste and scrap 800 100 457 000 274 800 84 200 Slovakia Metal 2 926 20 000 3 300 267 600 886 700 Waste and scrap 7 300 6 800 4 800 6 500 200 Slovenia Waste and scrap 5 450 12 200 14 800 1 100 — Spain Metal 282 816 9 444 195 4 268 966 3 562 857 2 590 351 Waste and scrap 258 156 176 652 113 264 621 165 21 272 Sweden Metal 14 700 12 900 16 600 15 100 14 600 Waste and scrap 5 100 21 000 9 700 2 400 21 900 Switzerland Metal 1 605 359 1 867 822 1 627 583 2 853 431 1 824 340 Waste and scrap 105 407 94 837 71 297 162 383 154 409 Turkey Metal 56 035 30 226 282 160 71 980 78 083 Waste and scrap 619 1 360 ... 580 84 829 United Kingdom Metal 293 153 775 261 266 572 1 736 966 1 890 797 Waste and scrap 496 924 272 597 1 928 197 388 290 726 210
Notes (1) In this table the term 'metal' includes both unwrought and partly worked gold and alloys but excludes gold coin
Imports of gold kilograms Country 2010 2011 2012 2013 2014 Austria Metal 56 600 63 500 47 300 54 400 45 100 Waste and scrap 1 400 2 400 3 300 6 900 11 900 Belgium Metal 10 100 9 100 9 400 10 900 10 700 Waste and scrap (a) * 557 000 * 495 000 * 726 000 * 602 000 * 486 000 Bulgaria Metal 55 1 596 342 137 200 Czech Republic Metal 2 600 23 800 3 600 5 500 5 100 Waste and scrap 84 000 192 500 245 400 12 200 14 800 Denmark Metal 2 065 101 814 2 037 49 186 45 810 Estonia Metal 900 1 600 900 3 200 1 600 Finland Metal 650 595 1 358 905 975 France Metal 20 037 19 721 18 994 26 979 20 200 Waste and scrap 25 070 3 886 697 1 324 12 568

230
Gold
Imports continued kilograms Country 2010 2011 2012 2013 2014 Germany Metal 192 815 162 289 133 260 149 337 112 065 Waste and scrap 1 396 280 2 680 174 2 568 174 1 997 032 2 320 541 Greece Metal 1 055 500 346 12 373 6 793 Hungary Metal 396 1 512 * 1 500 1 898 788 Ireland, Republic of Metal £4 047 000 £5 356 000 £7 079 000 £11 757 000 £6 133 000 Italy Metal 149 022 175 415 195 214 175 188 145 409 Waste and scrap 649 1 223 5 075 4 360 2 137 Lithuania Waste and scrap — 64 453 12 202 — 15 800 Luxembourg Metal 42 136 184 535 83 757 36 175 1 000 Waste and scrap 1 69 10 114 6 014 Malta Metal 8 200 3 400 3 100 7 100 7 400 Netherlands Metal 37 888 38 349 35 027 38 821 19 861 Waste and scrap 110 465 188 490 117 52 603 308 Norway Metal 969 1 220 1 338 1 007 1 018 Waste and scrap 4 127 5 415 4 915 3 928 4 000 Poland Metal 200 1 500 1 800 1 900 1 200 Portugal Metal 1 500 1 200 800 700 1 500 Waste and scrap ... 49 685 18 835 19 509 55 945 Slovakia Metal 220 470 189 400 523 800 120 600 1 124 900 Slovenia Metal 1 100 1 700 1 100 800 300 Waste and scrap 5 400 5 600 1 800 2 300 1 300 Spain Metal 44 542 46 695 24 180 103 946 803 063 Waste and scrap 2 780 29 069 33 912 25 382 21 318 Sweden Metal £32 625 000 £42 028 000 £33 413 000 £38 738 665 £33 702 000 Waste and scrap £12 243 000 £33 337 000 £26 246 000 £1 074 504 £984 000 Switzerland Metal 2 343 070 2 684 244 2 280 215 3 092 010 2 242 812 Waste and scrap 219 260 205 846 28 550 14 390 19 450 Turkey Metal 64 105 128 367 157 629 350 563 192 182 United Kingdom Metal 800 602 1 012 882 1 052 573 334 032 496 597 Waste and scrap 65 833 71 449 164 833 101 612 72 150
Notes (1) In this table the term 'metal' includes both unwrought and partly worked gold but excludes gold coin (2) Kilograms have been used as the unit except where the only obtainable figure is the value. In these cases the national currency figure
has been converted to £sterling (3) See explanatory notes regarding currency conversion (a) BGS estimates, based on known exports from certain countries

231
Graphite
Graphite
• Graphite is a stable form of pure carbon. It is soft, has low friction and is inert. The major use of graphite is in refractories that can withstand the temperature of molten metals and slags. The graphite imparts high thermal shock resistance, useful in furnace components and crucibles. Other uses include lubricants and in brake linings.
• China was the world’s largest producer in 2014, with 86 per cent of the total world output. The second largest was India (five per cent) followed by Brazil (with four per cent).
Rest of World 98.2%
Austria 1.3%Germany 1.4%
Norway 22.0%
Turkey 75.3%
EU36 1.8%
EU36 Production of graphite 2014
Production of graphite tonnes Country 2010 2011 2012 2013 2014 Austria (a) 420 925 219 * 500 * 500 Germany — — 109 269 517 Norway 6 270 7 789 6 992 6 207 8 308 Romania 6 633 — — — — Turkey — 5 250 31 500 28 740 * 28 500 EU36 total 13 000 14 000 39 000 36 000 38 000 Notes (1) This table includes all forms of amorphous and crystalline graphite but excludes synthetic material (a) Crude
0
5 000
10 000
15 000
20 000
25 000
30 000
35 000
40 000
45 000
2010 2011 2012 2013 2014
Tonn
es
EU36 Production of graphite 2010 - 14

232
Graphite
Exports of graphite tonnes Country 2010 2011 2012 2013 2014 Austria 9 518 9 936 5 562 5 216 4 744 Belgium 993 1 316 1 716 1 366 1 658 Czech Republic 3 154 3 417 3 108 2 673 2 980 France 361 321 166 222 265 Germany 20 583 15 600 12 721 13 601 16 994 Italy 798 512 310 233 281 Netherlands 2 967 10 651 11 201 8 019 9 535 Poland 233 505 977 796 600 Slovenia 14 661 252 79 402 Spain 5 369 6 142 5 184 1 620 446 Sweden 254 129 129 114 192 Switzerland 326 100 96 85 100 Turkey 220 761 766 836 663 United Kingdom 2 981 3 660 2 196 2 011 1 608
Notes (1) This table excludes synthetic graphite
Imports of graphite tonnes Country 2010 2011 2012 2013 2014 Austria 18 501 21 867 9 272 10 843 17 738 Belgium 7 243 7 473 6 109 6 321 6 779 Czech Republic 3 605 5 149 4 757 5 588 4 965 Denmark 303 405 424 335 256 France 9 981 11 725 8 201 7 799 11 150 Germany 56 333 57 411 43 349 46 829 53 380 Greece 219 92 68 64 103 Italy 8 308 12 559 6 411 6 274 7 703 Latvia 1 1 3 813 4 3 Macedonia 875 911 648 764 678 Netherlands 16 692 14 266 13 498 11 342 13 371 Norway 400 129 124 45 28 Poland 6 933 10 267 6 833 7 317 7 742 Romania 204 742 601 182 210 Slovakia 1 899 1 688 1 847 1 741 2 402 Slovenia 303 232 206 202 219 Spain 34 268 10 765 5 579 4 736 4 828 Sweden 1 315 1 129 779 893 844 Switzerland 848 823 454 841 854 Turkey 11 191 13 138 8 171 11 776 8 796 United Kingdom 6 989 6 869 4 114 4 951 5 277
Notes (1) This table excludes synthetic graphite

233
Graphite Graphite - EU36 trade in 2014
-20 -10 0 10 20 30 40 50 60
GermanyAustria
NetherlandsFranceTurkeyPoland
ItalyBelgium
United KingdomCzech Republic
SpainSlovakia
SwitzerlandSweden
MacedoniaDenmarkSloveniaRomania
Thousand tonnes
Imports Exports

234
Gypsum
Gypsum
• Gypsum (calcium sulphate) is a common mineral that chiefly occurs as beds or seams in sedimentary rocks. Anhydrite is a similar mineral without combined water and is considered in the following tables with gypsum. Calcined gypsum is chiefly used to make building and decorative plaster. It is used as an additive to cement, in farming as a soil conditioner, as a filler and for a variety of uses in the chemical industry.
• The overall situation with gypsum is difficult to follow as large quantities of synthetic gypsum are made during the desulphurisation of coal-fired power station fumes and this competes with natural gypsum production.
• China was the world’s largest producer in 2014, with an estimated 21 per cent of the total world output. The second largest were Iran and USA (ten per cent each), followed by Thailand (eight per cent), Iraq and Turkey (with six per cent each).
Rest of World 79.7%
Austria 2.0%
France 5.3%
Germany 5.0%Greece 1.6%
Italy 23.9%
Others 6.0%
Poland 3.4%
Romania 2.3%
Spain 19.6%
Turkey 27.4%
United Kingdom 3.4%
EU36 20.3%
EU36 Production of gypsum 2014
Production of Gypsum tonnes Country 2010 2011 2012 2013 2014 Albania * 80 000 * 80 000 91 021 126 349 108 733 Austria (a) 872 273 815 438 791 961 635 299 729 892 Bulgaria 109 200 114 800 113 700 119 100 * 119 000 Croatia 248 675 231 008 182 557 114 450 120 055 Cyprus 333 000 335 000 327 800 315 000 347 600 Czech Republic 5 000 11 000 14 000 11 000 11 000 France (a) 2 065 814 2 452 204 2 314 788 2 189 971 1 907 768 Germany (a) 1 822 000 2 021 000 1 949 000 1 778 000 1 802 000 Greece (a) * 600 000 587 000 700 000 760 000 572 000 Hungary (a) 20 000 3 000 — — — Ireland, Republic of * 300 000 * 300 000 * 200 000 * 200 000 * 300 000 Italy (a) 4 441 109 3 642 897 3 200 920 3 192 186 8 551 200 Latvia (a) 176 510 215 950 252 714 272 340 * 280 000 Macedonia (a) 143 118 162 984 157 844 162 661 156 492 Norway (a)(b) 36 395 88 953 85 296 77 009 79 740 Poland (a) 1 241 200 1 418 300 1 395 400 1 270 100 1 231 900 Portugal 336 755 337 272 321 988 299 038 328 730 Romania 639 010 834 009 765 251 736 099 815 586 Slovakia (a) 87 000 88 000 88 000 60 000 65 000 Spain 6 990 249 7 825 747 6 359 923 7 388 699 * 7 000 000 Switzerland 335 000 300 000 297 000 284 000 242 000 Turkey 6 321 891 5 723 439 8 248 446 9 790 097 * 9 800 000 United Kingdom * 1 200 000 * 1 200 000 * 1 200 000 * 1 200 000 * 1 200 000 EU36 total 28 400 000 28 800 000 29 100 000 31 000 000 35 800 000
Notes (1) Some countries produce large quantities of synthetic gypsum. Where possible, this output is excluded from the table. (a) Including anhydrite (b) Sales

235
Gypsum
0
5 000
10 000
15 000
20 000
25 000
30 000
35 000
40 000
2010 2011 2012 2013 2014
Thou
sand
tonn
es
EU36 Production of gypsum 2010 - 14
Exports of Gypsum tonnes Country 2010 2011 2012 2013 2014 Albania Crude and calcined 1 955 791 2 019 7 439 ... Austria Crude 19 124 23 007 18 485 24 898 26 761 Calcined 55 927 76 548 79 280 75 787 76 479 Belgium Crude 92 533 101 382 72 899 81 189 84 022 Calcined 177 046 (a)* 195 000 (a)* 184 000 (a)* 187 000 (a)* 188 000 Bulgaria Crude and calcined 3 641 10 953 21 872 11 800 19 110 Cyprus Crude and calcined 250 034 248 284 249 250 248 863 297 086 Czech Republic Crude 48 605 103 363 63 751 70 706 88 861 Calcined 5 235 3 448 3 537 3 421 2 983 Denmark Crude 2 211 63 5 155 126 15 Calcined 8 299 6 725 13 990 1 748 1 603 Estonia Crude and calcined 87 105 1 781 1 282 956 France Crude 259 192 239 815 267 365 328 277 314 872 Calcined 286 799 310 248 289 668 242 886 270 093 Germany Crude 430 977 516 024 501 487 425 608 430 612 Calcined 1 558 288 1 333 953 1 444 714 1 156 749 1 162 927 Greece Crude 38 459 95 699 142 598 338 023 358 840 Calcined 337 621 3 750 3 415 1 844 Hungary Crude and calcined 17 367 44 845 59 059 27 914 33 284 Ireland, Republic of Crude 23 355 5 390 5 176 7 039 8 025 Calcined 15 129 21 274 16 585 16 699 18 723 Italy Crude 12 035 9 614 8 383 35 889 289 213 Calcined 18 484 39 465 79 661 84 696 186 856 Latvia Crude and calcined 38 596 47 016 84 358 97 074 92 767 Luxembourg Crude and calcined 1 596 1 919 1 698 1 594 606 Macedonia Crude and calcined 30 273 32 328 29 321 27 891 29 710
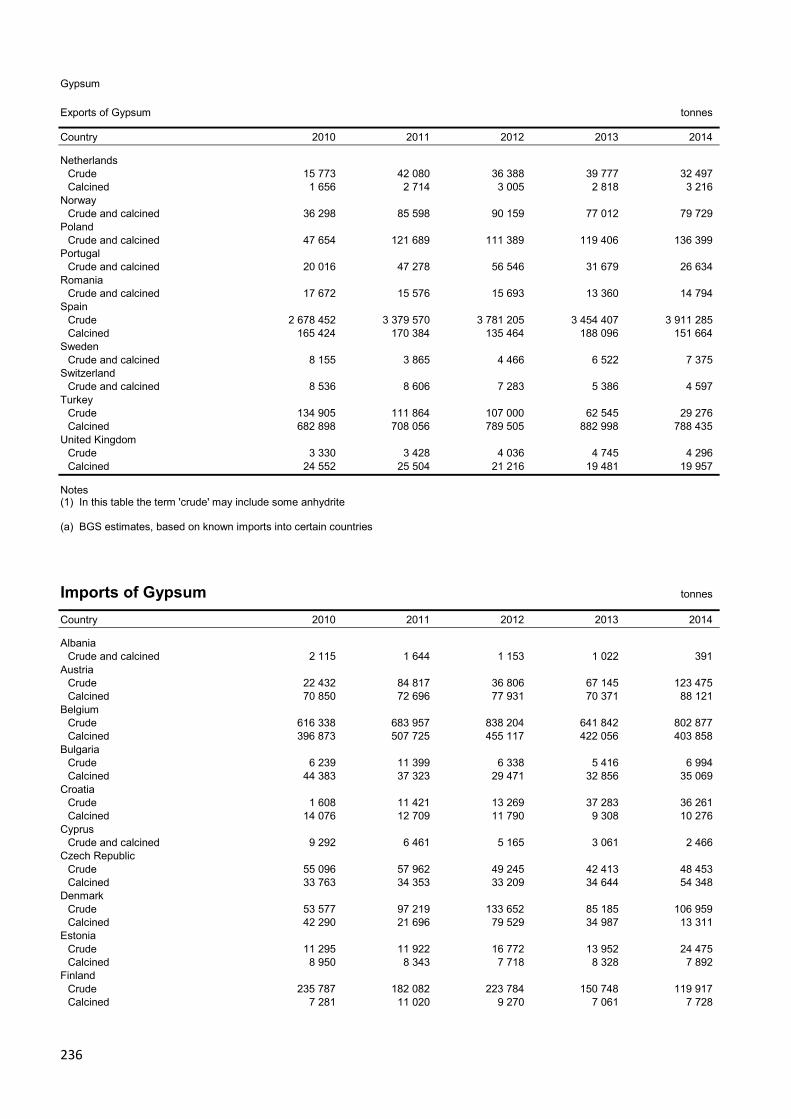
236
Gypsum
Exports of Gypsum tonnes Country 2010 2011 2012 2013 2014 Netherlands Crude 15 773 42 080 36 388 39 777 32 497 Calcined 1 656 2 714 3 005 2 818 3 216 Norway Crude and calcined 36 298 85 598 90 159 77 012 79 729 Poland Crude and calcined 47 654 121 689 111 389 119 406 136 399 Portugal Crude and calcined 20 016 47 278 56 546 31 679 26 634 Romania Crude and calcined 17 672 15 576 15 693 13 360 14 794 Spain Crude 2 678 452 3 379 570 3 781 205 3 454 407 3 911 285 Calcined 165 424 170 384 135 464 188 096 151 664 Sweden Crude and calcined 8 155 3 865 4 466 6 522 7 375 Switzerland Crude and calcined 8 536 8 606 7 283 5 386 4 597 Turkey Crude 134 905 111 864 107 000 62 545 29 276 Calcined 682 898 708 056 789 505 882 998 788 435 United Kingdom Crude 3 330 3 428 4 036 4 745 4 296 Calcined 24 552 25 504 21 216 19 481 19 957
Notes (1) In this table the term 'crude' may include some anhydrite (a) BGS estimates, based on known imports into certain countries
Imports of Gypsum tonnes Country 2010 2011 2012 2013 2014 Albania Crude and calcined 2 115 1 644 1 153 1 022 391 Austria Crude 22 432 84 817 36 806 67 145 123 475 Calcined 70 850 72 696 77 931 70 371 88 121 Belgium Crude 616 338 683 957 838 204 641 842 802 877 Calcined 396 873 507 725 455 117 422 056 403 858 Bulgaria Crude 6 239 11 399 6 338 5 416 6 994 Calcined 44 383 37 323 29 471 32 856 35 069 Croatia Crude 1 608 11 421 13 269 37 283 36 261 Calcined 14 076 12 709 11 790 9 308 10 276 Cyprus Crude and calcined 9 292 6 461 5 165 3 061 2 466 Czech Republic Crude 55 096 57 962 49 245 42 413 48 453 Calcined 33 763 34 353 33 209 34 644 54 348 Denmark Crude 53 577 97 219 133 652 85 185 106 959 Calcined 42 290 21 696 79 529 34 987 13 311 Estonia Crude 11 295 11 922 16 772 13 952 24 475 Calcined 8 950 8 343 7 718 8 328 7 892 Finland Crude 235 787 182 082 223 784 150 748 119 917 Calcined 7 281 11 020 9 270 7 061 7 728

237
Gypsum
Imports continued tonnes Country 2010 2011 2012 2013 2014 France Crude 313 842 249 933 283 071 367 325 320 671 Calcined 85 849 76 800 73 772 90 451 93 009 Germany Crude 29 132 26 182 21 712 16 062 19 377 Calcined 82 341 80 574 98 665 93 803 86 645 Greece Crude and calcined 1 759 1 400 3 714 4 576 6 799 Hungary Crude 5 362 5 198 5 241 3 608 2 777 Calcined 12 413 18 039 24 138 31 969 35 398 Iceland Crude and calcined 2 771 1 073 872 932 1 763 Ireland, Republic of Crude 20 637 2 731 10 715 10 688 38 603 Calcined 5 410 9 318 7 623 8 944 8 369 Italy Crude 3 618 2 205 8 793 1 980 1 264 Calcined 16 267 16 976 17 916 17 911 20 810 Latvia Crude 22 669 33 495 48 578 45 012 60 286 Calcined 2 027 2 787 2 523 1 918 3 153 Lithuania Crude 54 772 63 632 64 379 82 504 72 310 Calcined 17 377 18 503 19 211 19 504 25 502 Luxembourg Crude 50 104 69 918 63 994 61 079 63 371 Calcined 10 715 18 459 24 216 19 003 17 069 Malta Crude and calcined 10 446 11 428 12 507 6 191 7 526 Netherlands Crude 203 179 307 971 280 623 349 844 415 489 Calcined 368 523 611 145 570 600 504 609 192 705 Norway Crude 84 359 94 824 79 789 78 521 88 089 Calcined 270 721 275 909 299 898 264 601 277 549 Poland Crude 129 336 134 230 122 407 20 267 20 374 Calcined 53 613 47 261 39 845 43 204 50 895 Portugal Crude 73 822 40 153 28 175 44 712 34 852 Calcined 270 783 237 788 167 437 133 151 123 507 Romania Crude 40 703 63 658 92 883 54 106 53 982 Calcined 47 912 50 866 43 118 36 964 61 892 Serbia Crude 14 601 22 546 32 566 25 738 29 987 Calcined 9 276 9 962 9 096 7 441 8 292 Slovakia Crude 74 512 80 966 70 308 99 454 104 686 Calcined 16 732 17 194 17 335 15 319 14 021 Slovenia Crude and calcined 8 557 7 003 6 132 5 411 5 853 Spain Crude 20 776 13 207 11 943 5 398 11 959 Calcined 6 021 5 799 5 548 12 354 14 797 Sweden Crude 256 696 324 584 294 946 271 096 337 505 Calcined 73 865 58 751 48 111 60 279 64 079 Switzerland Crude 112 555 94 474 81 642 78 329 107 446 Calcined 100 958 104 574 113 112 116 822 128 964 Turkey Crude 232 713 375 169 295 462 347 834 310 438 Calcined 1 782 1 916 2 259 2 485 3 431

238
Gypsum
Imports continued tonnes Country 2010 2011 2012 2013 2014 United Kingdom Crude 216 605 539 327 490 661 376 972 516 377 Calcined 54 209 46 526 47 545 33 620 41 106
Notes (1) In this table the term 'crude' may include some anhydrite
Gypsum - EU36 trade in 2014
-4,500 -4,000 -3,500 -3,000 -2,500 -2,000 -1,500 -1,000 -500 0 500 1,000 1,500
BelgiumNetherlands
United KingdomFrance
SwedenNorwayTurkey
SwitzerlandAustria
PortugalFinland
DenmarkSlovakiaRomaniaGermany
Czech RepublicLithuania
LuxembourgPolandLatvia
Ireland, Republic ofCroatia
BulgariaSerbia
HungaryEstonia
SpainItaly
GreeceCyprus
Macedonia
Thousand tonnes
Imports Exports

239
Iodine
Iodine
• Iodine is a bluish-black lustrous, solid, non-metal with antiseptic and other medicinal properties, used in sanitation, animal feed and pharmaceutical products. It is also a catalyst.
• Chile was the world’s largest producer in 2014, with 61 per cent of the total world output. The second largest was Japan (30 per cent), followed by USA (four per cent), China and Turkmenistan (two per cent each).
Exports of iodine kilograms Country 2010 2011 2012 2013 2014 Austria 564 413 10 652 200 500 Belgium 3 989 500 3 584 800 3 391 900 4 457 300 5 356 700 Bulgaria 600 600 500 400 500 Cyprus ... ... ... ... 1 700 Czech Republic 1 000 2 000 4 000 5 300 1 400 Estonia ... ... ... 15 000 10 400 France 47 103 89 357 187 560 86 018 112 913 Germany 62 331 124 705 109 595 62 042 43 909 Hungary ... ... 92 300 40 900 — Ireland, Republic of — 2 589 — — — Italy 24 722 20 112 22 559 26 637 128 186 Latvia 4 200 — 7 400 — — Lithuania 4 8 900 3 000 6 900 800 Luxembourg 83 600 40 900 — — — Netherlands 124 797 152 295 122 569 502 562 704 006 Norway — 13 250 1 127 — — Poland 16 400 4 000 3 700 2 700 4 000 Portugal — 500 200 100 1 000 Spain 14 704 7 909 43 289 90 312 97 866 Sweden 700 900 7 900 (a)* 500 (a)* 600 Switzerland 349 239 238 17 244 1 952 Turkey 2 960 4 877 2 480 3 393 18 747 United Kingdom 393 005 234 182 370 132 190 878 304 611
Notes (a) BGS estimates, based on known imports into certain countries
Imports of iodine kilograms Country 2010 2011 2012 2013 2014 Austria 213 000 198 500 147 200 195 100 322 300 Belgium 4 087 700 3 814 500 4 663 100 4 773 300 5 909 800 Bulgaria 2 300 2 800 3 600 3 200 3 200 Croatia 204 233 195 400 900 Czech Republic 35 100 36 500 22 600 16 400 15 800 Denmark 10 168 5 895 8 447 11 900 14 100 Estonia 13 157 258 39 5 024 10 400 Finland 1 443 1 174 856 719 794 France 1 530 436 1 492 427 1 501 344 1 237 444 1 361 833 Germany 1 422 575 1 576 165 1 700 953 1 771 622 1 656 931 Greece 1 300 200 300 753 200 Hungary 2 700 6 100 4 000 8 000 12 600 Iceland 9 24 278 159 1 316 Ireland, Republic of 13 311 22 220 32 305 23 685 31 919 Italy 1 080 203 1 375 868 1 633 655 1 673 429 1 613 146 Latvia 140 272 252 708 19 Lithuania 17 732 20 100 3 200 2 000 400 Netherlands 16 031 1 352 421 811 065 1 174 000 947 209 Norway 1 708 338 1 663 657 1 759 025 2 035 784 2 057 520 Poland 21 700 11 600 12 900 21 800 9 200 Portugal 8 700 8 600 6 300 10 800 19 100 Romania 300 500 400 2 500 600

240
Iodine
Imports continued kilograms Country 2010 2011 2012 2013 2014 Serbia 8 137 10 876 2 790 748 1 171 Slovakia 325 500 300 500 400 Slovenia 45 35 111 3 529 65 Spain 342 914 522 768 357 482 534 309 461 345 Sweden 1 100 1 800 8 600 1 700 2 900 Switzerland 10 238 10 839 13 172 13 865 9 232 Turkey 3 218 6 641 6 163 4 423 5 561 United Kingdom 1 253 806 1 426 239 1 573 126 1 135 699 1 129 242

241
Iron Ore
Iron ore
• There are two main commercial ores of iron — magnetite and haematite (both iron oxides). Iron is also recovered from pyrites (FeS2). Iron ore is mined, processed and smelted chiefly to produce steel in integrated steel plants. Pig iron, for use as iron, is a minor part of production.
• China was the world’s largest producer in 2014, with 45 per cent of the total world output. The second largest was Australia (22 per cent), followed by Brazil (ten per cent), India (four per cent) and Russia (three per cent).
Rest of World 98.3%
Austria 4.3%
Germany 0.8%
Norway 18.5%
Sweden 62.9%
Turkey 13.5%
EU36 1.7%
EU36 Production of iron ore 2014
Production of iron ore tonnes Country 2010 2011 2012 2013 2014 Austria (a) 2 068 853 2 206 910 2 142 255 2 323 323 2 436 675 Germany (b)(c) 390 353 489 091 447 515 413 404 455 941 Norway 6 742 333 6 723 426 7 744 487 9 549 232 10 542 149 Sweden 28 797 000 30 840 000 32 198 000 37 411 000 35 759 000 Turkey 5 378 455 6 308 448 7 599 511 * 7 700 000 * 7 700 000 EU36 total 43 377 000 46 568 000 50 132 000 57 397 000 56 894 000
Notes (a) Including micaceous iron oxide (b) Including manganiferous iron ore (c) Used as aggregate in the construction industry
0
10 000
20 000
30 000
40 000
50 000
60 000
70 000
2010 2011 2012 2013 2014
Thou
sand
tonn
es
EU36 Production of iron ore 2010 - 14

242
Iron Ore
Exports of iron ore tonnes Country 2010 2011 2012 2013 2014 Albania 277 026 606 577 191 531 191 934 479 445 Belgium 366 331 455 069 76 216 7 694 1 918 Bulgaria 1 — 26 823 2 776 156 101 Czech Republic 8 984 1 097 1 796 12 210 Finland Iron ore 298 912 (a)* 700 000 (a)* 1 200 000 (a)* 1 700 000 (a)* 2 521 000 Burnt pyrites 391 549 (a)* 80 000 (a)* 30 000 (a)* 13 000 (a)* 56 000 France (b) 19 349 129 374 (b) 88 094 167 799 90 541 Germany Iron ore 22 373 54 555 42 763 50 451 113 172 Burnt pyrites 7 994 15 999 — — 5 Greece Burnt pyrites ... 6 559 — 10 180 2 678 Hungary 52 400 64 435 63 373 11 382 2 009 Italy (b) 8 779 6 742 14 191 18 697 2 510 Netherlands 121 426 208 469 49 903 241 379 140 232 Norway 1 803 242 2 435 415 3 659 210 3 567 408 4 016 143 Poland 16 130 4 400 1 573 29 699 97 832 Romania Iron ore 1 718 2 728 53 998 317 571 4 436 Burnt pyrites 1 359 1 690 2 887 10 757 17 177 Serbia Burnt pyrites 0 34 828 1 547 491 1 288 928 206 424 Slovakia 62 568 22 481 118 695 121 558 97 908 Spain (b) 9 079 165 589 184 056 270 073 60 022 Sweden 20 726 152 21 115 203 22 869 383 23 455 915 23 727 480 Turkey Iron ore 195 770 273 798 323 089 858 755 1 029 111 Burnt pyrites 4 830 22 752 100 447 96 577 45 670 United Kingdom (b) 5 256 179 709 108 415 71 811 3 860
Notes (a) BGS estimates, based on known imports into certain countries (b) Including burnt pyrites
Imports of iron ore tonnes Country 2010 2011 2012 2013 2014 Austria (a) 9 309 860 9 966 338 9 628 923 8 269 199 6 289 430 Belgium (a) 7 567 498 7 425 015 6 309 506 (a) 6 303 617 (a) 6 748 563 Bulgaria Iron ore 7 991 1 265 1 987 9 634 13 859 Burnt pyrites 16 653 16 679 11 794 4 344 3 046 Croatia (a) 20 125 2 123 (a) 2 764 1 924 1 822 Czech Republic (a) 5 902 011 (a) 7 363 983 (a) 5 870 744 (a) 6 268 042 6 303 298 Denmark (a) 39 494 49 605 49 005 39 879 28 723 Finland (a) 3 052 609 3 728 222 3 220 998 (a) 2 903 196 (a) 3 091 635 France Iron ore 15 259 049 13 531 471 13 718 095 15 344 995 17 106 178 Burnt pyrites 11 603 11 452 23 894 13 099 6 569 Germany Iron ore 43 082 309 41 678 285 38 908 327 40 322 561 43 039 944 Burnt pyrites 3 077 4 513 23 495 13 696 10 335 Hungary 1 985 510 1 780 865 (a) 1 632 969 (a) 845 366 1 267 611 Iceland 36 318 42 846 19 251 22 916 11 088 Italy 12 092 237 15 134 122 13 396 809 11 522 381 9 510 836 Latvia 1 (a) 7 422 (a) 3 797 (a) 7 149 (a) 11 848 Netherlands (a) 8 810 077 8 921 399 7 445 399 (a) 5 200 141 (a) 8 297 535 Norway 148 809 127 127 92 702 74 266 49 445 Poland 6 494 457 5 977 338 6 576 287 6 640 058 7 438 720 Romania Iron ore 2 848 921 2 186 674 2 023 063 2 545 657 2 225 618 Burnt pyrites 29 544 35 551 30 178 17 263 16 569

243
Iron ore
Imports continued tonnes Country 2010 2011 2012 2013 2014 Serbia 1 860 593 (a) 1 624 795 (a) 465 170 486 247 850 269 Slovakia 5 796 813 5 103 229 5 404 215 5 647 197 6 012 384 Spain (a) 5 873 927 5 143 562 4 475 772 6 260 115 5 699 476 Sweden Iron ore 55 078 51 334 44 285 26 028 26 374 Burnt pyrites 16 743 24 561 22 191 ... 4 014 Switzerland Iron ore 5 382 12 537 12 046 9 224 12 244 Burnt pyrites 15 171 14 916 13 386 10 991 8 162 Turkey 7 220 977 6 644 310 7 842 126 8 114 387 8 543 994 United Kingdom 10 597 085 (a) 9 175 852 (a) 10 062 323 (a) 14 137 160 (a) 14 469 169
Notes (a) Including burnt pyrites
Iron ore - EU36 trade in 2014
-30 -20 -10 0 10 20 30 40 50
GermanyFrance
United KingdomItaly
TurkeyNetherlands
PolandBelgium
Czech RepublicAustria
SlovakiaSpain
FinlandRomaniaHungary
SerbiaNorwaySwedenBulgariaAlbania
Million tonnes
Imports Exports
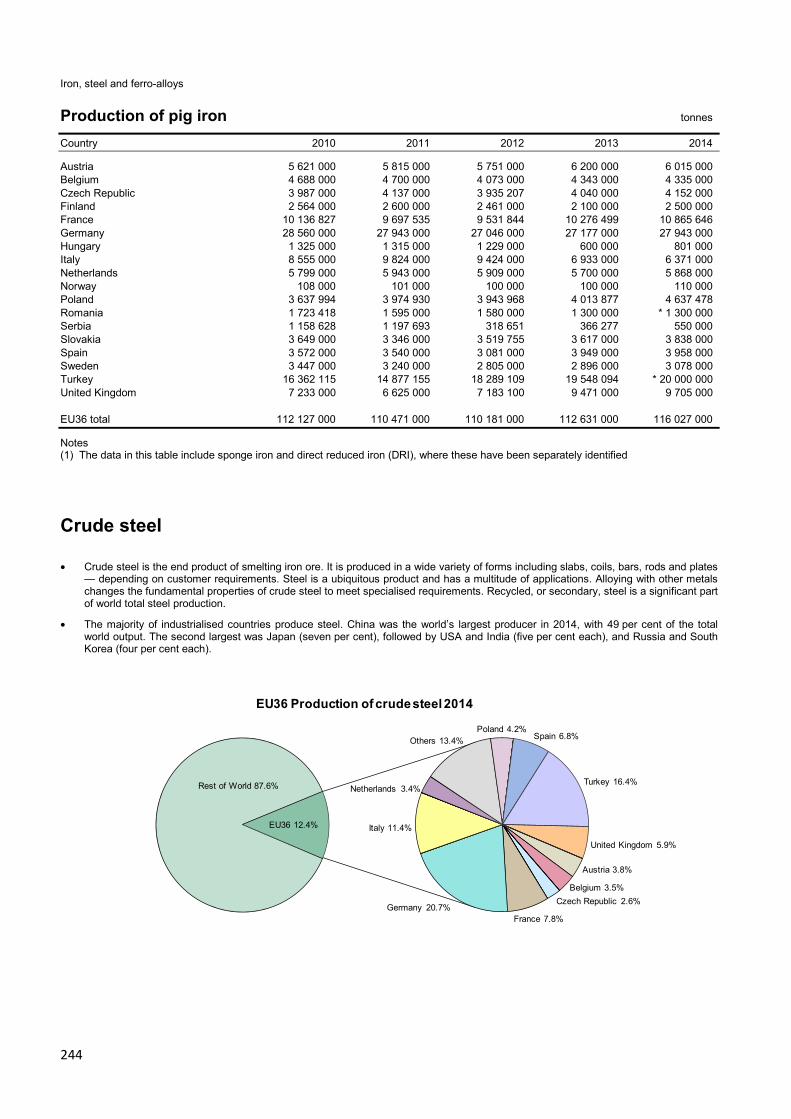
244
Iron, steel and ferro-alloys
Production of pig iron tonnes Country 2010 2011 2012 2013 2014 Austria 5 621 000 5 815 000 5 751 000 6 200 000 6 015 000 Belgium 4 688 000 4 700 000 4 073 000 4 343 000 4 335 000 Czech Republic 3 987 000 4 137 000 3 935 207 4 040 000 4 152 000 Finland 2 564 000 2 600 000 2 461 000 2 100 000 2 500 000 France 10 136 827 9 697 535 9 531 844 10 276 499 10 865 646 Germany 28 560 000 27 943 000 27 046 000 27 177 000 27 943 000 Hungary 1 325 000 1 315 000 1 229 000 600 000 801 000 Italy 8 555 000 9 824 000 9 424 000 6 933 000 6 371 000 Netherlands 5 799 000 5 943 000 5 909 000 5 700 000 5 868 000 Norway 108 000 101 000 100 000 100 000 110 000 Poland 3 637 994 3 974 930 3 943 968 4 013 877 4 637 478 Romania 1 723 418 1 595 000 1 580 000 1 300 000 * 1 300 000 Serbia 1 158 628 1 197 693 318 651 366 277 550 000 Slovakia 3 649 000 3 346 000 3 519 755 3 617 000 3 838 000 Spain 3 572 000 3 540 000 3 081 000 3 949 000 3 958 000 Sweden 3 447 000 3 240 000 2 805 000 2 896 000 3 078 000 Turkey 16 362 115 14 877 155 18 289 109 19 548 094 * 20 000 000 United Kingdom 7 233 000 6 625 000 7 183 100 9 471 000 9 705 000 EU36 total 112 127 000 110 471 000 110 181 000 112 631 000 116 027 000
Notes (1) The data in this table include sponge iron and direct reduced iron (DRI), where these have been separately identified
Crude steel
• Crude steel is the end product of smelting iron ore. It is produced in a wide variety of forms including slabs, coils, bars, rods and plates — depending on customer requirements. Steel is a ubiquitous product and has a multitude of applications. Alloying with other metals changes the fundamental properties of crude steel to meet specialised requirements. Recycled, or secondary, steel is a significant part of world total steel production.
• The majority of industrialised countries produce steel. China was the world’s largest producer in 2014, with 49 per cent of the total world output. The second largest was Japan (seven per cent), followed by USA and India (five per cent each), and Russia and South Korea (four per cent each).
Rest of World 87.6%
Austria 3.8%
Belgium 3.5%Czech Republic 2.6%
France 7.8%Germany 20.7%
Italy 11.4%
Netherlands 3.4%
Others 13.4%Poland 4.2%
Spain 6.8%
Turkey 16.4%
United Kingdom 5.9%
EU36 12.4%
EU36 Production of crude steel 2014
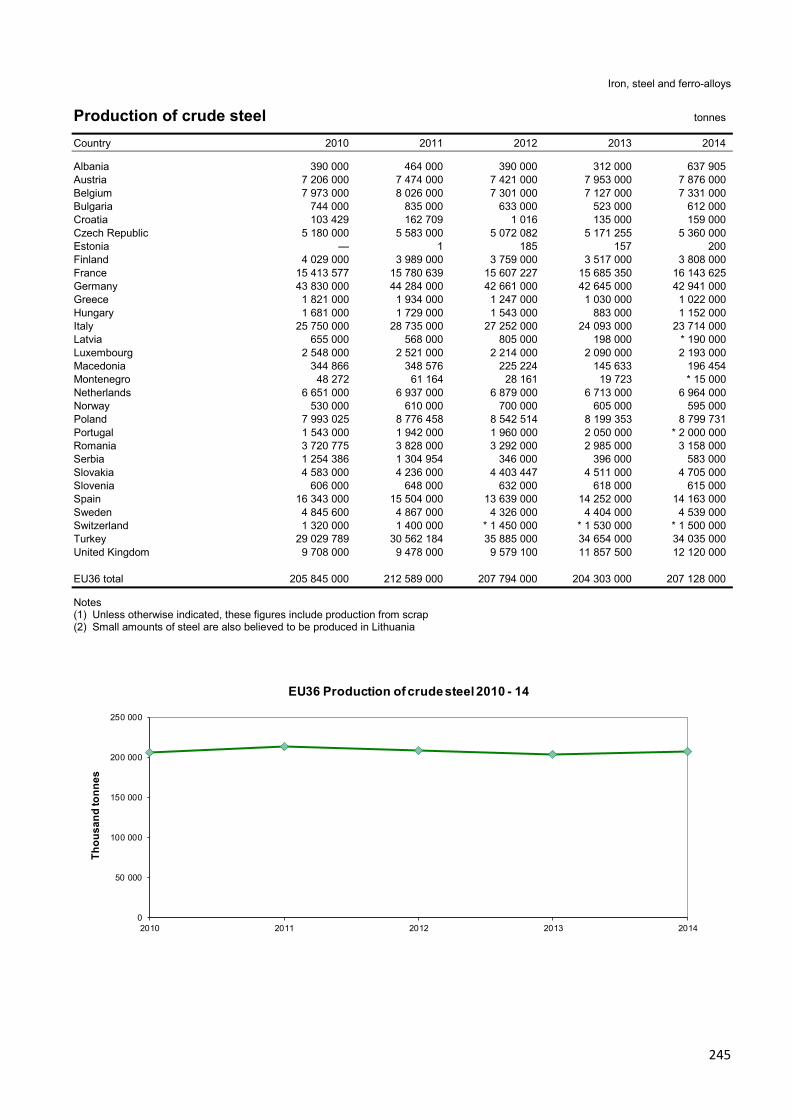
245
Iron, steel and ferro-alloys
Production of crude steel tonnes Country 2010 2011 2012 2013 2014 Albania 390 000 464 000 390 000 312 000 637 905 Austria 7 206 000 7 474 000 7 421 000 7 953 000 7 876 000 Belgium 7 973 000 8 026 000 7 301 000 7 127 000 7 331 000 Bulgaria 744 000 835 000 633 000 523 000 612 000 Croatia 103 429 162 709 1 016 135 000 159 000 Czech Republic 5 180 000 5 583 000 5 072 082 5 171 255 5 360 000 Estonia — 1 185 157 200 Finland 4 029 000 3 989 000 3 759 000 3 517 000 3 808 000 France 15 413 577 15 780 639 15 607 227 15 685 350 16 143 625 Germany 43 830 000 44 284 000 42 661 000 42 645 000 42 941 000 Greece 1 821 000 1 934 000 1 247 000 1 030 000 1 022 000 Hungary 1 681 000 1 729 000 1 543 000 883 000 1 152 000 Italy 25 750 000 28 735 000 27 252 000 24 093 000 23 714 000 Latvia 655 000 568 000 805 000 198 000 * 190 000 Luxembourg 2 548 000 2 521 000 2 214 000 2 090 000 2 193 000 Macedonia 344 866 348 576 225 224 145 633 196 454 Montenegro 48 272 61 164 28 161 19 723 * 15 000 Netherlands 6 651 000 6 937 000 6 879 000 6 713 000 6 964 000 Norway 530 000 610 000 700 000 605 000 595 000 Poland 7 993 025 8 776 458 8 542 514 8 199 353 8 799 731 Portugal 1 543 000 1 942 000 1 960 000 2 050 000 * 2 000 000 Romania 3 720 775 3 828 000 3 292 000 2 985 000 3 158 000 Serbia 1 254 386 1 304 954 346 000 396 000 583 000 Slovakia 4 583 000 4 236 000 4 403 447 4 511 000 4 705 000 Slovenia 606 000 648 000 632 000 618 000 615 000 Spain 16 343 000 15 504 000 13 639 000 14 252 000 14 163 000 Sweden 4 845 600 4 867 000 4 326 000 4 404 000 4 539 000 Switzerland 1 320 000 1 400 000 * 1 450 000 * 1 530 000 * 1 500 000 Turkey 29 029 789 30 562 184 35 885 000 34 654 000 34 035 000 United Kingdom 9 708 000 9 478 000 9 579 100 11 857 500 12 120 000 EU36 total 205 845 000 212 589 000 207 794 000 204 303 000 207 128 000
Notes (1) Unless otherwise indicated, these figures include production from scrap (2) Small amounts of steel are also believed to be produced in Lithuania
0
50 000
100 000
150 000
200 000
250 000
2010 2011 2012 2013 2014
Thou
sand
tonn
es
EU36 Production of crude steel 2010 - 14
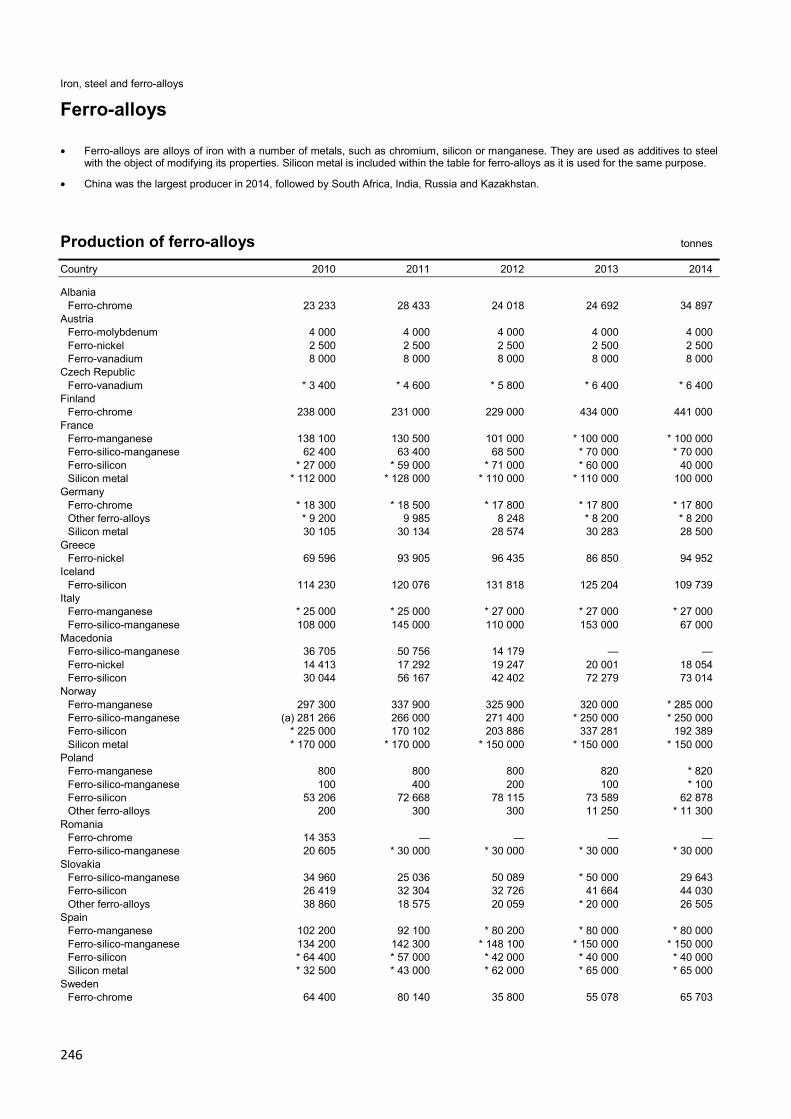
246
Iron, steel and ferro-alloys
Ferro-alloys
• Ferro-alloys are alloys of iron with a number of metals, such as chromium, silicon or manganese. They are used as additives to steel with the object of modifying its properties. Silicon metal is included within the table for ferro-alloys as it is used for the same purpose.
• China was the largest producer in 2014, followed by South Africa, India, Russia and Kazakhstan.
Production of ferro-alloys tonnes Country 2010 2011 2012 2013 2014 Albania Ferro-chrome 23 233 28 433 24 018 24 692 34 897 Austria Ferro-molybdenum 4 000 4 000 4 000 4 000 4 000 Ferro-nickel 2 500 2 500 2 500 2 500 2 500 Ferro-vanadium 8 000 8 000 8 000 8 000 8 000 Czech Republic Ferro-vanadium * 3 400 * 4 600 * 5 800 * 6 400 * 6 400 Finland Ferro-chrome 238 000 231 000 229 000 434 000 441 000 France Ferro-manganese 138 100 130 500 101 000 * 100 000 * 100 000 Ferro-silico-manganese 62 400 63 400 68 500 * 70 000 * 70 000 Ferro-silicon * 27 000 * 59 000 * 71 000 * 60 000 40 000 Silicon metal * 112 000 * 128 000 * 110 000 * 110 000 100 000 Germany Ferro-chrome * 18 300 * 18 500 * 17 800 * 17 800 * 17 800 Other ferro-alloys * 9 200 9 985 8 248 * 8 200 * 8 200 Silicon metal 30 105 30 134 28 574 30 283 28 500 Greece Ferro-nickel 69 596 93 905 96 435 86 850 94 952 Iceland Ferro-silicon 114 230 120 076 131 818 125 204 109 739 Italy Ferro-manganese * 25 000 * 25 000 * 27 000 * 27 000 * 27 000 Ferro-silico-manganese 108 000 145 000 110 000 153 000 67 000 Macedonia Ferro-silico-manganese 36 705 50 756 14 179 — — Ferro-nickel 14 413 17 292 19 247 20 001 18 054 Ferro-silicon 30 044 56 167 42 402 72 279 73 014 Norway Ferro-manganese 297 300 337 900 325 900 320 000 * 285 000 Ferro-silico-manganese (a) 281 266 266 000 271 400 * 250 000 * 250 000 Ferro-silicon * 225 000 170 102 203 886 337 281 192 389 Silicon metal * 170 000 * 170 000 * 150 000 * 150 000 * 150 000 Poland Ferro-manganese 800 800 800 820 * 820 Ferro-silico-manganese 100 400 200 100 * 100 Ferro-silicon 53 206 72 668 78 115 73 589 62 878 Other ferro-alloys 200 300 300 11 250 * 11 300 Romania Ferro-chrome 14 353 — — — — Ferro-silico-manganese 20 605 * 30 000 * 30 000 * 30 000 * 30 000 Slovakia Ferro-silico-manganese 34 960 25 036 50 089 * 50 000 29 643 Ferro-silicon 26 419 32 304 32 726 41 664 44 030 Other ferro-alloys 38 860 18 575 20 059 * 20 000 26 505 Spain Ferro-manganese 102 200 92 100 * 80 200 * 80 000 * 80 000 Ferro-silico-manganese 134 200 142 300 * 148 100 * 150 000 * 150 000 Ferro-silicon * 64 400 * 57 000 * 42 000 * 40 000 * 40 000 Silicon metal * 32 500 * 43 000 * 62 000 * 65 000 * 65 000 Sweden Ferro-chrome 64 400 80 140 35 800 55 078 65 703

247
Iron, steel and ferro-alloys
Production continued tonnes Country 2010 2011 2012 2013 2014 Turkey Ferro-chrome * 50 000 * 40 000 * 40 000 * 40 000 * 40 000 Ferro-silico-chrome * 3 000 * 3 000 * 3 000 * 3 000 * 3 000
Notes (a) Sales
Exports of iron, steel and ferro-alloys tonnes Country 2010 2011 2012 2013 2014 Albania Ferro-alloys 23 493 31 364 29 813 28 389 7 383 Ingots, blooms, billets 132 144 162 632 124 525 42 798 (a)* 103 700 Scrap 55 885 99 445 86 884 23 038 8 387 Austria Pig iron 4 476 3 74 776 1 989 Sponge and powder 1 195 653 49 019 46 756 10 889 Ferro-manganese 150 225 918 1 117 2 234 Ferro-silicon 538 1 233 663 1 227 830 Other ferro-alloys 1 930 232 710 182 19 Silicon metal 7 403 597 1 643 842 557 Ingots, blooms, billets 190 343 293 647 238 922 297 349 246 600 Scrap 1 034 398 950 865 1 008 503 963 641 1 055 948 Belgium Pig iron 254 854 255 067 232 381 218 946 171 376 Sponge and powder 35 395 10 029 14 734 22 163 19 703 Ferro-chrome 25 965 23 538 26 098 26 507 43 882 Ferro-silico-chrome 5 849 1 549 666 — 13 Ferro-manganese 26 544 41 161 43 319 30 129 15 544 Ferro-silico-manganese 48 652 47 762 10 280 4 867 2 927 Ferro-molybdenum 19 593 20 134 21 760 23 643 27 926 Ferro-nickel ... 775 675 57 122 Ferro-niobium ... 122 297 234 317 Ferro-phosphorus ... 117 211 632 1 091 Ferro-silicon 23 071 33 676 25 595 32 322 28 415 Ferro-titanium and ferro-silico-titanium ... 31 165 106 113 Ferro-tungsten and ferro-silico-tungsten ... 38 44 133 373 Ferro-vanadium ... 94 94 199 241 Other ferro-alloys 4 137 14 947 6 559 8 315 7 203 Silicon metal 8 522 8 396 2 327 2 127 1 910 Ingots, blooms, billets 487 535 484 510 336 540 288 335 211 596 Scrap 3 754 403 3 533 560 3 618 789 3 218 658 3 949 162 Bulgaria Pig iron 1 141 854 1 249 2 157 1 777 Ferro-manganese ... 85 153 969 537 Ferro-silico-manganese 19 1 136 761 1 717 Ferro-molybdenum ... — — 576 240 Ferro-silicon 980 248 1 563 1 463 1 679 Other ferro-alloys 2 115 227 754 1 652 110 Ingots, blooms, billets 30 327 24 822 14 564 11 786 6 658 Scrap 949 000 850 898 730 749 610 990 398 988 Croatia Ferro-alloys 6 526 5 254 2 368 73 131 Silicon metal 1 ... 6 3 912 5 055 Ingots, blooms, billets 2 495 30 004 4 041 78 244 117 777 Scrap 357 015 517 438 516 600 349 730 350 706 Cyprus Scrap 96 654 138 529 136 351 103 981 78 944

248
Iron, steel and ferro-alloys
Exports continued tonnes Country 2010 2011 2012 2013 2014 Czech Republic Pig iron 65 473 45 677 82 769 82 515 42 910 Sponge and powder ... 163 46 932 1 132 Ferro-chrome ... 2 346 2 329 2 688 2 130 Ferro-manganese ... 1 704 1 776 2 107 1 780 Ferro-silico-manganese ... 1 754 2 819 4 676 2 188 Ferro-molybdenum ... 549 1 870 2 658 223 Ferro-phosphorus ... 40 10 92 168 Ferro-silicon 9 806 7 354 7 571 10 533 5 939 Ferro-vanadium 3 440 4 603 5 737 6 368 6 013 Other ferro-alloys 23 873 339 507 766 371 Ingots, blooms, billets 320 821 356 146 292 066 259 268 283 542 Scrap 1 814 398 2 011 915 2 042 131 1 908 593 2 061 990 Denmark Pig iron 239 1 102 1 681 674 579 Ferro-silicon 77 164 1 043 602 197 Other ferro-alloys 54 43 48 52 146 Ingots, blooms, billets 19 143 21 926 21 050 21 075 16 654 Scrap 1 596 485 1 554 808 1 359 467 1 245 646 1 690 566 Estonia Ferro-manganese ... ... 36 45 108 Ferro-titanium and ferro-silico-titanium ... ... 502 1 641 7 480 Other ferro-alloys 124 142 474 489 270 Scrap 512 766 563 124 631 831 517 330 424 235 Finland Pig iron 2 564 373 14 459 5 780 163 Ferro-chrome 126 713 97 322 104 829 283 425 270 570 Other ferro-alloys 560 211 217 202 171 Ingots, blooms, billets 263 863 219 129 127 904 49 814 75 696 Scrap 229 680 341 937 361 107 402 310 405 112 France Pig iron 52 439 53 736 44 010 42 234 35 485 Sponge and powder 18 917 20 857 9 484 7 372 18 140 Ferro-chrome 2 447 2 035 2 837 1 995 2 056 Ferro-silico-magnesium 1 259 1 222 2 381 1 485 1 261 Ferro-manganese 2 200 2 554 1 704 782 350 Ferro-silico-manganese 51 330 54 023 51 068 79 510 104 825 Ferro-molybdenum 548 802 972 724 705 Ferro-nickel 6 104 1 042 787 59 40 Ferro-niobium 505 220 186 186 739 Ferro-silicon 77 144 84 879 74 961 75 639 68 903 Ferro-titanium and ferro-silico-titanium 1 869 1 985 1 660 1 744 2 209 Other ferro-alloys 37 932 33 076 45 776 39 004 30 344 Silicon metal 261 298 85 65 234 Ingots, blooms, billets 1 858 111 2 088 739 2 232 987 1 141 631 1 233 421 Scrap 6 665 264 6 240 254 6 233 179 6 174 335 6 307 971 Germany Pig iron 180 542 183 310 171 347 149 745 122 568 Sponge and powder 56 763 43 160 35 370 35 330 38 850 Ferro-chrome 54 956 45 048 32 760 28 644 44 309 Ferro-silico-magnesium 1 718 2 355 2 062 2 981 1 762 Ferro-manganese 12 387 22 690 11 811 11 501 12 016 Ferro-silico-manganese 3 377 17 756 12 006 16 084 16 276 Ferro-molybdenum 3 174 4 440 2 815 3 438 3 808 Ferro-nickel 7 869 5 775 391 1 146 119 Ferro-niobium 538 237 228 283 342 Ferro-phosphorus 1 452 1 233 1 250 1 449 1 619 Ferro-silicon 95 683 81 464 67 351 65 014 75 122 Ferro-titanium and ferro-silico-titanium 4 180 5 350 4 687 4 010 3 739 Ferro-tungsten and ferro-silico-tungsten 640 402 417 381 320 Ferro-vanadium 659 391 226 389 550 Other ferro-alloys 10 799 8 722 3 952 5 080 5 165 Silicon metal 29 309 33 077 49 693 58 466 72 954 Ingots, blooms, billets 2 150 091 2 150 120 1 712 813 1 844 387 1 945 249 Scrap 9 175 802 9 859 197 9 658 280 9 146 441 9 291 270

249
Iron, steel and ferro-alloys
Exports continued tonnes Country 2010 2011 2012 2013 2014 Greece Pig iron 2 009 2 650 2 ... 2 820 Ferro-alloys 999 294 11 299 4 816 276 Ingots, blooms, billets 143 318 139 537 64 523 44 379 51 214 Scrap 66 989 59 592 57 511 70 956 62 938 Hungary Ferro-alloys 104 207 272 112 140 Silicon metal ... 4 317 2 887 1 809 5 Ingots, blooms, billets 9 274 44 796 7 260 14 694 24 832 Scrap 1 132 142 1 272 473 1 171 610 1 109 969 1 050 496 Iceland Ferro-silicon 114 231 120 076 131 818 125 204 112 657 Other ferro-alloys 5 603 6 0 0 0 Ingots, blooms, billets ... 0 1 1 4 485 Scrap 37 328 38 954 28 581 40 564 48 112 Ireland, Republic of Sponge and powder ... 18 709 150 1 268 653 Ingots, blooms, billets 262 9 240 510 425 887 Scrap 484 871 609 985 517 800 447 391 447 669 Italy Pig iron 38 026 22 412 51 911 39 597 49 144 Sponge and powder 729 1 534 3 904 3 571 6 151 Ferro-chrome 5 020 5 639 3 399 4 180 5 291 Ferro-silico-chrome 48 57 — — 122 Ferro-silico-magnesium 33 27 114 527 92 Ferro-manganese 9 186 9 761 11 603 8 233 9 372 Ferro-silico-manganese 4 316 3 890 15 215 15 371 20 285 Ferro-molybdenum 149 41 1 048 368 607 Ferro-nickel 176 215 52 186 285 Ferro-silicon 6 329 8 642 7 741 10 028 10 964 Ferro-vanadium 6 124 324 78 335 Other ferro-alloys 809 770 644 923 748 Silicon metal 3 284 4 293 1 621 1 246 2 902 Ingots, blooms, billets 909 562 908 493 831 477 702 422 653 960 Scrap 422 731 317 626 324 451 253 587 268 714 Latvia Ferro-chrome 4 051 9 502 30 189 13 006 10 095 Ferro-silico-chrome ... ... 233 121 6 849 Ferro-manganese 794 1 132 515 679 44 Ferro-silico-manganese 6 247 16 563 20 152 11 513 7 636 Ferro-silicon 11 029 23 706 13 874 26 207 20 202 Ingots, blooms, billets 2 442 5 045 72 535 32 687 629 Scrap 396 794 563 192 507 285 468 154 477 810 Lithuania Ferro-nickel ... ... 1 336 635 1 044 Other ferro-alloys 104 141 1 944 600 163 Scrap 595 721 664 225 562 585 493 483 576 123 Luxembourg Ingots, blooms, billets 10 953 37 393 27 521 26 104 15 018 Scrap 165 832 133 133 102 625 127 509 98 166 Macedonia Ferro-manganese 50 4 209 21 57 Ferro-silico-manganese 31 344 46 254 22 482 441 4 Ferro-nickel 67 384 77 107 89 302 94 714 83 915 Ferro-silicon 19 491 52 684 41 131 71 956 78 486 Scrap 71 830 83 784 88 861 75 972 61 124 Malta Scrap 29 498 38 408 34 244 28 134 48 856 Montenegro Ingots, blooms, billets 18 775 6 866 9 199 3 540 716 Scrap 28 570 55 204 43 998 56 423 51 429

250
Iron, steel and ferro-alloys
Exports continued tonnes Country 2010 2011 2012 2013 2014 Netherlands Pig iron 111 189 133 861 184 975 78 365 105 754 Sponge and powder 359 625 745 26 189 37 091 Ferro-chrome 170 489 242 310 232 408 168 967 227 443 Ferro-silico-chrome 448 14 816 31 811 6 589 9 567 Ferro-manganese 35 353 66 053 57 013 88 182 78 639 Ferro-silico-manganese 66 085 62 737 99 228 124 570 127 457 Ferro-molybdenum 6 462 6 544 8 031 8 399 5 929 Ferro-nickel 6 264 7 514 10 306 23 130 40 420 Ferro-niobium 1 175 2 070 1 280 1 941 1 909 Ferro-silicon 219 244 238 469 226 217 112 552 143 357 Ferro-titanium and ferro-silico-titanium 10 510 13 620 10 357 11 011 14 667 Ferro-tungsten and ferro-silico-tungsten 727 1 155 990 1 663 1 436 Ferro-vanadium 1 909 2 343 1 772 1 525 3 156 Other ferro-alloys 50 903 16 535 15 559 7 145 10 167 Silicon metal 69 896 65 055 86 097 47 748 51 298 Ingots, blooms, billets 849 018 1 553 519 1 601 063 702 912 624 693 Scrap 5 541 773 5 692 223 5 635 229 5 517 477 5 295 208 Norway Pig iron (a) * 118 000 * 110 000 * 91 000 * 118 000 * 126 000 Sponge and powder 678 169 1 269 3 722 3 986 Ferro-chrome (a) * 30 * 65 * 90 * 89 * 62 Ferro-manganese (a) * 332 000 * 379 000 * 370 000 * 825 000 * 332 000 Ferro-silico-manganese 245 095 246 808 277 070 279 907 302 037 Ferro-silicon 214 643 246 711 244 224 246 718 268 911 Other ferro-alloys 2 479 47 9 20 74 Silicon metal 162 649 154 191 161 468 174 217 191 221 Ingots, blooms, billets 64 474 92 475 163 423 87 907 54 323 Scrap 337 675 289 943 345 558 365 332 422 776 Poland Pig iron 17 340 21 122 79 889 49 925 83 488 Sponge and powder 5 293 16 519 7 185 7 040 6 990 Ferro-chrome 668 309 505 648 1 396 Ferro-silico-chrome 81 95 — 7 558 28 705 Ferro-manganese and ferro-silico-manganese 10 113 3 284 5 844 44 294 58 249 Ferro-molybdenum 991 3 379 2 605 3 550 205 Ferro-silicon 59 845 76 121 72 741 83 700 68 970 Ferro-vanadium 457 146 266 333 387 Other ferro-alloys 5 255 4 206 1 548 2 998 1 726 Silicon metal 845 1 390 1 674 2 161 1 425 Ingots, blooms, billets 490 919 846 908 618 682 360 816 715 244 Scrap 1 334 069 1 838 699 1 955 438 1 946 832 2 041 162 Portugal Pig iron 18 502 21 606 18 330 17 431 37 707 Ferro-alloys 1 746 2 392 793 443 352 Ingots, blooms, billets 172 983 119 353 54 844 71 231 146 809 Scrap 303 013 239 842 236 115 246 687 214 984 Romania Sponge and powder 24 454 29 320 25 038 24 992 27 736 Ferro-chrome 14 234 10 996 8 577 1 715 1 209 Ferro-manganese 45 26 195 92 18 Ferro-silico-manganese 19 087 34 387 4 171 14 170 7 477 Ferro-molybdenum 179 73 1 655 703 1 590 Ferro-niobium 53 66 136 217 56 Ferro-silicon 24 0 — 45 167 Other ferro-alloys 44 28 61 52 27 Ingots, blooms, billets 196 302 267 543 199 986 156 285 186 585 Scrap 2 519 237 2 348 565 1 908 069 1 947 543 1 430 949 Serbia Pig iron 70 090 46 629 374 860 910 ... Ingots, blooms, billets 20 547 111 080 187 578 266 510 266 038 Scrap 416 713 357 778 372 846 330 259 266 550

251
Iron, steel and ferro-alloys
Exports continued tonnes Country 2010 2011 2012 2013 2014 Slovakia Pig iron 70 588 26 976 29 527 42 978 18 683 Ferro-chrome 10 029 11 189 12 893 10 802 9 185 Ferro-manganese 14 032 10 229 4 308 13 223 14 904 Ferro-silico-manganese 35 764 28 660 44 202 41 345 44 048 Ferro-molybdenum 78 2 416 172 98 24 Ferro-niobium 95 46 10 319 289 Ferro-silicon 19 656 31 004 26 389 39 296 42 123 Other ferro-alloys 3 295 3 180 4 930 6 277 8 190 Ingots, blooms, billets 631 135 221 697 413 032 128 932 306 932 Scrap 556 952 651 135 430 539 360 818 510 907 Slovenia Pig iron 10 507 21 823 19 227 10 834 12 799 Ferro-chrome 5 320 4 757 12 373 14 421 6 900 Ferro-silico-magnesium 2 139 2 002 2 197 2 842 4 082 Ferro-manganese 1 769 1 317 3 076 5 676 3 974 Ferro-silico-manganese 5 959 4 268 3 281 1 200 2 467 Ferro-phosphorus 464 569 639 600 693 Ferro-silicon 7 280 13 397 9 241 5 150 5 471 Ferro-titanium and ferro-silico-titanium 124 123 53 46 123 Other ferro-alloys 1 611 1 983 2 357 2 230 4 594 Silicon metal 5 568 4 753 764 1 303 6 181 Ingots, blooms, billets 17 320 39 269 33 034 36 092 46 103 Scrap 343 716 409 401 417 264 395 560 419 844 Spain Pig iron 2 998 7 023 11 831 17 049 9 620 Sponge and powder 2 658 3 233 3 000 3 659 5 565 Ferro-chrome 1 025 1 181 1 359 2 224 1 616 Ferro-silico-chrome 239 236 ... ... 323 Ferro-silico-magnesium 57 514 569 2 835 784 Ferro-manganese 52 296 37 866 42 486 71 628 83 903 Ferro-silico-manganese 58 097 65 469 66 101 58 380 45 196 Ferro-molybdenum 359 7 55 22 129 Ferro-nickel 4 2 47 28 2 272 Ferro-niobium 380 518 336 88 235 Ferro-phosphorus 57 167 250 391 294 Ferro-silicon 12 854 12 952 20 235 17 571 21 927 Ferro-titanium and ferro-silico-titanium 18 12 56 190 152 Other ferro-alloys 1 436 877 643 797 1 253 Silicon metal 18 463 21 864 20 690 19 644 15 884 Ingots, blooms, billets 337 566 194 482 134 781 253 033 113 488 Scrap 277 401 431 394 737 203 567 955 626 637 Sweden Pig iron 146 027 133 387 109 644 34 960 66 844 Sponge and powder 12 335 313 081 297 427 293 451 302 616 Ferro-chrome 51 010 2 752 2 525 37 393 43 515 Ferro-manganese and ferro-silico-manganese 3 517 3 581 2 835 2 395 2 826 Ferro-molybdenum 340 375 294 253 276 Ferro-niobium 475 622 771 743 1 062 Ferro-phosphorus 582 448 479 497 535 Ferro-silicon 6 905 6 903 15 630 20 102 12 954 Ferro-tungsten and ferro-silico-tungsten 5 25 165 403 219 Other ferro-alloys 68 75 78 56 162 Silicon metal 2 337 1 274 1 206 1 409 2 013 Ingots, blooms, billets 261 273 235 814 450 860 415 798 256 503 Scrap 1 352 399 1 484 197 1 543 542 1 317 282 1 490 281 Switzerland Sponge and powder 2 191 981 1 013 908 184 Ferro-alloys 1 191 1 299 848 1 026 874 Ingots, blooms, billets 66 642 85 201 70 375 74 934 74 578 Scrap 623 910 630 837 626 757 714 655 633 366

252
Iron, steel and ferro-alloys
Exports continued tonnes Country 2010 2011 2012 2013 2014 Turkey Pig iron 8 028 9 357 7 723 6 240 4 640 Sponge and powder 1 326 7 581 1 422 3 174 599 Ferro-chrome 74 570 76 255 75 555 104 259 103 552 Ferro-silico-chrome 4 3 994 593 1 512 150 Ferro-manganese 4 410 3 536 2 003 2 249 1 842 Ferro-silico-manganese 2 362 2 172 1 237 1 472 1 131 Ferro-silicon 4 619 5 807 2 653 2 676 3 987 Other ferro-alloys 203 892 202 408 201 Ingots, blooms, billets 3 716 586 2 459 563 2 985 209 1 566 856 603 113 Scrap 94 498 105 914 95 152 101 685 168 061 United Kingdom Pig iron 4 339 2 074 3 775 1 652 1 758 Sponge and powder 2 938 3 775 4 585 4 858 4 067 Ferro-alloys 45 314 43 918 49 357 47 949 47 413 Ferro-chrome 2 403 1 853 2 288 2 108 3 537 Ferro-silico-chrome 22 364 72 168 362 Ferro-silico-magnesium 366 338 327 240 119 Ferro-manganese 8 361 819 658 407 2 721 Ferro-silico-manganese 52 132 7 503 3 626 791 Ferro-molybdenum 11 248 12 948 12 421 11 922 12 491 Ferro-nickel 15 49 539 183 68 Ferro-niobium 224 179 257 162 195 Ferro-phosphorus 667 766 562 558 336 Ferro-silicon 2 958 6 594 4 659 5 109 3 400 Ferro-titanium and ferro-silico-titanium 15 197 17 662 18 040 22 652 22 831 Other ferro-alloys 3 802 2 213 2 030 814 562 Silicon metal 2 901 3 662 3 027 4 979 5 422 Ingots, blooms, billets 1 137 160 668 885 1 817 820 3 164 861 3 197 397 Scrap 7 507 853 7 744 411 7 160 639 6 777 534 6 934 918
Notes (1) In this table the term 'ingots, blooms, billets' corresponds to items 7206, 7207, 7218 and 7224 of the Harmonised System which
includes those of alloy and high carbon steel (2) In this table "ferro-silico-magnesium" includes both HS codes 7207 9930 and 7202 9980 even though the description appears to have
changed (a) BGS estimates, based on known imports into certain countries
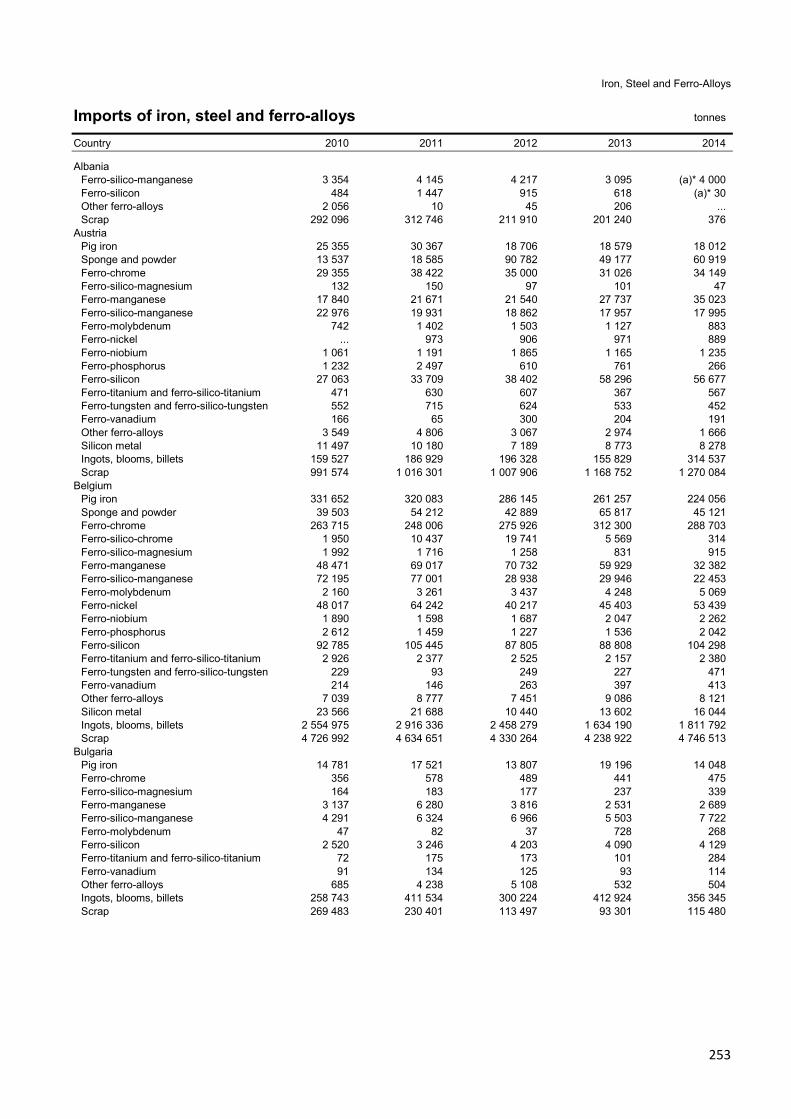
253
Iron, Steel and Ferro-Alloys
Imports of iron, steel and ferro-alloys tonnes Country 2010 2011 2012 2013 2014 Albania Ferro-silico-manganese 3 354 4 145 4 217 3 095 (a)* 4 000 Ferro-silicon 484 1 447 915 618 (a)* 30 Other ferro-alloys 2 056 10 45 206 ... Scrap 292 096 312 746 211 910 201 240 376 Austria Pig iron 25 355 30 367 18 706 18 579 18 012 Sponge and powder 13 537 18 585 90 782 49 177 60 919 Ferro-chrome 29 355 38 422 35 000 31 026 34 149 Ferro-silico-magnesium 132 150 97 101 47 Ferro-manganese 17 840 21 671 21 540 27 737 35 023 Ferro-silico-manganese 22 976 19 931 18 862 17 957 17 995 Ferro-molybdenum 742 1 402 1 503 1 127 883 Ferro-nickel ... 973 906 971 889 Ferro-niobium 1 061 1 191 1 865 1 165 1 235 Ferro-phosphorus 1 232 2 497 610 761 266 Ferro-silicon 27 063 33 709 38 402 58 296 56 677 Ferro-titanium and ferro-silico-titanium 471 630 607 367 567 Ferro-tungsten and ferro-silico-tungsten 552 715 624 533 452 Ferro-vanadium 166 65 300 204 191 Other ferro-alloys 3 549 4 806 3 067 2 974 1 666 Silicon metal 11 497 10 180 7 189 8 773 8 278 Ingots, blooms, billets 159 527 186 929 196 328 155 829 314 537 Scrap 991 574 1 016 301 1 007 906 1 168 752 1 270 084 Belgium Pig iron 331 652 320 083 286 145 261 257 224 056 Sponge and powder 39 503 54 212 42 889 65 817 45 121 Ferro-chrome 263 715 248 006 275 926 312 300 288 703 Ferro-silico-chrome 1 950 10 437 19 741 5 569 314 Ferro-silico-magnesium 1 992 1 716 1 258 831 915 Ferro-manganese 48 471 69 017 70 732 59 929 32 382 Ferro-silico-manganese 72 195 77 001 28 938 29 946 22 453 Ferro-molybdenum 2 160 3 261 3 437 4 248 5 069 Ferro-nickel 48 017 64 242 40 217 45 403 53 439 Ferro-niobium 1 890 1 598 1 687 2 047 2 262 Ferro-phosphorus 2 612 1 459 1 227 1 536 2 042 Ferro-silicon 92 785 105 445 87 805 88 808 104 298 Ferro-titanium and ferro-silico-titanium 2 926 2 377 2 525 2 157 2 380 Ferro-tungsten and ferro-silico-tungsten 229 93 249 227 471 Ferro-vanadium 214 146 263 397 413 Other ferro-alloys 7 039 8 777 7 451 9 086 8 121 Silicon metal 23 566 21 688 10 440 13 602 16 044 Ingots, blooms, billets 2 554 975 2 916 336 2 458 279 1 634 190 1 811 792 Scrap 4 726 992 4 634 651 4 330 264 4 238 922 4 746 513 Bulgaria Pig iron 14 781 17 521 13 807 19 196 14 048 Ferro-chrome 356 578 489 441 475 Ferro-silico-magnesium 164 183 177 237 339 Ferro-manganese 3 137 6 280 3 816 2 531 2 689 Ferro-silico-manganese 4 291 6 324 6 966 5 503 7 722 Ferro-molybdenum 47 82 37 728 268 Ferro-silicon 2 520 3 246 4 203 4 090 4 129 Ferro-titanium and ferro-silico-titanium 72 175 173 101 284 Ferro-vanadium 91 134 125 93 114 Other ferro-alloys 685 4 238 5 108 532 504 Ingots, blooms, billets 258 743 411 534 300 224 412 924 356 345 Scrap 269 483 230 401 113 497 93 301 115 480

254
Iron, Steel and Ferro-Alloys
Imports continued tonnes Country 2010 2011 2012 2013 2014 Croatia Pig iron 10 343 14 072 12 353 13 950 12 973 Ferro-chrome 54 61 46 25 544 Ferro-manganese 135 546 59 361 1 027 Ferro-silico-manganese 2 005 743 56 927 1 003 Ferro-phosphorus 168 196 192 184 164 Ferro-silicon 1 416 878 828 1 055 862 Other ferro-alloys 441 262 234 26 137 Silicon metal 95 208 347 16 466 2 295 Ingots, blooms, billets 6 514 1 943 14 199 2 139 2 142 Scrap 30 395 44 335 4 875 43 945 91 041 Czech Republic Pig iron 54 625 76 416 67 036 65 101 71 319 Sponge and powder 15 391 24 059 18 754 13 440 11 099 Ferro-chrome 16 962 10 933 9 658 18 172 19 509 Ferro-silico-magnesium 820 1 061 699 530 596 Ferro-manganese 26 204 25 281 24 826 22 787 26 649 Ferro-silico-manganese 40 732 41 411 39 572 45 720 45 457 Ferro-molybdenum 1 868 2 401 3 415 3 962 2 106 Ferro-nickel 96 136 47 380 48 Ferro-niobium 275 310 360 295 250 Ferro-phosphorus 645 650 451 521 646 Ferro-silicon 31 908 33 418 29 475 31 596 28 820 Ferro-titanium and ferro-silico-titanium 239 317 212 173 112 Ferro-vanadium 482 472 526 935 637 Other ferro-alloys 3 012 2 749 2 358 2 316 2 643 Silicon metal 5 805 5 809 4 910 6 325 6 437 Ingots, blooms, billets 651 182 322 206 352 697 358 780 289 266 Scrap 410 647 472 576 475 327 551 957 568 675 Denmark Pig iron 10 263 17 316 17 014 18 760 18 331 Sponge and powder 3 229 3 586 8 505 28 389 37 989 Ferro-silico-magnesium 114 8 32 89 79 Ferro-manganese 139 121 248 151 96 Ferro-silicon 2 864 3 328 3 655 3 010 3 197 Other ferro-alloys 149 98 87 189 202 Ingots, blooms, billets 538 503 609 342 420 037 554 999 557 183 Scrap 337 192 242 848 208 231 322 275 241 463 Estonia Ferro-manganese 182 64 85 52 126 Ferro-niobium 438 374 411 410 462 Ferro-silicon 21 149 61 83 103 Ferro-titanium and ferro-silico-titanium ... ... 11 500 2 984 Other ferro-alloys 31 15 17 51 89 Scrap 8 434 12 230 8 305 25 634 103 833 Finland Pig iron 36 120 31 235 21 728 20 360 21 725 Sponge and powder 872 476 1 871 1 102 1 361 1 783 Ferro-chrome 7 055 8 274 33 392 6 865 7 949 Ferro-silico-magnesium 190 158 220 100 65 Ferro-manganese 10 595 11 784 10 170 9 005 10 661 Ferro-silico-manganese 30 204 30 169 * 22 000 30 757 31 309 Ferro-molybdenum 1 316 1 717 * 1 200 1 001 1 374 Ferro-nickel 25 746 40 962 * 51 000 35 930 75 230 Ferro-niobium 629 849 874 804 1 110 Ferro-phosphorus 543 499 325 537 374 Ferro-silicon 31 395 30 207 34 361 34 600 36 493 Ferro-titanium and ferro-silico-titanium 1 043 1 843 942 994 1 072 Ferro-vanadium 235 193 134 119 181 Other ferro-alloys 4 648 4 839 1 545 1 260 1 061 Silicon metal 1 390 1 281 845 1 821 5 370 Ingots, blooms, billets 18 268 17 119 10 111 12 616 4 205 Scrap 754 726 710 558 * 600 000 * 556 007 * 783 502

255
Iron, Steel and Ferro-Alloys
Imports continued tonnes Country 2010 2011 2012 2013 2014 France Pig iron 139 186 160 336 140 321 187 416 150 165 Sponge and powder 52 795 84 787 38 973 72 852 37 697 Ferro-chrome 111 080 99 240 106 591 121 183 121 006 Ferro-silico-magnesium 1 047 1 102 483 572 672 Ferro-manganese 44 405 43 245 37 724 40 090 29 547 Ferro-silico-manganese 35 405 44 217 58 938 40 432 62 179 Ferro-molybdenum 3 720 4 857 4 441 4 081 4 091 Ferro-nickel 7 724 16 270 4 818 6 119 13 255 Ferro-niobium 2 195 2 225 1 608 1 673 2 103 Ferro-phosphorus 2 656 2 227 1 833 1 857 1 983 Ferro-silicon 51 906 65 306 54 824 52 768 68 493 Ferro-titanium and ferro-silico-titanium 5 457 5 756 3 958 4 314 4 549 Ferro-tungsten and ferro-silico-tungsten 343 378 303 328 275 Ferro-vanadium 1 065 1 113 811 815 705 Other ferro-alloys 16 247 15 035 8 602 11 741 12 485 Silicon metal 19 135 19 373 27 828 30 215 30 591 Ingots, blooms, billets 1 807 094 2 047 778 1 728 612 1 696 098 1 817 764 Scrap 2 450 993 2 682 258 2 732 380 2 377 000 2 480 652 Germany Pig iron 421 287 589 302 614 096 533 932 489 961 Sponge and powder 500 970 326 097 210 328 461 742 653 438 Ferro-chrome 454 005 447 242 392 515 329 237 265 333 Ferro-silico-chrome 29 047 18 334 8 573 19 757 34 772 Ferro-silico-magnesium 2 972 6 208 4 528 3 412 3 088 Ferro-manganese 203 200 232 613 192 817 204 941 206 095 Ferro-silico-manganese 185 067 208 913 206 967 224 049 243 694 Ferro-molybdenum 16 375 18 760 16 934 17 025 17 850 Ferro-nickel 192 394 155 881 81 991 88 951 20 985 Ferro-niobium 5 923 6 579 6 297 5 857 6 540 Ferro-phosphorus 6 067 5 137 5 587 5 471 6 788 Ferro-silicon 272 466 298 352 248 310 227 634 253 921 Ferro-titanium and ferro-silico-titanium 8 754 9 818 9 912 9 423 10 785 Ferro-tungsten and ferro-silico-tungsten 787 977 1 010 1 313 1 345 Ferro-vanadium 5 034 5 305 5 096 4 962 5 613 Other ferro-alloys 11 783 15 982 21 651 14 401 14 036 Silicon metal 255 977 241 565 232 640 219 791 245 485 Ingots, blooms, billets 1 611 091 2 401 066 1 768 289 1 532 302 2 118 072 Scrap 5 305 194 6 658 407 5 737 878 5 656 924 5 292 669 Greece Pig iron 4 427 9 127 470 2 615 7 369 Sponge and powder 5 772 3 302 429 680 697 Ferro-chrome 693 1 217 1 304 1 174 1 425 Ferro-manganese 837 271 203 162 197 Ferro-silico-manganese 18 515 12 695 10 971 12 124 10 415 Ferro-silicon 4 888 4 361 2 924 2 623 2 496 Other ferro-alloys 849 167 156 401 838 Silicon metal 1 426 1 746 1 212 1 487 1 779 Ingots, blooms, billets 28 092 71 878 17 546 45 081 34 204 Scrap 1 008 235 935 510 413 394 301 661 457 959 Hungary Pig iron 7 158 5 662 5 527 5 079 8 122 Ferro-chrome 187 223 279 323 229 Ferro-manganese 12 015 16 011 12 255 5 753 8 770 Ferro-silico-manganese 724 1 785 225 1 191 1 553 Ferro-molybdenum 85 105 108 89 141 Ferro-niobium 75 141 111 71 116 Ferro-phosphorus 652 60 111 161 249 Ferro-silicon 3 630 3 999 2 969 2 275 2 429 Other ferro-alloys 569 312 410 263 545 Silicon metal 4 010 7 832 5 619 4 061 2 563 Ingots, blooms, billets 30 505 240 299 565 955 1 156 777 727 071 Scrap 56 974 68 566 34 219 51 899 75 819

256
Iron, Steel and Ferro-Alloys
Imports continued tonnes Country 2010 2011 2012 2013 2014 Iceland Pig iron 1 148 841 844 792 1 833 Ferro-alloys 6 838 204 727 69 134 Silicon metal 4 366 3 204 4 816 6 377 7 469 Scrap 11 545 4 680 7 173 4 516 Ireland, Republic of Pig iron 1 345 946 797 797 131 Sponge and powder 989 1 176 1 216 698 443 Ferro-chrome 89 128 100 91 89 Other ferro-alloys 296 233 139 213 161 Ingots, blooms, billets 7 332 5 423 4 952 7 230 10 757 Scrap 4 030 3 310 6 565 3 496 3 171 Italy Pig iron 1 018 615 1 288 014 1 106 558 1 517 045 1 689 784 Sponge and powder 278 989 540 005 551 034 732 306 703 570 Ferro-chrome 390 374 414 410 416 091 388 133 339 587 Ferro-silico-chrome 97 841 3 99 83 Ferro-silico-magnesium 1 943 1 683 2 125 2 586 2 086 Ferro-manganese 71 406 86 512 82 933 86 923 72 526 Ferro-silico-manganese 158 540 176 855 167 310 173 051 167 846 Ferro-molybdenum 6 141 8 541 9 547 10 710 12 009 Ferro-nickel 98 168 116 806 128 877 124 343 118 962 Ferro-niobium 2 751 2 521 2 619 2 490 2 223 Ferro-phosphorus 631 414 365 380 297 Ferro-silicon 137 031 160 561 118 880 129 155 124 794 Ferro-titanium and ferro-silico-titanium 3 876 3 819 3 139 2 418 2 574 Ferro-tungsten and ferro-silico-tungsten 247 252 269 298 309 Ferro-vanadium 1 901 2 330 2 367 2 011 1 885 Other ferro-alloys 7 325 9 198 7 117 8 392 9 250 Silicon metal 48 392 53 131 41 277 43 173 40 350 Ingots, blooms, billets 3 681 439 3 662 856 3 169 000 3 198 102 3 126 871 Scrap 4 609 403 5 752 270 5 271 612 4 957 195 5 144 643 Latvia Pig iron 45 454 2 244 2 653 1 163 897 Sponge and powder 4 460 565 104 84 46 Ferro-chrome 6 995 9 782 17 179 13 045 3 125 Ferro-manganese 4 090 1 480 584 782 74 Ferro-silico-manganese 18 898 17 085 25 026 10 122 7 564 Ferro-silicon 24 660 25 992 15 963 25 583 20 428 Ferro-tungsten and ferro-silico-tungsten ... ... 80 120 ... Other ferro-alloys 158 245 119 51 174 Silicon metal 1 553 981 1 134 879 459 Ingots, blooms, billets 206 428 402 711 3 861 2 695 3 141 Scrap 443 817 366 039 923 037 318 371 219 926 Lithuania Ferro-manganese 51 39 6 38 106 Ferro-molybdenum — 3 936 3 5 Ferro-nickel ... 674 986 — 1 044 Ferro-silicon 102 40 40 46 34 Other ferro-alloys 40 38 1 500 1 087 46 Ingots, blooms, billets 4 270 5 384 4 536 7 537 8 864 Scrap 35 270 71 858 59 444 30 690 35 161 Luxembourg Ferro-manganese 910 1 317 1 193 1 032 2 028 Ferro-silico-manganese 27 116 29 053 29 843 29 419 28 497 Ferro-niobium 192 226 212 243 248 Ferro-silicon 3 428 3 828 3 642 3 337 3 081 Ferro-titanium and ferro-silico-titanium 33 63 81 108 394 Ferro-vanadium 292 328 298 308 396 Other ferro-alloys 581 788 716 942 757 Ingots, blooms, billets 407 419 370 786 237 293 131 957 137 643 Scrap 2 693 481 2 632 849 2 259 684 2 330 581 2 224 619 Macedonia Pig iron 1 823 1 382 1 075 967 1 079 Ferro-alloys 2 401 5 970 3 251 2 436 3 410 Ingots, blooms, billets 145 509 97 889 100 791 90 116 116 862 Scrap 292 049 318 612 157 401 55 654 153 264
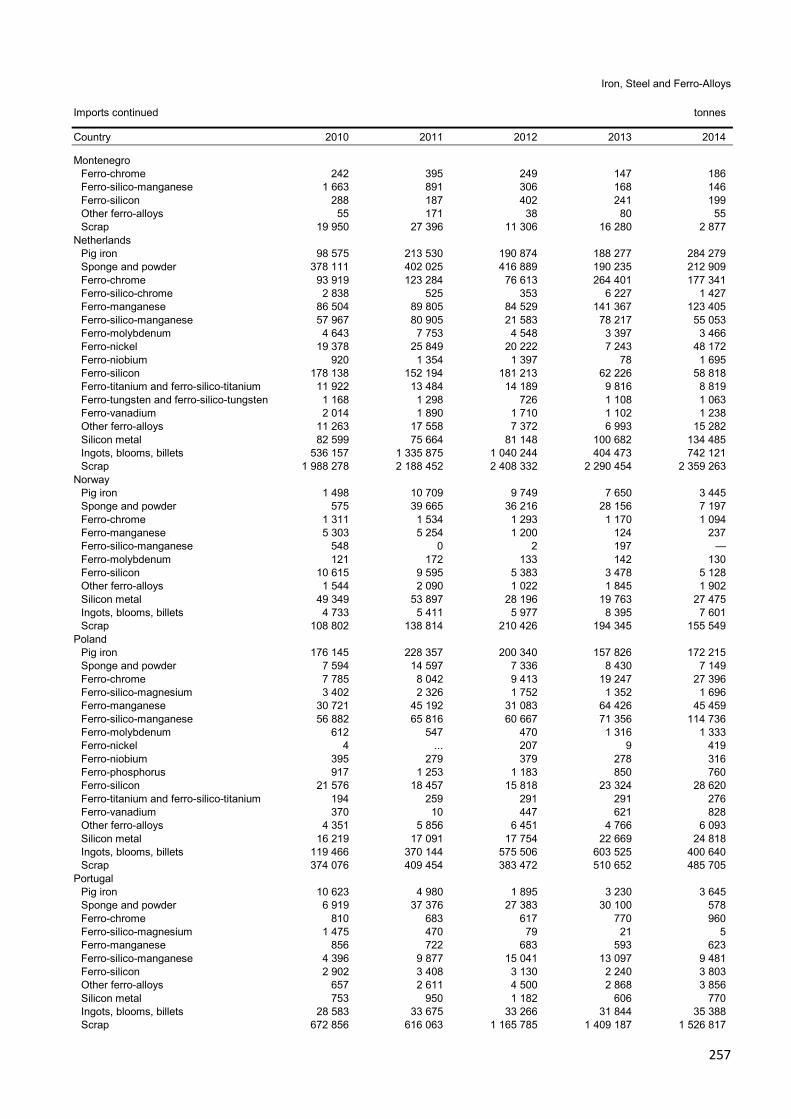
257
Iron, Steel and Ferro-Alloys
Imports continued tonnes Country 2010 2011 2012 2013 2014 Montenegro Ferro-chrome 242 395 249 147 186 Ferro-silico-manganese 1 663 891 306 168 146 Ferro-silicon 288 187 402 241 199 Other ferro-alloys 55 171 38 80 55 Scrap 19 950 27 396 11 306 16 280 2 877 Netherlands Pig iron 98 575 213 530 190 874 188 277 284 279 Sponge and powder 378 111 402 025 416 889 190 235 212 909 Ferro-chrome 93 919 123 284 76 613 264 401 177 341 Ferro-silico-chrome 2 838 525 353 6 227 1 427 Ferro-manganese 86 504 89 805 84 529 141 367 123 405 Ferro-silico-manganese 57 967 80 905 21 583 78 217 55 053 Ferro-molybdenum 4 643 7 753 4 548 3 397 3 466 Ferro-nickel 19 378 25 849 20 222 7 243 48 172 Ferro-niobium 920 1 354 1 397 78 1 695 Ferro-silicon 178 138 152 194 181 213 62 226 58 818 Ferro-titanium and ferro-silico-titanium 11 922 13 484 14 189 9 816 8 819 Ferro-tungsten and ferro-silico-tungsten 1 168 1 298 726 1 108 1 063 Ferro-vanadium 2 014 1 890 1 710 1 102 1 238 Other ferro-alloys 11 263 17 558 7 372 6 993 15 282 Silicon metal 82 599 75 664 81 148 100 682 134 485 Ingots, blooms, billets 536 157 1 335 875 1 040 244 404 473 742 121 Scrap 1 988 278 2 188 452 2 408 332 2 290 454 2 359 263 Norway Pig iron 1 498 10 709 9 749 7 650 3 445 Sponge and powder 575 39 665 36 216 28 156 7 197 Ferro-chrome 1 311 1 534 1 293 1 170 1 094 Ferro-manganese 5 303 5 254 1 200 124 237 Ferro-silico-manganese 548 0 2 197 — Ferro-molybdenum 121 172 133 142 130 Ferro-silicon 10 615 9 595 5 383 3 478 5 128 Other ferro-alloys 1 544 2 090 1 022 1 845 1 902 Silicon metal 49 349 53 897 28 196 19 763 27 475 Ingots, blooms, billets 4 733 5 411 5 977 8 395 7 601 Scrap 108 802 138 814 210 426 194 345 155 549 Poland Pig iron 176 145 228 357 200 340 157 826 172 215 Sponge and powder 7 594 14 597 7 336 8 430 7 149 Ferro-chrome 7 785 8 042 9 413 19 247 27 396 Ferro-silico-magnesium 3 402 2 326 1 752 1 352 1 696 Ferro-manganese 30 721 45 192 31 083 64 426 45 459 Ferro-silico-manganese 56 882 65 816 60 667 71 356 114 736 Ferro-molybdenum 612 547 470 1 316 1 333 Ferro-nickel 4 ... 207 9 419 Ferro-niobium 395 279 379 278 316 Ferro-phosphorus 917 1 253 1 183 850 760 Ferro-silicon 21 576 18 457 15 818 23 324 28 620 Ferro-titanium and ferro-silico-titanium 194 259 291 291 276 Ferro-vanadium 370 10 447 621 828 Other ferro-alloys 4 351 5 856 6 451 4 766 6 093 Silicon metal 16 219 17 091 17 754 22 669 24 818 Ingots, blooms, billets 119 466 370 144 575 506 603 525 400 640 Scrap 374 076 409 454 383 472 510 652 485 705 Portugal Pig iron 10 623 4 980 1 895 3 230 3 645 Sponge and powder 6 919 37 376 27 383 30 100 578 Ferro-chrome 810 683 617 770 960 Ferro-silico-magnesium 1 475 470 79 21 5 Ferro-manganese 856 722 683 593 623 Ferro-silico-manganese 4 396 9 877 15 041 13 097 9 481 Ferro-silicon 2 902 3 408 3 130 2 240 3 803 Other ferro-alloys 657 2 611 4 500 2 868 3 856 Silicon metal 753 950 1 182 606 770 Ingots, blooms, billets 28 583 33 675 33 266 31 844 35 388 Scrap 672 856 616 063 1 165 785 1 409 187 1 526 817

258
Iron, Steel and Ferro-Alloys
Imports continued tonnes Country 2010 2011 2012 2013 2014 Romania Pig iron 111 702 48 365 58 954 35 635 11 244 Sponge and powder 2 740 22 355 1 777 2 551 4 772 Ferro-chrome 1 500 2 856 2 564 1 911 2 803 Ferro-silico-magnesium 49 25 104 92 7 Ferro-manganese 15 530 18 136 21 039 19 489 21 826 Ferro-silico-manganese 19 151 24 215 19 093 10 013 17 029 Ferro-molybdenum 274 315 420 365 352 Ferro-niobium 55 132 177 172 116 Ferro-phosphorus 217 154 119 135 27 Ferro-silicon 9 859 9 602 10 392 8 149 7 881 Ferro-titanium and ferro-silico-titanium 183 412 284 250 209 Ferro-vanadium 153 166 166 211 167 Other ferro-alloys 1 255 1 495 635 677 886 Silicon metal 3 098 3 205 2 730 2 097 2 445 Ingots, blooms, billets 458 742 771 167 328 843 224 868 303 099 Scrap 5 501 8 416 49 468 17 655 6 274 Serbia Pig iron 2 739 1 281 1 073 1 017 569 Sponge and powder 217 187 89 1 524 135 Ferro-chrome 1 272 1 884 1 327 1 146 551 Ferro-manganese 9 524 9 270 2 299 4 893 6 905 Ferro-silico-manganese 440 2 431 3 727 3 970 4 182 Ferro-silicon 2 418 3 285 2 631 2 355 2 374 Other ferro-alloys 324 357 219 219 157 Ingots, blooms, billets 283 255 34 913 2 021 1 325 2 622 Scrap 12 403 35 192 90 554 169 512 148 094 Slovakia Pig iron 33 258 43 874 38 466 36 404 34 910 Sponge and powder 13 227 7 294 6 124 6 188 6 119 Ferro-chrome 6 829 6 684 8 014 7 056 5 056 Ferro-manganese 13 202 16 391 17 286 19 133 20 384 Ferro-silico-manganese 1 776 4 904 3 902 22 205 11 071 Ferro-molybdenum 140 374 252 213 194 Ferro-niobium 315 426 549 540 567 Ferro-phosphorus 282 629 463 307 511 Ferro-silicon 15 250 12 660 9 171 10 200 11 007 Ferro-titanium and ferro-silico-titanium 535 435 281 224 736 Ferro-vanadium 62 123 144 127 141 Other ferro-alloys 1 627 981 201 267 238 Silicon metal 6 309 7 196 6 329 6 735 7 887 Ingots, blooms, billets 10 020 24 162 7 314 12 664 10 131 Scrap 224 868 146 065 342 657 383 012 248 305 Slovenia Pig iron 29 120 25 327 30 517 29 660 28 531 Sponge and powder 1 225 1 630 794 1 020 1 211 Ferro-chrome 26 575 36 528 36 673 51 232 38 659 Ferro-silico-magnesium 624 786 1 485 1 377 1 509 Ferro-manganese 6 175 5 763 6 318 8 882 7 342 Ferro-silico-manganese 8 810 7 697 7 477 5 608 7 487 Ferro-molybdenum 717 885 1 028 1 060 1 085 Ferro-nickel ... 42 ... — 605 Ferro-phosphorus 846 968 1 115 710 978 Ferro-silicon 13 114 15 739 15 371 12 419 12 310 Ferro-titanium and ferro-silico-titanium 230 232 228 219 306 Ferro-tungsten and ferro-silico-tungsten 99 136 65 60 62 Ferro-vanadium 481 449 413 471 516 Other ferro-alloys 1 795 1 645 1 714 1 433 2 224 Silicon metal 7 874 8 318 5 862 5 810 11 851 Ingots, blooms, billets 8 191 31 931 20 897 20 770 28 446 Scrap 495 432 561 713 552 363 539 994 579 017
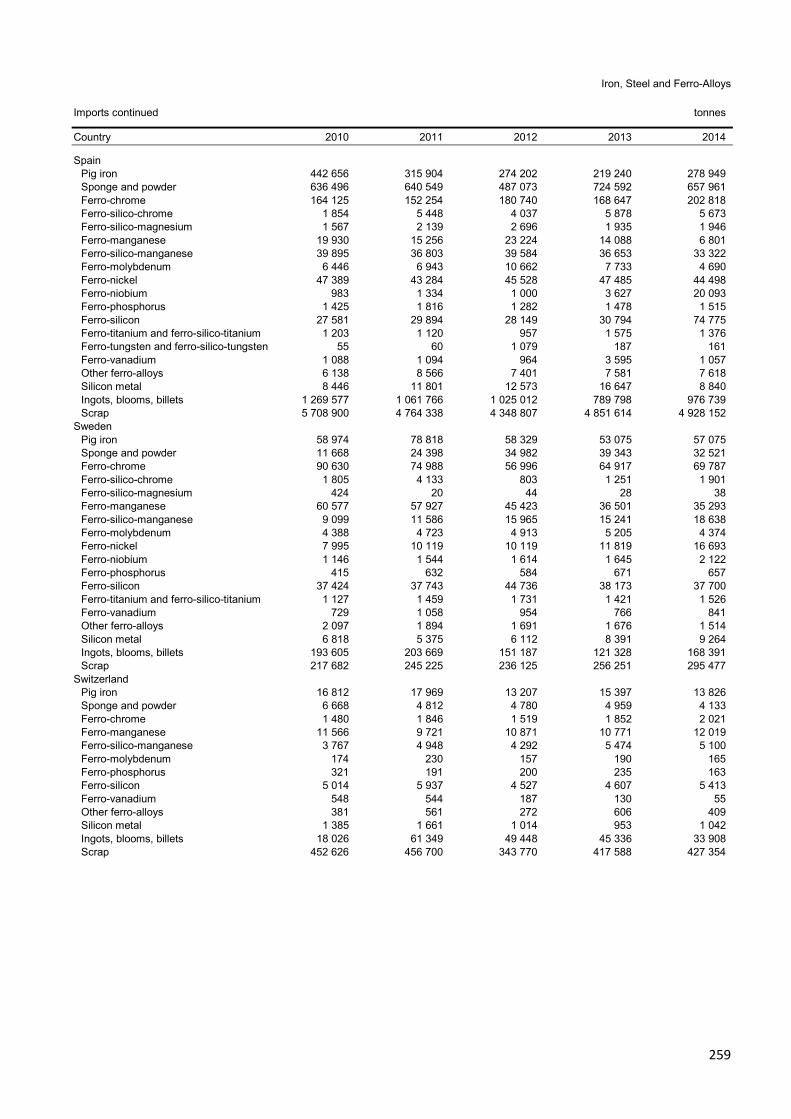
259
Iron, Steel and Ferro-Alloys
Imports continued tonnes Country 2010 2011 2012 2013 2014 Spain Pig iron 442 656 315 904 274 202 219 240 278 949 Sponge and powder 636 496 640 549 487 073 724 592 657 961 Ferro-chrome 164 125 152 254 180 740 168 647 202 818 Ferro-silico-chrome 1 854 5 448 4 037 5 878 5 673 Ferro-silico-magnesium 1 567 2 139 2 696 1 935 1 946 Ferro-manganese 19 930 15 256 23 224 14 088 6 801 Ferro-silico-manganese 39 895 36 803 39 584 36 653 33 322 Ferro-molybdenum 6 446 6 943 10 662 7 733 4 690 Ferro-nickel 47 389 43 284 45 528 47 485 44 498 Ferro-niobium 983 1 334 1 000 3 627 20 093 Ferro-phosphorus 1 425 1 816 1 282 1 478 1 515 Ferro-silicon 27 581 29 894 28 149 30 794 74 775 Ferro-titanium and ferro-silico-titanium 1 203 1 120 957 1 575 1 376 Ferro-tungsten and ferro-silico-tungsten 55 60 1 079 187 161 Ferro-vanadium 1 088 1 094 964 3 595 1 057 Other ferro-alloys 6 138 8 566 7 401 7 581 7 618 Silicon metal 8 446 11 801 12 573 16 647 8 840 Ingots, blooms, billets 1 269 577 1 061 766 1 025 012 789 798 976 739 Scrap 5 708 900 4 764 338 4 348 807 4 851 614 4 928 152 Sweden Pig iron 58 974 78 818 58 329 53 075 57 075 Sponge and powder 11 668 24 398 34 982 39 343 32 521 Ferro-chrome 90 630 74 988 56 996 64 917 69 787 Ferro-silico-chrome 1 805 4 133 803 1 251 1 901 Ferro-silico-magnesium 424 20 44 28 38 Ferro-manganese 60 577 57 927 45 423 36 501 35 293 Ferro-silico-manganese 9 099 11 586 15 965 15 241 18 638 Ferro-molybdenum 4 388 4 723 4 913 5 205 4 374 Ferro-nickel 7 995 10 119 10 119 11 819 16 693 Ferro-niobium 1 146 1 544 1 614 1 645 2 122 Ferro-phosphorus 415 632 584 671 657 Ferro-silicon 37 424 37 743 44 736 38 173 37 700 Ferro-titanium and ferro-silico-titanium 1 127 1 459 1 731 1 421 1 526 Ferro-vanadium 729 1 058 954 766 841 Other ferro-alloys 2 097 1 894 1 691 1 676 1 514 Silicon metal 6 818 5 375 6 112 8 391 9 264 Ingots, blooms, billets 193 605 203 669 151 187 121 328 168 391 Scrap 217 682 245 225 236 125 256 251 295 477 Switzerland Pig iron 16 812 17 969 13 207 15 397 13 826 Sponge and powder 6 668 4 812 4 780 4 959 4 133 Ferro-chrome 1 480 1 846 1 519 1 852 2 021 Ferro-manganese 11 566 9 721 10 871 10 771 12 019 Ferro-silico-manganese 3 767 4 948 4 292 5 474 5 100 Ferro-molybdenum 174 230 157 190 165 Ferro-phosphorus 321 191 200 235 163 Ferro-silicon 5 014 5 937 4 527 4 607 5 413 Ferro-vanadium 548 544 187 130 55 Other ferro-alloys 381 561 272 606 409 Silicon metal 1 385 1 661 1 014 953 1 042 Ingots, blooms, billets 18 026 61 349 49 448 45 336 33 908 Scrap 452 626 456 700 343 770 417 588 427 354

260
Iron, Steel and Ferro-Alloys
Imports continued tonnes Country 2010 2011 2012 2013 2014 Turkey Pig iron 557 398 1 137 729 1 376 572 982 579 912 961 Sponge and powder 284 608 180 591 387 667 510 327 223 419 Ferro-chrome 8 159 9 061 6 493 8 093 5 429 Ferro-silico-chrome 1 200 600 0 0 Ferro-silico-magnesium 786 1 344 2 064 1 910 1 280 Ferro-manganese 61 866 59 326 54 195 47 517 47 835 Ferro-silico-manganese 229 451 243 637 252 758 243 123 263 189 Ferro-molybdenum 1 577 1 091 1 181 1 106 1 125 Ferro-niobium 147 424 550 392 529 Ferro-phosphorus 1 050 1 035 1 117 817 684 Ferro-silicon 87 552 107 151 100 727 108 702 109 772 Ferro-titanium and ferro-silico-titanium 167 480 629 701 852 Ferro-vanadium 261 591 562 769 776 Other ferro-alloys 7 366 8 213 6 639 5 653 5 293 Silicon metal 9 978 10 363 10 777 7 215 9 814 Ingots, blooms, billets 2 350 758 2 157 532 3 355 265 5 429 936 4 777 554 Scrap 19 138 460 21 452 724 22 415 045 19 725 026 19 068 005 United Kingdom Pig iron 41 959 69 095 55 845 38 057 52 780 Sponge and powder 97 745 147 870 176 638 33 518 9 590 Ferro-alloys 208 817 225 819 212 787 216 722 235 941 Ferro-chrome 58 398 70 191 65 219 48 587 63 275 Ferro-silico-chrome 9 362 723 163 307 Ferro-silico-magnesium 931 1 328 1 360 1 211 948 Ferro-manganese 46 985 39 159 47 706 59 517 54 814 Ferro-silico-manganese 49 280 51 928 36 661 43 823 47 122 Ferro-molybdenum 322 573 458 259 303 Ferro-nickel 6 284 13 888 17 916 13 439 22 480 Ferro-niobium 859 395 250 987 1 029 Ferro-phosphorus 836 1 134 474 810 1 088 Ferro-silicon 43 703 45 918 39 351 42 966 43 209 Ferro-titanium and ferro-silico-titanium 274 187 902 687 805 Ferro-tungsten and ferro-silico-tungsten 48 44 34 30 47 Ferro-vanadium 340 368 246 339 450 Other ferro-alloys 595 388 1 520 3 904 158 Silicon metal 99 651 101 005 97 454 97 524 111 125 Ingots, blooms, billets 714 541 1 185 242 835 691 443 657 340 628 Scrap 270 986 423 744 284 986 302 580 351 436
Notes (1) In this table the term 'ingots, blooms, billets' corresponds to items 7206, 7207, 7218 and 7224 of the Harmonised System which
includes those of alloy and high carbon steel (2) In this table "ferro-silico-magnesium" includes both HS codes 7207 9930 and 7202 9980 even though the description appears to have
changed (a) BGS estimates, based on known exports from certain countries

261
Iron, steel and ferro-alloys
Iron and steel ingots, blooms and billets - EU36 trade in 2014
Iron and steel scrap - EU36 trade in 2014
-4 -3 -2 -1 0 1 2 3 4 5
TurkeyItaly
GermanyFrance
BelgiumSpain
NetherlandsHungaryDenmark
PolandBulgaria
United KingdomAustria
RomaniaCzech Republic
SwedenLuxembourg
MacedoniaPortugalGreece
SwitzerlandSloveniaSlovakiaNorwayFinlandSerbia
CroatiaAlbania
Million tonnes
Imports Exports
-15 -10 -5 0 5 10 15 20
TurkeyGermany
ItalySpain
BelgiumFrance
NetherlandsLuxembourg
PortugalAustriaFinland
SloveniaCzech Republic
PolandGreece
SwitzerlandUnited Kingdom
SwedenSlovakiaDenmark
LatviaNorway
MacedoniaSerbia
BulgariaEstoniaCroatia
HungaryLithuaniaRomania
Ireland, Republic of
Million tonnes
Imports Exports

262
Kaolin
Kaolin
• Kaolin is the market name for the clay mineral kaolinite. Unlike ceramic and refractory clays, kaolinite is usually processed to eliminate impurities and to tailor the product for end-use. Kaolin has many industrial applications: the main ones are in the manufacture of paper, ceramics, rubber, plastics, paint, cement and glass-fibres.
• USA was the world’s largest producer in 2014, with 23 per cent of the total world output. The second largest was Germany (17 per cent), followed by China (12 per cent), Brazil (seven per cent) and Ukraine (six per cent).
Rest of World 67.4%
Belgium 3.6%Czech Republic 7.3%France 3.7%
Germany 50.7%
Others 5.9%
Portugal 3.1%
Spain 4.1%
Turkey 8.7%
United Kingdom 12.9%
EU36 32.6%
EU36 Production of kaolin 2014
Production of kaolin tonnes Country 2010 2011 2012 2013 2014
Austria 18 914 18 897 13 497 11 558 * 11 500 Belgium * 300 000 * 300 000 * 300 000 * 300 000 * 300 000 Bulgaria * 16 832 7 700 33 900 22 600 * 32 000 Czech Republic (a) 636 000 660 000 624 000 609 000 617 000 France 350 000 310 000 308 000 * 300 000 311 000 Germany (b) 4 578 097 4 898 516 4 398 796 4 348 562 4 275 422 Greece 3 493 7 250 6 268 — — Italy * 180 000 * 180 000 * 180 000 * 180 000 * 180 000 Poland (c) 125 000 163 600 137 800 166 000 * 165 000 Portugal 273 890 322 041 321 689 248 008 264 872 Romania 326 — — 32 722 30 638 Serbia 76 197 90 472 69 487 * 70 000 * 70 000 Slovakia — 4 000 3 000 6 000 6 000 Spain (c) 310 993 384 179 402 251 410 717 350 000 Turkey 787 287 1 229 352 988 081 1 027 189 734 072 United Kingdom * 1 140 000 * 1 290 000 * 1 150 000 * 1 110 000 * 1 090 000 EU36 total 8 800 000 9 900 000 8 900 000 8 800 000 8 400 000
Notes (1) In addition to the countries listed, Denmark is believed to produce kaolin (a) Beneficiated (b) Washed and dried (c) Washed

263
Kaolin
0
2 000
4 000
6 000
8 000
10 000
12 000
2010 2011 2012 2013 2014
Thou
sand
tonn
esEU36 Production of kaolin 2010 - 14
Exports of kaolin tonnes Country 2010 2011 2012 2013 2014 Austria 27 908 6 588 6 958 6 318 5 944 Belgium 523 697 232 664 219 024 193 131 759 901 Bulgaria 159 669 197 114 193 385 200 655 214 229 Czech Republic 485 203 537 962 507 689 504 179 504 690 Denmark 607 1 370 1 489 1 245 966 Estonia 878 830 1 019 352 591 Finland 18 176 30 760 40 550 38 900 37 761 France 272 778 273 802 244 439 232 133 240 605 Germany 389 927 431 815 361 915 372 171 394 195 Hungary 2 436 3 272 2 861 2 753 2 980 Italy 36 208 27 994 21 393 24 241 29 178 Lithuania 40 648 1 258 258 311 Netherlands 33 923 24 652 25 254 26 668 29 800 Norway 103 85 492 20 72 Poland 9 781 13 591 12 366 10 173 11 749 Portugal 31 390 102 721 122 029 103 161 147 026 Serbia 1 868 1 282 1 069 4 649 8 234 Slovakia 4 493 552 42 14 067 16 080 Slovenia 359 277 197 504 300 Spain 167 557 161 497 173 332 164 350 200 956 Sweden 23 103 16 444 7 032 769 605 Switzerland 287 55 201 425 189 Turkey 137 963 83 203 110 139 91 294 117 304 United Kingdom 1 722 335 1 157 780 1 039 460 1 003 841 984 272
Notes (1) The term 'kaolin', as used here, includes kaolin and kaolinitic clay
Imports of kaolin tonnes Country 2010 2011 2012 2013 2014 Austria 194 396 187 831 171 310 161 876 157 527 Belgium 1 001 057 890 863 868 298 854 056 930 145 Bulgaria 23 784 25 789 29 038 26 218 41 453 Croatia 10 238 11 278 8 655 9 456 8 417 Czech Republic 14 125 19 352 17 045 15 815 16 757 Denmark 37 007 37 755 53 815 26 349 12 360 Estonia 881 211 8 568 3 090 3 326 Finland 941 387 936 544 860 241 806 954 745 438

264
Kaolin
Imports continued tonnes Country 2010 2011 2012 2013 2014 France 231 779 220 764 223 649 198 892 175 767 Germany 715 770 705 107 625 826 629 989 624 461 Greece 31 132 14 336 7 454 8 808 8 254 Hungary 24 175 29 736 23 099 26 053 30 157 Ireland, Republic of 4 039 3 414 3 377 3 489 3 457 Italy 823 461 707 622 681 595 686 567 722 977 Latvia 10 594 9 289 10 768 12 151 12 593 Lithuania 486 360 480 508 619 Luxembourg 904 563 736 1 046 705 Macedonia 4 985 3 815 1 440 1 497 3 046 Netherlands 150 929 150 310 149 090 115 525 168 279 Norway 225 576 149 002 176 164 168 419 148 595 Poland 117 914 143 476 138 026 146 430 135 599 Portugal 96 851 106 955 103 863 97 034 155 804 Romania 51 754 56 871 60 170 62 370 69 190 Serbia 50 421 38 810 25 922 22 219 26 900 Slovakia 62 748 70 451 64 345 70 545 72 923 Slovenia 27 287 28 779 22 614 23 877 25 248 Spain 1 061 703 1 055 912 856 355 1 016 611 1 078 541 Sweden 367 948 389 358 359 345 316 362 324 835 Switzerland 24 249 21 460 21 551 17 924 16 830 Turkey 424 152 497 148 479 665 404 283 441 998 United Kingdom 95 865 102 396 88 505 85 534 92 426
Notes (1) The term 'kaolin', as used here, includes kaolin and kaolinitic clay
Kaolin - EU36 trade in 2014
-1,250 -1,000 -750 -500 -250 0 250 500 750 1,000 1,250
SpainBelgiumFinland
ItalyGermany
TurkeySwedenFrance
NetherlandsAustria
PortugalNorwayPoland
United KingdomSlovakiaRomaniaBulgariaHungary
SerbiaSlovenia
SwitzerlandCzech Republic
LatviaDenmark
CroatiaGreece
Ireland, Republic ofEstonia
Macedonia
Thousand tonnes
Imports Exports

265
Lead
Lead
• Lead is a very soft, highly malleable, ductile metallic element with low electrical conductivity. It is also very dense and strongly resistant to corrosion, although it tarnishes rapidly in air. The main use is in lead-acid batteries, although lead is also widely used in architecture, plumbing, ordinance, solder, radiation shielding and insecticides.
• China was the world’s largest producer of mined lead in 2014, with 50 per cent of the total world output. The second largest was Australia (13 per cent), followed by USA (seven per cent), Peru and Mexico (five per cent each).
• China was also the world’s largest producer of refined lead in 2014, with 45 per cent of the total world output. The second largest was USA (11 per cent), followed by India (five per cent) and Germany (four per cent).
Rest of World 93.6%
Bulgaria 4.5%
Greece 4.8%
Ireland 11.7%Macedonia 12.6%
Others 3.1%
Poland 24.0%
Sweden 20.4%
Turkey 18.8%
EU36 6.4%
EU36 Mine production of lead 2014
Mine production of lead tonnes (metal content)
Country 2010 2011 2012 2013 2014 Bulgaria (a) 12 705 14 369 15 949 16 914 15 600 Greece 12 200 13 400 18 060 18 010 16 700 Ireland, Republic of 39 100 50 700 47 400 42 950 40 500 Macedonia 41 293 37 295 39 184 42 826 43 810 Montenegro ... ... 1 958 2 453 2 755 Poland 48 050 67 003 64 342 79 480 83 150 Portugal — — 87 1 496 3 192 Romania * 300 * — * 5 300 * 400 * — Serbia 1 800 2 100 2 500 3 100 3 700 Slovakia 94 114 166 235 162 Spain 229 5 705 3 800 2 200 1 200 Sweden 67 697 62 028 63 551 59 556 70 848 Turkey 39 000 38 682 57 017 76 638 62 190 United Kingdom (b) * 380 (c) 280 (c) 61 (b) * 100 (d) * 100 EU36 total 262 800 291 700 319 400 346 400 343 900
Notes (a) Metal content of ore (b) By-product of Pennine fluorspar operations and of gold mining in Northern Ireland (c) By-product of gold mining in Northern Ireland (d) By-product of Pennine fluorspar operation in Northern Ireland
0
50
100
150
200
250
300
350
400
2010 2011 2012 2013 2014
Thou
sand
tonn
es
(met
al c
onte
nt)
EU36 Mine production of lead 2010 - 14

266
Lead
Rest of World 83.6%
Belgium 7.6%
Bulgaria 5.3%France 4.1%
Germany 23.4%
Italy 9.2%
Others 13.0%Poland 8.5%
Spain 9.5%
Sweden 3.9%
United Kingdom 15.3%EU36 16.4%
EU36 Production of refined lead 2014
Production of refined lead tonnes
Country 2010 2011 2012 2013 2014 Austria 25 500 26 200 24 504 38 786 37 122 Belgium 121 000 119 000 119 000 129 429 133 252 Bulgaria 98 000 90 000 85 000 90 000 92 000 Czech Republic 36 000 38 000 41 000 42 000 44 000 Estonia 7 200 7 800 8 046 7 581 8 588 France 71 000 80 000 83 000 71 000 72 000 Germany 405 400 429 100 423 000 400 000 408 000 Greece * 11 000 * 7 000 * 6 000 * 6 000 * 6 000 Ireland, Republic of 19 000 18 000 16 000 17 000 17 200 Italy 150 000 149 500 138 400 151 000 160 000 Netherlands 27 000 27 000 27 000 27 000 31 000 Poland 120 300 121 500 141 000 145 400 149 000 Portugal 9 000 6 000 5 000 4 000 5 000 Romania 11 263 6 747 14 668 14 000 12 000 Slovenia 14 000 15 000 14 000 12 000 11 000 Spain 165 000 177 000 160 000 157 000 166 000 Sweden 59 179 52 438 61 528 68 713 68 708 Turkey * 42 000 * 48 000 * 50 000 * 50 000 * 55 000 United Kingdom 301 000 275 000 311 930 329 200 267 000 EU36 total 1 693 000 1 693 000 1 729 000 1 760 000 1 743 000 Notes (1) Figures relate to both primary and secondary refined lead and include the lead content of antimonial lead
0
200
400
600
800
1 000
1 200
1 400
1 600
1 800
2 000
2010 2011 2012 2013 2014
Thou
sand
tonn
es
EU36 Production of refined lead 2010 - 14
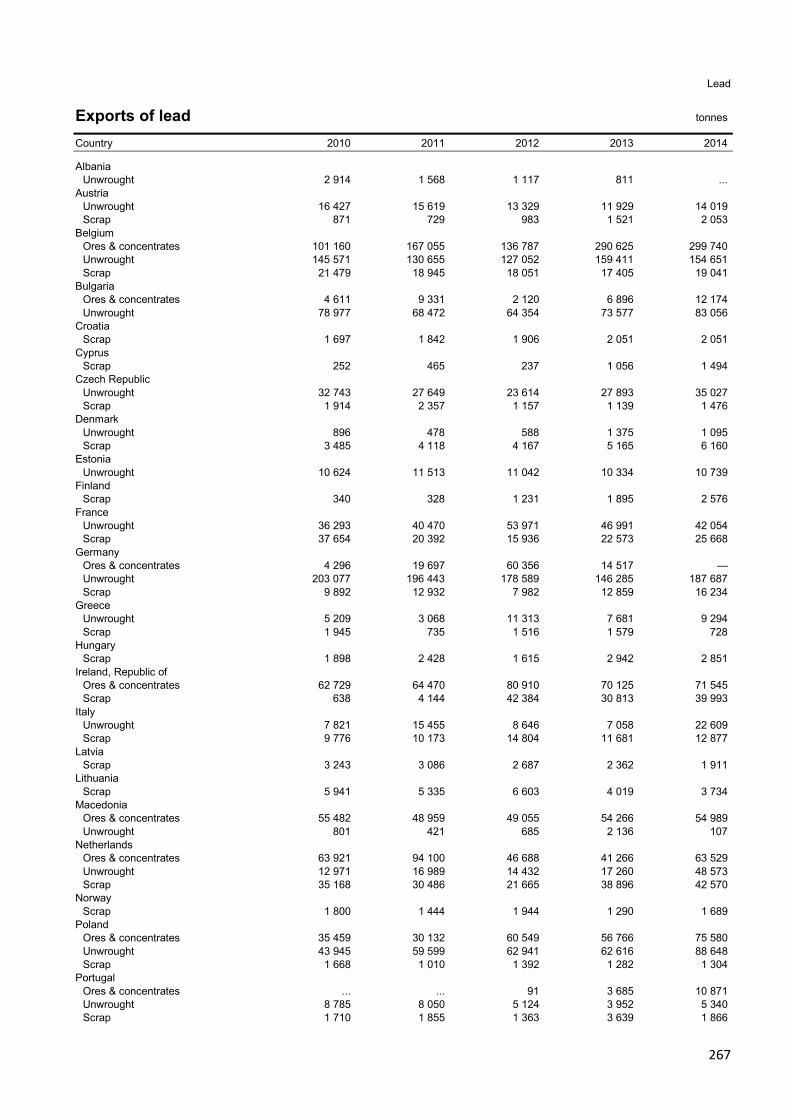
267
Lead
Exports of lead tonnes
Country 2010 2011 2012 2013 2014 Albania Unwrought 2 914 1 568 1 117 811 ... Austria Unwrought 16 427 15 619 13 329 11 929 14 019 Scrap 871 729 983 1 521 2 053 Belgium Ores & concentrates 101 160 167 055 136 787 290 625 299 740 Unwrought 145 571 130 655 127 052 159 411 154 651 Scrap 21 479 18 945 18 051 17 405 19 041 Bulgaria Ores & concentrates 4 611 9 331 2 120 6 896 12 174 Unwrought 78 977 68 472 64 354 73 577 83 056 Croatia Scrap 1 697 1 842 1 906 2 051 2 051 Cyprus Scrap 252 465 237 1 056 1 494 Czech Republic Unwrought 32 743 27 649 23 614 27 893 35 027 Scrap 1 914 2 357 1 157 1 139 1 476 Denmark Unwrought 896 478 588 1 375 1 095 Scrap 3 485 4 118 4 167 5 165 6 160 Estonia Unwrought 10 624 11 513 11 042 10 334 10 739 Finland Scrap 340 328 1 231 1 895 2 576 France Unwrought 36 293 40 470 53 971 46 991 42 054 Scrap 37 654 20 392 15 936 22 573 25 668 Germany Ores & concentrates 4 296 19 697 60 356 14 517 — Unwrought 203 077 196 443 178 589 146 285 187 687 Scrap 9 892 12 932 7 982 12 859 16 234 Greece Unwrought 5 209 3 068 11 313 7 681 9 294 Scrap 1 945 735 1 516 1 579 728 Hungary Scrap 1 898 2 428 1 615 2 942 2 851 Ireland, Republic of Ores & concentrates 62 729 64 470 80 910 70 125 71 545 Scrap 638 4 144 42 384 30 813 39 993 Italy Unwrought 7 821 15 455 8 646 7 058 22 609 Scrap 9 776 10 173 14 804 11 681 12 877 Latvia Scrap 3 243 3 086 2 687 2 362 1 911 Lithuania Scrap 5 941 5 335 6 603 4 019 3 734 Macedonia Ores & concentrates 55 482 48 959 49 055 54 266 54 989 Unwrought 801 421 685 2 136 107 Netherlands Ores & concentrates 63 921 94 100 46 688 41 266 63 529 Unwrought 12 971 16 989 14 432 17 260 48 573 Scrap 35 168 30 486 21 665 38 896 42 570 Norway Scrap 1 800 1 444 1 944 1 290 1 689 Poland Ores & concentrates 35 459 30 132 60 549 56 766 75 580 Unwrought 43 945 59 599 62 941 62 616 88 648 Scrap 1 668 1 010 1 392 1 282 1 304 Portugal Ores & concentrates ... ... 91 3 685 10 871 Unwrought 8 785 8 050 5 124 3 952 5 340 Scrap 1 710 1 855 1 363 3 639 1 866

268
Lead
Exports continued tonnes
Country 2010 2011 2012 2013 2014 Romania Ores & concentrates 9 096 5 952 11 051 1 631 1 374 Unwrought 10 573 18 722 18 859 21 331 19 305 Scrap 5 659 6 846 5 419 3 884 11 269 Serbia Ores & concentrates 10 265 13 981 13 479 14 917 14 150 Unwrought 5 661 7 848 5 777 1 847 55 Slovakia Unwrought 250 539 373 1 577 4 178 Scrap 662 737 759 1 258 1 218 Slovenia Unwrought 8 090 6 008 5 391 5 995 5 963 Spain Ores & concentrates 9 513 24 677 50 216 45 055 45 576 Unwrought 6 630 15 683 37 882 13 350 9 434 Scrap 6 781 5 029 3 361 7 505 3 436 Sweden Ores & concentrates 111 153 73 996 68 646 43 506 64 208 Unwrought 55 501 54 370 51 796 71 771 66 869 Scrap 1 445 1 471 1 425 1 113 9 181 Switzerland Scrap 5 497 5 732 5 301 4 424 4 407 Turkey Ores & concentrates 64 247 65 917 93 590 130 217 109 067 Unwrought 400 802 2 522 1 726 922 United Kingdom Unwrought 105 235 144 877 169 739 144 718 150 270 Unwrought alloys 62 406 4 820 6 050 5 521 3 006 Scrap 69 404 74 789 57 990 53 746 56 432
Notes (1) In this table the term 'unwrought' lead corresponds to item 7801 of the Harmonised System and comprises base bullion, pigs,
unwrought bars, etc. (2) The term 'unwrought' as used here includes alloys unless these are separately specified
Imports of lead tonnes
Country 2010 2011 2012 2013 2014 Austria Unwrought 19 391 31 675 29 938 40 143 45 566 Scrap 264 837 558 1 560 1 260 Belgium Ores & concentrates 169 356 154 976 139 771 214 596 213 749 Unwrought 14 467 27 696 77 349 33 247 48 052 Scrap 31 992 33 219 26 023 24 479 29 470 Bulgaria Ores & concentrates 81 307 74 810 72 008 74 199 80 553 Unwrought 7 283 21 566 21 064 23 536 12 439 Scrap 17 462 4 627 1 660 11 050 16 660 Czech Republic Unwrought 81 762 36 233 60 258 104 236 125 855 Scrap 2 901 2 763 2 560 4 177 4 889 Denmark Scrap 2 890 1 989 2 655 2 601 3 188 Finland Unwrought 1 512 2 446 3 821 4 146 4 245 France Unwrought 34 090 39 305 38 918 42 523 46 479 Scrap 12 848 15 182 14 265 2 941 3 273 Germany Ores & concentrates 184 018 205 464 228 444 258 922 266 438 Unwrought 157 301 157 653 148 576 149 465 144 872 Scrap 39 653 35 823 28 058 28 091 26 409

269
Lead
Imports continued tonnes
Country 2010 2011 2012 2013 2014 Greece Unwrought 11 149 16 980 17 028 16 937 22 195 Scrap 1 692 2 136 2 183 915 1 032 Hungary Unwrought 6 138 9 497 11 372 8 710 9 751 Ireland, Republic of Unwrought 14 357 15 345 5 199 2 916 3 586 Scrap 12 074 12 305 14 089 16 874 16 884 Italy Ores & concentrates 20 0 9 419 39 748 73 037 Unwrought 111 301 109 458 89 266 71 393 93 413 Scrap 2 609 4 976 4 111 3 059 2 904 Latvia Scrap 93 1 221 502 922 3 808 Lithuania Scrap 4 459 5 755 1 892 3 350 982 Macedonia Unwrought 395 479 268 2 313 1 936 Netherlands Ores & concentrates 1 558 8 083 29 375 7 383 47 770 Unwrought 8 717 8 496 4 020 5 484 5 561 Scrap 21 255 16 886 15 622 10 578 8 823 Norway Unwrought 6 449 7 713 8 071 9 630 8 902 Poland Unwrought 46 810 52 011 42 108 44 237 51 216 Scrap 7 154 6 673 4 980 10 330 11 539 Portugal Unwrought 5 593 9 403 8 661 13 630 13 263 Scrap 395 266 1 113 5 026 953 Romania Ores & concentrates 7 052 9 420 463 831 1 861 Unwrought 11 834 16 789 12 777 14 707 14 090 Serbia Ores & concentrates 5 978 8 127 2 642 1 475 5 Unwrought 6 018 5 302 9 163 3 862 2 486 Scrap 1 228 2 643 2 087 45 ... Slovakia Unwrought 136 563 697 252 2 583 Slovenia Unwrought 16 025 17 594 17 294 21 844 27 402 Scrap 3 812 3 611 3 741 4 117 5 055 Spain Ores & concentrates 10 946 6 698 4 651 1 536 1 682 Unwrought 110 316 114 428 122 913 110 576 94 173 Scrap 43 432 42 236 34 702 35 284 32 249 Sweden Ores & concentrates 14 763 — — — 10 Unwrought 5 340 5 783 6 616 6 876 6 235 Scrap 9 464 8 401 9 624 9 282 9 572 Switzerland Unwrought 5 664 2 838 5 519 3 186 2 372 Turkey Unwrought 73 057 85 131 99 137 91 337 105 082 United Kingdom Unwrought 166 830 147 579 189 605 171 169 130 199 Scrap 8 858 4 792 3 317 4 169 7 236
Notes (1) In this table the term 'unwrought' lead corresponds to item 7801 of the Harmonised System and comprises base bullion, pigs,
unwrought bars, etc. (2) The term 'unwrought' as used here includes alloys unless these are separately specified

270
Lead
Lead ore - EU36 trade in 2014
Lead - EU36 trade in 2014
-350 -300 -250 -200 -150 -100 -50 0 50 100 150 200 250 300
GermanyBelgiumBulgaria
ItalyNetherlands
RomaniaSpain
SwedenSerbia
United KingdomTurkey
PortugalPoland
MacedoniaIreland, Republic of
Thousand tonnes
Imports Exports
-350 -300 -250 -200 -150 -100 -50 0 50 100 150 200
GermanyUnited KingdomCzech Republic
TurkeySpain
ItalyPoland
BelgiumFranceAustria
SloveniaGreece
RomaniaPortugalBulgariaHungaryNorwaySweden
NetherlandsFinland
Ireland, Republic ofSlovakia
SerbiaSwitzerlandMacedonia
CyprusLithuaniaDenmark
CroatiaEstonia
Latvia
Thousand tonnes
Metal
Scrap
Imports Exports

271
Lithium
Lithium minerals
• Lithium is a very light metallic element. It is mainly used as lithium compounds in rechargeable batteries, as fluxes in the ceramics and glass industries, and in lubricants. The metal is an important alloying agent with primary aluminium.
• Lithium can either be produced from minerals, such as spodumene or lepidolite, or from brine extracted from beneath salt lakes. Based on lithium content, Chile was the world’s largest producer in 2014, with an estimated 44 per cent of the total world output, which was entirely from brine extraction. The second largest was Australia (32 per cent, entirely from minerals), followed by Argentina (11 per cent, from brine), and China (five per cent, from both minerals and brine).
Production of lithium minerals tonnes Country 2010 2011 2012 2013 2014 Portugal Lepidolite 40 109 37 534 20 698 19 940 17 459 Spain Lepidolite 7 824 — — — —
Exports of lithium tonnes Country 2010 2011 2012 2013 2014 Austria Carbonate 170 166 9 13 24 Belgium Oxides 2 284 1 890 2 320 2 380 2 442 Carbonate 4 539 4 428 4 985 6 736 5 549 France Oxides 46 108 103 72 114 Germany Carbonate 2 387 2 927 2 259 2 809 3 043 Italy Carbonate 49 105 73 84 133 Netherlands Oxides 116 365 303 492 314 Carbonate 160 300 567 266 229 Spain Carbonate 176 268 100 2 477 6 770 Switzerland Oxides 190 1 83 91 92 United Kingdom Oxides 144 7 41 39 65 Carbonate 123 50 102 86 138
Imports of lithium tonnes Country 2010 2011 2012 2013 2014 Austria Carbonate 402 463 359 298 340 Belgium Oxides 2 410 2 953 2 515 3 179 2 389 Carbonate 4 183 7 770 7 205 6 403 4 406 Denmark Carbonate 340 358 80 63 63 France Oxides 570 479 547 505 581 Carbonate 1 137 2 792 1 756 1 162 1 371 Germany Oxides (a) * 1 800 * 1 700 * 1 300 * 1 600 * 1 766 Carbonate 6 486 5 735 6 064 5 977 6 015
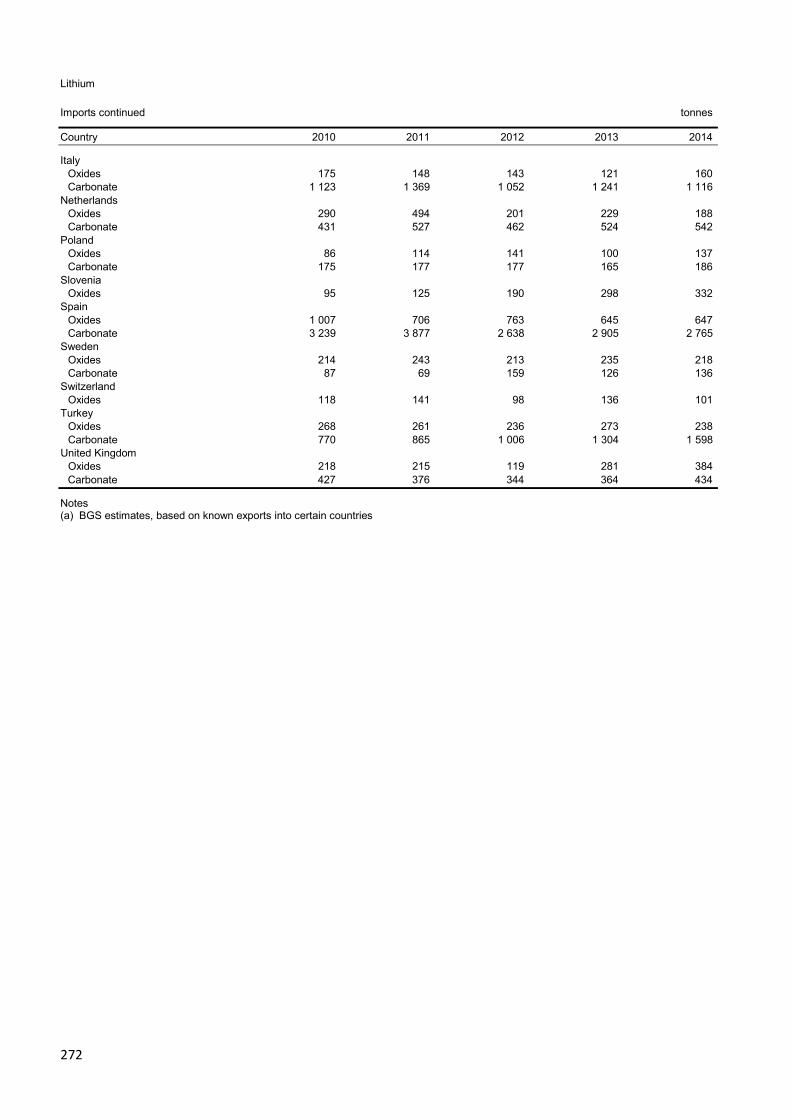
272
Lithium
Imports continued tonnes Country 2010 2011 2012 2013 2014 Italy Oxides 175 148 143 121 160 Carbonate 1 123 1 369 1 052 1 241 1 116 Netherlands Oxides 290 494 201 229 188 Carbonate 431 527 462 524 542 Poland Oxides 86 114 141 100 137 Carbonate 175 177 177 165 186 Slovenia Oxides 95 125 190 298 332 Spain Oxides 1 007 706 763 645 647 Carbonate 3 239 3 877 2 638 2 905 2 765 Sweden Oxides 214 243 213 235 218 Carbonate 87 69 159 126 136 Switzerland Oxides 118 141 98 136 101 Turkey Oxides 268 261 236 273 238 Carbonate 770 865 1 006 1 304 1 598 United Kingdom Oxides 218 215 119 281 384 Carbonate 427 376 344 364 434
Notes (a) BGS estimates, based on known exports into certain countries

273
Magnesite and Magnesia
Magnesite
• Magnesite is the commonly used name for magnesium carbonate rock. Magnesite has excellent thermal resistance and is most commonly used as refractory bricks in furnaces. It is also used in fertilisers.
• China was the world’s largest producer in 2014, with 78 per cent of the total world output. The second largest were Russia and Turkey (with five per cent each), followed by Spain and Austria (with two per cent each).
Rest of World 88.4%
Austria 13.7%
Greece 7.1%Netherlands 5.2%
Poland 1.7%Slovakia 10.1%
Spain 15.2%
Turkey 47.1%
EU36 11.6%
EU36 Production of magnesite 2014
Production of magnesite tonnes
Country 2010 2011 2012 2013 2014 Austria 757 063 867 912 778 810 714 422 754 096 Greece 396 497 393 880 349 998 314 770 391 140 Netherlands (a) 236 053 274 877 290 873 249 568 285 907 Poland 63 000 75 350 83 860 97 000 92 000 Slovakia 650 100 751 700 618 400 584 000 557 100 Spain 462 959 577 725 649 977 836 269 840 000 Turkey 2 316 763 2 588 276 2 475 828 2 597 465 * 2 600 000 EU36 total 4 882 000 5 530 000 5 248 000 5 393 000 5 520 000 Notes (1) In addition to the countries listed, Bulgaria is believed to produce magnesite (a) Chloride produced from solution mining
0
1 000
2 000
3 000
4 000
5 000
6 000
2010 2011 2012 2013 2014
Thou
sand
tonn
es
EU36 Production of magnesite 2010 - 14

274
Magnesite and Magnesia
Exports of magnesite and magnesia tonnes Country 2010 2011 2012 2013 2014 Austria Magnesite 989 780 774 559 488 Magnesia 39 589 79 519 71 453 70 253 64 204 Belgium Magnesite 1 235 914 150 2 469 1 318 Magnesia 96 513 58 237 49 561 17 793 10 618 Bulgaria Magnesite — 537 241 94 148 Czech Republic 3 809 7 096 5 997 4 690 3 675 Denmark Magnesia 522 497 179 437 376 Finland Magnesite 11 — — — 12 275 France Magnesite 274 207 250 195 458 Magnesia 52 553 35 543 38 098 53 989 61 368 Germany Magnesite 229 1 303 381 474 1 379 Magnesia 94 198 67 605 73 154 84 986 96 136 Greece Magnesite ... 8 766 4 012 1 268 10 055 Magnesia 108 020 110 276 87 550 98 204 87 520 Hungary Magnesia ... 317 309 643 172 Ireland, Republic of Magnesite 3 383 18 665 13 218 4 114 16 568 Magnesia 33 334 11 761 3 465 41 749 61 343 Italy Magnesite 2 535 3 236 2 902 2 305 3 372 Magnesia 7 393 6 194 7 283 7 237 6 997 Lithuania Magnesia 717 352 350 294 239 Luxembourg Magnesite 943 1 325 1 171 1 081 778 Netherlands Magnesite 423 744 31 99 1 304 Magnesia 139 516 402 976 370 287 273 416 266 591 Poland Magnesia 1 013 550 3 303 5 873 6 066 Portugal Magnesite 11 1 716 503 4 988 Magnesia 4 1 528 712 708 Romania Magnesia 460 212 412 309 248 Serbia Magnesite 1 851 1 524 1 852 2 551 2 448 Magnesia 328 5 831 8 704 3 283 4 167 Slovakia Magnesite (a) * 8 400 * 4 900 * 3 800 * 2 600 * 2 700 Magnesia 336 786 340 612 272 677 266 320 266 297 Slovenia Magnesite 4 798 78 22 20 30 Magnesia 334 259 9 577 125 735 123 173 Spain Magnesite 410 573 1 081 798 970 Magnesia 222 825 256 523 256 824 234 020 233 754 Sweden Magnesia 303 165 130 69 109 Turkey Magnesite 24 213 37 902 28 747 38 569 22 746 Magnesia 209 633 238 620 245 537 266 279 231 851
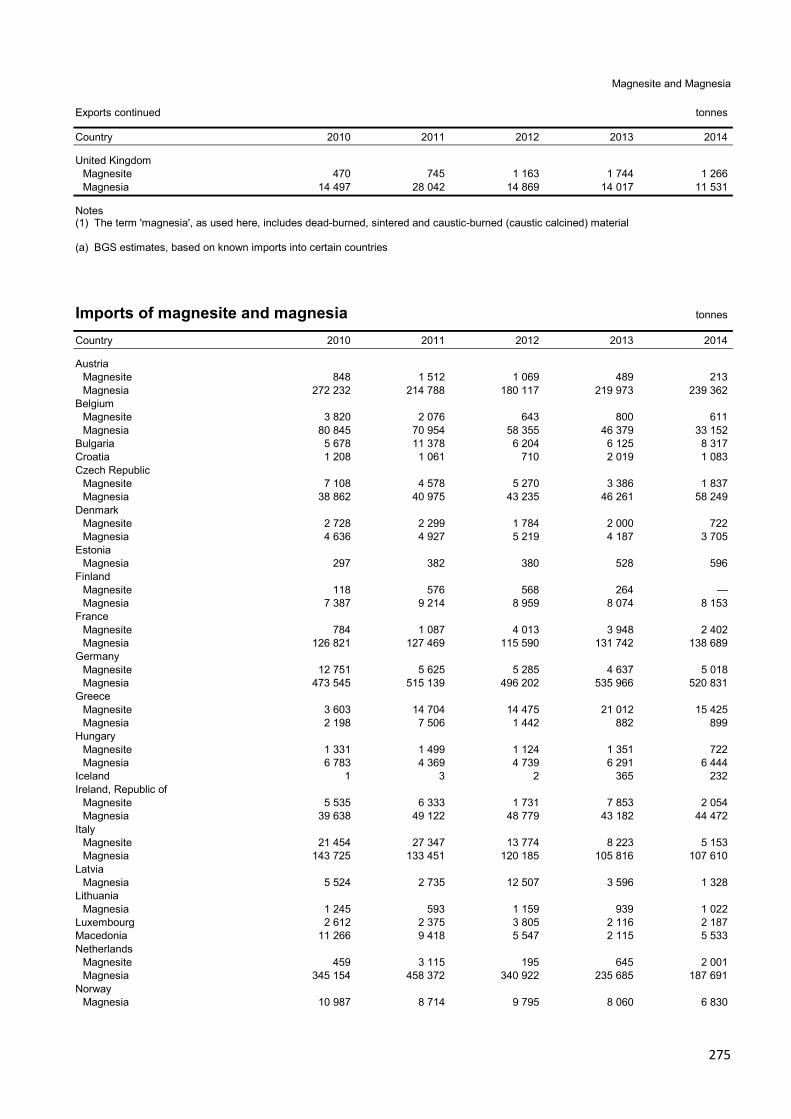
275
Magnesite and Magnesia
Exports continued tonnes Country 2010 2011 2012 2013 2014 United Kingdom Magnesite 470 745 1 163 1 744 1 266 Magnesia 14 497 28 042 14 869 14 017 11 531
Notes (1) The term 'magnesia', as used here, includes dead-burned, sintered and caustic-burned (caustic calcined) material (a) BGS estimates, based on known imports into certain countries
Imports of magnesite and magnesia tonnes Country 2010 2011 2012 2013 2014 Austria Magnesite 848 1 512 1 069 489 213 Magnesia 272 232 214 788 180 117 219 973 239 362 Belgium Magnesite 3 820 2 076 643 800 611 Magnesia 80 845 70 954 58 355 46 379 33 152 Bulgaria 5 678 11 378 6 204 6 125 8 317 Croatia 1 208 1 061 710 2 019 1 083 Czech Republic Magnesite 7 108 4 578 5 270 3 386 1 837 Magnesia 38 862 40 975 43 235 46 261 58 249 Denmark Magnesite 2 728 2 299 1 784 2 000 722 Magnesia 4 636 4 927 5 219 4 187 3 705 Estonia Magnesia 297 382 380 528 596 Finland Magnesite 118 576 568 264 — Magnesia 7 387 9 214 8 959 8 074 8 153 France Magnesite 784 1 087 4 013 3 948 2 402 Magnesia 126 821 127 469 115 590 131 742 138 689 Germany Magnesite 12 751 5 625 5 285 4 637 5 018 Magnesia 473 545 515 139 496 202 535 966 520 831 Greece Magnesite 3 603 14 704 14 475 21 012 15 425 Magnesia 2 198 7 506 1 442 882 899 Hungary Magnesite 1 331 1 499 1 124 1 351 722 Magnesia 6 783 4 369 4 739 6 291 6 444 Iceland 1 3 2 365 232 Ireland, Republic of Magnesite 5 535 6 333 1 731 7 853 2 054 Magnesia 39 638 49 122 48 779 43 182 44 472 Italy Magnesite 21 454 27 347 13 774 8 223 5 153 Magnesia 143 725 133 451 120 185 105 816 107 610 Latvia Magnesia 5 524 2 735 12 507 3 596 1 328 Lithuania Magnesia 1 245 593 1 159 939 1 022 Luxembourg 2 612 2 375 3 805 2 116 2 187 Macedonia 11 266 9 418 5 547 2 115 5 533 Netherlands Magnesite 459 3 115 195 645 2 001 Magnesia 345 154 458 372 340 922 235 685 187 691 Norway Magnesia 10 987 8 714 9 795 8 060 6 830

276
Magnesite and magnesia
Imports continued tonnes Country 2010 2011 2012 2013 2014 Poland Magnesite 3 966 1 375 1 948 659 590 Magnesia 113 757 137 148 116 632 103 475 125 579 Portugal Magnesite 1 162 1 379 1 249 1 652 801 Magnesia 4 504 5 523 7 130 9 037 9 406 Romania Magnesia 10 389 13 391 11 402 8 838 9 393 Serbia Magnesia 570 547 623 899 907 Slovakia Magnesite 3 916 4 960 (a)* 2 000 (a)* 3 000 (a)* 1 766 Magnesia 28 639 27 100 23 363 20 405 25 213 Slovenia 7 279 64 675 109 365 128 518 129 116 Spain Magnesite 3 926 6 164 2 675 2 189 13 109 Magnesia 99 436 105 674 91 916 65 530 71 435 Sweden Magnesia 12 004 20 425 19 081 18 068 21 886 Switzerland Magnesite 362 793 521 1 122 50 Magnesia 4 625 4 917 5 734 13 961 12 034 Turkey Magnesia 60 121 58 556 50 199 56 723 58 607 United Kingdom Magnesite 8 640 7 903 5 059 5 015 5 258 Magnesia 49 076 52 263 70 330 69 822 65 730
Notes (1) The term 'magnesia', as used here, includes dead-burned, sintered and caustic-burned (caustic calcined) material (a) BGS estimates, based on known exports from certain countries
Magnesite and magnesia - EU36 trade in 2014
-300 -200 -100 0 100 200 300 400 500 600
GermanyAustria
NetherlandsFrance
SloveniaPoland
ItalySpain
United KingdomCzech Republic
TurkeyIreland, Republic of
BelgiumSlovakiaSwedenGreece
SwitzerlandPortugalRomaniaBulgariaFinland
HungaryNorway
MacedoniaDenmark
LuxembourgSerbia
Thousand tonnes
Imports Exports
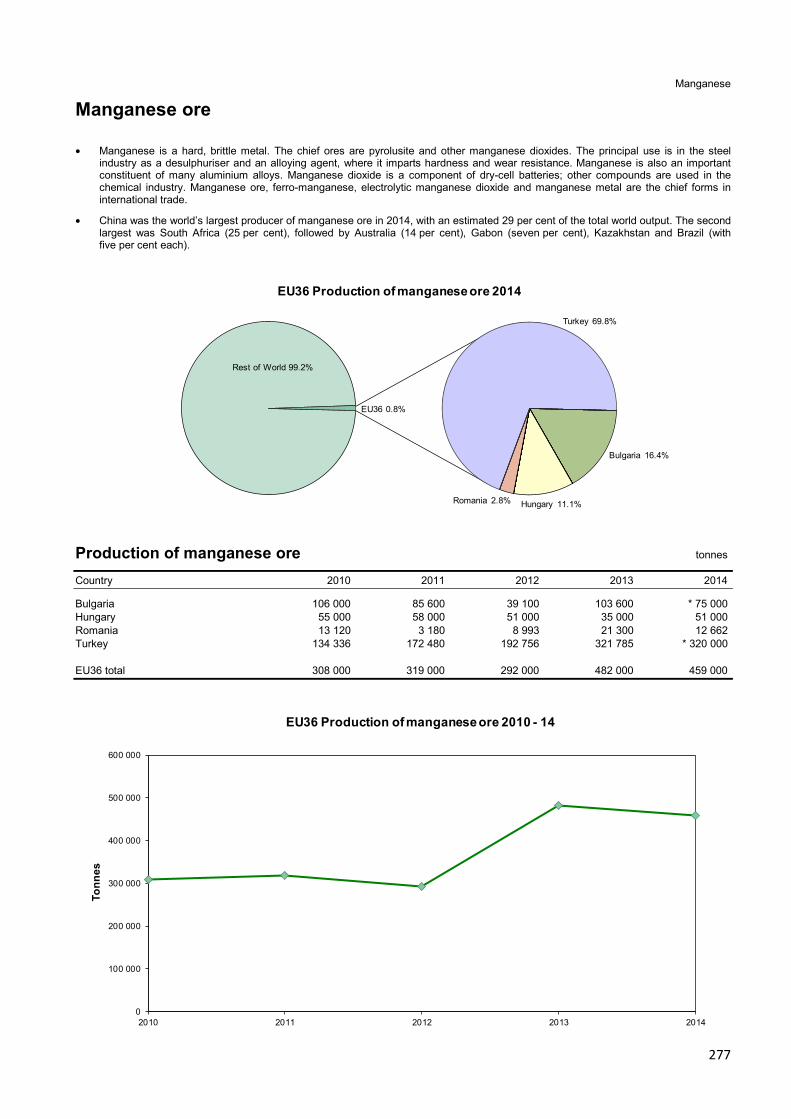
277
Manganese
Manganese ore
• Manganese is a hard, brittle metal. The chief ores are pyrolusite and other manganese dioxides. The principal use is in the steel industry as a desulphuriser and an alloying agent, where it imparts hardness and wear resistance. Manganese is also an important constituent of many aluminium alloys. Manganese dioxide is a component of dry-cell batteries; other compounds are used in the chemical industry. Manganese ore, ferro-manganese, electrolytic manganese dioxide and manganese metal are the chief forms in international trade.
• China was the world’s largest producer of manganese ore in 2014, with an estimated 29 per cent of the total world output. The second largest was South Africa (25 per cent), followed by Australia (14 per cent), Gabon (seven per cent), Kazakhstan and Brazil (with five per cent each).
Rest of World 99.2%
Bulgaria 16.4%
Hungary 11.1%Romania 2.8%
Turkey 69.8%
EU36 0.8%
EU36 Production of manganese ore 2014
Production of manganese ore tonnes
Country 2010 2011 2012 2013 2014 Bulgaria 106 000 85 600 39 100 103 600 * 75 000 Hungary 55 000 58 000 51 000 35 000 51 000 Romania 13 120 3 180 8 993 21 300 12 662 Turkey 134 336 172 480 192 756 321 785 * 320 000 EU36 total 308 000 319 000 292 000 482 000 459 000
0
100 000
200 000
300 000
400 000
500 000
600 000
2010 2011 2012 2013 2014
Tonn
es
EU36 Production of manganese ore 2010 - 14

278
Manganese
Exports of manganese tonnes Country 2010 2011 2012 2013 2014 Belgium Ores & concentrates 4 444 9 982 4 236 7 751 5 003 Metal 1 185 1 625 1 447 2 959 4 828 Bulgaria Ores & concentrates 163 257 91 110 76 140 50 390 73 996 Czech Republic Ores & concentrates — 50 383 65 32 Finland Metal 32 25 2 1 1 179 France Ores & concentrates (a) 152 425 125 827 118 915 130 333 36 460 Metal 717 805 1 081 582 135 Germany Ores & concentrates 4 480 5 035 4 387 4 114 3 215 Metal 8 243 8 907 13 598 9 758 10 285 Italy Metal 716 963 897 600 470 Netherlands Ores & concentrates 21 806 29 097 27 154 30 072 29 303 Metal 38 159 44 310 29 855 26 866 27 634 Norway Ores & concentrates 10 709 2 600 39 355 8 211 2 100 Metal 112 462 95 0 — Poland Metal 2 875 41 97 198 313 Romania Ores & concentrates ... ... 9 085 6 623 23 231 Slovakia Ores & concentrates — 7 508 — — 3 029 Spain Ores & concentrates 707 623 621 5 367 1 537 Metal 1 297 1 735 4 665 3 880 4 106 Turkey Ores & concentrates 51 731 100 172 118 953 310 479 126 140 Metal 4 952 12 3 535 1 468 943 United Kingdom Ores & concentrates 97 129 101 284 3 983 Metal (b) * 2 000 * 2 100 * 1 600 * 1 200 * 700
Notes (1) Metal traded in ferro-alloy form is included under Iron, Steel and Ferro-alloys (a) Including manganiferous iron ore (b) BGS estimates, based on known imports into certain countries
Imports of manganese tonnes Country 2010 2011 2012 2013 2014 Austria Ores & concentrates 152 334 222 198 223 Metal 16 696 21 123 21 692 20 665 25 822 Belgium Ores & concentrates 49 731 49 393 50 509 51 271 49 950 Metal 4 377 5 466 4 636 5 946 10 178 Bulgaria Ores & concentrates 5 133 — 7 893 2 523 Czech Republic Ores & concentrates 25 758 28 810 335 14 189 18 671 Metal 984 907 521 629 746 Denmark Ores & concentrates 257 1 051 352 566 804 Estonia Metal 576 85 — 71 24

279
Manganese
Imports continued tonnes Country 2010 2011 2012 2013 2014 Finland Ores & concentrates 21 961 3 792 329 248 229 Metal 2 134 2 123 2 144 1 747 1 818 France Ores & concentrates (a) 721 272 647 182 562 298 572 043 308 163 Metal 17 586 21 186 9 231 10 304 11 272 Germany Ores & concentrates (a) 17 346 19 137 18 532 18 872 17 359 Metal 43 346 40 705 35 671 32 039 34 320 Greece Ores & concentrates 22 888 51 374 26 294 22 943 22 304 Metal 292 175 855 1 029 1 623 Hungary Ores & concentrates 198 159 142 304 229 Metal 336 461 500 589 659 Ireland, Republic of Ores & concentrates (a) 54 9 565 31 19 37 Italy Ores & concentrates (a) 55 284 81 629 107 907 27 243 27 243 Metal 5 788 5 759 5 804 6 274 5 095 Latvia Ores & concentrates 27 92 97 200 201 Macedonia Ores & concentrates 56 893 110 589 42 109 503 70 Netherlands Ores & concentrates 23 045 33 555 66 281 38 141 414 471 Metal 50 866 35 618 40 131 30 706 25 735 Norway Ores & concentrates 1 121 716 1 085 383 1 072 991 992 832 1 092 278 Metal 1 974 2 697 1 636 2 158 1 851 Poland Ores & concentrates 4 345 4 509 4 951 5 459 52 330 Metal 1 514 436 764 1 030 1 378 Portugal Ores & concentrates 68 56 168 38 205 Romania Ores & concentrates 87 880 66 285 244 13 77 Metal 220 588 415 517 698 Serbia Ores & concentrates 17 003 14 366 4 229 5 829 8 780 Metal 324 317 254 184 183 Slovakia Ores & concentrates 146 434 130 519 144 936 127 764 54 955 Metal 442 659 228 207 304 Slovenia Metal 433 420 483 417 486 Spain Ores & concentrates 407 450 508 794 413 613 542 836 595 513 Metal 7 510 10 951 6 470 7 047 8 461 Sweden Ores & concentrates 522 438 412 504 535 Metal 3 815 5 241 3 438 4 838 5 889 Switzerland Ores & concentrates 214 333 357 181 207 Metal 556 509 490 385 284 Turkey Ores & concentrates 694 1 295 534 529 565 Metal 980 1 202 863 1 356 1 890 United Kingdom Ores & concentrates (a) 1 517 1 656 1 597 2 168 3 232 Metal 6 619 5 444 3 721 3 796 3 629
Notes (1) Metal traded in ferro-alloy form is included under Iron, Steel and Ferro-alloys (a) Including manganiferous iron ore
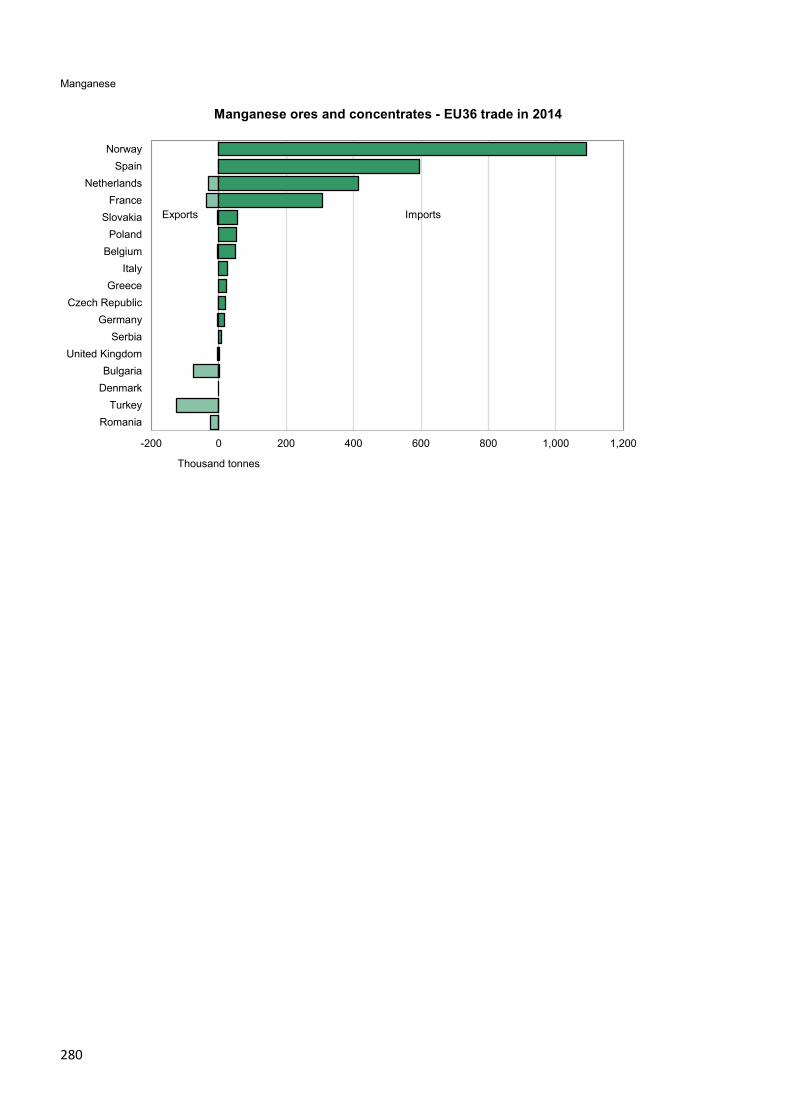
280
Manganese
Manganese ores and concentrates - EU36 trade in 2014
-200 0 200 400 600 800 1,000 1,200
NorwaySpain
NetherlandsFrance
SlovakiaPoland
BelgiumItaly
GreeceCzech Republic
GermanySerbia
United KingdomBulgaria
DenmarkTurkey
Romania
Thousand tonnes
Imports Exports

281
Mercury
Mercury
• Mercury is the only metallic element that is liquid at room temperature. The chief economic sources are deposits of the mineral cinnabar but mercury is also recovered from base metal refining. Mercury’s main uses are in electrical switches and other control apparatus, and in dental amalgam. Large amounts remain in use in chlor-alkali plants and in batteries but these applications are being phased out.
• Only nine countries commercially extracted mercury in 2014. China was the world’s largest producer, with 78 per cent of the total world output. The second largest was Mexico (10 per cent), followed by Tajikistan (four per cent), Russia and Kyrgyzstan (two per cent each).
Production of mercury kilograms Country 2010 2011 2012 2013 2014
Finland 9 000 5 000 — — —
Notes (1) Several countries are believed to have unrecorded production of mercury from copper electrowinning processes
0
1 000
2 000
3 000
4 000
5 000
6 000
7 000
8 000
9 000
10 000
2010 2011 2012 2013 2014
Kilo
gram
s
EU36 Production of mercury 2010 - 14
Exports of mercury kilograms Country 2010 2011 2012 2013 2014 Austria (a) * 3 300 * 1 600 * 500 * 200 * 400 Belgium 11 500 600 8 700 7 900 110 Finland 9 321 4 830 — — — France 1 595 49 992 2 233 1 092 1 216 Germany 110 405 197 989 102 650 133 626 57 942 Hungary 6 400 10 700 6 500 22 800 4 100 Italy 202 273 68 623 12 706 8 743 1 322 Netherlands 195 272 72 020 67 263 64 995 1 806 Poland 106 100 7 300 — — — Portugal 200 6 700 25 600 — — Spain 964 922 824 421 950 824 1 008 952 1 123 184 Switzerland 8 529 53 581 164 517 132 596 87 222 Turkey 2 156 10 890 4 392 1 245 6 690 United Kingdom 9 321 5 368 2 991 3 405 10 421
Notes (a) BGS estimates, based on known imports into certain countries

282
Mercury
Imports of mercury kilograms Country 2010 2011 2012 2013 2014 Belgium 57 200 12 500 505 707 200 Czech Republic 2 561 6 651 3 842 3 783 20 046 Finland 2 203 4 069 36 17 31 France 19 073 1 406 252 180 402 Germany 104 241 134 666 52 469 46 484 19 254 Greece 211 1 200 7 500 900 2 400 Hungary 5 000 8 400 6 100 5 400 6 900 Ireland, Republic of 8 582 24 81 69 89 Italy 10 510 15 246 4 247 1 863 1 579 Netherlands 30 636 213 259 154 983 124 697 2 122 Poland 4 300 39 900 13 700 31 300 50 900 Portugal 152 900 125 400 59 18 30 Romania 18 149 19 500 4 200 2 600 1 800 Slovakia 4 700 27 700 10 000 3 000 5 000 Spain 335 852 54 748 54 994 70 325 10 054 Sweden 2 700 2 400 1 400 1 200 5 000 Switzerland 1 370 471 5 096 246 — Turkey 719 9 772 3 143 1 490 3 476 United Kingdom 22 065 425 21 138 41 836 4 259
Mercury - EU36 trade in 2014
-1,200 -1,000 -800 -600 -400 -200 0 200
PolandCzech Republic
GermanySpain
HungarySwedenSlovakia
United KingdomTurkeyGreece
NetherlandsRomania
ItalySwitzerland
Tonnes
Imports Exports

283
Mica
Mica
• Micas are a group of chemically complex rock-forming minerals recognisable by a perfect cleavage (i.e. they are naturally flaky). Sheet mica is used predominantly in electrical insulation and ground mica has a very wide variety of uses including filler, dusting agent, absorbent, fire insulator, strength enhancer in plastics and as a decorative material.
• China was the world’s largest producer in 2014, with an estimated 46 per cent of the total world output. The second largest was USA (14 per cent), followed by South Korea (seven per cent), France (six per cent) and Canada (five per cent).
Rest of World 88.9%
Finland 31.5%
France 53.2% Spain 9.2%
Turkey 6.1%EU36 11.1%
EU36 Production of mica 2014
Production of mica tonnes Country 2010 2011 2012 2013 2014 Finland 13 809 12 896 12 112 11 244 11 973 France (a) * 19 000 * 19 000 * 18 000 * 19 700 * 20 200 Spain (a) 4 034 3 609 3 518 3 462 3 500 Turkey 36 009 17 542 1 253 2 304 * 2 300 EU36 total 73 000 53 000 35 000 37 000 38 000
Notes (1) In addition to the countries listed, Romania is believed to produce mica (a) Including mica recovered from mica schists and/or kaolin beneficiation
0
10 000
20 000
30 000
40 000
50 000
60 000
70 000
80 000
2010 2011 2012 2013 2014
Tonn
es
EU36 Production of mica 2010 - 14

284
Mica
Exports of mica tonnes Country 2010 2011 2012 2013 2014 Austria 4 303 4 245 4 024 3 554 3 411 Belgium 1 590 2 363 3 587 2 561 3 110 Czech Republic 96 163 212 82 56 Finland 11 377 8 636 9 242 11 073 7 909 France 12 455 12 821 11 771 13 352 13 200 Germany 4 197 4 479 4 474 6 157 4 774 Italy 697 1 014 1 138 1 336 1 440 Netherlands 1 687 2 396 1 986 1 897 2 246 Norway 2 078 2 144 2 093 2 447 2 289 Spain Unmanufactured 1 339 1 846 1 826 1 904 2 075 Ground 2 269 2 193 1 993 613 923 Turkey 601 1 039 1 054 624 572 United Kingdom 4 137 4 238 3 639 4 679 4 714
Notes (1) This table shows unmanufactured mica and includes sheet, block, splitting’s, ground and waste, unless these are separately specified.
Mica powder is included under the term 'ground'
Imports of mica tonnes
Country 2010 2011 2012 2013 2014 Austria 874 656 625 493 339 Belgium Unmanufactured 2 636 2 395 4 331 1 893 2 402 Ground 4 086 4 722 3 314 3 803 3 452 Waste 8 120 1 212 929 1 114 Czech Republic 2 513 740 915 604 901 Denmark 237 150 148 185 165 Finland 3 647 3 351 2 267 208 265 France Unmanufactured 255 848 488 541 393 Ground 1 861 2 149 1 828 1 941 1 649 Germany Unmanufactured 1 330 10 527 8 934 7 986 8 043 Ground 29 716 26 405 24 116 24 104 26 407 Waste 428 20 — — — Greece 169 175 155 211 165 Ireland, Republic of 77 24 32 43 1 151 Italy Unmanufactured 136 209 205 187 141 Ground 3 854 3 849 3 489 3 329 3 572 Netherlands Unmanufactured 191 419 418 540 158 Ground 21 756 20 744 4 632 4 504 5 565 Waste 748 462 24 0 ... Norway Unmanufactured 1 224 1 573 1 964 2 027 500 Ground 1 179 294 285 193 797 Waste ... ... 82 355 896 Poland 1 150 2 019 1 504 1 459 1 711 Portugal 284 288 258 263 219 Romania 785 1 077 810 1 039 841 Spain 1 183 1 538 1 017 1 538 1 819 Sweden 673 545 419 429 488 Switzerland 1 226 866 893 630 713 Turkey 317 508 285 483 407

285
Mica
Imports continued tonnes
Country 2010 2011 2012 2013 2014 United Kingdom Unmanufactured 43 243 407 131 160 Ground 7 341 7 926 9 203 7 307 7 891 Waste 902 0 0 24 —
Notes (1) This table shows unmanufactured mica and includes sheet, block, splitting’s, ground and waste, unless these are separately specified.
Mica powder is included under the term 'ground'

286
Molybdenum
Molybdenum
• Molybdenum is a hard metal. It is an important component of high tensile steel where it imparts hardness, tolerance of high temperatures and resistance to corrosion. Molybdenum disulphide is used as a dry lubricant.
• Molybdenum is generally produced as a by-product of copper mining. Production in 2014 was confined to only 14 countries, of which China was the world’s largest producer, with 42 per cent of the total world output. The second largest was USA (22 per cent), followed by Chile (17 per cent), Peru (six per cent) and Mexico (five per cent).
Mine production of molybdenum tonnes (metal content)
Country 2010 2011 2012 2013 2014 Norway ... ... 4 8 2 Turkey — 3 — 1 * 1
Exports of molybdenum tonnes Country 2010 2011 2012 2013 2014 Austria Metal (a) * 2 300 * 2 800 * 2 500 * 2 500 * 3 200 Belgium Ores & concentrates 24 396 25 337 19 444 18 384 19 546 Metal 371 128 204 650 880 Oxides 83 366 688 59 116 Bulgaria Ores & concentrates ... ... 101 304 265 Metal 122 355 133 139 138 Czech Republic Oxides 25 25 20 214 221 Estonia Ores & concentrates 40 80 180 848 260 France Ores & concentrates 205 352 81 30 157 Metal 47 36 317 262 1 025 Germany Ores & concentrates 5 017 3 955 3 738 3 127 2 540 Metal 763 1 248 1 395 1 475 1 473 Italy Ores & concentrates 1 523 2 299 3 153 2 503 6 023 Metal 911 443 409 76 728 Oxides 443 286 22 126 139 Netherlands Ores & concentrates 17 126 19 765 24 083 29 792 30 292 Metal 249 492 128 141 251 Oxides 6 429 6 434 6 407 7 319 6 956 Romania Ores & concentrates ... ... 652 525 — Spain Metal 243 14 69 79 30 Turkey Ores & concentrates 160 266 — 1 498 1 522 Metal 42 64 11 22 2 United Kingdom Ores & concentrates 305 3 64 — — Metal 572 403 375 472 797 Scrap 490 299 280 355 514
Notes (1) Metal traded in ferro-alloy form is included under iron, steel and ferro-alloys (a) BGS estimates, based on known imports into certain countries

287
Molybdenum
Imports of molybdenum tonnes Country 2010 2011 2012 2013 2014 Austria Ores & concentrates ... ... — — 8 151 Metal 548 951 440 414 917 Belgium Ores & concentrates 46 899 42 498 39 523 45 135 48 791 Metal 142 235 304 720 929 Oxides 694 1 204 1 659 1 542 862 Bulgaria Metal 10 193 9 3 2 Czech Republic Metal 82 104 57 64 69 Denmark Oxides 418 253 345 570 644 Finland Ores & concentrates (a)* 1 724 (a)* 1 679 (a)* 2 013 3 864 5 531 France Ores & concentrates 1 209 1 764 1 575 1 653 2 228 Metal 888 1 098 942 998 1 072 Oxides 1 095 1 465 1 365 1 387 1 128 Germany Ores & concentrates 9 134 9 500 7 158 6 165 4 354 Metal 3 038 3 761 4 016 3 479 3 760 Oxides 2 890 2 699 2 385 2 423 2 619 Hungary Metal 70 60 51 60 59 Italy Ores & concentrates 9 108 5 248 4 794 5 394 5 310 Metal 136 219 192 161 506 Oxides 276 199 187 128 114 Lithuania Metal 65 37 45 6 18 Netherlands Ores & concentrates 35 335 40 562 39 782 30 242 22 784 Metal 274 261 236 154 152 Oxides 594 865 596 617 648 Poland Metal 889 1 292 72 72 99 Oxides 162 198 237 195 224 Romania Ores & concentrates 1 41 1 516 1 2 Metal 31 9 4 2 1 622 Slovenia Ores & concentrates 561 523 473 476 717 Spain Ores & concentrates 2 585 3 572 3 041 3 136 4 211 Metal 239 83 78 42 47 Sweden Ores & concentrates 5 487 5 893 6 110 5 988 6 218 Metal 644 360 356 160 172 Oxides 414 357 496 880 673 United Kingdom Ores & concentrates 12 581 15 844 16 041 14 396 16 629 Metal 1 099 1 415 1 487 1 271 1 649 Oxides 1 638 2 316 1 971 2 101 2 723
Notes (1) Metal traded in ferro-alloy form is included under iron, steel and ferro-alloys (a) BGS estimates, based on known exports from certain countries

288
Nickel
Nickel
• Nickel is a hard, strong, corrosion-resistant, malleable and ductile metal that is a good conductor of heat and electricity. Its most important use is in steel alloys where it imparts strength and toughness. It is also widely used in plating, both metals and plastics, and combined with copper in cupro-nickel alloys.
• The Philippines was the world’s largest producer of mined nickel in 2014, with 18 per cent of the total world output. The second largest was Russia (13 per cent), followed by Australia (12 per cent), Canada (11 per cent) and Indonesia (ten per cent).
• China was the world’s largest producer of refined nickel in 2014, with 36 per cent of the total world output. The second largest was Russia (12 per cent), followed by Japan (nine per cent), Australia and Canada (six per cent each).
Rest of World 97.2%
Albania 8.3%
Finland 34.0%
Greece 36.9%
Others 1.8%
Spain 14.9%
Turkey 4.1%EU36 2.8%
EU36 Mine production of nickel 2014
Mine production of nickel tonnes (metal content) Country 2010 2011 2012 2013 2014 Albania 1 954 914 750 2 151 4 791 Finland 12 100 18 244 19 073 18 560 19 700 Greece 16 100 21 700 21 600 19 100 21 400 Macedonia * 1 800 * 3 600 * 1 700 — — Norway 348 339 351 296 290 Poland 570 850 840 570 780 Spain 6 296 — 2 398 7 574 8 631 Turkey 2 539 848 3 805 1 076 2 400 EU36 total 41 700 46 500 50 500 49 300 58 000
0
10 000
20 000
30 000
40 000
50 000
60 000
70 000
2010 2011 2012 2013 2014
Tonn
es (m
etal
con
tent
)
EU36 Mine production of nickel 2010 - 14

289
Nickel
Rest of World 88.7%
Finland 19.5%
France 3.8%Greece 8.4%
Macedonia 8.3%
Norway 41.3%
Others 0.8%
United Kingdom 17.8%
EU36 11.3%
EU36 Smelter/refinery production of nickel 2014
Smelter/refinery production of nickel tonnes Country 2010 2011 2012 2013 2014 Austria * 1 000 * 1 000 * 1 000 * 1 000 * 1 000 Finland 49 772 49 823 46 275 44 498 42 750 France 12 900 13 700 13 200 12 100 8 400 Greece 13 960 18 530 18 630 16 800 18 481 Macedonia 14 400 17 300 19 200 20 000 18 100 Norway 92 185 92 427 91 687 91 017 90 526 Poland 600 900 800 600 800 United Kingdom 31 600 37 400 34 300 40 400 39 100 EU36 total 216 400 231 100 225 100 226 400 219 200 Notes (1) Data relate to refined nickel plus the nickel content of ferro-nickel, nickel oxide and nickel salts
0
50 000
100 000
150 000
200 000
250 000
2010 2011 2012 2013 2014
Tonn
es
EU36 Smelter/refinery production of nickel 2010 - 14

290
Nickel
Exports of nickel tonnes Country 2010 2011 2012 2013 2014 Albania Ores & concentrates ... ... 103 191 605 239 379 Scrap 1 7 477 7 ... Austria Unwrought (a) 208 234 351 305 626 Scrap 1 606 2 709 2 633 3 322 5 402 Belgium Mattes, sinters etc 697 2 380 3 328 2 379 1 053 Unwrought 9 271 9 684 11 517 12 067 11 189 Unwrought alloys 1 357 1 838 3 838 14 106 12 268 Oxides 221 910 498 1 080 282 Scrap 3 443 7 430 2 407 2 953 11 773 Bulgaria Scrap 1 220 2 ... 9 10 Czech Republic Unwrought (a) 126 272 725 1 668 1 151 Oxides 341 338 380 289 259 Scrap 4 558 3 427 6 851 6 560 3 125 Denmark Scrap 1 765 1 244 590 314 278 Estonia Unwrought (a) 2 2 539 (a) 2 (a) 24 Scrap 0 536 144 20 — Finland Ores & concentrates 8 946 23 411 55 260 139 017 103 378 Mattes, sinters etc ... 7 732 13 387 9 473 0 Unwrought (a) 31 275 (a) 39 472 36 364 36 113 (a) 34 617 Oxides (b) * 500 * 200 * 200 * 150 * 140 Scrap 323 33 39 130 416 France Mattes, sinters etc 315 1 306 1 384 1 240 1 177 Unwrought 9 376 10 997 11 477 9 535 6 462 Unwrought alloys 1 307 1 875 1 818 2 517 3 707 Scrap 30 601 11 685 12 683 9 164 10 253 Germany Ores & concentrates 2 673 299 778 74 2 222 Mattes, sinters etc 13 981 15 998 19 412 18 951 22 490 Unwrought 3 751 4 184 4 808 4 922 5 921 Unwrought alloys 1 866 4 423 5 036 5 336 8 353 Scrap 9 563 8 600 7 727 6 516 9 923 Greece Ores & concentrates 20 284 120 86 37 25 Ireland, Republic of Scrap 557 269 208 188 162 Italy Unwrought (a) 2 408 2 097 2 182 2 766 2 898 Scrap 3 537 627 1 260 710 926 Latvia Scrap 3 108 2 284 150 291 304 Macedonia Ores & concentrates 60 181 25 579 16 219 3 575 4 Netherlands Ores & concentrates 40 (b)* 11 3 787 (b)* 1 145 309 Mattes, sinters etc (b) * 1 800 * 2 400 * 1 400 * 980 * 490 Unwrought (a) 165 49 681 46 929 45 573 51 310 Oxides ... 1 456 1 398 1 433 1 205 Scrap 1 956 1 793 1 405 2 948 3 252 Norway Ores & concentrates 4 818 7 598 7 969 5 433 5 397 Unwrought 91 813 92 705 91 591 89 413 86 210 Scrap 1 042 582 499 674 404 Poland Mattes, sinters etc 1 134 — — 28 2 Unwrought (a) 1 876 (a) 252 (a) 917 2 617 (a) 3 303 Scrap 416 749 709 319 369

291
Nickel
Exports continued tonnes Country 2010 2011 2012 2013 2014 Romania Scrap 816 561 66 131 65 Slovakia Unwrought 68 84 — 1 095 2 147 Scrap 295 1 368 217 149 158 Slovenia Unwrought (a) 1 544 520 692 527 1 075 Spain Ores & concentrates 106 913 26 597 20 739 100 228 133 552 Unwrought (a) 738 400 570 390 1 377 Oxides 11 1 104 125 232 Scrap 366 376 454 339 1 284 Sweden Unwrought (a) 497 599 1 690 385 1 021 Oxides 534 516 429 406 401 Scrap 1 022 1 137 13 853 1 265 1 396 Switzerland Unwrought (a) 173 130 62 63 103 Scrap 1 090 909 1 214 1 069 1 649 Turkey Ores & concentrates 172 682 378 350 302 100 104 212 163 916 Unwrought (a) 292 (a) 96 (a) 204 (a) 223 373 Scrap 519 841 783 992 1 273 United Kingdom Unwrought 18 639 28 994 30 322 31 742 27 358 Unwrought alloys 4 530 6 025 6 711 7 324 7 629 Scrap 19 361 17 405 33 614 20 994 15 772
Notes (1) In this table the term 'unwrought' nickel corresponds to item 7502 of the Harmonised System which excludes all electro-plating anodes (2) Metal traded in ferro-alloy form is included under iron, steel and ferro-alloys (a) Including alloys (b) BGS estimates, based on known imports into certain countries
Imports of nickel tonnes Country 2010 2011 2012 2013 2014 Austria Unwrought (a) 6 894 9 231 8 830 8 004 9 062 Oxides 15 8 247 63 7 Scrap 440 527 1 917 4 359 4 375 Belgium Mattes, sinters etc 330 598 1 541 3 770 968 Unwrought 15 052 19 170 19 032 19 343 20 768 Unwrought alloys 469 574 3 035 11 930 10 110 Oxides 700 1 033 576 1 322 284 Scrap 918 1 553 1 907 2 109 787 Bulgaria Unwrought (a) 125 201 172 160 167 Czech Republic Unwrought (a) 2 560 3 748 3 761 2 368 5 757 Oxides 393 399 307 298 307 Scrap 1 257 178 1 311 1 016 470 Denmark Scrap 382 234 227 303 182 Finland Mattes, sinters etc 33 986 35 284 30 443 29 502 19 562 Ores & concentrates 217 164 276 892 276 587 240 116 307 179 Unwrought 14 558 9 946 — 7 878 1 233 Unwrought alloys 17 649 2 688 — 490 4 729

292
Nickel
Imports continued tonnes Country 2010 2011 2012 2013 2014 France Mattes, sinters etc 19 921 19 954 19 395 19 053 12 042 Unwrought 13 964 21 693 24 002 16 608 20 214 Unwrought alloys 5 029 7 345 5 466 4 943 5 979 Oxides 524 412 114 66 56 Scrap 2 164 2 988 2 713 3 063 3 036 Germany Mattes, sinters etc 849 2 048 1 869 766 545 Ores & concentrates 1 667 1 184 8 185 1 637 3 042 Unwrought 69 282 68 023 73 360 66 360 60 726 Unwrought alloys 8 023 11 778 23 191 7 844 11 039 Oxides 621 476 608 532 510 Scrap 8 584 11 924 14 191 10 135 11 858 Hungary Unwrought (a) 346 (a) 35 (a) 47 (a) 159 302 Ireland, Republic of Unwrought (a) 1 503 1 748 568 409 181 Italy Mattes, sinters etc 1 4 78 1 281 903 Unwrought 39 586 38 075 33 635 28 985 30 904 Unwrought alloys 1 171 1 314 2 626 9 793 6 651 Scrap 1 063 656 899 1 330 1 554 Latvia Unwrought ... 0 584 1 30 Macedonia Ores & concentrates 1 210 300 1 393 490 1 518 156 1 259 734 1 391 103 Netherlands Ores & concentrates 5 940 9 544 744 0 — Unwrought ... 50 510 32 005 41 856 45 272 Unwrought alloys 638 3 548 982 1 126 1 386 Oxides (b) * 50 * 70 * 150 * 253 * 96 Scrap 10 852 4 607 2 584 2 803 4 208 Norway Mattes, sinters etc 170 365 199 173 190 275 178 840 162 202 Unwrought (a) 235 246 250 175 131 Poland Mattes, sinters etc 1 223 7 — 10 — Unwrought (a) 3 350 2 722 3 189 3 208 2 518 Oxides 38 28 263 29 35 Scrap 341 603 325 447 447 Portugal Unwrought 312 221 285 405 327 Romania Unwrought (a) 456 224 190 216 193 Slovakia Unwrought (a) 112 617 103 2 659 1 855 Scrap 52 312 35 1 35 Slovenia Unwrought (a) 2 967 3 230 4 304 4 469 4 190 Spain Ores & concentrates 5 1 — 6 888 11 492 Unwrought 16 540 17 495 20 230 18 352 22 034 Unwrought alloys 2 033 2 593 2 049 1 510 1 203 Oxides 329 323 131 43 28 Scrap 151 806 554 386 728 Sweden Mattes, sinters etc 1 239 1 723 1 008 777 179 Unwrought 23 375 23 191 17 878 17 406 18 291 Unwrought alloys 397 216 542 1 226 839 Scrap 10 491 10 332 8 801 8 898 9 881 Switzerland Unwrought (a) 1 370 1 199 1 320 1 224 1 214 Turkey Unwrought (a) 3 391 4 047 4 012 4 233 4 332 Oxides 144 108 104 170 189

293
Nickel
Imports continued tonnes Country 2010 2011 2012 2013 2014 United Kingdom Mattes, sinters etc 50 263 58 519 57 108 63 129 59 194 Unwrought 14 200 12 707 11 521 8 130 9 031 Unwrought alloys 3 310 4 644 4 771 4 309 3 771 Scrap 8 154 6 741 9 237 9 887 11 000
Notes (1) In this table the term 'unwrought' nickel corresponds to item 7502 of the Harmonised System which excludes all electro-plating anodes (2) Metal traded in ferro-alloy form is included under iron, steel and ferro-alloys (a) Including alloys (b) BGS estimates, based on known exports from certain countries
Nickel ore, mattes and sinters - EU36 trade in 2014
Nickel metal - EU36 trade in 2014
-400 -200 0 200 400 600 800 1,000 1,200 1,400
MacedoniaFinlandNorway
United KingdomFranceSpain
GermanyBelgiumTurkey
Albania
Thousand tonnes
Imports Exports
-100 -80 -60 -40 -20 0 20 40 60 80
GermanyNetherlands
ItalyBelgiumFranceSpain
SwedenUnited Kingdom
AustriaFinland
Czech RepublicTurkey
SloveniaPoland
SlovakiaSwitzerland
PortugalHungaryNorway
Thousand tonnes
Imports Exports

294
Petroleum and natural gas
Crude petroleum
• Petroleum (‘oil’) is a fundamental energy resource and raw material for lubricants, olefins, polymers (plastics) and other synthetic materials.
• Saudi Arabia was the world’s largest producer in 2014, with 13 per cent of the total world output, closely followed by the USA and Russia (also with 13 per cent each). These three countries were followed by the China (five per cent), Canada and the United Arab Emirates (four per cent each).
Rest of World 96.0%
Denmark 4.9%
Italy 3.5%
Norway 56.0%
Others 9.6% Romania 2.4%
United Kingdom 23.7%
EU36 4.0%
EU36 Production of crude petroleum 2014
Production of crude petroleum tonnes Country 2010 2011 2012 2013 2014 Albania 742 012 894 530 1 029 319 1 203 638 1 342 451 Austria 875 969 838 052 837 561 847 952 883 016 Bulgaria 22 400 21 400 23 600 27 400 * 26 100 Croatia 748 791 664 440 620 835 620 795 558 327 Czech Republic 173 000 163 000 150 000 152 000 147 000 Denmark 12 090 000 10 909 000 9 968 000 8 657 000 8 159 150 Estonia (a) 2 080 000 2 173 132 2 180 313 2 379 253 2 359 463 France 896 000 895 000 806 500 793 000 * 800 000 Germany 2 511 174 2 677 136 2 633 000 2 638 379 2 429 789 Greece 86 000 87 126 83 143 62 233 59 743 Hungary 735 900 657 000 700 931 626 890 * 600 000 Italy 5 080 498 5 286 042 5 376 629 5 480 000 5 750 000 Lithuania 114 464 113 895 101 644 86 054 80 862 Netherlands 1 414 000 1 464 000 1 467 000 1 519 000 1 900 000 Norway 105 146 000 100 343 000 94 497 000 90 387 000 93 294 000 Poland 686 487 618 163 677 664 960 672 984 216 Romania 4 172 411 4 081 979 3 992 011 3 994 122 3 922 784 Serbia 865 499 1 020 490 1 124 794 1 163 988 1 112 303 Slovakia 16 000 18 000 14 000 13 000 13 000 Slovenia 233 263 279 298 366 Spain 121 528 99 925 143 526 367 569 305 263 Turkey 2 602 114 * 2 600 000 2 957 000 2 508 894 2 373 000 United Kingdom 62 962 000 51 972 000 44 560 000 40 646 000 39 550 000 EU36 total 204 100 000 187 600 000 173 900 000 165 100 000 166 700 000 Notes (1) The figures shown in this table exclude natural gasoline (a) From oil shale

295
Petroleum and natural gas
0
50 000
100 000
150 000
200 000
250 000
2010 2011 2012 2013 2014
Thou
sand
tonn
esEU36 Production of crude petroleum 2010 - 14
Exports of crude petroleum tonnes Country 2010 2011 2012 2013 2014 Albania 537 315 696 762 1 000 850 1 251 513 (a)* 863 000 Belgium 2 593 653 2 278 613 2 085 993 2 149 195 2 472 878 Czech Republic 18 239 18 685 21 470 24 673 26 518 Denmark 7 363 518 6 899 354 5 896 071 6 000 228 4 157 006 Estonia — 1 062 3 124 12 056 11 532 France 161 761 467 914 427 246 67 524 4 352 Germany 180 515 283 784 138 712 108 761 31 014 Greece — — — 235 324 58 598 Hungary ... ... 1 353 65 964 15 294 Ireland, Republic of 96 46 629 62 — — Italy 423 777 713 237 920 740 573 665 617 854 Latvia 524 42 208 45 767 5 690 105 267 Lithuania 110 597 80 025 78 183 66 924 62 678 Netherlands 340 357 81 621 396 475 8 886 727 9 007 981 Norway 79 030 886 70 031 846 64 341 641 59 375 084 62 177 588 Poland 3 186 730 211 223 402 670 420 124 Romania 78 256 76 061 48 688 60 128 51 070 Slovakia 13 048 15 359 11 515 10 042 9 398 Spain 2 7 592 14 11 1 416 095 Sweden 2 3 105 22 040 2 797 699 Turkey (a) * 1 139 000 * 702 000 * 99 000 * 2 371 000 * 2 057 000 United Kingdom 41 591 305 34 304 184 33 679 090 35 581 067 37 109 307
Notes (a) BGS estimates, based on known imports into certain countries
Imports of crude petroleum tonnes Country 2010 2011 2012 2013 2014 Albania 21 972 28 163 276 ... ... Austria 6 770 069 7 358 582 7 463 478 7 831 498 7 663 094 Belgium 35 234 358 34 059 177 35 087 312 32 729 841 37 638 864 Bulgaria 5 355 541 4 999 511 5 901 767 5 726 184 5 073 523 Croatia 3 517 452 2 838 313 2 324 685 2 461 651 1 851 207 Czech Republic 7 770 418 6 968 871 7 024 223 6 630 606 7 313 020 Denmark 2 562 669 2 625 412 3 150 386 4 274 735 3 344 297 Finland 11 211 580 11 504 505 11 088 493 11 639 775 11 608 880 France 59 946 970 62 875 826 56 890 280 55 608 981 51 305 516 Germany 91 239 711 87 338 296 92 277 990 91 465 347 87 502 814 Greece 19 064 118 13 010 825 20 102 882 20 292 638 20 907 404

296
Petroleum and natural gas
Imports continued tonnes Country 2010 2011 2012 2013 2014 Hungary 5 310 899 5 935 772 5 489 453 5 741 800 6 057 010 Ireland, Republic of 2 931 391 2 720 968 2 843 575 2 989 606 2 776 466 Italy 76 729 305 72 173 373 68 812 837 57 467 112 52 923 689 Latvia 376 1 453 99 2 575 67 892 Lithuania 9 018 334 8 943 996 8 523 368 9 077 111 7 478 509 Macedonia 852 361 685 090 258 896 51 521 — Netherlands 60 408 191 55 108 848 63 505 928 63 201 586 62 072 337 Norway 1 508 241 1 238 531 1 305 413 1 815 872 1 220 705 Poland 22 009 801 22 870 416 24 629 744 23 141 408 23 577 998 Portugal 11 251 958 10 152 747 11 456 025 11 600 330 11 149 051 Romania 5 821 640 5 451 662 5 127 631 5 299 043 6 727 423 Serbia 1 869 881 1 497 415 1 091 762 1 596 462 1 434 923 Slovakia 5 555 541 5 988 119 5 345 149 5 821 927 5 479 990 Spain 52 714 224 51 960 524 58 285 251 58 583 900 62 353 860 Sweden 18 236 284 17 988 419 20 429 251 15 900 863 17 390 820 Switzerland 4 534 930 4 302 674 3 231 713 4 891 059 4 963 792 Turkey 16 873 392 18 049 163 19 479 238 20 091 078 17 481 481 United Kingdom 50 447 008 53 647 056 56 471 508 48 380 730 46 831 399
Crude petroleum - EU36 trade in 2014
-80 -60 -40 -20 0 20 40 60 80 100
GermanySpain
NetherlandsItaly
FranceUnited Kingdom
BelgiumPolandGreeceTurkey
SwedenFinland
PortugalAustria
LithuaniaCzech Republic
RomaniaHungarySlovakiaBulgaria
SwitzerlandDenmark
Ireland, Republic ofCroatiaSerbia
NorwayLatvia
Albania
Million tonnes
Imports Exports

297
Petroleum and natural gas
Natural gas
• Natural gas is an increasingly important fundamental energy resource. It is used chiefly as a fuel but also a basic feedstock for chemicals such as propane and butane, and in the manufacture of ammonia and fertilisers. It is transported either by pipeline, often over transcontinental distances, or by ships in the form of liquefied natural gas (LNG).
• USA was the world’s largest producer in 2014, with 20 per cent of the total world output. The second largest was Russia (with 18 per cent), followed by Qatar and Iran (five per cent each), Canada and China (with four per cent).
Rest of World 92.7%
Denmark 1.7%
Germany 3.9%
Italy 2.8%
Netherlands 25.5%
Norway 41.9%
Others 2.8%Poland 2.2%
Romania 4.4%
United Kingdom 14.8%
EU36 7.3%
EU36 Production of natural gas 2014
Production of natural gas million m3 Country 2010 2011 2012 2013 2014 Albania 2 1 18 19 33 Austria 1 713 1 591 1 729 1 359 1 245 Bulgaria 74 443 390 282 181 Croatia 2 727 2 471 2 013 1 862 1 804 Czech Republic 201 187 204 207 198 Denmark 7 792 6 262 5 480 4 566 4 502 France 736 623 538 340 28 Germany 13 666 12 952 11 706 10 678 10 060 Greece 7 6 6 5 * 5 Hungary 2 600 2 315 2 205 2 028 2 055 Ireland, Republic of (a) 402 357 381 343 354 Italy 7 900 8 300 8 540 7 710 7 280 Netherlands 83 944 76 429 76 020 81 479 66 324 Norway 107 800 101 697 114 918 108 746 108 820 Poland 5 666 5 825 5 783 5 790 5 660 Romania 11 138 11 164 11 095 11 135 11 345 Serbia 423 616 672 660 631 Slovakia 106 106 93 91 87 Slovenia 7 2 2 3 3 Spain 58 58 65 62 20 Turkey 626 536 547 562 * 550 United Kingdom 59 707 47 733 41 054 38 475 38 517 EU36 total 307 000 280 000 283 000 276 000 260 000 Notes (1) So far as possible the figures in this table exclude flared or reinjected gas (a) Sales
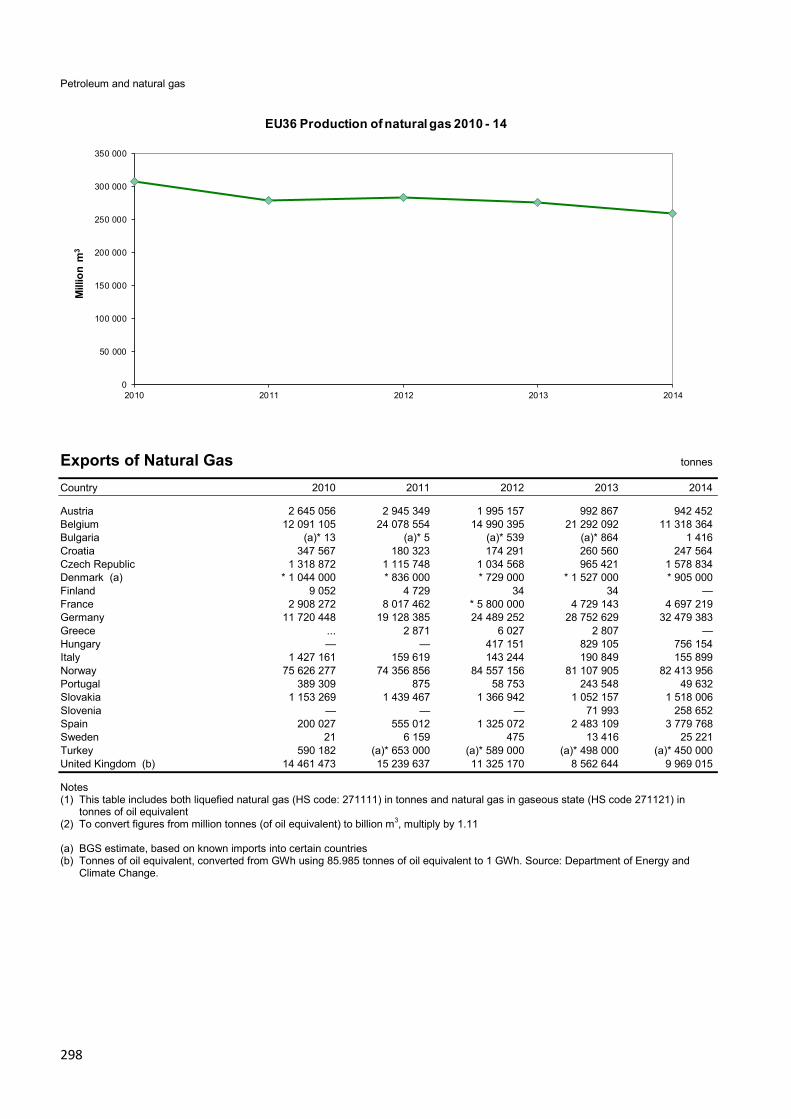
298
Petroleum and natural gas
0
50 000
100 000
150 000
200 000
250 000
300 000
350 000
2010 2011 2012 2013 2014
Mill
ion
m3
EU36 Production of natural gas 2010 - 14
Exports of Natural Gas tonnes Country 2010 2011 2012 2013 2014 Austria 2 645 056 2 945 349 1 995 157 992 867 942 452 Belgium 12 091 105 24 078 554 14 990 395 21 292 092 11 318 364 Bulgaria (a)* 13 (a)* 5 (a)* 539 (a)* 864 1 416 Croatia 347 567 180 323 174 291 260 560 247 564 Czech Republic 1 318 872 1 115 748 1 034 568 965 421 1 578 834 Denmark (a) * 1 044 000 * 836 000 * 729 000 * 1 527 000 * 905 000 Finland 9 052 4 729 34 34 — France 2 908 272 8 017 462 * 5 800 000 4 729 143 4 697 219 Germany 11 720 448 19 128 385 24 489 252 28 752 629 32 479 383 Greece ... 2 871 6 027 2 807 — Hungary — — 417 151 829 105 756 154 Italy 1 427 161 159 619 143 244 190 849 155 899 Norway 75 626 277 74 356 856 84 557 156 81 107 905 82 413 956 Portugal 389 309 875 58 753 243 548 49 632 Slovakia 1 153 269 1 439 467 1 366 942 1 052 157 1 518 006 Slovenia — — — 71 993 258 652 Spain 200 027 555 012 1 325 072 2 483 109 3 779 768 Sweden 21 6 159 475 13 416 25 221 Turkey 590 182 (a)* 653 000 (a)* 589 000 (a)* 498 000 (a)* 450 000 United Kingdom (b) 14 461 473 15 239 637 11 325 170 8 562 644 9 969 015
Notes (1) This table includes both liquefied natural gas (HS code: 271111) in tonnes and natural gas in gaseous state (HS code 271121) in
tonnes of oil equivalent (2) To convert figures from million tonnes (of oil equivalent) to billion m3, multiply by 1.11 (a) BGS estimate, based on known imports into certain countries (b) Tonnes of oil equivalent, converted from GWh using 85.985 tonnes of oil equivalent to 1 GWh. Source: Department of Energy and
Climate Change.

299
Petroleum and natural gas
Imports of natural gas tonnes Country 2010 2011 2012 2013 2014 Austria 8 697 934 9 390 448 10 043 171 7 317 311 7 096 338 Belgium 14 144 704 13 250 074 12 979 827 12 670 698 13 060 915 Bulgaria 2 003 357 2 551 044 1 925 287 1 688 459 1 643 658 Croatia 587 846 579 005 971 008 1 032 104 768 131 Czech Republic 7 471 522 7 175 884 5 652 749 6 622 377 5 413 601 Denmark 103 236 198 423 315 464 419 357 197 175 Estonia 491 806 478 288 452 299 535 232 382 921 Finland 3 252 037 3 543 126 (a)* 3 000 000 2 152 696 (a)* 1 373 France 41 624 014 50 897 525 (a)* 37 000 000 35 767 086 29 549 860 Germany 82 784 241 87 762 701 92 961 372 98 149 729 101 080 184 Greece 3 520 510 4 233 660 3 927 266 2 835 500 2 127 817 Hungary 5 858 735 5 788 348 5 509 482 6 064 192 7 844 861 Ireland, Republic of 4 738 918 4 430 360 4 282 222 4 372 123 4 111 051 Italy 59 616 091 50 506 295 48 666 707 43 720 221 39 108 795 Latvia 1 160 668 1 099 045 1 034 139 1 081 866 924 514 Lithuania 2 048 906 2 385 268 2 265 929 1 954 603 1 760 365 Luxembourg 3 591 3 077 1 441 — 1 188 Macedonia 79 059 93 816 96 877 93 567 103 041 Netherlands (a) * 11 044 000 * 12 153 000 * 10 107 568 * 2 884 000 * 3 026 000 Norway 4 393 1 005 444 36 23 Portugal 3 849 819 3 543 064 3 231 198 3 456 751 3 109 506 Romania * 2 000 000 3 283 138 (a)* 200 000 (a)* 260 000 417 705 Serbia 1 346 955 1 362 390 1 289 674 1 201 886 1 028 997 Slovakia 5 765 254 5 747 975 5 577 333 5 378 551 4 475 375 Slovenia 828 674 736 641 662 178 719 982 802 609 Spain 27 795 263 27 529 122 26 622 307 26 177 038 25 681 312 Sweden 1 066 174 899 467 816 561 804 417 745 739 Switzerland 2 759 930 2 521 494 2 644 533 2 857 193 2 536 886 United Kingdom (b) 50 244 561 50 045 076 46 191 572 45 144 017 39 999 792
Notes (1) This table includes both liquefied natural gas (HS code: 271111) in tonnes and natural gas in gaseous state (HS code 271121) in
tonnes of oil equivalent (2) To convert figures from million tonnes (of oil equivalent) to billion m3, multiply by 1.11 (a) BGS estimate, based on known exports from certain countries (b) Tonnes of oil equivalent, converted from GWh using 85.985 GWh to 1 tonne of oil equivalent. Source: Department of Energy and
Climate Change.
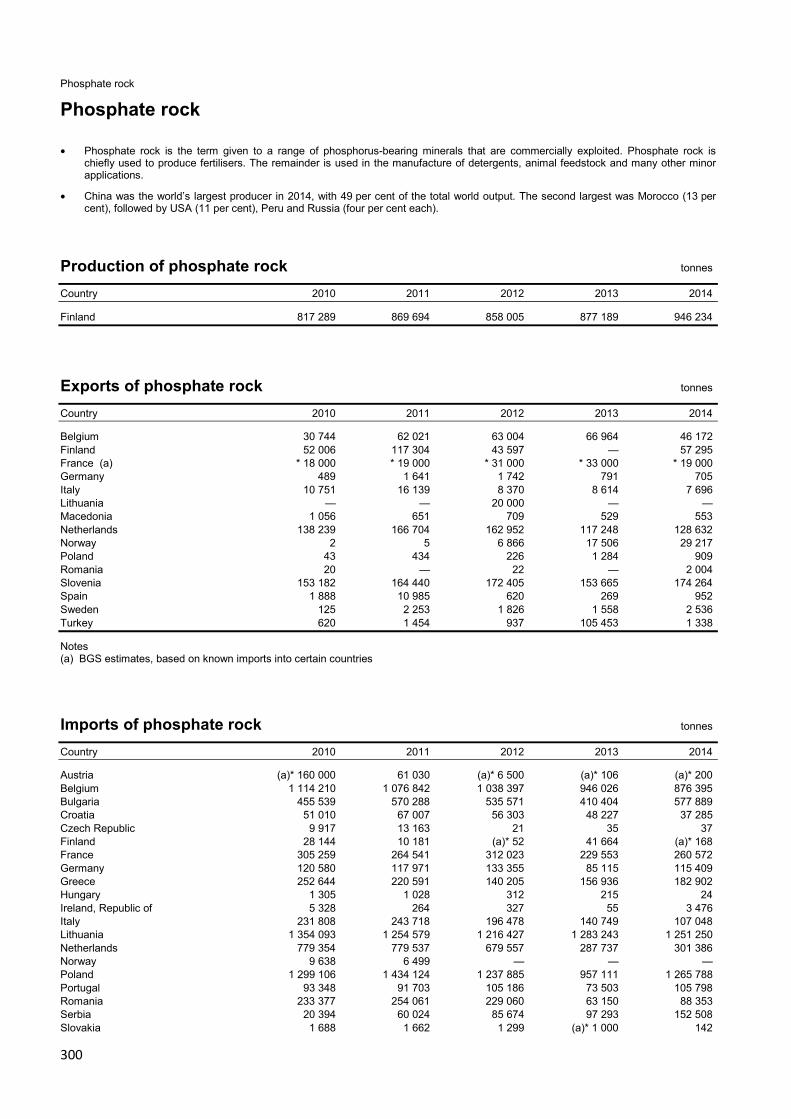
300
Phosphate rock
Phosphate rock
• Phosphate rock is the term given to a range of phosphorus-bearing minerals that are commercially exploited. Phosphate rock is chiefly used to produce fertilisers. The remainder is used in the manufacture of detergents, animal feedstock and many other minor applications.
• China was the world’s largest producer in 2014, with 49 per cent of the total world output. The second largest was Morocco (13 per cent), followed by USA (11 per cent), Peru and Russia (four per cent each).
Production of phosphate rock tonnes Country 2010 2011 2012 2013 2014
Finland 817 289 869 694 858 005 877 189 946 234
Exports of phosphate rock tonnes Country 2010 2011 2012 2013 2014 Belgium 30 744 62 021 63 004 66 964 46 172 Finland 52 006 117 304 43 597 — 57 295 France (a) * 18 000 * 19 000 * 31 000 * 33 000 * 19 000 Germany 489 1 641 1 742 791 705 Italy 10 751 16 139 8 370 8 614 7 696 Lithuania — — 20 000 — — Macedonia 1 056 651 709 529 553 Netherlands 138 239 166 704 162 952 117 248 128 632 Norway 2 5 6 866 17 506 29 217 Poland 43 434 226 1 284 909 Romania 20 — 22 — 2 004 Slovenia 153 182 164 440 172 405 153 665 174 264 Spain 1 888 10 985 620 269 952 Sweden 125 2 253 1 826 1 558 2 536 Turkey 620 1 454 937 105 453 1 338
Notes (a) BGS estimates, based on known imports into certain countries
Imports of phosphate rock tonnes Country 2010 2011 2012 2013 2014 Austria (a)* 160 000 61 030 (a)* 6 500 (a)* 106 (a)* 200 Belgium 1 114 210 1 076 842 1 038 397 946 026 876 395 Bulgaria 455 539 570 288 535 571 410 404 577 889 Croatia 51 010 67 007 56 303 48 227 37 285 Czech Republic 9 917 13 163 21 35 37 Finland 28 144 10 181 (a)* 52 41 664 (a)* 168 France 305 259 264 541 312 023 229 553 260 572 Germany 120 580 117 971 133 355 85 115 115 409 Greece 252 644 220 591 140 205 156 936 182 902 Hungary 1 305 1 028 312 215 24 Ireland, Republic of 5 328 264 327 55 3 476 Italy 231 808 243 718 196 478 140 749 107 048 Lithuania 1 354 093 1 254 579 1 216 427 1 283 243 1 251 250 Netherlands 779 354 779 537 679 557 287 737 301 386 Norway 9 638 6 499 — — — Poland 1 299 106 1 434 124 1 237 885 957 111 1 265 788 Portugal 93 348 91 703 105 186 73 503 105 798 Romania 233 377 254 061 229 060 63 150 88 353 Serbia 20 394 60 024 85 674 97 293 152 508 Slovakia 1 688 1 662 1 299 (a)* 1 000 142
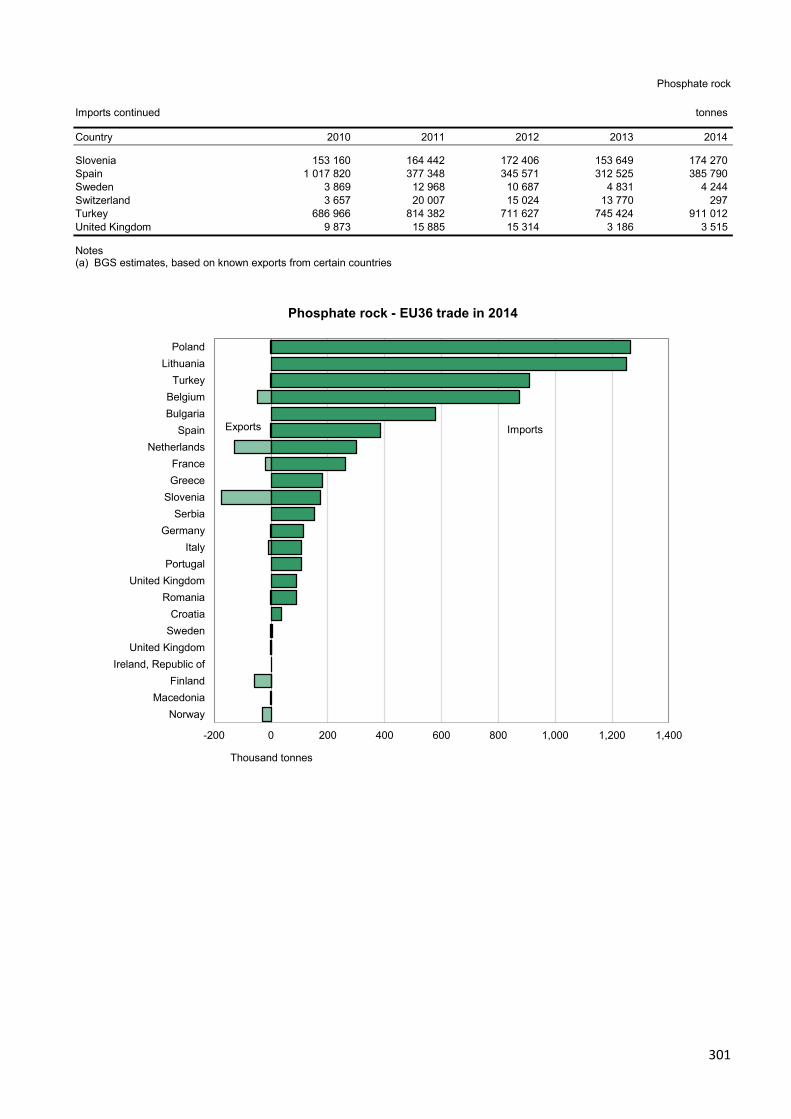
301
Phosphate rock
Imports continued tonnes Country 2010 2011 2012 2013 2014 Slovenia 153 160 164 442 172 406 153 649 174 270 Spain 1 017 820 377 348 345 571 312 525 385 790 Sweden 3 869 12 968 10 687 4 831 4 244 Switzerland 3 657 20 007 15 024 13 770 297 Turkey 686 966 814 382 711 627 745 424 911 012 United Kingdom 9 873 15 885 15 314 3 186 3 515
Notes (a) BGS estimates, based on known exports from certain countries
Phosphate rock - EU36 trade in 2014
-200 0 200 400 600 800 1,000 1,200 1,400
PolandLithuania
TurkeyBelgiumBulgaria
SpainNetherlands
FranceGreece
SloveniaSerbia
GermanyItaly
PortugalUnited Kingdom
RomaniaCroatia
SwedenUnited Kingdom
Ireland, Republic ofFinland
MacedoniaNorway
Thousand tonnes
Imports Exports

302
Platinum Metals
Platinum group metals
• The platinum group metals (PGMs) are platinum, palladium, rhodium, ruthenium, osmium and iridium. Of these, platinum and palladium are the most commercially significant. Platinum and palladium have important applications in electronics, jewellery and as catalysts (in catalytic converters for vehicles and in many industrial processes). They are also investment commodities.
• South Africa was the world’s largest producer of platinum in 2014, with 64 per cent of the total world output. The second largest was Russia (15 per cent), followed by Zimbabwe (nine per cent), Canada (seven per cent), and the USA (two per cent).
• Russia was the world’s largest producer of palladium in 2014, with 44 per cent of the total world output. The second largest was South Africa (32 per cent), followed by Canada (ten per cent), USA (seven per cent) and Zimbabwe (six per cent).
• South Africa was also the largest producer of other platinum group metals in 2014, with 84 per cent of the world output. Other producers were Russia and Zimbabwe (seven per cent each), and Canada (three per cent).
Mine production of platinum group metals kilograms (metal content) Country 2010 2011 2012 2013 2014 Finland Platinum — — 429 946 1 060 Palladium — — 379 766 808 Poland Platinum 30 23 39 51 * 60 Palladium 20 13 23 30 * 30 Serbia Platinum — 6 3 3 * 3 Palladium 22 4 22 20 * 20 EU36 total 70 50 900 1 820 1 980 Notes (1) Wherever possible, figures relate to quantities of platinum group metals thought to be recovered from ores originating in the country
stated (2) In addition to the production listed, concentrates produced in Spain are believed to be processed in China to recover platinum group
metals
Exports of platinum group metals kilograms Country 2010 2011 2012 2013 2014 Austria Platinum & platinum metals £83 434 000 £110 119 000 £105 895 000 £101 611 000 £72 848 000 Waste & scrap £1 070 000 £757 000 £733 000 £697 000 £389 000 Belgium Platinum & platinum metals 7 500 8 900 5 300 5 400 2 100 Waste & scrap 497 000 218 400 31 200 9 300 31 900 Bulgaria Platinum & platinum metals 1 15 22 8 519 Waste & scrap (a) * 16 000 * 23 000 * 21 000 * 37 000 * 28 000 Croatia Waste & scrap 53 996 24 958 36 441 35 000 (a)* 32 700 Czech Republic Platinum & platinum metals 6 800 2 900 2 800 3 500 130 700 Waste & scrap — 15 300 — 4 600 — Denmark Platinum & platinum metals 200 100 200 600 300 Estonia Platinum & platinum metals ... — 654 500 — Waste & scrap 7 700 9 100 8 800 103 800 133 700 Finland Platinum & platinum metals 6 238 6 684 3 927 8 475 2 044 Waste & scrap 723 75 454 37 096 51 332 France Platinum 1 884 2 566 4 139 4 662 16 425 Platinum metals 914 1 255 2 558 3 281 5 514 Waste & scrap 179 798 270 355 352 702 521 192 275 632

303
Platinum metals
Exports continued kilograms Country 2010 2011 2012 2013 2014 Germany Platinum 24 597 24 994 23 627 25 030 25 819 Palladium 35 462 43 952 43 524 44 596 36 703 Other platinum metals 33 299 28 158 21 018 23 890 23 716 Waste & scrap 5 997 852 6 960 588 6 047 948 6 088 890 6 174 615 Greece Platinum & platinum metals 345 106 883 37 1 500 Waste & scrap — ... 6 300 32 500 21 600 Hungary Platinum & platinum metals 211 158 — 118 9 418 Waste & scrap 92 300 91 200 149 100 36 600 14 000 Ireland, Republic of Platinum & platinum metals * 213 * 295 * 268 549 984 Waste & scrap 5 440 1 763 3 496 1 775 2 012 Italy Platinum 10 408 9 982 10 071 9 791 12 296 Platinum metals 12 684 14 436 16 259 23 339 36 220 Waste & scrap 634 37 750 2 899 6 425 22 415 Lithuania Waste & scrap 193 600 126 800 (a)* 153 000 (a)* 183 000 144 564 Luxembourg Platinum & platinum metals 243 197 469 477 — Waste & scrap 5 600 16 000 ... 100 — Netherlands Platinum £14 634 000 £9 386 000 £10 282 000 £6 146 000 £7 996 000 Platinum metals £7 953 000 £7 261 000 £5 329 000 £6 817 000 £4 605 000 Waste & scrap 1 877 220 5 714 1 445 97 519 Norway Platinum & platinum metals 9 714 11 951 13 707 10 088 9 262 Waste & scrap 157 937 36 399 63 560 19 969 3 814 Poland Platinum & platinum metals 1 100 2 400 400 900 900 Waste & scrap 300 3 400 63 900 425 200 538 900 Portugal Waste & scrap ... 15 100 3 200 1 600 300 Slovakia Platinum & platinum metals 5 800 84 100 29 400 1 800 2 100 Waste & scrap 111 764 97 152 30 600 Spain Platinum & platinum metals 2 347 1 255 21 889 467 717 322 509 Waste & scrap 291 877 163 420 68 805 106 813 601 265 Sweden Platinum & platinum metals £429 000 £1 203 000 £801 000 £1 550 000 £2 194 000 Waste & scrap 69 000 43 600 39 100 24 900 62 100 Switzerland Platinum 72 006 63 853 64 331 53 309 30 715 Palladium 70 662 60 859 56 950 50 029 42 138 Other platinum metals 464 494 836 977 1 252 Waste & scrap 314 061 289 174 241 307 365 333 260 344 Turkey Platinum & platinum metals 5 124 2 765 589 4 743 695 Waste & scrap 4 491 5 332 13 244 550 1 236 United Kingdom Platinum 24 464 37 836 55 114 42 712 74 068 Palladium 42 864 50 917 55 864 55 322 60 671 Other platinum metals 23 021 17 319 18 945 17 843 20 158 Waste & scrap 527 862 287 198 1 066 729 1 193 612 3 815 056
Notes (1) In this table the term 'Platinum' and/or 'Platinum metals' includes unwrought, partly worked and alloys (2) Kilograms have been used as the unit except where the only obtainable figure is the value. In these cases the national currency figure
has been converted to £ sterling. See explanatory notes at the front of this volume regarding currency conversions. (a) BGS estimates, based on known imports into certain countries

304
Platinum metals
Imports of platinum group metals kilograms Country 2010 2011 2012 2013 2014 Austria Platinum & platinum metals 1 400 4 100 500 2 600 1 100 Waste & scrap 100 21 400 1 100 700 5 500 Belgium Platinum & platinum metals 5 189 3 763 3 055 10 418 1 217 Cyprus Platinum & platinum metals (a) * 900 * 400 * 11 * 340 * 22 Czech Republic Platinum 25 000 2 100 13 100 1 200 1 400 Platinum metals 17 700 100 100 300 500 Waste & scrap 7 835 54 300 169 600 189 400 54 800 Denmark Platinum & platinum metals 2 300 1 367 500 1 600 200 Estonia Waste & scrap ... ... — 59 600 114 500 Finland Platinum & platinum metals 385 356 57 429 107 271 246 Waste & scrap ... ... — — 1 777 France Platinum 4 516 4 010 4 606 43 645 6 628 Palladium 2 706 25 607 7 919 10 272 10 355 Other platinum metals 300 270 264 1 308 950 Waste & scrap 143 885 296 178 122 641 411 440 329 640 Germany Platinum 40 983 38 019 32 874 33 128 38 066 Palladium 53 479 50 926 47 449 41 511 43 339 Other platinum metals 19 655 21 319 18 444 15 626 15 963 Waste & scrap 8 069 744 7 290 427 8 020 283 7 091 894 7 580 861 Greece Platinum & platinum metals 500 1 400 900 400 183 Hungary Platinum & platinum metals 1 300 84 — 38 29 Ireland, Republic of Platinum & platinum metals 9 470 7 826 13 879 15 171 41 557 Italy Platinum 12 545 10 630 7 417 8 436 15 766 Palladium 10 019 9 171 7 855 6 411 11 765 Other platinum metals 1 694 1 084 1 244 782 3 203 Waste & scrap 16 918 1 468 3 103 2 150 12 607 Latvia Waste & scrap (d)* 400 ... ... — — Lithuania Waste & scrap 76 400 64 600 4 800 59 500 98 000 Luxembourg Platinum & platinum metals 1 633 438 329 301 1 798 Macedonia Platinum & platinum metals 2 420 7 649 9 910 13 443 21 219 Netherlands Platinum £25 740 000 £73 911 000 £79 002 000 £15 407 000 £10 591 546 Platinum metals £13 014 000 £54 486 000 £31 440 000 £10 916 000 £9 319 288 Waste & scrap 260 515 411 332 5 883 116 333 6 003 Norway Platinum & platinum metals 1 425 1 430 758 955 813 Waste & scrap 1 362 1 160 1 403 1 225 1 290 Poland Platinum & platinum metals 5 100 2 700 1 800 300 900 Waste & scrap 19 1 100 33 000 143 200 Portugal Platinum & platinum metals 796 245 * 800 * 900 205 Waste & scrap ... ... — 3 600 28 600 Slovakia Platinum 1 625 761 2 662 700 2 339 500 1 544 400 101 800 Palladium 2 702 4 400 4 800 500 3 300 Spain Platinum & platinum metals (a) * 3 500 * 3 000 * 2 500 * 3 000 * 3 000 Waste & scrap 29 183 17 845 13 104 5 866 114 289

305
Platinum Metals
Imports continued kilograms Country 2010 2011 2012 2013 2014 Sweden Platinum & platinum metals £7 551 000 £8 430 000 £12 301 000 £8 081 000 £10 548 769 Waste & scrap 1 500 19 800 12 700 1 100 5 200 Switzerland Platinum 49 089 57 415 39 955 38 007 25 303 Palladium 41 454 43 310 27 123 28 836 25 681 Other platinum metals 813 873 1 065 1 488 1 252 Waste & scrap 912 680 459 360 413 819 410 984 421 031 United Kingdom Platinum 58 659 46 092 54 073 39 973 51 736 Palladium 73 184 42 167 59 803 49 348 34 191 Other platinum metals 9 487 7 768 4 374 6 953 5 339 Waste & scrap 819 769 1 556 736 2 163 943 1 186 431 838 025
Notes (1) In this table the term 'Platinum' and/or 'Platinum metals' includes unwrought, partly worked and alloys (2) Kilograms have been used as the unit except where the only obtainable figure is the value. In these cases the national currency figure
has been converted to £ sterling. See explanatory notes at the front of this volume regarding currency conversions. (a) BGS estimates, based on known exports from certain countries

306
Potash
Potash
• Potash is the name for a range of potassium-bearing minerals and processed chemical products. Potassium is essential in fertilisers and is widely used in the chemicals industry and in explosives.
• Canada was the world’s largest producer in 2014, with 29 per cent of the total world output. The second largest was Russia (19 per cent), followed by Belarus (16 per cent) and China (nine per cent).
Rest of World 88.0%
Germany 66.5%
Spain 20.7%
United Kingdom 12.8%EU36 12.0%
EU36 Production of potash 2014
Production of potash tonnes (K20 content)
Country 2010 2011 2012 2013 2014 Germany Potassic salts 3 023 941 3 214 696 3 149 386 3 075 201 3 126 913 Spain Chloride 513 222 520 555 421 652 711 272 972 045 United Kingdom Chloride * 403 800 * 462 000 * 540 000 * 540 000 * 600 000 EU36 total 3 941 000 4 197 000 4 111 000 4 326 000 4 699 000
0
1 000
2 000
3 000
4 000
5 000
6 000
2010 2011 2012 2013 2014
Thou
sand
tonn
es (K
2O c
onte
nt)
EU36 Production of potash 2010 - 14

307
Potash
Exports of potash tonnes Country 2010 2011 2012 2013 2014 Austria Potassic fertilisers 20 259 19 304 21 653 25 037 32 771 Belgium Chloride 64 018 100 097 217 498 65 796 27 879 Croatia Chloride 3 212 217 1 033 77 Czech Republic Potassic fertilisers 4 235 4 780 3 839 3 320 4 279 Denmark Chloride 69 2 123 2 579 2 628 5 425 Other potassic fertilisers 683 8 898 7 664 5 891 5 202 Estonia Potassic fertilisers 48 693 242 131 2 Finland Sulphate 53 850 * 61 000 * 75 000 * 72 000 * 77 000 France Sulphate 17 085 25 238 17 335 3 224 982 Chloride 36 215 15 947 65 461 66 100 55 048 Other potassic fertilisers 1 788 2 772 3 714 2 660 1 276 Germany Potassic fertilisers (a)(b) 3 023 941 3 214 696 3 149 386 3 075 201 3 126 913 Greece Potassic fertilisers 1 294 431 336 575 300 Hungary Potassic fertilisers 5 697 5 805 7 664 13 513 11 998 Italy Potassic fertilisers 13 629 8 702 8 551 9 426 9 698 Latvia Chloride 39 28 1 427 137 1 952 Potassic fertilisers 357 535 1 344 1 070 1 092 Lithuania Potassic fertilisers 6 517 4 256 7 989 6 381 8 210 Netherlands Sulphate 7 854 45 711 27 002 27 259 202 718 Chloride 174 453 227 456 395 684 327 663 280 860 Other potassic fertilisers 15 619 45 766 31 642 33 173 30 626 Poland Potassic fertilisers 10 687 10 078 3 999 15 678 27 845 Portugal Potassic fertilisers 612 895 3 901 10 878 4 350 Romania Chloride 5 218 303 390 99 24 Serbia Potassic fertilisers 690 3 672 3 546 2 288 957 Slovakia Potassic fertilisers 51 580 183 859 1 184 Spain Sulphate 6 474 3 713 4 873 4 150 5 078 Chloride 609 429 688 599 737 088 852 298 859 278 Other potassic fertilisers 2 365 2 385 3 020 1 879 2 251 Sweden Sulphate 93 796 84 381 69 205 79 724 99 551 Turkey Potassic fertilisers 6 533 6 504 3 654 6 620 5 558 United Kingdom Sulphate 71 108 118 428 469 Chloride (c) * 339 000 * 429 000 * 440 000 * 504 000 * 568 000 Other potassic fertilisers 420 5 283 15 732 29 558 53 838
Notes (a) K2O content (b) Including sulphate, chloride and other potassic fertilisers (c) BGS estimates, based on known imports into certain countries

308
Potash
Imports of potash tonnes Country 2010 2011 2012 2013 2014 Albania Other potassic fertilisers 650 88 48 30 ... Austria Sulphate 15 074 9 595 15 636 14 738 15 276 Chloride 105 299 102 028 132 302 125 318 146 317 Other potassic fertilisers 18 201 9 418 12 312 16 730 19 225 Belgium Sulphate 21 604 6 225 15 461 7 775 27 690 Chloride 744 987 1 511 805 740 726 717 027 660 878 Other potassic fertilisers 13 668 13 771 3 794 5 567 6 126 Bulgaria Potassic fertilisers 7 985 3 210 9 948 15 194 8 463 Croatia Chloride 132 471 102 879 115 375 75 526 90 036 Other potassic fertilisers 1 749 3 717 1 314 2 233 1 402 Czech Republic Chloride 82 710 87 248 75 651 72 531 90 502 Other potassic fertilisers 4 773 3 410 3 377 4 381 3 931 Denmark Sulphate 1 910 9 335 11 225 15 644 20 544 Chloride 36 608 42 472 30 823 41 611 63 047 Other potassic fertilisers 14 967 8 473 4 816 3 951 10 403 Estonia Chloride 1 517 1 898 2 438 3 120 4 669 Other potassic fertilisers 57 1 491 1 960 372 1 047 Finland Chloride (a) 194 800 211 100 207 500 232 400 226 500 Other potassic fertilisers 117 4 602 1 100 9 192 France Sulphate 51 068 40 885 75 743 86 471 85 795 Chloride 1 049 344 1 003 299 901 717 826 150 902 959 Other potassic fertilisers 13 998 6 814 13 696 15 213 20 530 Germany Sulphate 20 786 22 490 21 559 19 889 22 579 Chloride 131 645 131 244 146 673 172 910 198 212 Other potassic fertilisers 8 065 11 726 7 729 14 129 13 004 Greece Sulphate 39 155 26 686 26 621 24 778 19 421 Chloride 35 176 27 276 19 735 19 026 36 912 Other potassic fertilisers 3 240 8 166 2 947 2 276 192 Hungary Chloride 90 063 98 351 106 292 127 342 133 156 Other potassic fertilisers 5 760 6 161 5 449 5 141 7 798 Ireland, Republic of Chloride 99 181 95 816 85 536 146 361 175 688 Other potassic fertilisers 7 570 2 011 5 249 6 697 3 933 Italy Sulphate 88 593 58 418 52 568 59 966 43 124 Chloride 367 465 287 984 285 476 283 353 300 974 Other potassic fertilisers 8 415 1 368 511 416 481 Latvia Chloride 6 414 3 468 8 694 9 043 9 881 Lithuania Sulphate 2 581 7 069 6 267 4 521 3 127 Chloride 32 552 35 602 52 573 46 394 60 786 Other potassic fertilisers 4 112 1 837 98 162 Luxembourg Potassic fertilisers 1 681 1 167 1 252 1 832 1 722 Netherlands Sulphate 21 982 56 536 66 497 118 050 246 261 Chloride 430 138 756 966 905 233 851 210 978 368 Other potassic fertilisers 1 542 26 231 24 569 80 844 103 051 Norway Sulphate (b) * 99 000 * 65 000 * 27 782 * 49 000 * 455 000 Chloride (b) * 377 000 * 354 000 * 395 133 * 371 000 * 389 000 Other potassic fertilisers 612 287 320 235 2 348

309
Potash
Imports continued tonnes Country 2010 2011 2012 2013 2014 Poland Sulphate 19 155 23 281 23 883 28 911 38 846 Chloride 757 987 769 256 779 023 784 534 860 095 Other potassic fertilisers 4 442 10 317 11 544 17 079 25 937 Portugal Sulphate 3 840 4 405 10 798 27 020 10 290 Chloride 50 687 65 352 82 364 64 943 73 749 Other potassic fertilisers 1 899 2 596 5 395 8 477 3 952 Romania Sulphate 13 726 6 936 17 559 32 233 20 486 Chloride 56 922 46 842 21 354 46 300 49 333 Other potassic fertilisers 425 683 1 279 1 161 1 253 Serbia Chloride 71 906 53 113 69 712 57 629 66 813 Slovakia Chloride 22 561 24 631 23 613 18 670 12 171 Other potassic fertilisers 2 913 2 260 3 204 1 032 719 Slovenia Potassic fertilisers 1 919 2 076 1 447 1 574 1 610 Spain Sulphate 40 716 34 477 43 865 46 773 42 717 Chloride 209 552 221 210 232 397 242 393 220 390 Other potassic fertilisers 1 607 1 283 968 426 683 Sweden Sulphate 1 789 2 551 1 340 1 855 1 663 Chloride 55 671 79 863 81 282 74 406 92 734 Other potassic fertilisers 5 858 9 276 8 187 5 193 2 719 Switzerland Sulphate 4 914 5 899 6 638 5 248 8 023 Chloride 16 865 14 730 11 866 12 201 12 965 Other potassic fertilisers 2 049 1 159 1 136 990 805 Turkey Sulphate 34 986 28 989 36 459 22 799 25 613 Chloride 82 923 93 471 94 930 116 098 151 935 Other potassic fertilisers 1 075 109 107 113 127 United Kingdom Sulphate 15 766 13 232 10 795 10 905 16 513 Chloride 270 096 153 141 161 388 149 121 201 039 Other potassic fertilisers 10 565 2 373 7 899 8 484 8 875
Notes (a) K2O content (b) BGS estimates, based on known exports from certain countries

310
Potash
Potash - EU36 trade in 2014
-6,000 -5,000 -4,000 -3,000 -2,000 -1,000 0 1,000 2,000
NetherlandsFrancePolandNorwayBelgiumFinland
ItalySpain
GermanyUnited Kingdom
AustriaIreland, Republic of
TurkeyHungarySweden
Czech RepublicDenmark
CroatiaPortugalRomania
SerbiaLithuania
GreeceSwitzerland
SlovakiaLatvia
BulgariaEstonia
Thousand tonnes
Imports Exports
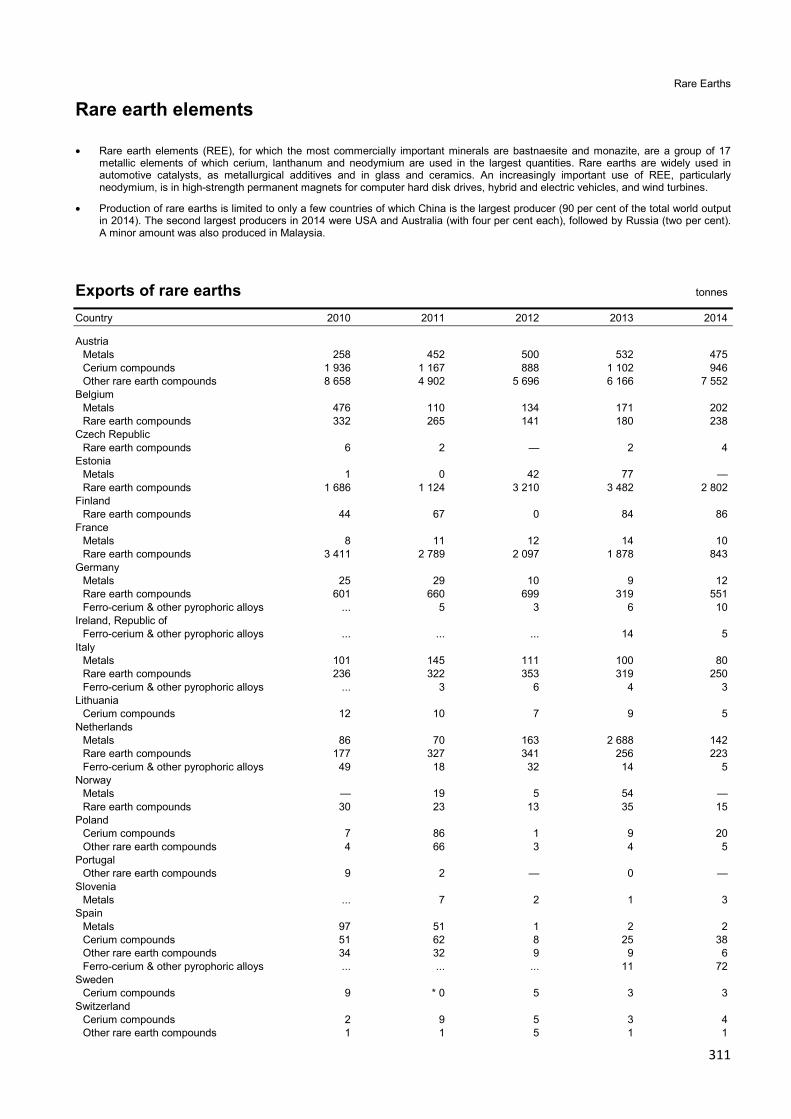
311
Rare Earths
Rare earth elements
• Rare earth elements (REE), for which the most commercially important minerals are bastnaesite and monazite, are a group of 17 metallic elements of which cerium, lanthanum and neodymium are used in the largest quantities. Rare earths are widely used in automotive catalysts, as metallurgical additives and in glass and ceramics. An increasingly important use of REE, particularly neodymium, is in high-strength permanent magnets for computer hard disk drives, hybrid and electric vehicles, and wind turbines.
• Production of rare earths is limited to only a few countries of which China is the largest producer (90 per cent of the total world output in 2014). The second largest producers in 2014 were USA and Australia (with four per cent each), followed by Russia (two per cent). A minor amount was also produced in Malaysia.
Exports of rare earths tonnes Country 2010 2011 2012 2013 2014 Austria Metals 258 452 500 532 475 Cerium compounds 1 936 1 167 888 1 102 946 Other rare earth compounds 8 658 4 902 5 696 6 166 7 552 Belgium Metals 476 110 134 171 202 Rare earth compounds 332 265 141 180 238 Czech Republic Rare earth compounds 6 2 — 2 4 Estonia Metals 1 0 42 77 — Rare earth compounds 1 686 1 124 3 210 3 482 2 802 Finland Rare earth compounds 44 67 0 84 86 France Metals 8 11 12 14 10 Rare earth compounds 3 411 2 789 2 097 1 878 843 Germany Metals 25 29 10 9 12 Rare earth compounds 601 660 699 319 551 Ferro-cerium & other pyrophoric alloys ... 5 3 6 10 Ireland, Republic of Ferro-cerium & other pyrophoric alloys ... ... ... 14 5 Italy Metals 101 145 111 100 80 Rare earth compounds 236 322 353 319 250 Ferro-cerium & other pyrophoric alloys ... 3 6 4 3 Lithuania Cerium compounds 12 10 7 9 5 Netherlands Metals 86 70 163 2 688 142 Rare earth compounds 177 327 341 256 223 Ferro-cerium & other pyrophoric alloys 49 18 32 14 5 Norway Metals — 19 5 54 — Rare earth compounds 30 23 13 35 15 Poland Cerium compounds 7 86 1 9 20 Other rare earth compounds 4 66 3 4 5 Portugal Other rare earth compounds 9 2 — 0 — Slovenia Metals ... 7 2 1 3 Spain Metals 97 51 1 2 2 Cerium compounds 51 62 8 25 38 Other rare earth compounds 34 32 9 9 6 Ferro-cerium & other pyrophoric alloys ... ... ... 11 72 Sweden Cerium compounds 9 * 0 5 3 3 Switzerland Cerium compounds 2 9 5 3 4 Other rare earth compounds 1 1 5 1 1

312
Rare Earths
Exports continued tonnes Country 2010 2011 2012 2013 2014 Turkey Cerium compounds 5 10 5 9 23 Ferro-cerium & other pyrophoric alloys ... ... ... 50 21 United Kingdom Metals 46 272 54 65 18 Cerium compounds 182 149 273 48 24 Other rare earth compounds 614 347 214 220 275 Ferro-cerium & other pyrophoric alloys 37 48 79 40 152
Notes (1) Rare earths are here taken to include yttrium and scandium
Imports of rare earths tonnes Country 2010 2011 2012 2013 2014 Austria Metals 550 325 442 595 429 Cerium compounds 1 766 1 310 696 979 765 Other rare earth compounds 3 375 1 646 802 1 630 1 973 Belgium Metals 411 205 136 205 6 Cerium compounds 323 289 146 204 401 Other rare earth compounds 172 58 41 52 19 Ferro-cerium & other pyrophoric alloys 2 0 7 0 1 Croatia Ferro-cerium & other pyrophoric alloys 106 133 116 52 29 Cyprus Cerium compounds 24 0 16 ... — Ferro-cerium & other pyrophoric alloys 18 ... — — 39 Czech Republic Metals 13 35 2 ... 1 Rare earth compounds 131 117 344 190 274 Ferro-cerium & other pyrophoric alloys 6 2 1 1 1 Denmark Cerium compounds 15 16 19 16 8 Other rare earth compounds 19 6 3 20 * 20 Estonia Cerium compounds 24 501 545 300 235 Other rare earth compounds 2 105 3 616 4 499 4 494 6 057 Finland Cerium compounds 72 52 18 23 14 Other rare earth compounds 8 14 5 3 1 Ferro-cerium & other pyrophoric alloys 2 2 10 12 11 France Metals 372 506 280 338 191 Cerium compounds 5 687 1 867 3 940 * 1 900 * 500 Other rare earth compounds 1 408 1 359 1 301 1 396 574 Ferro-cerium & other pyrophoric alloys 83 388 940 242 932 Germany Metals 459 263 290 267 276 Cerium compounds 1 006 844 553 862 1 601 Other rare earth compounds 9 999 6 904 4 155 5 862 5 618 Ferro-cerium & other pyrophoric alloys 6 14 11 13 12 Greece Rare earth compounds 3 4 11 12 3 Ferro-cerium & other pyrophoric alloys 65 62 169 20 1 Hungary Cerium compounds 38 33 31 20 42 Other rare earth compounds 31 23 31 11 15 Iceland Metals 350 77 ... ... ... Ireland, Republic of Rare earth compounds 8 85 3 2 4

313
Rare earths
Imports continued tonnes Country 2010 2011 2012 2013 2014 Italy Metals 124 108 30 62 96 Cerium compounds 597 616 337 565 220 Other rare earth compounds 303 307 257 232 276 Ferro-cerium & other pyrophoric alloys 10 3 3 1 3 Lithuania Rare earth compounds 14 11 10 11 4 Luxembourg Rare earth compounds 2 5 2 1 183 Ferro-cerium & other pyrophoric alloys 11 0 — — — Netherlands Metals 48 18 99 75 94 Cerium compounds 88 223 396 268 201 Other rare earth compounds 568 173 742 878 1 094 Ferro-cerium & other pyrophoric alloys 2 1 23 14 ... Norway Metals 148 552 438 439 361 Cerium compounds 1 13 3 — 3 Other rare earth compounds 8 9 9 17 11 Poland Metals 5 0 2 27 2 Cerium compounds 134 86 68 104 184 Other rare earth compounds 48 32 13 13 14 Portugal Metals 1 87 — 1 1 Cerium compounds 7 8 7 6 1 Other rare earth compounds 5 18 3 3 3 Romania Rare earth compounds 5 1 2 1 4 Slovakia Rare earth compounds 8 10 7 10 9 Slovenia Metals 98 26 55 61 65 Rare earth compounds 3 3 9 5 13 Spain Metals 421 9 19 93 296 Cerium compounds 543 636 455 729 457 Other rare earth compounds 216 102 155 438 266 Ferro-cerium & other pyrophoric alloys 41 33 22 35 209 Sweden Metals 37 48 72 62 52 Cerium compounds 47 55 31 1 1 Other rare earth compounds 7 9 16 37 21 Switzerland Metals 4 5 21 11 5 Cerium compounds 31 18 15 11 14 Other rare earth compounds 16 12 17 40 38 Ferro-cerium & other pyrophoric alloys ... 5 3 23 1 Turkey Metals 14 13 10 5 8 Cerium compounds 233 128 120 160 103 Other rare earth compounds 13 8 4 11 11 Ferro-cerium & other pyrophoric alloys ... ... 13 18 107 United Kingdom Metals 119 79 65 128 127 Cerium compounds 1 119 1 713 485 633 603 Other rare earth compounds 322 629 518 654 591 Ferro-cerium & other pyrophoric alloys 150 79 14 50 28
Notes (1) Rare earths are here taken to include yttrium and scandium

314
Salt
Salt
• Salt (sodium chloride) is a fundamental chemical of life. However, human consumption accounts for a small fraction of salt usage. Industrial use is far higher, particularly in the chemical industry as a source of soda and chlorine. Salt is also used to ‘grit’ roads to prevent the formation of ice between 0°C and -6°C.
• Most countries in the world have some salt production from rock salt, brine or seawater. China was the world’s largest producer in 2014, with 23 per cent of the total world output. The second largest was USA (16 per cent), followed by India (ten per cent), Germany and Australia (with five per cent each).
Rest of World 80.5%
Austria 7.0%
Bulgaria 3.6%France 11.8%
Germany 20.2%
Italy 4.6%
Netherlands 11.8%
Others 2.6%Poland 7.5%
Romania 3.7%
Spain 8.0%
Turkey 10.0%
United Kingdom 9.1%
EU36 19.5%
EU36 Production of salt 2014
Production of salt tonnes
Country 2010 2011 2012 2013 2014
Albania Sea salt * 47 000 * 47 000 * 47 000 * 47 000 * 47 000 Austria Rock salt 95 169 222 184 245 Salt in brine 1 071 842 1 150 474 3 193 216 3 717 419 3 846 881 Bulgaria 1 900 000 2 200 000 2 100 000 2 000 000 * 2 000 000 Croatia 66 835 53 963 45 992 42 502 33 039 Denmark 601 046 * 595 000 * 590 000 580 000 * 580 000 France * 8 500 000 * 8 500 000 6 545 600 7 312 200 6 500 000 Germany Rock salt 9 992 156 8 765 168 5 938 855 8 510 652 4 928 656 Brine salt 2 118 484 2 217 205 2 182 440 2 164 456 2 133 359 Salt in brine * 4 500 000 * 6 500 000 * 10 900 000 7 878 895 4 075 004 Greece 164 000 174 500 191 970 189 500 * 190 000 Italy Rock salt & brine salt 4 006 882 2 912 128 2 862 440 2 672 340 2 560 441 Montenegro Sea salt 11 200 10 000 16 000 10 000 * 10 000 Netherlands 5 982 000 6 866 000 6 513 000 6 517 000 6 500 000 Poland Rock salt 1 221 700 1 233 800 782 500 1 310 500 763 100 Brine salt 2 464 400 2 633 300 2 732 200 2 735 500 2 705 100 Other salt 763 515 768 000 724 000 686 352 641 769 Portugal Rock salt 618 961 631 295 520 284 473 095 69 702 Sea salt 44 574 47 267 88 693 91 282 96 321 Romania 2 388 357 2 248 940 1 888 516 2 127 780 2 046 740 Serbia 30 816 23 334 16 506 13 704 12 994 Slovenia 59 4 291 5 684 3 360 — Spain Rock salt 3 115 940 3 096 383 2 785 959 2 973 993 * 3 000 000 Sea salt 1 242 718 1 314 529 1 222 060 1 221 018 1 320 000 Other salt 92 644 92 850 100 643 114 829 105 000
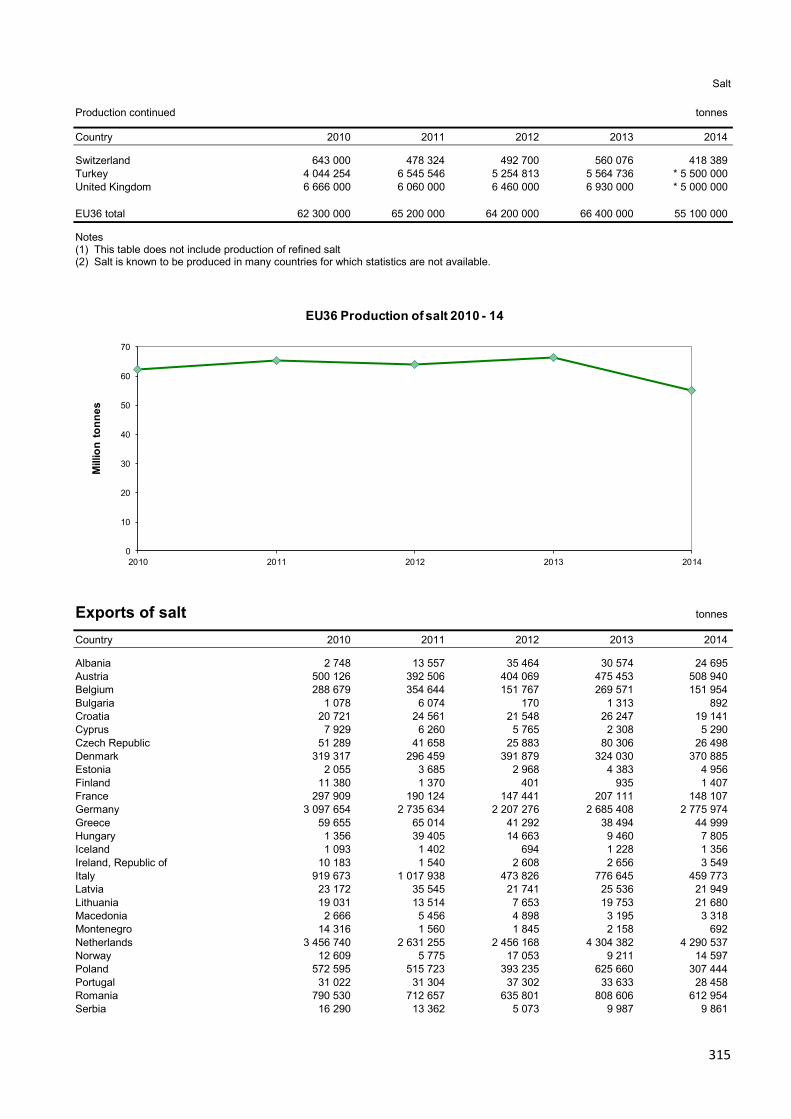
315
Salt
Production continued tonnes
Country 2010 2011 2012 2013 2014
Switzerland 643 000 478 324 492 700 560 076 418 389 Turkey 4 044 254 6 545 546 5 254 813 5 564 736 * 5 500 000 United Kingdom 6 666 000 6 060 000 6 460 000 6 930 000 * 5 000 000 EU36 total 62 300 000 65 200 000 64 200 000 66 400 000 55 100 000
Notes (1) This table does not include production of refined salt (2) Salt is known to be produced in many countries for which statistics are not available.
0
10
20
30
40
50
60
70
2010 2011 2012 2013 2014
Mill
ion
tonn
es
EU36 Production of salt 2010 - 14
Exports of salt tonnes Country 2010 2011 2012 2013 2014 Albania 2 748 13 557 35 464 30 574 24 695 Austria 500 126 392 506 404 069 475 453 508 940 Belgium 288 679 354 644 151 767 269 571 151 954 Bulgaria 1 078 6 074 170 1 313 892 Croatia 20 721 24 561 21 548 26 247 19 141 Cyprus 7 929 6 260 5 765 2 308 5 290 Czech Republic 51 289 41 658 25 883 80 306 26 498 Denmark 319 317 296 459 391 879 324 030 370 885 Estonia 2 055 3 685 2 968 4 383 4 956 Finland 11 380 1 370 401 935 1 407 France 297 909 190 124 147 441 207 111 148 107 Germany 3 097 654 2 735 634 2 207 276 2 685 408 2 775 974 Greece 59 655 65 014 41 292 38 494 44 999 Hungary 1 356 39 405 14 663 9 460 7 805 Iceland 1 093 1 402 694 1 228 1 356 Ireland, Republic of 10 183 1 540 2 608 2 656 3 549 Italy 919 673 1 017 938 473 826 776 645 459 773 Latvia 23 172 35 545 21 741 25 536 21 949 Lithuania 19 031 13 514 7 653 19 753 21 680 Macedonia 2 666 5 456 4 898 3 195 3 318 Montenegro 14 316 1 560 1 845 2 158 692 Netherlands 3 456 740 2 631 255 2 456 168 4 304 382 4 290 537 Norway 12 609 5 775 17 053 9 211 14 597 Poland 572 595 515 723 393 235 625 660 307 444 Portugal 31 022 31 304 37 302 33 633 28 458 Romania 790 530 712 657 635 801 808 606 612 954 Serbia 16 290 13 362 5 073 9 987 9 861

316
Salt
Exports continued tonnes Country 2010 2011 2012 2013 2014 Slovakia 45 056 27 935 20 917 20 151 13 942 Slovenia 21 711 33 998 30 498 17 001 15 002 Spain 1 311 257 1 311 383 807 026 1 496 873 1 145 725 Sweden 12 742 13 297 8 973 6 459 7 219 Switzerland 67 537 71 525 58 820 70 945 61 889 Turkey 262 050 417 596 66 690 90 656 159 791 United Kingdom 450 246 489 633 396 155 497 670 772 971
Imports of salt tonnes
Country 2010 2011 2012 2013 2014 Albania 15 415 22 903 14 098 9 647 19 787 Austria 293 799 291 187 162 790 314 374 132 360 Belgium 1 751 650 2 001 517 1 272 556 1 696 164 1 620 942 Bulgaria 215 355 214 732 252 392 163 880 181 412 Croatia 287 609 190 963 201 542 256 162 155 427 Cyprus 23 836 20 998 20 470 16 683 18 724 Czech Republic 958 474 858 980 560 186 1 046 589 382 879 Denmark 762 420 907 135 351 217 715 813 299 129 Estonia 73 254 85 105 73 248 43 617 65 197 Finland 384 089 452 873 385 359 380 753 423 978 France 1 653 101 1 622 835 705 665 1 157 520 643 237 Germany 2 654 736 3 477 233 2 277 714 2 376 658 2 404 752 Greece 144 367 173 050 154 435 146 686 117 853 Hungary 704 143 800 950 540 297 841 520 599 639 Iceland 65 342 94 177 100 020 84 266 88 758 Ireland, Republic of 172 053 308 884 105 270 131 516 131 561 Italy 1 119 583 1 045 659 1 128 585 943 961 670 659 Latvia 163 486 198 975 135 514 187 521 85 353 Lithuania 209 506 246 724 154 780 225 754 130 638 Luxembourg 77 304 91 033 24 059 86 365 41 338 Macedonia 42 011 39 986 49 248 43 611 34 013 Malta 1 682 1 366 2 567 1 464 2 009 Montenegro 6 470 9 600 6 795 6 137 10 034 Netherlands 1 404 032 2 397 781 331 643 1 090 957 324 274 Norway 1 042 489 1 106 066 1 052 197 1 029 977 954 563 Poland 886 294 1 052 650 451 619 906 654 468 938 Portugal 172 107 144 688 182 585 149 922 227 884 Romania 81 441 114 500 94 288 107 859 106 703 Serbia 204 395 274 636 246 280 197 570 148 063 Slovakia 266 329 244 787 226 571 408 235 221 269 Slovenia 317 999 235 663 142 926 284 695 169 045 Spain 85 807 116 804 48 061 182 413 54 335 Sweden 905 190 933 936 745 276 958 222 669 334 Switzerland 37 731 58 307 23 179 27 569 9 701 Turkey 154 536 254 045 248 663 (a)* 72 000 13 959 United Kingdom 1 288 253 1 814 865 418 028 738 670 356 289
Notes (a) BGS estimates, based on known exports from certain countries

317
Salt
Salt - EU36 trade in 2014
-5,000 -4,000 -3,000 -2,000 -1,000 0 1,000 2,000 3,000
GermanyBelgiumNorway
ItalySwedenFrance
HungaryPolandFinland
Czech RepublicUnited Kingdom
NetherlandsDenmarkPortugalSlovakiaBulgariaSlovenia
CroatiaSerbiaAustria
Ireland, Republic ofLithuania
GreeceRomania
IcelandLatvia
EstoniaSpain
LuxembourgMacedonia
AlbaniaCyprusTurkey
MontenegroSwitzerland
Thousand tonnes
Imports Exports

318
Sillimanite minerals
Sillimanite minerals
• Sillimanite minerals are a group of three anhydrous aluminium silicate minerals (andalusite, kyanite and sillimanite) that are chiefly used as refractories. Bricks and mortar used to line furnaces and kilns usually contain a proportion of these minerals.
• Despite being common minerals in high-grade metamorphic rocks, economic concentrations of these minerals are rare. South Africa was the world’s largest producer in 2014 followed by USA, India and France. China is also believed to be a significant producer of sillimanite minerals but accurate production data are not available.
Production of sillimanite minerals tonnes Country 2010 2011 2012 2013 2014 France Andalusite * 65 000 * 65 000 * 68 000 * 68 000 * 68 000
Notes (1) A number of other countries produce sillimanite minerals but details of output are not reported (2) Production capacity for synthetic mullite also exists in the United Kingdom but output is believed to be zero.
Exports of sillimanite minerals tonnes Country 2010 2011 2012 2013 2014 Belgium 53 940 51 011 35 685 32 902 33 547 France 49 011 55 316 43 751 43 457 50 394 Germany 13 379 18 818 17 287 19 614 20 557 Hungary 7 505 8 180 6 335 7 641 6 599 Netherlands 6 907 23 239 13 447 18 958 6 494 Spain 288 358 796 1 585 1 514 Turkey 2 623 3 357 4 444 6 278 22 United Kingdom 1 378 1 761 1 141 1 459 1 065
Notes (1) In this table 'Sillimanite minerals' is understood to include any or all of andalusite, kyanite, sillimanite and mullite
Imports of sillimanite minerals tonnes Country 2010 2011 2012 2013 2014 Austria 2 089 2 224 3 093 1 941 1 289 Belgium Sillimanite minerals 53 115 50 427 32 683 31 070 38 669 Mullite 1 955 1 690 4 139 3 391 3 045 Czech Republic Sillimanite minerals 3 682 4 089 4 132 7 867 4 919 Mullite 758 818 606 1 142 713 Denmark Sillimanite minerals 1 124 792 386 1 338 1 276 Mullite 3 199 2 590 1 714 1 639 2 239 France Sillimanite minerals 3 110 3 502 1 930 2 576 2 573 Mullite 2 663 3 831 2 919 2 948 2 650 Germany Sillimanite minerals 47 738 48 748 54 045 50 227 70 963 Mullite 47 775 72 049 51 709 57 152 28 806 Greece 44 220 94 425 1 008 Hungary Sillimanite minerals 2 100 2 903 3 039 2 515 4 165 Mullite 1 348 1 854 1 352 1 364 1 174

319
Sillimanite minerals
Imports continued tonnes Country 2010 2011 2012 2013 2014 Italy Sillimanite minerals 14 473 17 937 11 720 10 465 16 054 Mullite 16 141 13 564 16 084 6 728 10 739 Netherlands Sillimanite minerals 3 576 13 342 13 177 24 417 20 577 Mullite 51 745 64 162 34 244 32 464 49 343 Norway 3 456 3 208 3 626 2 767 2 520 Poland Sillimanite minerals 17 956 13 791 17 567 20 761 23 924 Mullite 2 109 2 817 2 757 2 299 2 476 Portugal 466 641 2 241 794 962 Slovakia 2 456 2 917 844 2 002 2 036 Slovenia 363 921 1 901 3 970 3 706 Spain Sillimanite minerals 27 611 32 091 12 372 24 416 30 600 Mullite 4 934 6 153 2 465 3 274 4 371 Sweden 4 782 5 174 4 225 4 677 4 906 Switzerland 1 162 1 596 1 079 1 580 1 169 Turkey Sillimanite minerals 5 466 6 907 6 905 9 434 11 122 Mullite 12 675 10 733 8 827 5 530 2 072 United Kingdom Sillimanite minerals 7 419 12 485 10 562 6 058 6 814 Mullite 8 276 3 491 4 588 3 746 7 306
Notes (1) In this table 'Sillimanite minerals' is understood to include any or all of andalusite, kyanite, sillimanite and mullite, except where
separately identified

320
Silver
Silver
• Silver is a ductile and malleable metallic element that has the highest electrical and thermal conductivity of all metals. It is widely used in electronics although the most important uses are in photography (silver nitrate) and making mirrors.
• Silver is more common than the other precious metals, although still much rarer than base and ferrous metals. It is rarely mined in its own right, and is chiefly produced as a by-product of lead, tin or copper mining. Mexico was the world’s largest producer in 2014, with 21 per cent of the total world output. The second largest producer was Peru (with 14 per cent), followed by China (13 per cent), Australia (seven per cent), and Chile (six per cent).
Rest of World 91.9%
Bulgaria 2.5%Greece 1.6%
Others 5.0%
Poland 62.5%
Portugal 1.9%
Sweden 17.3%
Turkey 9.3%EU36 8.1%
EU36 Mine production of silver 2014
Mine production of silver kilograms (metal content) Country 2010 2011 2012 2013 2014 Bulgaria * 55 000 * 55 000 * 55 000 * 55 000 * 55 000 Finland 11 020 11 160 10 479 14 226 12 830 Greece 29 000 * 33 300 * 39 800 39 759 35 785 Ireland, Republic of 3 818 6 109 9 454 7 822 6 436 Macedonia * 32 000 * 30 000 * 31 000 * 32 000 * 33 000 Poland 1 183 000 1 167 000 1 149 000 1 161 114 1 384 000 Portugal 20 561 28 027 29 890 40 621 43 172 Romania * 18 000 * 18 000 * 18 000 * 18 000 * 18 000 Serbia (a) 4 384 7 380 8 388 * 8 400 * 8 400 Slovakia 320 330 441 508 437 Spain 20 800 29 900 32 943 * 31 000 * 31 000 Sweden 302 145 301 959 309 337 341 346 382 611 Turkey 363 520 246 500 193 890 189 600 205 000 United Kingdom 506 531 230 82 — EU36 total 2 044 000 1 935 000 1 888 000 1 939 000 2 216 000 Notes (a) Smelter and/or refinery production
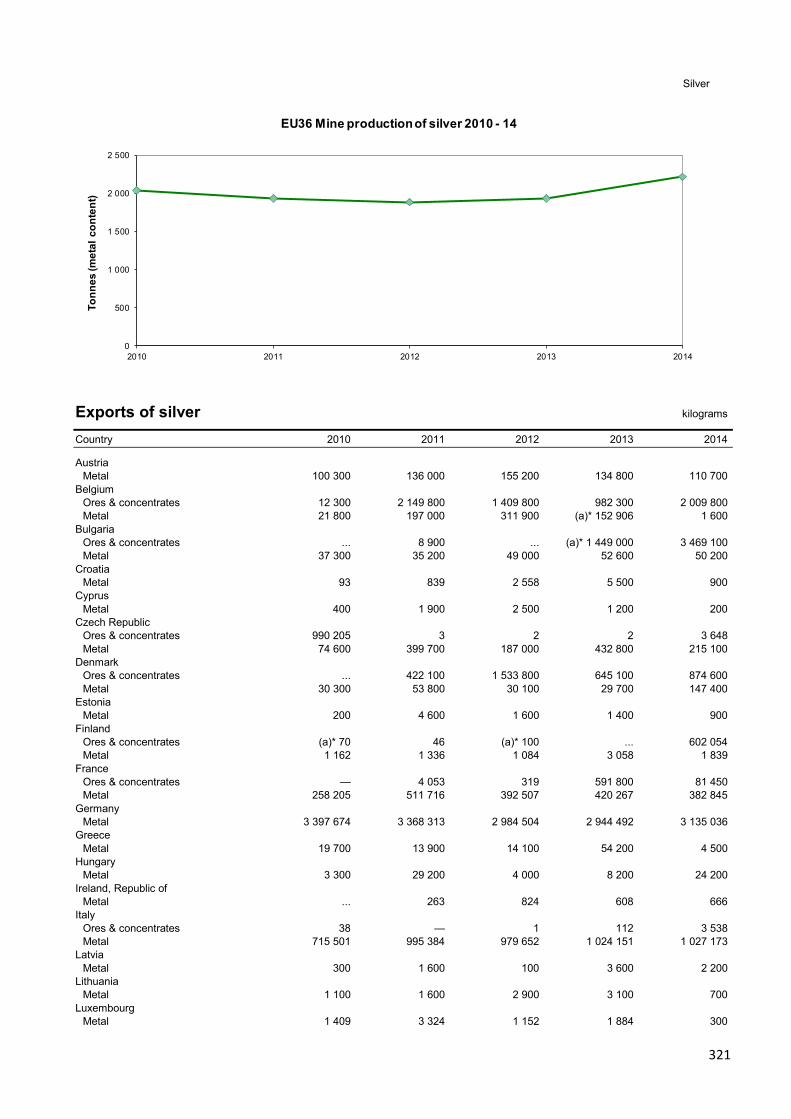
321
Silver
0
500
1 000
1 500
2 000
2 500
2010 2011 2012 2013 2014
Tonn
es (m
etal
con
tent
)
EU36 Mine production of silver 2010 - 14
Exports of silver kilograms Country 2010 2011 2012 2013 2014 Austria Metal 100 300 136 000 155 200 134 800 110 700 Belgium Ores & concentrates 12 300 2 149 800 1 409 800 982 300 2 009 800 Metal 21 800 197 000 311 900 (a)* 152 906 1 600 Bulgaria Ores & concentrates ... 8 900 ... (a)* 1 449 000 3 469 100 Metal 37 300 35 200 49 000 52 600 50 200 Croatia Metal 93 839 2 558 5 500 900 Cyprus Metal 400 1 900 2 500 1 200 200 Czech Republic Ores & concentrates 990 205 3 2 2 3 648 Metal 74 600 399 700 187 000 432 800 215 100 Denmark Ores & concentrates ... 422 100 1 533 800 645 100 874 600 Metal 30 300 53 800 30 100 29 700 147 400 Estonia Metal 200 4 600 1 600 1 400 900 Finland Ores & concentrates (a)* 70 46 (a)* 100 ... 602 054 Metal 1 162 1 336 1 084 3 058 1 839 France Ores & concentrates — 4 053 319 591 800 81 450 Metal 258 205 511 716 392 507 420 267 382 845 Germany Metal 3 397 674 3 368 313 2 984 504 2 944 492 3 135 036 Greece Metal 19 700 13 900 14 100 54 200 4 500 Hungary Metal 3 300 29 200 4 000 8 200 24 200 Ireland, Republic of Metal ... 263 824 608 666 Italy Ores & concentrates 38 — 1 112 3 538 Metal 715 501 995 384 979 652 1 024 151 1 027 173 Latvia Metal 300 1 600 100 3 600 2 200 Lithuania Metal 1 100 1 600 2 900 3 100 700 Luxembourg Metal 1 409 3 324 1 152 1 884 300

322
Silver
Exports continued kilograms Country 2010 2011 2012 2013 2014 Malta Metal 100 500 500 100 200 Montenegro Metal ... — 14 372 42 403 Netherlands Ores & concentrates 1 458 6 944 123 — — Metal 216 182 624 589 241 614 555 475 160 451 Norway Metal 57 617 62 849 49 856 48 129 52 256 Poland Metal 1 281 800 1 328 900 1 378 800 1 245 000 1 436 700 Portugal Ores & concentrates 12 300 16 300 15 100 25 200 14 100 Metal 3 400 10 600 40 600 34 200 20 400 Romania Ores & concentrates ... (a)* 217 000 ... (a)* 181 000 36 200 Serbia Metal 4 355 4 222 3 044 7 084 6 978 Slovakia Metal 39 100 15 100 31 500 28 800 37 900 Slovenia Metal 3 100 3 600 3 800 14 400 19 300 Spain Ores & concentrates 377 9 847 30 748 896 1 278 Metal 417 381 383 412 626 782 670 633 13 855 475 Sweden Metal 412 900 428 500 480 100 457 100 501 000 Switzerland Metal 1 456 475 1 779 063 1 719 300 2 490 396 2 195 532 Turkey Metal 144 942 202 886 216 509 209 094 93 889 United Kingdom Ores & concentrates 2 035 206 — 2 174 1 584 Metal 2 579 909 3 937 294 3 197 152 4 219 571 3 516 844 Waste & scrap 5 160 290 11 649 846 19 737 958 17 177 345 11 220 895
Notes (1) This table excludes silver coin but includes silver shipped for minting (2) In this table the term 'metal' includes both unwrought and partly worked silver and alloys (a) BGS estimates, based on known imports into certain countries
Imports of silver kilograms Country 2010 2011 2012 2013 2014 Albania Metal 7 819 4 485 2 768 3 327 230 Austria Metal 481 800 804 000 331 500 583 000 267 100 Belgium Ores & concentrates 6 000 300 7 619 600 25 085 300 2 799 000 — Metal 86 500 71 100 80 200 60 400 55 200 Bulgaria Ores & concentrates 91 ... ... 88 200 ... Metal 2 408 4 300 12 800 4 900 3 400 Croatia Metal 3 212 3 868 3 309 2 859 2 700 Cyprus Metal 1 200 2 200 500 200 300 Czech Republic Ores & concentrates 990 200 — — — — Metal 136 000 1 635 700 993 700 865 000 150 100

323
Silver
Imports continued kilograms Country 2010 2011 2012 2013 2014 Denmark Metal 620 284 160 312 132 719 381 138 283 638 Estonia Metal 3 200 5 000 1 700 3 700 1 800 Finland Metal 50 681 26 764 19 618 13 828 14 647 France Ores & concentrates 4 433 810 8 499 100 102 8 713 51 561 Metal 954 773 908 080 612 382 680 836 750 677 Germany Ores & concentrates 4 002 438 3 493 141 5 279 656 2 590 874 5 378 985 Metal 2 322 566 2 434 577 1 858 257 2 203 529 2 157 829 Greece Metal 29 900 55 100 51 900 68 500 55 200 Hungary Metal 196 500 234 100 229 700 232 900 331 700 Iceland Metal 909 700 640 399 489 Ireland, Republic of Metal 3 999 5 431 3 571 10 137 25 963 Italy Ores & concentrates 70 440 31 391 11 644 102 547 Metal 1 120 080 729 807 645 344 911 101 1 062 821 Latvia Metal 791 2 300 1 400 7 900 2 400 Lithuania Metal 6 300 7 800 9 200 11 300 13 200 Luxembourg Metal 24 304 11 000 2 800 1 100 2 700 Macedonia Metal 3 294 3 779 2 032 2 781 2 059 Malta Metal 128 100 100 800 700 Netherlands Metal 304 219 338 239 301 089 321 318 179 287 Norway Ores & concentrates (a)* 1 100 (a)* 700 (a)* 4 700 ... ... Metal 57 422 49 727 47 768 27 060 36 991 Poland Metal 106 700 78 600 82 800 76 900 76 500 Portugal Metal 66 900 38 700 22 200 37 300 31 700 Romania Metal (a) * 27 500 * 8 100 * 15 900 * 14 600 * 71 400 Serbia Metal * 741 * 800 411 1 846 1 670 Slovakia Metal 55 300 * 47 000 268 700 97 800 168 400 Slovenia Metal 24 100 29 700 25 100 26 900 21 200 Spain Ores & concentrates 11 317 17 131 123 171 11 356 3 395 Metal 1 513 257 828 017 431 934 8 665 969 10 281 452 Sweden Ores & concentrates ... (a)* 87 (a)* 131 ... 72 400 Metal 83 700 90 900 94 900 80 900 68 500 Switzerland Ores & concentrates * 24 000 * 115 000 * 30 000 * 31 000 * 22 000 Metal 1 746 243 2 155 625 2 397 273 1 935 822 1 279 130 Turkey Metal 90 064 209 909 226 227 299 109 316 698

324
Silver
Imports continued kilograms Country 2010 2011 2012 2013 2014 United Kingdom Ores & concentrates 9 737 1 209 6 287 72 454 394 649 Metal 3 278 015 3 686 011 8 525 994 6 097 865 4 740 438 Waste & scrap 4 137 096 13 713 610 5 946 307 6 668 845 5 107 834
Notes (1) This table excludes silver coin but includes silver shipped for minting (2) In this table the term 'metal' includes both unwrought and partly worked silver and alloys (a) BGS estimates, based on known exports from certain countries

325
Sulphur and Pyrites
Sulphur and pyrites
• Sulphur is a fundamental feedstock to the chemical industry, usually as sulphuric acid. The chief sources of sulphur are petroleum refining, natural gas, base metal sulphide processing and pyrites (iron sulphide).
• Most industrialised countries in the world have some sulphur production. The largest producers of recovered sulphur in 2014 were the USA (14 per cent of the total world output), followed by China (11 per cent) and Russia (ten per cent). The largest world producer of pyrites and sulphur ore was China (with 94 per cent and 96 per cent respectively of the total world output).
Rest of World 90.6%
Belgium 5.1%
Bulgaria 5.8%
Finland 10.5%France 5.7%
Germany 14.7%
Greece 2.9%
Italy 7.0%
Netherlands 6.8%
Others 9.5% Poland 14.7%
Spain 13.5%
Sweden 3.7%EU36 9.4%
EU36 Production of sulphur and pyrites 2014
Production of sulphur and pyrites tonnes (sulphur content) Country 2010 2011 2012 2013 2014 Austria Recovered (a) 40 512 48 612 47 572 45 442 44 560 Belgium Recovered (a)(b) 353 000 396 500 382 100 396 900 * 400 000 Bulgaria Recovered (b) 379 000 411 800 375 800 392 200 * 392 000 Recovered (a) 50 000 50 000 55 000 60 000 * 60 000 Croatia Recovered (a) 6 834 14 725 17 411 15 902 19 384 Czech Republic Recovered (a) 65 000 35 000 35 000 35 000 * 35 000 Denmark Recovered (a) 3 246 3 045 3 925 3 599 4 435 Finland Pyrites 250 000 338 000 375 000 347 000 353 000 Recovered (b) 269 449 319 971 329 831 315 958 336 168 Recovered (a) 122 000 133 300 121 700 130 000 * 130 000 France Recovered (a) 570 000 505 000 440 000 370 000 * 370 000 Recovered (c) 78 400 78 400 78 400 78 400 * 78 400 Germany Recovered (a) 831 533 874 639 798 257 754 540 708 146 Recovered (c) 520 220 542 210 493 169 464 776 437 677 Greece Recovered (a) 230 000 214 943 227 197 230 000 * 230 000 Hungary Recovered (a) 55 000 60 000 65 000 58 000 * 54 000 Italy Recovered (b) 124 200 65 400 58 800 40 200 * 40 200 Recovered (a) 600 000 620 000 540 000 510 000 * 510 000 Lithuania Recovered (a) 73 470 76 699 73 040 81 449 76 594

326
Sulphur and pyrites
Production continued tonnes (sulphur content) Country 2010 2011 2012 2013 2014 Netherlands Recovered (b) 121 000 120 900 117 600 120 900 * 120 000 Recovered (a) 465 000 470 000 450 000 430 000 * 410 000 Norway Recovered (b) 36 900 37 531 41 464 38 745 40 119 Recovered (a) 22 000 19 000 20 000 22 000 * 22 000 Poland Frasch 516 700 657 100 702 190 526 290 605 420 Recovered (b) 253 000 273 000 267 000 260 000 * 260 000 Recovered (a) 250 075 259 000 285 000 * 280 000 * 280 000 Portugal Recovered 23 000 20 500 20 600 * 21 000 * 21 000 Romania Recovered 50 700 55 600 50 000 60 000 * 47 000 Serbia Recovered (b) 21 200 27 800 29 700 29 400 * 29 400 Slovakia Recovered (b) 4 900 4 900 4 900 4 900 * 4 900 Recovered (a) 73 200 83 300 76 200 85 300 * 85 300 Spain Recovered (b) 547 400 490 200 578 400 539 200 * 539 000 Recovered (a) 480 000 520 000 545 000 515 000 * 515 000 Sweden Recovered (b) 180 540 211 280 198 850 194 938 205 616 Recovered (a) 83 947 92 973 93 442 64 587 86 538 Turkey Pyrites 55 152 56 780 52 080 45 348 * 40 000 Recovered (a)(c) 72 900 72 900 72 900 * 72 900 * 72 900 Sulphur ore 427 3 820 5 889 8 069 * 10 000 United Kingdom Recovered (a) 162 000 165 000 158 000 313 000 134 000 EU36 total Pyrites 305 000 395 000 427 000 392 000 393 000 Ore 400 4 000 6 000 8 000 10 000 Frasch 517 000 657 000 702 000 526 000 605 000 Recovered 7 220 000 7 374 000 7 151 000 7 034 000 6 799 000 Notes (a) From petroleum refining and/or natural gas (b) From metal sulphide processing (c) Other
0
1 000
2 000
3 000
4 000
5 000
6 000
7 000
8 000
9 000
2010 2011 2012 2013 2014
Thou
sand
tonn
es (s
ulph
ur c
onte
nt)
EU36 Production of sulphur and pyrites 2010 - 14

327
Sulphur and Pyrites
Exports of sulphur and pyrites tonnes Country 2010 2011 2012 2013 2014 Albania Pyrites ... ... 5 076 10 560 ... Austria Pyrites 2 794 2 887 2 579 1 523 965 Sulphur, sublimed and precipitated 1 145 746 2 138 3 425 2 230 Belgium Sulphur 21 533 34 087 10 274 9 828 27 977 Sulphur, sublimed and precipitated 193 83 119 298 85 Bulgaria Sulphur 40 286 38 097 41 601 45 592 39 738 Croatia Sulphur 6 565 14 256 15 801 12 917 17 107 Czech Republic Sulphur 12 124 980 1 852 9 195 7 084 Sulphur, sublimed and precipitated 330 260 183 44 69 Denmark Sulphur 12 39 4 814 14 543 46 Estonia Sulphur 45 621 — — — Finland Pyrites (a) * 198 000 * 460 000 * 520 000 * 316 000 * 718 000 Sulphur 2 715 2 404 2 871 (a)* 80 (a)* 200 France Sulphur 296 345 248 989 237 974 193 899 95 143 Sulphur, sublimed and precipitated 565 556 394 232 99 Germany Pyrites 755 440 342 301 1 457 Sulphur 671 836 721 717 525 622 474 875 388 333 Sulphur, sublimed and precipitated 271 1 380 274 493 6 427 Greece Pyrites 28 680 42 3 776 57 800 40 037 Sulphur 4 594 35 279 167 611 204 170 208 051 Hungary Sulphur 44 098 48 616 43 855 49 438 56 509 Italy Pyrites 13 698 16 032 11 114 13 741 13 208 Sulphur 286 954 285 891 249 274 212 188 146 971 Sulphur, sublimed and precipitated 22 485 55 740 17 021 5 279 20 028 Lithuania Sulphur 1 227 403 759 383 36 476 Macedonia Sulphur 1 653 877 197 170 ... Netherlands Pyrites 56 610 101 114 84 734 13 367 45 579 Sulphur 480 968 469 819 561 995 395 938 441 806 Poland Sulphur 402 102 394 861 506 641 406 030 506 889 Sulphur, sublimed and precipitated 34 752 26 542 29 757 500 42 324 Portugal Sulphur 6 164 9 737 7 065 24 478 32 210 Romania Sulphur 55 961 58 437 54 016 63 651 78 970 Serbia Sulphur 2 335 3 571 2 760 12 556 15 352 Slovakia Sulphur 448 1 998 2 456 2 075 2 528 Sulphur, sublimed and precipitated 72 910 82 785 74 817 86 343 74 490 Slovenia Sulphur 1 016 145 190 79 403 Spain Sulphur 138 168 361 188 438 368 456 025 396 507 Sulphur, sublimed and precipitated 612 289 264 165 660 Sweden Sulphur 2 768 3 980 10 145 13 751 11 598 Sulphur, sublimed and precipitated 11 564 10 344 5 248 1 601 2 380

328
Sulphur and Pyrites
Exports continued tonnes Country 2010 2011 2012 2013 2014 Switzerland Sulphur 5 310 4 864 2 160 5 494 4 854 Turkey Pyrites 1 ... 48 1 243 14 730 Sulphur 279 822 56 143 59 116 47 765 62 847 Sulphur, sublimed and precipitated 21 068 7 949 8 757 9 454 6 221 United Kingdom Sulphur, crude 41 491 101 964 37 239 27 018 6 154 Sulphur, refined 1 198 3 686 14 609 7 560 24 766 Sulphur, sublimed and precipitated 1 349 2 151 21 385 7 359 31 088
Notes (a) BGS estimates, based on known imports into certain countries
Imports of sulphur and pyrites tonnes Country 2010 2011 2012 2013 2014 Austria Pyrites 3 154 3 321 3 340 2 133 2 043 Sulphur 75 065 70 892 49 910 51 428 58 522 Sulphur, sublimed and precipitated 15 331 22 109 16 997 22 895 18 623 Belgium Pyrites 20 18 15 0 641 Sulphur 592 348 562 688 568 833 662 537 615 912 Sulphur, sublimed and precipitated 621 473 558 561 343 Croatia Sulphur 2 877 2 752 1 503 176 395 Sulphur, sublimed and precipitated 105 156 142 116 269 Cyprus Sulphur 951 625 604 664 822 Czech Republic Pyrites 250 247 384 366 368 Sulphur 14 762 14 945 70 008 54 000 62 706 Sulphur, sublimed and precipitated 82 355 93 289 39 459 27 870 28 056 Denmark Sulphur 7 051 6 123 4 173 4 339 4 253 Estonia Sulphur 1 2 1 344 1 224 1 487 Finland Sulphur 21 676 38 923 29 283 16 558 25 298 Sulphur, sublimed and precipitated 3 4 43 210 163 France Pyrites 183 206 136 254 564 Sulphur 78 366 92 106 108 471 145 535 164 461 Sulphur, sublimed and precipitated 410 441 481 1 623 495 Germany Pyrites 76 101 82 530 74 726 74 610 92 419 Sulphur 44 103 51 714 34 102 49 080 69 343 Sulphur, sublimed and precipitated 1 649 4 363 4 637 3 889 2 734 Greece Sulphur 42 673 80 976 31 788 38 372 20 225 Hungary Sulphur 3 189 1 100 981 934 1 066 Sulphur, sublimed and precipitated 119 223 172 7 224 Italy Pyrites 13 538 29 746 10 436 12 808 27 135 Sulphur 19 263 30 290 22 499 23 964 63 824 Sulphur, sublimed and precipitated 758 732 887 5 066 1 283 Lithuania Sulphur 326 485 298 977 293 839 291 622 324 726 Luxembourg Sulphur 2 166 1 789 1 432 1 604 1 845

329
Sulphur and pyrites
Imports continued tonnes Country 2010 2011 2012 2013 2014 Netherlands Pyrites 48 1 593 329 1 481 3 288 Sulphur 49 399 229 496 80 459 117 195 96 545 Sulphur, sublimed and precipitated 4 7 3 736 1 22 Norway Sulphur 2 897 3 051 2 725 2 614 2 838 Sulphur, sublimed and precipitated 11 515 11 627 12 685 12 848 11 188 Poland Pyrites 1 866 1 255 1 480 1 473 1 574 Sulphur 44 939 53 828 30 488 8 508 2 904 Sulphur, sublimed and precipitated 164 387 6 88 76 Portugal Sulphur 4 861 3 981 2 726 2 367 2 007 Romania Sulphur 2 561 2 965 6 246 4 311 4 461 Sulphur, sublimed and precipitated 2 062 2 074 1 807 1 469 1 478 Serbia Sulphur 674 721 635 796 1 072 Slovakia Sulphur 3 855 3 173 3 115 3 571 3 773 Sulphur, sublimed and precipitated 864 1 510 735 576 64 Slovenia Pyrites 645 836 921 959 957 Sulphur 57 411 56 490 51 225 54 707 57 575 Spain Pyrites 1 160 476 384 922 805 Sulphur 68 214 44 724 13 291 20 710 25 114 Sulphur, sublimed and precipitated 229 176 300 669 1 069 Sweden Pyrites 874 825 744 820 754 Sulphur 56 961 65 296 42 457 34 206 48 378 Sulphur, sublimed and precipitated 200 145 130 138 555 Switzerland Pyrites 185 128 131 116 248 Sulphur 17 414 13 072 14 257 14 183 14 121 Turkey Pyrites 480 323 142 205 329 Sulphur 141 478 161 866 151 955 136 430 127 648 Sulphur, sublimed and precipitated 592 292 382 302 118 United Kingdom Pyrites 2 581 1 734 168 435 962 Sulphur, crude 274 590 1 125 1 374 4 439 Sulphur, refined 10 201 10 391 8 670 8 485 7 885 Sulphur, sublimed and precipitated 767 691 698 946 6 647

330
Sulphur and pyrites
Sulphur and pyrites - EU36 trade in 2014
-600 -500 -400 -300 -200 -100 0 100 200 300 400 500 600 700
BelgiumLithuania
FranceTurkey
GermanyNetherlands
Czech RepublicAustria
ItalySloveniaSweden
SpainFinlandGreece
United KingdomSwitzerland
NorwayRomaniaDenmarkSlovakia
PolandPortugal
LuxembourgEstonia
HungarySerbia
CroatiaBulgaria
Thousand tonnes
Imports Exports
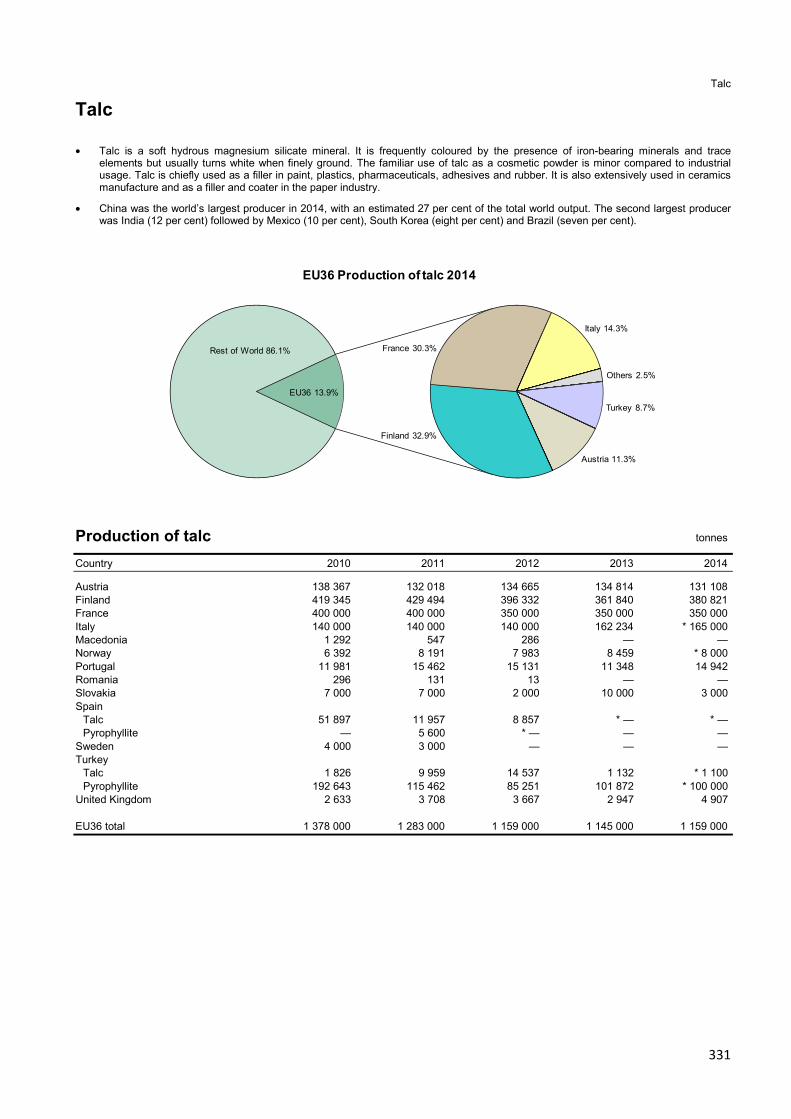
331
Talc
Talc
• Talc is a soft hydrous magnesium silicate mineral. It is frequently coloured by the presence of iron-bearing minerals and trace elements but usually turns white when finely ground. The familiar use of talc as a cosmetic powder is minor compared to industrial usage. Talc is chiefly used as a filler in paint, plastics, pharmaceuticals, adhesives and rubber. It is also extensively used in ceramics manufacture and as a filler and coater in the paper industry.
• China was the world’s largest producer in 2014, with an estimated 27 per cent of the total world output. The second largest producer was India (12 per cent) followed by Mexico (10 per cent), South Korea (eight per cent) and Brazil (seven per cent).
Rest of World 86.1%
Austria 11.3%
Finland 32.9%
France 30.3%
Italy 14.3%
Others 2.5%
Turkey 8.7%
EU36 13.9%
EU36 Production of talc 2014
Production of talc tonnes Country 2010 2011 2012 2013 2014 Austria 138 367 132 018 134 665 134 814 131 108 Finland 419 345 429 494 396 332 361 840 380 821 France 400 000 400 000 350 000 350 000 350 000 Italy 140 000 140 000 140 000 162 234 * 165 000 Macedonia 1 292 547 286 — — Norway 6 392 8 191 7 983 8 459 * 8 000 Portugal 11 981 15 462 15 131 11 348 14 942 Romania 296 131 13 — — Slovakia 7 000 7 000 2 000 10 000 3 000 Spain Talc 51 897 11 957 8 857 * — * — Pyrophyllite — 5 600 * — — — Sweden 4 000 3 000 — — — Turkey Talc 1 826 9 959 14 537 1 132 * 1 100 Pyrophyllite 192 643 115 462 85 251 101 872 * 100 000 United Kingdom 2 633 3 708 3 667 2 947 4 907 EU36 total 1 378 000 1 283 000 1 159 000 1 145 000 1 159 000

332
Talc
0
200
400
600
800
1 000
1 200
1 400
1 600
2010 2011 2012 2013 2014
Thou
sand
tonn
es
EU36 Production of talc 2010 - 14
Exports of talc tonnes Country 2010 2011 2012 2013 2014 Austria 106 271 115 967 121 264 84 271 127 230 Belgium 128 526 125 040 109 253 114 645 102 599 Czech Republic 169 298 214 270 375 Denmark 409 235 235 188 105 Finland (a) * 222 000 * 259 000 * 249 000 * 243 000 * 262 000 France 270 494 269 518 271 399 273 414 285 681 Germany 4 773 6 243 5 274 5 374 7 724 Greece 2 809 4 086 9 312 6 997 7 107 Hungary 173 51 69 413 26 Italy 143 236 135 418 140 618 144 432 141 343 Lithuania 350 111 126 232 40 Macedonia 636 648 380 618 368 Netherlands 173 042 147 492 150 456 145 912 166 925 Norway 728 2 204 535 648 71 Poland 869 744 830 825 520 Portugal 4 316 2 526 2 224 1 740 2 966 Slovakia 47 38 25 939 1 019 Spain 11 206 28 971 9 844 8 823 8 391 Sweden 9 014 8 308 4 598 4 915 3 598 Turkey 2 865 2 711 2 635 3 401 3 380 United Kingdom 3 074 3 171 5 026 4 681 3 570
Notes (a) BGS estimates, based on known imports into certain countries
Imports of talc tonnes
Country 2010 2011 2012 2013 2014 Austria 74 554 93 985 86 891 84 634 102 494 Belgium 183 625 175 662 163 309 168 067 154 480 Bulgaria 512 985 956 960 862 Croatia 1 813 1 578 1 774 1 989 2 739 Cyprus 307 267 133 150 172 Czech Republic 9 570 12 686 8 827 9 735 14 617 Denmark 7 013 6 276 6 883 6 469 6 025 Estonia 373 451 429 467 361 Finland 1 202 1 929 1 624 1 153 961

333
Talc
Imports continued tonnes
Country 2010 2011 2012 2013 2014 France 59 722 48 155 47 883 45 965 23 884 Germany 324 703 330 321 293 175 304 604 307 921 Greece 8 869 8 663 13 779 8 123 9 855 Hungary 6 786 6 226 5 319 6 010 5 438 Ireland, Republic of 1 140 1 320 3 033 2 982 3 303 Italy 100 934 115 046 111 333 99 446 125 992 Netherlands 178 312 199 302 182 898 213 095 249 040 Norway 8 356 8 364 8 374 10 586 11 702 Poland 23 331 26 212 26 430 34 117 29 854 Portugal 24 143 22 388 11 746 14 043 17 819 Romania 2 099 2 248 2 593 2 284 1 995 Serbia 1 616 1 270 1 432 1 957 1 764 Slovakia 719 380 470 1 098 2 679 Slovenia 10 793 4 489 4 413 4 618 4 311 Spain 84 536 88 989 80 421 91 965 92 006 Sweden 25 998 22 202 22 507 18 259 18 149 Switzerland 8 490 7 666 6 975 7 377 7 074 Turkey 20 026 26 952 23 496 28 004 23 085 United Kingdom 50 309 53 339 57 751 53 099 63 815
Talc - EU36 trade in 2014
-300 -250 -200 -150 -100 -50 0 50 100 150 200 250 300 350
GermanyNetherlands
BelgiumItaly
AustriaSpain
United KingdomPolandFranceTurkey
SwedenPortugal
Czech RepublicNorwayGreece
SwitzerlandDenmarkHungarySlovenia
Ireland, Republic ofCroatia
SlovakiaRomania
SerbiaFinland
BulgariaEstonia
Thousand tonnes
Imports Exports

334
Tantalum and Niobium
Tantalum and niobium
• Tantalum and niobium are sometimes produced from the same ore mineral. Tantalum is also produced from tin refinery slags. Tantalum is a heavy, very hard, ductile metallic element that has a very high melting point (2996°C) and is strongly resistant to chemical attack. It is used chiefly in electronic applications, especially in miniature capacitors, such as those in mobile telephones. Niobium is a soft and ductile metallic element that is used mainly in special steels and superalloys.
• The largest producer of tantalum (in terms of content) in 2014 was Rwanda (with 44 per cent of the total world output), followed by Democratic Republic of Congo (with 22 per cent), Brazil (15 per cent and China (with seven per cent). The largest producer of niobium was Brazil (94 per cent of the total world output), followed by Canada (with four per cent).
Exports of tantalum tonnes Country 2010 2011 2012 2013 2014 Austria 27 29 21 112 187 Belgium 4 2 2 121 3 Czech Republic 95 110 86 118 121 Estonia 34 76 49 24 38 France 20 25 41 138 42 Germany 18 38 33 30 37 Lithuania 9 18 10 6 3 Netherlands 22 42 19 12 (a)* 128 Portugal 98 81 50 27 12 Spain 4 11 3 13 7 Switzerland — 1 2 ... 23 Turkey 2 — 22 13 16 United Kingdom 191 97 336 43 61
Notes (1) Metal traded in ferro-alloy form is included under iron, steel and ferro-alloys (a) BGS estimates, based on known imports into certain countries
Imports of tantalum tonnes Country 2010 2011 2012 2013 2014 Austria 17 4 5 31 56 Czech Republic 265 222 175 224 246 Estonia 37 20 1 — 8 Finland * 0 * 0 * 0 * 87 * 9 France 22 39 49 39 18 Germany 231 376 221 178 151 Hungary 32 0 0 0 2 Ireland, Republic of 85 0 1 0 1 Lithuania 12 13 4 1 1 Luxembourg 1 1 1 52 1 Netherlands 27 33 54 10 62 Portugal 41 44 33 23 6 Romania 0 * 0 0 * 60 * 81 United Kingdom 284 176 144 203 184
Notes (1) Metal traded in ferro-alloy form is included under iron, steel and ferro-alloys

335
Tin
Tin
• Tin is a malleable and ductile metal that is resistant to corrosion. The chief use of tin is to coat metals that are more susceptible to corrosion, especially steel. It is also widely used as an alloying agent (i.e. with lead to make pewter) and its use in solders is rapidly growing as it replaces lead. Tin chemicals are used as fungicides and other biocides.
• China was the world’s largest producer of mined tin in 2014, with 45 per cent of the total world output. The second largest was Indonesia (20 per cent), followed by Burma (also known as Myanmar; ten per cent), Peru (seven per cent)and Bolivia (six per cent).
• China was also the world’s largest producer of refined tin in 2014, with 50 per cent of the total world output. The second largest was Indonesia (17 per cent), followed by Malaysia (nine per cent), Peru (seven per cent) and Thailand (five per cent).
Mine production of tin tonnes (metal content) Country 2010 2011 2012 2013 2014 Portugal 22 39 42 84 75 Spain — 9 69 0 —
0
25
50
75
100
125
2010 2011 2012 2013 2014
Tonn
es (m
etal
con
tent
)
EU36 Mine production of tin 2010 - 14
Smelter production of tin tonnes Country 2010 2011 2012 2013 2014 Belgium 9 946 10 008 11 350 10 346 9 718 Poland 602 82 1 375 1 900 2 253
Exports of tin tonnes Country 2010 2011 2012 2013 2014 Austria Unwrought (a) 60 98 103 118 112 Belgium Concentrates 127 95 107 114 509 Unwrought 5 114 4 261 7 428 11 881 11 217 Unwrought alloys 6 236 6 427 5 018 408 663 Scrap 207 1 195 308 2 496 2 483
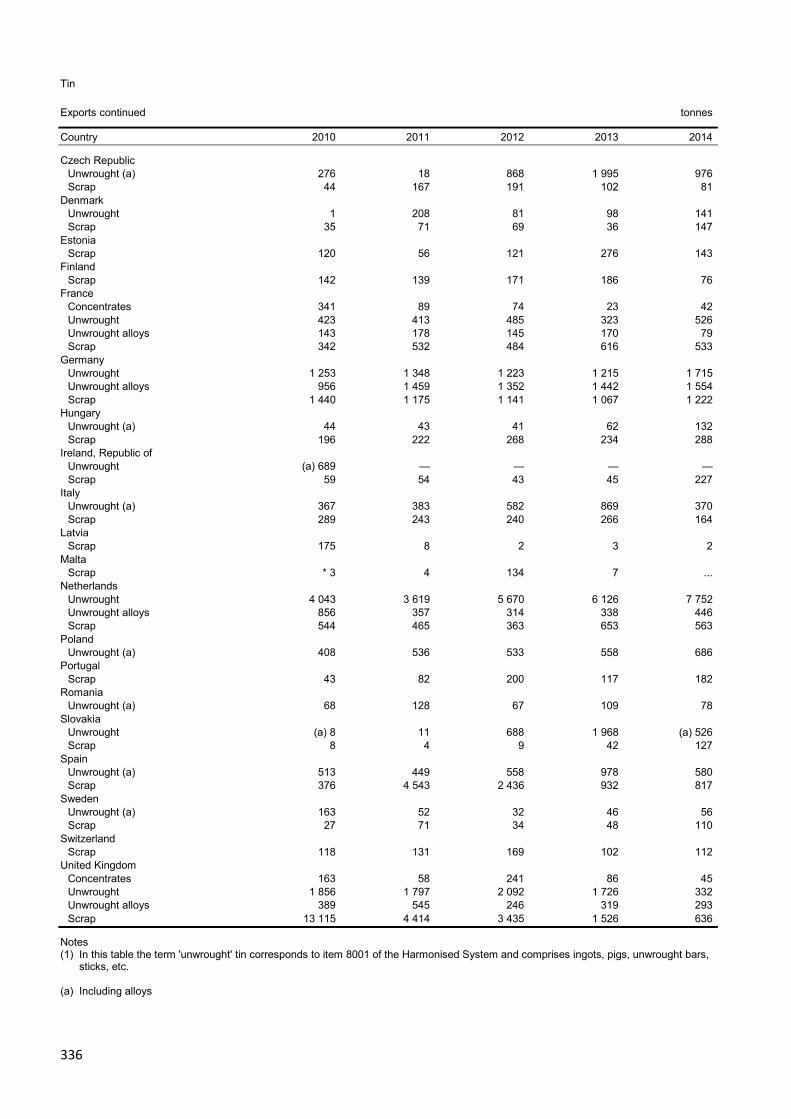
336
Tin
Exports continued tonnes Country 2010 2011 2012 2013 2014 Czech Republic Unwrought (a) 276 18 868 1 995 976 Scrap 44 167 191 102 81 Denmark Unwrought 1 208 81 98 141 Scrap 35 71 69 36 147 Estonia Scrap 120 56 121 276 143 Finland Scrap 142 139 171 186 76 France Concentrates 341 89 74 23 42 Unwrought 423 413 485 323 526 Unwrought alloys 143 178 145 170 79 Scrap 342 532 484 616 533 Germany Unwrought 1 253 1 348 1 223 1 215 1 715 Unwrought alloys 956 1 459 1 352 1 442 1 554 Scrap 1 440 1 175 1 141 1 067 1 222 Hungary Unwrought (a) 44 43 41 62 132 Scrap 196 222 268 234 288 Ireland, Republic of Unwrought (a) 689 — — — — Scrap 59 54 43 45 227 Italy Unwrought (a) 367 383 582 869 370 Scrap 289 243 240 266 164 Latvia Scrap 175 8 2 3 2 Malta Scrap * 3 4 134 7 ... Netherlands Unwrought 4 043 3 619 5 670 6 126 7 752 Unwrought alloys 856 357 314 338 446 Scrap 544 465 363 653 563 Poland Unwrought (a) 408 536 533 558 686 Portugal Scrap 43 82 200 117 182 Romania Unwrought (a) 68 128 67 109 78 Slovakia Unwrought (a) 8 11 688 1 968 (a) 526 Scrap 8 4 9 42 127 Spain Unwrought (a) 513 449 558 978 580 Scrap 376 4 543 2 436 932 817 Sweden Unwrought (a) 163 52 32 46 56 Scrap 27 71 34 48 110 Switzerland Scrap 118 131 169 102 112 United Kingdom Concentrates 163 58 241 86 45 Unwrought 1 856 1 797 2 092 1 726 332 Unwrought alloys 389 545 246 319 293 Scrap 13 115 4 414 3 435 1 526 636
Notes (1) In this table the term 'unwrought' tin corresponds to item 8001 of the Harmonised System and comprises ingots, pigs, unwrought bars,
sticks, etc. (a) Including alloys
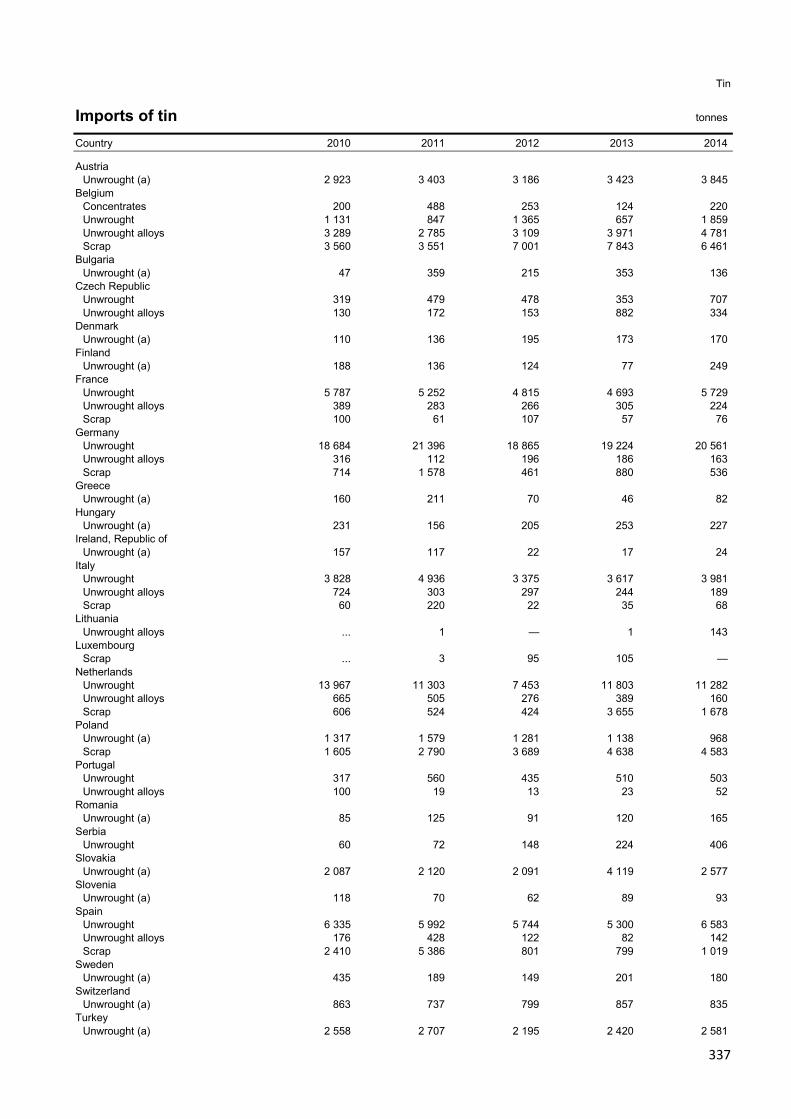
337
Tin
Imports of tin tonnes
Country 2010 2011 2012 2013 2014 Austria Unwrought (a) 2 923 3 403 3 186 3 423 3 845 Belgium Concentrates 200 488 253 124 220 Unwrought 1 131 847 1 365 657 1 859 Unwrought alloys 3 289 2 785 3 109 3 971 4 781 Scrap 3 560 3 551 7 001 7 843 6 461 Bulgaria Unwrought (a) 47 359 215 353 136 Czech Republic Unwrought 319 479 478 353 707 Unwrought alloys 130 172 153 882 334 Denmark Unwrought (a) 110 136 195 173 170 Finland Unwrought (a) 188 136 124 77 249 France Unwrought 5 787 5 252 4 815 4 693 5 729 Unwrought alloys 389 283 266 305 224 Scrap 100 61 107 57 76 Germany Unwrought 18 684 21 396 18 865 19 224 20 561 Unwrought alloys 316 112 196 186 163 Scrap 714 1 578 461 880 536 Greece Unwrought (a) 160 211 70 46 82 Hungary Unwrought (a) 231 156 205 253 227 Ireland, Republic of Unwrought (a) 157 117 22 17 24 Italy Unwrought 3 828 4 936 3 375 3 617 3 981 Unwrought alloys 724 303 297 244 189 Scrap 60 220 22 35 68 Lithuania Unwrought alloys ... 1 — 1 143 Luxembourg Scrap ... 3 95 105 — Netherlands Unwrought 13 967 11 303 7 453 11 803 11 282 Unwrought alloys 665 505 276 389 160 Scrap 606 524 424 3 655 1 678 Poland Unwrought (a) 1 317 1 579 1 281 1 138 968 Scrap 1 605 2 790 3 689 4 638 4 583 Portugal Unwrought 317 560 435 510 503 Unwrought alloys 100 19 13 23 52 Romania Unwrought (a) 85 125 91 120 165 Serbia Unwrought 60 72 148 224 406 Slovakia Unwrought (a) 2 087 2 120 2 091 4 119 2 577 Slovenia Unwrought (a) 118 70 62 89 93 Spain Unwrought 6 335 5 992 5 744 5 300 6 583 Unwrought alloys 176 428 122 82 142 Scrap 2 410 5 386 801 799 1 019 Sweden Unwrought (a) 435 189 149 201 180 Switzerland Unwrought (a) 863 737 799 857 835 Turkey Unwrought (a) 2 558 2 707 2 195 2 420 2 581

338
Tin
Imports continued tonnes
Country 2010 2011 2012 2013 2014 United Kingdom Unwrought 4 327 4 186 3 850 3 484 4 318 Unwrought alloys 365 396 1 113 4 049 5 750 Scrap 196 121 147 69 7
Notes (1) In this table the term 'unwrought' tin corresponds to item 8001 of the Harmonised System and comprises ingots, pigs, unwrought bars,
sticks, etc. (a) Including alloys

339
Titanium
Titanium minerals
• The titanium minerals ilmenite and rutile are the main sources of titanium, but a third mineral leucoxene is also produced. Titanium is a low density, strong and corrosion-resistant metal that is important in the aerospace industry. However, the chief use (> 90 per cent) of titanium minerals is in the form of titanium dioxide, a white pigment used in paint, plastics, rubber and paper.
• Canada was the world’s largest producer in 2014, with 19 per cent of the total world output. The second largest was Australia (14 per cent), followed by South Africa (nine per cent), China, Vietnam and Senegal (eight per cent each).
Rest of World 93.4%
Norway 6.6%
EU36 Production of titanium minerals 2014
Production of titanium minerals tonnes Country 2010 2011 2012 2013 2014 Norway Ilmenite 864 000 870 000 830 614 826 126 863 660
Notes (1) The figures in this table refer to gross tonnage of titanium concentrates
0
50
100
150
200
250
300
350
400
450
500
2010 2011 2012 2013 2014
Tonn
es (T
iO2
cont
ent)
EU36 Production of titanium minerals 2010 - 14

340
Titanium
Exports of titanium tonnes Country 2010 2011 2012 2013 2014 Austria Metal 129 224 317 159 609 Oxides 5 956 4 794 3 965 4 052 6 093 Belgium Titanium minerals 106 478 116 859 119 931 96 990 104 513 Metal 895 1 405 1 560 1 336 1 038 Oxides 435 415 390 405 345 752 399 734 381 857 Bulgaria Metal — 849 64 114 26 Oxides 584 987 408 258 274 Croatia Oxides 117 172 42 519 983 Czech Republic Titanium minerals 2 378 504 684 758 761 Metal 358 264 384 368 725 Oxides 45 842 45 437 43 174 45 164 51 595 Denmark Metal 196 125 194 193 316 Oxides 820 5 792 10 732 10 385 10 131 Estonia Metal 26 33 23 41 58 Oxides 49 164 468 396 44 Finland Titanium minerals 1 0 ... 171 3 017 Oxides (a) * 88 000 * 80 000 * 66 000 * 83 000 * 78 000 France Metal 4 907 5 333 5 946 6 633 8 838 Oxides 129 197 140 278 114 715 127 319 111 622 Germany Titanium minerals 22 384 18 932 13 648 51 517 5 623 Metal 9 351 13 954 12 561 13 824 14 096 Oxides 391 981 345 661 331 757 374 970 351 825 Greece Oxides 773 731 744 1 079 729 Hungary Metal 55 37 68 48 53 Oxides 1 942 1 484 1 298 1 871 2 002 Italy Metal 3 248 4 789 4 531 4 756 5 315 Oxides 27 450 26 181 22 039 37 137 35 730 Latvia Metal 7 61 42 2 1 Lithuania Metal 3 3 3 6 93 Oxides 1 167 965 1 029 1 122 1 486 Luxembourg Metal 20 17 17 151 164 Netherlands Titanium minerals 101 840 69 170 57 796 3 396 2 503 Metal 4 117 9 548 10 173 8 815 5 403 Oxides 31 385 11 305 14 836 114 285 119 100 Norway Titanium minerals (a) * 465 000 * 441 000 * 392 000 * 396 000 * 420 000 Metal 231 343 243 271 468 Oxides (a) * 35 000 * 35 000 * 31 000 * 35 000 * 38 000 Poland Metal 76 90 47 47 459 Oxides 20 996 23 401 20 201 20 329 14 517 Portugal Oxides 1 091 3 422 5 322 6 733 6 934 Romania Metal 960 550 375 615 287 Oxides 310 498 536 433 583 Slovakia Metal 49 24 199 91 101

341
Titanium
Exports continued tonnes Country 2010 2011 2012 2013 2014 Slovenia Metal 171 346 356 347 315 Oxides 61 637 53 015 47 488 58 140 56 320 Spain Titanium minerals 2 405 650 4 011 297 227 Metal 1 928 1 698 1 779 2 896 1 888 Oxides 35 233 48 870 51 919 85 355 81 080 Sweden Metal 925 1 086 1 111 981 1 453 Oxides 20 567 18 331 16 429 15 109 16 125 Switzerland Metal 805 868 724 887 1 038 Oxides 1 466 1 666 1 623 2 009 2 130 Turkey Metal 85 95 122 193 327 Oxides 2 650 3 170 2 538 2 749 2 821 United Kingdom Metal 12 060 11 926 11 541 11 493 11 911 Unwrought 3 683 1 263 709 1 475 1 362 Wrought 4 197 4 907 5 628 6 122 6 316 Oxides 208 518 223 190 142 135 169 548 191 395
Notes (1) Significant quantities of titanium slag are traded, but it is not always possible to identify this material in national trade accounts (2) So far as possible, the term 'oxides', as used in this table, includes oxides and oxide based pigments classified under Harmonised
System items 2823 and 3206.10 (3) Metal traded in ferro-alloy form is included under iron, steel and ferro-alloys (a) BGS estimates, based on known imports into certain countries
Imports of titanium tonnes
Country 2010 2011 2012 2013 2014 Austria Titanium minerals 477 580 284 432 388 Metal 1 381 2 590 3 130 2 737 2 859 Oxides 28 288 32 258 21 255 20 972 26 352 Belgium Titanium minerals 181 688 213 276 205 930 174 657 221 108 Metal 1 743 1 582 1 160 1 454 1 444 Oxides * 314 200 114 760 97 229 126 543 124 733 Bulgaria Titanium minerals 506 486 735 — 26 Metal 19 46 127 89 75 Oxides 5 675 6 454 4 593 4 897 4 885 Croatia Oxides 3 000 2 911 2 194 3 257 2 954 Cyprus Oxides 1 299 1 141 783 621 583 Czech Republic Titanium minerals 155 485 146 778 98 071 100 317 107 926 Metal 779 1 333 1 717 1 884 1 956 Oxides 8 857 9 372 7 763 8 863 10 398 Denmark Metal 674 1 723 1 948 1 036 1 255 Oxides 20 427 23 296 17 706 20 220 22 668 Estonia Metal 82 5 683 2 229 3 985 Oxides 1 409 1 724 1 921 1 808 1 312 Finland Titanium minerals (a)* 20 (a)* 3 154 (a)* 20 39 888 (a)* 10 Metal 60 66 81 62 246 Oxides 15 571 15 533 13 638 14 391 13 669

342
Titanium
Imports continued tonnes
Country 2010 2011 2012 2013 2014 France Titanium minerals 50 893 67 259 184 385 91 344 161 216 Metal 7 766 10 026 11 881 13 169 16 267 Oxides 148 994 138 687 123 037 129 659 139 199 Titanium slag 15 218 246 20 762 12 707 — Germany Titanium minerals 838 768 794 043 648 030 612 633 699 059 Metal 12 919 20 233 17 015 16 198 17 038 Oxides 309 500 329 073 264 304 309 892 321 016 Titanium slag 164 2 499 ... ... ... Greece Titanium minerals 504 396 220 275 292 Metal 74 74 47 260 141 Oxides 19 003 19 447 12 378 16 796 16 158 Hungary Titanium minerals 2 677 2 410 3 038 3 254 3 214 Metal 84 134 116 143 149 Oxides 8 927 8 885 7 325 8 809 9 606 Iceland Metal 100 59 75 80 154 Ireland, Republic of Metal 414 202 432 1 297 1 558 Oxides 4 922 4 312 3 924 4 044 4 207 Italy Titanium minerals 98 978 111 842 (a)* 4 132 55 323 102 316 Metal 4 497 9 420 7 367 6 065 6 630 Oxides 160 361 164 708 137 976 143 083 155 263 Latvia Oxides 739 693 640 586 699 Lithuania Metal 7 4 38 71 78 Oxides 1 947 2 081 2 028 2 686 2 362 Luxembourg Metal 456 1 842 786 1 898 1 039 Oxides 1 481 1 534 1 494 13 393 15 235 Macedonia Oxides 504 502 455 546 528 Malta Oxides 463 445 346 382 361 Netherlands Titanium minerals 238 199 196 960 158 679 83 675 114 468 Metal 5 330 6 094 5 709 5 902 4 678 Oxides 43 542 52 165 38 792 58 718 58 775 Norway Titanium minerals 45 018 25 003 ... 26 238 26 780 Metal 412 723 890 671 762 Oxides 10 115 10 376 8 093 7 214 7 115 Poland Titanium minerals 105 384 99 055 84 143 96 894 92 439 Metal 616 2 020 329 270 377 Oxides 46 110 54 770 44 098 48 200 52 495 Portugal Titanium minerals 714 807 429 517 885 Metal 26 28 38 32 95 Oxides 20 486 19 813 14 788 23 016 24 277 Romania Titanium minerals 2 095 5 393 1 354 1 721 1 930 Metal 771 541 776 801 543 Oxides 8 733 10 571 7 511 8 996 9 451 Serbia Oxides 3 888 4 498 3 960 4 336 4 430 Slovakia Titanium minerals 0 1 2 4 6 847 Metal 956 2 271 643 778 801 Oxides 2 109 2 409 2 163 2 776 2 843

343
Titanium
Imports continued tonnes
Country 2010 2011 2012 2013 2014 Slovenia Titanium minerals 25 081 54 387 20 208 19 761 48 861 Metal 400 964 739 844 694 Oxides 2 917 2 884 2 625 2 954 3 407 Titanium slag ... 39 644 57 097 54 482 58 063 Spain Titanium minerals 111 298 123 284 99 055 130 406 155 814 Metal 2 627 3 673 3 411 4 285 3 614 Oxides 91 822 90 581 67 970 79 052 88 028 Sweden Titanium minerals 1 854 645 629 661 1 569 Metal 1 936 2 390 2 245 2 072 2 323 Oxides 61 191 62 054 53 030 52 729 53 879 Switzerland Metal 971 1 081 1 177 1 207 1 463 Oxides 19 725 22 198 16 806 18 186 19 436 Turkey Titanium minerals 7 390 9 454 7 328 9 292 9 281 Metal 298 357 356 556 642 Oxides 127 266 144 383 117 269 130 866 141 078 United Kingdom Titanium minerals 90 622 32 127 117 860 104 134 210 722 Metal 20 681 69 844 33 943 27 099 30 278 Oxides 59 460 62 311 63 058 75 316 67 143
Notes (1) Significant quantities of titanium slag are traded, but it is not always possible to identify this material in national trade accounts (2) So far as possible, the term 'oxides', as used in this table, includes oxides and oxide based pigments classified under Harmonised
System items 2823 and 3206.10 (3) Metal traded in ferro-alloy form is included under iron, steel and ferro-alloys (a) BGS estimates, based on known exports from certain countries
Titanium - EU36 trade in 2014
-600 -400 -200 0 200 400 600 800 1,000 1,200
GermanyItaly
TurkeyFrance
BelgiumSpain
United KingdomNetherlands
SwedenPolandAustria
PortugalDenmark
SwitzerlandGreece
LuxembourgFinland
Czech RepublicHungaryRomania
NorwayBulgariaSlovenia
Thousand tonnes
Oxides
Minerals, ilmenite andslag
Imports Exports

344
Tungsten
Tungsten
• Tungsten is a corrosion-resistant metallic element with an extremely high melting point. Its largest use is as cemented carbides in cutting tools; it is also used as an alloying agent with steel to make high-speed tool steel, and in superalloys. Its most familiar use is in light bulb filaments.
• China was the world’s largest producer in 2014, with 80 per cent of the total world output. The second largest was Russia (seven per cent), followed by Canada (three per cent), Rwanda and Bolivia (two per cent each).
Rest of World 97.1%
Austria 33.6%
Portugal 26.1%
Spain 40.3%
EU36 2.9%
EU36 Mine production of tungsten 2014
Mine production of tungsten tonnes (metal content) Country 2010 2011 2012 2013 2014 Austria 975 861 706 851 862 Portugal (a) 799 818 763 692 671 Spain 303 425 496 614 1 036 EU36 total 2 100 2 100 2 000 2 200 2 600 Notes (a) Wolframite and scheelite
0
500
1 000
1 500
2 000
2 500
3 000
2010 2011 2012 2013 2014
Tonn
es (m
etal
con
tent
)
EU36 Mine production of tungsten 2010 - 14

345
Tungsten
Exports of tungsten tonnes Country 2010 2011 2012 2013 2014
Austria Metal (a) * 3 000 * 2 400 * 2 200 * 1 900 * 2 000 Belgium Ores & concentrates 27 406 544 350 20 Metal 723 368 657 427 446 Carbide 92 92 77 82 43 Bulgaria Metal 80 11 12 5 11 Czech Republic Ores & concentrates ... ... ... 20 45 Metal 211 611 1 011 1 110 1 122 Carbide 803 903 863 949 1 174 Denmark Metal 113 118 32 12 58 Estonia Metal 1 ... 61 4 — Finland Metal 450 588 480 643 775 France Ores & concentrates 2 3 — 1 335 189 Metal 473 589 962 566 559 Carbide 288 272 353 286 208 Germany Ores & concentrates 164 976 524 40 192 Metal 3 119 3 064 3 618 4 823 4 234 Hungary Metal 54 53 99 76 68 Italy Ores & concentrates ... ... 0 0 62 Metal 925 1 091 1 060 687 858 Lithuania Ores & concentrates ... ... ... 41 ... Metal — 178 18 17 53 Luxembourg Metal 203 47 0 0 3 Netherlands Ores & concentrates 104 0 0 63 197 Metal 406 255 119 84 123 Poland Ores & concentrates ... 314 ... 41 — Metal 154 179 89 348 304 Portugal Ores & concentrates 1 289 1 324 1 325 1 253 1 070 Metal 6 131 51 10 70 Romania Metal 9 23 43 5 373 1 266 Slovakia Metal 4 9 43 296 1 Spain Ores & concentrates 400 981 1 074 958 1 460 Metal 315 880 453 504 350 Sweden Ores & concentrates — 21 149 105 25 Metal 289 218 122 495 197 Carbide 401 186 109 87 28 Switzerland Metal 476 398 400 323 448 Turkey Metal 139 237 210 227 220

346
Tungsten
Exports continued tonnes Country 2010 2011 2012 2013 2014
United Kingdom Ores & concentrates 29 35 102 67 558 Metal 1 650 2 135 1 674 2 448 4 580 Carbide 41 597 463 400 232
Notes (1) Significant amounts of tungsten are traded in the forms of ammonium paratungstate (APT) and carbide. Though statistics are included
where available, most countries do not separately distinguish these forms in their trade accounts (2) Metal traded in ferro-alloy form is included under iron, steel and ferro-alloys (a) BGS estimates, based on known imports into certain countries
Imports of tungsten tonnes
Country 2010 2011 2012 2013 2014 Austria Metal 632 1 471 1 017 950 997 Carbide 1 268 1 241 1 076 968 1 340 Belgium Ores & concentrates 28 — — 48 3 Metal 402 321 202 112 173 Carbide 31 20 22 52 30 Bulgaria Metal 86 16 30 21 21 Czech Republic Ores & concentrates ... 314 799 100 6 Metal 677 367 968 506 437 Carbide 150 219 88 198 723 Finland Metal 403 567 456 725 824 France Ores & concentrates 2 4 14 619 69 283 77 Metal 867 1 027 619 534 1 022 Carbide 359 583 551 575 603 Germany Ores & concentrates 1 029 843 381 119 357 Metal 7 168 8 094 6 946 6 351 6 644 Carbide 2 544 3 105 2 478 2 337 2 678 Hungary Metal 54 67 56 78 70 Ireland, Republic of Metal 91 76 121 101 141 Carbide 68 186 116 113 76 Italy Metal 496 552 656 482 606 Carbide 279 440 240 380 531 Lithuania Metal 1 156 52 25 286 Netherlands Ores & concentrates (a) * 1 200 * 3 100 * 3 400 * 3 203 * 3 600 Metal 206 209 211 471 226 Poland Metal 124 96 69 170 160 Portugal Metal 277 206 151 147 70 Carbide 110 106 79 93 76 Romania Metal 79 50 63 45 32 Slovakia Metal 366 5 398 5 331 2 207 50 Slovenia Metal 15 16 28 42 63
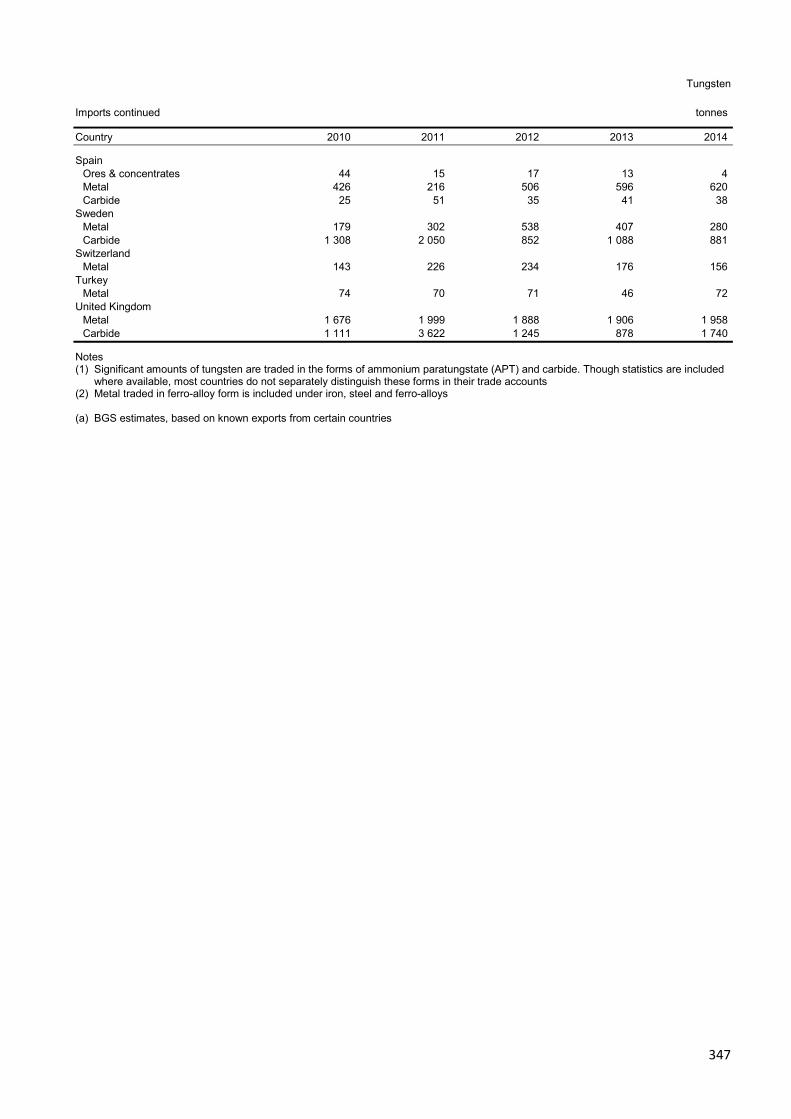
347
Tungsten
Imports continued tonnes
Country 2010 2011 2012 2013 2014 Spain Ores & concentrates 44 15 17 13 4 Metal 426 216 506 596 620 Carbide 25 51 35 41 38 Sweden Metal 179 302 538 407 280 Carbide 1 308 2 050 852 1 088 881 Switzerland Metal 143 226 234 176 156 Turkey Metal 74 70 71 46 72 United Kingdom Metal 1 676 1 999 1 888 1 906 1 958 Carbide 1 111 3 622 1 245 878 1 740
Notes (1) Significant amounts of tungsten are traded in the forms of ammonium paratungstate (APT) and carbide. Though statistics are included
where available, most countries do not separately distinguish these forms in their trade accounts (2) Metal traded in ferro-alloy form is included under iron, steel and ferro-alloys (a) BGS estimates, based on known exports from certain countries

348
Vanadium
Vanadium
• Vanadium is a soft, ductile, metallic element that is very corrosion resistant. The chief use is as an additive in alloy steels where it imparts strength and corrosion resistance. Other uses are in titanium alloys and as a catalyst.
• Mine production was confined to five countries in 2014: China (60 per cent of the total world output), Russia (22 per cent), South Africa (15 per cent), Brazil (two per cent) and Kazakhstan (one per cent). In the USA vanadium has been a significant by-product from the refining of heavy crude oils in prior years but no vanadium production was reported from this source for 2014.
Exports of vanadium tonnes Country 2010 2011 2012 2013 2014 Belgium Pentoxide 80 * 116 65 7 3 Germany Metal 248 429 560 487 369 Italy Metal 37 1 ... ... 477 Netherlands Pentoxide 122 186 328 492 314 Spain Pentoxide 22 774 26 9 102 United Kingdom Pentoxide 694 6 0 0 — Metal 23 ... ... ... ...
Notes (1) In this table the term 'pentoxide' also includes vanadium oxides and hydroxides, if any (2) Metal traded in ferro-alloy form is included under iron, steel and ferro-alloys
Imports of vanadium tonnes Country 2010 2011 2012 2013 2014 Austria Vanadiferous residues * 46 000 * 46 000 * 46 000 * 46 000 * 46 000 Pentoxide ... ... ... ... 1 754 Belgium Pentoxide 123 95 364 200 26 Czech Republic Pentoxide 5 255 7 004 8 672 9 478 9 202 France Pentoxide 574 605 429 652 660 Metal 84 104 119 80 94 Germany Pentoxide (a) * 1 000 * 700 * 1 300 * 1 500 * 400 Metal 61 104 68 60 50 Italy Pentoxide 53 45 117 231 304 Netherlands Pentoxide 204 888 558 1 240 3 465 Metal 21 6 ... 66 333 Spain Pentoxide 115 52 56 57 36 United Kingdom Metal 197 376 261 199 168
Notes (1) In this table the term 'pentoxide' also includes vanadium oxides and hydroxides, if any (2) Metal traded in ferro-alloy form is included under iron, steel and ferro-alloys (a) BGS estimates, based on known exports from certain countries

349
Zinc
Zinc
• Zinc is a metal that is brittle at ordinary temperatures but malleable at temperatures above 100ºC. It is corrosion resistant and this property is exploited in its chief use as a steel coating (galvanising). Its other main uses are as zinc die-castings and alloyed with copper to make brass, which is widely used in the electrical, engineering and construction industries.
• China was the world’s largest producer of mined zinc in 2014, with 38 per cent of the total world output. The second largest was Australia (11 per cent), followed by Peru (ten per cent)and USA (six per cent).
• China was also the world’s largest producer of slab zinc in 2013, with 43 per cent of the total world output. The second largest was South Korea (seven per cent), followed by India and Canada (five per cent each).
Rest of World 92.7%
Finland 4.6%
Ireland 28.4%
Macedonia 3.2%
Others 5.1%
Poland 5.6%
Portugal 6.8%
Spain 2.7%
Sweden 22.3%
Turkey 21.3%
EU36 7.3%
EU36 Mine production of zinc 2014
Mine production of zinc tonnes (metal content) Country 2010 2011 2012 2013 2014 Bulgaria (a) 9 904 10 977 12 116 13 902 11 900 Finland 55 562 64 115 52 200 41 124 46 100 Greece 18 400 21 200 20 800 22 549 23 085 Ireland, Republic of 342 500 344 000 337 500 326 700 282 600 Macedonia 32 872 28 132 28 037 30 907 31 570 Montenegro * 250 * 3 300 4 677 5 487 5 505 Poland 107 700 87 200 76 700 75 900 56 000 Portugal 6 422 4 227 30 006 53 382 67 378 Romania * 7 700 * 8 800 * 8 400 * 2 000 * 3 300 Serbia 2 600 3 100 6 000 5 800 7 100 Slovakia 82 103 134 190 176 Spain 17 323 33 197 28 634 30 428 26 756 Sweden 198 687 194 021 188 325 176 582 221 841 Turkey 195 500 158 057 195 793 195 025 210 152 EU36 total 996 000 960 000 989 000 980 000 993 000
Notes (a) Metal content of ore

350
Zinc
0
200
400
600
800
1 000
1 200
2010 2011 2012 2013 2014
Thou
sand
tonn
es (m
etal
con
tent
)
EU36 Mine production of zinc 2010 - 14
Rest of World 83.5%
Belgium 11.7%
Bulgaria 3.9%Finland 13.5%
France 7.6%
Germany 7.4%
Italy 4.9%
Netherlands 13.0%
Norway 7.4%Poland 6.9%
Spain 23.7%
EU36 16.5%
EU36 Production of slab zinc 2014
Production of slab zinc tonnes Country 2010 2011 2012 2013 2014 Belgium (a) 260 000 282 000 250 000 252 000 262 000 Bulgaria 93 800 88 400 73 100 * 72 000 87 800 Finland 307 144 307 352 314 742 311 686 302 000 France 163 000 164 000 161 000 152 000 171 000 Germany 165 000 170 000 169 000 162 000 165 000 Italy 104 700 110 200 97 200 111 000 110 100 Netherlands 264 000 261 000 257 000 275 000 290 000 Norway 148 862 153 200 152 647 143 444 165 600 Poland 135 100 144 100 138 300 146 300 154 000 Spain 517 100 527 100 528 300 * 530 000 * 530 000 EU36 total 2 159 000 2 207 000 2 141 000 2 155 000 2 238 000
Notes (a) Years ended 31 March following that stated

351
Zinc
0
500
1 000
1 500
2 000
2 500
2010 2011 2012 2013 2014
Thou
sand
tonn
es
EU36 Production of slab zinc 2010 - 14
Exports of zinc tonnes Country 2010 2011 2012 2013 2014 Austria Unwrought (a) 8 532 9 776 6 410 11 065 10 933 Scrap 5 757 8 583 8 591 10 440 10 077 Belgium Ores & concentrates 749 582 725 335 859 086 773 334 840 967 Unwrought 155 654 296 197 277 418 244 589 252 548 Unwrought alloys ... 154 258 140 766 155 488 183 718 Scrap 14 540 11 652 15 063 13 333 15 985 Bulgaria Unwrought (a) 81 332 71 894 57 768 54 272 60 880 Scrap 1 949 2 021 2 185 1 353 1 382 Croatia Scrap 518 676 764 833 1 023 Czech Republic Unwrought (a) 5 148 5 147 7 407 13 112 61 347 Scrap 4 798 4 189 4 432 3 364 3 276 Denmark Unwrought (a) 318 635 789 1 060 727 Scrap 2 563 2 468 2 617 2 271 2 565 Finland Ores & concentrates 22 479 50 656 39 555 29 613 15 395 Unwrought (a) 266 738 265 686 271 313 272 632 263 422 Scrap 1 369 1 215 1 066 935 808 France Ores & concentrates 49 652 54 609 62 111 97 317 81 569 Unwrought 79 727 105 934 80 747 73 557 119 045 Unwrought alloys 1 851 2 549 1 938 2 333 2 235 Scrap 51 755 42 736 42 231 47 478 118 445 Germany Ores & concentrates 1 674 73 980 39 533 96 369 98 065 Unwrought 52 483 55 518 59 913 54 476 69 430 Unwrought alloys 31 857 31 170 29 775 27 985 24 342 Scrap 74 208 75 168 73 200 52 974 53 244 Greece Ores & concentrates 14 660 36 016 51 007 41 940 36 764 Hungary Unwrought (a) 405 527 264 148 1 750 Scrap 2 821 2 314 1 897 1 755 2 169 Ireland, Republic of Ores & concentrates 588 143 660 259 647 444 615 916 531 029 Italy Ores & concentrates 98 211 71 471 84 569 89 580 68 508 Unwrought 11 071 16 570 14 737 8 016 11 199 Unwrought alloys 6 377 9 385 10 029 8 415 7 417 Scrap 16 427 13 006 7 151 7 019 10 416

352
Zinc
Exports continued tonnes Country 2010 2011 2012 2013 2014 Latvia Scrap 587 459 779 821 838 Lithuania Unwrought ... 330 618 432 1 283 Luxembourg Scrap 1 134 739 698 690 790 Macedonia Ores & concentrates 60 369 51 545 51 154 56 810 57 218 Scrap 739 313 103 144 230 Montenegro Ores & concentrates 499 6 579 9 120 9 283 14 340 Netherlands Ores & concentrates 12 182 132 344 90 253 91 030 79 600 Unwrought 166 281 122 532 213 479 272 732 190 548 Unwrought alloys 42 182 52 382 39 626 48 484 68 830 Scrap 32 543 25 629 28 277 26 682 31 910 Norway Unwrought 122 649 119 770 115 789 109 485 125 164 Unwrought alloys 19 889 29 094 28 188 30 614 33 315 Poland Ores & concentrates 4 213 0 0 3 2 Unwrought 96 142 105 552 105 929 128 521 181 437 Unwrought alloys 6 280 6 939 6 541 9 137 13 607 Scrap 902 960 533 570 1 570 Portugal Ores & concentrates 7 438 2 201 67 881 112 125 150 223 Unwrought (a) 151 734 1 723 492 320 Scrap 940 755 5 736 1 745 2 072 Romania Ores & concentrates 15 375 17 592 16 745 4 080 6 647 Scrap 711 597 672 592 885 Serbia Ores & concentrates 14 921 23 247 22 559 25 416 24 149 Scrap 120 67 907 834 652 Slovakia Unwrought 7 903 2 836 3 421 2 385 8 410 Unwrought alloys 13 075 7 001 10 336 10 472 13 722 Slovenia Unwrought (a) 2 725 918 367 604 1 477 Scrap 933 832 1 104 1 173 1 656 Spain Ores & concentrates 104 276 122 372 133 163 92 125 71 193 Unwrought 318 527 351 378 359 605 303 548 291 072 Unwrought alloys 91 054 35 318 38 229 42 674 56 974 Scrap 37 362 15 625 8 283 17 625 8 669 Sweden Ores & concentrates 362 085 374 501 343 725 333 534 411 944 Scrap 2 900 3 257 3 166 2 877 2 143 Switzerland Scrap 2 582 2 846 2 284 1 889 2 222 Turkey Ores & concentrates 392 725 316 714 412 744 399 384 422 982 Unwrought (a) 666 1 704 2 130 2 443 2 490 Scrap 1 536 2 997 2 960 1 903 1 469 United Kingdom Ores & concentrates 8 405 9 714 5 561 4 720 7 515 Unwrought 3 580 2 724 1 823 2 138 2 930 Unwrought alloys 14 561 12 737 13 580 11 251 17 173 Scrap 14 903 12 545 9 897 4 375 4 736
Notes (1) In this table the term 'unwrought' zinc corresponds to item 7901 of the Harmonised System and comprises blocks, pigs, slabs, etc. (a) Including alloys

353
Zinc
Imports of zinc tonnes
Country 2010 2011 2012 2013 2014 Austria Unwrought 37 560 47 394 51 634 72 381 69 138 Unwrought alloys 34 411 38 759 34 920 33 182 33 553 Scrap 298 4 827 9 832 9 204 12 481 Belgium Ores & concentrates 1 129 207 1 182 797 1 194 208 1 132 719 1 157 770 Unwrought 189 980 280 492 267 917 214 491 375 977 Unwrought alloys 10 613 11 844 30 383 40 924 26 113 Scrap 68 233 66 665 57 765 52 498 51 133 Bulgaria Ores & concentrates 167 107 166 553 132 500 127 158 129 405 Unwrought (a) 1 761 2 765 6 878 2 765 8 846 Croatia Unwrought (a) 3 029 2 886 2 847 3 024 3 395 Czech Republic Unwrought 15 121 17 137 19 064 21 687 65 712 Unwrought alloys 11 653 10 590 11 947 8 524 8 852 Scrap 900 909 583 177 161 Denmark Unwrought 4 427 6 023 6 877 6 968 6 605 Unwrought alloys 1 310 954 923 1 343 1 239 Estonia Unwrought (a) 5 978 8 887 4 987 664 705 Finland Ores & concentrates 559 918 547 265 558 963 611 240 557 413 Unwrought (a) 4 374 1 471 1 146 1 565 1 750 France Ores & concentrates 222 580 234 060 288 110 306 850 320 668 Unwrought 131 993 151 988 126 771 120 553 119 879 Unwrought alloys 34 205 34 022 32 075 34 823 37 710 Scrap 3 003 3 853 23 591 58 552 53 540 Germany Ores & concentrates 285 331 344 106 324 954 292 037 364 990 Unwrought 380 807 398 086 365 788 371 332 378 951 Unwrought alloys 57 563 69 972 64 642 64 278 76 188 Scrap 23 694 25 853 25 536 20 363 23 291 Greece Unwrought 20 735 9 706 9 762 8 833 6 619 Unwrought alloys 1 799 1 652 1 579 1 062 1 025 Hungary Unwrought 8 806 9 478 9 838 8 660 10 895 Unwrought alloys 2 961 3 340 3 018 3 479 4 579 Ireland, Republic of Unwrought (a) 2 104 2 358 2 058 2 481 2 579 Italy Ores & concentrates 184 192 153 982 186 715 140 909 183 989 Unwrought 245 254 244 557 164 716 142 457 143 426 Unwrought alloys 34 595 39 554 31 434 48 303 49 733 Scrap 27 740 36 491 36 134 39 614 50 413 Latvia Unwrought (a) 383 249 662 402 3 637 Lithuania Unwrought (a) 460 1 049 1 063 684 1 830 Luxembourg Unwrought 9 232 6 819 7 461 7 080 5 664 Macedonia Unwrought (a) 5 213 4 920 4 611 4 075 4 664 Netherlands Ores & concentrates 391 050 355 644 445 698 474 857 640 235 Unwrought 254 953 227 277 221 680 191 576 165 072 Unwrought alloys 19 827 13 356 8 029 24 859 12 532 Scrap 12 653 9 283 6 759 7 301 8 417 Norway Ores & concentrates 228 828 250 537 260 442 237 170 261 048 Unwrought (a) 1 376 1 013 2 313 205 279

354
Zinc
Imports continued tonnes
Country 2010 2011 2012 2013 2014 Poland Ores & concentrates 115 561 97 225 178 780 157 232 143 744 Unwrought 53 983 49 569 47 314 48 736 41 524 Unwrought alloys 7 610 10 045 11 622 11 593 9 799 Scrap 7 188 10 421 11 060 14 251 15 464 Portugal Unwrought 15 757 13 299 11 135 10 471 8 692 Unwrought alloys 4 522 3 967 4 601 6 084 6 585 Romania Unwrought (a) 16 664 17 006 16 883 18 691 18 128 Scrap 246 439 1 628 1 101 1 046 Serbia Unwrought 4 846 5 275 5 344 6 418 5 932 Slovakia Unwrought (a) 37 266 34 536 27 313 36 191 50 943 Slovenia Unwrought 15 314 14 495 12 916 12 984 14 284 Unwrought alloys 5 850 7 374 6 623 8 457 9 576 Scrap 313 299 279 384 968 Spain Ores & concentrates 958 485 977 695 1 069 671 994 451 1 057 670 Unwrought 7 583 16 841 6 091 4 623 12 274 Unwrought alloys 15 388 11 025 7 235 7 156 8 081 Scrap 10 935 23 205 9 620 38 266 41 625 Sweden Unwrought 37 524 30 598 24 686 23 619 25 827 Unwrought alloys 5 905 6 282 5 907 6 536 6 910 Switzerland Unwrought 15 521 12 747 11 702 11 554 10 560 Unwrought alloys 2 276 2 158 1 930 1 648 2 080 Turkey Unwrought 182 598 201 409 224 683 234 744 237 999 Unwrought alloys 2 876 6 504 5 261 10 059 13 969 United Kingdom Unwrought 97 066 85 516 77 847 98 448 113 410 Unwrought alloys 2 973 9 306 8 917 8 469 5 177 Scrap 447 339 412 533 1 412
Notes (1) In this table the term 'unwrought' zinc corresponds to item 7901 of the Harmonised System and comprises blocks, pigs, slabs, etc. (a) Including alloys

355
Zinc
Zinc ore - EU36 trade in 2014
Zinc - EU36 trade in 2014
-1,000 -800 -600 -400 -200 0 200 400 600 800 1,000 1,200
BelgiumSpain
NetherlandsFinland
GermanyFranceNorway
ItalyPoland
BulgariaGreece
Ireland, Republic ofMontenegro
United KingdomPortugalRomania
SerbiaSwedenTurkey
Macedonia
Thousand tonnes
Imports Exports
-500 -400 -300 -200 -100 0 100 200 300 400 500
GermanyBelgiumTurkey
ItalyNetherlands
FranceUnited Kingdom
AustriaCzech Republic
PolandSlovakiaSwedenSlovenia
SpainRomaniaHungaryPortugal
SwitzerlandBulgaria
DenmarkGreeceSerbia
LuxembourgMacedonia
LatviaCroatia
Ireland, Republic ofLithuania
FinlandNorway
Thousand tonnes
Metal
Scrap
Imports Exports

356
Zirconium
Zirconium minerals
• The mineral zircon (zirconium silicate) is the principal zirconium commodity. Due to its very high melting temperature and chemical stability, it is used as a refractory in furnace and ladle linings, foundry sands and ceramic manufacture. Zirconium metal manufacture is a very small part of total output.
• Zircon is recovered from heavy mineral sands, typically as a co-product with titanium minerals. Australia was estimated to be the world’s largest producer in 2014, with approximately 34 per cent of the total world output. The second largest was South Africa (33 per cent), followed by USA (ten per cent) and Mozambique (four per cent).
Exports of zirconium tonnes Country 2010 2011 2012 2013 2014 Belgium Concentrates 17 417 12 021 13 246 17 228 9 173 Metal 187 272 186 197 274 France Concentrates 2 044 4 973 1 708 1 955 2 569 Germany Concentrates (a) * 10 800 * 10 800 * 7 500 * 6 300 * 5 700 Metal 384 792 735 896 853 Italy Concentrates 41 784 44 252 11 012 2 832 3 500 Metal 136 34 137 27 17 Netherlands Concentrates 11 091 13 351 9 959 9 514 11 493 Metal 110 108 147 75 32 Spain Concentrates 122 372 29 952 14 360 8 031 10 191 Metal 51 3 64 73 50 United Kingdom Concentrates 1 405 1 661 818 1 037 1 261 Metal 90 102 213 66 60
Notes (1) Metal traded in ferro-alloy form is included under iron, steel and ferro-alloys (a) BGS estimates, based on known imports into certain countries
Imports of zirconium tonnes Country 2010 2011 2012 2013 2014 Austria Concentrates 1 680 1 994 1 344 1 193 1 132 Belgium Concentrates 17 469 12 317 12 682 17 652 10 321 Metal 370 480 309 382 306 Bulgaria Concentrates 781 609 95 231 172 Czech Republic Concentrates 303 955 595 682 767 Metal 37 34 24 46 187 France Concentrates 25 310 35 922 25 784 26 688 17 834 Metal 326 687 436 363 3 863 Germany Metal 798 676 956 983 867 Hungary Concentrates 2 455 1 765 1 965 1 444 1 209 Ireland, Republic of Concentrates 16 162 886 146 268 231

357
Zirconium
Imports continued tonnes Country 2010 2011 2012 2013 2014 Italy Concentrates 98 214 81 360 40 897 56 430 55 743 Metal 144 184 135 141 80 Latvia Concentrates ... ... 165 352 540 Netherlands Concentrates 23 981 43 560 17 070 6 651 19 942 Metal 188 297 211 152 206 Poland Concentrates 648 488 670 735 759 Portugal Concentrates 5 475 4 048 2 386 2 574 3 555 Romania Metal 35 41 1 46 106 Spain Concentrates 149 442 143 493 63 341 99 858 116 434 Metal 132 97 124 136 136 Sweden Metal 220 120 146 119 121 Turkey Concentrates 4 823 4 770 3 268 4 130 4 808 United Kingdom Concentrates (a) 8 450 14 709 8 928 6 879 7 974 Metal 411 616 482 513 391
Notes (1) Metal traded in ferro-alloy form is included under iron, steel and ferro-alloys (a) Mainly zircon.
Zirconium concentrates - EU36 trade in 2014
-20 0 20 40 60 80 100 120
SpainItaly
NetherlandsFrance
BelgiumUnited Kingdom
TurkeyPortugalHungary
AustriaCzech Republic
PolandLatvia
Germany
Thousand tonnes
Imports Exports

358
Other Mineral Commodities
Borates
• Borates is a general term for a range of boron-containing minerals of which borax (tincal), ulexite, colemanite and datolite are the most commercially significant. These minerals are processed via boron trioxide to boric acid. The chief use of borate minerals is in glass manufacture (in particular fibreglass) and ceramics.
• Economic concentrations of borates form in unusual geological environments and so production is restricted to a few countries. Of these, Turkey was the world’s largest producer in 2014, with 32 per cent of the total world output. The second largest was USA (24 per cent), followed by Argentina (14 per cent) and Chile (11 per cent).
Production of borates tonnes Country 2010 2011 2012 2013 2014
Turkey 2 504 249 2 729 849 1 814 725 1 748 231 * 1 750 000
Nepheline syenite
• Nepheline syenite is an igneous rock composed chiefly of feldspar and nepheline (one of a family of minerals called feldspathoids). The chief uses are similar to those for feldspar, i.e. in the manufacture of glass, in ceramics and as a filler.
• Economic concentrations form in rare geological environments and only a few countries are known to produce nepheline syenite. Russia was the largest known producer in 2014, followed by Canada and Norway.
Production of nepheline syenite tonnes Country 2010 2011 2012 2013 2014
Norway 327 000 330 000 320 000 320 000 331 000
Perlite
• Perlite is a silicate mineral that results from the alteration of natural glass with the chemical composition of granite. Upon heating the mineral swells and dewaters — resulting in a sudden increase in volume accompanied by a decrease in density. It has remarkable thermal insulation properties, porosity, chemical stability, low flammability, high heat resistance and high sound absorption. It is chiefly used in building materials.
• Turkey and Iran were estimated to be the joint largest producers in the world in 2014, with approximately 23 per cent of the total world output each. The next largest were Greece (20 per cent), China (14 per cent) and USA (nine per cent).
Production of perlite tonnes Country 2010 2011 2012 2013 2014 Bulgaria — — 3 700 — * — Greece 790 000 800 000 870 000 890 000 985 000 Hungary 70 990 70 900 72 364 64 944 * 65 000 Italy * 60 000 * 60 000 * 60 000 * 60 000 * 60 000 Slovakia 23 000 23 000 24 000 16 000 17 000 Turkey 545 585 702 673 887 600 1 075 949 * 1 100 000 EU36 total 1 490 000 1 660 000 1 920 000 2 110 000 2 230 000
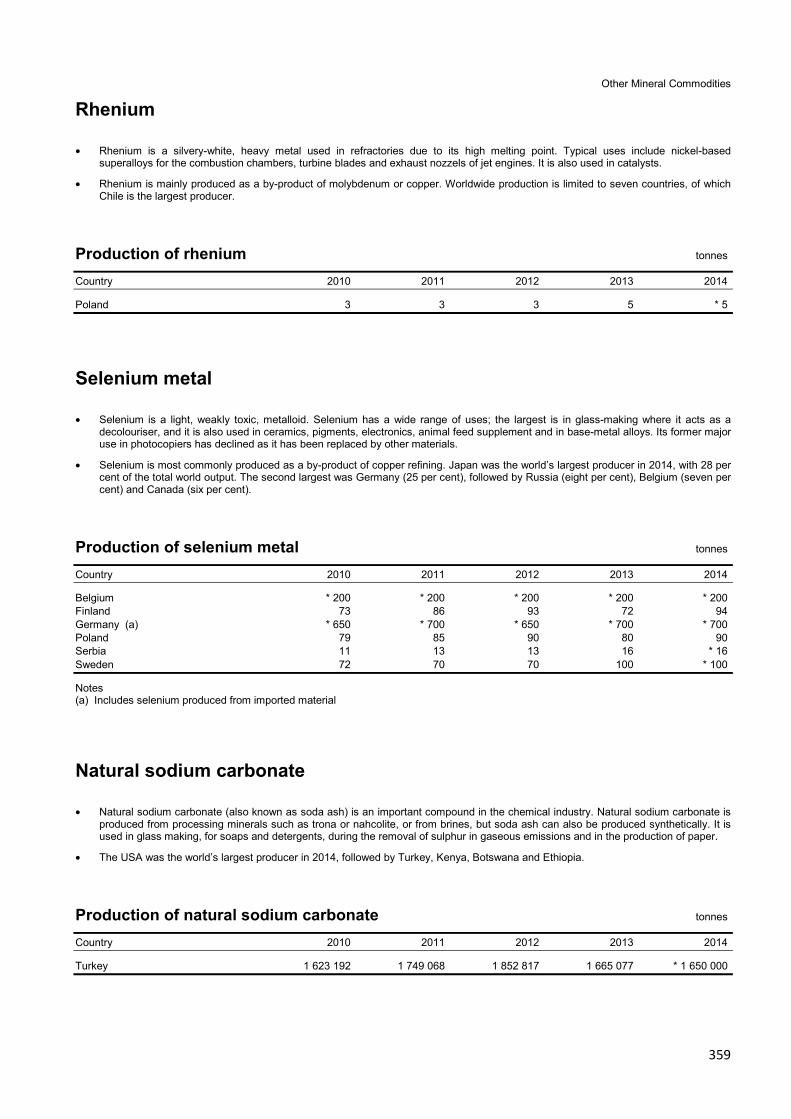
359
Other Mineral Commodities
Rhenium
• Rhenium is a silvery-white, heavy metal used in refractories due to its high melting point. Typical uses include nickel-based superalloys for the combustion chambers, turbine blades and exhaust nozzels of jet engines. It is also used in catalysts.
• Rhenium is mainly produced as a by-product of molybdenum or copper. Worldwide production is limited to seven countries, of which Chile is the largest producer.
Production of rhenium tonnes
Country 2010 2011 2012 2013 2014
Poland 3 3 3 5 * 5
Selenium metal
• Selenium is a light, weakly toxic, metalloid. Selenium has a wide range of uses; the largest is in glass-making where it acts as a decolouriser, and it is also used in ceramics, pigments, electronics, animal feed supplement and in base-metal alloys. Its former major use in photocopiers has declined as it has been replaced by other materials.
• Selenium is most commonly produced as a by-product of copper refining. Japan was the world’s largest producer in 2014, with 28 per cent of the total world output. The second largest was Germany (25 per cent), followed by Russia (eight per cent), Belgium (seven per cent) and Canada (six per cent).
Production of selenium metal tonnes Country 2010 2011 2012 2013 2014 Belgium * 200 * 200 * 200 * 200 * 200 Finland 73 86 93 72 94 Germany (a) * 650 * 700 * 650 * 700 * 700 Poland 79 85 90 80 90 Serbia 11 13 13 16 * 16 Sweden 72 70 70 100 * 100
Notes (a) Includes selenium produced from imported material
Natural sodium carbonate
• Natural sodium carbonate (also known as soda ash) is an important compound in the chemical industry. Natural sodium carbonate is produced from processing minerals such as trona or nahcolite, or from brines, but soda ash can also be produced synthetically. It is used in glass making, for soaps and detergents, during the removal of sulphur in gaseous emissions and in the production of paper.
• The USA was the world’s largest producer in 2014, followed by Turkey, Kenya, Botswana and Ethiopia.
Production of natural sodium carbonate tonnes Country 2010 2011 2012 2013 2014
Turkey 1 623 192 1 749 068 1 852 817 1 665 077 * 1 650 000

360
Other Mineral Commodities
Strontium minerals
• Strontium is a soft metallic element. The most common strontium mineral is celestite (strontium sulphate). This is frequently converted into strontium carbonate before marketing. Strontium compounds are also used in pyrotechnics and flares, ceramic ferrite magnets, pigments and fillers, and in glass (particularly the glass for televisions screens).
• China was the world’s largest producer in 2014, with 76 per cent of the total world output. The second largest was Spain (14 per cent), followed by Mexico (seven per cent).
Production of strontium minerals tonnes Country 2010 2011 2012 2013 2014
Spain 83 035 97 102 96 888 90 972 128 077
Notes (1) In addition to the countries listed, Germany and Poland are believed to produce strontium minerals
Tellurium
• Tellurium is a brittle, mildly toxic, silvery-white metalloid which is used primarily in steel or copper alloys to improve machinability. It is also used in semi-conductors and solar panels.
• Tellurium is mainly produced as a by-product of copper refining and worldwide production of limited to five countries, of which the USA is the largest producer, followed by Japan and Sweden.
Production of tellurium metal tonnes Country 2010 2011 2012 2013 2014
Sweden — — 7 24 31
Notes (1) In addition to the countries listed, Germany is believed to produce tellurium metal
Uranium
• Uranium is a dense metallic element. It is chiefly used as the fuel source for nuclear power stations. Uranium ore is milled and processed into ‘yellowcake’ (a uranium oxide), which is the chief form in international trade. Yellowcake is converted to uranium hexafluoride, which is then enriched to enable it to be used as a fuel.
• Kazakhstan was the world’s largest producer in 2014, with 41 per cent of the total world output. The second largest was Canada (16 per cent), followed by Australia (9 per cent) and Niger (seven per cent).
Mine production of uranium tonnes (metal content) Country 2010 2011 2012 2013 2014 Czech Republic 259 252 222 232 165 Germany * 8 52 50 27 33 Romania * 77 * 77 * 90 * 80 * 77
Notes (1) Excluding uranium production from decommissioning operations
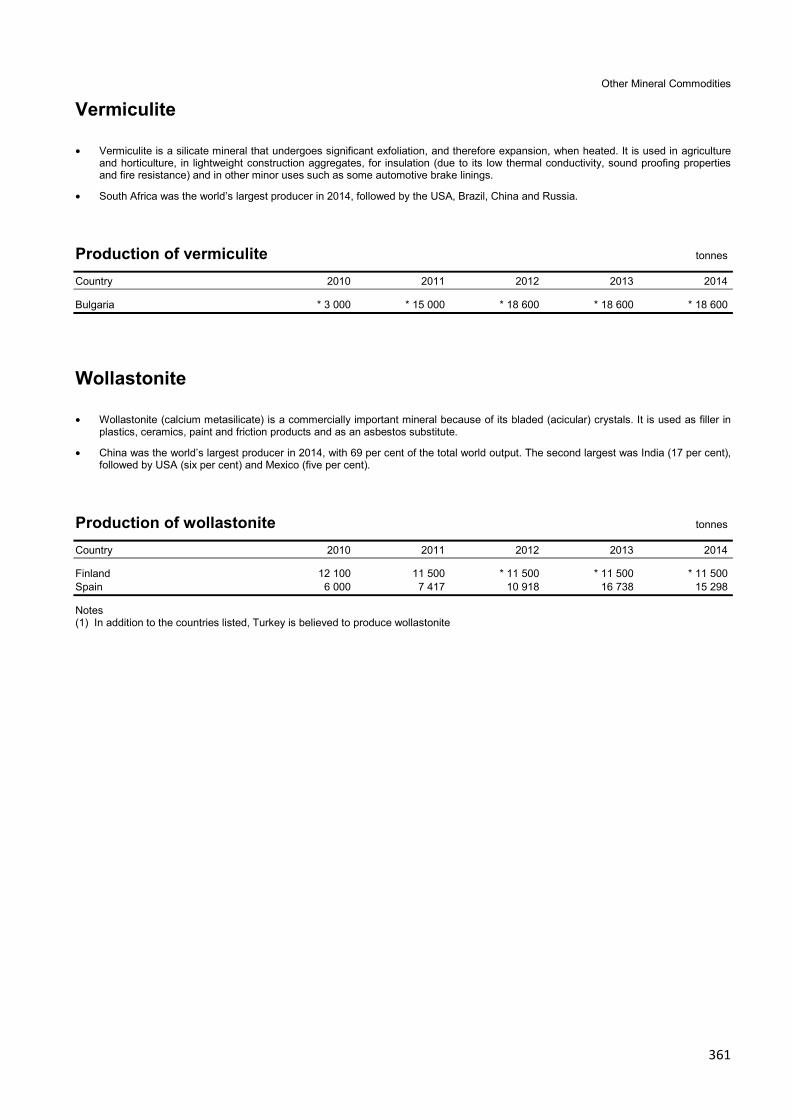
361
Other Mineral Commodities
Vermiculite
• Vermiculite is a silicate mineral that undergoes significant exfoliation, and therefore expansion, when heated. It is used in agriculture and horticulture, in lightweight construction aggregates, for insulation (due to its low thermal conductivity, sound proofing properties and fire resistance) and in other minor uses such as some automotive brake linings.
• South Africa was the world’s largest producer in 2014, followed by the USA, Brazil, China and Russia.
Production of vermiculite tonnes Country 2010 2011 2012 2013 2014
Bulgaria * 3 000 * 15 000 * 18 600 * 18 600 * 18 600
Wollastonite
• Wollastonite (calcium metasilicate) is a commercially important mineral because of its bladed (acicular) crystals. It is used as filler in plastics, ceramics, paint and friction products and as an asbestos substitute.
• China was the world’s largest producer in 2014, with 69 per cent of the total world output. The second largest was India (17 per cent), followed by USA (six per cent) and Mexico (five per cent).
Production of wollastonite tonnes Country 2010 2011 2012 2013 2014 Finland 12 100 11 500 * 11 500 * 11 500 * 11 500 Spain 6 000 7 417 10 918 16 738 15 298
Notes (1) In addition to the countries listed, Turkey is believed to produce wollastonite

Price £30