european power system 2040 completing the map documents/tyndp2018... · wororde f 1 european power...
TRANSCRIPT
01
Euro
pean
Pow
er S
yste
m 2
040
– C
ompl
etin
g th
e m
ap
European Power System 2040
Completing the mapThe Ten-Year Network Development Plan 2018 System Needs Analysis

FOREWORD 1
1 EXECUTIVE SUMMARY 2 1.1 Summary of conclusions 4
2 INTRODUCTION 5
3 NEW CAPACITY INCREASES 6 3.1 Internal reinforcements 11
4 THE COSTS OF NO GRID IN THE 2040 ELECTRICITY SYSTEM 14
4.1 Fragmented markets and higher bills 174.2 Threatening reliable access to electricity 204.3 Falling short on European climate
objectives 224.4 Cross-border and internal physical
bottlenecks 24
5 NEW NEEDS IN A NEW SET-UP: DYNAMIC STUDY RESULTS 26
5.1 Frequency management: system inertia and local frequency variations 29
5.2 Transient and voltage stability related aspects 32
5.3 How to adapt? Possible solutions for future system operations 33
6 DESCRIPTION OF THE SCENARIOS 34
7 METHODOLOGY 407.1 IoSN methodology – market approach 437.2 IoSN methodology – network approach 44
8 NEXT STEPS 46
9 APPENDICES 489.1 Abbreviations 499.2 Terminology 50
Contents

Foreword
1
Euro
pean
Pow
er S
yste
m 2
040
– C
ompl
etin
g th
e m
ap
Power networks facilitating a system of systems
The power system in Europe is changing rapidly. While it originally was designed on the basis of centralised predictable generation ensuring steady power flows, it has progressively evolved to integrate more decentralised and variable renewable energy sources. Today almost one-third of the power generation mix is provided through variable renewables in Europe, even if the proportion can vary greatly from country to country.
Renewables, particularly photovoltaics and wind onshore, have introduced new challenges for power system operators that have to co-ordinate distributed, small-scale generation assets across their networks.
In fact the architecture of the European power system is evolving into an architecture where centralised and decentralised co-exist. New actors and new services are needed to optimise flexibility at local, national, regional and European levels. Network operators, from transmission and distribution, have a key role in facilitating the orchestration of new transactions over the whole value chain.
It is clear that we are evolving towards a system of systems. The ‘fourth industrial revolution’ increases interfaces, interactions and transactions at every stage of the system and between systems. Power networks are central in this evolution, and will remain a fundamental pillar of this transformation where sectors will need to further couple across electricity, gas, heating, transport and digital.
The power networks that were built progressively in Europe since the early days of electricity have to adapt to this paradigm shift. New hardware and software are needed to enable new interactions and to have the capacity to flow competitive renewables from north to south of Europe, ultimately bridging offshore wind from Nordics with photovoltaics from southern countries.
This report provides a quantified overview of the needs of the power system of tomorrow, looking through to the 2040 time horizon. It illustrates why constructing more physical lines is so crucial and what the cost of doing nothing would be. It also insists on innovation and the development of new tools and principles in network optimisation to guarantee a high level of security of supply, integrate more renewables, and support more and more cross-border electricity exchanges.
On this specific topic of cross-border trade, closer interaction between network operators, policymakers and regulators at regional level is highly desirable so as to debate on important questions and choices impacting citizens.
ENTSO-E is notably working towards developing a vision for how market and operation should be updated, hoping to contribute further in finding collective solutions to the issues highlighted in the present report.
As this publication shows, together with its members, ENTSO-E is committed to developing the power system that will support Europe’s competitiveness and sustainability and will guarantee a safe supply of power to Europeans for the decades to come.
Laurent SchmittENTSO-E Secretary General

What should the electricity grid look like in 2040 to create maximum value for Europeans, ensure continuous access to electricity throughout Europe and deliver on the climatic agenda? Furthermore, what would be the cost of not having the right grid by 2040? ENTSO-E’s long-term pan-European grid planning (the biennial 10-year network development plan or TYNDP) 2016 presented a plan for the European electricity grid for 2030. The ehighway2050 European research project explores the need for grids in a near to full decarbonised economic context.
The present report is looking at 2040. Very high levels – up to 75% of the total demand – of renewable energy sources (RES) will be reached, and European countries will more than ever need to rely on each other through cross-border exchanges. This means more capacity at borders, which goes hand in hand with reinforcements of national grids. This report and the six Regional Investment Plans it accompanies present how to complement the power system maps by 2040 in the most efficient way.
The right set of increases of the transmission capacity between and within European countries could indeed decrease market prices in most of the countries, strengthen security of supply and allow the integration of a high share of RES in the system. They can allow countries momentarily producing more energy than they need in case of high wind or solar to export their production, whereas in other moments they could import cheap wind or solar energy. Overall, optimising the use of renewable energy and of generation resources in Europe so that security of supply can be maintained at best cost for all Europeans.
Completing the map In the context of the mid to long-term pan-European planning, but also research and development activities, ENTSO-E has developed three 2040 scenarios describing what Europe’s future could look like. The scenarios are looking at a very decentralised, digitalised system but also a system driven by strong international cooperation or rather by a continuation of the present policies. In all scenarios, European climate are met or exceeded.
The present analyses of pan-European electricity system needs is based on those scenarios which have been widely consulted and co-created with ENTSOG so as to maximise the synergies between the two networks. This document and the six Regional Investment Plans, which all provide in depth analysis
of the studies presented in this report as well as specific regional elements, are part of the TYNDP 2018 package. The scenarios are thus ambitious and offer a wide spectrum of potential energy futures for Europe. Thanks to this strong basis, the present report assesses where transmission capacity should increase, and by how much, by taking into account policy – like cheaper electricity prices for consumers – and environmental objectives. It will shed some light on increasing challenges in terms of real-time system management in the 2040 electricity landscape.
This report aims at offering the most reliable assessment of:— pan-European network needs— the impact and needs in regions— where grid projects should be considered
but also— potential policy requirements and/or adjustments — future technical challenges to be addressed.
Preparing for the 2040 future systemA number of additional capacity increases, therefore new projects, will be necessary in the future beyond the TYNDP 2016 portfolio of projects.
These additional interconnector reinforcements were they developed would:
— Reduce market prices on average over a year— Decrease curtailed energy in countries with
significant levels of renewable energy installed, and— Increase the security of supply in scenarios with
a low amount of conventional power plants (for example, nuclear and coal) operating compared to today’s situation.
But interconnection is not enough. In order to materialise the benefits of the interconnector reinforcements and sustain the integration of renewable energy sources at large, internal grid reinforcements will also be needed to operate the system in a safe and efficient way.
The new conditions by 2040 will also make it more and more difficult for system operators to manage the system in real time, as large power flows will need to travel across Europe, and large controllable power plants are being replaced by small and distributed sources. This will require innovation in grids – notably ICT/ digital solutions – but also new market design, policy and regulatory coordination to increase flexibility in the system.
Section 1
Executive summary
1 Increases already identifed in TYNDP 2016 refers to the reference capacities of TYNDP 2016 for 2030 which for some borders had been adjusted for the TYNDP 2018 purpose. Projects commissioned in 2020 are not included as increases.
IS
NOm
NOs
SE1
SE2
SE3
SE4
FI
GB
NI
IE
FR
ESPT
DKw DKe
NL
BE
LU
DE
CH
AT
ITn
SI HR
BA
CZ
SK
HU
RS
ME
MK
GR
AL
BG
RO
PL
LT
HK
EE
CY
TR
MT
ITsic
ITs
ITcs
ITcn
ITsar
FRc
NOn
MA TN
MD
UA
BY
RU
DZ
RU

IS
NOm
NOs
SE1
SE2
SE3
SE4
FI
GB
NI
IE
FR
ESPT
DKw DKe
NL
BE
LU
DE
CH
AT
ITn
SI HR
BA
CZ
SK
HU
RS
ME
MK
GR
AL
BG
RO
PL
LT
HK
EE
CY
TR
MT
ITsic
ITs
ITcs
ITcn
ITsar
FRc
NOn
MA TN
MD
UA
BY
RU
DZ
RU
Increases beyond 2030 in only one scenarioIncreases beyond 2030 in at least two scenariosIncreases already identified in TYNDP 2016
Figure 1: Europe needs a strong, meshed grid. Results from the analysis conducted on the 2018 ENTSOs scenarios.1
1.1
Summary of conclusions
New investment needed after 2030— There will be a need for increased transmission
capacity in some places to make the system work in 2040. The interconnection projects currently in development and identified in TYNDP 2016 will need to be completed by new entries responding to these needs in future editions of the TYNDP
— New interconnection needs have been identified across and between all regions, largely due to the increasing levels and use of renewable resources to supply all areas of the European grid
— To deliver the new necessary levels of interconnections, a high level of internal reinforcements of the grid will also be necessary in most European countries.
The high cost of no grid— Overall benefits for Europeans of a fit-for-
purpose network (both financially, and to ensure continued access to electricity and enable climate objectives) far outweigh the necessary efforts which will need to be mobilised in the coming decades for its realisation
— A lack of new investments by 2040 would hinder the development of the integrated energy market and would lead to a lack of competitiveness. In turn, this would increase prices on
electricity markets leading to higher bills for consumers. By 2040, the “No Grid” extra bill (€43 billion a year in the average case) would be largely above the expected cost of the new grid (150bln€ in total in the TYNDP 2016 plus internal reinforcements, 25% discount rate)
— A lack of investments will affect the stability of the European grid and could, in some regions, threaten the continued access to electricity which also has a cost for society
— All scenarios looked at show that without grid extension, Europe will not meet its climate targets.
Policy and technical challenges to integrate renewables foreseen— Operating in real time, by 2040 the grid will
be made more difficult by the large flows of electricity travelling across Europe, and the replacement of large generators by non-controllable, distributed RES
— System operators will need new solutions to ensure frequency and voltage stability, leading to new responsibilities for market participants
— The challenges not only require technological solutions, but also a higher level of regulatory and policy coordination, as well as innovation in market design to increase flexibility in the system.

ENTSO-E has investigated pan-European system needs based on future scenarios as part of its European studies.
As the future could develop in many different ways, ENTSO-E decided to investigate three different 2040 scenarios named “Global Climate Action”, “Sustainable Transition” and “Distributed Generation”. These scenarios were co-created with ENTSOG (European Network of Transmission System Operators for Gas) and other stakeholders to ensure the most accurate and exhaustive visions for the future. The scenarios are described in more detail in Chapter 6 and in the separate Scenario Building Report2.
Because of their largely consulted and co-created nature, ENTSO-E scenarios for 2040 offer a solid basis to identify future interconnection and system needs.
The current report focuses on three main drivers for increase in transmission capacity: social economic welfare, security of supply, European climate goals. Then according to the three scenarios, ENTSO-E analysed where increase in capacity was needed. The same approach was used in the Regional Investment Plans – jointly released – so as to ensure consistency of results at regional and pan-European level.
The TYNDP 2018 will list projects that will support the meeting of the European system by 2040 and, as usual, will provide a cost-benefit analysis of each project based on the needs identified here.
2 https://www.entsoe.eu/Documents/TYNDP%20documents/14475_ENTSO_ScenarioReport_Main.pdf
Section 2
Introduction
5
Euro
pean
Pow
er S
yste
m 2
040
– C
ompl
etin
g th
e m
ap
Section 3
New capacity increases
Beyond the portfolio of projects of the previous TYNDP, greater integration of markets through new interconnectors is needed and could provide benefits financially, environmentally and in terms of security of supply.

7
Euro
pean
Pow
er S
yste
m 2
040
– C
ompl
etin
g th
e m
ap

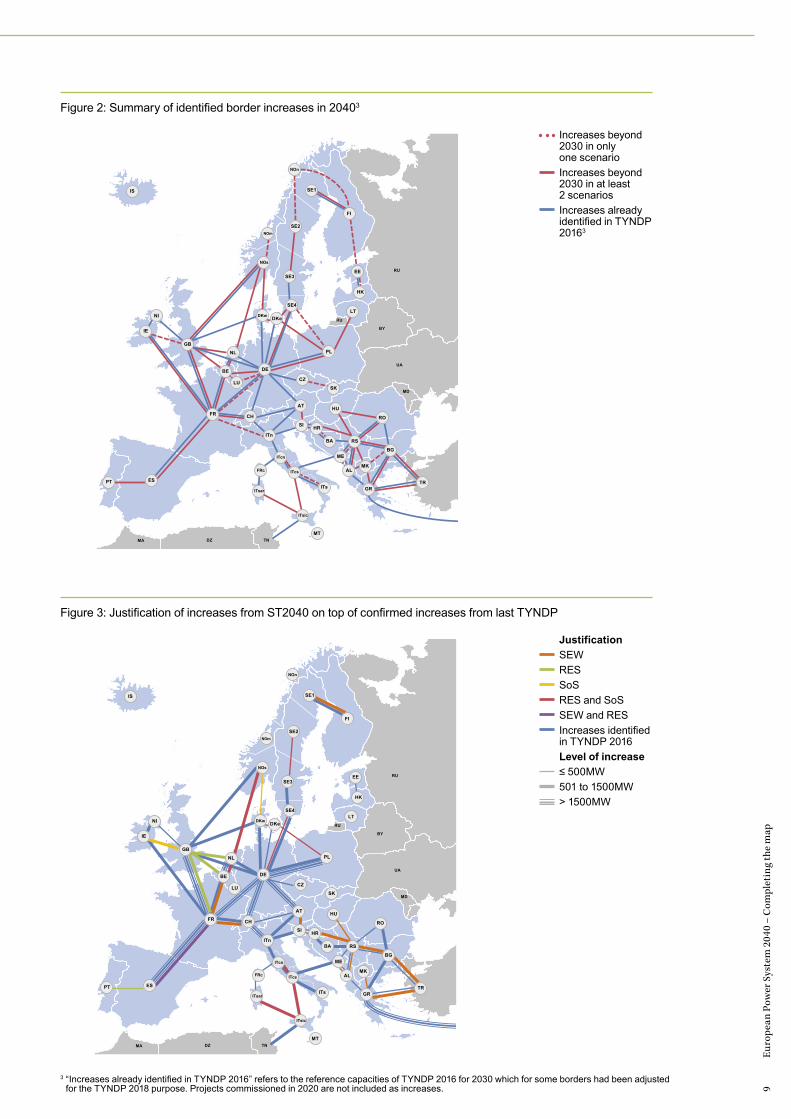
All European regions are concerned by the transformation of the energy landscape. The analysis therefore showed a need for new projects in each European region. Many of the necessary capacity increases are valid in more than one scenario, and justified by more than one driver (SEW, RES and SoS).
Each of the identified capacity needs will require further investigation. It is also certain that the proposed set of capacity increases does not represent the only solution, as other combinations of capacity increases could also address the same needs. Furthermore, the value for society of a capacity increase can only be assessed considering their interaction with each other. A change in the sequence of capacity increases could therefore have led to another valid end result. Additionally, the phenomenon studied in this report could, and will also have to, be addressed through new market designs and the development of storage and smart grid (although these elements are already ambitiously represented within the scenarios, and would therefore necessitate an exceptional and unforeseen development to address efficiently the needs described in this report).
The three following maps show the specific reason for which an increase has been identified in every scenario.
Subsequent to the outcomes of this report it is envisaged that both TSOs and other project promoters will consider and appraise whether a project is viable (in co-ordination with the relevant TSOs to which they are connecting), considering in more detail where these projects could be built exactly and which technology (AC or DC, voltage level, etc.) should be used. Any resulting proposed projects submitted will be shown against the associated needs in the TYNDP 2018 (or later TYNDPs) to perform the cost-benefit analysis and ensure that the project is robust against different realistic scenarios.
Methodology: Identifying capacity increases In order to go beyond the learning of the TYNDP published in 2016 (focusing on 2030 scenarios) ENTSO-E analysed which new capacity increases would be necessary by 2040.
To do so, ENTSO-E determined, for three distinct 2040 scenarios, which European borders presented the highest economic gains when equipped with an additional interconnector (using standard development costs for each border). This operation was repeated until no new profitable route could be identified. Following the economic analysis,
ENTSO-E tested two additional criteria in order to identify borders where additional capacity was needed for non economic reasons (integration of RES and security of supply).
The methodology is presented in Chapter 7 of this document.
The results of this analysis is a set of proposed capacity increases per European border, and an indication of the need they respond to (economic, security of supply or RES).
9
Euro
pean
Pow
er S
yste
m 2
040
– C
ompl
etin
g th
e m
ap
IS
NOm
NOs
SE1
SE2
SE3
SE4
FI
GB
NI
IE
FR
ESPT
DKw DKe
NL
BE
LU
DE
CH
AT
ITn
SI HR
BA
CZ
SK
HU
RS
ME
MK
GR
AL
BG
RO
PL
LT
HK
EE
CY
TR
MT
ITsic
ITs
ITcs
ITcn
ITsar
FRc
NOn
MA TN
MD
UA
BY
RU
DZ
RU
IS
NOm
NOs
SE1
SE2
SE3
SE4
FI
GB
NI
IE
FR
ESPT
DKw DKe
NL
BE
LU
DE
CH
AT
ITn
SI HR
BA
CZ
SK
HU
RS
ME
MK
GR
AL
BG
RO
PL
LT
HK
EE
CY
TR
MT
ITsic
ITs
ITcs
ITcn
ITsar
FRc
NOn
MA TN
MD
UA
BY
RU
DZ
RU
Figure 2: Summary of identified border increases in 20403
Figure 3: Justification of increases from ST2040 on top of confirmed increases from last TYNDP
Increases beyond 2030 in only one scenarioIncreases beyond 2030 in at least 2 scenariosIncreases already identified in TYNDP 20163
Justification
SEWRESSoSRES and SoSSEW and RESIncreases identified in TYNDP 2016Level of increase
≤ 500MW501 to 1500MW> 1500MW
3 “Increases already identified in TYNDP 2016” refers to the reference capacities of TYNDP 2016 for 2030 which for some borders had been adjusted for the TYNDP 2018 purpose. Projects commissioned in 2020 are not included as increases.

Figure 4: Justification of increases from DG2040 on top of confirmed increases from last TYNDP3
Figure 5: Justification of increases from GCA2040 on top of confirmed increases from last TYNDP
IS
NOm
NOs
SE1
SE2
SE3
SE4
FI
GB
NI
IE
FR
ESPT
DKw DKe
NL
BE
LU
DE
CH
AT
ITn
SI HR
BA
CZ
SK
HU
RS
ME
MK
GR
AL
BG
RO
PL
LT
HK
EE
CY
TR
MT
ITsic
ITs
ITcs
ITcn
ITsar
FRc
NOn
MA TN
MD
UA
BY
RU
DZ
RU
IS
NOm
NOs
SE1
SE2
SE3
SE4
FI
GB
NI
IE
FR
ESPT
DKw DKe
NL
BE
LU
DE
CH
AT
ITn
SI HR
BA
CZ
SK
HU
RS
ME
MK
GR
AL
BG
RO
PL
LT
HK
EE
CY
TR
MT
ITsic
ITs
ITcs
ITcn
ITsar
FRc
NOn
MA TN
MD
UA
BY
RU
DZ
RU
Justification
SEWRESSoSRES and SoSSEW and RESIncreases identified in TYNDP 2016Level of increase
≤ 500MW501 to 1500MW> 1500MW
Justification
SEWRESSoSRES and SoSSEW and RESIncreases identified in TYNDP 2016Level of increase
≤ 500MW501 to 1500MW> 1500MW
3 “Increases already identified in TYNDP 2016” refers to the reference capacities of TYNDP 2016 for 2030 which for some borders had been adjusted for the TYNDP 2018 purpose. Projects commissioned in 2020 are not included as increases.
11
Euro
pean
Pow
er S
yste
m 2
040
– C
ompl
etin
g th
e m
ap
4 The identified cross-border capacities of the scenario grids can be found in the appendix.
3.1
Internal reinforcements
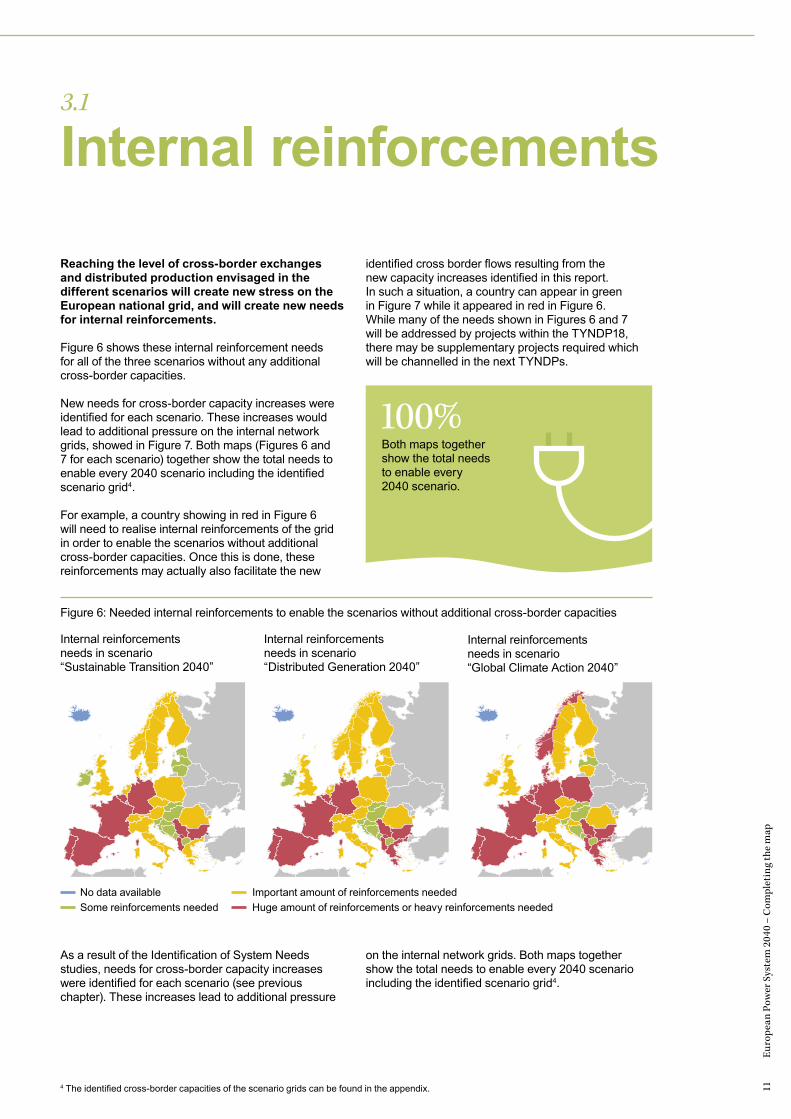
Reaching the level of cross-border exchanges and distributed production envisaged in the different scenarios will create new stress on the European national grid, and will create new needs for internal reinforcements.
Figure 6 shows these internal reinforcement needs for all of the three scenarios without any additional cross-border capacities.
New needs for cross-border capacity increases were identified for each scenario. These increases would lead to additional pressure on the internal network grids, showed in Figure 7. Both maps (Figures 6 and 7 for each scenario) together show the total needs to enable every 2040 scenario including the identified scenario grid4.
For example, a country showing in red in Figure 6 will need to realise internal reinforcements of the grid in order to enable the scenarios without additional cross-border capacities. Once this is done, these reinforcements may actually also facilitate the new
identified cross border flows resulting from the new capacity increases identified in this report. In such a situation, a country can appear in green in Figure 7 while it appeared in red in Figure 6. While many of the needs shown in Figures 6 and 7 will be addressed by projects within the TYNDP18, there may be supplementary projects required which will be channelled in the next TYNDPs.
100%Both maps together show the total needs to enable every 2040 scenario.
Figure 6: Needed internal reinforcements to enable the scenarios without additional cross-border capacities
Internal reinforcements needs in scenario “Sustainable Transition 2040”
Internal reinforcements needs in scenario “Distributed Generation 2040”
No data availableSome reinforcements needed
Important amount of reinforcements neededHuge amount of reinforcements or heavy reinforcements needed
Internal reinforcements needs in scenario “Global Climate Action 2040”
As a result of the Identification of System Needs studies, needs for cross-border capacity increases were identified for each scenario (see previous chapter). These increases lead to additional pressure
on the internal network grids. Both maps together show the total needs to enable every 2040 scenario including the identified scenario grid4.

Figure 7: Needed internal reinforcements to accommodate the additional cross-border capacity needs in thescenarios
Additional internal reinforcements needs following cross-border capacity increases identified in scenario “Sustainable Transition 2040”
Additional internal reinforcements needs following cross-border capacity increases identified in scenario “Distributed Generation 2040”
No data availableSome reinforcements needed
Important amount of reinforcements neededHuge amount of reinforcements or heavy reinforcements needed
Additional internal reinforcements needs following cross-border capacity increases identified in scenario “Global Climate Action 2040”

13
Euro
pean
Pow
er S
yste
m 2
040
– C
ompl
etin
g th
e m
ap

Section 4
The costs of no grid in the 2040 electricity system
Delivering additional investments in transmission infrastructure beyond the already significant project portfolio of the TYNDP 2016 will be needed, as showed in the previous chapter. This massive undertaking will require strong and coordinated political, technical and financial efforts throughout Europe for decades to come.
The costs of developing the grid are, however, far smaller than the economic, security of supply and environmental costs we would have if we did not increase the capacity on the transmission grid.

15
Euro
pean
Pow
er S
yste
m 2
040
– C
ompl
etin
g th
e m
ap“ Energy should flow freely across the EU – without any technical or regulatory barriers. Only then can energy providers freely compete and provide the best energy prices, and can Europe fully achieve its renewable energy potential.” Vice-President Maroš Šefčovič

Methodology: The No Grid 2040 scenario What would be the consequences of no (additional) grid for Europeans by 2040? To answer this question, we created No Grid versions of each of the 2040 ENTSOs scenarios.
These scenarios keep the generation portfolio and the demand levels of original scenarios, but use a 2020 version of the grid (projects which will be operational by 2020 are in the final stages of their delivery and therefore rather certain to happen).
Testing these scenarios and comparing the results to simulations of original scenarios allows the reader to grasp concretely the value of the overall investment portfolio, rather than incremental benefits of additional capacity increases.
In this chapter, average results for the three original and No Grid scenarios are presented in order to increase readability. Simulations have been performed using three different set of climatic conditions. These variations are also incorporated in the average results presented in this chapter. Full results are available in Appendix, Chapter 9.4.3.

17
Euro
pean
Pow
er S
yste
m 2
040
– C
ompl
etin
g th
e m
ap
4.1
Fragmented markets and higher billsNo new grid beyond 2020 would directly hit the European objective of a well-integrated European energy market. The severe limitation that this would induce in cross-border exchanges, coupled to a heterogeneous distribution of renewables across Europe, would lead to important splits between regional market prices; with price differences at the borders going up by 600% in the worst cases. This means that the cohesion of the European single market would be harmed by vastly different costs of electricity between neighbouring countries.
The following chart shows ranges and the average of hourly marginal cost differences between neighbouring countries for the six regional groups of ENTSO-E. Marginal cost differences at borders are in general highest in the Global Climate Action scenario (GCA) and lowest in the Sustainable Transition scenario (ST) (see full figures in the appendix, Chapter 9.4.3). This is due to the fact that the GCA and ST scenarios are the ones based on the highest and lowest growth of renewable resources.
Figure 8: Range and average annual marginal cost differences
No Grid scenario 2040 scenarios with scenario grid
0
10
20
30
40
50
60
€/M
Wh
Range and average of all scenarios and climate years
Baltic SeaRegion
North SeaRegion
ContinentalSouth West
Region
ContinentalCentral South
Region
ContinentalSouth East
Region
ContinentalCentral East
Region
+43bln €/yearNot reinforcing the transmission grid at borders and within countries would on average increase the total European market value by 43 billion euros per year by 2040 in an average case. This is more than three times more than the 12 billion per year Europeans need to invest to reinforce the grid according to the TYNDP 2016.
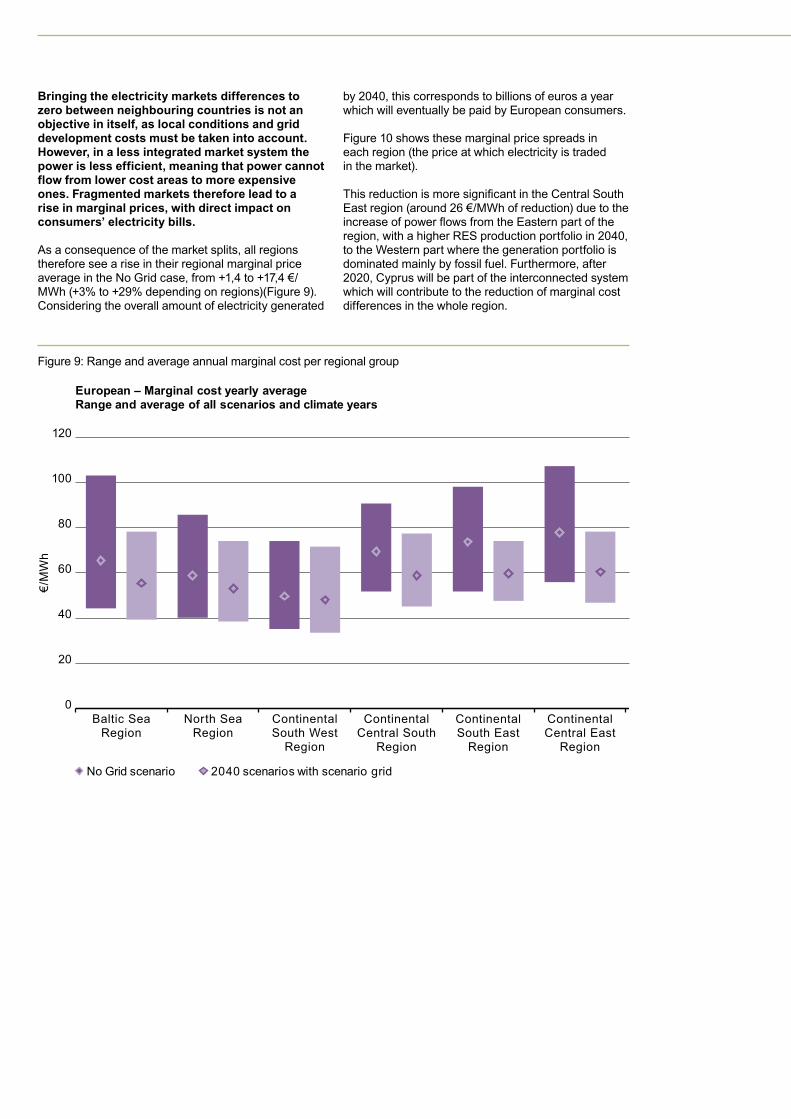
Bringing the electricity markets differences to zero between neighbouring countries is not an objective in itself, as local conditions and grid development costs must be taken into account. However, in a less integrated market system the power is less efficient, meaning that power cannot flow from lower cost areas to more expensive ones. Fragmented markets therefore lead to a rise in marginal prices, with direct impact on consumers’ electricity bills.
As a consequence of the market splits, all regions therefore see a rise in their regional marginal price average in the No Grid case, from +1,4 to +17,4 €/MWh (+3% to +29% depending on regions)(Figure 9). Considering the overall amount of electricity generated
by 2040, this corresponds to billions of euros a year which will eventually be paid by European consumers.
Figure 10 shows these marginal price spreads in each region (the price at which electricity is traded in the market).
This reduction is more significant in the Central South East region (around 26 €/MWh of reduction) due to the increase of power flows from the Eastern part of the region, with a higher RES production portfolio in 2040, to the Western part where the generation portfolio is dominated mainly by fossil fuel. Furthermore, after 2020, Cyprus will be part of the interconnected system which will contribute to the reduction of marginal cost differences in the whole region.
No Grid scenario 2040 scenarios with scenario grid
0
20
40
60
80
100
120
€/M
Wh
European – Marginal cost yearly averageRange and average of all scenarios and climate years
Baltic SeaRegion
North SeaRegion
ContinentalSouth West
Region
ContinentalCentral South
Region
ContinentalSouth East
Region
ContinentalCentral East
Region
Figure 9: Range and average annual marginal cost per regional group

19
Euro
pean
Pow
er S
yste
m 2
040
– C
ompl
etin
g th
e m
ap
The enhanced grid leads to a much greater level of power transfer between countries (Figure 10) as this network is used to trade more efficient power. This is a good indicator that the additional grid is actually supportive of trade throughout Europe and a more efficient use of the generation portfolio.
The North Sea region is the one experiencing the greatest increment in cross-border exchanges as well as the one with the highest difference in net balances between scenarios. In this region, the generation production mix in Norway and Great Britain is very dependant on the set of climatic conditions, which leads to a high variation in net balances between scenarios. All the regions are net exporters except for Central South East and Continental Central East.5
No Grid scenario 2040 scenarios with scenario grid
TWh
-200
-150
-100
-50
0
50
100
150
200
250
300
Baltic SeaRegion
North SeaRegion
ContinentalSouth West
Region
ContinentalCentral South
Region
ContinentalSouth East
Region
ContinentalCentral East
Region
European – Net annual balance per regionRange and average of all scenarios and climate years
Figure 10: Net annual region balance in 2040, depending on assumed grid status
5 Many countries are part of several regions and have therefore been included several times in the balances figures.

No Grid beyond 2020 would also have a tangible impact on Europeans’ economy and quality of life by putting at risk the reliability of access to electricity. If renewable energy sources and new
electricity uses keep growing as foreseen, failure to deliver on transmission investments would lead to unacceptable and never before seen levels of business inoperability or even blackouts.
4.2
Threatening reliable access to electricity
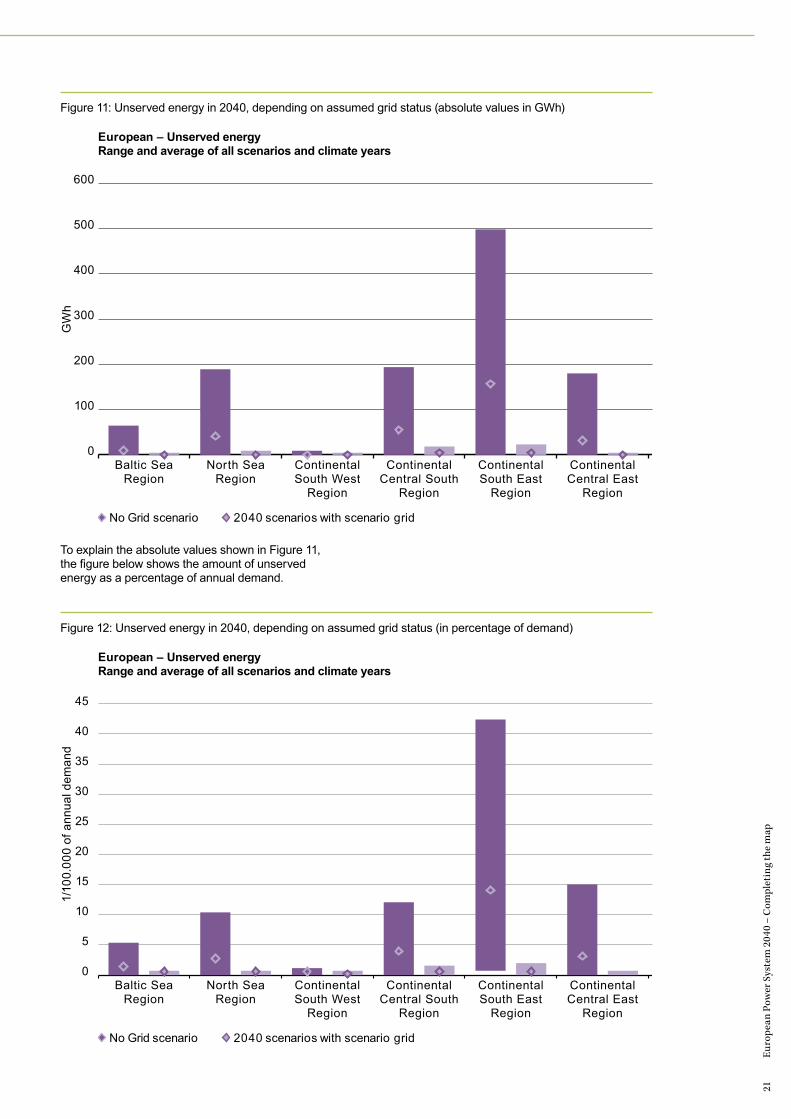
The results of the No Grid scenarios confirm that without the ability to rely on cross-border exchanges, many European countries will simply lack generation capacity.
In the No Grid scenario, unserved energy across all regions is rising. These results demonstrate the principle that interconnectors contribute to ensuring adequacy through the sharing of resources in Europe and that they are at the basis of a secure and reliable power system in the mid/long-term scenarios.
Methodology: Unserved energy Unserved energy means the amount of end-customer demand that cannot be supplied within a region due to a deficiency of generation or interconnector capacity. In other words, forced disconnection of demand customers, commonly referred to as ‘load shedding’.
This security of supply indicator is shown per region in the figures below. The additional cross-border exchange capacities identified lead to a much higher level of security of supply demonstrated by nearly no unserved energy in 2040, that is nearly zero load-shedding.
21
Euro
pean
Pow
er S
yste
m 2
040
– C
ompl
etin
g th
e m
ap
To explain the absolute values shown in Figure 11, the figure below shows the amount of unserved energy as a percentage of annual demand.
No Grid scenario 2040 scenarios with scenario grid
GW
h
0
100
200
300
400
500
600
Baltic SeaRegion
North SeaRegion
ContinentalSouth West
Region
ContinentalCentral South
Region
ContinentalSouth East
Region
ContinentalCentral East
Region
European – Unserved energyRange and average of all scenarios and climate years
No Grid scenario 2040 scenarios with scenario grid
1/10
0.00
0 of
ann
ual d
eman
d
European – Unserved energyRange and average of all scenarios and climate years
Baltic SeaRegion
North SeaRegion
ContinentalSouth West
Region
ContinentalCentral South
Region
ContinentalSouth East
Region
ContinentalCentral East
Region
0
5
10
15
20
25
30
35
40
45
Figure 11: Unserved energy in 2040, depending on assumed grid status (absolute values in GWh)
Figure 12: Unserved energy in 2040, depending on assumed grid status (in percentage of demand)
4.3
Falling short of European climate objectivesNo Grid is incompatible with the achievements of European emission targets.
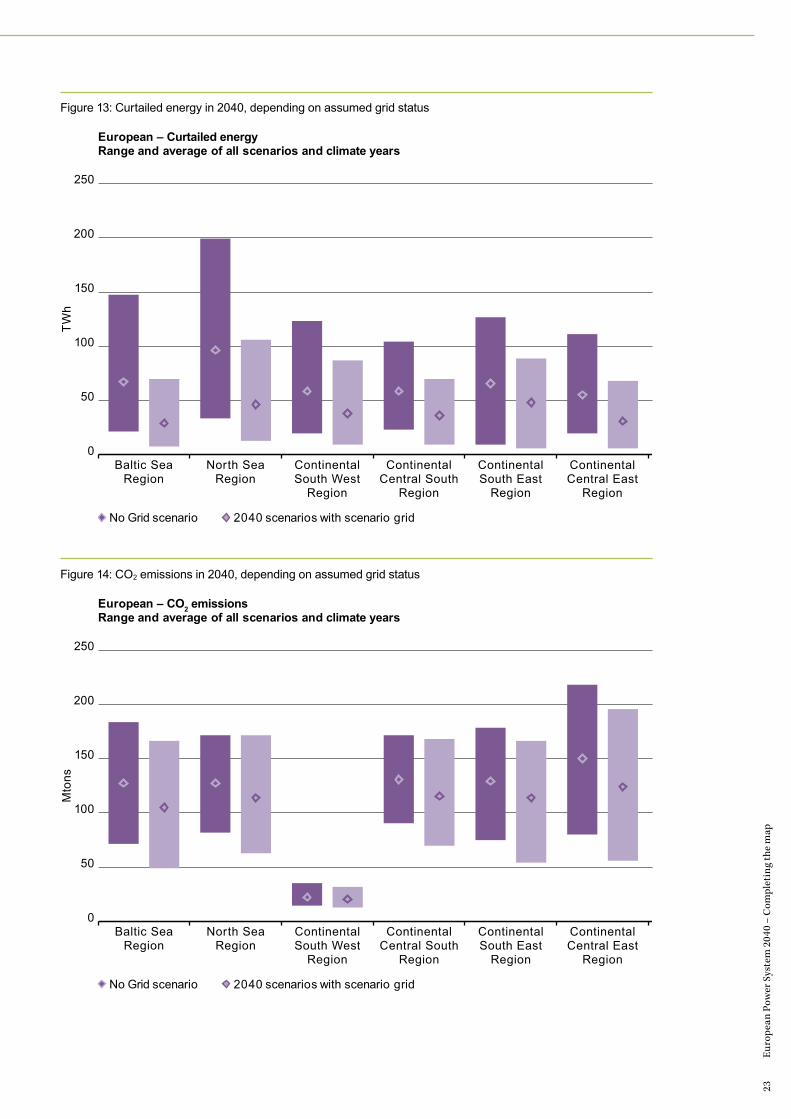
In the No Grid scenarios, significant amounts of renewable energy would go to waste as they could not be exported because of the lack of cross-border capacity. Additionally, the limitations in cross-border exchanges would be compensated by local production from peaking units, representing more CO2 emissions. Even with the delivery of the infrastructure needed by 2040, the amount of curtailed energy remains very significant despite the increase of interconnection capacities: this confirms that further reduction of curtailed energy will necessitate further optimisation of the geographical spreading of RES and/or complementary solutions (storage, etc.) to network development.
It can be argued that in the No Grid case, because RES promoters will know that they will not be able to sell their production in foreign markets and therefore will not be able to benefit from this revenue, they will not build the RES units in the first place. This would reduce the amount of lost or ‘dumped’ energy from RES, but overall push up the level of CO2 emissions. The light blue bars show the range of curtailed energy in the three scenarios per region using the capacities as they will be in 2020. The dark blue bar then shows the same regions, but provides the range of the curtailed energy using the capacities in 2040.
It is important to have in mind that all scenarios were developed under the assumption that the CO2 emissions will be reduced as defined in the European climate goals. That means that on a European level, installed coal capacity and production has been reduced in the 2030 scenarios and even more in 2040 compared to 2020 and 2025. Any old coal unit that retires after 2030 will not be rebuilt i.e. they are not included in the 2040 scenarios if they reach the end of their lifetime.
Beside the CO2 reductions achieved by the scenarios’ transition to a more renewable production system and the increased utilisation of flexible demand, the identified cross-border capacity increases reduce the CO2 emissions even more. Figure 13 shows CO2 emissions in 2040, depending on assumed grid status. Figure 14 shows ranges and averages of the regional CO2 emissions in the No Grid and original 2040 scenarios. On average, the grid built between 2020 and 2040 allows a further 10% decrease in power sector CO2 emissions as compared to the 1990 levels.
>156TWh per yearof renewable energy wasted on average because of No Grid. Equal to the total annual consumption of Benelux in 2040. In some situations, up to 4 times this amount would go to waste.
23
Euro
pean
Pow
er S
yste
m 2
040
– C
ompl
etin
g th
e m
ap
No Grid scenario 2040 scenarios with scenario grid
0
50
100
150
200
250
TWh
European – Curtailed energyRange and average of all scenarios and climate years
Baltic SeaRegion
North SeaRegion
ContinentalSouth West
Region
ContinentalCentral South
Region
ContinentalSouth East
Region
ContinentalCentral East
Region
No Grid scenario 2040 scenarios with scenario grid
Baltic SeaRegion
North SeaRegion
ContinentalSouth West
Region
ContinentalCentral South
Region
ContinentalSouth East
Region
ContinentalCentral East
Region
0
50
100
150
200
250
Mto
ns
European – CO2 emissionsRange and average of all scenarios and climate years
Figure 13: Curtailed energy in 2040, depending on assumed grid status
Figure 14: CO2 emissions in 2040, depending on assumed grid status
4.4
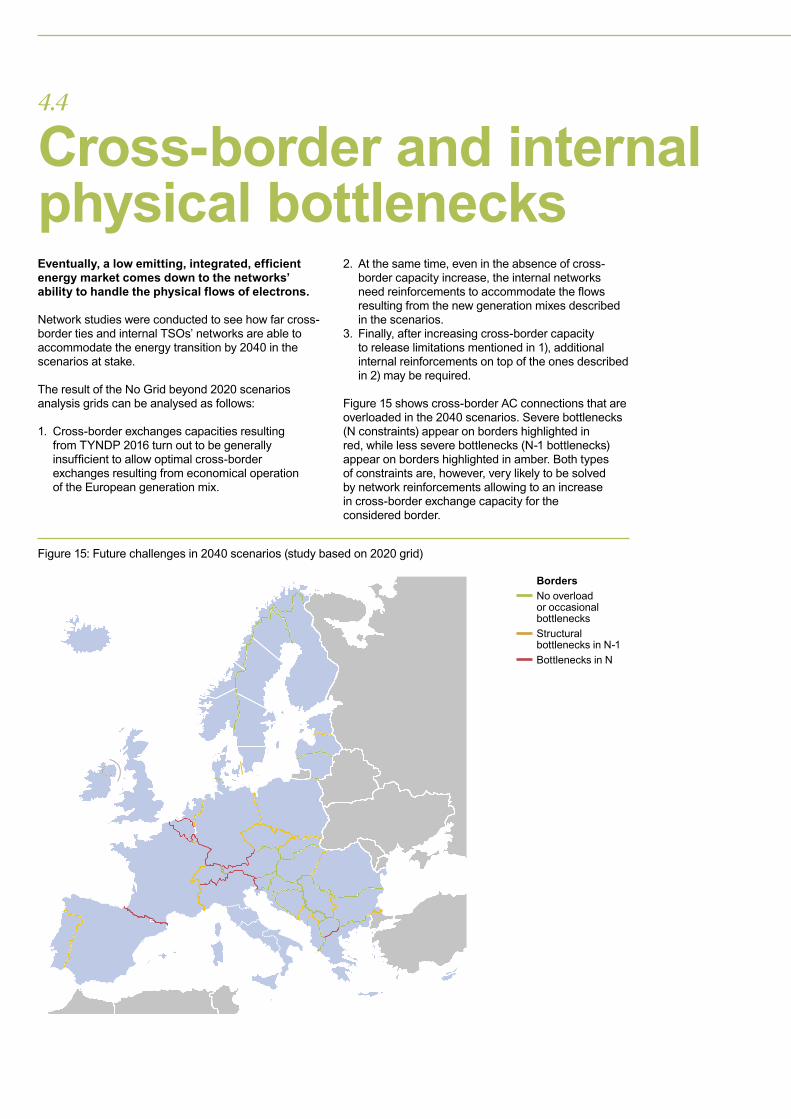
Cross-border and internal physical bottlenecksEventually, a low emitting, integrated, efficient energy market comes down to the networks’ ability to handle the physical flows of electrons. Network studies were conducted to see how far cross-border ties and internal TSOs’ networks are able to accommodate the energy transition by 2040 in the scenarios at stake.
The result of the No Grid beyond 2020 scenarios analysis grids can be analysed as follows:
1. Cross-border exchanges capacities resulting from TYNDP 2016 turn out to be generally insufficient to allow optimal cross-border exchanges resulting from economical operation of the European generation mix.
2. At the same time, even in the absence of cross-border capacity increase, the internal networks need reinforcements to accommodate the flows resulting from the new generation mixes described in the scenarios.
3. Finally, after increasing cross-border capacity to release limitations mentioned in 1), additional internal reinforcements on top of the ones described in 2) may be required.
Figure 15 shows cross-border AC connections that are overloaded in the 2040 scenarios. Severe bottlenecks (N constraints) appear on borders highlighted in red, while less severe bottlenecks (N-1 bottlenecks) appear on borders highlighted in amber. Both types of constraints are, however, very likely to be solved by network reinforcements allowing to an increase in cross-border exchange capacity for the considered border.
Figure 15: Future challenges in 2040 scenarios (study based on 2020 grid)
Borders
No overload or occasional bottlenecksStructural bottlenecks in N-1Bottlenecks in N

25
Euro
pean
Pow
er S
yste
m 2
040
– C
ompl
etin
g th
e m
ap
Section 5
New needs in a new set-up: dynamic study results
Beyond the necessity to efficiently ensure balance between production and demand at any time, the future system will also need to be operable in real time by TSOs. The changing environment radically transforms the way this will be done, leading to new technical needs for the system.

27
Euro
pean
Pow
er S
yste
m 2
040
– C
ompl
etin
g th
e m
ap

Transmission systems in Europe are increasing in complexity. Conventional generation is being displaced by new generation technologies that have different performance capabilities, generation is moving from the higher voltage levels to the distribution networks, and there is an increased level of interconnection between different synchronous areas.
This increases both the interdependency of TSO processes to operate the system in a secure and efficient manner, and the need to take into account the challenges associated with the operation of the future system when designing the transmission network.
These needs are highly dependent on the final portfolio, individual characteristics and technology of the projects that address the capacity needs identified
in this report. By presenting a vision of the situation created by the future energy landscape, this report represents a first step towards a reliable and accurate definition of these needs.
Future studies will be necessary to clearly understand the scale and nature of measures to be taken by system operators in order to adapt to the situation presented in this report.
Some of the needs may be addressed through the specification of capabilities and services that users (generation or demand) are expected to provide as part of their connection. However, additional nationally and regionally defined network reinforcement projects can also be expected to address the specific dynamic stability needs.
Methodology: Dynamic stability analysis This chapter looks into the way the system would physically respond to the ENTSOs 2040 conditions. The results it presents are based on analysis of the hourly demand and generation profiles, testing operational parameters such as inertia and short-circuit current levels, operational requirements such as flexibility, and availability of ancillary services such as reactive power support, frequency response, and contribution to short-circuit current. It is also based on a collection of more local or regional issues identified across Europe.
An explanation of the technical concepts presented in these chapters, as well as more detailed results and further analysis is presented in Appendix 1.3.
29
Euro
pean
Pow
er S
yste
m 2
040
– C
ompl
etin
g th
e m
ap
5.1
Frequency management: system inertia and local frequency variationsFrequency variations occur in power systems due to mismatches between the active power being generated and the power being used by the demand it is supplying.
Once a mismatch takes place, the energy stored in the rotating masses of the synchronous generating units, by virtue of their inertia, is released providing instantaneously balancing of any mismatch (between the raw energy supplied to generating units and the total system demand including losses). The immediate inertial action results in a change in rotor speed and, consequently, the system frequency.
Whereas this does not solve the power mismatch problem in a sustainable manner, it is essential for instantaneously balancing this mismatch until the balance between generation and demand can be restored.
Consequently the level of inertia provides a useful assessment of the emerging challenges to system operability.
The following duration curves present the percentage of hours in a full year where, for all synchronous areas, the intrinsic inertia from generators is above a given value. The estimated synchronous area equivalent inertia, expressed as H[s], is calculated on the basis of online generators’ capacity. The larger the area, the more stored energy in the rotating masses of the synchronous generating units there is inherently that the system can benefit from.
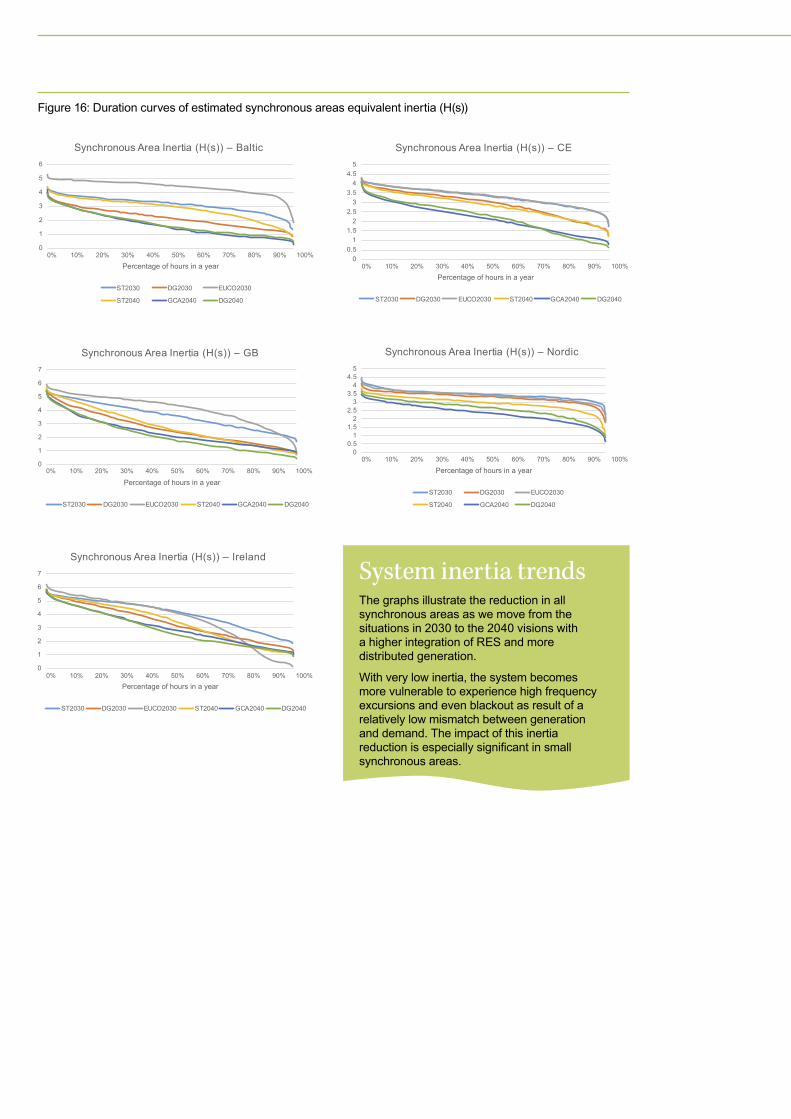
Figure 16: Duration curves of estimated synchronous areas equivalent inertia (H(s))
System inertia trendsThe graphs illustrate the reduction in all synchronous areas as we move from the situations in 2030 to the 2040 visions with a higher integration of RES and more distributed generation.
With very low inertia, the system becomesmore vulnerable to experience high frequencyexcursions and even blackout as result of arelatively low mismatch between generationand demand. The impact of this inertiareduction is especially significant in smallsynchronous areas.
00.5
11.5
22.5
33.5
44.5
5
Percentage of hours in a year
Synchronous Area Inertia (H(s)) – CE
ST2030 DG2030 EUCO2030 ST2040 GCA2040 DG2040
00% 10% 20% 30% 40% 50% 60% 70% 80% 90% 100%
1
2
3
4
5
6
Percentage of hours in a year
Synchronous Area Inertia (H(s)) – Cyprus
ST2030 DG2030 EUCO2030 ST2040 GCA2040 DG2040
00.5
11.5
22.5
33.5
44.5
5
Percentage of hours in a year
Synchronous Area Inertia (H(s)) – Nordic
ST2030 DG2030 EUCO2030
ST2040 GCA2040 DG2040
0
1
2
3
4
5
6
Percentage of hours in a year
Synchronous Area Inertia (H(s)) – Baltic
ST2030 DG2030 EUCO2030
ST2040 GCA2040 DG2040
0
1
2
3
4
5
6
7
Percentage of hours in a year
Synchronous Area Inertia (H(s)) – GB
ST2030 DG2030 EUCO2030 ST2040 GCA2040 DG2040
0
1
2
3
4
5
6
7
Percentage of hours in a year
Synchronous Area Inertia (H(s)) – Ireland
ST2030 DG2030 EUCO2030 ST2040 GCA2040 DG2040
00.5
11.5
22.5
33.5
44.5
5
Percentage of hours in a year
Synchronous Area Inertia (H(s)) – Sardinia
ST2030 DG2030 EUCO2030 ST2040 GCA2040 DG2040
0% 10% 20% 30% 40% 50% 60% 70% 80% 90% 100%
0% 10% 20% 30% 40% 50% 60% 70% 80% 90% 100%
0% 10% 20% 30% 40% 50% 60% 70% 80% 90% 100%
0% 10% 20% 30% 40% 50% 60% 70% 80% 90% 100%
0% 10% 20% 30% 40% 50% 60% 70% 80% 90% 100%
0% 10% 20% 30% 40% 50% 60% 70% 80% 90% 100%
00.5
11.5
22.5
33.5
44.5
5
Percentage of hours in a year
Synchronous Area Inertia (H(s)) – CE
ST2030 DG2030 EUCO2030 ST2040 GCA2040 DG2040
00% 10% 20% 30% 40% 50% 60% 70% 80% 90% 100%
1
2
3
4
5
6
Percentage of hours in a year
Synchronous Area Inertia (H(s)) – Cyprus
ST2030 DG2030 EUCO2030 ST2040 GCA2040 DG2040
00.5
11.5
22.5
33.5
44.5
5
Percentage of hours in a year
Synchronous Area Inertia (H(s)) – Nordic
ST2030 DG2030 EUCO2030
ST2040 GCA2040 DG2040
0
1
2
3
4
5
6
Percentage of hours in a year
Synchronous Area Inertia (H(s)) – Baltic
ST2030 DG2030 EUCO2030
ST2040 GCA2040 DG2040
0
1
2
3
4
5
6
7
Percentage of hours in a year
Synchronous Area Inertia (H(s)) – GB
ST2030 DG2030 EUCO2030 ST2040 GCA2040 DG2040
0
1
2
3
4
5
6
7
Percentage of hours in a year
Synchronous Area Inertia (H(s)) – Ireland
ST2030 DG2030 EUCO2030 ST2040 GCA2040 DG2040
00.5
11.5
22.5
33.5
44.5
5
Percentage of hours in a year
Synchronous Area Inertia (H(s)) – Sardinia
ST2030 DG2030 EUCO2030 ST2040 GCA2040 DG2040
0% 10% 20% 30% 40% 50% 60% 70% 80% 90% 100%
0% 10% 20% 30% 40% 50% 60% 70% 80% 90% 100%
0% 10% 20% 30% 40% 50% 60% 70% 80% 90% 100%
0% 10% 20% 30% 40% 50% 60% 70% 80% 90% 100%
0% 10% 20% 30% 40% 50% 60% 70% 80% 90% 100%
0% 10% 20% 30% 40% 50% 60% 70% 80% 90% 100%
31
Euro
pean
Pow
er S
yste
m 2
040
– C
ompl
etin
g th
e m
ap
Given the trend of more non-synchronous sources without intrinsic inertia, the same level of imbalance between generation and demand today will create a faster and greater change in system frequency in the future. This is because of the reduced levels of inertia to oppose this change. This trend towards higher frequency sensitivity to incidents for generation-demand imbalances is important to quantify. If the frequency changes too quickly or far from nominal,
the system may become unrecoverable and blackouts will occur.
Whereas small synchronous areas would see large and rapid frequency excursions that could last for several tens of seconds after a normal generation loss, large synchronous areas would not see the same size of frequency excursions (unless a significant disturbance occurred such as a system split event).
The analysis of inertia by country also brings further insight on the level of complexity in a system split event. A system split is more prone to occur across congested transit corridors, thus interrupting these transits. As transfer of power is increasing in magnitude, distance and volatility, the power imbalance following a system split event is likely to increase. This will need to be compensated by Low Frequency Demand Disconnection (LFDD) or fast frequency response. Defence plans6 are designed to help during severe disturbances, but cannot stabilise all system split scenarios with extreme imbalances.
Different solutions and mitigation measures contribute to securing the power system performance in case of disturbances related to frequency. These services are more difficult to obtain from variable renewables, and significant effort is likely to be needed to develop the existing capacities, in particular by implementing the Network Codes, and bring new technologies into the system (such as fly-wheel inertia storage).
Unlike conventional generation with costly but controllable sources of primary energy, RES utilise primary energy sources that are free but have a variable nature. Hence, the high installed capacity
of RES and their close-to-zero marginal costs cause conventional generation, with primary energy sources independent of weather conditions, to be displaced from the market.
The variability in the power output from RES, which is driven by the variability of the primary energy resource, must be balanced, including forecast output deviations, in order to maintain the frequency equilibrium. In order to cope with this situation, new flexibility sources will be necessary both from the generation and demand side. This includes new roles for thermal plants, RES participation, demand side response, and storage. Also from the network side, strong interconnection between countries will be essential to exchange the power flows from flexibility sources.
ENTSO-E will further analyse to what extent the existing solutions will need to be extended to guarantee a secure electricity system. The analyses above represent a positive first step to enable the needed changes to provide adequate dynamic behaviour.
6 According to the SOGL: system defence plan means the technical and organisational measures to be undertaken to prevent the propagation or deterioration of a disturbance in the transmission system, in order to avoid a wide area state disturbance and blackout state.
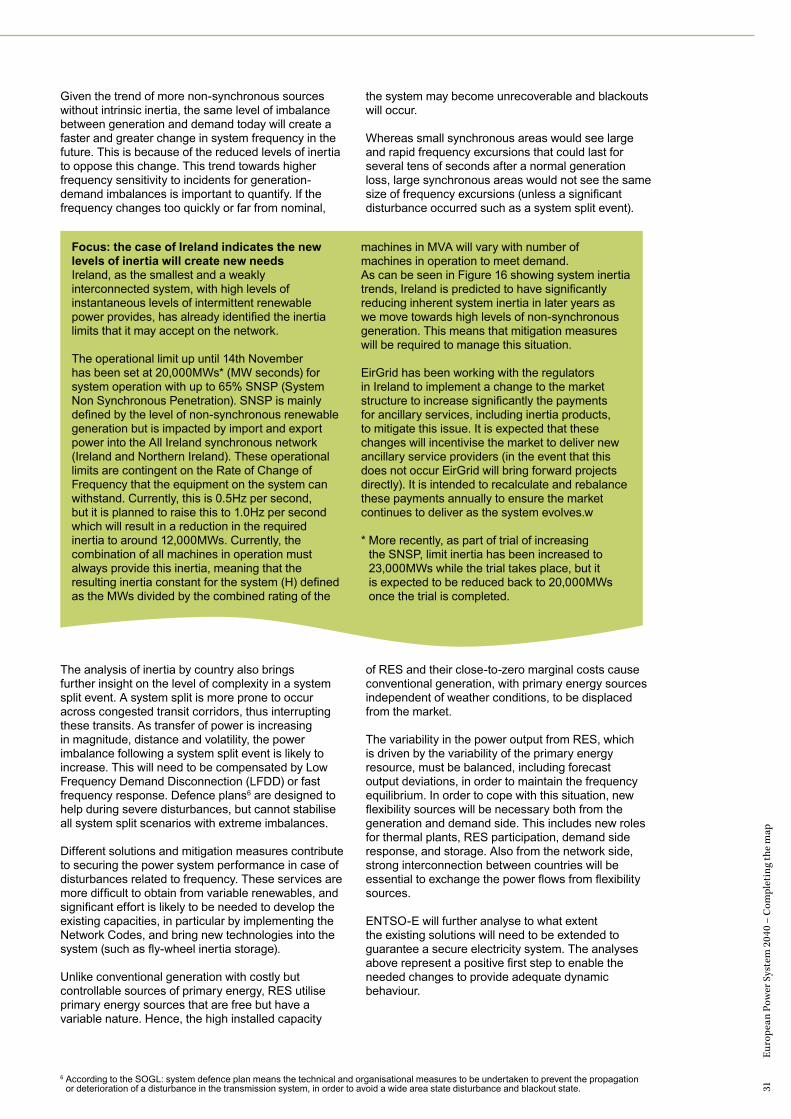
Focus: the case of Ireland indicates the new levels of inertia will create new needsIreland, as the smallest and a weakly interconnected system, with high levels of instantaneous levels of intermittent renewable power provides, has already identified the inertia limits that it may accept on the network.
The operational limit up until 14th November has been set at 20,000MWs* (MW seconds) for system operation with up to 65% SNSP (System Non Synchronous Penetration). SNSP is mainly defined by the level of non-synchronous renewable generation but is impacted by import and export power into the All Ireland synchronous network (Ireland and Northern Ireland). These operational limits are contingent on the Rate of Change of Frequency that the equipment on the system can withstand. Currently, this is 0.5Hz per second, but it is planned to raise this to 1.0Hz per second which will result in a reduction in the required inertia to around 12,000MWs. Currently, the combination of all machines in operation must always provide this inertia, meaning that the resulting inertia constant for the system (H) defined as the MWs divided by the combined rating of the
machines in MVA will vary with number of machines in operation to meet demand. As can be seen in Figure 16 showing system inertia trends, Ireland is predicted to have significantly reducing inherent system inertia in later years as we move towards high levels of non-synchronous generation. This means that mitigation measures will be required to manage this situation.
EirGrid has been working with the regulators in Ireland to implement a change to the market structure to increase significantly the payments for ancillary services, including inertia products, to mitigate this issue. It is expected that these changes will incentivise the market to deliver new ancillary service providers (in the event that this does not occur EirGrid will bring forward projects directly). It is intended to recalculate and rebalance these payments annually to ensure the market continues to deliver as the system evolves.w
* More recently, as part of trial of increasing the SNSP, limit inertia has been increased to 23,000MWs while the trial takes place, but it is expected to be reduced back to 20,000MWs once the trial is completed.

5.2
Transient and voltage stability related aspectsShort-circuit power has been commonly used as an indicator of the system strength and, consequently, the ability of a synchronous generating unit to remain connected to the network following a large disturbance and remain in synchronism with the system. A strongly meshed system with enough synchronous generation running at all times will have a high short-circuit level. Synchronous generation provides greater short-circuit current than equivalently rated converter connected RES. Therefore, as it is replaced by RES, the short-circuit level will reduce. Also the contribution of a generator to provide short-circuit reduces the further away it is, so as the power generated has to be transmitted over long distances to demand centres, the short-circuit power level will drop to very low levels.
This will result in faults causing deeper voltage dips, affecting the efficiency and security of the system.
Reactive power fluctuationsA constant and reliable source of reactive power is essential to maintain system voltage; a shortfall will reduce voltage and an excess will raise system voltage. Both high and low voltages can lead to equipment failure, and consequentially loss of demand and ultimately blackouts. Some reactive power devices on the system also monitor and try to respond to correct any excess or shortfall accordingly. Fluctuations can lead to errors in these corrective actions which can also impact on security of supply.
The fluctuations in reactive power demand and reactive losses are increasing. This is driven by a number of factors including:— the higher reactive power losses associated with
larger power transits;
— the reduced reactive demand due to the changing nature of the demand, and;
— the increased reactive gain from lightly loaded circuits during low demand periods or during times of high output of embedded generation.
The large fluctuations in reactive power demand and reactive losses, and the reduction in short-circuit power, generally result in an increase in both instantaneous change in voltage (voltage step) and the final settled voltage after automated corrective actions have occurred (post-fault voltage).
The technological capabilities of transmission connected synchronous generation to provide or absorb reactive power is generally significantly higher compared to embedded RES with convertor power electronic interfaces. Therefore, reactive power reserves available on the transmission system are diminishing as mainly convertor connected RES replaces synchronous connected generation and some of this generation will connect to the distribution system. Due to this fact, it is necessary to ensure that sufficient alternative measures are made available in order to ensure that voltage excursions can be managed within permissible limits.
The exact location and technology of projects to address the assessed needs for increased capacity in 2040 are not known at this time. These will be highly influential on the future changes in system strength and reactive power provision compared to those at present. Consequently, the corresponding projects, which will compensate for these changes and provide adequate dynamic behaviour, can also not be determined at this time. However, ENTSO-E is committed to and will conduct further studies to assess the mitigating needs and projects for the 2040 scenarios as capacity related projects are developed.

33
Euro
pean
Pow
er S
yste
m 2
040
– C
ompl
etin
g th
e m
ap
5.3
How to adapt? Possible solutions for future system operationsThe situation described above and with details in the Appendix of this document will lead to new needs, the exact nature and scale of which will need to be assessed in detail by system operators. This is expected to require significant research and development efforts as well as a redefinition of the roles and responsibilities of system participants, and possibly new cross-border and internal transmission lines. The possible solutions could include:
— Implementation of the Connection Codes: they will be essential to ensure that the necessary technical requirements from generators, HVDC and demand related to dynamic stability are implemented.
— Immediate inertial response can only be presently met by synchronous generators. After immediate inertial response, fast frequency response by other sources than synchronous generation are needed: converter-connected generation, demand side response, storage (including batteries), and reserves shared between synchronous areas using HVDC.
— In the future new capabilities, not yet available, such as grid-forming converters7, are currently promising to be capable of providing immediate inertial response. Grid-forming converters will need research and development to demonstrate they could be a solution and can in the future be incorporated in the grid8.
— Dynamic system needs could lead to a limitation of cross-border exchanges between large and small synchronous areas in some situations.
— New roles for existing generators, who would become service providers able to react to changing operating conditions in real time, temporarily or permanently, for instance from decommissioned nuclear power plants (Germany).
— Real-time monitoring of system inertia to ensure minimum level of inertia is in the system at all times.
— Procurement of inertia and reactive power as an ancillary service and activation when necessary (e.g. during high RES production), using possibly aggregated sources coordinated with DSOs.
— Constraining RES and placing synchronous generation with intrinsic inertia in the unit commitment. This measure, which is easy to implement as a short-term solution, could be less efficient in the long term.
— Investments on the network side: synchronous condensers, SVCs, STATCOM, HVDC, series compensation etc. to maintain stability and avoid curtailment of RES generation.
— Observability and controllability of distributed resources by the TSOs and DSOs as well as strong coordination between both operators.
7 Implementation Guiding Document – High Penetration of Power Electronic Interfaced Power Sources. https://www.entsoe.eu/Documents/Network%20codes%20documents/Implementation/CNC/170322_IGD25_HPoPEIPS.pdf
8 An example of related investigations is the MIGRATE project - Massive InteGRATion of power Electronic devices. https://www.h2020-migrate.eu/

Section 6
Description of the scenarios
Figure 17 overleaf gives an overview of the 2018 ENTSOs Scenarios, which served as a framework to identify the needs presented in this document.

35
Euro
pean
Pow
er S
yste
m 2
040
– C
ompl
etin
g th
e m
ap

The present study analysed the three 2040 scenarios:
Distributed Generation (DG)Presumers at the centre – small-scale decentralised generation, batteries and fuel switching. Society engaged and empowered by strong EU policies and efficient ETS. High economic growth. High electrification of heating and transport sectors. An efficient usage of renewable energy resources is enabled at the EU level as a whole.
2030 and 2050 EU emission targets are reached.
Global Climate ActionFull speed global decarbonisation, large-scale renewables development in both electricity and gas sectors. High penetration rate of disruptive technologies (smart cities, demand response, Power to gas etc.).
Global methods regarding CO2 reductions are in place, and the EU is on track for its 2030 and 2050 decarbonisation targets. An efficient usage of renewable energy sources will be secured by a strong EU policy.
Sustainable TransitionTargets reached through national regulation, emission trading schemes and subsidies. Steady RES growth, moderate economic growth, moderate development of electrification of heating and transport, Scenario in line with the EU 2030 target, but slightly behind the EU 2050 target.
The regulation, with more national focus on climate change, takes the shape of legislation that imposes binding emissions targets. The ST scenario is driven by national subsidies and will result in an inefficient usage of renewable resources.
A more detailed description of the scenarios is available in the “Scenario Building Report”: https://www.entsoe.eu/Documents/TYNDP%20documents/14475_ENTSO_ScenarioReport_Main.pdfKey figures.
Figure 17: Scenario building framework indicating Bottom Up and Top Down scenarios
2020 2025 2030
DistributedGeneration
BestEstimate
BestEstimate
The EUCOScenario
Global ClimateAction
SustainableTransition
SustainableTransition
DistributedGeneration
2035 2040 2045 2050
4%1%11% 6%
2%14% 9%
15%
0%5%21%
0%4%15% 25%
1%6%25%
17%3%9%
34%
10%0%3%
27%7%2%19%
External from European Commission
ENTSO-E/ENTSOGScenario
System share of wind
System shareof solar power
Biomethaneproduction share
Power-to-gasproduction share
37
Euro
pean
Pow
er S
yste
m 2
040
– C
ompl
etin
g th
e m
ap
Nuclear Coal + other fossil Natural gas Peak Hydro and pumped storage
Wind Solar Biomass and other RES
0
500
1000
1500
2000
2500
GW
2020 2025CBG
2025GBC
ST 2030 ST 2040 GCA2040
DG 2030 DG 2040 EUCO2030
Installed production capacities per scenario
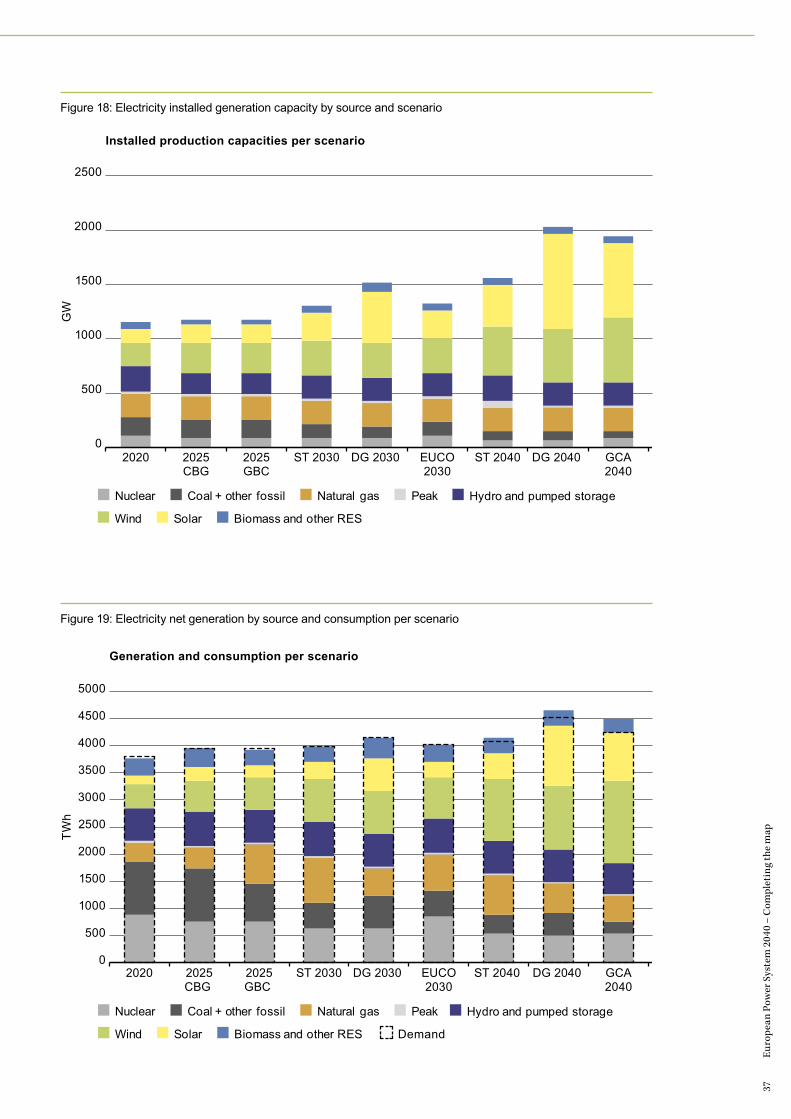
Figure 18: Electricity installed generation capacity by source and scenario
Nuclear Coal + other fossil Natural gas Peak Hydro and pumped storage
Wind Solar Biomass and other RES Demand
TWh
0
500
1000
1500
2000
2500
3000
3500
4000
4500
5000
2020 2025CBG
2025GBC
ST 2030 DG 2030 EUCO2030
ST 2040 DG 2040 GCA2040
Generation and consumption per scenario
Figure 19: Electricity net generation by source and consumption per scenario
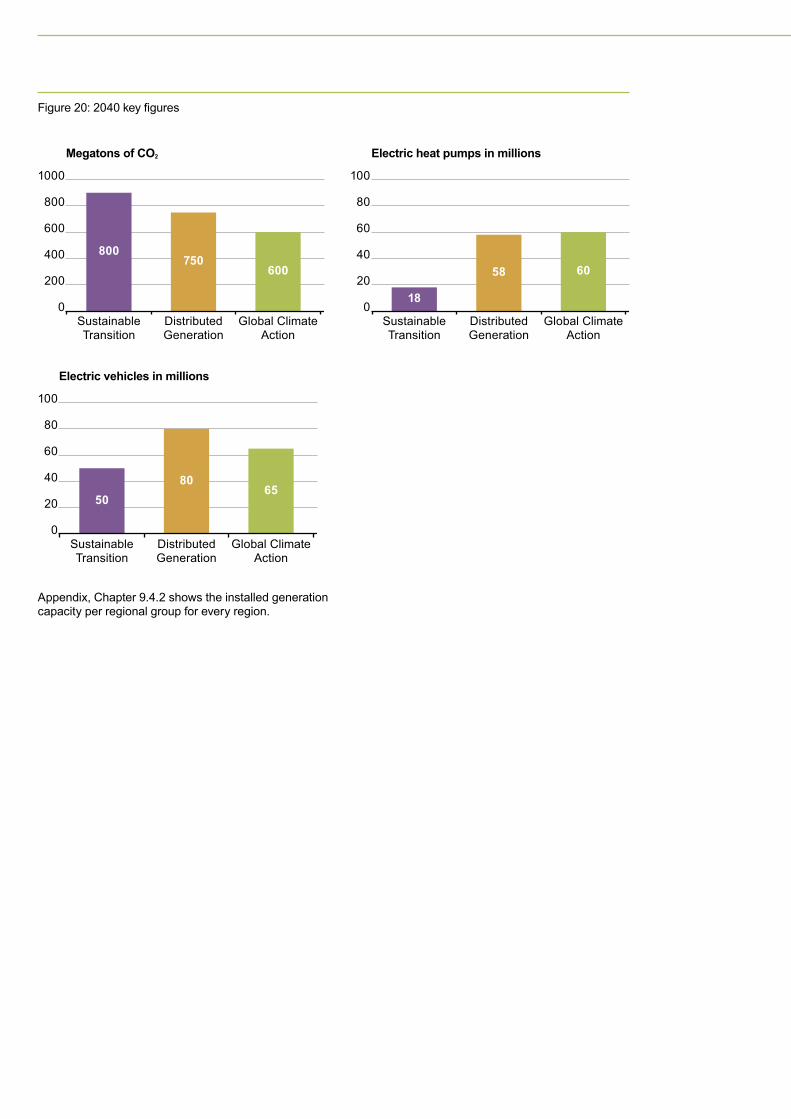
Appendix, Chapter 9.4.2 shows the installed generation capacity per regional group for every region.
SustainableTransition
DistributedGeneration
0
20
40
60
80
100
Global ClimateAction
18
58 60
Electric heat pumps in millions
SustainableTransition
DistributedGeneration
Global ClimateAction
0
20
40
60
80
100
5080
65
Electric vehicles in millions
SustainableTransition
DistributedGeneration
0
200
400
600
800
1000
Global ClimateAction
800750
600
Megatons of CO2
Figure 20: 2040 key figures

39
Euro
pean
Pow
er S
yste
m 2
040
– C
ompl
etin
g th
e m
ap

Section 7
Methodology
This chapter gives a description of the “Identification of System Needs” methodology, including the improvements to the process compared with the last edition of the TYNDP.

41
Euro
pean
Pow
er S
yste
m 2
040
– C
ompl
etin
g th
e m
ap
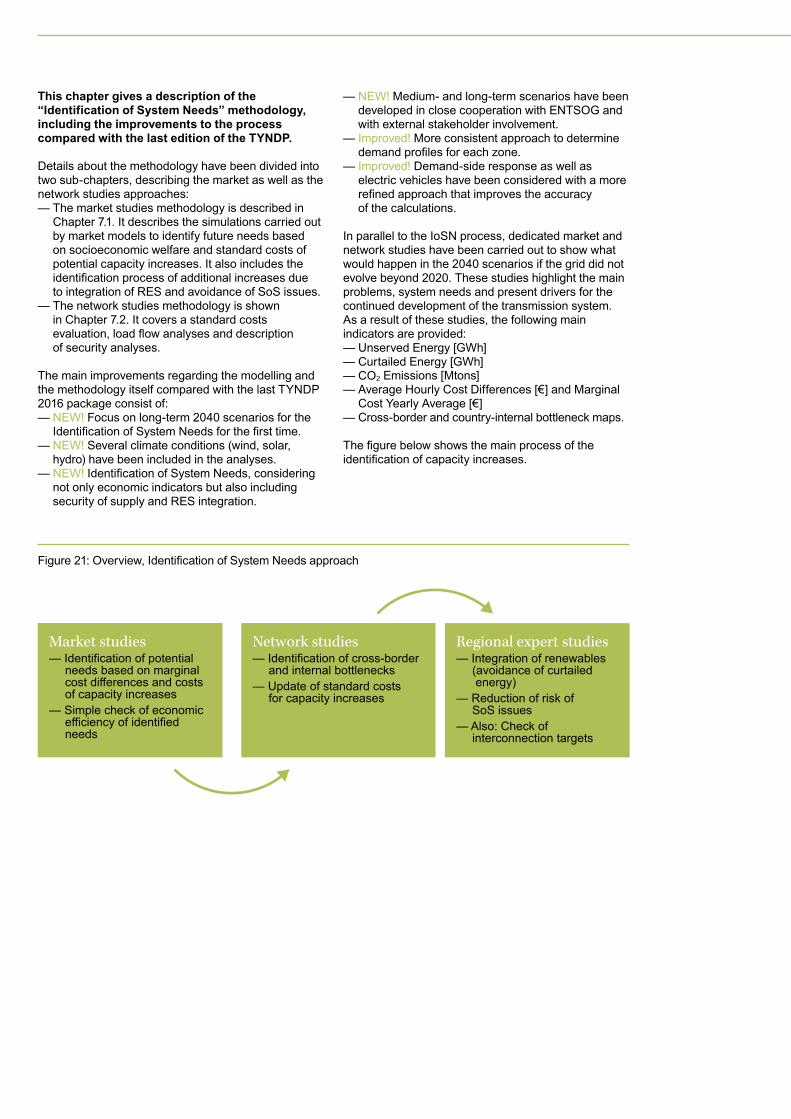
Market studies— Identification of potential
needs based on marginal cost differences and costs of capacity increases
— Simple check of economic efficiency of identified needs
Network studies— Identification of cross-border
and internal bottlenecks— Update of standard costs
for capacity increases
Regional expert studies— Integration of renewables
(avoidance of curtailed energy)
— Reduction of risk of SoS issues
— Also: Check of interconnection targets
This chapter gives a description of the “Identification of System Needs” methodology, including the improvements to the process compared with the last edition of the TYNDP.
Details about the methodology have been divided into two sub-chapters, describing the market as well as the network studies approaches:— The market studies methodology is described in
Chapter 7.1. It describes the simulations carried out by market models to identify future needs based on socioeconomic welfare and standard costs of potential capacity increases. It also includes the identification process of additional increases due to integration of RES and avoidance of SoS issues.
— The network studies methodology is shown in Chapter 7.2. It covers a standard costs evaluation, load flow analyses and description of security analyses.
The main improvements regarding the modelling and the methodology itself compared with the last TYNDP 2016 package consist of:— NEW! Focus on long-term 2040 scenarios for the
Identification of System Needs for the first time.— NEW! Several climate conditions (wind, solar,
hydro) have been included in the analyses.— NEW! Identification of System Needs, considering
not only economic indicators but also including security of supply and RES integration.
— NEW! Medium- and long-term scenarios have been developed in close cooperation with ENTSOG and with external stakeholder involvement.
— Improved! More consistent approach to determine demand profiles for each zone.
— Improved! Demand-side response as well as electric vehicles have been considered with a more refined approach that improves the accuracy of the calculations.
In parallel to the IoSN process, dedicated market and network studies have been carried out to show what would happen in the 2040 scenarios if the grid did not evolve beyond 2020. These studies highlight the main problems, system needs and present drivers for the continued development of the transmission system. As a result of these studies, the following main indicators are provided:— Unserved Energy [GWh]— Curtailed Energy [GWh]— CO2 Emissions [Mtons]— Average Hourly Cost Differences [€] and Marginal
Cost Yearly Average [€]— Cross-border and country-internal bottleneck maps.
The figure below shows the main process of the identification of capacity increases.
Figure 21: Overview, Identification of System Needs approach

43
Euro
pean
Pow
er S
yste
m 2
040
– C
ompl
etin
g th
e m
ap
7.1
IoSN methodology – market approachThe market simulations, performed in the IoSN framework, have been carried out for all the TYNDP 2018 long-term 2040 scenarios “Sustainable Transition”, “Global Climate Action” and “Distributed Generation”.
Three different climate years (1982, 1984 and 2007) have been considered for each scenario. In order to provide high quality and consistent results, three different market tools (PowrSym, BID and Antares) have been used. The appendix in Chapter 9.5 provides a description of the methodology used to determine which climate years to use.
The aim of these studies was to identify potential capacity increases in a coordinated pan-European manner also building on the expertise of all TSOs. Potential capacity increases could be triggered by drivers like market integration, integration of renewable energy sources and security of supply issues.
The studies started using a 2030 grid9 and considered an iterative approach individually carried out for every scenario. Market models were used to calculate hourly marginal cost differences between countries. For the borders with the highest factor of marginal cost difference divided by the standard cost of an increase, an increment of the NTC was studied. The socioeconomic welfare (SEW) from this increase was compared to the investment cost of a potential standard project on that border and, if the calculation gave a positive result, the increase on this border was included for the next round of simulations.
The more reinforcements were added on a given border, the lower the SEW from additional increases was and generally the more expensive additional projects became. Thus, the proper capacity was obtained when the expected additional SEW no longer exceeded future investment cost.
It must be noted that this approach included some simplification. For instance, only the SEW increase due to an increased market coupling was taken into
account as a main driver, whereas other elements could also be taken into account in a definition of a new specific additional capacity increase. Another simplification was the fact that the screening was carried out with a standard capacity increase of 500MW to harmonise as much as possible the approach among the areas. Finally, the standard costs of the increases were assessed by expert view, taking as far as possible the specificity of the area (e.g. presence of mountain or sea), internal grid considerations as well as knowledge from previous projects at these borders (if any) into account.
In addition to the market integration, security of supply and RES integration have been considered in the process of the Identification of System Needs. Market analyses provided results of simulations where the capacity increases identified in the SEW iterations have been implemented. Regional market and network experts considered the output of these simulations in their investigation of additional capacity increases based on SoS and RES needs. The main parameters considered by the regional experts were:— For security of supply needs10, the remaining
capacity, defined as
RC(%) = Avail. capacity(h) - Demand(h) ± IC contribution(h)
Demand(h)
— For RES integration needs, the curtailed energy (GWh) (provided directly by the tools used in the process) was considered.
Finally, with the scenario capacities derived from the steps above, market analyses investigated if the 15% interconnection ratio criteria (15% of RES installed capacity) were met in all market nodes. If it was not then regional experts could provide additional capacity increases.
It is worth pointing out that the additional capacity increases identified in this step refer to potential needs to be further investigated, and they will not necessarily result in new projects in TYNDP 2018.
9 TYNDP 2016 V1 grid, used to speed up the computation (TYNDP 2018 values were still under definition mid of 2017)10 Since TYNDP 2018 scenarios are adequate by definition, it is not possible to see any Energy Not Supplied. This definition will be discussed
during the TYNDP 2020 scenario building consultation phase.
7.2
IoSN methodology – network approachBased on the results of the market simulations, network studies were performed on detailed grid models which included all buses, lines and transformers of the transmission systems explored. The scope of these network simulations was to analyse if the capacity increases suggested by market studies increased network bottlenecks.
Network analyses have been carried out on an hourly year round calculation basis but, where the translation from market to network studies was done using a combination of: — PTDF (Power Transfer Distribution Factor) Matrix
approach: market data of each hour was transposed into the simplified grid represented by the PTDF Matrix. Then PTDF flows were calculated for each of the 8,760 hours and on each synchronous border and each of the internal transmission lines elected by each TSO.
— Computing all 8,760 hours in a year in DC or AC load flows directly in load flow tools with a detailed representation of the grid model.
Bottleneck analysis was performed taking into account security of the network, that means fulfilment of the planning standards of each system, with all grid elements available (N criterion) and considering as well the outage of every relevant grid element (N-1 criterion).
Results of the network analyses were maps showing:— Cross-border challenges between countries when
going to 2040 scenarios but not evolving the grid beyond 2020. These maps show if borders are safe (green), if bottlenecks are identified in N-1 situations (yellow) or if bottlenecks are already present in N situation (red).
— Internal challenges inside countries when the production/consumption of the 2040 scenarios is applied to the internal grids of 2020. Countries were coloured green if only some reinforcements are needed, yellow if an important amount of reinforcements are needed or red if a huge amount or heavy of reinforcements are needed (red).
— Additional internal challenges inside countries due to capacity increases as a result of the market step of the IoSN approach.

45
Euro
pean
Pow
er S
yste
m 2
040
– C
ompl
etin
g th
e m
ap

Section 8
Next steps
This report describes, for the first time, studies focusing on the 2040 time horizon. Many new system needs were identified for this long-term time horizon and it could be concluded that additional capacity increases are necessary to evolve the European energy system in order to be on track to fulfil the climate goals for 2050.
ENTSO-E is now working on solutions for the identified needs. In summer 2018, the first draft of the TYNDP 2018 document package will be published for consultation. This package will, beside a number of specific Insight Reports, include cost-benefit analyses of all approved projects submitted to ENTSO-E for assessment. It will allow all stakeholders to understand how a project contributes to overcome the Energy Trilemma i.e. a sustainable, affordable and secure European energy system. After the public consultation phase at the end of 2018, the final TYNDP 2018 package will be published.

47
Euro
pean
Pow
er S
yste
m 2
040
– C
ompl
etin
g th
e m
ap
Figure 22 below gives an overview of the publications of the TYNDP 2018. This pan-European System Needs report is published together with the six Regional Investment Plans and Summary leaflets of these documents.
DraftScenario
Report
MonitoringUpdate Report
MAFReport
Pan-EuropeanSystem Needs
Report
RegionalInvestment
Plans
ProjectList
TYNDPPublications
Package
FinalScenarioReport
Section 9
Appendices
9.1 ABBREVIATIONS
9.2 TERMINOLOGY

49
Euro
pean
Pow
er S
yste
m 2
040
– C
ompl
etin
g th
e m
ap
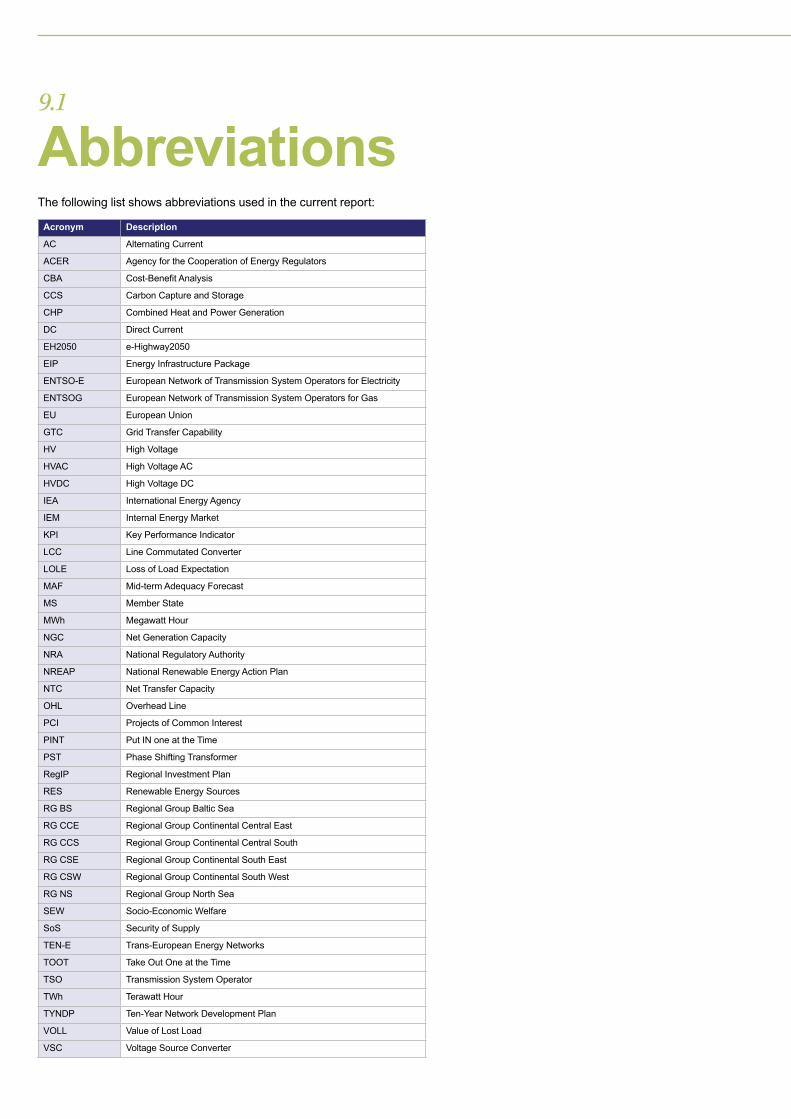
9.1
AbbreviationsThe following list shows abbreviations used in the current report:
Acronym Description
AC Alternating Current
ACER Agency for the Cooperation of Energy Regulators
CBA Cost-Benefit Analysis
CCS Carbon Capture and Storage
CHP Combined Heat and Power Generation
DC Direct Current
EH2050 e-Highway2050
EIP Energy Infrastructure Package
ENTSO-E European Network of Transmission System Operators for Electricity
ENTSOG European Network of Transmission System Operators for Gas
EU European Union
GTC Grid Transfer Capability
HV High Voltage
HVAC High Voltage AC
HVDC High Voltage DC
IEA International Energy Agency
IEM Internal Energy Market
KPI Key Performance Indicator
LCC Line Commutated Converter
LOLE Loss of Load Expectation
MAF Mid-term Adequacy Forecast
MS Member State
MWh Megawatt Hour
NGC Net Generation Capacity
NRA National Regulatory Authority
NREAP National Renewable Energy Action Plan
NTC Net Transfer Capacity
OHL Overhead Line
PCI Projects of Common Interest
PINT Put IN one at the Time
PST Phase Shifting Transformer
RegIP Regional Investment Plan
RES Renewable Energy Sources
RG BS Regional Group Baltic Sea
RG CCE Regional Group Continental Central East
RG CCS Regional Group Continental Central South
RG CSE Regional Group Continental South East
RG CSW Regional Group Continental South West
RG NS Regional Group North Sea
SEW Socio-Economic Welfare
SoS Security of Supply
TEN-E Trans-European Energy Networks
TOOT Take Out One at the Time
TSO Transmission System Operator
TWh Terawatt Hour
TYNDP Ten-Year Network Development Plan
VOLL Value of Lost Load
VSC Voltage Source Converter

51
Euro
pean
Pow
er S
yste
m 2
040
– C
ompl
etin
g th
e m
ap
9.2
TerminologyThe following list describes a number of terms used in this System Needs Analysis report.
Term Description
Cluster Several investment items, matching the CBA clustering rules. Essentially, a project clusters all investment items that have to be realised in total to achieve a desired effect.
Congestion Revenue/ Congestion Rent
The revenue derived by interconnector owners from sale of the interconnector capacity through auctions. In general, the value of the congestion rent is equal to the price differential between the two connected markets, multiplied by the capacity of the interconnector.
Congestion Means a situation in which an interconnection linking national transmission networks cannot accommodate all physical flows resulting from international trade requested by market participants, because of a lack of capacity of the interconnectors and/or the national transmission systems concerned.
Corridors The CBA clustering rules proved challenging for complex grid reinforcement strategies: the largest investment needs may require some 30 investment items, scheduled over more than five years but addressing the same concern. In this case, for the sake of transparency, they are formally presented in a series – a corridor – of smaller projects, each matching the clustering rules.
Cost-Benefit Analysis (CBA)
Analysis carried out to define to what extent a project is worthwhile from a social perspective.
Grid Transfer Capacity (GTC)
Represents the aggregated capacity of the physical infrastructure connecting nodes in reality; it is not only set by the transmission capacities of cross-border lines but also by the ratings of so-called “critical” domestic components. The GTC value is thus generally not equal to the sum of the capacities of the physical lines that are represented by this branch; it is represented by a typical value across the year.
Investment Individual equipment or facility, such as a transmission line, a cable or a substation.
Net Transfer Capacity (NTC)
The maximum total exchange program between two adjacent control areas compatible with security standards applicable in all control areas of the synchronous area, and taking into account the technical uncertainties on future network conditions.
N-1 Criterion The rule according to which elements remaining in operation within TSO’s Responsibility Area after a Contingency from the Contingency List must be capable of accommodating the new operational situation without violating Operational Security Limits.
Project Either a single investment or a set of investments, clustered together to form a project, in order to achieve a common goal.
Project Candidate Investment(s) considered for inclusion in the TYNDP.
Project of Common Interest
A project which meets the general and at least one of the specific criteria defined in Art. 4 of the TEN-E Regulation and which has been granted the label of PCI Project according to the provisions of the TEN-E Regulation.
Put IN one at the Time (PINT)
Methodology that considers each new network investment/project (line, substation, PST or other transmission network device) on the given network structure one-by-one and evaluates the load flows over the lines with and without the examined network reinforcement.
Reference Network
The existing network plus all mature TYNDP developments, allowing the application of the TOOT approach.
Reference Capacity
Cross-border capacity of the reference grid, used for applying the TOOT/PINT methodology in the assessment according to the CBA.
Scenario A set of assumptions for modelling purposes related to a specific future situation in which certain conditions regarding gas demand and gas supply, gas infrastructures, fuel prices and global context occur.
Take Out One at the Time (TOOT)
Methodology that consists of excluding investment items (line, substation, PST or other transmission network device) or complete projects from the forecasted network structure on a one-by-one basis and to evaluate the load flows over the lines with and without the examined network reinforcement.
Ten-Year Network Development Plan
The Union-wide report carried out by ENTSO-E every other year as (TYNDP) part of its regulatory obligation as defined under Article 8, para 10 of Regulation (EC) 714 / 2009.
Total Transfer Capacity (TTC)
See Transmission Capacity below.
Transmission Capacity (also called Total Transfer Capacity)
The maximum transmission of active power in accordance with the system security criteria which is permitted in transmission cross-sections between the sub-systems/areas or individual installations.
Vision Plausible future states selected as wide-ranging possible alternatives.

9.3
Useful information
For queries about this report, the TYNDP 2018 or the ongoing consultation, please contact the ENTSO-E team which coordinated the release of this report:Jean-Baptiste Paquel, Dante Powell and Andriy [email protected]
For press queries, please contact:Claire [email protected]
ENTSO-E – European Network of Transmission System Operators for ElectricityAvenue de Cortenbergh 1001000 Brussels BelgiumPhone: +32 2 741 09 50Fax: +32 2 741 09 51
General queries: [email protected]

53
Euro
pean
Pow
er S
yste
m 2
040
– C
ompl
etin
g th
e m
ap
ENTSO-E AISBL Avenue de Cortenbergh 100, 1000 Brussels, Belgium
Tel (+32) 2 741 09 50
[email protected] www.entsoe.eu
©ENTSO-E 2018