european powers of construction 2008 analysis of key ...5 grupo ferrovial sa spain dec 07 14,630 734...
TRANSCRIPT

European Powers ofConstruction 2008Analysis of key players and markets
27697 rt EPoC:27697 EPoC rt 12/12/08 15:37 Page 1

27697 rt EPoC:27697 EPoC rt 12/12/08 15:37 Page 2
European Powers of Construction 2008 Analysis of key players and markets 1
Introduction 2
Leaders of the pack: Europe’s top 100 construction companies 4
Meet the senior executives 13
Expert view from Deloitte 17
• The credit crunch and construction 17
• Infrastructure investment opportunities in the emerging Chinese 19and Indian markets
• Key risks disclosed in financial statements 23
• Construction and the environment 26
• Reducing failure costs through supply chain management 29
Country profiles 34
References 83
European construction and infrastructure group contacts 84
Contents
27697 rt EPoC:27697 EPoC rt 12/12/08 15:37 Page 1

2
Introduction
Deloitte is pleased to present European Powers ofConstruction (EPoC) 2008, our annual publicationidentifying the 100 largest European constructioncompanies by construction revenue and providingindustry insights into the current marketplace.
The data for this publication has been collated usingpublic sources such as company annual reports andwebsites, Amadeus, Datamonitor, Euroconstruct,Factiva, Mergerstat and Onesource. Alongside ouranalysis of this data, we provide commentary fromDeloitte industry specialists throughout Europe.
Leaders of the packVINCI of France continues to lead the pack, topping the 100 largest European construction companies withconstruction revenues of €26bn. The UK continues todominate the top 100 with the majority of companieslisted, and also has its first entrant in the top ten forsometime with Balfour Beatty.
During 2007, 75 companies reported constructionrevenue growth, with VINCI reporting the largestrelative increase at €4bn. On average, the increase inconstruction revenue per company was €288m and netincome was 4.6%. While companies with constructionrevenues of less than €5bn continued to enjoy highernet margins than the major international companies,average net margins for all categories of companieswere lower than in 2006.
Meet the senior executivesAn important regular feature of EPoC is our interviewswith senior industry executives across Europe. This yearwe spoke to Baldomero Falcones, Chairman and ChiefExecutive Officer (CEO) of FCC in Spain, and TheoBruijninckx, Chairman, and Ruud Jacobs, Member of theBoard, both from Ballast Nedam in The Netherlands.We would like to thank them for their contributionsand think you will agree that they provide an interestinginsight into their organisations.
Expert view from DeloitteEPoC 2008 includes a range of articles on currentindustry themes and trends:
The credit crunch and constructionNo matter which newspaper you pick up at themoment, you will find daily references to the financialturmoil in the credit markets and the trend towards a worldwide economic downturn. Given this, it wouldbe inappropriate for this publication not to considerhow the construction and infrastructure sector is being– or could be – affected. We do not comment on thehouse building sector because a great deal has alreadyhappened in this market, with falling share prices,refinancings, a level of redundancies and endlessspeculation as to where house prices are going to endup. This market differs from the traditional constructionsector because it is very much asset-backed; housebuilding companies purchase land banks, make use ofdebt markets and construct houses – alwaysconsidering demand and prices. In contrast, manyconstruction companies leave land purchases and homesales to real estate developers or actual propertyowners. In this respect, construction companies areservice companies and their assets are their brandnames, people and customers – all elements that theydo not require debt to purchase.
Infrastructure investment opportunities in theemerging Chinese and Indian marketsThe Chinese and Indian markets have experiencedsignificant growth over the past few years, exhibitingthe highest growth rates in the world economy. One of the factors required to sustain this growth is re-investment in their vast and ageing infrastructurenetworks. While considerable expenditure has alreadytaken place in these two countries, it is not surprising to note that a significant proportion of the projectedworldwide infrastructure spend over the next decadewill be concentrated there. Therefore, even though themajority of European companies have tended to focustheir efforts on the European and US infrastructuremarkets, the levels of planned spend in China and Indiapresent huge opportunities.
27697 rt EPoC:27697 EPoC rt 12/12/08 15:37 Page 2

European Powers of Construction 2008 Analysis of key players and markets 3
Key risks disclosed in financial statements For many years, regulators and other standard-settershave called for more extensive and improved disclosureswithin company financial statements. This wouldincrease understanding of a company’s performanceand position and assist users in making more informedinvestment and credit decisions. As a result ofamendments to accounting standards and additionalrequirements for enhanced disclosures within operatingand financial reviews (OFRs), companies are nowrequired to provide increased narrative on the principalrisks and uncertainties impacting their organisations.This article examines the main risks and uncertaintiesdetailed within the financial statements of the top 20 European construction companies and looks at howdisclosures vary across different organisations.
Construction and the environmentSuccessful corporate management of environmentalissues will not only lead to companies improving theirreputations in the marketplace, but also to long-termincreases in shareholder value. As environmentallegislation, public awareness and customer expectationsgather momentum, we look at the importance of theenvironment to the construction industry and the maindrivers associated with it.
Reduction of contract failure costs through supplychain managementMargins in the construction sector (excluding housebuilding) are typically low and range from 2-5%.Therefore, the identification and reduction of problems– and their associated costs – could lead toconsiderable improvements in overall contractperformance in the sector. The concept of supply chainmanagement (SCM) has been effectively applied inother industries and sectors, resulting in increasedefficiency and effectiveness, cost reductions, andimproved profitability. In this article we look at whetherthe application of SCM in the construction industrycould lead to a reduction in contract failures and,ultimately, higher margins.
Country profilesIn this section of EPoC 2008, we present key data onmarket statistics, trends, top construction companies,the public finance initiative/public private partnerships(PFI/PPP) market, and merger and acquisition (M&A)activity on a country-by-country basis. We hope thatyou find the profiles interesting and they provide a readily accessible source of information.
Finally...We hope that you find our sixth annual EPoCpublication on trends, perspectives and analysis of the past year in the construction sector of interest. We welcome your thoughts, comments andsuggestions on any of the matters covered in thispublication.
Jack KellyPartnerDeloitte – UK
27697 rt EPoC:27697 EPoC rt 12/12/08 15:37 Page 3

Leaders of the pack: Europe’s top 100
4
2007 ranking Company name Country FY end Sales (€m)
Constructionrevenue (€m)
Net income (€m) FY end Sales (€m)
Constructionrevenue (€m)
1 VINCI SA France Dec 07 30,428 25,848 1,461 Dec 06 25,634 21,745
2 Bouygues SA France Dec 07 29,613 21,802 1,376 Dec 06 26,408 18,970
3 HOCHTIEF AG Germany Dec 07 18,773 18,773 141 Dec 06 16,719 16,719
4 Skanska AB Sweden Dec 07 14,922 14,922 443 Dec 06 14,048 14,048
5 Grupo Ferrovial SA Spain Dec 07 14,630 14,630 734 Dec 06 12,355 12,352
6 Eiffage SA France Dec 07 12,596 12,596 1,000 Dec 06 10,745 10,745
7 Balfour Beatty Plc UK Dec 07 11,007 11,007 222 Dec 06 8,073 8,073
8 STRABAG SE Austria Dec 07 10,746 10,746 170 Dec 06 10,385 10,385
9 Koninklijke BAM Groep NV The Netherlands Dec 07 9,322 9,322 349 Dec 06 8,988 8,988
10 Bilfinger Berger Germany Dec 07 9,222 9,222 134 Dec 06 7,936 7,936
11 Activ. de Construc. y Servicios SA (ACS) Spain Dec 07 21,312 7,389 1,551 Dec 06 13,869 6,776
12 FCC Spain Dec 07 13,881 6,957 738 Dec 06 9,481 4,395
13 Taylor Wimpey Plc UK Dec 07 7,050 6,818 -291 Dec 06 5,394 4,947
14 NCC AB Sweden Dec 07 6,313 6,313 243 Dec 06 6,034 6,034
15 Carillion Plc UK Dec 07 5,809 5,809 112 Dec 06 5,150 5,150
16 Laing O’Rourke UK Mar 08 5,297 5,297 96 Mar 07 4,454 4,454
17 Sacyr Vallehermoso SA Spain Dec 07 5,760 4,863 946 Dec 06 4,685 3,921
18 Koninklijke Volker Wessels Stevin NV The Netherlands Dec 07 4,828 4,828 146 Dec 06 4,488 4,488
19 Barratt Developments Plc UK Jun 07 4,478 4,478 442 Jun 06 3,553 3,553
20 Persimmon Plc UK Dec 07 4,439 4,439 608 Dec 06 4,616 4,616
21 Enka Insaat ve Sanayi AS Turkey Dec 07 3,847 3,847 418 Dec 06 3,189 3,189
22 Heijmans NV The Netherlands Dec 07 3,746 3,746 56 Dec 06 2,953 2,953
23 YIT Oyj Finland Dec 07 3,707 3,707 225 Dec 06 3,284 3,284
24 Obrascon Huarte Lain SA Spain Dec 07 3,764 3,648 140 Dec 06 3,278 3,194
25 Acciona SA Spain Dec 07 7,953 3,639 975 Dec 06 6,272 4,004
26 Peab AB Sweden Dec 07 3,616 3,616 88 Dec 06 2,850 2,850
27 Kier Group Plc UK Jun 07 3,128 3,128 82 Jun 06 2,695 2,695
28 Morgan Sindall Plc UK Dec 07 3,109 3,108 58 Dec 06 2,195 2,195
29 Porr Group Austria Dec 07 2,744 2,744 22 Dec 06 2,323 2,323
30 Newarthill Ltd UK Oct 07 2,681 2,681 48 Oct 06 1,835 1,835
31 Impregilo SpA Italy Dec 07 2,627 2,627 41 Dec 06 2,631 2,631
32 Veidekke ASA Norway Dec 07 2,505 2,256 123 Dec 06 2,166 1,983
33 Fayat France Sep 07 2,180 2,180 101 Sep 06 1,921 1,921
34 Lemminkainen Oyj Finland Dec 07 2,174 2,174 73 Dec 06 1,796 1,796
35 Technical Olympic SA Greece N/A N/A N/A N/A Dec 06 2,225 2,171
36 Ed. Züblin AG Germany Dec 07 2,128 2,128 17 Dec 06 1,626 1,626
37 Galliford Try Plc UK Jun 07 2,100 2,072 64 Jun 06 1,252 1,252
38 Bellway Plc UK Jul 07 1,990 1,990 245 Jul 06 1,812 1,812
39 The Miller Group Ltd UK Dec 07 1,925 1,925 85 Dec 06 1,805 1,805
Latest year financials Previous year financials
27697 rt EPoC:27697 EPoC rt 12/12/08 15:37 Page 4

00 construction companies
European Powers of Construction 2008 Analysis of key players and markets 5
nm)
Net income (€m) Present in
5 1,270 France, UK, Germany, Central & Eastern Europe, North America, Africa, Asia
0 1,254 France, UK, Spain, Germany, Central & Eastern Europe, US, Middle East, Africa, Asia
9 89 Germany, Australia, Chile, UK, Austria, Poland, Russia, Asia, Czech Republic, Hungary, US, Russia, Brazil
8 393 Argentina, Bolivia, Brazil, Chile, Czech Republic, Denmark, Estonia, Finland, Hungary, Mexico, Norway, Peru, Poland, Slovakia, Sweden, UK, US, Venezuela
2 1,426 Spain, Ireland, UK, Poland, Switzerland, Italy, Portugal, Greece, Cyprus, Tunisia, Israel, Nigeria, Sudan, Saudi Arabia, Dubai, Kenya, Tanzania, South Africa, Pakistan,Singapore, Philippines, Australia, Korea, Japan, Alaska, US, Canada, Mexico, Dominican Republic, Venezuela, Peru, Brazil, Argentina, Chile
5 377 France, The Netherlands, Belgium, UK, France, Spain, Portugal, Morocco, Senegal, Luxembourg, Germany, Czech Republic, Poland, Austria, Hungary, Italy
3 133 UK, US, Sweden, Germany, Italy, Hong Kong, Middle East
5 191 Austria, Germany, Middle East, Poland, Czech Republic, Hungary, Slovakia, Africa, US, Russia, Romania, Switzerland, Serbia, Croatia, Benelux, Bulgaria, Asia, Slovenia,Scandinavia, Italy, Ireland
8 137 The Netherlands, UK, Belgium, Germany, Ireland, US
6 92 Germany, France, Poland, Austria, Switzerland, UK, Canada, Nigeria, Hungary, Norway, US, Nigeria, Australia, China
6 1,250 Spain, Chile, Greece, Portugal, UK, South Africa, Chile, Colombia, Jamaica, Mexico
5 536 Spain, Europe, US, Latin America
7 424 UK, US, Spain, Gibraltar
4 184 Sweden, Denmark, Finland, Norway, Germany
0 85 UK, Canada, UAE, Oman, Trinidad & Tobago
4 55 UK, India, Cyprus, Ireland, Germany, UAE, Australia
1 542 Spain, Italy, Portugal, Ireland, Costa Rica, Chile
8 110 The Netherlands, UK, US, Canada, Belgium, Germany, Estonia, Lithuania, Poland, Sweden
3 402 UK
6 581 UK
9 325 Turkey, Europe, Africa, Middle East
3 83 The Netherlands, Belgium, UK, Germany
4 171 Finland, Sweden, Norway, Denmark, Estonia, Latvia, Lithuania, Russia
4 105 Spain, Czech Republic, Brazil, Chile, US, Mexico, Argentina, Algeria, Slovakia
4 1,370 Spain, Portugal, Poland, Mexico, Canada, Poland, Mexico, Chile
0 1,047 Sweden, Norway, Finland
5 63 UK, Romania, Jamaica, UAE, Antigua
5 48 UK
3 21 Austria, Germany, Croatia, Poland, Switzerland, Slovakia, Slovenia, Czech Republic, Hungary
5 59 UK
1 141 Italy, Denmark, Germany, Greece, Iceland, Portugal, Sweden, Switzerland, UK, Argentina, Brazil, Chile, Dominican Republic, Peru, Venezuela, US, Saudi Arabia, Qatar, UAE, China, Pakistan
3 88 Norway, Denmark, Sweden
1 93 France
6 66 Finland, Russia, Norway, Lithuania, Estonia, Latvia, Estonia, Denmark
1 -218 Greece, US, Romania, Cyprus
6 7 Germany, Portugal, France, Denmark, Sweden, Poland, Austria, Hungary, Romania, Bulgaria, Croatia, Switzerland, Russia, China, Qatar, UAE, China, Malaysia, Singapore
2 37 UK
2 228 UK
5 95 UK
als
27697 rt EPoC:27697 EPoC rt 12/12/08 15:37 Page 5
2007 ranking Company name Country FY end Sales (€m)
Constructionrevenue (€m)
Net income (€m) FY end Sales (€m)
Constructionrevenue (€m)
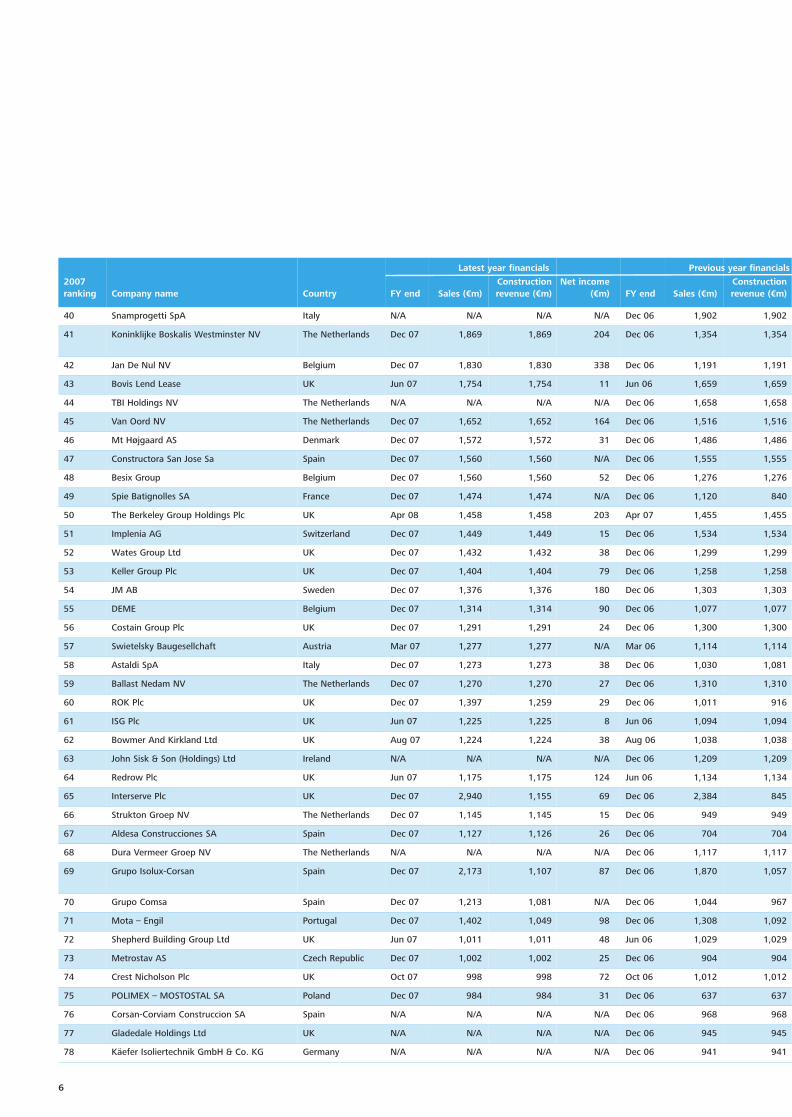
40 Snamprogetti SpA Italy N/A N/A N/A N/A Dec 06 1,902 1,902
41 Koninklijke Boskalis Westminster NV The Netherlands Dec 07 1,869 1,869 204 Dec 06 1,354 1,354
42 Jan De Nul NV Belgium Dec 07 1,830 1,830 338 Dec 06 1,191 1,191
43 Bovis Lend Lease UK Jun 07 1,754 1,754 11 Jun 06 1,659 1,659
44 TBI Holdings NV The Netherlands N/A N/A N/A N/A Dec 06 1,658 1,658
45 Van Oord NV The Netherlands Dec 07 1,652 1,652 164 Dec 06 1,516 1,516
46 Mt Højgaard AS Denmark Dec 07 1,572 1,572 31 Dec 06 1,486 1,486
47 Constructora San Jose Sa Spain Dec 07 1,560 1,560 N/A Dec 06 1,555 1,555
48 Besix Group Belgium Dec 07 1,560 1,560 52 Dec 06 1,276 1,276
49 Spie Batignolles SA France Dec 07 1,474 1,474 N/A Dec 06 1,120 840
50 The Berkeley Group Holdings Plc UK Apr 08 1,458 1,458 203 Apr 07 1,455 1,455
51 Implenia AG Switzerland Dec 07 1,449 1,449 15 Dec 06 1,534 1,534
52 Wates Group Ltd UK Dec 07 1,432 1,432 38 Dec 06 1,299 1,299
53 Keller Group Plc UK Dec 07 1,404 1,404 79 Dec 06 1,258 1,258
54 JM AB Sweden Dec 07 1,376 1,376 180 Dec 06 1,303 1,303
55 DEME Belgium Dec 07 1,314 1,314 90 Dec 06 1,077 1,077
56 Costain Group Plc UK Dec 07 1,291 1,291 24 Dec 06 1,300 1,300
57 Swietelsky Baugesellchaft Austria Mar 07 1,277 1,277 N/A Mar 06 1,114 1,114
58 Astaldi SpA Italy Dec 07 1,273 1,273 38 Dec 06 1,030 1,081
59 Ballast Nedam NV The Netherlands Dec 07 1,270 1,270 27 Dec 06 1,310 1,310
60 ROK Plc UK Dec 07 1,397 1,259 29 Dec 06 1,011 916
61 ISG Plc UK Jun 07 1,225 1,225 8 Jun 06 1,094 1,094
62 Bowmer And Kirkland Ltd UK Aug 07 1,224 1,224 38 Aug 06 1,038 1,038
63 John Sisk & Son (Holdings) Ltd Ireland N/A N/A N/A N/A Dec 06 1,209 1,209
64 Redrow Plc UK Jun 07 1,175 1,175 124 Jun 06 1,134 1,134
65 Interserve Plc UK Dec 07 2,940 1,155 69 Dec 06 2,384 845
66 Strukton Groep NV The Netherlands Dec 07 1,145 1,145 15 Dec 06 949 949
67 Aldesa Construcciones SA Spain Dec 07 1,127 1,126 26 Dec 06 704 704
68 Dura Vermeer Groep NV The Netherlands N/A N/A N/A N/A Dec 06 1,117 1,117
69 Grupo Isolux-Corsan Spain Dec 07 2,173 1,107 87 Dec 06 1,870 1,057
70 Grupo Comsa Spain Dec 07 1,213 1,081 N/A Dec 06 1,044 967
71 Mota – Engil Portugal Dec 07 1,402 1,049 98 Dec 06 1,308 1,092
72 Shepherd Building Group Ltd UK Jun 07 1,011 1,011 48 Jun 06 1,029 1,029
73 Metrostav AS Czech Republic Dec 07 1,002 1,002 25 Dec 06 904 904
74 Crest Nicholson Plc UK Oct 07 998 998 72 Oct 06 1,012 1,012
75 POLIMEX – MOSTOSTAL SA Poland Dec 07 984 984 31 Dec 06 637 637
76 Corsan-Corviam Construccion SA Spain N/A N/A N/A N/A Dec 06 968 968
77 Gladedale Holdings Ltd UK N/A N/A N/A N/A Dec 06 945 945
78 Käefer Isoliertechnik GmbH & Co. KG Germany N/A N/A N/A N/A Dec 06 941 941
Latest year financials Previous year financials
6
27697 rt EPoC:27697 EPoC rt 12/12/08 15:37 Page 6
nm)
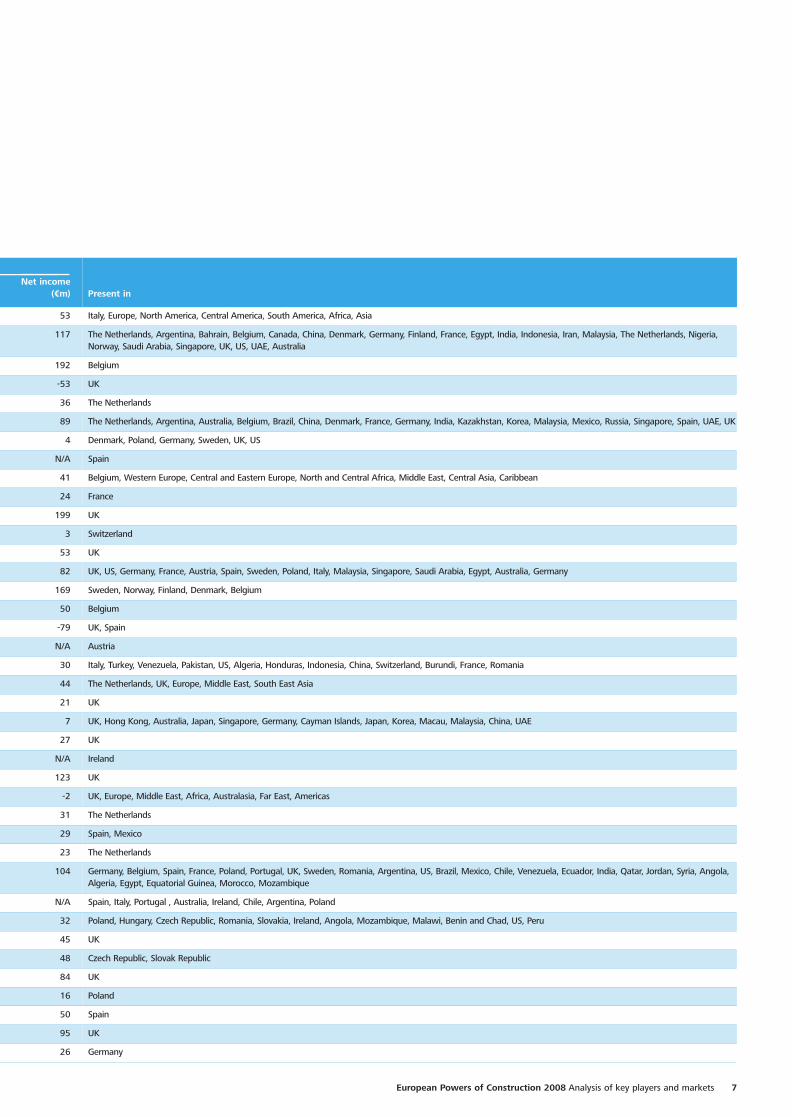
Net income (€m) Present in
2 53 Italy, Europe, North America, Central America, South America, Africa, Asia
4 117 The Netherlands, Argentina, Bahrain, Belgium, Canada, China, Denmark, Germany, Finland, France, Egypt, India, Indonesia, Iran, Malaysia, The Netherlands, Nigeria,Norway, Saudi Arabia, Singapore, UK, US, UAE, Australia
1 192 Belgium
9 -53 UK
8 36 The Netherlands
6 89 The Netherlands, Argentina, Australia, Belgium, Brazil, China, Denmark, France, Germany, India, Kazakhstan, Korea, Malaysia, Mexico, Russia, Singapore, Spain, UAE, UK
6 4 Denmark, Poland, Germany, Sweden, UK, US
5 N/A Spain
6 41 Belgium, Western Europe, Central and Eastern Europe, North and Central Africa, Middle East, Central Asia, Caribbean
0 24 France
5 199 UK
4 3 Switzerland
9 53 UK
8 82 UK, US, Germany, France, Austria, Spain, Sweden, Poland, Italy, Malaysia, Singapore, Saudi Arabia, Egypt, Australia, Germany
3 169 Sweden, Norway, Finland, Denmark, Belgium
7 50 Belgium
0 -79 UK, Spain
4 N/A Austria
1 30 Italy, Turkey, Venezuela, Pakistan, US, Algeria, Honduras, Indonesia, China, Switzerland, Burundi, France, Romania
0 44 The Netherlands, UK, Europe, Middle East, South East Asia
6 21 UK
4 7 UK, Hong Kong, Australia, Japan, Singapore, Germany, Cayman Islands, Japan, Korea, Macau, Malaysia, China, UAE
8 27 UK
9 N/A Ireland
4 123 UK
5 -2 UK, Europe, Middle East, Africa, Australasia, Far East, Americas
9 31 The Netherlands
4 29 Spain, Mexico
7 23 The Netherlands
7 104 Germany, Belgium, Spain, France, Poland, Portugal, UK, Sweden, Romania, Argentina, US, Brazil, Mexico, Chile, Venezuela, Ecuador, India, Qatar, Jordan, Syria, Angola,Algeria, Egypt, Equatorial Guinea, Morocco, Mozambique
7 N/A Spain, Italy, Portugal , Australia, Ireland, Chile, Argentina, Poland
2 32 Poland, Hungary, Czech Republic, Romania, Slovakia, Ireland, Angola, Mozambique, Malawi, Benin and Chad, US, Peru
9 45 UK
4 48 Czech Republic, Slovak Republic
2 84 UK
7 16 Poland
8 50 Spain
5 95 UK
1 26 Germany
als
7European Powers of Construction 2008 Analysis of key players and markets
27697 rt EPoC:27697 EPoC rt 12/12/08 15:37 Page 7

2007 ranking Company name Country FY end Sales (€m)
Constructionrevenue (€m)
Net income (€m) FY end Sales (€m)
Constructionrevenue (€m)
79 Bloor Holdings Ltd UK Jun 07 932 932 56 Jun 06 831 831
80 Bovis Homes Group Plc UK Dec 07 817 817 128 Dec 06 876 876
81 E. Pihl & Søn AS Denmark Dec 07 814 814 12 Dec 06 775 775
82 Budimex SA Poland Dec 07 813 813 4 Dec 06 780 780
83 Hellenic Technodomiki TEB SA Greece Dec 07 915 810 130 Dec 06 718 631
84 Goldbeck Germany Mar 07 752 727 28 Mar 06 562 562
85 Impresa Pizzarotti Italy Dec 07 736 736 23 Dec 06 672 672
86 Societa Italiana per condotte d’acqua Italy Dec 07 729 729 9 Dec 06 724 724
87 Vägverket Produktion Sweden N/A N/A N/A N/A Jun 05 776 721
88 Lindner Holding Germany Dec 07 675 675 13 Dec 06 594 594
89 Mccarthy & Stone (Developments) Ltd UK Aug 07 671 671 119 Aug 06 543 543
90 J&P – Avax SA Greece Dec 07 683 663 25 Dec 06 360 352
91 Koop Holding Europe The Netherlands N/A N/A N/A N/A Dec 06 661 661
92 Max Bögl Bauunternehmung Gmbh & Co. KG Germany N/A N/A N/A N/A Dec 06 645 645
93 McInerney Holdings Plc Ireland Dec 07 633 616 48 Dec 06 630 600
94 Wolff & Muller Germany N/A N/A N/A N/A Dec 06 613 613
95 Michael McNamara & Co Ireland Mar 07 611 611 N/A N/A N/A N/A
96 Tieliikelaitos (Destia Oy) Finland Dec 07 602 602 6 Dec 06 485 485
97 AF Gruppen ASA Norway Dec 07 691 598 22 Dec 06 666 577
98 Köster Holding Germany N/A N/A N/A N/A Dec 06 583 583
99 Tekfen Holding AS Turkey Dec 07 1,062 577 157 Dec 06 962 598
100 Per Aarsleff AS Denmark Sep 07 576 576 20 Sep 06 507 507
Latest year financials Previous year financials
Note: Some companies have adopted proportional consolidation method for joint ventures. In proportional consolidation method the Group combines its share ofjoint ventures’ individual revenues and expenses, assets and liabilities on a line-by-line basis with corresponding items in the Group’s financial statements. So in thiscase, joint venture revenues are included in the Group revenues.
Some companies, where they do not adopt proportionate consolidation method, the Group will include only its profits and not revenue in its consolidated incomestatement. In such instances, the companies sometimes report the share of revenues from joint ventures separately.
8
27697 rt EPoC:27697 EPoC rt 12/12/08 15:37 Page 8
n)
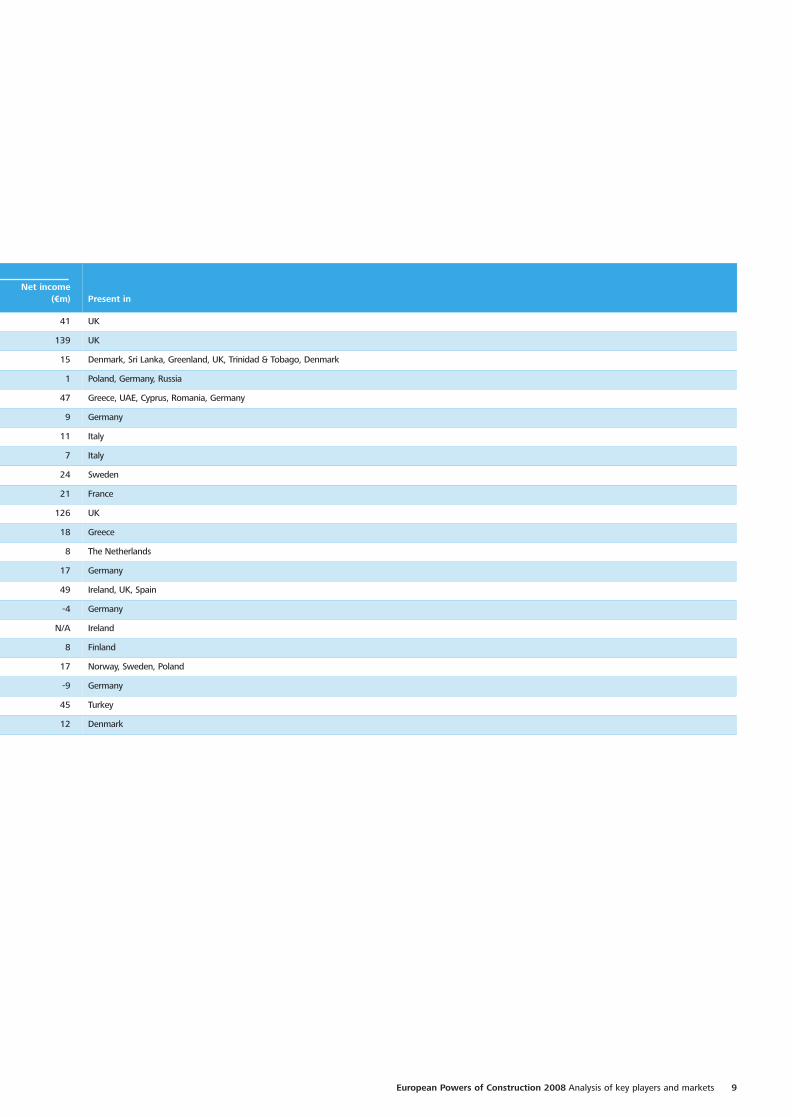
Net income (€m) Present in
1 41 UK
6 139 UK
5 15 Denmark, Sri Lanka, Greenland, UK, Trinidad & Tobago, Denmark
0 1 Poland, Germany, Russia
1 47 Greece, UAE, Cyprus, Romania, Germany
2 9 Germany
2 11 Italy
4 7 Italy
1 24 Sweden
4 21 France
3 126 UK
2 18 Greece
1 8 The Netherlands
5 17 Germany
0 49 Ireland, UK, Spain
3 -4 Germany
A N/A Ireland
5 8 Finland
7 17 Norway, Sweden, Poland
3 -9 Germany
8 45 Turkey
7 12 Denmark
als
9European Powers of Construction 2008 Analysis of key players and markets
27697 rt EPoC:27697 EPoC rt 12/12/08 15:37 Page 9

2007 2006
Average constructionrevenue per company
(€m)
UK 28 33 2,613
Spain 11 11 4,600
The Netherlands 10 11 3,405
Germany 9 6 6,305
France 5 10 12,780
Italy 5 4 1,325
Sweden 5 4 6,557
Austria 3 3 4,922
Belgium 3 3 1,568
Denmark 3 2 987
Finland 3 2 2,161
Greece 3 1 736
Ireland 3 1 614
Norway 2 2 1,427
Poland 2 2 899
Turkey 2 1 2,212
The UK continued to dominate the top 100 with 28 companies listed in 2007, compared to 33 in 2006as a result of John Laing, Renew Holdings and WillmottDixon dropping out, Amec changing its strategic focusto the oil equipment and services sector, and themerger of Taylor Woodrow and George Wimpey. AlfredMcAlpine was acquired by Carillion in February 2008and consolidated information on the Alfred McAlpinegroup at 31 December 2007 was not available, so thegroup does not feature in the top 100.
Overall, eight countries increased their entrants in thetop 100 – including Germany, Greece and Ireland – andthree countries saw reductions in the number ofentrants.
For example, France had five companies listed in 2007,compared to ten in 2006, mainly due to consolidationin the market and a change of strategic focus for someof the companies.
While the UK has, for a number of years, dominatedthe top 100 in terms of the number of companieslisted, the relative fragmentation of the market meansthat it has not yet achieved a commensuratepercentage of total construction revenues. This year’sanalysis highlights that the UK accounts for 23% oftotal construction revenues, compared to France’s 21%.A possible explanation for this is the rapid growth ofthe larger UK companies in recent years.
The top tenConsistent with the previous year, VINCI, Bouygues, HOCHTIEF and Skanska continued to rank as the top fourEuropean construction companies in 2007. VINCI of France retained its number one position, with 19% growth inconstruction revenues for the year ending 31 December 2007. The group further consolidated its lead overBouygues, which once again came second, and the UK saw its first entrant in the top ten for sometime with BalfourBeatty coming seventh. France dominated the top ten with three companies listed, closely followed by Germanywith two, while no other country had more than one company listed.
The top 100
10
No. of companies in top 100
27697 rt EPoC:27697 EPoC rt 12/12/08 15:37 Page 10

European Powers of Construction 2008 Analysis of key players and markets 11
Other notable increases included an 18.4% growth in revenues for Ferrovial due to the integration of a complete year of BAA results, and FCC’s constructionrevenue growth of 58.3% – of which 41.2% wasgenerated outside the domestic Spanish market.Galliford Try of the UK also increased revenues by65.5% on the back of the Morrison Construction andLinden Homes acquisitions.
What is noticeable overall is that lower levels of growthwere achieved by those companies specialising in housebuilding rather than infrastructure, as a slowdown inthe housing market began to take effect during 2007.House building is one of the first casualties of anyslowdown due to demand being inextricably linked toconsumer confidence.
Net income in 2007
There is considerable variation in the 2007 averageconstruction revenues. This reflects different industrystructures, such as the presence of major internationalcontractors in smaller countries and the French andSpanish domestic markets being relatively closed toforeign companies, while allowing their own companiesto have significant international operations.
Changes in revenueOf the top 100, 75 companies reported revenue growthin 2007. Within the top ten, Balfour Beatty reported thelargest year-on-year increase at 36.3%, of which 22%was attributable to acquisitions such as CentexConstruction in the US, and full-year performancefigures from Birse in the UK.
VINCI consolidated its number one position with 18.9% growth in 2007. This strong growth came fromits construction sector operation and was achievedprimarily through organic growth, supported byacquisitions – the most notable being Soletanche Bachy.The tie-up between Sogea Construction and GTMConstruction to form VINCI Construction France alsoallowed the group to capture a greater share of thedomestic market, while outside France, growth wassignificant in the UK and Polish markets. VINCI’s UKposition was further strengthened in 2008 through theacquisition of Taylor Woodrow Construction from Taylor Wimpey.
Bouygues achieved 14.9% growth in 2007, driven byinternational acquisitions such as Warings in the UK andMibag in Switzerland. HOCHTIEF achieved growth of12.3% from 2006, mainly because of its overseasbusinesses such as US subsidiary Turner, and Leighton in Asia-Pacific. In contrast, the domestic building sectorin Germany remained fraught throughout 2007 and thestart of 2008. Increased demand for constructiontriggered significant material and labour price rises thatwere not fully passed on to customers and resulted in a significant impact on earnings for 2007. After aperiod of significant growth between 2004 and 2006,2007 was a year of consolidation and strategic reviewfor the STRABAG group, which at 3.5% grew the leastamong the top ten companies.
No. of companies Average net incomein 2007 (%)
All 82 4.6
Major international 8 3.9
Second tier 8 3.8
Third tier 20 6.5
Fourth tier 46 5.3
UK all 28 3.9
UK house builders 10 7.1
Average net income in 2007 was 4.6%, down from5.1% in 2006. These figures are based on eachcompany’s entire revenue, as in some casesconstruction revenue forms only part of a company’sbusiness. Excluding the results of specialists SacyrVallehermoso and Jan de Nul – which reported netincomes of 16.4% and 18.5% respectively – and the UK house builders, this would give an average netincome of 4.1%.
27697 rt EPoC:27697 EPoC rt 12/12/08 15:37 Page 11

12
Higher income percentages in the third and fourth tierswere driven by the number of UK house builders thatfall within this group, given that they have differentbusiness models to non-house builders. The UK housebuilders reported average net income of 7.1%, which ifadjusted to remove the results of Taylor Wimpey, wouldresult in average net income of 11.8%. At 17.7%, thehighest net income was reported by McCarthy & StoneDevelopments, which focuses on the residential carehomes sector.
Of the major international players, and consistent with2006, HOCHTIEF reported the lowest net income at0.8%, partly due to the reasons discussed above.Eiffage of France – another of the major internationalplayers – reported the largest net income at 7.9%. This was largely driven by profits arising from thedisposal of its interests in Cofiroute and CompagnieEiffage du Viadu de Millau, without which thecompany’s net income would have been comparable to 2006 at 3%.
The second tier of companies – those with constructionrevenues of €5-10bn – reported average net income of3.8%. Excluding the results of Taylor Wimpey (whichreported net losses of 4.1% arising from restructuring,brand impairments, and land and work in progresswrite-downs following the George Wimpey merger),the second tier of companies reported average netincome of 4.5%.
27697 rt EPoC:27697 EPoC rt 12/12/08 15:37 Page 12

Meet the senior executives
What sets you apart from your competition?We are one of the main construction and infrastructurecompanies in Europe, with revenues of €7m(representing about 50% of our total sales of €14m),but we also serve more than 5,000 municipalitiesaround the world in the areas of waste management,street cleaning and other services. In addition we ownCementos Portland Valderrivas, which is the largestcement company in Spain, and have a presence incommercial property and renewable energy.
We are confident that this diversity is a key competitiveadvantage, and we are very proud of it. Fomento deObras y Construcciones – one of FCC’s two foundingcompanies – was created back in 1900 as a constructioncompany, but as early as 1911 it gained its firstenvironmental service contract – the conservation ofBarcelona’s urban cleaning and sewerage system. Since then, we have achieved a proven track record ofsuccessful diversification that has been widely acclaimedand even emulated.
What regional markets and activities do youview as being key growth areas?We now work in more than 50 countries andinternational sales represent 40% of our business, with a target of reaching 50% by 2010. To achieve this, wewill continue looking at the countries we alreadyoperate in. Consolidating our construction and servicesbusinesses in the UK and Central and Eastern Europe(CEE) is also one of our priorities.
In addition, the US market is very interesting for us andwe plan to increase our presence there significantly,taking advantage of the massive investment expectedacross the country in transport infrastructure, utilitiesand environmental services.
Baldomero FalconesChairman and CEO at FCC, Spain
What are FCC’s key objectives for 2008/09? Under our strategic plan for 2008 to 2010 – which we launched in May 2008 – we aim to consolidate our position as a leading, diversified and multinationalprovider of services and infrastructure. Our strategy is based on three pillars: consolidating our currentbusinesses, taking advantage of expansionopportunities, and increasing our efficiency levels.
Consolidating our current businesses means that we will have to work hard in order to secure our marketshare across our different activities, consolidate ourinternational acquisitions – such as Alpine in Austria andthe Waste Recycling Group (WRG) in the UK – andfocus on profitability and free cash flow generation. We will also continue to explore international expansionopportunities in our core businesses – such asenvironmental services, water management andinfrastructure – in Europe, the US and selectedemerging markets.
We have recently launched a new Energy division andacquired 14 wind farms with a total of 425 megawatts(mw) of generating capacity, as well as two solar farmswith 20mw of capacity. These assets, along with ourWaste and Energy divisions, constitute the platform forour future growth. We believe our Energy division inparticular will see significant development over thecoming years.
This consolidation and expansion will be fuelled byfurther improving our processes and increasing theefficiency of our organisation, with a particular focus on cost optimisation.
Our ultimate goal is to increase the company’s equityvalue for our shareholders.
In this year’s edition of EPoC, we have interviews with senior executives from two of Europe’s top constructioncompanies.
First, we hear from Baldomero Falcones, Chairman and CEO at FCC, and second we hear from Theo Bruijninckx,Chairman, and Ruud Jacobs, Member of the Board, at Ballast Nedam.
13European Powers of Construction 2008 Analysis of key players and markets
Baldomero FalconesChairman and CEO atFCC, Spain
27697 rt EPoC:27697 EPoC rt 12/12/08 15:37 Page 13

14
We also follow other markets very closely, especiallyemerging economies, but it is important that we ensurewe understand these markets properly and are able tolimit any risks before entering them. Setting up theappropriate infrastructure and finding the right partneris key.
What other growth/diversification opportunitiesdo you see for FCC in 2008/09?As mentioned earlier, in accordance with our strategicplan we recently launched an Energy division and haveinvested more than €900m in renewable energy assetsas of July 2008. This is a natural area of focus for us as we already enjoy a noteworthy position in wastemanagement and energy generation. We arecommitted to this sector and will use these assets as a basis on which to build a larger business unit,leveraging our expertise in electrical and civilconstruction, infrastructure development and operations to achieve this goal.
The growth of demand for energy is exponential andwe want to consolidate our position in this key sectorof the economy, as we have done in others. Renewableenergies are of specific interest for us, given our long-standing pledge to sustainability – something that wasrecently recognised with our inclusion in the Dow JonesSustainability Index.
What are your expectations for the Europeanconstruction market and what issues does theindustry face in 2008/09?It is evident that we are facing a downturn in theeconomic cycle in Western Europe, but more than 45% of our earnings before interest, taxes, depreciationand amortisation (EBITDA) are generated by services.
Despite the downturn, I remain quite an optimist aboutcivil construction, which is our main activity (housingconstruction represents less than 3% of our EBITDA).The market for infrastructure projects will steadily growat a low rate in Western Europe, but we will continueto see two-digit growth in Eastern Europe. Overall, escalating pressure on public budgets shouldalso be compensated for by increasing investment ininfrastructure through PFI and PPP projects.
Overall, I foresee stable expansion of the market thatwill allow construction companies to navigate throughthe cycle – as long as they are well-diversified andtechnically-sound, and benefit from an appropriatefinancial structure.
27697 rt EPoC:27697 EPoC rt 12/12/08 15:37 Page 14

European Powers of Construction 2008 Analysis of key players and markets 15
Theo BruijninckxChairman and CEO, Ballast Nedam, The Netherlands
Ruud JacobsMember of the Board, Ballast Nedam, The Netherlands
Who are Ballast Nedam?After a few difficult years in the late 1990s, we made a turnaround in 2000/01 to become a solid top fiveplayer in the Dutch construction market. With revenuesof almost €1bn, of which approximately €100m comesfrom international business, our main focus is on ourdomestic market. Since 2005, all international projectshave been managed directly by our holding company.
The group consists of two divisions: Building andDevelopment, and Infrastructure. As well as carrying out their day-to-day activities, these divisions also jointlymanage Ballast Nedam Consessies – a separate businessthat focuses on projects of a concessional nature, suchas PPPs.
What are your objectives, and how do youintend to differentiate yourselves?As part of our mission to offer high-quality, totalsolutions, we have four key priorities for the next fewyears.
First, we intend to focus our mix of activities on thefront end (development) and the back end (maintenanceand operation) of the value chain, as well as increasingour focus on niche segments – all of which we hopewill increase the value of our business.
Second, we intend to start getting involved in projectsearlier and for longer periods so that we can meet ourcustomers’ growing demands for total solutions.
Third, we wish to strengthen the position of ourspecialised companies within the value chain in order to contribute more to our core competencies.
Fourth, we will be more selective about adding orremoving activities from our current portfolio. We willassess each activity based on profitability and the extentto which it can contribute to providing advanced totalsolutions for our clients.
While these strategic objectives might not be consideredradical, they are necessary to secure our competitiveposition – and how we realise them is even moreimportant than the objectives themselves. We consistently monitor how effectively our strategy is being implemented within our various companies andmake time to implement new ways of working tocontinually improve our business model. For example,we have spent a lot of time in recent years working onour PPP proposition and as a result of this we havebecome very successful in this area, now being involvedin the majority of PPP projects throughout TheNetherlands.
Although as you focus mainly on your domesticmarket, what other markets and activities withinEurope do you view as being potential keygrowth areas for Ballast Nedam?The construction industry remains largely a nationalindustry. Of course, we see that a lot of attention isfocused on Central Europe at present, but that is onlyinteresting if you have a strong position or a strategicpartner within a country there and can really add value.We will only work in other countries if we can addextra value based on our specific expertise, such as inthe construction of football stadiums.
For the raw materials market, it’s a different story. This cannot be done solely on a national basis, so weare planning concessions for raw material production in different parts of Europe (eg, in Germany andNorway), in addition to our core activities.
Finally, offshore wind energy farms are a growth areafor us, mostly in North West Europe. We will apply ourknowledge and expertise regarding wet infrastructure – such as bridges – to further develop this niche market.
Theo BruijninckxChairman and CEOBallast NedamThe Netherlands
Ruud JacobsMember of the Board,Ballast Nedam, The Netherlands
27697 rt EPoC:27697 EPoC rt 12/12/08 15:37 Page 15

16
What other growth or diversificationopportunities do you anticipate?Overall, growth is not a major priority, but profitability is.
Finding clients for whom we can apply our broadknowledge and expertise is key to our future success; a current example of this is the healthcare industry,especially including hospitals and medical parks. Other important niche markets include industrialconstruction and natural gas, for which we haveformed a new company – CNG Net – that focuses onthe construction, operation, management andmaintenance of natural gas stations in The Netherlands.
We aim to keep our organisation as decentralised aspossible because regional knowledge andentrepreneurship are crucial to the success of ourcompanies. This will be easier for our Building andDevelopment division than for our Infrastructure divisionbecause there are more opportunities with a broaderclient base in this area, as well as a less prescribed wayof working.
What issues face the European constructionindustry over the coming years?It’s obvious that the construction industry will faceserious environmental issues – for example, aroundlimiting energy consumption to be moreenvironmentally-friendly. We will need to find innovativeways to improve our offerings to clients in this area,with innovation likely to come both from constructioncompanies and our suppliers.
Of course, the financial crisis will also have an impacton the industry – but that should only be temporary.Some countries will suffer more than others, as recentdevelopments show, but we expect strong demand forhousing and infrastructure in domestic markets tocontinue in the years to come.
27697 rt EPoC:27697 EPoC rt 12/12/08 15:37 Page 16

European Powers of Construction 2008 Analysis of key players and markets 17
The credit crunch and constructionThe construction industry in any developed economy is cyclical: its fortunes tend to follow the fortunes of the country or even the region in which it operates. But because any actual assets being constructed taketime to be financed, designed and built, each companyusually has a sufficient backlog of work orders tocounter any downturn for a short period of time.However, the construction cycle will inevitably followgross domestic product (GDP), and so this lag of time – no matter how long it is – will eventually come to an end.
In light of the current economic downturn, this makesthe picture look bleak for construction companiesacross Europe. However, the trend might be counteredto a limited degree by a high level of public sectorspending on infrastructure. Looking at the UK inparticular, major projects that might counter thepredicted downward trend include the London 2012Olympics; work on the M25 upgrade and maintenance;and the Thameslink and Cross London Rail Links.Further, since the last downturn – and as some of ourcommentators have noted in their interviews – manyconstruction companies have diversified into theservices sector. This market is not considered to be ascyclical, thus potentially dampening the extent of anydownturn.
Predictions, however, are currently fraught with danger.Even as this article went to press, there were indicationsthat significant projects were starting to be cancelled.
Changing focusIn light of the credit crunch, four key issues areanticipated and should be managed in the comingmonths:
• advanced payments drying up, leading to differentworking capital ratios;
• customers’ and subcontractors’ financial positionsweakening;
• more difficult variation and claim negotiations; and
• rising finance and insurance costs.
Advanced paymentsA well-run construction company has net workingcapital liabilities because it receives significant paymentsbefore it starts work, keeps the cash inflow going withtimely certification and collection, and manages itssuppliers’ payment terms.
But credit is becoming scarcer and more expensive, andso the level and incidence of advanced payments willundoubtedly fall – turning the net current liabilities intonet current assets that will need to be financed byexisting cash reserves or overdraft facilities.
Across Europe, there have been a number of workingcapital failures by construction companies, asirrecoverable assets have been exposed. As theadvanced payments dry up, there is a risk that a furtherlevel of these assets will become visible. Certainly,working capital ratios – and the cash conversion ratiosthat analysts in this sector are now so fond of – willlook different. As a result, if you are a supplier to theindustry, you will have to watch your credit terms overthe year-end.
Customers and suppliersIf construction companies are not doing so already, theyshould be taking a closer look at the financial positionsof their customers, subcontractors and suppliers.
When customers fail to honour their paymentagreements, the contractor always has the option towalk off site. However, with tight deadlines and thepenal effects of liquidated damages, this is not always a popular course of action – so management should try to avoid such situations by regularly assessing thefinancial strength of their customers and pre-emptingany possible problems.
Suppliers and subcontractors failing – regardless ofthem being bonded – is also a major problem for anycontract. First, a replacement is needed (undoubtedlyeroding forecast margins) and second, the contract isput under time pressure – meaning the project issqueezed at both ends.
Expert view from Deloitte
27697 rt EPoC:27697 EPoC rt 12/12/08 15:37 Page 17

18
Variation and claim negotiationsWhenever the economy comes under pressure, variationand claim negotiations take longer. The industry’scustomers and suppliers are trying to manage theirworking capital positions and costs, so paying someoneto stall – or putting the squeeze on a settlement offer – is often the cheapest approach. As a result, we expectto see working capital positions coming under pressureover the next few months, and prudent revenuerecognition policies may need to be maintained.
Rising finance and insurance costsThis effect almost goes without saying. First, if acompany does have to extend its credit facilities with abank, they will find that this is not the cheapest time todo so. This is compounded by the fact that banks oftenlook on construction companies unfavourably becausetheir assets are largely intangible. Second, we shouldnot forget that a large number of contracts in theindustry are backed by performance and paymentbonds. The financial institutions that provide suchinsurances are unlikely to take on more risks at thistime, and costs will inevitably go up.
Is it all doom and gloom?The answer is that it is too early to tell. However, thereare three important factors that could counter thepotential issues outlined above:
• construction companies should have learned fromtheir past mistakes. We have heard a lot aboutcompanies improving their customer relations andtaking a less-combative approach to construction over the past few years, so now is the time whenthose improved relationships should come to the fore.In addition, working capital failures have been wellpublicised, so companies remaining in the sector havebeen stressing their prudence in terms of revenuerecognition – which should include improved workingcapital management;
• support services and term-contracts. In contrast tothe last bout of economic difficulties, constructioncompanies have diversified into support services.While these contracts are often working capitalpositive (ie, they are not usually paid in advance), they are long term and should dampen the level ofcyclicality; and
• the infrastructure gap. Across Europe, there are heavydemands on governments to maintain and enhanceinfrastructure. The standards of buildings such asschools, hospitals and prisons needs to improve; roadand rail demands are increasing; and utility spend ison the increase.
In conclusion, the construction and infrastructuremarket is not immune to the credit crunch. We havenot seen the full effects yet, and the next 12 to 18 months will be an interesting time for the industry.There are a number of critical issues that should bemonitored and we will see if claims such as thosearound improved customer relations are shown to be true as the credit crunch starts to bite.
27697 rt EPoC:27697 EPoC rt 12/12/08 15:37 Page 18

European Powers of Construction 2008 Analysis of key players and markets 19
Infrastructure investment opportunities in theemerging Chinese and Indian markets The sustainable economic development of a countryand improvement in its citizens’ living standards are veryclosely linked to the creation of infrastructure, includingboth transport infrastructure and that relating to theprovision of essential services such as healthcare andeducation. Infrastructure constitutes a means ofachieving geographical, economic and social regionalcohesion because it integrates space, provides a backbone for a geographical area, makes it accessible,and provides the basic services required for socialinteraction and production. Adequate infrastructure alsoincreases productivity by reducing production costs,stimulating commercial activity, contributing to jobcreation, and generating income – making it possible toincrease tax revenues without increasing the burden ontaxpayers. Finally, infrastructure stimulates privateinvestment and capital accumulation, both of whichfacilitate the development, economic growth and socialwelfare of poorer regions.
It is not surprising that more than 70% of the world’sprojected investment in infrastructure over the next tenyears will be concentrated in two countries: China(60%+) and India (10%+). These are currently the twocountries with the highest growth rates in the worldeconomy and, because of their vast populations andgeographical size, they require enormous investments in infrastructure in order to support and help sustaintheir economic growth.
The other so-called BRIC countries (Brazil and Russia)and N-11 countries (those deemed to have the greatestgrowth potential: Bangladesh, Egypt, Indonesia, Iran,Korea, Mexico, Nigeria, Pakistan, The Philippines, Turkeyand Vietnam) rank next in terms of investment, with airtravel, roads, water, electricity and telecommunicationsattracting the most investment.
The high worldwide investment volumes forecast forthe next decade have triggered the creation of morethan 100 infrastructure funds over the past 18 months,which between them have raised capital of almost€105bn. With the typical leverage in projects of thisnature, these funds would be capable of financinginvestments in excess of €420bn. They tend to beowned by financial institutions, investment banks andpension funds, and nearly half originate from the USand Europe where for the first time venture capital (eg, Carlyle, 3i, Blackstone and Citigroup) is behind a significant number of them. These new competitorshave been lured by the large volumes of investment andfinancing required, the relative stability of investments,and the visibility of cash flow from infrastructure projects.
The entry of new players will give rise to increasedcompetition between traditional operators in themarket. This is particularly true for brownfield projects,where governments are using existing public assets togain additional value, as investment in new infrastructureis not an essential part of any project. This increasedcompetition may well reduce the rates of return oninvestments in projects of this nature.
The main emerging markets The Chinese and Indian governments are aware of thehigh levels of investment required to cater to theircountries’ needs, particularly taking into account thecurrent inadequacy of infrastructure in rural areas.
In order to modernise their infrastructure, China andIndia have both implemented mechanisms for financinginvestments that go beyond the traditional budget-based methods, as well as developing new policies andregulatory frameworks to assist in reducing anyshortcomings.
27697 rt EPoC:27697 EPoC rt 12/12/08 15:37 Page 19

China’s infrastructure marketBetween 2002 and 2006, investment in Chineseinfrastructure increased from €191bn to €420bn – anaverage annual increase of 22%. In fact, China currentlyspends 9% of its GDP on infrastructure. In addition, since2004 – three years after work commenced on China’saccession to the World Trade Organisation – foreigncompanies have been allowed to operate in China’sconstruction industry. The Chinese regulatory frameworkalso permits various means of financing infrastructure,including traditional budget-based financing, governmentbonds and PPPs. However, PPPs in China are generallyconfined to build-operate-transfer models, in which thepublic and private sectors share the financial risks.
The Chinese government’s ninth and tenth five-yearplans are focused mainly on investment in roads andrailways. However, an enormous volume of investmentin these areas is still necessary. For example, theMinistry of Communications estimates that the Chineseroad network needs to be extended to 2.3m km andthe motorway network to 65,000km by 2010 – and to3m km and 85,000km respectively by 2020.
20
Industry Sub-sector No. of projects Total investment (€bn)
Energy
Electricity 132 21
Natural gas 164 3
Total energy 296 24
Telecoms
Telecoms 4 10
Transport
Airports 15 2
Railways 5 4
Roads 124 14
Ports 45 7
Total transport 189 27
Water
Treatment plants 167 3
Utilities 16 1
Total water 183 4
Total 672 65
PPP projects in China during 2007 China is also considering building 97 new airports by2020 – 43 before 2010 – with an approximateinvestment of €44bn.
Finally, in the eleventh five-year plan, the ChineseMinistry of Construction has set an objective for a€29bn investment in waste water treatment plants.
The most notable planned investments include theZhejiang Expressway (with almost 2,000km of motorwayconstruction and an estimated investment of €15bnbetween 2006 and 2010), the Jiangsu Expressway (with 1,200km of motorway and an estimatedinvestment of €9bn between 2006 and 2010), theShenzhen Expressway (with 1,900km and an estimatedinvestment of €12bn), the Anhui Expressway (with1,900km and an estimated investment of €8bn), andthe Sichuan Expressway (with 1,391km and anestimated investment of €10bn).
China leads the world ranking for private investment in transport infrastructure, most of which comes fromabroad – a feature that the Chinese government wishesnot only to maintain, but also to promote because theenormous demand for investment simply could not becovered by budgeted financing. Also, from a legalcertainty standpoint, the percentage of investments in cancelled PPP projects is approximately 7%, which is lower than the global average of 10%.
The greatest investment opportunities are located inWest and North-East China due to the government’splanned developments for these areas.
India’s infrastructure marketThe rapid increase in the Indian population and thecountry’s economic growth have both generatedenormous pressure in connection with the modernisationand expansion of the country’s infrastructure. To tacklethis, the Indian government’s tenth five-year plan (2002 to 2007) budgeted for infrastructure investmentsof €175bn.
However, according to various studies, India needs toinvest 9% of its GDP in infrastructure until 2012 –compared with the current 5% – and would need toinvest up to 12.5% of GDP annually until 2015 to reachChina’s infrastructure level. An investment of more than€315bn will be required by 2012, of which approximately20% will be provided by the private sector.
27697 rt EPoC:27697 EPoC rt 12/12/08 15:37 Page 20

European Powers of Construction 2008 Analysis of key players and markets 21
Regulations regarding investment by foreign companieshave been relaxed significantly in recent years, and now100% of foreign investment in projects building roads,motorways, ports, power stations, industrial parks,airports and hotels is permitted. Moreover, thegovernment has implemented various initiatives aimedat strengthening the infrastructure market, including the provision of funds and the establishment of aninfrastructure development vehicle – the IndiaInfrastructure Finance Company Ltd.
PPP projects – State highlights
Punjab: 11 road projects costing US$161m
Rajasthan: 28 road projectsworth US$92m
Gujarat: Seven port projectsworth US$2.2bn
Karnataka: Projectsworth US$0.9bn
Kerala: Thiruvananthapuramcity road development project– US$48m. First urban road project built with privateparticipation
Tamil Nadu: Infrastructure fund with initial corpus of US$4.1m set up to facilitate PPPs
Andhra Pradesh: Major projects worth US$6.5bn are in progress or complete; airport being developed through PPPs costing US$397m
Orissa: Eight road projectsare in the pipeline
West Bengal: Two of thelargest privately-financed build-operate-transfer highway projects in India – worth approx. US$200m
Madhya Pradesh: Over 2,000km of roads developed via build-operate-transfer projects
Delhi and Mumbai: Airportsbeing modernised throughPPPs costing US$2.1bn
States for which PPP projects are shown
27697 rt EPoC:27697 EPoC rt 12/12/08 15:38 Page 21

22
Gujarat, Maharashtra, and the states bordering Delhioffer the best growth prospects for infrastructureinvestment.
Given that the shortfall in infrastructure cannot becovered exclusively by budgeted financing or multi-lateral bodies, the government has made efforts totransform the legal framework in order to support PPPs.This has involved, among other measures, the creationof a PPP department in the Ministry of Finance, and a Planning Committee for the promotion of PPPs. In addition, model PPP contracts have been created forcertain industries and guidelines for PPP financing andbidding processes have been issued.
By the end of 2006, the government had awarded 86 PPP contracts, with an investment cancellationpercentage of around 7% of the total investment.
Despite this progress, the elections in May 2009 couldaffect the timing of the reforms, even though they arecurrently supported by a coalition of widely-differingparties. In addition, market liquidity and the scanttransparency of the various markets and players arerisks that should be considered by companiesconsidering entering the Indian market.
Looking aheadThe major volumes of investment planned in China andIndia present an important opportunity for Europeantransport infrastructure concession operators, whichnumber among the world’s leading companies in thisfield.
However, many European companies are focusing theirstrategies on the US and Latin American infrastructuremarkets. The economic recovery of the principal LatinAmerican countries – most notably Brazil and Mexico,which recently announced ambitious infrastructureplans – represents a clear opportunity for Europeancompanies.
Added to this is the enormous interest shown by the USin recent years in transport infrastructure concessions asa means of financing investments. European companiesare naturally drawn to such projects because of theexperience they have gained in these countries, coupledwith their large market shares.
Because of this focus, European companies appear tobe some way behind their competitors in terms of thetwo economies that will lead infrastructure investmentover the next decade. However, European constructioncompanies – with their extensive domestic andinternational experience in transport infrastructureconcessions – possess enough financial muscle to graspthe opportunities and face up to the challenges thatwill emerge in the coming years.
27697 rt EPoC:27697 EPoC rt 12/12/08 15:38 Page 22
European Powers of Construction 2008 Analysis of key players and markets 23
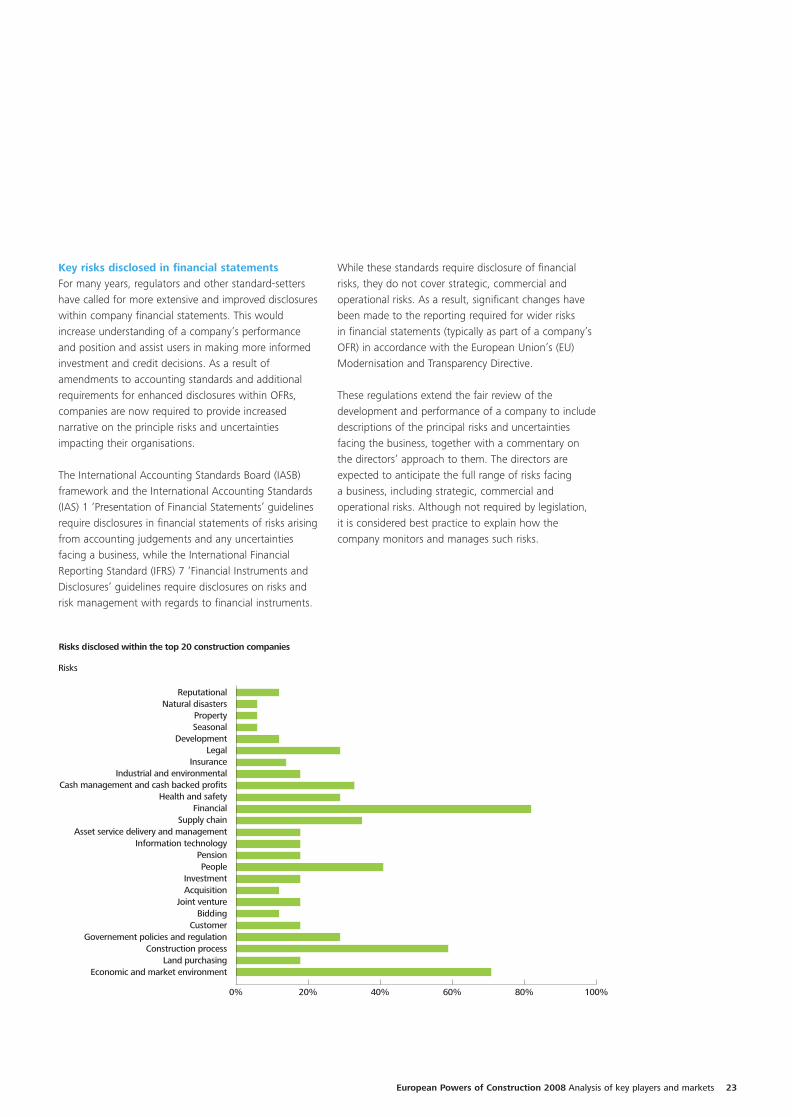
Key risks disclosed in financial statements For many years, regulators and other standard-settershave called for more extensive and improved disclosureswithin company financial statements. This wouldincrease understanding of a company’s performanceand position and assist users in making more informedinvestment and credit decisions. As a result ofamendments to accounting standards and additionalrequirements for enhanced disclosures within OFRs,companies are now required to provide increasednarrative on the principle risks and uncertaintiesimpacting their organisations.
The International Accounting Standards Board (IASB)framework and the International Accounting Standards(IAS) 1 ‘Presentation of Financial Statements’ guidelinesrequire disclosures in financial statements of risks arisingfrom accounting judgements and any uncertaintiesfacing a business, while the International FinancialReporting Standard (IFRS) 7 ‘Financial Instruments andDisclosures’ guidelines require disclosures on risks andrisk management with regards to financial instruments.
Risks disclosed within the top 20 construction companies
ReputationalNatural disasters
PropertySeasonal
DevelopmentLegal
InsuranceIndustrial and environmental
Cash management and cash backed profitsHealth and safety
FinancialSupply chain
Asset service delivery and managementInformation technology
PensionPeople
InvestmentAcquisition
Joint ventureBidding
CustomerGovernement policies and regulation
Construction processLand purchasing
Economic and market environment 0% 20% 40% 60% 80% 100%
Risks
While these standards require disclosure of financialrisks, they do not cover strategic, commercial andoperational risks. As a result, significant changes havebeen made to the reporting required for wider risksin financial statements (typically as part of a company’sOFR) in accordance with the European Union’s (EU)Modernisation and Transparency Directive.
These regulations extend the fair review of thedevelopment and performance of a company to includedescriptions of the principal risks and uncertaintiesfacing the business, together with a commentary onthe directors’ approach to them. The directors areexpected to anticipate the full range of risks facing a business, including strategic, commercial andoperational risks. Although not required by legislation, it is considered best practice to explain how thecompany monitors and manages such risks.
27697 rt EPoC:27697 EPoC rt 12/12/08 15:38 Page 23

24
For example, a strong emphasis tended to be placed onfinancial and operational risks, while less weight wasgiven to strategic and commercial risks.
Financial risks were disclosed in respect of 83% of thecompanies reviewed, and in part reflect the requirementsof IFRS 7 (ie, the need to disclose risks and riskmanagement relating to financial instruments). The keyfinancial risks disclosed primarily related to liquidity risksand foreign currency risks, reflecting the multi-locationalnature of many of the companies’ operations.
The economic and market environments around Europewould appear to be a primary concern for 71% of thecompanies reviewed. This in part reflects the companiescarrying out a wide range of activities in differentgeographical areas. Accordingly, a company’sperformance depends largely on the economic climatein the countries in which it operates, as a considerableportion of work will be commissioned by governmentbodies. Much of the commentary provided within thecompanies’ narrative reports was generic, with limiteddiscussion on how economic conditions would impacttheir business stream or company. History, however,tells us that for annual reports two critical factors arethe trend of GDP and government policy.
The construction process is highlighted as the keyoperational risk in 59% of the reports reviewed. This low percentage is somewhat surprising as itrepresents the key activity for such companies, and isthe area where stakeholders would presumably requiremost reassurance. In the reports where this wasdiscussed, extensive commentary was provided toexplain to the stakeholders how the risks had beenmitigated through effective project governance andsetting up internal control frameworks to safeguard theinterests of the company throughout a project’slifecycle.
This article examines the main risks and uncertaintiesdetailed within the financial statements of the top 20 European construction companies and looks at how disclosures vary across different organisations. The annual reports reviewed were the most recentlyavailable and relate to the 2007 year end.
We noted that all of the companies included a riskcommentary, although the quality and quantity ofinformation disclosed differed widely. The chart on page23, provides a breakdown of the principal risks identifiedacross the companies.
All of the companies disclosed risks and gave prominenceto them within their OFR. A wide range of risks werereported (which in part reflects the varying nature ofactivities performed by the companies surveyed), but itshould be noted that not all of the companies includedthe whole range of financial, strategic, commercial andoperational risks.
Other key risks our review identified were as follows:
Risk % Notes
The economic and marketenvironments
71 Exposure to changes in opportunities andthreats, competitors’ capabilities increasingand other factors affecting a company’sindustry.
The construction process/projectmanagement
59 Maintaining the quality of servicesprovided to customers and avoiding delays in the execution of work.
People 41 Recruitment, training, development andretention of key personnel.
SCM 35 Maintaining the supplier base andmanaging costs, efficiency and quality of supplies.
Cash management 33 Maintaining adequate levels of liquidityand ensuring delivery of cash-backedprofits.
Legal 29 Exposure to changing laws (affecting the ability of companies to enforce contractual agreements to implementspecific strategic activities) and risksarising from contract disputes.
Health and safety 29 Compliance with health and safetyregulations and maintaining workers’safety.
Government policy and regulation 29 Changing regulations impacting a company’s competitive position and itscapacity to efficiently conduct business.
27697 rt EPoC:27697 EPoC rt 12/12/08 15:38 Page 24

European Powers of Construction 2008 Analysis of key players and markets 25
The narrative reporting of risks in relation to people andSCM partly reflected the fact that we were studyingannual reports from 2007. This was when theconstruction market was at the top of the cycle, withincreased competition for winning new work andobtaining resources (both people and products) at thetop of companies’ minds. In addition, many companiesmay have included them as key risks because theyemphasise the key role of people elsewhere in theirannual reports, people after all are the key asset incompanies within this sector.
As construction companies are service companies, theirassets are essentially their brand names, people andclients. It is therefore somewhat surprising to see thatreputation risk was only included by 12% of thecompanies concerned, and customers by 18%.
It is also important to note the prominence of cashmanagement in narrative reporting. This may reflectchanges in stakeholders’ perceptions around what areimportant financial performance measures. Whileturnover and profit margins are still deemed to beimportant measures of growth, cash flow is also seen as a measure of success now. This may be because, as measuring profit becomes more complicated as aresult of changes in accounting standards, cash flow isthe one tangible that can be relied upon – and it is alsoa good indicator of whether something is going wrongat a company.
In conclusion, wide-ranging risks were disclosed by thetop construction companies in 2007, with disclosuresvarying substantially in quantity and quality. However, it is likely that – with the combination of recent eventsin the financial markets, the possible impact they willhave on the wider economy, and continued changes in regulatory reporting requirements – consistency ofdisclosure in reporting key risks will improve in 2008.
27697 rt EPoC:27697 EPoC rt 12/12/08 15:38 Page 25

26
Construction and the environmentAs early as 2003, 78% of Europe’s fund managers and analysts predicted that sound management ofenvironmental risks would increase a company’svaluation over the long term. Investor relationsmanagers also largely agreed that good sustainabilityperformance would lead to a better reputation,increased market value and improved economicperformance. One of the reasons for this issustainability and the environment becoming ubiquitousin the media, and regulatory changes gainingmomentum (eg, at the G8 Summit held in Japan in2008, a resolution to halve greenhouse gas emissionsby 2050 was adopted).
Meeting such ambitious objectives will be challenging,and the construction industry is likely to play a crucialrole – particularly through remodelling existing buildingsto save energy, and building new energy-efficientstructures. All of this means that companies should belooking in detail at how they manage their environmentalrisks – and opportunities – in order to maximise valueover the long term.
Major driversThe emerging importance of the environment to theconstruction industry is due to three main drivers:
Increased awarenessPeople have become more sensitive to environmentalissues all over Europe, especially in relation to thoselarge construction projects that are continually in thespotlight. For instance airports, motorways and otherinfrastructure construction projects frequently meet withmassive resistance on environmental grounds – and notjust from neighbouring residents.
In fact, protests and legal action often causeconstruction projects to be interrupted or abandoned,so companies increasingly need to take environmentalissues into account when they are planning or executingprojects. Something that is enabling this approach tobecome more embedded in the industry is thatindividuals working in construction appear to havegenerally become more environmentally-conscious in recent years.
Laws and regulationsAnother significant driver is the host of environmentallaws and regulations now in effect. First and foremostare the EU’s climate protection requirements. A 1990EU agreement called for a 20% reduction in carbondioxide emissions by 2020, and specific requirementsinclude obtaining energy passes for buildings –something that will further increase demand for energy-efficient remodelling and construction.
The EU requirements also include mandatory rulesaround renewable energies representing a larger shareof total energy production. This is likely to lead toincreased demand for corresponding power plants andtechnologies.
Finally, the launch of EU-wide emissions trading is alsoimportant. This means that those constructioncorporations that produce building materials will needto work hard to manage their own emissions.
Environmentalprotection inconstruction
Increased awareness
Laws and regulations Cost pressures
27697 rt EPoC:27697 EPoC rt 12/12/08 15:38 Page 26

European Powers of Construction 2008 Analysis of key players and markets 27
Cost pressuresIn times of increasing commodity and energy prices – and government interventions such as Germany’s eco tax – there is more intense pressure on companyfinances. This means that achieving energy-efficiency andlowering capital expenditure are becoming increasinglyimportant drivers, wherever properties are built andoperated. Companies must manage their constructionprojects as effectively as possible in order to ultimatelylower – or at least contain – operating costs.
An evolving marketEnvironmental requirements and associated approvalprocedures are increasingly posing major challenges tolarge construction projects. Almost everywhere, noiseand emissions limits must be observed, and projects inthe fields of infrastructure, tourism and raw materialexploration are often subject to particularly complexrestrictions – such as to protect nature reserves orensure that roads do not run through environmentally-sensitive areas. In every case, the challenge isminimising the impact of any construction.
Higher-priority environmental concerns for consumershave also caused demand to rise for environmentally-friendly products. As a result, construction standardshave changed – especially in building – and buyers,tenants and investors are paying increasing attention tothe energy and cost-efficiency of properties. This trendhas been reinforced by measures such as the EU’sGreen Building Programme and the introduction ofcertificate schemes for energy-saving buildings – suchas Leadership in Energy and Environmental Design,Building Research Establishment EnvironmentalAssessment Method, and Haute QualitéEnvironnementale. As well as catering to consumerdemand and trying to improve their reputations,companies are aiming to achieve such standardsbecause they ultimately benefit from lower operatingcosts when working with energy-efficient buildings.
Finally, brand new opportunities for construction firmsare emerging in areas such as wind energy (especiallybuilding offshore wind farms) and geothermal and solarenergy plant construction. Modernising existing powerplants, as well as developing the next generation, is alsobecoming increasingly important. Even nuclear energy – frowned upon in some European countries until just a few years ago – is being discussed as an option tofight energy- and carbon dioxide-related problems.
In order to make the most of the various opportunitieswhich are emerging, construction companies mustadapt to these changes in the market and develop theskills, resources and know-how needed to meettomorrow’s requirements.
Integrated managementCorporate environmental management relates to severalareas of the enterprise value chain, including thesupport functions.
Risk management
External financial reporting/investor relations
Controls/internal reporting
Constructionmaterialselection/procurement
Realising construction projects/productsand services
Marketing/sales
On a construction project, environmental concernsfigure prominently early on (ie, when constructionmaterials are being selected). Concerns include avoidingmaterials that are banned (such as asbestos), andsourcing those materials with environmentally-friendlyproperties. For example, to build an environmentally-friendly building, construction materials with certainproperties – such as adequate heat insulation and aircirculation – must be used. In road construction,requirements for blacktop surfaces have also changedand using a large proportion of recycled materials isencouraged to reduce waste.
More and more frequently, the actual constructionprocess is also being influenced by environmentalconcerns. Goal-orientated construction plans and sitelogistics allow significant energy savings to be realisedin many cases, which translates into less impact on theenvironment and lower operating costs. Disposing ofand/or recycling waste in an environmentally-friendlymanner is also of primary importance – both for ethicalreasons, and to help lower the cost of materials byincreasing recycling ratios.
27697 rt EPoC:27697 EPoC rt 12/12/08 15:38 Page 27

In order to be successful, environmental managementmust touch the various corporate support functions andproperly address the whole range of risks, identifyingthem and initiating appropriate action as and whenthey occur. It is also important that environmentally-relevant information – for instance, new regulations and policies – be communicated and documented usinga company-wide reporting system, and that controlsand measures such as internal audits are used to ensurea business is adhering to such requirements.
Environmental protection is also becoming an ever-more-present feature in external corporatecommunications. Increasingly, companies are publishingenvironmental information and key figures in annualreports, sustainability reports, environmental reports,and on their websites. This is partly due to statutoryrequirements such as Article 46 of the FourthAccounting Directive, 78/660/EC, according to which a company’s management report should contain non-financial performance indicators, including informationrelating to environmental matters. Besides, investorsand analysts are increasingly setting store by sustainabilityinformation and performance indicators and proactivecommunication of environmental topics can help toenhance a company’s image.
28
In conclusion, construction companies have no choicebut to confront the issue of environmental protection in every area of their business. Ensuring that integratedenvironmental management becomes a centralmanagerial focus will arguably be the best response tothe whole range of risks and opportunities that will arise.
27697 rt EPoC:27697 EPoC rt 12/12/08 15:38 Page 28

European Powers of Construction 2008 Analysis of key players and markets 29
Reducing failure costs through supply chainmanagementOver the past decade, failure costs (ie, costs associatedwith the causes of contract failures) in the constructionindustry have received more and more attention. The reason is simple: in a low-margin business such asthis, even a small reduction in failure costs leads toconsiderable improvement in a firm’s overall financialperformance. In the various studies that have beencarried out in an attempt to quantify failure costs forbuilding and engineering projects (sometimes referredto as ‘rework’), they have been estimated to rangebetween 3-23% of a contract’s value, while in theDutch construction industry the estimated range is evenwider, at 5-30%. Although these are only roughestimates, it is clear that failure costs are a serious issuefor construction companies.
Failure costs are caused by a variety of factors.However, all involved agree that a crucial factorcontributing to the current scale of the problem is thefragmentation of responsibilities within any constructionproject and the lack of co-ordination between theorganisations involved. Indeed, clients, architects,contractors, subcontractors and end-users all have theirown objectives, and they are not necessarily in line witheach other. Moreover, with so many parties involved,miscommunication is bound to happen – and it oftendoes. Even more problematic is that for a highpercentage of construction projects, the various partiesinvolved are selected based on a tender where lowprice is the dominant factor. This increases thelikelihood that each project will begin with a completelynew group of suppliers, so learning from earliermistakes is less likely to happen. The overall result is a lack of co-ordination between the variousorganisations, which leads to failure costs of themagnitude mentioned above.
To overcome similar issues in other industries – like fast-moving consumer goods and automotives – theconcept of SCM has been successfully applied. The keyidea behind SCM is that the various parties involvedwork together for the benefit of the end-user (better,faster and at lower costs). However, there is alsooverwhelming evidence that applying SCM can lead toincreased supply chain efficiency, with lower overallcosts and increased effectiveness, so all parties involvedstand to benefit.
Source: P.B. Crosby, Cost of quality
The fact that favourable SCM benchmarking results arebeing seen in other industries – coupled with the scaleof failure costs in the construction industry – meansthat whether we can implement SCM in construction is becoming a natural focus.
Defining failure costsWithin quality management, the costs of quality (CoQ)are the costs concerned with preventing, finding andcorrecting defective work. We use Philip Crosby’sdefinition for CoQ, which refers to CoQ as the price of conformance (prevention and appraisal costs),together with the price of non-conformance (failurecosts). This means that the total CoQ consists of twomajor components: control costs and failure costs (as shown below).
Control costsPrevention costs are planned costs incurred by anorganisation to ensure that errors are not made at anystage during the process of delivering a product orservice. The process may include stages such as design,development, production, and shipping, and examplesof prevention include process control, market research,field testing, and preventative maintenance.
Appraisal costs are the costs of checking a product or service at the various stages of the process, withexamples including internal product audits, supplierevaluations and inspections.
Failure costsInternal failure costs cover all costs resulting from errorsthat are discovered before a product or service reachesthe customer. Examples include costs due to reworking,redesigning, reports about necessary corrective action,and salvage.
27697 rt EPoC:27697 EPoC rt 12/12/08 15:38 Page 29

30
External failure costs are those costs incurred when a customer finds an error. Examples include costs forreplacement products, administration, recalls, shippingcosts and customer service.
Construction-specific examples of both internal andexternal failure costs are illustrated in academic RubenVrijhoef’s diagram below, which shows failure costproblems arising at the interfaces of different parties or functions in the construction supply chain.
Financial impact of failure cost reductionConstruction is an industry where profit margins aregenerally low (eg, 2-5% for major contractors) whichmeans that losing 3-23% of contract value on failurecosts can have a massive impact. That’s why it is crucialthat these costs are brought under control.
To analyse this further, assume that the profitability of a company is measured by the yield ratio – also knownas return on investment (ROI) – which is the turnover a venture has gained as a percentage of total capital.Within this model, reducing costs influences profitmargins and increases cost-effectiveness.
To demonstrate this, we have used a DuPont chart – a simple tool that measures and presents the effect of savings on yield. In the example on the followingpage, we show the impact that a 20% reduction ininternal failure costs would have on profit margins. This example shows that a 20% reduction in failurecosts improves the profit margin from 0.02 to 0.04, andthe ROI from 0.08 to 0.16. In other words, reducing thefailure costs by 20% results in a 100% improvement inprofit margin and ROI.
Source: R. Vrijhoef, Co-makership in construction: towards construction supply chain management
Prevention better than cureIn general, control costs are preferable to failure costs.This is not only because control costs are usually lower,but also because prevention costs are usually perceivedto be positive and informative, whereas failure costs areseen as negative and associated with fire-fighting –repairing things that should not have gone wrong inthe first place. Furthermore, there is an optimal level ofCoQ that companies should aim for (see managementconsultant J.M. Juran’s graph). This shows that when a higher level of quality – towards 100% right first time– is reached, failure costs decrease. However, to achievethis, control costs do need to increase – so getting theright balance is key. The necessary investments in SCMare to be evaluated within this setting.
Source: J.M. Juran and F.M. Gryna, Quality costs: Juran’s quality control
handbook
27697 rt EPoC:27697 EPoC rt 12/12/08 15:38 Page 30

European Powers of Construction 2008 Analysis of key players and markets 31
Why use SCM?Better co-ordination between the various organisationsinvolved in a construction project – something that canbe achieved using SCM – can lead to higher efficiencyand improved effectiveness.
In their respective books, Sir M. Latham and R. Lamming state that there are two main causes forthe occurrence of failure costs:
1. Construction companies and their suppliers failing todo things right the first time.
Such failures are often caused by:
• poor control of the supply chain;
• a lack of supplier involvement during design;
• poor technical data interchange and communication; and
• a lack of standardised approaches, resulting in uneconomical solutions and costly design errors that are often not exposed until the construction phase.
2. Contractors and their suppliers being selected basedon price to complete a building, often at a stagewhen it is still not fully designed.
This encourages suppliers to win work throughsubmitting artificially low tenders and then strugglingfor profit through claims – and, if necessary, litigation– following variations to the specification.
In order to reduce failure costs, these primary issueshave to be resolved. SCM has been shown to achievegood results regarding:
• increasing control of the supply chain;
• improving exchange of information;
• joint development of products;
• increasing co-ordination; and
• increasing co-operation and mutual trust.
Therefore, applying SCM in the construction industrymight be the way to fight the causes of failure costs at every stage of the process.
The diagram below shows the causes of failure costsand their impact on different construction phases versusthe financial results of implementing SCM.
Implementing SCM implies a total shift in thinkingabout partnering. Many organisations still think thattendering (ie, cutting projects into pieces and bringingthem to market individually for quotations) delivershigher quality and lower prices. From initial costs thiscan seem to be the case, but looking at constructionprojects from a wider perspective, parties offering thelowest initial prices may not be the ones that are ableto deliver the best lifecycle costs and quality.
Situation with reduced failure costs
Original situation
Source: Adapted from C.A. Kline and H.L. Hessler, The DuPont chart system for appraising operating
performance, NACA Bulletin 33
27697 rt EPoC:27697 EPoC rt 12/12/08 15:38 Page 31
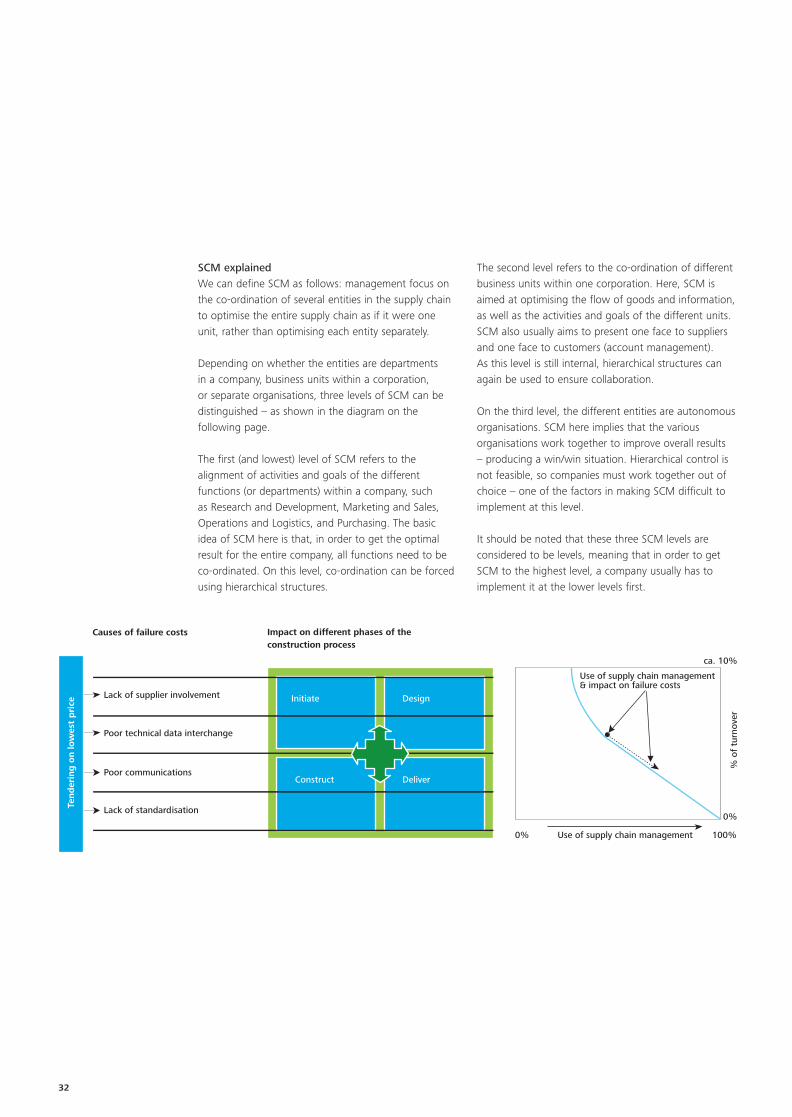
32
SCM explainedWe can define SCM as follows: management focus onthe co-ordination of several entities in the supply chainto optimise the entire supply chain as if it were oneunit, rather than optimising each entity separately.
Depending on whether the entities are departments in a company, business units within a corporation, or separate organisations, three levels of SCM can bedistinguished – as shown in the diagram on thefollowing page.
The first (and lowest) level of SCM refers to thealignment of activities and goals of the differentfunctions (or departments) within a company, such as Research and Development, Marketing and Sales,Operations and Logistics, and Purchasing. The basicidea of SCM here is that, in order to get the optimalresult for the entire company, all functions need to beco-ordinated. On this level, co-ordination can be forcedusing hierarchical structures.
The second level refers to the co-ordination of differentbusiness units within one corporation. Here, SCM isaimed at optimising the flow of goods and information,as well as the activities and goals of the different units.SCM also usually aims to present one face to suppliersand one face to customers (account management). As this level is still internal, hierarchical structures canagain be used to ensure collaboration.
On the third level, the different entities are autonomousorganisations. SCM here implies that the variousorganisations work together to improve overall results – producing a win/win situation. Hierarchical control isnot feasible, so companies must work together out ofchoice – one of the factors in making SCM difficult toimplement at this level.
It should be noted that these three SCM levels areconsidered to be levels, meaning that in order to getSCM to the highest level, a company usually has toimplement it at the lower levels first.
Causes of failure costs
Lack of supplier involvement
Impact on different phases of the construction process
Tend
erin
g o
n lo
wes
t p
rice
Poor technical data interchange
Poor communications
Lack of standardisation
Initiate Design
Construct Deliver
0% 100%Use of supply chain management
0%
% o
f tu
rnov
er
ca. 10%
Use of supply chain management & impact on failure costs
27697 rt EPoC:27697 EPoC rt 12/12/08 15:38 Page 32
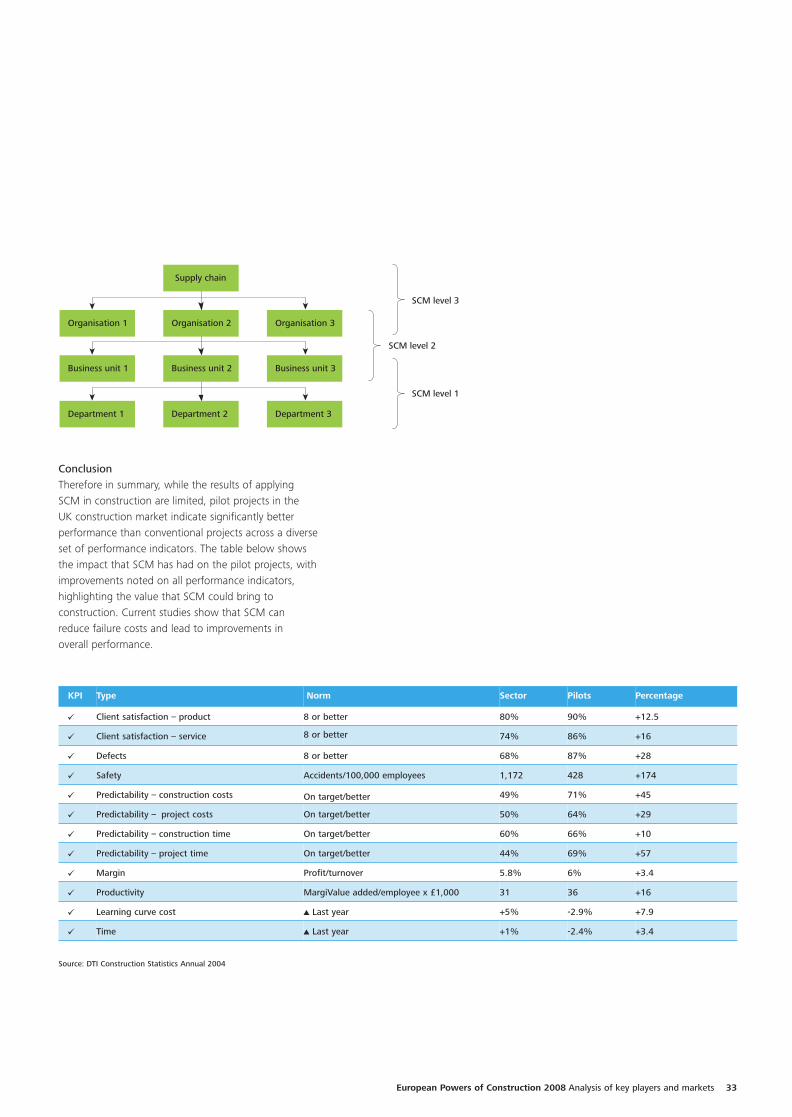
European Powers of Construction 2008 Analysis of key players and markets 33
ConclusionTherefore in summary, while the results of applyingSCM in construction are limited, pilot projects in the UK construction market indicate significantly betterperformance than conventional projects across a diverseset of performance indicators. The table below showsthe impact that SCM has had on the pilot projects, withimprovements noted on all performance indicators,highlighting the value that SCM could bring toconstruction. Current studies show that SCM canreduce failure costs and lead to improvements in overall performance.
Supply chain
Organisation 2 Organisation 3Organisation 1
Business unit 3Business unit 1
Department 2 Department 3Department 1
SCM level 3
SCM level 2
SCM level 1
Business unit 2
KPI Type Norm Sector Pilots Percentage
Client satisfaction – product 8 or better 80% 90% +12.5
Client satisfaction – service 8 or better 74% 86% +16
Defects 8 or better 68% 87% +28
Safety Accidents/100,000 employees 1,172 428 +174
Predictability – construction costs On target/better 49% 71% +45
Predictability – project costs On target/better 50% 64% +29
Predictability – construction time On target/better 60% 66% +10
Predictability – project time On target/better 44% 69% +57
Margin Profit/turnover 5.8% 6% +3.4
Productivity MargiValue added/employee x £1,000 31 36 +16
Learning curve cost Last year +5% -2.9% +7.9
Time Last year +1% -2.4% +3.4
Source: DTI Construction Statistics Annual 2004
27697 rt EPoC:27697 EPoC rt 12/12/08 15:38 Page 33
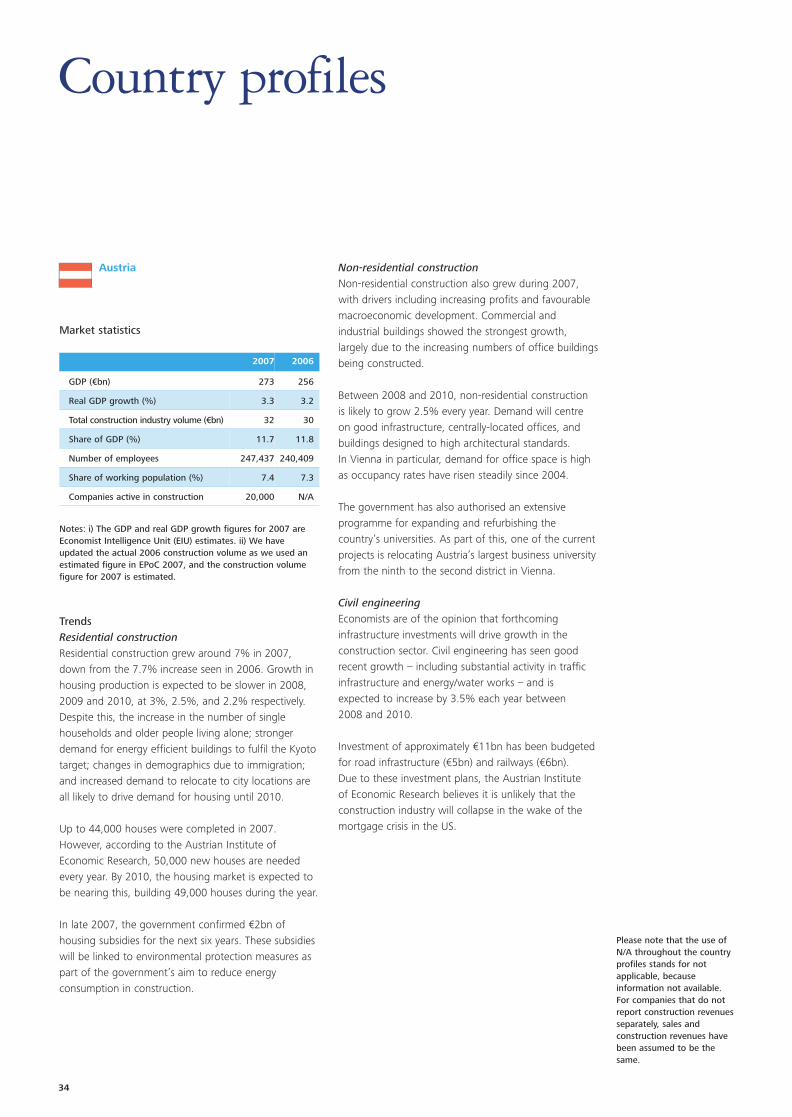
34
Austria
Market statistics
Notes: i) The GDP and real GDP growth figures for 2007 areEconomist Intelligence Unit (EIU) estimates. ii) We haveupdated the actual 2006 construction volume as we used anestimated figure in EPoC 2007, and the construction volumefigure for 2007 is estimated.
TrendsResidential constructionResidential construction grew around 7% in 2007,down from the 7.7% increase seen in 2006. Growth inhousing production is expected to be slower in 2008,2009 and 2010, at 3%, 2.5%, and 2.2% respectively.Despite this, the increase in the number of singlehouseholds and older people living alone; strongerdemand for energy efficient buildings to fulfil the Kyototarget; changes in demographics due to immigration;and increased demand to relocate to city locations areall likely to drive demand for housing until 2010.
Up to 44,000 houses were completed in 2007.However, according to the Austrian Institute ofEconomic Research, 50,000 new houses are neededevery year. By 2010, the housing market is expected tobe nearing this, building 49,000 houses during the year.
In late 2007, the government confirmed €2bn ofhousing subsidies for the next six years. These subsidieswill be linked to environmental protection measures aspart of the government’s aim to reduce energyconsumption in construction.
Country profiles
Please note that the use ofN/A throughout the countryprofiles stands for notapplicable, becauseinformation not available.For companies that do notreport construction revenuesseparately, sales andconstruction revenues havebeen assumed to be thesame.
2007 2006
GDP (€bn) 273 256
Real GDP growth (%) 3.3 3.2
Total construction industry volume (€bn) 32 30
Share of GDP (%) 11.7 11.8
Number of employees 247,437 240,409
Share of working population (%) 7.4 7.3
Companies active in construction 20,000 N/A
Non-residential constructionNon-residential construction also grew during 2007,with drivers including increasing profits and favourablemacroeconomic development. Commercial andindustrial buildings showed the strongest growth,largely due to the increasing numbers of office buildingsbeing constructed.
Between 2008 and 2010, non-residential construction is likely to grow 2.5% every year. Demand will centreon good infrastructure, centrally-located offices, andbuildings designed to high architectural standards. In Vienna in particular, demand for office space is highas occupancy rates have risen steadily since 2004.
The government has also authorised an extensiveprogramme for expanding and refurbishing thecountry’s universities. As part of this, one of the currentprojects is relocating Austria’s largest business universityfrom the ninth to the second district in Vienna.
Civil engineeringEconomists are of the opinion that forthcominginfrastructure investments will drive growth in theconstruction sector. Civil engineering has seen goodrecent growth – including substantial activity in trafficinfrastructure and energy/water works – and isexpected to increase by 3.5% each year between 2008 and 2010.
Investment of approximately €11bn has been budgetedfor road infrastructure (€5bn) and railways (€6bn). Due to these investment plans, the Austrian Institute of Economic Research believes it is unlikely that theconstruction industry will collapse in the wake of themortgage crisis in the US.
27697 rt EPoC:27697 EPoC rt 12/12/08 15:38 Page 34

European Powers of Construction 2008 Analysis of key players and markets 35
The need for investment is high, especially in the railsector. Expansion of the Western route – the railnetwork from Vienna to Munich – must take prioritybecause of bottle-necks and capacity issues on thesystem. The construction of the Koralm rail route – which will cost €5bn – is an important part of theBaltic-Adriatic corridor, as well as one of the biggestplanned infrastructure projects at present.
Major road projects on the horizon include investmentsin and around Vienna and the North-Eastern bypass,where construction is likely to start in 2009. Theexpansion of water transport via the Danube is alsoplanned, for which an additional €9m per year hasbeen budgeted.
PFI/PPP and concessionsPPPs are on the rise in Austria, mainly for transportinfrastructure projects. In the government’s programmefor 2007-2010, it sets out plans for the creation of a PPP competence centre that will draw on the powerand efficiency of the private sector and the controls of the public sector.
The Ostregion PPP scheme – a 30-year design-build-finance-operate-maintain contract worth €988m – hasbeen awarded to the Bonaventura consortium, whichcomprises Alpine Mayreder, HOCHTIEF, Egis Projects,RREEF and Meridiam. The scheme will be a network ofhighways to the North, East and South of Vienna, aswell as between Vienna and the Czech border. The project funding will be met by a combination ofequity, subordinated debt, mezzanine bonds,monocline-wrapped multiple drawdown senior bonds,and a monocline-wrapped European Investment Bank(EIB) loan.
The Summerau-Spielfeld Railway has been chosen to bethe first rail PPP by the Austrian Railway InfrastructureFinancing Association. The €840m rail link, which islikely to be completed by 2012, will improve the routefrom Summerau on the Czech border to Spielfeld onthe Slovenian border.
The government is keen to explore using the privatesector for healthcare, as well as for transport-relatedinfrastructure such as the Freudenau ContainerTerminal.
M&A activity
No Company FY endSales (€m)
Constructionrevenue (€m)
Netincome
(€m)
1 STRABAG SE Dec 07 10,746 10,746 170
2 Porr Group Dec 07 2,744 2,744 22
3 Alpine Bau GmbH Dec 07 2,595 2,595 30
4 Swietelsky Baugesellchaft Mar 07 1,277 1,277 N/A
5 Habau Group Mar 07 505 505 4
Buyer SellerUnit sold
Deal size
(€m)
Sharesought
(%)
Swietelsky Baugesellchaft Bahnbau Petri Hoch-TiefbauGesmbH & Co KG
N/A N/A 100
Top five construction companies
27697 rt EPoC:27697 EPoC rt 12/12/08 15:38 Page 35

36
Note: The GDP and real GDP growth figures for 2007 are EIUestimates.
TrendsBelgium’s GDP grew by 2.8% in 2007. The country’slarge construction and mechanical engineering industry,coupled with the ongoing construction boom, helpeddrive growth for the second year running (reaching6.8%).
However, as per Euroconstruct’s estimate, a slowdown is expected in infrastructure construction, and residentialconstruction is expected to grow at a modest 1.5% in2008. On the other hand, non-residential constructionshould hold up well with 4.1% growth, and beyond2008 both infrastructure and non-residentialconstruction should show signs of recovery.
Despite an EU directive stating that projects worth morethan €5m must be publicly-tendered, Belgian constructioncompanies have experienced little increased threat fromforeign competition. However, Belgium has long been a competitive market that plays host to a range offoreign companies, including firms from Germany,France and The Netherlands.
But out of all the European markets, the UK and TheNetherlands seem to be where the directive is workingas planned. One example is the recent achievement ofpreferred-bidder status for the Tweede Coentunnelproject – worth more than €500m – by a consortiumincluding VINCI and Belgian company CFE.
Belgium
Market statistics
PFI/PPP and concessions In Belgium, each state has its own rules and regulationsfor PPP/PFI initiatives and can develop projects in theareas for which it has responsibility. This results inseparate federal, Flemish, Walloon and Brussels-CapitalPPP markets, all evolving at different speeds and withdifferent priorities (with the Flemish region leading theway). In all of these regions, areas likely to see mostdevelopment over the next few years will be transport,environmental (with a particular focus on water), socialhousing and urban regeneration.
The following major PPP projects are under way:
• Noriant – a consortium led by France’s VINCI – hasbeen named preferred bidder for a project to design,finance, construct and maintain a 30km stretch ofring road in Antwerp. The 39-year project is expectedto begin in late 2009;
• Belgian natural gas network operator Fluxys SA andits French counterpart, GRTgaz, have signed a memorandum of understanding to build and operatea French-Belgian gas interconnector by late 2012;
• German utilities group E.on is planning to construct a coal-fired power station at Antwerp harbour with a capacity of 1,100mw. The station is expected tocost €2bn and become operational in 2014;
2007 2006
GDP (€bn) 331 314
Real GDP growth (%) 2.8 3
Total construction industry volume (€bn) 30 28
Share of GDP (%) 9.2 9
Number of employees N/A 199,000
Share of working population (%) N/A 4
Companies active in construction N/A N/A
No Company FY endSales (€m)
Constructionrevenue (€m)
Netincome
(€m)
1 Jan De Nul NV Dec 07 1,830 1,830 338
2 Besix Group Dec 07 1,560 1,560 52
3 DEME Dec 07 1,314 1,314 90
4 CFE (excluding DEME) Dec 07 811 696 62
5 Interbuild Dec 07 216 216 N/A
Top five construction companies
27697 rt EPoC:27697 EPoC rt 12/12/08 15:38 Page 36

European Powers of Construction 2008 Analysis of key players and markets 37
• Dialink, a joint venture composed of severalcompanies including CFE, has been selected to buildNorthern road and rail links at Brussels’ Zaventemairport. The design and build project, which is worthmore than €300m, should be completed in late 2011.It consists of boring a 1,080m tunnel under theairport runways, extending the existing undergroundstation, and connecting roads between the E19motorway and the airport’s cargo area; and
• a joint venture between Jan De Nul NV and Dutchconstruction company BAM has been awarded a contract to construct the Schuman-Josaphat railwaytunnel in Brussels. The contract is worth €210m andforms part of the Watermael-Schuman-Josaphatproject.
M&A activityMajor deals in 2007 included:
• the Royal BAM Group bought all of the shares inBelgian infrastructure builder Betonac, based in Sint-Truiden. Betonac has an annual turnover of some €100m and strong operating results;
• Koninklijke BAM Groep (also Royal BAM) acquiredLandsbeeck, a move that strengthened its position in the Flanders and Brussels regions. Landsbeeckspecialises in office building projects and had sales of €60m in 2006;
• Heijmans signed an agreement to acquire GroepVerbraeken, pending regulatory approval. If it goesthrough, the acquisition should reinforce Heijmans’position in the telecoms, gas, electricity and watersectors. Groep Verbraeken specialises in installingpiping and connections for gas, water and electricity;and
• CFE bought electro-technical installation firm VMAInfra-Industries and its subsidiary VMA Slovakia for€16m.
27697 rt EPoC:27697 EPoC rt 12/12/08 15:38 Page 37

38
Bulgaria
Market statistics
Bulgarian house prices increased approximately 20% in 2007. Analysts are expecting this growth to continuethrough 2008 and beyond, although at significantlylower rates.
Non-residential constructionDevelopers are showing increasing interest in buildingshopping centres, with many projects being announcedor under construction. For example, in 2007 more than14 projects were planned for Sofia alone. Developersare also beginning to face challenges around stricterlending requirements from banks and higher interestrates, but there is still no shortage of money in thesector.
There is concern that the sharp decreases in propertyprices in the UK and Ireland could affect investmentfrom these countries, so efforts are being made toattract more investment from other countries, such as Russia and Scandinavia.
Civil engineeringMajor infrastructure developments in 2007 included:
• projects worth just over €9m to refurbish and extendBourgas’ water and sewerage network, with AlpineMayreder as the contractor;
• government investment in the reconstruction ofmunicipal water mains that will service new retail andbusiness centre Varna Towers. The whole complex isexpected to cost €43m and create 1,800 jobs when it opens;
• the government has awarded two contracts worth a combined €62m to a consortium led by Spain’s FCCand High-Point Rendel. The contracts relate to theconstruction of adjacent infrastructure for a bridgethat is yet to be built over the Danube;
• construction of a 31km road, costing €11m, to formpart of a cross-border connection from Roudozem-Xanthe. The project is expected to be funded by thePhare programme for cross-border co-operation;
• Italian construction group Astaldi and the BulgarianMinistry of Transport signed a contract for the designand build of a 104km railway to connect SouthernBulgaria to Turkey. The €163m project will becompleted by 2010; and
2007 2006
GDP (€bn) 28 25
Real GDP growth (%) 6.2 6.1
Total construction industry volume (€bn) 4 3
Share of GDP (%) 14 12
Number of employees 187,600 140,600
Share of working population (%) 8 5
Companies active in construction 14,000 11,000
Note: Exchange rate used for 2007 = €1=1.96BGN.
Trends Bulgaria’s entry to the EU gave a strong boost to theconstruction industry, which recorded 17% growth in2007. The availability of EU financing for infrastructureprojects was one of the main reasons for this significantincrease, as well as strong investor interest in residentialand commercial property.
Foreign investment in the sector also continued togrow, reaching €727m in 2007 – a rise of 43% fromthe previous year. Overall, foreign direct investment(FDI) in construction accounted for 11.9% of totalforeign investment, and 2.8% of Bulgaria’s GDP.
The large-scale infrastructure projects planned for thenext few years, and the huge number of planneddevelopments across all property sub-sectors, areexpected to fuel future growth. Market analysts haveforecast growth of 12-16% per year until 2010 for theoverall sector.
Residential constructionAccording to the Bulgarian National Statistical Institute,18,864 new housing developments were completed in2007 – 42% more than the previous year. The largestnumbers of complexes were built in the seaside districts of Burgas (5,158) and Varna (3,471), while3,431 houses were built in Sofia.
27697 rt EPoC:27697 EPoC rt 12/12/08 15:38 Page 38
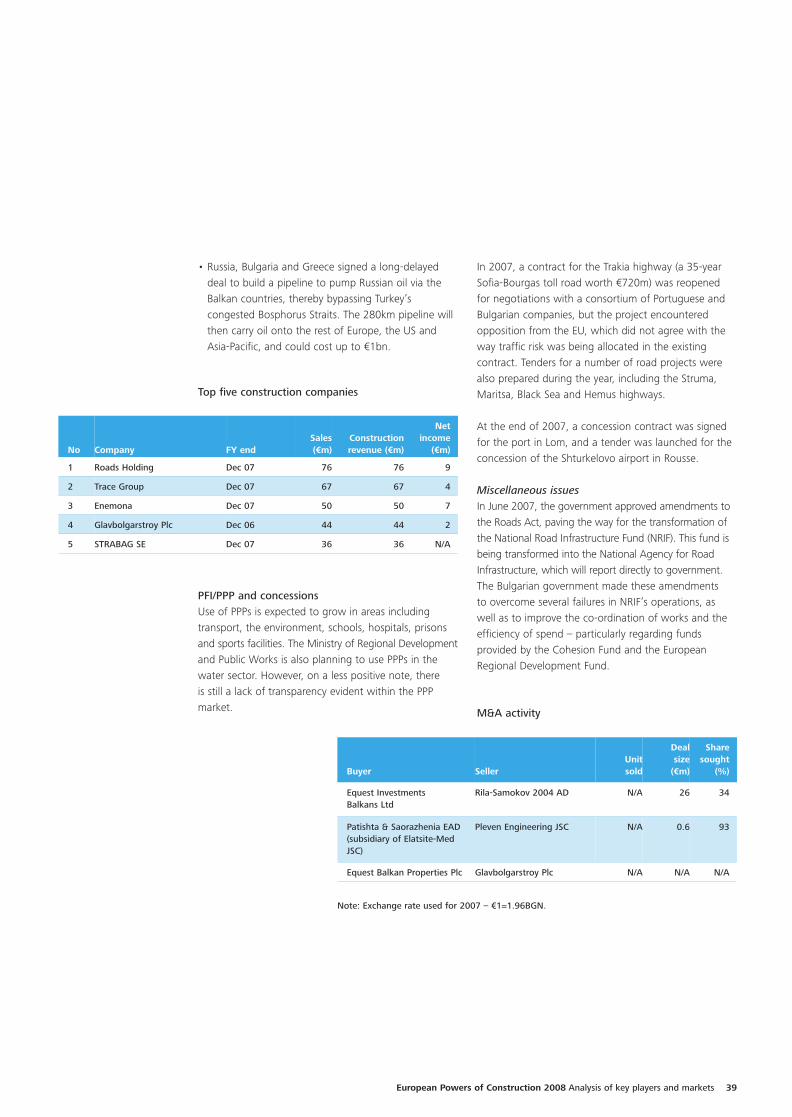
European Powers of Construction 2008 Analysis of key players and markets 39
No Company FY endSales (€m)
Constructionrevenue (€m)
Netincome
(€m)
1 Roads Holding Dec 07 76 76 9
2 Trace Group Dec 07 67 67 4
3 Enemona Dec 07 50 50 7
4 Glavbolgarstroy Plc Dec 06 44 44 2
5 STRABAG SE Dec 07 36 36 N/A
Top five construction companies
• Russia, Bulgaria and Greece signed a long-delayeddeal to build a pipeline to pump Russian oil via theBalkan countries, thereby bypassing Turkey’scongested Bosphorus Straits. The 280km pipeline willthen carry oil onto the rest of Europe, the US andAsia-Pacific, and could cost up to €1bn.
M&A activity
Buyer SellerUnit sold
Deal size
(€m)
Sharesought
(%)
Equest Investments Balkans Ltd
Rila-Samokov 2004 AD N/A 26 34
Patishta & Saorazhenia EAD(subsidiary of Elatsite-Med JSC)
Pleven Engineering JSC N/A 0.6 93
Equest Balkan Properties Plc Glavbolgarstroy Plc N/A N/A N/A
Note: Exchange rate used for 2007 – €1=1.96BGN.
PFI/PPP and concessions Use of PPPs is expected to grow in areas includingtransport, the environment, schools, hospitals, prisonsand sports facilities. The Ministry of Regional Developmentand Public Works is also planning to use PPPs in thewater sector. However, on a less positive note, there is still a lack of transparency evident within the PPPmarket.
In 2007, a contract for the Trakia highway (a 35-yearSofia-Bourgas toll road worth €720m) was reopened for negotiations with a consortium of Portuguese andBulgarian companies, but the project encounteredopposition from the EU, which did not agree with theway traffic risk was being allocated in the existingcontract. Tenders for a number of road projects werealso prepared during the year, including the Struma,Maritsa, Black Sea and Hemus highways.
At the end of 2007, a concession contract was signedfor the port in Lom, and a tender was launched for theconcession of the Shturkelovo airport in Rousse.
Miscellaneous issuesIn June 2007, the government approved amendments tothe Roads Act, paving the way for the transformation ofthe National Road Infrastructure Fund (NRIF). This fund isbeing transformed into the National Agency for RoadInfrastructure, which will report directly to government.The Bulgarian government made these amendments to overcome several failures in NRIF’s operations, aswell as to improve the co-ordination of works and theefficiency of spend – particularly regarding fundsprovided by the Cohesion Fund and the EuropeanRegional Development Fund.
27697 rt EPoC:27697 EPoC rt 12/12/08 15:38 Page 39

Construction permits 2007 2006 2005 2004 2003
Total construction permits 12,801 13,575 13,818 12,741 13,647
New construction 10,120 10,658 10,843 10,007 10,674
Reconstructions 2,681 2,917 2,975 2,734 2,973
Total building permits 11,378 12,135 12,253 11,203 11,977
New construction 8,986 9,500 9,569 8,750 9,301
Reconstructions 2,392 2,635 2,684 2,453 2,676
Civil engineering 1,423 1,440 1,565 1,538 1,670
New construction 1,134 1,158 1,274 1,257 1,373
Reconstructions 289 282 291 281 297
Construction permits (€m) 2007 2006 2005 2004 2003
Total value of permits 4,564 3,645 3,319 2,915 3,960
Building construction 3,110 2,633 2,162 1,998 1,869
Residential 1,568 1,513 1,241 1,018 1,003
Non-residential 1,542 1,120 921 980 866
Civil engineering 1,454 1,012 1,157 917 2,091
Transport 1,044 694 688 500 1,763
Telecoms, oil, transmission 289 274 339 337 294
Industrial 83 37 98 55 19
Other 38 7 31 25 15
Note: Exchange rate used for 2007 – €1=HRK7.34, for 2006 –€1=HRK7.32, for 2005 –€1=HRK7.4, for 2004 – €1=HRK7.5, and for 2003 – €1=HRK7.56.
40
Croatia
Market statistics
2007 2006
GDP (€bn) 38 35
Real GDP growth (%) 5.7 4.8
Total construction industry volume (€bn) 4 3.9
Share of GDP (%) 10.5 11.2
Number of employees 137,978 130,375
Share of working population (%) 9.3 9.1
Companies active in construction 10,806 9,185
Note: Exchange rate used for 2007 – €1=HRK7.3.
TrendsCroatia’s real GDP growth for 2007 was 5.7%, despitea fairly marked deceleration in the second half of theyear. Growth in investments and consumer spendingwere largely responsible for the economic expansion,but Croatia’s fiscal deficit remains a key problem.
In 2007, construction activity was sluggish compared to other countries in the region. The industry grewapproximately 5% to €4bn, but steady growth isexpected for the next few years.
Residential constructionIn residential construction, activities continued to centreon Zagreb and the coastal regions. The decline inconstruction permits continued in 2007, when permitsissued dropped 5% to 12,801. This was primarily due to a 6.2% fall in building permits, while civilconstruction permits fell 1.2%. However, with fewerconstruction permits being issued, the value of permitsincreased by 25% to €5bn.
Non-residential constructionThe non-residential construction sub-sector grewrobustly in 2007, with significant progress being madein office building (mainly in Zagreb), commercialbuildings, hotels (mainly on the coast), and industrialconstruction.
Civil engineeringCivil engineering, mainly consisting of motorwaydevelopment projects, represented about 60% of the totalconstruction sector during the year. Roughly 260km ofmotorways were planned for 2007/08, with preliminaryplans for a further 150km to start construction in 2009.Other key areas of planned investment are themodernisation of the railway system, the development of Zagreb airport, and the development of Rijeka port.
27697 rt EPoC:27697 EPoC rt 12/12/08 15:38 Page 40
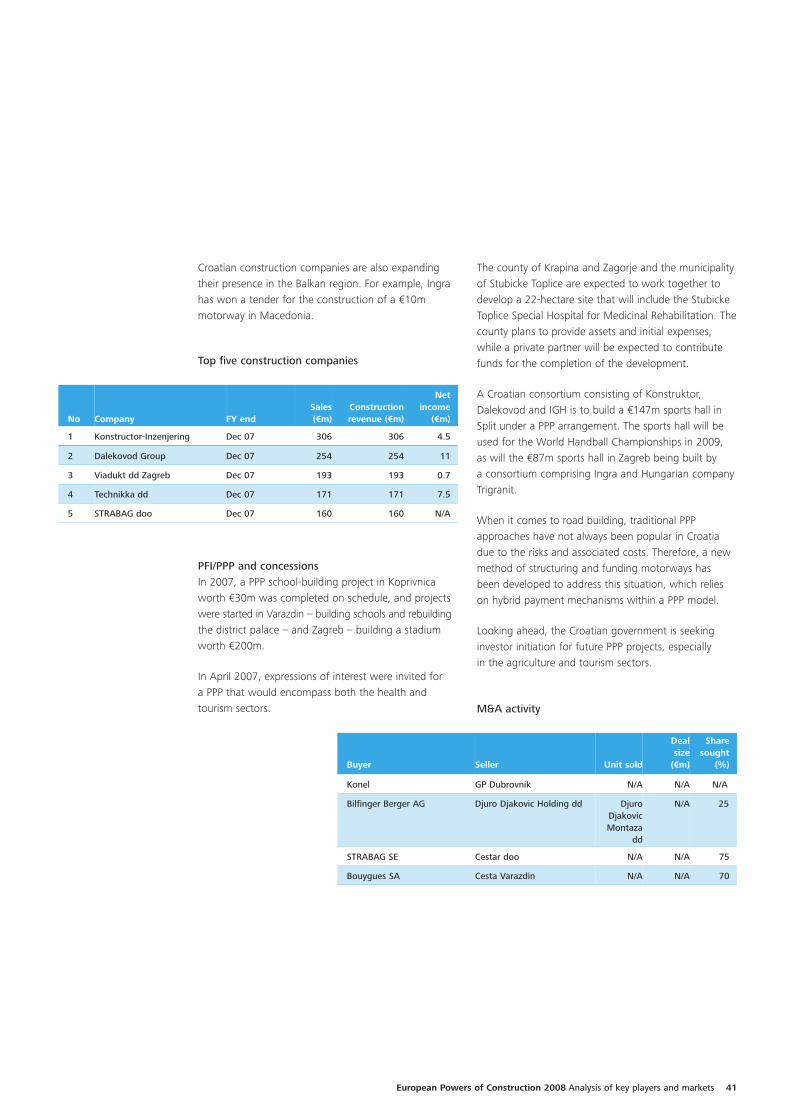
European Powers of Construction 2008 Analysis of key players and markets 41
Croatian construction companies are also expandingtheir presence in the Balkan region. For example, Ingrahas won a tender for the construction of a €10mmotorway in Macedonia.
PFI/PPP and concessionsIn 2007, a PPP school-building project in Koprivnicaworth €30m was completed on schedule, and projectswere started in Varazdin – building schools and rebuildingthe district palace – and Zagreb – building a stadiumworth €200m.
In April 2007, expressions of interest were invited for a PPP that would encompass both the health andtourism sectors.
No Company FY endSales (€m)
Constructionrevenue (€m)
Netincome
(€m)
1 Konstructor-Inzenjering Dec 07 306 306 4.5
2 Dalekovod Group Dec 07 254 254 11
3 Viadukt dd Zagreb Dec 07 193 193 0.7
4 Technikka dd Dec 07 171 171 7.5
5 STRABAG doo Dec 07 160 160 N/A
Top five construction companies
M&A activity
Buyer Seller Unit sold
Deal size
(€m)
Sharesought
(%)
Konel GP Dubrovnik N/A N/A N/A
Bilfinger Berger AG Djuro Djakovic Holding dd DjuroDjakovicMontaza
dd
N/A 25
STRABAG SE Cestar doo N/A N/A 75
Bouygues SA Cesta Varazdin N/A N/A 70
The county of Krapina and Zagorje and the municipalityof Stubicke Toplice are expected to work together todevelop a 22-hectare site that will include the StubickeToplice Special Hospital for Medicinal Rehabilitation. Thecounty plans to provide assets and initial expenses,while a private partner will be expected to contributefunds for the completion of the development.
A Croatian consortium consisting of Konstruktor,Dalekovod and IGH is to build a €147m sports hall inSplit under a PPP arrangement. The sports hall will beused for the World Handball Championships in 2009, as will the €87m sports hall in Zagreb being built by a consortium comprising Ingra and Hungarian companyTrigranit.
When it comes to road building, traditional PPPapproaches have not always been popular in Croatiadue to the risks and associated costs. Therefore, a newmethod of structuring and funding motorways hasbeen developed to address this situation, which relieson hybrid payment mechanisms within a PPP model.
Looking ahead, the Croatian government is seekinginvestor initiation for future PPP projects, especially in the agriculture and tourism sectors.
27697 rt EPoC:27697 EPoC rt 12/12/08 15:38 Page 41
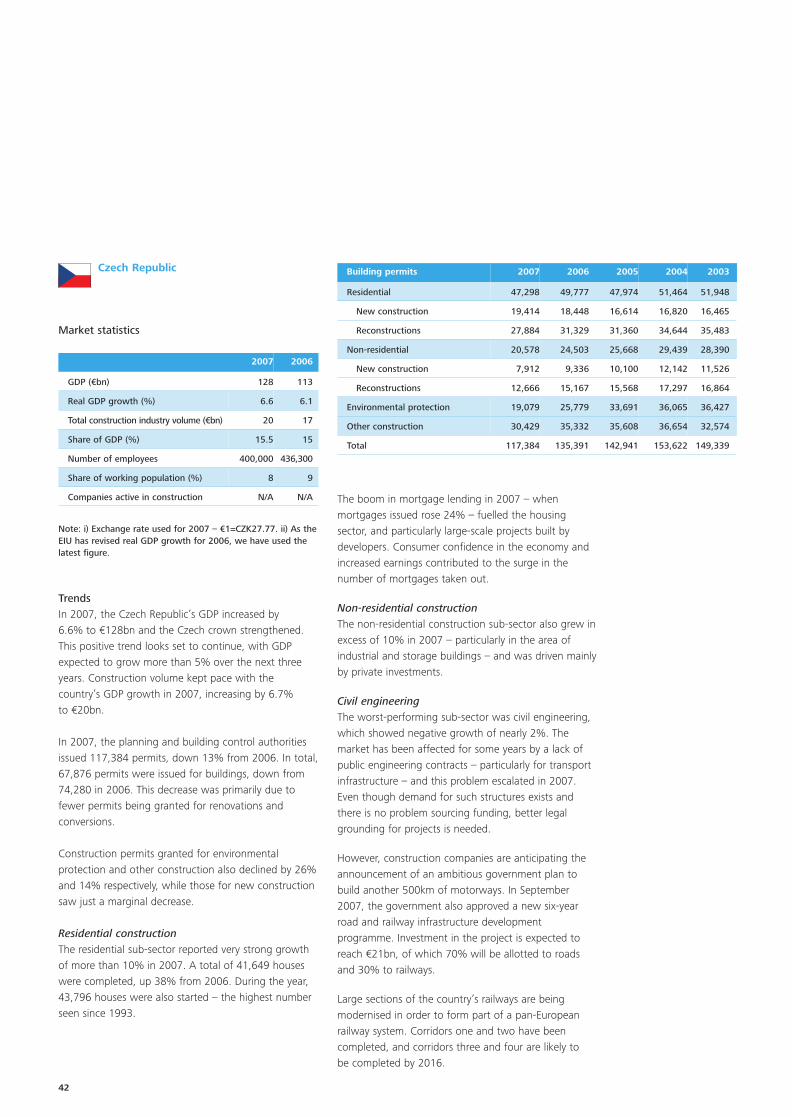
42
Czech Republic
Market statistics
2007 2006
GDP (€bn) 128 113
Real GDP growth (%) 6.6 6.1
Total construction industry volume (€bn) 20 17
Share of GDP (%) 15.5 15
Number of employees 400,000 436,300
Share of working population (%) 8 9
Companies active in construction N/A N/A
Note: i) Exchange rate used for 2007 – €1=CZK27.77. ii) As theEIU has revised real GDP growth for 2006, we have used thelatest figure.
TrendsIn 2007, the Czech Republic’s GDP increased by 6.6% to €128bn and the Czech crown strengthened. This positive trend looks set to continue, with GDPexpected to grow more than 5% over the next threeyears. Construction volume kept pace with thecountry’s GDP growth in 2007, increasing by 6.7% to €20bn.
In 2007, the planning and building control authoritiesissued 117,384 permits, down 13% from 2006. In total,67,876 permits were issued for buildings, down from74,280 in 2006. This decrease was primarily due tofewer permits being granted for renovations andconversions.
Construction permits granted for environmentalprotection and other construction also declined by 26%and 14% respectively, while those for new constructionsaw just a marginal decrease.
Residential constructionThe residential sub-sector reported very strong growthof more than 10% in 2007. A total of 41,649 houseswere completed, up 38% from 2006. During the year,43,796 houses were also started – the highest numberseen since 1993.
Building permits 2007 2006 2005 2004 2003
Residential 47,298 49,777 47,974 51,464 51,948
New construction 19,414 18,448 16,614 16,820 16,465
Reconstructions 27,884 31,329 31,360 34,644 35,483
Non-residential 20,578 24,503 25,668 29,439 28,390
New construction 7,912 9,336 10,100 12,142 11,526
Reconstructions 12,666 15,167 15,568 17,297 16,864
Environmental protection 19,079 25,779 33,691 36,065 36,427
Other construction 30,429 35,332 35,608 36,654 32,574
Total 117,384 135,391 142,941 153,622 149,339
The boom in mortgage lending in 2007 – whenmortgages issued rose 24% – fuelled the housingsector, and particularly large-scale projects built bydevelopers. Consumer confidence in the economy andincreased earnings contributed to the surge in thenumber of mortgages taken out.
Non-residential constructionThe non-residential construction sub-sector also grew inexcess of 10% in 2007 – particularly in the area ofindustrial and storage buildings – and was driven mainlyby private investments.
Civil engineeringThe worst-performing sub-sector was civil engineering,which showed negative growth of nearly 2%. Themarket has been affected for some years by a lack ofpublic engineering contracts – particularly for transportinfrastructure – and this problem escalated in 2007.Even though demand for such structures exists andthere is no problem sourcing funding, better legalgrounding for projects is needed.
However, construction companies are anticipating theannouncement of an ambitious government plan tobuild another 500km of motorways. In September2007, the government also approved a new six-yearroad and railway infrastructure developmentprogramme. Investment in the project is expected toreach €21bn, of which 70% will be allotted to roadsand 30% to railways.
Large sections of the country’s railways are beingmodernised in order to form part of a pan-Europeanrailway system. Corridors one and two have beencompleted, and corridors three and four are likely to be completed by 2016.
27697 rt EPoC:27697 EPoC rt 12/12/08 15:38 Page 42

PPP pilot schemes in the Czech Republic include: • a €30m military hospital in Prague;
• a €37m prison scheme, likely to be located inMoravia;
• two law courts, which will cost €27m and be locatedin Usti nad Labem and Karlovy Vary;
• the €67m Brno Leisure Centre;
• a €367m D3 highway project;
• a €90m campus scheme;
• the €77m Pardubice hospital; and
• the €465-€560m Aircon airport rail scheme.
In January 2007, the €765m country-wide e-toll systemcame into operation – a project that was awarded toAustrian company Kapsch in 2005.
Also during 2007, the government started preparationsfor the privatisation of Letiste Praha, the operator ofPrague-Ruzyne airport. This privatisation might beundertaken via a sale to a strategic partner, a stockmarket flotation, or a long term lease – with a salethought most likely at present.
European Powers of Construction 2008 Analysis of key players and markets 43
Going forward, EU funds of more than €800m per yearare expected towards the development of transportinfrastructure. However, administrative barriers are stillpreventing the optimum use of EU funds in the country.
In addition, the construction industry faces a lack ofskilled staff and increasing prices for energy andbuilding materials like cement, bricks and steel. Theseissues are expected to impact the quality and price ofconstruction works in the years ahead.
No CompanyFY end
Sales (€m)
Constructionrevenue (€m)
Netincome
(€m)
1 Skanska CZ AS Dec 07 1,274 1,274 46
2 Metrostav AS Dec 07 1,002 1,002 25
3 STRABAG AS Dec 07 864 864 N/A
4 Stavby silnic a zeleznic AS Dec 07 695 695 28
5 OHL ZS AS Dec 07 394 394 12
Top five construction companies
Note: Exchange rate used for 2007 – €1=CZK27.77.
M&A activity
Buyer SellerUnit sold
Deal size
(€m)
Sharesought
(%)
VINCI Energies CZ sro Jan Svoboda,Karel Hruska,Jan Jukl andPetr Dlouhy
Diprotonsro
N/A 80
Milan Janku (private individual)
Desta Holland PSJ Holding AS
N/A 50
Eiffage SA Vaclav Danek,Milan Lasak
TCHASspol. sro
N/A 90
VINCI SA Private individuals PrůmstavAS
N/A 75
Syner AS Private individuals VHSVysocina
AS
N/A 100
PFI/PPP and concessionsIn May 2007, after analysing a report prepared by theMinistry of Finance about PPPs as procurement vehicles,the government announced that it would support PPPs– along with the Czech PPP Association, PPP Centrumand other ministries.
27697 rt EPoC:27697 EPoC rt 12/12/08 15:38 Page 43

44
Denmark
Market statistics
The increase in construction and labour costs inDenmark in 2007 was the largest for 20 years.Construction costs were up 6%, while material costsrose 8% and labour costs rose 2%. Overall, totalconstruction costs have increased 96% since 1987,while materials costs have increased 92% and labourcosts 109%. The outlook for the Danish constructionindustry is weak because of the overall economicslowdown.
2007 2006
GDP (€bn) 228 220
Real GDP growth (%) 1.7 3.9
Total construction industry volume (€bn) 25 25
Share of GDP (%) 11 11
Number of employees 182,000 172,000
Share of working population (%) 6 6.2
Companies active in construction ~6,300 ~6,300
Note: Exchange rate used for 2007 – €0.1342=1DKK.
TrendsDenmark’s GDP growth slowed to 1.7% in 2007, afterthree years of strong economic performance that saw itoutstrip many of its main trading partners in the EU.Moreover, the EIU forecasts that Denmark’s GDP growthwill fall further to 0.9% in 2008, and 0.6% in 2009.
The construction industry accounts for around 11% ofDanish GDP, moving in parallel with the overallcontraction or expansion of the economy. Construction,after showing negative growth earlier in the decade,has recovered and grown at a steady pace since 2004 –alongside the country’s economic expansion. Accordingto a Euroconstruct estimate, the construction sectorgenerated total sales of €25bn in 2007, up around1.4% from the previous year.
According to Danish government statistics, around182,000 people were employed in construction in2007, compared to 172,000 in 2006 – an increase of 6%. The average household has decreased from 2.5 people in 1981 to 2.2 people in 2007, while theaverage house size has increased from 106.4m² to110.2m².
No Company FY endSales (€m)
Constructionrevenue (€m)
Netincome
(€m)
1 MT Hojgaard Dec 07 1,572 1,572 32
2 E Pihl & Son Dec 07 814 814 12
3 Per Aarsleff Sep 07 576 576 20
4 NCC Construction Dec 07 556 556 N/A
5 Skanska Denmark Dec 06 446 446 14
Top five construction companies
PFI/PPP and concessions PPP/PFI activities in Denmark remained sluggish in 2007.However, structural reforms to merge 14 counties intofive bigger regions that are responsible for healthcareand environmental issues are likely to increase PPPopportunities.
In one ongoing PPP project, the government has invitedprivate investors to finance the 18km Fehmarnbeltbridge project, linking Germany and Denmark. Theproject will cost in the region of €6bn.
M&A activityNo significant M&A activity was recorded in 2007.
27697 rt EPoC:27697 EPoC rt 12/12/08 15:38 Page 44

Top five construction companies
No Company FY endSales (€m)
Constructionrevenue (€m)
Netincome
(€m)
1 VINCI SA Dec 07 30,428 25,848 1,461
2 Bouygues SA Dec 07 29,613 21,802 1,376
3 Eiffage SA Dec 07 12,596 12,596 1,000
4 Fayat Sep 07 2,180 2,180 101
5 Spie Batignolles SA Dec 07 1,474 1,474 N/A
European Powers of Construction 2008 Analysis of key players and markets 45
France
Market statistics
This was because many households deferred theirpurchases in case any house buying incentives wereintroduced by the new president.
Demand picked up after the election and remainedbuoyant until September 2007, before slowing downdue to rising interest rates and credit becoming scarce.
Something that should provide impetus to the sluggishmarket – as well as bolstering the position of socialhousing contractors – is the government’sannouncement that social housing will increase from41,000 units in 2006 to around 142,000 by 2010.
Non-residential constructionThis sub-sector was relatively protected from theslowing market because high public spending drovegrowth in 2007 – particularly in the area of buildingnew public utilities to support population growth.According to a Deutsche Bank report, Paris’ officebuilding sub-sector – which accounts for 85% of non-residential construction – also benefited from limitedsupply and high occupancy rates, both of which drovedemand.
Public spending is expected to decline in 2008 if theFrench economy slows down in line with deterioratingfinancial conditions around the globe.
Civil engineeringThis sub-sector is highly dependent on local authoritiesbeing financially strong because they account for half ofall the civil engineering public spend in France.
2007 2006
GDP (€bn) 1,893 1,809
Real GDP growth (%) 2.1 2.4
Total construction industry volume (€bn) 155 151
Share of GDP (%) 8.5 8.4
Number of employees 1,766,800 1,684,200
Share of working population (%) 6.3 6.1
Companies active in construction N/A N/A
Trends The French construction market was one of the maindrivers behind the country’s economic growth in 2007.It grew by 2.6% – higher than the overall economicgrowth rate of 2.1% – although this was a fall from2006, when it grew 5.6%.
After four years of strong growth for Frenchconstruction overall, the industry is now facing apotential recession because of financial issueshighlighted by the sub-prime crisis. Deutsche Bankexpects a significant slowdown in the industry in 2008,predicting volume growth of only 1.4%.
Residential constructionDemand for housing was sluggish until the middle ofthe year, when the presidential election was held.
27697 rt EPoC:27697 EPoC rt 12/12/08 15:38 Page 45
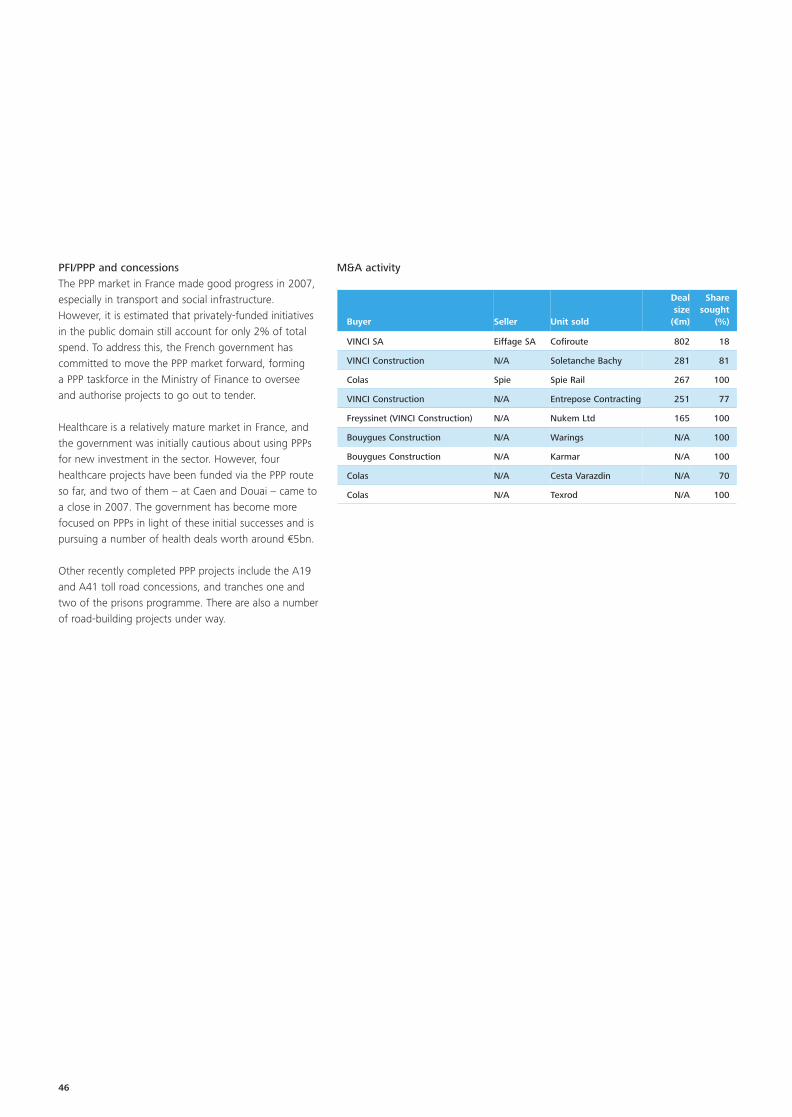
46
PFI/PPP and concessions The PPP market in France made good progress in 2007,especially in transport and social infrastructure.However, it is estimated that privately-funded initiativesin the public domain still account for only 2% of totalspend. To address this, the French government hascommitted to move the PPP market forward, forming a PPP taskforce in the Ministry of Finance to overseeand authorise projects to go out to tender.
Healthcare is a relatively mature market in France, andthe government was initially cautious about using PPPsfor new investment in the sector. However, fourhealthcare projects have been funded via the PPP routeso far, and two of them – at Caen and Douai – came toa close in 2007. The government has become morefocused on PPPs in light of these initial successes and ispursuing a number of health deals worth around €5bn.
Other recently completed PPP projects include the A19and A41 toll road concessions, and tranches one andtwo of the prisons programme. There are also a numberof road-building projects under way.
Buyer Seller Unit sold
Deal size
(€m)
Sharesought
(%)
VINCI SA Eiffage SA Cofiroute 802 18
VINCI Construction N/A Soletanche Bachy 281 81
Colas Spie Spie Rail 267 100
VINCI Construction N/A Entrepose Contracting 251 77
Freyssinet (VINCI Construction) N/A Nukem Ltd 165 100
Bouygues Construction N/A Warings N/A 100
Bouygues Construction N/A Karmar N/A 100
Colas N/A Cesta Varazdin N/A 70
Colas N/A Texrod N/A 100
M&A activity
27697 rt EPoC:27697 EPoC rt 12/12/08 15:38 Page 46
European Powers of Construction 2008 Analysis of key players and markets 47
Germany
Market statistics
Non-residential constructionNon-residential construction grew 4.9% in 2007. This was mainly due to a lack of capacity in themanufacturing sector coupled with high demand forproduction and workshop buildings, as well as retail,wholesale and warehouse premises. Demand for newoffices, on the other hand, was sluggish due to thehigh number of vacant properties. Overall, non-residential construction is expected to grow by 3.8% in 2008.
Civil engineeringIn 2007, civil engineering increased 4.2%, driven largelyby road toll revenues, and investment is likely toincrease by 3.5% during 2008.
The economic recovery in Germany resulted in improvedpublic sector revenues and, as a result, there wereindications in 2007 that the investment backlog intransport infrastructure would be addressed.
Municipalities also benefited from increasing taxrevenues, which rose to about €40bn. As municipalitiesare responsible for 60% of investments in public sectorconstruction, this improvement in their financesboosted demand.
Separately, construction companies are being affectedby the increase in building material costs. According tothe Federal Construction Industry Association, strongdemand for copper, steel and crude oil products inemerging markets such as India and China is having animpact on the price of building materials in Germany,which in turn is affecting profit margins.
Permits for building and construction work decreased24% to 188,216 in 2007, after having shown amarginal increase in 2006. Permits for construction ofnew buildings also declined 28% to 123,362 in 2007.
The decrease in monthly permits issued continued in2007, indicating a likely slowdown in constructionactivity.
2007 2006
GDP (€bn) 2,424 2,307
Real GDP growth (%) 2.5 2.7
Total construction industry volume (€bn) 89 84
Share of GDP (%) 3.7 3.6
Number of employees 2,240,000 2,237,000
Share of working population (%) 5.5 5.7
Companies active in construction N/A N/A
Note: Construction volume is calculated on the basis that itgrew 2% in 2007, as mentioned in the EIU country report fromFebruary 2008.
TrendsIn 2007, the construction industry delivered a positivecontribution to Germany’s economic growth for thesecond year running. Construction investmentexpanded by 2%, although construction industryvolume as a percentage of GDP declined to 6.2% from6.4% in 2006.
Residential constructionResidential construction activity was weak in 2007. This was largely caused by the withdrawal of tax breaksfor new home owners, and an increase in value addedtax at the start of the year.
Permits 2007 2006 2005 2004 2003
Buildings/construction work 188,216 247,830 242,102 271,944 298,787
New buildings 123,362 171,485 169,024 188,449 212,334
27697 rt EPoC:27697 EPoC rt 12/12/08 15:38 Page 47

48
PFI/PPP and concessionsThe German government generally puts majorinfrastructure projects out for tender to the privatesector. Therefore PPPs, though not yet common, maybecome more so. In July 2005, parliament passed a billto facilitate the creation of such partnerships thatallows, for example, the construction of roads byprivate companies. In April 2007, the cabinet alsopassed an investment law that would allow for thecreation of infrastructure funds to mobilise privatecapital for PPPs.
Road sector PPPs have attracted several internationalplayers to the German market because it is consideredto be a highly stable investment destination. A consortium including Bilfinger Berger (42.5%), JohannBunte (42.5%) and the UK’s John Laing (15%) won theconcession for the reconstruction of the A1 motorwayin Lower Saxony – the largest-ever PPP scheme for aGerman motorway. The design-build-finance-operatecontract is worth €650m and involves expanding 72kmof motorway from two to three lanes in each direction.
The Fluor consortium (Fluor Infrastructure BV, BAM PPP,Trapp Infra, Egis and Berger Bau) has been awarded a 30-year concession contract for the A8 motorwaybetween Augsburg and Munich. The project involvesthe reconstruction and widening of 37km of motorwayby December 2010, and the operation and maintenanceof 52km of motorway over the concession period.
PeriodTotal
Change fromprevious
year(%) Total
Change fromprevious year
(%)
2008
Feb 14,426 13 9,716 13
Jan 13,100 -1 8,553 -0.2
2007
Dec 14,535 -7 9,619 -9
Nov 14,870 -7 9,626 -9
Oct 16,215 -8 10,824 -7
Sep 15,940 -14 10,471 -14
Aug 17,367 -16 11,270 -19
Jul 17,955 -14 11,573 -15
Jun 16,727 -19 10,843 -18
May 17,434 -23 11,498 -23
Apr 15,916 -25 10,316 -30
Mar 15,194 -41 10,186 -46
Feb 12,811 -45 8,570 -51
Jan 13,252 -48 8,566 -57
Permits granted (including workon existing buildings)
Permits granted for newbuildings
Top five construction companies
No Company FY endSales (€m)
Constructionrevenue (€m)
Netincome
(€m)
1 HOCHTIEF AG Dec 07 18,773 18,773 141
2 Bilfinger Berger Dec 07 9,222 9,222 134
3 STRABAG AG Dec 07 2,142 2,142 65
4 Ed. Züblin AG Dec 07 2,128 2,128 17
5 VINCI Deutschland GmbH Dec 07 1,720 1,040 N/A
27697 rt EPoC:27697 EPoC rt 12/12/08 15:38 Page 48
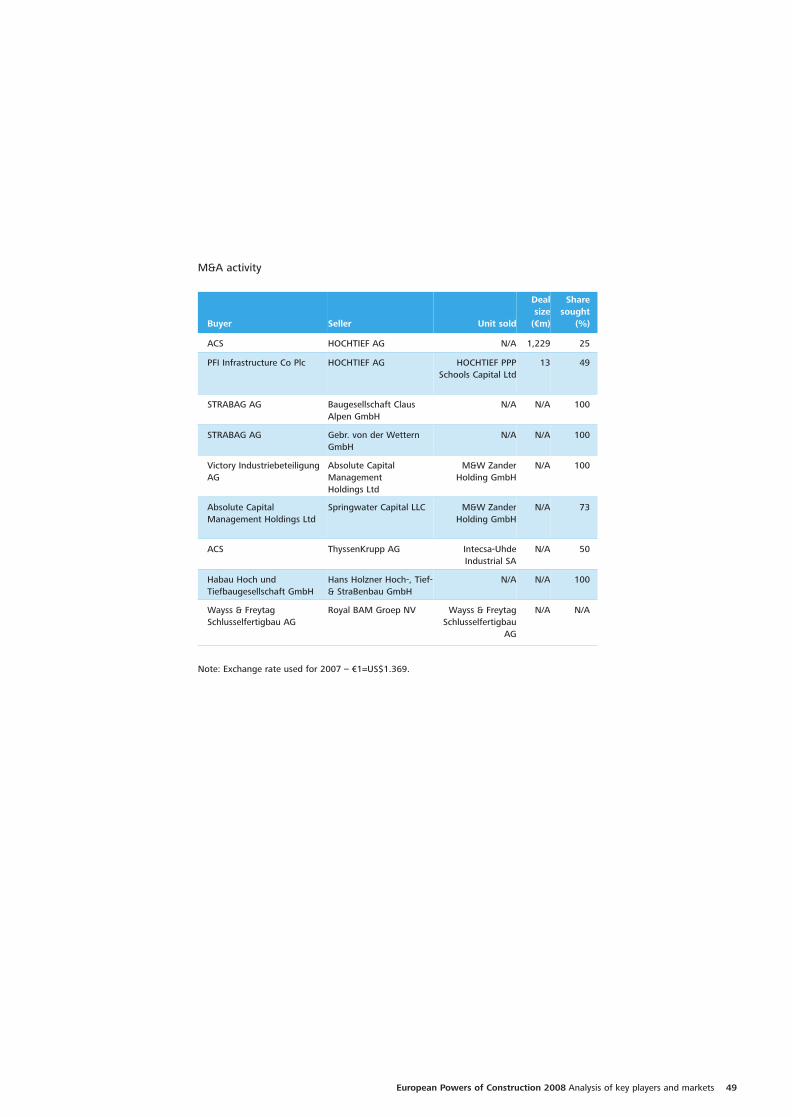
European Powers of Construction 2008 Analysis of key players and markets 49
M&A activity
Note: Exchange rate used for 2007 – €1=US$1.369.
Buyer Seller Unit sold
Deal size
(€m)
Sharesought
(%)
ACS HOCHTIEF AG N/A 1,229 25
PFI Infrastructure Co Plc HOCHTIEF AG HOCHTIEF PPPSchools Capital Ltd
13 49
STRABAG AG Baugesellschaft ClausAlpen GmbH
N/A N/A 100
STRABAG AG Gebr. von der WetternGmbH
N/A N/A 100
Victory Industriebeteiligung AG
Absolute CapitalManagement Holdings Ltd
M&W ZanderHolding GmbH
N/A 100
Absolute Capital Management Holdings Ltd
Springwater Capital LLC M&W ZanderHolding GmbH
N/A 73
ACS ThyssenKrupp AG Intecsa-UhdeIndustrial SA
N/A 50
Habau Hoch und Tiefbaugesellschaft GmbH
Hans Holzner Hoch-, Tief-& StraBenbau GmbH
N/A N/A 100
Wayss & Freytag Schlusselfertigbau AG
Royal BAM Groep NV Wayss & FreytagSchlusselfertigbau
AG
N/A N/A
27697 rt EPoC:27697 EPoC rt 12/12/08 15:38 Page 49

50
Greece
Market statistics
However, in 2008, this pressure started to ease becauseseveral new high-margin build-own-operate-transferprojects were started, and many of the low-marginprojects reached completion.
The government has signed 13 operational programmeswith the European Commission (EC) that mean Greecewill receive assistance from the EU until 2013 – €4mcoming from the Cohesion Fund, and €17bn fromStructural Funds.
The construction outlook for 2008 is positive in thecontext of the third and fourth European CommunitySupport Frameworks, under which new large-scalepublic projects are expected to be tendered.
2007 2006
GDP (€bn) 229 214
Real GDP growth (%) 4 4.3
Total construction industry volume (€bn) N/A N/A
Share of GDP (%) N/A N/A
Number of employees 399,500 368,500
Share of working population (%) 8.8 8.3
Companies active in construction N/A N/A
Notes: i) As the EIU has revised real GDP growth for 2006, wehave used the latest figure. ii) The GDP and real GDP growthfigures for 2007 are EIU estimates.
TrendsDuring the past decade, the Greek construction industryhas recorded a healthy volume increase due tocommunity funding for infrastructure improvements,and preparations for the 2004 Olympic Games.
Building activity declined in 2007 for all sub-sectors –new buildings, extensions and new houses – partlybecause construction volumes across the board havedeclined since the completion of the various Olympicprojects. There has also been a slowdown due tosignificant tender delays when awarding biginfrastructure projects. These delays were largely downto the change of ruling party after the 2004 electionsand government efforts towards minimising thecountry’s budget deficit, which led to a reduction inpublic spending. Despite this, an increasing use of PPPsfor infrastructure development is likely to counter anynegative impact.
In 2007, the government introduced a new legalframework for awarding public contracts, under whichprojects were awarded to the lowest bidder. Thisincreased competition and led construction companies– particularly smaller firms – to bid for projects atsignificantly discounted rates, thus putting pressure onmargins.
Building activity 2007 2006 2005 2004 2003 2002
New buildings 41,790 45,390 56,341 43,431 45,233 45,195
Extensions 16,604 17,541 17,596 17,175 16,774 17,143
New houses 103,865 125,368 195,206 122,135 127,008 128,236
No Company FY endSales (€m)
Constructionrevenue (€m)
Netincome
(€m)
1 Technical Olympic SA Dec 06 2,225 2,171 -218
2 Hellenic Technodomiki TEB SA Dec 07 915 810 130
3 J&P-Avax SA Dec 07 683 663 25
4 GEK Group of Companies Dec 07 446 386 38
5 Mochlos SA Dec 07 374 374 2
Top five construction companies
27697 rt EPoC:27697 EPoC rt 12/12/08 15:38 Page 50

European Powers of Construction 2008 Analysis of key players and markets 51
PPP projects under construction
PFI/PPP and concessionsThe government’s PPP committee has given the go-ahead to 18 new PPP packages worth €2bn, increasingthe total value of approved projects to €6bn. Moreover,the government is investigating the merit of tenderingnew public infrastructure projects through PPPs, such as:
• the development of a pan-Hellenic fibre opticnetwork, budgeted at €2bn;
• the renovation of peripheral airports and theconstruction of a new airport in Heracleon, Crete; and
• the extension of the Athens ring road.
The EIB extended a loan of €200m for the Korinthos-Patras-Tsakona Peloponnesian motorway and theupgrade of the Elefsina-Korinthos motorway. Thisdesign-build-finance-operate-maintain project will becarried out by Olympia Odos SA in a PPP with the Greek state.
M&A activity
Buyer Seller Unit sold
Deal size
(€m)
Sharesought
(%)
DS Constructions Ltd Aegek SA N/A 102 100
J&P-Avax SA Athena SA N/A 67 76
GEK Group of Companies Atti-Kat SA N/A 23 21
Hellenic Technodomiki TEV SA Pantechniki SA N/A 187 100
Sector Project Value (€m)
Roads Corinth-Patras-Pyrgos-Tsakona motorway 2,700
Roads E-65 Central Greece highway 1,100
Roads Corinth-Tripoli-Kalamata and Leftktro-Sparta motorways 900
Roads Malaikos to Kleidi highway 995
Roads Athens (Attika) urban projects 575
Note: Exchange rate used for 2007 – €1=251.32HUF.
27697 rt EPoC:27697 EPoC rt 12/12/08 15:38 Page 51

52
Hungary
Market statistics
Civil engineeringIn civil engineering, a significant decrease of more than10% was reported. In particular, motorway and railwayconstruction suffered major falls due to the government’sConvergence Programme. However, 52 new roaddevelopment projects are expected to be launched atthe end of 2008, which should drive an improvement in the construction sector and contribute to overallexpected growth of more than 3%.
2007 2006
GDP (€bn) 101 95
Real GDP growth (%) 1 4
Total construction industry volume (€bn) 10 11
Share of GDP (%) 10 11
Number of employees 330,000 322,000
Share of working population (%) 8.4 8
Companies active in construction N/A N/A
Note: Exchange rate used for 2007 – €1=251.32HUF.
TrendsThe Hungarian economy grew just 1.3% in 2007,largely due to the government still having structuralreforms in place to bring down its high public deficit.The economy is expected to improve from 2008, oncethe most painful reforms are out of the way. Overall,construction output fell 3% in 2007.
Residential constructionThe residential sub-sector showed growth of more than5%. Over 36,000 housing units were completed in2007, and more than 44,000 building permits wereissued for the construction of new houses. The numberof houses put to use was also 7% higher than in 2006.Finally, the government made preparations for theHungary Home Renovation Programme, which tookeffect in 2008.
Non-residential constructionThe non-residential sub-sector grew 3% in 2007. Strong growth of 6% was reported in office buildingand commercial construction, but public constructionshowed very sluggish growth during the year.
Top five construction companies
Note: Exchange rate used for 2007 – €1=251.32HUF.
PFI/PPP and concessions Hungary is one of the most advanced PPP markets inCEE, particularly in the area of road infrastructure.Several of the large motorway projects being financedunder PPP schemes (eg, the M5) have been completed.The M6 motorway from Érdi Teto to Dunaújváros – thefirst real PPP infrastructure project in Hungary – wasalso completed in 2006. Concessions company M6Duna Autópálya Koncessziós Zrt, founded in 2004 byBilfinger Berger, Porr Infrastruktur and SwietelskyInternational Baugesellschaft, won the concessiontender. This €482m project includes the construction,operation and maintenance of the motorway until 2026.
In 2007, a Bilfinger-led consortium won the tender forphase two of the M6 motorway, which is worth around€475m. The tender for phase three, which is worthapproximately €1bn, was won by a STRABAG-ledconsortium. Both of these projects will be completed byQ1 2010 and, like all Hungarian road PPPs, will be doneunder an availability fee regime.
No Company FY endSales (€m)
Constructionrevenue (€m)
Netincome
(€m)
1 STRABAG Èpítő Dec 07 614 614 N/A
2 Colas Hungary Dec 06 450 450 N/A
3 Betonùt Dec 06 403 403 8
4 Hídépítő Dec 07 372 372 12
5 Vegyépszer Dec 07 345 345 3
27697 rt EPoC:27697 EPoC rt 12/12/08 15:38 Page 52

European Powers of Construction 2008 Analysis of key players and markets 53
Also in 2007, a HOCHTIEF-led consortium took over theBudapest Ferihegy airport from BAA at an approximatecost of €2bn for a 75% share. The consortium plans toinvest €261m in the airport over the next few years.
In the large-scale infrastructure sub-sector, otheropportunities currently under discussion include theextension of the M3 motorway toward the Ukrainianborder (tender expected in Q1 2009) and the Budapestairport high-speed rail connection (Ferex). Another areathat is expected to see renewed attention is thecountry’s rail infrastructure – including the constructionof a number of high-speed tracks – but no decision hasyet been reached about how these will be financed.
The Hungarian government is also considering floatingshares from the state-owned motorway company onthe stock exchange, so that they can be accounted foroff-balance sheet and make motorway construction a more genuine PPP.
Finally, the construction of smaller-scale socialinfrastructure via PPPs – such as prisons, libraries,swimming pools, sports halls and university residences intensified in 2007 as the government started co-financing the availability payments. These projects rangefrom small-scale local swimming pools costing €5-10m,to larger prisons and dormitories costing €50-100m.
M&A activity
Buyer Seller Unit sold
Deal size
(€m)
Sharesought
(%)
Raiffeisen PPP Gmbh AAK (state motorwaymanagement company)
AKA (M5concessioncompany)
112 40
STRABAG Raiffeisen PPP Gmbh AKA (M5concessioncompany)
257 40
Hidepito VINCI N/A N/A 100
27697 rt EPoC:27697 EPoC rt 12/12/08 15:38 Page 53

54
Ireland
Market statistics
PFI/PPP and concessionsIn 2007, the National Development Plan 2007-2013was launched, forming the blueprint for futureinfrastructure and service development in Ireland. The plan is valued at around €175bn and includesapproximately €80bn of planned infrastructure spend,of which €13bn will be delivered via PPPs.
From now on, the majority of PPP procurement will bearranged using specialist agencies – NRA (roads), RPA(metro and light rail) and NDFA (health, education andjustice). With the introduction of new capital approvalguidelines, every project worth more than €23m is nowconsidered for PPP procurement, resulting in PPPsbecoming more acceptable and being considered andused for a wider range of projects.
The past year has seen PPP activity increase, with thelong-standing Metro North project being launched. The route has been selected and the four shortlistedconsortia are currently preparing detailed bids forsubmission in late 2008. However, the railway order stillneeds to be approved and planning permission grantedfor this €4bn project.
The RPA has already started work on the Metro Westand Lucan Luas light rail PPP projects. In addition, aseparate interconnector rail project in Central Dublin is being planned by Irish Rail.
Activity is also increasing in the education sector. In2008, the Schools PPP Programme – bundle one forsecondary schools – reached the preferred bidder stage,with financial closure expected in Q3 2008. Bundle two(for six new schools) went to market in Q2 2008, andbundle three is expected in late 2008/early 2009.
2007 2006
GDP (€bn) 191 176
Real GDP growth (%) 6 5.7
Total construction industry volume (€bn) 34 33
Share of GDP (%) 18 19
Number of employees 277,000 262,700
Share of working population (%) 13 2.5
TrendsThe Irish economy grew strongly in 2007, with real GDP growth increasing to 6% from 5.7% in 2006, wellahead of the European average of 2.9%. Theconstruction sector makes a significant contribution(around one fifth) to the economy and has been one of the main growth drivers in recent years.
According to a Euroconstruct estimate, Irish constructionsector volume was around €34bn in 2007 and thegrowth of the past few years started to slow due todeteriorating economic conditions.
The housing sector accounts for around 60% of allconstruction output in Ireland, and housing completionsin 2007 stood at 78,027, a 16.5% decrease from 2006.The global sub-prime crisis and rising interest rates haveled to a decline in the residential sector and stabilisedhouse prices, which had risen significantly over the pastfew years. The Construction Industry Federation haspredicted that total housing completions and thenumber of houses started will decline in 2008. As aresult, the government is expected to lose significanttax revenues. However, the civil engineering sector –and particularly road building – continued its growth in 2007 due to increased government spending.
In late 2007, there were 279,000 employees in theconstruction sector – roughly 13% of the country’sworkforce. Growth in construction employment isforecast to slow to about 3-3.5% in 2008 and fall to aslow as 1% in 2009, if the housing market continues todecline.
No Company FY end
Totalrevenue
(€m)
Constructionrevenue
(€m)
Netincome
(€m)
1 John Sisk & Sons Holdings Ltd Dec 06 1,209 1,209 N/A
2 McInerney Holdings Plc Dec 07 633 616 48
3 Michael McNamara & Co Mar 07 611 611 N/A
4 Ascon Contractors Dec 07 470 381 0.4
5 Pierse Contracting Apr 07 464 464 3
Top five construction companies
27697 rt EPoC:27697 EPoC rt 12/12/08 15:38 Page 54

European Powers of Construction 2008 Analysis of key players and markets 55
Furthermore, four bundles of third-level PPP projects arebeing developed, with the first bundle due in Q4 2008.
As the need for infrastructure increases, the volume ofnew PPP deals also increases. Strong interest from localand international bidders has continued, with mostmajor international PPP companies being involvedacross a variety of sectors.
PPP deals closed during the past year include theNational Conference Centre, the M50 upgrade, theDublin waste to energy project, and the Criminal Courtscomplex. Deals in progress include the Thornton Hallprison project, several co-located hospitals projects,bundle one of the NRA service stations project, theNational Concert Hall project, and various waste andhousing projects.
Overall, the PPP market looks to be improving rapidly,with many transactions planned. While continued focusneeds to be maintained by the public sector to ensureplanned projects reach the marketplace, this is notexpected to be a significant issue in the short tomedium term.
M&A activityNo major mergers or acquisitions took place in 2007.
27697 rt EPoC:27697 EPoC rt 12/12/08 15:38 Page 55

56
Italy
Market statistics
The extraordinary rises in the prices of iron and steel arealso causing difficulties, especially for those companiesinvolved in public construction works because theircontracts are typically negotiated years in advance. As a result, ANCE has asked the government tointervene on such price increases.
A study by Italian research company Nomisma predictsthat Italy’s construction sector will create 330,000 newjobs by 2015.
2007 2006
GDP (€bn) 1,535 1,477
Real GDP growth (%) 1.4 1.9
Total construction industry volume (€bn) 142 140
Share of GDP (%) 9.3 9.4
Number of employees 1,974,6891,949,347
Share of working population (%) 8.5 8.5
Companies active in construction N/A N/A
Notes: i) Construction volume is calculated on the basis that itgrew 2% in 2007, as mentioned in the EIU country report fromFebruary 2008. ii) Due to a lack of available information on thenumber of employees in construction, an estimate was workedout using the EIU’s overall employment figures for 2007.
TrendsResidential constructionInvestment in residential construction reached €83bn in2007, up 1.6% from 2006. New house constructioninvestment rose 0.8% to €40bn, while renovations andconversions increased 2.4% to €43bn due to theintroduction of tax reliefs.
According to a study by the Italian National StatisticsInstitute, residential construction costs rose 0.7% in thefirst quarter of 2008, compared with the last quarter of2007. This rise was mainly due to transport costs, whichwent up 1.9% in the first quarter of 2008 from theprevious quarter. Material costs also rose 2.8% andlabour costs rose 1.9% from the previous year.
According to the Italian Builders’ Association (ANCE),residential construction is expected to grow 1.3% in2008. Investment in new house construction is predictedto fall 0.1%, while renovations should increase 2.6%.
Non-residential constructionNon-residential construction investments rose just 2.8%in 2007 to €40bn, and ANCE expects a 0.3% fall ininvestment in the sector in 2008.
No Company FY end
Totalrevenue
(€m)
Constructionrevenue
(€m)
Netincome
(€m)
1 Impregilo SpA Dec 07 2,627 2,627 41
2 Snamprogetti SpA Dec 06 1,902 1,902 53
3 Astaldi SpA Dec 07 1,273 1,273 38
4 Impresa Pizzarotti Dec 07 737 737 23
5 Societa Italiana per condotted’acqua
Dec 07 729 729 9
Top five construction companies
PFI/PPP and concessionsItaly is not in a position to provide high levels of publicfunding for infrastructure development. However, itspublic debt decreased more than expected in 2007, andcredit for this positive outcome was given to theoutgoing Prodi government. It was the first time since2002 that the deficit fell below the ceiling of 3% ofGDP.
However, as the economy is likely to slow down,economists predict that it will be difficult for theBerlusconi government to build on this and bring thedeficit down further in 2008. Italy spends about €70ma year to finance its debt, which limits the resourcesavailable for growth-boosting measures.
Under these circumstances, Berlusconi’s government islikely to be a big supporter of PPPs – and it is also likelyto favour laws for private investment in infrastructure.Regarding infrastructure projects, two draft laws havebeen proposed. One of the laws aims to modify theCode of Public Contracts in order to speed up andsimplify the participation of private entities in publicworks, while the other intends to reform projectfinancing rules.
27697 rt EPoC:27697 EPoC rt 12/12/08 15:38 Page 56
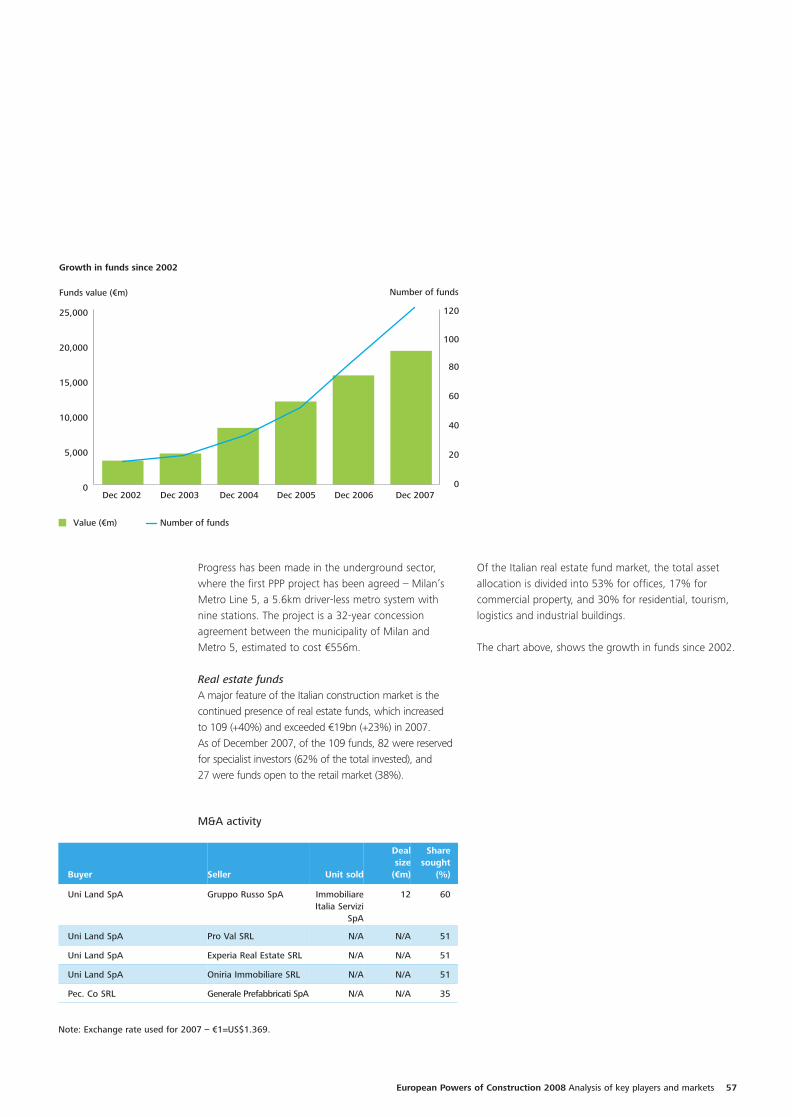
European Powers of Construction 2008 Analysis of key players and markets 57
Progress has been made in the underground sector,where the first PPP project has been agreed – Milan’sMetro Line 5, a 5.6km driver-less metro system withnine stations. The project is a 32-year concessionagreement between the municipality of Milan andMetro 5, estimated to cost €556m.
Real estate fundsA major feature of the Italian construction market is thecontinued presence of real estate funds, which increased to 109 (+40%) and exceeded €19bn (+23%) in 2007. As of December 2007, of the 109 funds, 82 were reservedfor specialist investors (62% of the total invested), and 27 were funds open to the retail market (38%).
Growth in funds since 2002
0
5,000
10,000
15,000
20,000
25,000
Funds value (€m) Number of funds
0
20
40
60
80
100
120
Value (€m) Number of funds
Dec 2002 Dec 2003 Dec 2004 Dec 2005 Dec 2006 Dec 2007
M&A activity
Buyer Seller Unit sold
Deal size
(€m)
Sharesought
(%)
Uni Land SpA Gruppo Russo SpA ImmobiliareItalia Servizi
SpA
12 60
Uni Land SpA Pro Val SRL N/A N/A 51
Uni Land SpA Experia Real Estate SRL N/A N/A 51
Uni Land SpA Oniria Immobiliare SRL N/A N/A 51
Pec. Co SRL Generale Prefabbricati SpA N/A N/A 35
Note: Exchange rate used for 2007 – €1=US$1.369.
Of the Italian real estate fund market, the total assetallocation is divided into 53% for offices, 17% forcommercial property, and 30% for residential, tourism,logistics and industrial buildings.
The chart above, shows the growth in funds since 2002.
27697 rt EPoC:27697 EPoC rt 12/12/08 15:38 Page 57
58
The Netherlands
Market statistics
Construction costs are increasing significantly as a resultof rising costs for raw materials and building materials;rising personnel costs due to labour market scarcities;and higher subcontracting costs – all of which are alsoimpacting demand for houses. Residential building costsrose 4% in 2007, while civil engineering costs rosemore than 5%, and the production volume of new non-residential buildings grew nearly 15%.
Non-residential constructionIn 2007, investment in commercial property increased.Roughly 2.1m m2 of office space was sold in TheNetherlands – almost 5% more than the previous year –as shops and business premises showed a strongrecovery and occupancy rates reached a peak of almost3m m2. The health and education sectors also startedreceiving increased government funding during the year.
Demand in the infrastructure market is developing well;production grew by approximately 3% in 2007 toaround €14bn, largely as a result of new developments,renovations and maintenance projects.
2007 2006
GDP (€bn) 567 540
Real GDP growth (%) 3.5 3.4
Total construction industry volume (€bn) 55 51
Share of GDP (%) 9.7 9.5
Number of employees 389,000 384,000
Share of working population (%) 5 5.1
Companies active in construction 85,910 81,690
TrendsThe Netherlands’ GDP was €567bn in 2007 and realGDP growth was 3.5%. Growth was driven by theexpansion of all the main market components,including building production, which rose 6% to €55bn.
Residential constructionThe residential building sector saw robust activity in2007, when 80,000 new houses were completed – anincrease of 10% from 2006. The number of new flats inparticular increased substantially at 21%.
However, there was also a significant decrease in thesale of new homes due to increasing construction costsand less favourable financing conditions. In an example,the average 5-year fixed mortgage rate has increasedfrom 3.8% in 2005 to 5.5% in 2007, illustrating thereduced borrowing capacity available.
Building permits issued during 2007 fell approximately9%, while the number of house permits issued was87,918.
Residential housing 2007 2006 2005 2004 2003
Building permits issued 87,918 96,447 83,273 76,180 72,454
Owner-occupied 64,175 72,530 64,636 58,880 56,606
Rented 23,743 23,917 18,637 17,300 15,848
Houses built 80,193 72,382 67,016 65,314 59,629
Owner-occupied 57,429 52,166 50,116 51,174 46,655
Rented 22,764 20,216 16,900 14,140 12,974
Permits – governmental andhousing corporations
25,645 22,978 22,600 20,870 18,220
No Company FY endSales (€m)
Constructionrevenue (€m)
Netincome
(€m)
1 Koninklijke BAM Groep NV Dec 07 9,322 9,322 349
2 Koninklijke Volker WesselsStevin NV
Dec 07 4,828 4,828 146
3 Heijmans NV Dec 07 3,746 3,746 56
4 Koninklijke BoskalisWestminster NV
Dec 07 1,869 1,869 204
5 TBI Holdings NV Dec 06 1,658 1,658 36
Top five construction companies
27697 rt EPoC:27697 EPoC rt 12/12/08 15:38 Page 58

European Powers of Construction 2008 Analysis of key players and markets 59
PFI/PPP and concessionsCurrent transport policy for 2010 to 2020 includesplans for total infrastructure investments of €81bn, ofwhich private funding would constitute €31bn. As partof this, the Dutch government has identified roadprojects suitable for design-build-finance-maintaintreatment, in line with its view that all transport projectsover €112m should be considered for PPP treatment.
One of the largest PPPs – the A10 Coentunnel project –has been assigned to the Coentunnel consortium,which includes local contractor Dura Vermeer, Belgianfirm Dredging International, and France’s VINCI. This isa €1bn, 30-year contract to build and manage a newtunnel under the River IJ as part of the A10 ring roadaround Amsterdam.
The Ministry of Defence has signed a contract to buildand run the Kromhout army barracks in Utrecht. This €250m project includes the development of offices,accommodation and sports facilities. A consortium –including local contractors Strukton and Ballast NedamInternational, Utrecht-based ISS, and UK equityproviders John Laing – will undertake this project.
M&A activity
Buyer Seller Unit sold
Deal size
(€m)
Sharesought
(%)
Group Air Cooling Services NV Heijmans NV Siegers ElektroNV
175 100
HOCHTIEF AG Royal BAM Group NV FlatironConstruction
Corp
N/A 100
CVC Capital Partners Ltd/ Koninklijke Volker Wessels Stevin NV
Koninklijke VolkerWessels Stevin NV
N/A N/A 43
PSJ Holding as /Janku & Vaculik Desta Holland PSJ Holding as N/A 51
Wayss & Freytag Schlusselfertigbau AG
Royal BAM Groep NV Wayss & FreytagSchlusselfertigbau
AG
N/A 100
Janssen de Jong Groep BV Koninklijke WoudenbergAmeide
N/A N/A 100
TBI Holdings BV Hopman InterheemGroep BV
N/A N/A 100
Van Wijnen Groep NV Bimo Bouw BV N/A N/A 100
27697 rt EPoC:27697 EPoC rt 12/12/08 15:38 Page 59

60
Norway
Market statistics
Non-residential construction and civil engineeringThese sub-sectors saw increased activity in 2007 – inboth the public and private sectors – largely becausedemand for commercial buildings remained high.Conversions and renovations in particular grew steadily,and an upward trend was also seen in the heavyconstruction market, which includes public road andrailway infrastructure projects. In January 2008, theroad and railway authorities submitted a draft NationalTransport Plan, including proposals to focus less on newbuildings and more on the maintenance and operationof existing buildings instead.
2007 2006
GDP (€bn) 284 267
Real GDP growth (%) 3.7 2.5
Total construction industry volume (€bn) 35 29
Share of GDP (%) 12 11
Number of employees N/A N/A
Share of working population (%) N/A N/A
Companies active in construction N/A N/A
Notes: i) As the EIU has revised real GDP growth for 2006, we have used the latest figure. ii) Exchange rate used for 2007– €1=NKr8.02.
TrendsThe country’s economic performance improved in 2007,with GDP reaching €284bn and real GDP growth of3.7%. Construction volume also increased to €35bn in2007, up from €29bn in 2006.
Residential constructionNorway’s housing market was characterised by greateruncertainty in 2007, after a sustained period of risingprices, strong demand, and high numbers of housesstarting construction. Residential construction decreasedduring the year as higher interest rates led to a drop indemand and house prices started to fall – with prices inJanuary 2008 2% lower than the same month theprevious year.
During 2007, the number of new houses being built fell2.4% to 32,520. While the inland regions reportedgrowth of 27% in 2007, Oslo and Central Norwaydeclined by 31% and 19% respectively and as a resultfewer houses are expected to be started in 2008.Apartments in cities are likely to be the most affected,while detached houses and smaller properties shouldremain stable.
Housing 2007 2006 2005 2004 2003
Buildings completed 30,970 28,554 29,544 23,609 21,405
Buildings started 32,520 33,314 31,608 29,999 23,177
Buildings under construction 38,089 37,525 33,971 33,482 28,084
The construction market in Norway is likely to show growth of 1.5% in 2008.Contributing to this growth will be the non-residential and heavy construction sub-sectors, with residential construction likely to show a fall in activity.
No Company FY endSales (€m)
Constructionrevenue (€m)
Netincome
(€m)
1 Veidekke ASA Dec 07 2,505 2,256 123
2 Skanska Norge AS Dec 06 997 997 26
3 NCC Construction AS Dec 06 603 603 8
4 AF Gruppen ASA Dec 07 691 598 22
5 BWG Homes ASA Dec 07 321 321 25
Top five construction companies
Note: Exchange rate used for 2007 – €1=NKr8.02.
27697 rt EPoC:27697 EPoC rt 12/12/08 15:38 Page 60

European Powers of Construction 2008 Analysis of key players and markets 61
Sector Project Value (€m)
Education Moster Havik School 12
Healthcare Trondheim Hospital N/A
Rail Sandness-Stavanger rail link 200
M&A activity
Buyer Seller Unit sold
Deal size
(€m)
Sharesought
(%)
NCC AB Mardahl Group MardahlPukk AS
N/A 100
VINCI SA Bremanger Quarry AS N/A N/A 23
Larsen Atteraas & Brosvik AS NCC AB AasaneByggmesterforretning AS
N/A 100
Kruse Smith AS Eco Bygg AS N/A N/A 70
PFI/PPP and concessions – pre-tender projects as at January 2007
27697 rt EPoC:27697 EPoC rt 12/12/08 15:38 Page 61
62
Note: Exchange rate used for 2007 – €1=Z13.78.
TrendsThe Polish economy continued to develop in 2007 withreal GDP growth reaching 6.6%, up from 6.1% in2006. Key drivers were low interest rates, an increase in consumer spending, and increasing interest ininvestments. Over the next few years, solid economicgrowth is expected, together with further appreciationof the zloty.
The rising affluence of Polish society and increasinglyeffective application of European funds both contributedto an increase in construction activity in 2007. Overall,construction output grew more than 12%, with similargrowth rates being achieved across the residential, non-residential and civil engineering sub-sectors. However,the sector was negatively affected by rising constructioncosts and workers’ salaries growing at more than 10%.
Poland
Market statistics
Residential constructionResidential construction showed good growth in 2007,with the number of building permits issued increasing47% to 247,700. House completions stood at 133,700– an increase of 16% from 2006, and the highest sincelevel 1992. Intense construction activity in this sub-sector was one of the reasons behind house pricesrising rapidly during the year.
High labour costs, a shortage of qualified workers,increasing material and transportation costs, and seriousequipment shortages have delayed the next round ofresidential housing investments. Labour shortages areparticularly problematic; up to 180,000 specialisedworkers have left Poland in the past two to three years,resulting in a shortage of approximately 60,000 workers.
Non-residential constructionNon-residential construction performed well in 2007,particularly in the storage, commercial and industrialsub-segments. Most of the growth came from theprivate sector, with the public sector showing limitedgrowth in comparison.
Poland’s hotel construction market is expected toincrease by two and a half times over the next five years– a necessary development to counter under-investmentin this sector in the past. Contributing factors to thispredicted increase include Poland co-hosting the Euro2012 football championships with Ukraine; the country’sfavourable economic situation; and a steady inflow offunds to aid tourism development. Demand for hotelsshould also continue to increase – the number oftourists visiting Poland is expected to rise to 20m by2012/13, up from 16m in 2006.
2007 2006
GDP (€bn) 308 271
Real GDP growth (%) 6.6 6.1
Total construction industry volume (€bn) 35 27
Share of GDP (%) 11 10
Number of employees 724,500 690,900
Share of working population (%) 5 5
Companies active in construction N/A N/A
Housing construction 2007 2006 2005
Permits issued 247,700 168,400 123,900
Buildings started 185,100 138,000 105,800
Buildings completed 133,700 115,400 114,100
27697 rt EPoC:27697 EPoC rt 12/12/08 15:38 Page 62

European Powers of Construction 2008 Analysis of key players and markets 63
Civil engineeringThe civil engineering sub-sector performed very well in2007, growing more than 10%. This growth could havebeen even higher had there not been delays in startingnew projects, owing to complicated preparationprocedures.
The Construction Programme for National Roadsestimated that the Polish government is going to spend€36bn constructing roads and motorways between2008 and 2012. The Ministry of Infrastructureannounced that work would start on the constructionof 625km of highways in 2008, and 281km ofhighways in 2009. In 2008, work on 514km ofexpressways is also starting, followed by 975km in2009, and 612km in 2010. The main sources of fundingfor these projects are expected to be the EU (mainly theCohesion Fund) and the government.
Investment of €9bn is expected in railways, stations androlling stock until 2012. This will come largely from theEU, the PKP Group, the government and privateinvestors. In 2008, the PKP Group continuedmodernising nearly 500km of a planned 1,600km ofrailroads. Other projects that will be carried out usingPKP Group funds – possibly with co-financing from thepublic sector – include Warsaw Central Station, KrakowMain Station, Wroclaw Main Station, Gdansk MainStation, and Gdynia Main Station.
Investments in airport expansion and modernisation – which are crucial in light of the increase in air trafficthat the Euro 2012 football championships will create – should reach €1bn.
No Company FY endSales (€m)
Constructionrevenue (€m)
Netincome
(€m)
1 Polimex-Mostostal SA Dec 07 984 984 31
2 Skanska SA Dec 07 859 859 38
3 Budimex SA Dec 07 813 813 3.7
4 STRABAG Sp zoo Dec 07 595 55 18
5 Mostostal Warszawa SA Dec 07 510 510 14
Top five construction companies
Note: Exchange rate used for 2007 – €1=Z13.78.
PFI/PPP and concessionsAlthough PPP legislation was adopted in 2005, only a few PPP projects have been started since then. The main reasons for this have historically included theneed for comprehensive project analysis, a lack ofknow-how and experience in the public sector; a lack of government measures to stimulate PPPdevelopments; and minimal incentives for privatepartners to invest in projects.
In 2007, many construction firms and investors weredisappointed with the rate of progress in the PPP sector.The government cancelled phase two of the A1Gdansk-Torun project in January 2007. The concessionhad been awarded to the Gdansk Transport CompanySA (GTC), and the government claimed that thecancellation was down to GTC causing a three-yeardelay.
In August 2007, the Polish roads authority (GDDKiA)issued tender documents for the A1 (Strykow-Pyrzowicesection) and the A2 (Strykow-Konotopa section) PPPprojects. Ongoing delays have hit the A1 projectbecause GDDKiA is struggling to obtain the necessaryenvironmental approvals.
Also during 2007, the government preparedamendments to current PPP legislation in order tostimulate PPP activity. The main PPP players hadpreviously blamed complex bureaucracy for long timeframes for tenders, and the small number of successfulprojects that had been completed. The amendments areexpected to be approved in 2008.
Despite initial setbacks, several large PPP infrastructureprojects are expected to be developed in connectionwith the Euro 2012 football championships. The mostanticipated projects include stadiums in Warsaw,Wrocław, Gdańsk, Poznań, Kraków and Chorzów, aswell as planned improvements to road, air and railinfrastructure. As the stadiums will continue to be usedafter the championships, the PPP route should be oneof the preferred options for carrying out these projects.
27697 rt EPoC:27697 EPoC rt 12/12/08 15:38 Page 63
64
Other PPP projects under consideration include prisonschemes and urban regeneration projects in Łódź,Sopot and Katowice, where local authorities plan torevitalise city centres in co-operation with privatepartners. Some very popular sport and leisure PPPprojects include aqua parks in Bydgoszcz, Szczecin andWągrowiec, sports centres in Kraków and Olsztyn, andstadiums in Chorzów and Łódź. PPPs are also beingused in the health sector, with examples including theWolski hospital extension and the construction of newhospitals in Warsaw and Wrocław. Finally, other PPPprojects include conference centres and car parks, suchas those in Kraków and Poznań.
Two key acquisitions stood out during 2007. First,STRABAG purchased Poland’s fourth-largest roadconstructor – NCC Poland – for €114m. NCC Poland isa subsidiary of Swedish construction company NCC.Second, Autostrade acquired a controlling stake inPolish toll road company Stalexport – concessionaire ofthe €100m Katowice-Krakow section of the A4motorway.
Note: Exchange rate used for 2007 – €1=US$1.369.
M&A activity
Buyer Seller Unit sold
Deal size
(€m)
Sharesought
(%)
Finanz Industrie Management AG
NCC AB NCC RoadsPolska Sp
zoo
114 100
ERBUD SA Budlex Sp zoo N/A 13 75
PBG SA PRID SA N/A 4 56
Projprzem SA LubuskiePrzedsiebiorstwoBudownictwaPrzemyslowego
N/A 3 100
ERBUD SA Rembet Plus Sp zoo 2 75
PBG SA Apartamenty Poznanskie N/A 0.4 51
Polimex-Mostostal Siedlce SA Zaklady RemontoweEnergetyki Lublin SA
N/A 0.3 7
Autostrade Stalexport N/A N/A N/A
COMSA Group PRK7 SA N/A N/A 9I.
Pol-Aqua SA Vectra SA N/A N/A 1í.1
Pol-Aqua SA Mostostal Pomorze SA N/A N/A 12
TUP SA PRD MPRD Sp zoo N/A N/A 96
Bouygues SA Karmar SA N/A N/A N/A
PBG SA Hydrobudowa Slask SA N/A N/A N/A
27697 rt EPoC:27697 EPoC rt 12/12/08 15:38 Page 64
European Powers of Construction 2008 Analysis of key players and markets 65
Portugal
Market statistics
The residential building sub-sector saw negative growthof 1.3% in 2007, largely due to high household debtlevels and interest rate rises. Along with civilengineering, the new residential building sub-sectorcontracted at an average annual rate of 3.5% between2004 and 2007.
In 2007, the non-residential and civil engineering sub-sectors saw negative growth of 3.8% and 4.7%respectively. In fact, between 2004 and 2007 the non-residential sub-sector shrank 6.5% on average each yeardue to under-investment.
The outlook for Portugal’s construction sector is positivebecause Euroconstruct and domestic constructioncompanies expect 2008 to be a turning point. This isbased on the expectation that the government plans toensure infrastructure investments will take priority in therun up to the 2009 elections. Important investmentsalready announced include the new international airportand the TGV railway.
According to Euroconstruct, the Portuguese constructionsector is expected to grow at a CAGR of 1.5% between2007 and 2010. Construction output is expected toincrease 0.4% in 2008, 2% in 2009, and 2.2% in 2010,and international operations should becomeincreasingly important for Portuguese constructionfirms.
TrendsThe Portuguese economy grew 1.8% in 2007, laggingbehind other European countries which grew morerapidly at an average of 2.9%. However, Portugal’sgrowth rate was slightly better than the 1.3% itrecorded in 2006.
Between 2000 and 2007 the Portuguese economy,corrected for purchasing power parity, fell by 7.3%overall, resulting in average incomes falling from 73%to 67% of the European average. The Portugueseeconomy’s sluggish performance over the past fewyears is largely due to the high budget deficit and, tosome extent, the economic underperformance ofimportant economic partners such as Germany andSpain.
The current conditions are having a serious impact onthe construction sector, an important constituent of theeconomy (representing 15% in 2007). According toEuroconstruct, Portugal’s construction sector volumewas €25bn in 2007 – a fall of 2.8% from 2006 – andconstruction sector volume decreased at a compoundannual growth rate (CAGR) of 4.1% between 2004 and2007. Significantly, investment in the constructionsector also slowed to 1.8% growth in 2007, down frommore than 6% in 2006.
2007 2006
GDP (€bn) 163 155
Real GDP growth (%) 1.8 1.3
Total construction industry volume (€bn) 24.5 25.2
Share of GDP (%) 15 16
Number of employees 570,800 553,000
Share of working population (%) 11 10
Companies active in construction >90,000 >90,000
27697 rt EPoC:27697 EPoC rt 12/12/08 15:38 Page 65
66
PFI/PPP and concessionsThe Portuguese PPP market did not make significantprogress in 2007, due to the overall slowdown in publicand private spending. This was despite the ambitioushospital programme that the government launched in2002, which included plans for 31 hospitals wortharound €21bn to be built by 2014 using a PPP model.The contracts are wide-ranging, covering the design,construction, financing, maintenance and operation ofthe buildings, and even some clinical services. There hasnot been much recent progress, but the governmentstill looks likely to stimulate activity before the 2009election.
Other PPP developments include the government’sPriority Investments in Infrastructure Plan, which callsfor almost €16bn of investment in infrastructure up to2009. However, more recent estimates suggest that thiswill lead to contracts worth as much as €40bn beingawarded between 2009 and 2018.
No Company FY endSales (€m)
Constructionrevenue (€m)
Netincome
(€m)
1 Mota-Engil Dec 07 1,402 1,049 98
2 Somague-Engenheria Dec 07 N/A 726 8
3 Teixeira Duarte Dec 07 1,012 564 122
4 Soares da Costa Dec 07 551 480 12
5 Opway Dec 07 N/A 322 1
Top five construction companies
M&A activity
Buyer SellerUnit sold
Deal size
(€m)
Sharesought
(%)
Grupo Soares da Costa SGPS SA Scuvitas Autoestrades daBeira Interior SA
N/A 56 20
Finertec-Energia e Tecnologia SGPS SA
Sociedade Construtora doTamega SGPS SA
N/A 25 41
Domingos da Silva Teixeira SA Casimiro Ribeiro & FilhosLda
N/A 5 100
Eiffage SA JJ Tome N/A N/A 51
Eiffage SA TGA SA N/A N/A 51
27697 rt EPoC:27697 EPoC rt 12/12/08 15:39 Page 66
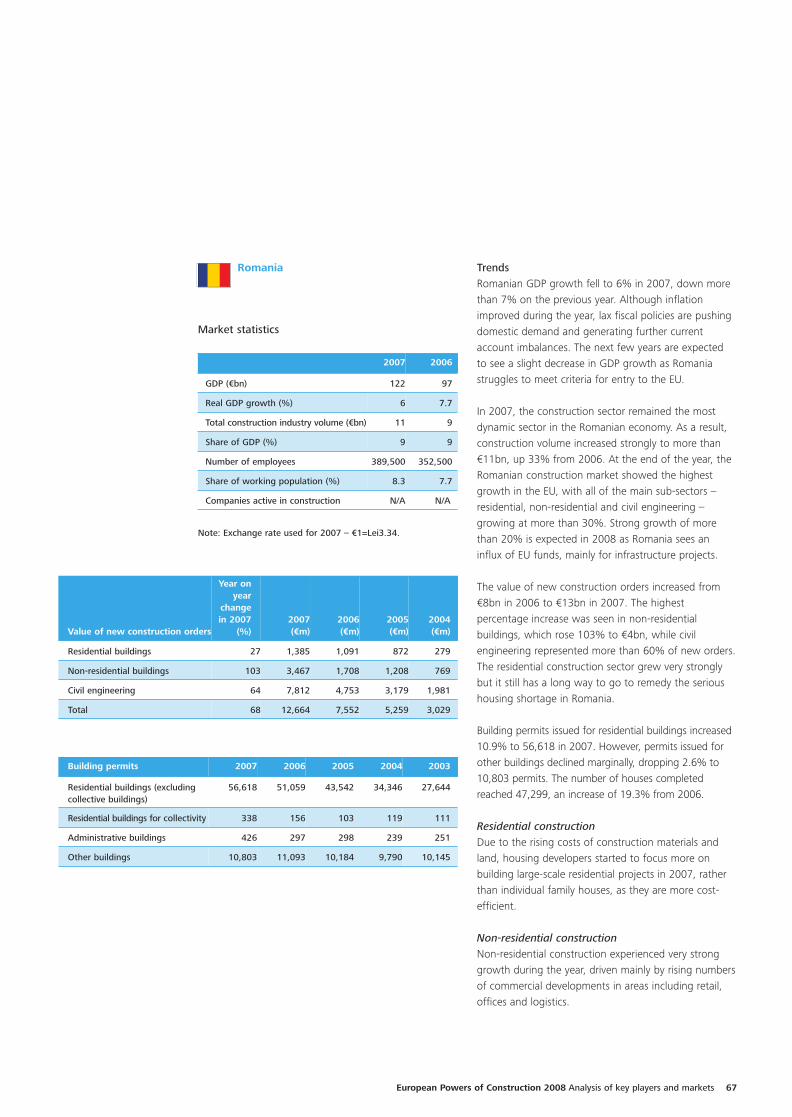
European Powers of Construction 2008 Analysis of key players and markets 67
Romania
Market statistics
TrendsRomanian GDP growth fell to 6% in 2007, down morethan 7% on the previous year. Although inflationimproved during the year, lax fiscal policies are pushingdomestic demand and generating further currentaccount imbalances. The next few years are expected to see a slight decrease in GDP growth as Romaniastruggles to meet criteria for entry to the EU.
In 2007, the construction sector remained the mostdynamic sector in the Romanian economy. As a result,construction volume increased strongly to more than€11bn, up 33% from 2006. At the end of the year, theRomanian construction market showed the highestgrowth in the EU, with all of the main sub-sectors –residential, non-residential and civil engineering –growing at more than 30%. Strong growth of morethan 20% is expected in 2008 as Romania sees aninflux of EU funds, mainly for infrastructure projects.
The value of new construction orders increased from€8bn in 2006 to €13bn in 2007. The highestpercentage increase was seen in non-residentialbuildings, which rose 103% to €4bn, while civilengineering represented more than 60% of new orders.The residential construction sector grew very stronglybut it still has a long way to go to remedy the serioushousing shortage in Romania.
Building permits issued for residential buildings increased10.9% to 56,618 in 2007. However, permits issued forother buildings declined marginally, dropping 2.6% to10,803 permits. The number of houses completedreached 47,299, an increase of 19.3% from 2006.
Residential constructionDue to the rising costs of construction materials andland, housing developers started to focus more onbuilding large-scale residential projects in 2007, ratherthan individual family houses, as they are more cost-efficient.
Non-residential constructionNon-residential construction experienced very stronggrowth during the year, driven mainly by rising numbersof commercial developments in areas including retail,offices and logistics.
2007 2006
GDP (€bn) 122 97
Real GDP growth (%) 6 7.7
Total construction industry volume (€bn) 11 9
Share of GDP (%) 9 9
Number of employees 389,500 352,500
Share of working population (%) 8.3 7.7
Companies active in construction N/A N/A
Note: Exchange rate used for 2007 – €1=Lei3.34.
Value of new construction orders
Year onyear
changein 2007
(%)2007 (€m)
2006(€m)
2005(€m)
2004(€m)
Residential buildings 27 1,385 1,091 872 279
Non-residential buildings 103 3,467 1,708 1,208 769
Civil engineering 64 7,812 4,753 3,179 1,981
Total 68 12,664 7,552 5,259 3,029
Building permits 2007 2006 2005 2004 2003
Residential buildings (excludingcollective buildings)
56,618 51,059 43,542 34,346 27,644
Residential buildings for collectivity 338 156 103 119 111
Administrative buildings 426 297 298 239 251
Other buildings 10,803 11,093 10,184 9,790 10,145
27697 rt EPoC:27697 EPoC rt 12/12/08 15:39 Page 67
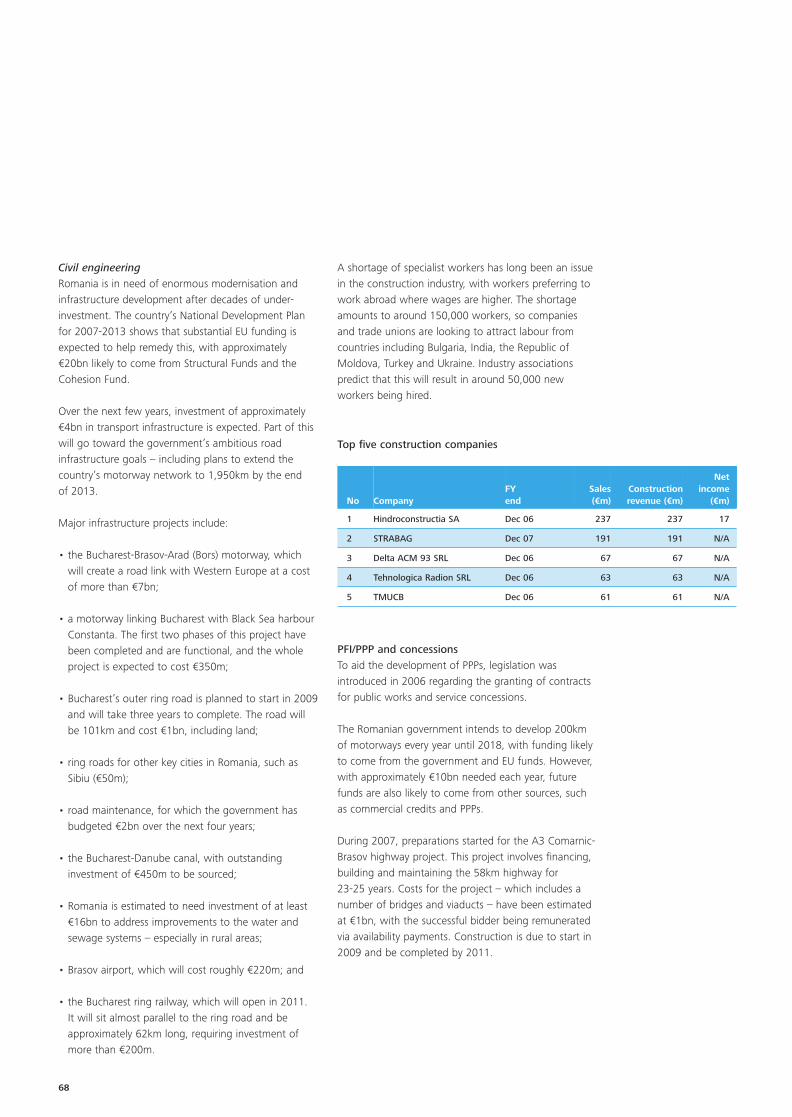
68
Civil engineeringRomania is in need of enormous modernisation andinfrastructure development after decades of under-investment. The country’s National Development Planfor 2007-2013 shows that substantial EU funding isexpected to help remedy this, with approximately€20bn likely to come from Structural Funds and theCohesion Fund.
Over the next few years, investment of approximately€4bn in transport infrastructure is expected. Part of thiswill go toward the government’s ambitious roadinfrastructure goals – including plans to extend thecountry’s motorway network to 1,950km by the end of 2013.
Major infrastructure projects include:
• the Bucharest-Brasov-Arad (Bors) motorway, whichwill create a road link with Western Europe at a costof more than €7bn;
• a motorway linking Bucharest with Black Sea harbourConstanta. The first two phases of this project havebeen completed and are functional, and the wholeproject is expected to cost €350m;
• Bucharest’s outer ring road is planned to start in 2009and will take three years to complete. The road willbe 101km and cost €1bn, including land;
• ring roads for other key cities in Romania, such asSibiu (€50m);
• road maintenance, for which the government hasbudgeted €2bn over the next four years;
• the Bucharest-Danube canal, with outstandinginvestment of €450m to be sourced;
• Romania is estimated to need investment of at least€16bn to address improvements to the water andsewage systems – especially in rural areas;
• Brasov airport, which will cost roughly €220m; and
• the Bucharest ring railway, which will open in 2011. It will sit almost parallel to the ring road and beapproximately 62km long, requiring investment ofmore than €200m.
A shortage of specialist workers has long been an issuein the construction industry, with workers preferring towork abroad where wages are higher. The shortageamounts to around 150,000 workers, so companiesand trade unions are looking to attract labour fromcountries including Bulgaria, India, the Republic ofMoldova, Turkey and Ukraine. Industry associationspredict that this will result in around 50,000 newworkers being hired.
No CompanyFY end
Sales (€m)
Constructionrevenue (€m)
Netincome
(€m)
1 Hindroconstructia SA Dec 06 237 237 17
2 STRABAG Dec 07 191 191 N/A
3 Delta ACM 93 SRL Dec 06 67 67 N/A
4 Tehnologica Radion SRL Dec 06 63 63 N/A
5 TMUCB Dec 06 61 61 N/A
Top five construction companies
PFI/PPP and concessionsTo aid the development of PPPs, legislation wasintroduced in 2006 regarding the granting of contractsfor public works and service concessions.
The Romanian government intends to develop 200kmof motorways every year until 2018, with funding likelyto come from the government and EU funds. However,with approximately €10bn needed each year, futurefunds are also likely to come from other sources, suchas commercial credits and PPPs.
During 2007, preparations started for the A3 Comarnic-Brasov highway project. This project involves financing,building and maintaining the 58km highway for 23-25 years. Costs for the project – which includes anumber of bridges and viaducts – have been estimatedat €1bn, with the successful bidder being remuneratedvia availability payments. Construction is due to start in2009 and be completed by 2011.
27697 rt EPoC:27697 EPoC rt 12/12/08 15:39 Page 68

European Powers of Construction 2008 Analysis of key players and markets 69
Romania’s Ministry of the Environment and WaterManagement plans to distribute approximately €4bn ofEU funds, with most being invested in wastemanagement and improvement of the country’s waterinfrastructure. To do this, a PPP project is already underway at Sanandrei.
Work on airport infrastructure also intensified in 2007.Several airports are in need of modernisation and thegovernment and local authorities are analysing severaloptions for achieving this. Plans include modernisingBacau’s airport – for which preparations are at anadvanced stage – and building a large new airport atVadeni with an initial investment of €300m.
M&A activity
Buyer SellerUnit sold
Deal size
(€m)
Sharesought
(%)
STRABAG ARL Cluj N/A 5 100
Euroholding Marcora Constructii N/A 12 100
Eurovia (VINCI) Viarom Construct N/A N/A 80
Grupo Prasa Silva Group N/A N/A N/A
George Becalli Arcom N/A N/A 5
Note: Exchange rate used for 2007 – €1=US$1.369.
27697 rt EPoC:27697 EPoC rt 12/12/08 15:39 Page 69
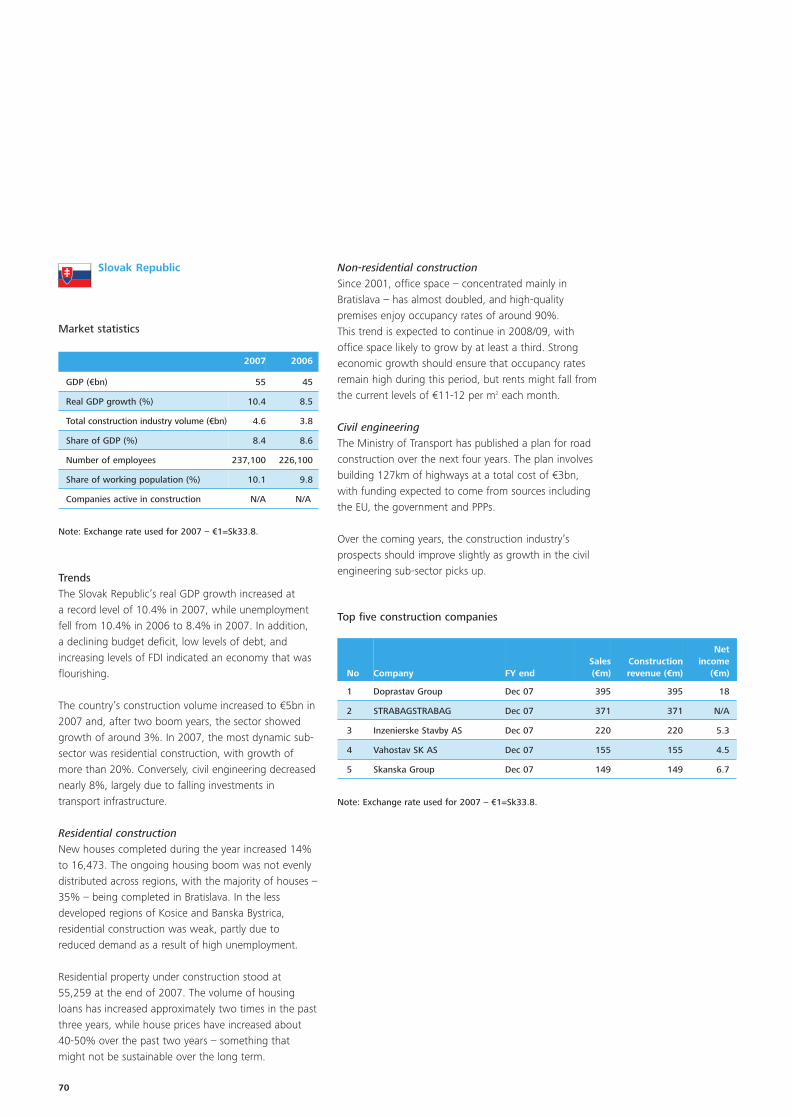
70
Slovak Republic
Market statistics
Non-residential constructionSince 2001, office space – concentrated mainly inBratislava – has almost doubled, and high-qualitypremises enjoy occupancy rates of around 90%. This trend is expected to continue in 2008/09, withoffice space likely to grow by at least a third. Strongeconomic growth should ensure that occupancy ratesremain high during this period, but rents might fall fromthe current levels of €11-12 per m2 each month.
Civil engineeringThe Ministry of Transport has published a plan for roadconstruction over the next four years. The plan involvesbuilding 127km of highways at a total cost of €3bn,with funding expected to come from sources includingthe EU, the government and PPPs.
Over the coming years, the construction industry’sprospects should improve slightly as growth in the civilengineering sub-sector picks up.
2007 2006
GDP (€bn) 55 45
Real GDP growth (%) 10.4 8.5
Total construction industry volume (€bn) 4.6 3.8
Share of GDP (%) 8.4 8.6
Number of employees 237,100 226,100
Share of working population (%) 10.1 9.8
Companies active in construction N/A N/A
Note: Exchange rate used for 2007 – €1=Sk33.8.
TrendsThe Slovak Republic’s real GDP growth increased at a record level of 10.4% in 2007, while unemploymentfell from 10.4% in 2006 to 8.4% in 2007. In addition, a declining budget deficit, low levels of debt, andincreasing levels of FDI indicated an economy that wasflourishing.
The country’s construction volume increased to €5bn in2007 and, after two boom years, the sector showedgrowth of around 3%. In 2007, the most dynamic sub-sector was residential construction, with growth ofmore than 20%. Conversely, civil engineering decreasednearly 8%, largely due to falling investments intransport infrastructure.
Residential constructionNew houses completed during the year increased 14%to 16,473. The ongoing housing boom was not evenlydistributed across regions, with the majority of houses –35% – being completed in Bratislava. In the lessdeveloped regions of Kosice and Banska Bystrica,residential construction was weak, partly due toreduced demand as a result of high unemployment.
Residential property under construction stood at 55,259 at the end of 2007. The volume of housingloans has increased approximately two times in the pastthree years, while house prices have increased about40-50% over the past two years – something thatmight not be sustainable over the long term.
Note: Exchange rate used for 2007 – €1=Sk33.8.
No Company FY endSales (€m)
Constructionrevenue (€m)
Netincome
(€m)
1 Doprastav Group Dec 07 395 395 18
2 STRABAGSTRABAG Dec 07 371 371 N/A
3 Inzenierske Stavby AS Dec 07 220 220 5.3
4 Vahostav SK AS Dec 07 155 155 4.5
5 Skanska Group Dec 07 149 149 6.7
Top five construction companies
27697 rt EPoC:27697 EPoC rt 12/12/08 15:39 Page 70

European Powers of Construction 2008 Analysis of key players and markets 71
PFI/PPP and concessionsThe Slovak Republic’s main priority is to modernise itsinfrastructure in line with the Trans-European TransportNetworks development programme. PPPs in the areasof education, healthcare and justice are also underconsideration, while a new football stadium andinfrastructure for the Ice Hockey World Championshipare needed.
Following the cancellation of plans to privatise Bratislavaairport in 2006, the Slovakian government is looking forprivate sector investment for the airport once again.
In 2007, the National Highway Company (NDS)published prior information notices for the first sectionof the D1 motorway and the R1 expressway.
Later in the year, the National Council of the SlovakRepublic passed widely-debated legislation onextraordinary measures relating to the construction ofroads and highways. The legislation should acceleratethe construction of PPP road projects because itconsiderably shortens certain time-limits for planningand building procedures.
It is also worth noting that a number of privatecompanies set up the Slovak PPP Association at the endof 2007.
Finally, the government made preparations for anelectronic tolling system network to cover 2,400km ofmotorways and main roads, and NDS was expected toannounce a preferred bidder in 2008.
M&A activityNo major M&A activity took place during 2007.
27697 rt EPoC:27697 EPoC rt 12/12/08 15:39 Page 71
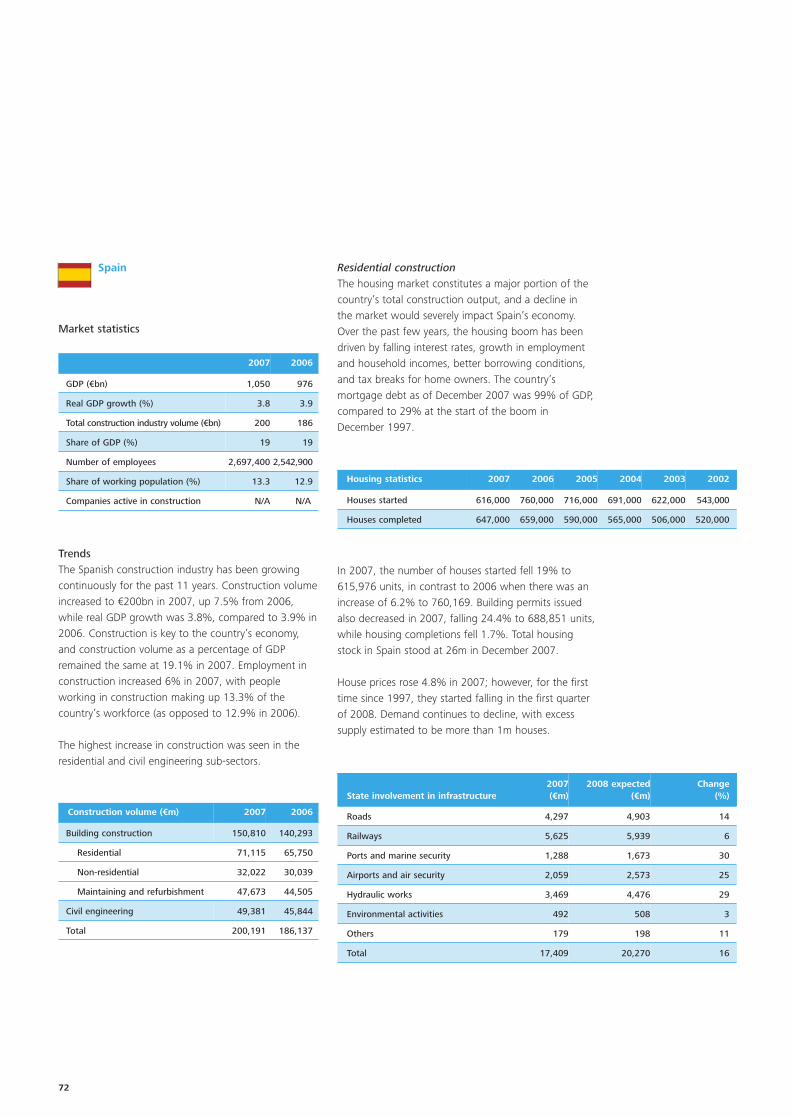
72
Spain
Market statistics
Residential constructionThe housing market constitutes a major portion of thecountry’s total construction output, and a decline in the market would severely impact Spain’s economy.Over the past few years, the housing boom has beendriven by falling interest rates, growth in employmentand household incomes, better borrowing conditions,and tax breaks for home owners. The country’smortgage debt as of December 2007 was 99% of GDP,compared to 29% at the start of the boom inDecember 1997.
2007 2006
GDP (€bn) 1,050 976
Real GDP growth (%) 3.8 3.9
Total construction industry volume (€bn) 200 186
Share of GDP (%) 19 19
Number of employees 2,697,400 2,542,900
Share of working population (%) 13.3 12.9
Companies active in construction N/A N/A
TrendsThe Spanish construction industry has been growingcontinuously for the past 11 years. Construction volumeincreased to €200bn in 2007, up 7.5% from 2006,while real GDP growth was 3.8%, compared to 3.9% in2006. Construction is key to the country’s economy,and construction volume as a percentage of GDPremained the same at 19.1% in 2007. Employment inconstruction increased 6% in 2007, with peopleworking in construction making up 13.3% of thecountry’s workforce (as opposed to 12.9% in 2006).
The highest increase in construction was seen in theresidential and civil engineering sub-sectors.
Construction volume (€m) 2007 2006
Building construction 150,810 140,293
Residential 71,115 65,750
Non-residential 32,022 30,039
Maintaining and refurbishment 47,673 44,505
Civil engineering 49,381 45,844
Total 200,191 186,137
Housing statistics 2007 2006 2005 2004 2003 2002
Houses started 616,000 760,000 716,000 691,000 622,000 543,000
Houses completed 647,000 659,000 590,000 565,000 506,000 520,000
In 2007, the number of houses started fell 19% to615,976 units, in contrast to 2006 when there was anincrease of 6.2% to 760,169. Building permits issuedalso decreased in 2007, falling 24.4% to 688,851 units,while housing completions fell 1.7%. Total housingstock in Spain stood at 26m in December 2007.
House prices rose 4.8% in 2007; however, for the firsttime since 1997, they started falling in the first quarterof 2008. Demand continues to decline, with excesssupply estimated to be more than 1m houses.
State involvement in infrastructure2007(€m)
2008 expected (€m)
Change (%)
Roads 4,297 4,903 14
Railways 5,625 5,939 6
Ports and marine security 1,288 1,673 30
Airports and air security 2,059 2,573 25
Hydraulic works 3,469 4,476 29
Environmental activities 492 508 3
Others 179 198 11
Total 17,409 20,270 16
27697 rt EPoC:27697 EPoC rt 12/12/08 15:39 Page 72

European Powers of Construction 2008 Analysis of key players and markets 73
Civil engineeringFrom 1995 to 2007, government tenders increased by15% per annum – reaching €47bn in 2007. Tenderswere largely concentrated on railways, roads, urbandevelopment, social services and hydraulic works.
Government spending in 2008 – budgeted at €20bn –is mainly focused on infrastructure and, in particular,roads and railways. These investments are set out in thegovernment’s Strategic Plan for Infrastructure andTransport (PEIT). PEIT aims to improve Spanishinfrastructure by 2020, with plans to investapproximately €249bn in total, or an annual average of€16bn. Investment of €19bn was forecast for PEITprojects in 2008, taking total investment to €65bn bythe end of the year – as opposed to initial estimates of€57bn. If this high rate of investment is maintained, thegovernment should be able to meet all of the plan’sobjectives.
Conversely, local government bodies such asmunicipalities and regional governments showedincreasing interest in using PPPs during 2007. For example, an ACS/Dragados-led consortium wasawarded a 35-year construction and maintenanceconcession for part of the CV-50 shadow toll inValencia for €98m. Municipalities and local governmentbodies also started using PPP and concession modelsfor hospitals, prisons, car parks and social infrastructure,with significant activity continuing into 2008.
M&A activityAfter several years of consolidation, 2006 and 2007saw Spain’s top five construction companiesconcentrating on diversification and globalisation. For example:
• between 2006 and 2008, ACS acquired 45% ofenergy company Unión Fenosa for €5bn, 7.2% ofenergy company Iberdrola for €3bn, and 25% ofGerman constructor HOCHTIEF for circa €1bn. Also, in December 2007, ACS’ wholly-ownedsubsidiary Dragados acquired US constructorSchiavonne for €100m;
• a consortium led by Ferrovial acquired BAA for€17bn. Since then, Ferrovial has focused ondivestments rather than acquisitions, selling itsproperty branch Ferrovial Inmobiliaria for €2bn, itsshare in Sydney airport for €600m, and its share inBudapest airport for €1bn;
• Acciona acquired 25% of Spanish energy companyEndesa for €9bn. This acquisition required a publicoffer, jointly-launched in March 2007 with Italianenergy company Enel;
• FCC invested more than €4bn in acquisitions between2006 and 2007, including most notably the Spanishcement group Corporación Uniland for €1bn, Austrianconstructor Alpine for €480m, UK company WRG for€2bn, Austrian waste management company ASA for€230m, and Czech water company Svmak for €170m;and
• after making good investments in 2006 (buying 33%of French company Eiffage for €2bn and 20% ofRepsol YPF SA for €7bn), Sacyr was not involved inany significant M&A activities in 2007.
No CompanyFY end
Sales (€m)
Constructionrevenue (€m)
Netincome
(€m)
1 Grupo Ferrovial SA Dec 07 14,630 14,630 734
2 ACS Dec 07 21,312 7,389 1,551
3 FCC Dec 07 13,881 6,957 738
4 Sacyr Vallehermoso SA Dec 07 5,760 4,863 946
5 Obrascon Huarte Lain SA Dec 07 3,764 3,648 140
Top five construction companies
PFI/PPP and concessionsOf the €249bn PEIT budget, 40% will be accounted forby PPPs. A major portion of that will be spent onrailways and roads – amounting to €109bn and €63bnrespectively – while airports and ports will constitute6.3% and 9.4% respectively.
Although PEIT investments during 2007 were 15%ahead of plan, PPP investments were 6% below planbecause the government is not strongly endorsing PPPschemes. The main contracts awarded in 2007 wereeight 20-year concessions totalling approximately €3mfor the renewal and maintenance of the so-called FirstGeneration Highways.
27697 rt EPoC:27697 EPoC rt 12/12/08 15:39 Page 73

74
Buyer Seller Unit sold
Deal size
(€m)
Sharesought
(%)
Dico, Harinsa and Obrum Merger between threecompanies
Merger 297 100
Grupo Sando Agofer SL N/A 215 100
Obras Publicas e Cimento Armado SA
Sarrion SA N/A 95 70
Note: Exchange rate used for 2007 – €1=US$1.369.
Other significant M&A deals include:
27697 rt EPoC:27697 EPoC rt 12/12/08 15:39 Page 74
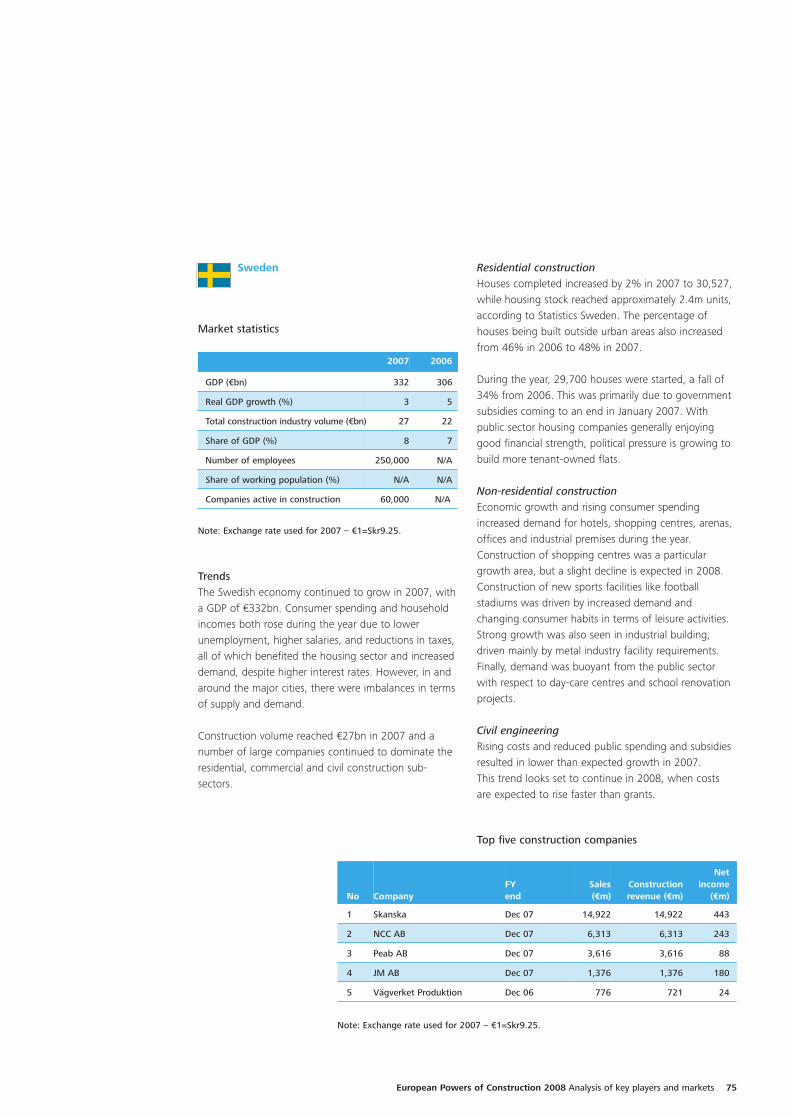
European Powers of Construction 2008 Analysis of key players and markets 75
Sweden
Market statistics
Residential constructionHouses completed increased by 2% in 2007 to 30,527,while housing stock reached approximately 2.4m units,according to Statistics Sweden. The percentage ofhouses being built outside urban areas also increasedfrom 46% in 2006 to 48% in 2007.
During the year, 29,700 houses were started, a fall of34% from 2006. This was primarily due to governmentsubsidies coming to an end in January 2007. Withpublic sector housing companies generally enjoyinggood financial strength, political pressure is growing tobuild more tenant-owned flats.
Non-residential constructionEconomic growth and rising consumer spendingincreased demand for hotels, shopping centres, arenas,offices and industrial premises during the year.Construction of shopping centres was a particulargrowth area, but a slight decline is expected in 2008.Construction of new sports facilities like footballstadiums was driven by increased demand andchanging consumer habits in terms of leisure activities.Strong growth was also seen in industrial building,driven mainly by metal industry facility requirements.Finally, demand was buoyant from the public sectorwith respect to day-care centres and school renovationprojects.
Civil engineeringRising costs and reduced public spending and subsidiesresulted in lower than expected growth in 2007. This trend looks set to continue in 2008, when costs are expected to rise faster than grants.
2007 2006
GDP (€bn) 332 306
Real GDP growth (%) 3 5
Total construction industry volume (€bn) 27 22
Share of GDP (%) 8 7
Number of employees 250,000 N/A
Share of working population (%) N/A N/A
Companies active in construction 60,000 N/A
Note: Exchange rate used for 2007 – €1=Skr9.25.
TrendsThe Swedish economy continued to grow in 2007, witha GDP of €332bn. Consumer spending and householdincomes both rose during the year due to lowerunemployment, higher salaries, and reductions in taxes,all of which benefited the housing sector and increaseddemand, despite higher interest rates. However, in andaround the major cities, there were imbalances in termsof supply and demand.
Construction volume reached €27bn in 2007 and anumber of large companies continued to dominate theresidential, commercial and civil construction sub-sectors.
No CompanyFY end
Sales (€m)
Constructionrevenue (€m)
Netincome
(€m)
1 Skanska Dec 07 14,922 14,922 443
2 NCC AB Dec 07 6,313 6,313 243
3 Peab AB Dec 07 3,616 3,616 88
4 JM AB Dec 07 1,376 1,376 180
5 Vägverket Produktion Dec 06 776 721 24
Top five construction companies
Note: Exchange rate used for 2007 – €1=Skr9.25.
27697 rt EPoC:27697 EPoC rt 12/12/08 15:39 Page 75

76
The government has announced plans to allocate moreinvestment to infrastructure projects in its autumnbudget. Projects include parts of the E22 in Skane, theHjulsta-Kista project in Stockholm, and a further railwayproject.
PFI/PPP and concessionsThe Swedish government has tended to financeinfrastructure projects themselves. As a result, theprojects that have been proposed by the Swedish RoadAdministration (Vägverket) and Swedish RailAdministration (Banverket) as suitable for PPP areunlikely to be financed in this way.
M&A activity
Buyer Seller Unit sold
Deal size
(€m)
Sharesought
(%)
STRABAG Oesterreich AG NCC AB NCC RoadsPolska Sp
zoo
114 100
AF Gruppen ASA JK Bygg i Goteborg AB N/A 8 32
Ittur Koncernen Tallasens Bygg i RudaAB
N/A N/A 100
Bravida Jibex El AB N/A N/A 100
Wolseley Plc Pieter MartinssonAB/Klas BerntssonInvest AB/ Per Stellan AB
Save TraForsaljnings
AB
N/A 100
Asane Byggmesterforretning AS/Atteras
NCC AB AsaneByggmesterforretning AS
N/A 100
Peab AB GeoDells Byggnads AB N/A N/A 100
Note: Exchange rate used for 2007 – €1=US$1.369.
27697 rt EPoC:27697 EPoC rt 12/12/08 15:39 Page 76

European Powers of Construction 2008 Analysis of key players and markets 77
Turkey
Market statistics
In 2007, Turkey was focused on the general electionand various other socio-political events. This resulted insome important economic issues and structural reformsbeing postponed for the next few years, such as severalmajor infrastructure projects led by the public sector. As a result, growth in public sector spending alsoslowed to 5.2% in 2007, compared to 10.4% in 2006.Growth in private sector spending slowed even moresignificantly to 6.3% in 2007, down from 20.3% in2006.
The outlook for the Turkish construction sector isuncertain as reduced liquidity, coupled with increasedloan costs, is expected to further slow growth.However, the structural reforms that were postponed in2007 are expected to be resurrected during 2008, soinfrastructure, energy, and transportation projects areexpected to provide impetus to the sector.
2007 2006
GDP (€bn) 480 423
Real GDP growth (%) 4.5 6.9
Total construction industry volume (€bn) 24 20
Share of GDP (%) 5 4.7
Number of employees 1,258,345 1,160,150
Share of working population (%) 5.5 5
Companies active in construction N/A N/A
TrendsThe global economic downturn seems to have affectedthe Turkish economy as GDP grew at a rate of 4.5% in2007, compared to 6.9% in 2006. Also, inflationreached almost double the targeted rate, and thebudget deficit outstripped that of 2006. However, overthe past five years, the country’s GDP has more thandoubled and Turkey has become the 17th largesteconomy in the world. In 2008, Turkey’s GDP is forecastto grow at 5.5%, well ahead of the EU average.
The buoyancy of the Turkish economy in recent yearshas been driven by strong growth in the constructionand industrial sectors. The construction boom of thepast few years did start to slow in 2007 (with theindustry growing 5.4% and then just 0.5% in Q3 andQ4 of 2007) as a result of the global sub-prime crisis.However, the rapid population increase and the needfor earthquake-resistant housing projects ensuredoverall growth and construction volume reached €24bn during the year, up from €20bn in 2006.
Note: Exchange rate used for 2007 – €1=YTL1.784.
27697 rt EPoC:27697 EPoC rt 12/12/08 15:39 Page 77

78
PFI/PPP and concessionsNo significant PPP projects are currently under way inthe construction market. However, the government isbroadening the law on the build-operate-transfer modelto include a wider range of projects, as well as allowingforeign companies to work on construction projects.
M&A activityNo significant M&A activity took place in 2007.
No CompanyFY end
Sales (€m)
Constructionrevenue (€m)
Netincome
(€m
1 Enka Insaat ve Sanayi AS Dec 07 3,847 3,847 418
2 Tefken Holding Dec 07 1,062 577 157
3 Gama Holding Dec 06 505 505 N/A
4 Alarko Holding Dec 07 534 296 31
5 Ihlas Holding AS Dec 07 219 20 -7
Top five construction companies
27697 rt EPoC:27697 EPoC rt 12/12/08 15:39 Page 78
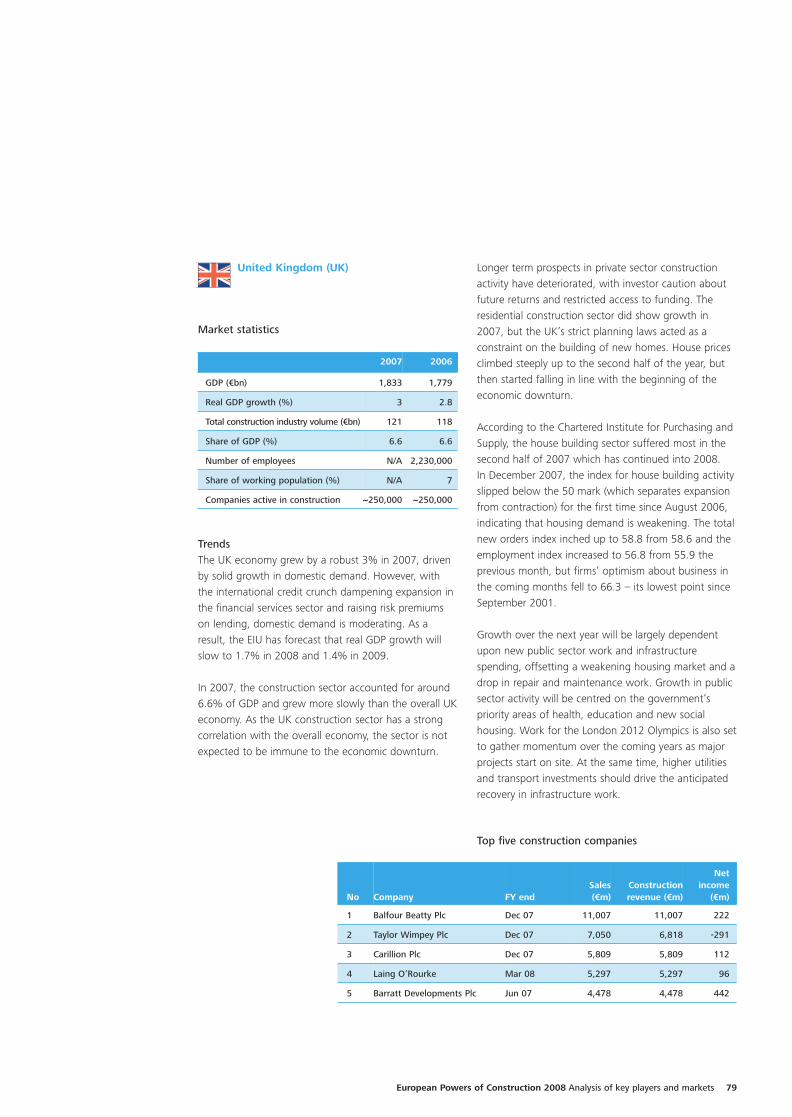
United Kingdom (UK)
Market statistics
European Powers of Construction 2008 Analysis of key players and markets 79
Longer term prospects in private sector constructionactivity have deteriorated, with investor caution aboutfuture returns and restricted access to funding. Theresidential construction sector did show growth in2007, but the UK’s strict planning laws acted as aconstraint on the building of new homes. House pricesclimbed steeply up to the second half of the year, butthen started falling in line with the beginning of theeconomic downturn.
According to the Chartered Institute for Purchasing andSupply, the house building sector suffered most in thesecond half of 2007 which has continued into 2008. In December 2007, the index for house building activityslipped below the 50 mark (which separates expansionfrom contraction) for the first time since August 2006,indicating that housing demand is weakening. The totalnew orders index inched up to 58.8 from 58.6 and theemployment index increased to 56.8 from 55.9 theprevious month, but firms’ optimism about business inthe coming months fell to 66.3 – its lowest point sinceSeptember 2001.
Growth over the next year will be largely dependentupon new public sector work and infrastructurespending, offsetting a weakening housing market and adrop in repair and maintenance work. Growth in publicsector activity will be centred on the government’spriority areas of health, education and new socialhousing. Work for the London 2012 Olympics is also setto gather momentum over the coming years as majorprojects start on site. At the same time, higher utilitiesand transport investments should drive the anticipatedrecovery in infrastructure work.
2007 2006
GDP (€bn) 1,833 1,779
Real GDP growth (%) 3 2.8
Total construction industry volume (€bn) 121 118
Share of GDP (%) 6.6 6.6
Number of employees N/A 2,230,000
Share of working population (%) N/A 7
Companies active in construction ~250,000 ~250,000
TrendsThe UK economy grew by a robust 3% in 2007, drivenby solid growth in domestic demand. However, withthe international credit crunch dampening expansion inthe financial services sector and raising risk premiumson lending, domestic demand is moderating. As aresult, the EIU has forecast that real GDP growth willslow to 1.7% in 2008 and 1.4% in 2009.
In 2007, the construction sector accounted for around6.6% of GDP and grew more slowly than the overall UKeconomy. As the UK construction sector has a strongcorrelation with the overall economy, the sector is notexpected to be immune to the economic downturn.
No Company FY endSales (€m)
Constructionrevenue (€m)
Netincome
(€m)
1 Balfour Beatty Plc Dec 07 11,007 11,007 222
2 Taylor Wimpey Plc Dec 07 7,050 6,818 -291
3 Carillion Plc Dec 07 5,809 5,809 112
4 Laing O’Rourke Mar 08 5,297 5,297 96
5 Barratt Developments Plc Jun 07 4,478 4,478 442
Top five construction companies
27697 rt EPoC:27697 EPoC rt 12/12/08 15:39 Page 79
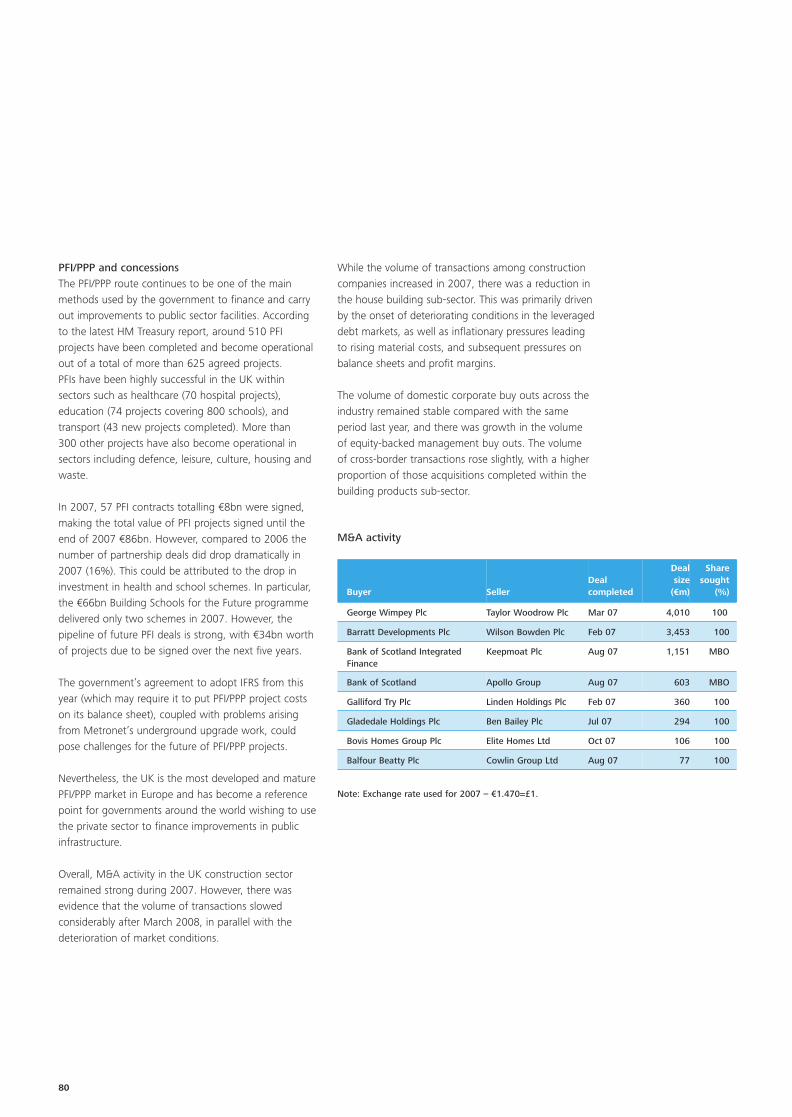
80
PFI/PPP and concessions The PFI/PPP route continues to be one of the mainmethods used by the government to finance and carryout improvements to public sector facilities. Accordingto the latest HM Treasury report, around 510 PFIprojects have been completed and become operationalout of a total of more than 625 agreed projects. PFIs have been highly successful in the UK withinsectors such as healthcare (70 hospital projects),education (74 projects covering 800 schools), andtransport (43 new projects completed). More than 300 other projects have also become operational insectors including defence, leisure, culture, housing andwaste.
In 2007, 57 PFI contracts totalling €8bn were signed,making the total value of PFI projects signed until theend of 2007 €86bn. However, compared to 2006 thenumber of partnership deals did drop dramatically in2007 (16%). This could be attributed to the drop ininvestment in health and school schemes. In particular,the €66bn Building Schools for the Future programmedelivered only two schemes in 2007. However, thepipeline of future PFI deals is strong, with €34bn worthof projects due to be signed over the next five years.
The government’s agreement to adopt IFRS from thisyear (which may require it to put PFI/PPP project costson its balance sheet), coupled with problems arisingfrom Metronet’s underground upgrade work, couldpose challenges for the future of PFI/PPP projects.
Nevertheless, the UK is the most developed and maturePFI/PPP market in Europe and has become a referencepoint for governments around the world wishing to usethe private sector to finance improvements in publicinfrastructure.
Overall, M&A activity in the UK construction sectorremained strong during 2007. However, there wasevidence that the volume of transactions slowedconsiderably after March 2008, in parallel with thedeterioration of market conditions.
While the volume of transactions among constructioncompanies increased in 2007, there was a reduction inthe house building sub-sector. This was primarily drivenby the onset of deteriorating conditions in the leverageddebt markets, as well as inflationary pressures leadingto rising material costs, and subsequent pressures onbalance sheets and profit margins.
The volume of domestic corporate buy outs across theindustry remained stable compared with the sameperiod last year, and there was growth in the volume of equity-backed management buy outs. The volume of cross-border transactions rose slightly, with a higherproportion of those acquisitions completed within thebuilding products sub-sector.
M&A activity
Buyer SellerDealcompleted
Deal size
(€m)
Sharesought
(%)
George Wimpey Plc Taylor Woodrow Plc Mar 07 4,010 100
Barratt Developments Plc Wilson Bowden Plc Feb 07 3,453 100
Bank of Scotland Integrated Finance
Keepmoat Plc Aug 07 1,151 MBO
Bank of Scotland Apollo Group Aug 07 603 MBO
Galliford Try Plc Linden Holdings Plc Feb 07 360 100
Gladedale Holdings Plc Ben Bailey Plc Jul 07 294 100
Bovis Homes Group Plc Elite Homes Ltd Oct 07 106 100
Balfour Beatty Plc Cowlin Group Ltd Aug 07 77 100
Note: Exchange rate used for 2007 – €1.470=£1.
27697 rt EPoC:27697 EPoC rt 12/12/08 15:39 Page 80

European Powers of Construction 2008 Analysis of key players and markets 81
Ukraine
Market statistics
2007 2006
GDP (€bn) 103 85
Real GDP growth (%) 7.7 7.9
Total construction industry volume (€bn) 13 9
Share of GDP (%) 6.9 7.1
Number of employees N/A 667,900
Share of working population (%) N/A N/A
Companies active in construction N/A 35,875
Note: Exchange rate used for 2007 – €1=HRN7.3.
TrendsThe buoyant Ukrainian economy kept up themomentum of 2006 with strong growth of 7.7% in2007. Similar growth rates are expected over the nextfew years as the country becomes more closely alignedwith the EU. However, the economy does face severalchallenges, including inflation, taxes and increasingenergy exposures.
The construction sector grew faster than the economyin 2007, achieving strong volume growth of more than10%, slightly up from 2006. Construction prices alsorose more than 20%.
Residential constructionThe housing sector continued to be the most dynamicsub-sector in the construction market during 2007,showing growth of more than 10%. This impressivegrowth is expected to accelerate in the years ahead.The number of newly-built homes increased to 95,000units in 2007, up from 82,000 units the year before,with the highest levels of activity taking place inOdessa, Lviv and the Kiev region. House prices alsocontinued to rise, driven by strong demand and thedevelopment of the mortgage lending market.
Non-residential constructionThe non-residential sub-sector grew by nearly 10% in2007. The majority of this growth was concentrated inthe office, commercial and industrial sub-sectors, drivenlargely by a lack of supply and increasing demand.
Civil engineeringThe worst-performing sub-sector of the constructionmarket in 2007 was civil engineering, which was heldback by limited public funding. Of the activity that didtake place, most was focused on road and airportconstruction. The lack of modern infrastructure remainsa key challenge for the country going forward.
The main driver for the Ukrainian construction industryover the next few years will be the country’s co-hostingof the Euro 2012 football championships with Poland.The championship will be held in Dnepropetrovsk,Donetsk, Kyiv, Lviv and Simferopol, with Kharkiv andOdessa as reserve cities. It is expected to requiremassive investment in areas such as transportation,sports infrastructure, accommodation, catering,hospital, and energy supply networks.
No Company FY endSales (€m)
Constructionrevenue (€m)
Netincome
(€m)
1 Mostobud VAT Dec 07 128.5 128.8 N/A
2 Interbudmontazh Dec 05 85 85 -0.2
3 Kyivmetrobud Dec 07 82 82 3
4 Poznyakyzhylbud Dec 05 71 71 5
5 TMM Dec 07 44 44 9
Top five construction companies
Note: Exchange rate used for 2007 – €1=HRN7.3.
27697 rt EPoC:27697 EPoC rt 12/12/08 15:39 Page 81

82
PFI/PPP and concessionsThe Euro 2012 football championships are providingsignificant impetus to Ukraine’s PPP programme –although the country may be starting from too farbehind to be able to rely heavily on private capital forits planned investments.
The government estimates that investments in thechampionships will reach €18bn, with the stateplanning to invest €2bn and local government bodiesplanning to contribute almost €1bn. This means thatapproximately 90% of all investments – €16bn – willneed to come from private sources.
In September 2007, the Ukrainian government signed a partnership memorandum with a private companyregarding transportation infrastructure. The StateAutomobile Road Service, Ukravtodor, predicts that PPPprojects will start under this umbrella by 2010.
Apart from road projects, other PPPs across all sectorsare only at the consideration stage.
Ukraine is in the process of setting up a legalframework for PPP projects in order to encourage theirdevelopment. For that purpose, it has received multi-lateral technical and consultancy assistance aroundconcession legislation and how to build an effective PPPstrategy.
M&A activity
Buyer SellerUnitsold
Deal size
(€m)
Sharesought
(%)
Bamtonnelstroy JSC Metrobud JSC KievMetroBud JSC
N/A N/A
Colberg Division Innovative ConstructionCo
N/A N/A N/A
27697 rt EPoC:27697 EPoC rt 12/12/08 15:39 Page 82

European Powers of Construction 2008 Analysis of key players and markets 83
AmadeusAustrian Commercial RegisterAustrian Institute of Economic Research
Bulgarian National Statistical Institute
C.A. Kline and H.L. HesslerThe DuPont chart system for appraising operating performance
Company annual reports and websites*Construction News, UK Construction UkraineConstruction Products AssociationCentral Bureau of Statistics, Croatia Czech Statistical Office
Datamonitor Deloitte
European Powers of Construction 2007European Powers of Construction 2006
Deloitte, Euronext and CSR EuropeInvesting in responsible business: 2003 survey of European fund managers, financial analysts and investor relations officers
Department for Business, Enterprise and RegulatoryReform, UKDLA Piper
European PPP report 2007
EIUCountry reportsCountry profiles
Euroconstruct61st conference: prospects for the European
construction market 2006-2008 64th conference: prospects for the European construction market 2007-2010
ECFourth accounting directive (78/660/EC), article 46
Factiva**Federal Statistical Office, Germany
H. Abdul-RahmanThe management and cost of quality for civil engineering projects
HM TreasuryInfrastructure procurement: delivering long-term value, 2008
Hungarian Central Statistical Office
*For all of the companies listed throughout the publication.
**A full list of the articles used is available on request.
ISI Emerging Markets/IntelliNews Reports**
J.M. Juran and F.M. GrynaQuality costs: Juran’s quality control handbook
M. CnuddeLack of quality in construction – economic losses
Mergerstat
National Institute for Statistics and Economic Studies,UKNational Institute of Statistics, RomaniaNational Statistical Service of GreeceNorton Rose Group
PPP outlook Italy, May 2008
OneSourceOffice for National Statistics, UK
P. Barber, D. Sheath, C. Tomkins and A. GravesThe cost of quality failures in major civil engineering projects
P.E.D. LoveThe influence of project type and procurement methods on rework costs in building and constructionprojects
P.E. Josephson and Y. HammarlundThe causes and costs of defects in construction: a study of seven building projects
PMR publications**Poland’s Central Statistical Office
R. LammingBeyond partnership
R. Vrijhoef Co-makership in construction: towards construction supply chain management
SantanderThe Portuguese construction sector, July 2008
Sir M. LathamConstructing the team
Statistical Office of the Slovak RepublicStatistics Denmark Statistics NetherlandsStatistics NorwayStatistics Sweden
The Swedish Construction FederationThomson Research
Greece construction sector, Proton Bank
References
27697 rt EPoC:27697 EPoC rt 12/12/08 15:39 Page 83
84
Region Name Telephone EmailAustria Manfred Geritzer +43 (1) 537 00 7500 [email protected]
Marieluise Krimmel +43 (1) 537 00 2412 [email protected] Moritz +43 (1) 537 00 4300 [email protected] Schaffer +43 (1) 537 00 2400 [email protected]
Belgium Alexandre Bulla +32 (2) 639 49 48 [email protected] de Lantsheere +32 (2) 639 49 41 [email protected] Loozen +32 (2) 639 49 40 [email protected] Neckebroeck +32 (2) 800 20 22 [email protected]
Central Europe Petr Kymlicka +420 (246) 042 480 [email protected]
Denmark Lars Andersen +45 (36) 10 25 30 [email protected]
France Marc de Villartay +33 (1) 5561 2716 [email protected]
Germany Franz Klinger +49 (89) 29036 8362 [email protected] Mueller +49 (89) 29036 8428 [email protected] Reiss +49 (911) 230 74 14 [email protected]
Greece Alexis Damalas +30 (210) 678 1100 [email protected] Hadjipavlou +30 (210) 678 1100 [email protected]
Ireland Michael Flynn +353 (1) 417 2515 [email protected] Sheehan +353 (1) 417 2218 [email protected] Whelan +353 (1) 417 2848 [email protected]
Italy Kevin O’Connor +39 (02) 833 25072 [email protected] Vistarini +39 (02) 833 25122 [email protected]
The Netherlands Paul Meulenberg +31 (20) 582 5060 [email protected] Noordhuis +31 (61) 234 4631 [email protected] Oosterhof +31 (61) 234 4617 [email protected] van der Pal +31 (65) 585 5060 [email protected]
Norway Frode Lid +47 (23) 279 676 [email protected] Lundgaard +47 (23) 279 282 [email protected] Nyquist +47 (23) 279 663 [email protected]
Portugal Joao Costa da Silva +351 (21) 042 7511 [email protected] Heredia +351 (21) 042 3047 [email protected]
Spain Miguel Laserna +34 (915) 145 000 [email protected] Parada Pardo +34 (915) 145 000 [email protected]
Sweden Andreas Adolphsson +46 (8) 506 72103 [email protected]
Switzerland David Quinlin +41 (44) 421 6158 [email protected]
Turkey Hakan Dundar +90 (212) 366 6127 [email protected]
UK Makhan Chahal +44 (0) 20 7007 0626 [email protected] Kelly +44 (0) 20 7007 0826 [email protected] Shilton +44 (0) 20 7007 7934 [email protected] Watts +44 (0) 20 7007 7939 [email protected]
European construction andinfrastructure group contacts
27697 rt EPoC:27697 EPoC rt 12/12/08 15:39 Page 84

European Powers of Construction 2008 Analysis of key players and markets 85
27697 rt EPoC:27697 EPoC rt 12/12/08 15:39 Page 85

Deloitte refers to one or more of Deloitte Touche Tohmatsu (‘DTT’), a Swiss Verein, and its network of member firms, each ofwhich is a legally separate and independent entity. Please see www.deloitte.co.uk\about for a detailed description of the legalstructure of DTT and its member firms.
Deloitte LLP is the United Kingdom member firm of DTT.
This publication has been written in general terms and therefore cannot be relied on to cover specific situations; application of theprinciples set out will depend upon the particular circumstances involved and we recommend that you obtain professional advicebefore acting or refraining from acting on any of the contents of this publication. Deloitte LLP would be pleased to advise readerson how to apply the principles set out in this publication to their specific circumstances. Deloitte LLP accepts no duty of care orliability for any loss occasioned to any person acting or refraining from action as a result of any material in this publication.
© 2008 Deloitte LLP. All rights reserved.
Deloitte LLP is a limited liability partnership registered in England and Wales with registered number OC303675. A list of members’names is available for inspection at 2 New Street Square, London EC4A 3BZ, United Kingdom, the firm’s principal place of businessand registered office. Tel: +44 (0) 20 7936 3000 Fax: +44 (0) 20 7583 1198.
Designed and produced by The Creative Studio at Deloitte, London. 27697
27697 rt EPoC:27697 EPoC rt 12/12/08 15:39 Page 86