evaluacion de htas calidad de pdf
DESCRIPTION
Gestion de la calidadTRANSCRIPT

Int. J. Production Economics 92 (2004) 267–280
Quality tools and techniques: Are they necessary forquality management?
Juan Jose! Tar!ı*, Vicente SabaterDepartment of Business Management, University of Alicante, AP. Correos 99, Alicante 03080, Spain
Received 10 February 2003; accepted 21 October 2003
Abstract
Total quality management (TQM) has been developed around a number of critical factors. However, TQM is muchmore than a number of critical factors; it also includes other components, such as tools and techniques for quality improvement. In this paper, we carry out an empirical study in order to verify the importance of these tools and techniques for TQM improvement and their effect upon TQM results. For this purpose, we use the answers provided by the person in charge of quality in 106 ISO-certified firms in Spain.r 2003 Elsevier B.V. All rights reserved.Keywords: ISO 9000; Quality management; Quality tools
1. Introduction or into the ‘soft’ and ‘hard’ parts (Wilkinson et al.,1998).
Thus, TQM is much more than a number of critical factors; it also includes other components, such as tools and techniques for quality improve- ment (Hellsten and Klefsjo. , 2000). In fact, techniques and tools are vital to support and develop the quality improvement process (Bunney and Dale, 1997; Stephens, 1997).
The critical factors of TQM are the elements that may lead to satisfactory performance, as has been proved by other studies (Saraph et al., 1989; Badri et al., 1995; Powell, 1995; Ahire et al., 1996; Adam et al., 1997; Hendricks and Singhal, 1997; Grandzol and Gershon, 1998; Quazi et al., 1998; Das et al., 2000). However, on the one hand, although the data show the existence of connec- tions between the factors of TQM and a firm’s performance, it cannot be strictly proven that TQM leads to increased performance, but simply
The importance of total quality management(TQM) has considerably increased over the last years, on both a practical and theoretical level. TQM has been developed around a number of critical factors which vary from one author to another, although the core factors are leadership, quality planning, human resources management (training, work teams, employee involvement, etc.), process management, cooperation with customers and suppliers, and continuous improve- ment. According to the literature, the elements of TQM may be grouped into two dimensions: the management system (leadership, planning, human resources, etc.) and the technical system (TQM tools and techniques) (Evans and Lindsay, 1999);
*Corresponding author. Tel./fax: +34-965903606.E-mail address: [email protected] (J.J. Tar!ı).
0925-5273/$ - see front matter r 2003 Elsevier B.V. All rights reserved.doi:10.1016/j.ijpe.2003.10.018

268 J.J. Tar!ı, V. Sabater / Int. J. Production Economics 92 (2004) 267–280
that such relationship exists (Powell, 1995) andalso that, as many respondents answered, quality may influence part of the firm’s performance. On the other hand, in some cases, the impact of TQM practices on a firm’s performance is weaker and not always significant (Sousa and Voss, 2002).
Thus, TQM does not always improve perfor- mance. In spite of its advantages (Sohal et al., 1991; Kanji, 1998), we can also find problems in its implementation (Kanji, 1998). Firstly, in order to have a positive performance in a firm, it is necessary to develop its intangible resources (Powell, 1995). Secondly, firms that implement an effective TQM programme improve their operating performance (Hendricks and Singhal, 1997). Thirdly, experience has shown that some firms fail when they implement TQM (Boje and Winsor, 1993; Spector and Beer, 1994) because the implementation of TQM cannot be successful without the use of suitable quality management methods (Sitkin et al., 1994; Wilkinson et al., 1998; Zhang, 2000) such as tools and techniques for quality. According to this view, the management system of TQM may only have a positive effect on performance if a technical system has also been established (Sousa and Voss, 2002). In addition, these techniques, amongst others, are important for business survival and continuation (Zackrisson et al., 1995).
What has been missing from the literature is an assessment of how quality tools have affected TQM. In our opinion, the situation makes it necessary to carry out an empirical study in order to verify the importance of these tools and techniques for TQM improvement and their effect upon TQM results.
Our study analyzes the relationship between the use of these techniques and tools for TQM improvement and TQM itself, and will attempt to check if those firms with a higher TQM level (higher implementation of critical factors) and best TQM results, do show a higher interest in the use of these tools and techniques. For this purpose, we use the answers provided by the person in charge of quality in 106 ISO-certified firms in Spain. Our results are part of a wider research process, aimed at analyzing quality practices in certified firms by using TQM elements, which identifies the factors
and results of these firms, classifies them andestablishes different TQM levels.
This paper will be structured as follows: in the next section, a review is made of the literature, on the one hand, concerning TQM results and critical factors, and on the other, regarding the tools and techniques for quality improvement. The following section reflects the methodology used for this paper; this is followed by a presentation and discussion of the results. A number of conclusions will be suggested in the final section.
2. Literature review
2.1. Critical factors of quality management
Quality management theory has been influencedby the contributions made by quality leaders (Crosby, 1979; Deming, 1982; Ishikawa, 1985; Juran, 1988; Feigenbaum, 1991). The research byall these authors showsweaknesses, for none of solutions to the problems
both strengths andthem offers all the encountered by firms
(Dale, 1999), although some common issues can beobserved, such as management leadership, train- ing, employees’ participation, process manage- ment, planning and quality measures for continuous improvement.
These ideas have exerted an influence upon later studies, in such a way that the literature on TQM has progressively developed from these initial contributions, identifying different elements for effective quality management: customer-based approach, leadership, quality planning, fact-based management, continuous improvement, human resource management (involvement of all members in the firm, training, work teams, communication systems), learning, process management, coopera- tion with suppliers and organizational awareness and concern for the social and environmental context.
Alongside these studies, we may mention the development of formal evaluation models, such as the Malcolm Baldrige National Quality Award model in the USA, the European Foundation for Quality Management (EFQM) model in Europe and the Deming Application Prize model in Japan.

J.J. Tar!ı, V. Sabater / Int. J. Production Economics 92 (2004) 267–280
269
Table 1Empirical research of quality management
Authors Purpose Critical factors identified
Saraph et al. (1989) Develop an instrument for measuring criticalfactors of quality managementDevelop an instrument based on empirical and practitioner literatureAdditional assessment of instrument proposedby Saraph, Benson and Schroeder Identify a set of critical factors of TQMIdentify constructs of TQM and develop scales for measuring these constructsDevelop and test an instrument for use in TQM researchCorroborate the results of the study developed by Saraph, Benson and SchroederDevelop a valid instrument for key dimensions of quality management in the international context
8 factors with 66 items
Flynn et al. (1994) 7 major dimensions with 48 items
Badri et al. (1995) 8 factors with 66 items
Black and Porter (1995)Ahire et al. (1996)
10 factors with 32 items12 factors with 50 items
Grandzol and Gershon (1998) 7 exogenous factors with 39 items and6 endogenous factors with 23 items16 factors with 78 itemsQuazi et al. (1998)
Rao et al. (1999) 13 factors with 62 items
Although there are some differences between thesemodels, they have a number of common elements (Ritchie and Dale, 2000). We should also quote here a number of empirical studies leading to a scale for TQM measurement (Table 1). These constructs are all present in the framework used for the national quality awards we have listed.
(1985) and McConnell (1989) have identified a listof seven TQM tools: flow charts, cause and effect diagrams, Pareto charts, histograms, run charts and graphs, X bar and R control charts and scatter diagrams. Also, Imai (1986), Dean and Evans (1994), Goetsch and Davis (1997), Dale (1999), and Evans and Lindsay (1999) have offered a list of tools and techniques for quality improvement. For their part, Dale and McQuater (1998) have identified the tools and techniques most widely used by firms, as shown in Table 2.
This review shows, on the one hand, that there have been numerous studies analyzing the critical factors for successful quality management imple- mentation and its influence upon performance (Saraph et al., 1989; Powell, 1995; Hendricks and Singhal, 1997), and on the other, which techniques and tools might be best suited for quality improvement. In this latter case, there is a major gap in research in this area, because there are few studies which have verified if the use of these techniques and tools improves the TQM level and if it has an influence upon performance.
Thus, considering that: (a) an effective TQM programme has positive effects upon operating performance (Hendricks and Singhal, 1997), (b) the use of these techniques and tools is vital to support and develop the quality improvementprocess (Hellsten and Klefsjo. , 2000; Bunney and
2.2. Tools and techniques for quality improvement
As pointed out above, according to the litera-ture on TQM there are two components in a TQM system: the management system and the technical system, or the ‘soft’ and ‘hard’ part. The hard part includes production and work process control techniques, which ensure the correct functioning of such processes (amongst others, process design, the ‘‘just in time’’ philosophy, the ISO 9000 norm and the seven basic quality control tools) (Evans and Lindsay, 1999; Wilkinson et al., 1998). The two dimensions reflect all the issues which a manager must bear in mind for a successful TQM implementation.
Researchers have identified a number of tools and techniques for quality improvement. A single tool is a device with a clear function, and is usually applied on its own, whereas a technique has a wider application and is understood as a set of tools (McQuater et al., 1995). Thus, Ishikawa

270 J.J. Tar!ı, V. Sabater / Int. J. Production Economics 92 (2004) 267–280
Dale, 1997; Stephens, 1997) and (c) companies inwhich these tools have been developed to a greater extent are likewise the ones which have a greater implementation of work practices, such as employ- ee management, continuous improvement (work teams, suggestion schemes, etc.) (Bayo-Morionesand Merino-D!ıaz, 2001), the following question isempirically researched in this study: do techniques and tools have a positive effect upon a firm’s TQM level and TQM results?
Answering the above question would help managers to realize the importance of techniques and tools in order to improve quality. The hypotheses we have formulated are the following:
carrying out their activity in the Alicante area(eastern Spain) which received the ISO 9000 certificate. Certified firms were chosen because we were interested in firms with some kind of quality system, for the following reasons: (a) these firms had one person engaged, either full time or part-time, in quality tasks and (b) these organiza- tions would be firms which started their path toward quality management by obtaining an ISO 9000 based system, and this is an objective criterion guaranteeing that these firms do possess a quality system. Also, the ISO 9000 quality management system, like the excellence models, is improving the understanding of concepts and practices associated with TQM (Van der Wiele et al., 2000) and implies compliance with certain requirements of total quality, which may help to understand the questions asked, and therefore, to obtain adequate answers.
Thus, a list of certified firms in the Alicantearea was requested from the organizations in charge of certification in Spain. Although the total population (number of certificates) was 175, our study only includes 154 cases for the following reasons:
H1. TQM critical factors are positively relatedto the tools and techniques for quality improve- ment.
H2. TQM results are positively related to the toolsand techniques for quality improvement.
These two hypotheses are tested by means of acorrelation analysis, the relationship being verified in the two senses: a higher TQM level and higher TQM results imply a greater use of these techniques, and vice versa. In order to further clarify the connections, the following hypotheses are formulated, derived from the two previous ones:
We eliminated two multinational consultancyfirms, which were not included in the study. There were four firms with more than one certificate for each of them (nine altogether), and thus the number of answers received was four.It was detected in some cases that there werevarious certified firms belonging to the same group, and thus the person responsible for quality issues was the same. This reduced a total of 22 certificates to eight interviews (i.e. eight answers).
In addition to this, it proved impossible to
*
*
H3. Firmsplemented
with a higher TQM level have im-to a greater extent the tools and
*
techniques for quality improvement.
H4. Firms with better TQM results have imple-mented to a greater extent the tools and techniques for quality improvement.
obtain data from 12 firms, and hence the finalpopulation considered was 142. The number of answers recorded was 108, which represents a response percentage of 76.06%. However, two answers were not regarded as valid due to incomplete data; therefore, the number of cases processed statistically with the SPSS software was 106 firms. The characteristics of these 106 firms are shown in Table 3.
3. Methodology
3.1. Sample
In order to achieve our objective, and within thewider analysis mentioned in the introduction, we selected as the population for our study those firms

J.J. Tar!ı, V. Sabater / Int. J. Production Economics 92 (2004) 267–280
271
Table 2Commonly used tools and techniques
The seven basic quality control tools The seven management tools Other tools Techniques
Cause and effect diagramCheck sheet Control chart Graphs Histogram Pareto diagram Scatter diagram
Affinity diagramArrow diagram Matrix diagram Matrix data analysis methodProcess decision programme chart Relations diagram Systematic diagram
BrainstormingControl plan Flow chart
BenchmarkingDepartmental purpose analysisDesign of experiments Failure mode and effects analysisFault tree analysis Poka yokeProblem solving methodologyQuality costingQuality function deployment Quality improvement teams Statistical process control
Force field analysisQuestionnaire Sampling
Table 3Number of certified firms according to number of employees and number of firms per sector
Number of employees Sector (SIC—StandardIndustrial Classification)
Small Medium Large Total Industry Services
o20 20–49 50–99 100–250 >250 >500
No. of firmsTotal Total (%)
17 17 27 24 8 13 106106100%
3432%
5148%
2120%
6359%
4341%
One sample-related error is that caused by the this way, this test consisted in a first revision of thequestionnaire (pre-test) with four people (an academic, a small/medium firm manager and two quality consultants), to ensure a suitable coverage of the domain of each construct, and a second test with the first ten firms studied, selected at random, which allowed us to modify and delete some variables.
The data were collected by means of a struc-tured personal interview, based on a closed questionnaire, plus a set of open questions which allowed us to clarify certain points. We decided to combine the interview with the questionnaire and, due to the need for personal interaction, the participating firms were limited to the Alicante area. Although this could place a limitation on any generalizations, it must be considered that ISO 9000 offers a standard applicable to any firm, region or country. However, ISO 9000 is a culture- independent system: the standard is written in general terms and may be applicable to any
lack of response by some firms. Therefore, in orderto verify if the lack of response was significant, we carried out a comparison between the firms that did answer and those which did not. It was seen that there were no significant differences between them regarding the variable size (p ¼ 0:697) and sector (p ¼ 0:609). Also, the sampling error was 74.9%.
3.2. Data collection
A questionnaire was designed meeting theobjectives that had been set. The process ofdeveloping the questionnaire finished with a pilot survey, which was used to modify and eliminate a number of variables, until the final questionnaire was designed. Experts on the subject were con- sulted, to ensure that the questions were properly phrased, and the suitability of the questionnaire was tested on a sample of firms (Madu, 1998). In

272 J.J. Tar!ı, V. Sabater / Int. J. Production Economics 92 (2004) 267–280
organization, but each firm must adapt thestandard to its own characteristics. Nevertheless, most obstacles, benefits and other issues related to ISO 9000 do not differ to any great degree from one country to another (Ebrahimpour et al., 1997; Withers and Ebrahimpour, 2001).
In this way, the process started with a pilot test, which allowed us, as has been discussed before, to modify the initial questionnaire; then we con- ducted the interviews with 108 firms that agreed to participate. However, only 106 interviews were considered because the other two, as has been mentioned before, yielded incomplete data. The questionnaire was answered by the persons in charge of the quality area, for these reasons: (a) these persons play an active role in the quality strategy; (b) they possess the knowledge required to answer the questionnaire, and given their training and knowledge on the subject, considering that these firms had quality systems, this would allow a better understanding of the questions; and(c) in similar studies, the key person to interview is the quality manager.
a 7-point scale (Table 4). Among these categories,the learning factor is the same as the one used in the work by Grandzol and Gershon (1998), formed by its five items.
Results of TQM: These questions are aimed at discovering which effects quality has had upon results. We measure the results of TQM consider- ing the results of the EFQM model and the work by Powell (1995) and Grandzol and Gershon (1998). Our final questionnaire contains 15 items, measured within a 7-point scale, grouped into four results (Table 5). We consider the customer satisfaction factor used by Grandzol and Gershon (1998) and the construct of the TQM programme performance used by Powell (1995); however, in both factors we have included in the final questionnaire one item less than in these studies, such item being dropped in the pilot test.
Concerning the performance construct of TQM, the effects of quality on such result may be evaluated by examining unexpected changes in financial results, for example, in the five years following the onset of quality management, as described in the financial results published by firms (Easton and Jarrell, 1998); or in a subjective way, by measuring respondents’ perceptions, these subjective measurements being widely accepted in organizational research (Powell, 1995), due to the difficulty in identifying and obtaining an objective measurement for firms of different sizes and sectors (Saraph et al., 1989). In our case, we chose the second option instead of the sales turnover.
Techniques and tools: A question was asked in order to study the most frequent techniques and tools, by means of nominal qualitative variables. We identified 12 tools and techniques, based on the research by Ishikawa (1985), Imai (1986), McConnell (1989), Dean and Evans (1994), Goetsch and Davis (1997), Dale and McQuater (1998), Dale (1999), and Evans and Lindsay (1999). Thus, those responsible for quality were asked whether they were not familiar with, were familiar with, used or regarded as a basic tool any of the following techniques and tools: graphs, statistical process control (SPC), benchmarking, quality costs, internal audits, failure mode and effects analysis (FMEA), cause and effect diagrams, Pareto diagrams, histograms, scatter
3.3. Measures
By means of a number of measures weattempted to find out about the usual practices of firms implementing quality systems. Our inten- tion was to measure TQM (through the critical factors), the results of quality management and the use of tools and techniques of TQM.
Critical factors: By means of these measures we intended to analyze the usual practice of those firms implementing quality systems (ISO 9000) through the factors of quality management. In order to identify them, we started from the EFQM model and a review of the literature. We selected eight critical factors considering the enablers defined by the EFQM model and a review of the literature, defining the items from those fixed in that model and in the empirical work by Saraph et al. (1989), Badri et al. (1995), Black and Porter (1995), Powell (1995), Ahire et al. (1996), Grand- zol and Gershon (1998) and Quazi et al. (1998). Thirty-seven items were used in our final ques- tionnaire, grouped within these eight critical factors. Each of these items was measured within

Table 4Elements of the EFQM model and critical factors identified
Enablers (EFQM model) Critical factors (Cronbach’s alpha)
No. of items
Source
Leadership Leadership (a ¼ 0:76)
5 Strategic quality management (Black and Porter) Executive commitment (Powell)Leadership (Grandzol and Gershon)EFQM model
Policy and strategy Quality planning (a ¼ 0:77)
6 Role of divisional top management and quality police (Saraph, Benson and Schroeder) Operational quality management (Black and Porter)Corporate quality culture (Black and Porter)Top management commitment (Ahire, Golhar and Waller) EFQM model
People management Employee management (a ¼ 0:72)
6 Training (Saraph, Benson and Schroeder, Powell) Employee relations (Saraph, Benson and Schroeder) People and customer management (Black and Porter) Employee empowerment (Ahire, Golhar and Waller) Employee training (Ahire, Golhar and Waller) EFQM model
Suppliers managementaPartnership and resources 3 Supplier quality management (Saraph, Benson and Schroeder, Ahire, Golhar and Waller) Supplier partnership (Black and Porter)Closer to suppliers (Powell)Internal/external cooperation (Grandzol and Gershon) EFQM model
Processes Customer focus (a ¼ 0:54)
3 People and customer management (Black and Porter) Customer satisfaction orientation (Black and Porter) Closer to customer (Powell)Customer focus (Ahire, Golhar and Waller, Grandzol and Gershon) EFQM model
Process management (a ¼ 0:63)
Continuous improvement (a ¼ 0:76)
4 Process management (Saraph, Benson and Schroeder, Grandzol and Gershon) Quality improvement measurement systems (Black and Porter)EFQM modelQuality date and reporting (Saraph, Benson and Schroeder) Teamwork structures for process improvement (Black and Porter) Quality improvement measurement systems (Black and Porter) Open organization (Powell)Process improvement (Powell)Continuous improvement (Grandzol and Gershon) EFQM modelLearning (Grandzol and Gershon)
5
Learningb
(a ¼ 0:82)
5
a a ¼ 0:52: The minimum advisable level is 0.55 (Van de Ven and Ferry, 1979). Then, the alpha is recalculated after eliminating one item, in order to verify if the scale improves. The new scale is based on two items (a ¼ 0:62).
b Learning is not one of the five enablers in the EFQM model. However, it is implied throughout the nine criteria of the model.
J.J. Tar!ı, V
. Sabater / Int. J. Production E
conomics 92 (2
004
) 267–280
273

274 J.J. Tar!ı, V. Sabater / Int. J. Production Economics 92 (2004) 267–280
Table 5Results of TQM
Results(EFQM model)
Results No. of items Cronbach’s alphaa
Source
Customer satisfactionPeople satisfaction
Customer satisfactionEmployee satisfaction
32
0.56a
Grandzol and GershonGrandzol and Gershon EFQM modelEFQM modelPowell
Impact on societyBusiness results
Impact on societyTQM performance
37
0.650.82
a a ¼ 0:45: This value is low. However, we can accept it because the literature shows that there are significant differences in this coefficient, between using a two-category scale and more than two category scales (Churchill and Peter, 1984; Peterson, 1994).
flow charts and problem-solving methodology.These nominal variables were transformed into dichotomic ones (does not use/uses the tool and technique) in order to obtain a summative scale of the 12 tools and techniques. As the measurement level in the original scale did not allow the analyses we intended, we created a summative scale, where 1 indicated the presence of a characteristic (use) and 0 indicated the absence of such characteristic (non-use). The new summa- tive scale reflects the presence or absence of a characteristic in each of the items it consists of. Thus, the value of the new scale is a figure between 0 and 12 (in our case, between 1 and 12, because all the firms studied use internal audits), which reflects
the development of their systems; such highpercentage is due to the fact that this is a requirement of ISO 9000. Similarly, only 18% of firms do not use graphs and 48% have not
implemented SPC; however, the interviews suggest a higher percentage because, although
we did mention that we were referring to the use of control charts, the answers provided
show that many times respondents were actually speaking about statistical data or
percentage tables (reflect- ing, for instance, defects or other quality-related issues), without
really applying SPC as we under- stand it. In those firms using them, the employees collect
data—for example, concerning product refusal—and some manager (the person respon- sible
for production and/or quality) takes mea- sures and prepares statistics with these data.
Concerning the graphs, they are usually periodic reports on refused products, statistics, tables, etc.
Flow charts are used in 52% of cases, mostly in the system documentation, as a method to describe a specific process. After explaining to respondents that our interest lied in the formal process, 46% of them answered in the affirmative regarding the problem-solving methodology. In this case, we could see that some firms had a formal, written problem-solving procedure different from the methodology used to solve non-conformities.Therefore, in practice, the flow charts are linked with problem solving methods.
Regarding quality costs, they are evaluated by45% of the firms, although very few follow the procedure as described in the literature (prevention costs, assessment, internal faults and external faults), considering that 8% are starting to perform
the use of theimprovement.
tools and techniques for quality
4. Results
We shall divide this section into three subsec-tions: (a) a descriptive analysis of the use of toolsand techniques; (b) differences among firms according to size and sector; and (c) validation of the four hypotheses.
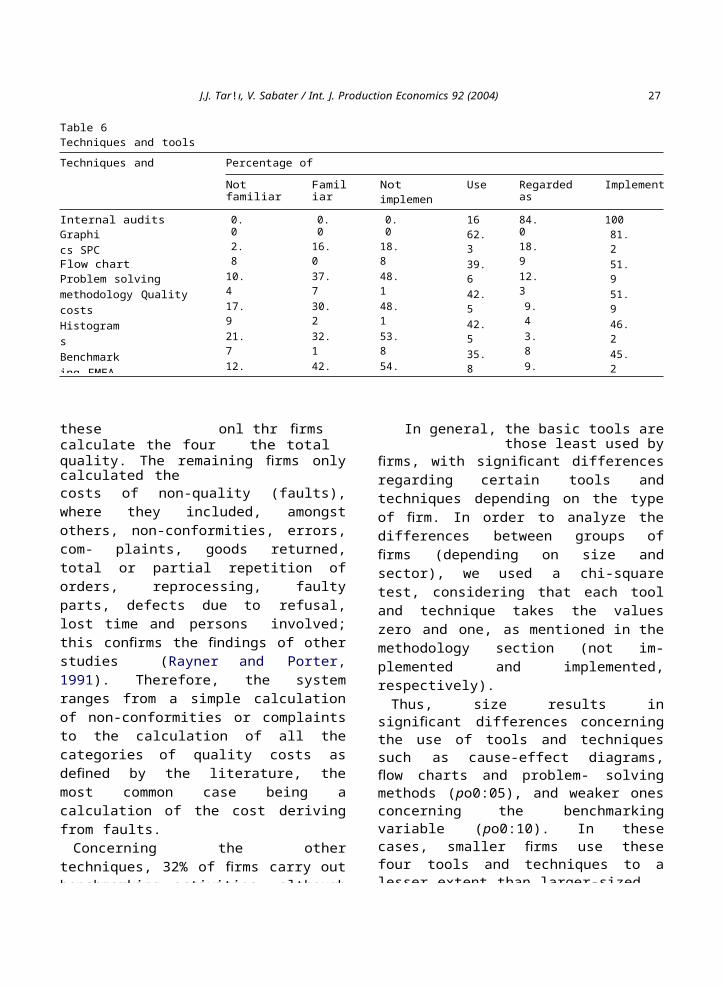
The answers we received show that the most widely used tools and techniques are, mainly, audits and graphs. SPC and flow charts rank third and fourth, but with a great difference compared to the first two instruments. The least used ones are Pareto curves, cause-effect diagrams and correlation diagrams (Table 6).
As expected, all firms carry out quality audits, and 84% of them consider them fundamental for
J.J. Tar!ı, V. Sabater / Int. J. Production Economics 92 (2004) 267–280
275
Table 6Techniques and tools of TQM
Techniques and tools Percentage of firms
Not familiarwith
Familiarwith
Notimplemented
Used Regarded asa basic tool
Implemented
Internal auditsGraphics SPCFlow chartProblem solving methodology Quality costsHistograms Benchmarking FMEAPareto diagramsCause and effect diagrams Scatter diagram
0.02.8
10.417.921.712.327.421.740.640.631.146.3
0.016.037.730.232.142.536.846.334.035.847.237.7
0.018.848.148.153.854.864.268.074.676.478.384.0
1662.339.642.542.535.831.131.120.817.919.815.1
84.018.912.39.43.89.44.70.94.65.71.90.9
10081.251.951.946.245.235.832.025.423.621.716.0
these calculations. Thus, only three firms did In general, the basic tools are those least used byfirms, with significant differences regarding certain tools and techniques depending on the type of firm. In order to analyze the differences between groups of firms (depending on size and sector), we used a chi-square test, considering that each tool and technique takes the values zero and one, as mentioned in the methodology section (not im- plemented and implemented, respectively).
Thus, size results in significant differences concerning the use of tools and techniques such as cause-effect diagrams, flow charts and problem- solving methods (po0:05), and weaker ones concerning the benchmarking variable (po0:10). In these cases, smaller firms use these four tools and techniques to a lesser extent than larger-sizedfirms. As regards the remaining tools and techni- ques, although no significant differences can be observed regarding use, it can be nevertheless detected that small firms also use them to a lesser extent, with the exception of histograms and correlations, which are seldom used in all groups.
Regarding the sector (industry vs. tertiary sector), differences can only be observed in quality costs and flow charts, with a significance level lower than 0.05, and in the Pareto curve and histograms, although accepting a significance level of less than 0.10. In this respect, industrial firms usually resort more often to quality improvement
calculate the four categories of the total cost ofquality. The remaining firms only calculated thecosts of non-quality (faults), where they included, amongst others, non-conformities, errors, com- plaints, goods returned, total or partial repetition of orders, reprocessing, faulty parts, defects due to refusal, lost time and persons involved; this confirms the findings of other studies (Rayner and Porter, 1991). Therefore, the system ranges from a simple calculation of non-conformities or complaints to the calculation of all the categories of quality costs as defined by the literature, the most common case being a calculation of the cost deriving from faults.
Concerning the other techniques, 32% of firms carry out benchmarking activities, although the interviews suggested that this was done in an informal way; for instance, by analyzing products manufactured by other firms. 25% of the firms use FMEA; in fact, after the conversation with the person in charge of quality, it was found that very few firms use it, and therefore in practice the value is even lower, since some of the respondents associated it with the mere fact of reflecting non- conformities. Histograms are used by 36% of the firms, Pareto curves in 23% of the cases, cause- effect diagrams in 21% and correlation diagrams in 16% of cases.

276 J.J. Tar!ı, V. Sabater / Int. J. Production Economics 92 (2004) 267–280
tools and techniques, except the problem-solvingmethodology, which is practically the same in the two groups.
After these two analyses, and in order to verifyHypotheses 1 and 2, we performed a correlation analysis between the TQM critical factors and the TQM results and the tools and techniques for quality improvement. For this purpose, we created a variable equivalent to the average of the eight critical factors, which we used as the TQM level for a given firm (TQMF) and we created the TQMR variable, as the average of the four TQM results. Such procedure is similar to that used byPowell (1995) and Mart!ınez et al. (1998). Similarly,we developed the variable called TQMT, equiva- lent to the total of the 12 tools and techniques, which was therefore a summative scale whose maximum would be 12. Such procedure is similar to that used by Bayo-Moriones and Merino-D!ıaz(2001). The TQM factors taken together (TQMF) correlate positively and significantly with the use of tools and techniques (TQMT), and similarly, the TQM results (TQMR) correlate positively and significantly with TQMT, which confirms Hypoth- eses 1 and 2 (Table 7). This shows that, when
certified firms are more highly committed to a joint implementation of TQM factors, they are
likely to use the tools and techniques to a higher extent, which can in turn lead to
improved performance. The eight critical factors are all significantly related to TQMT,
except the leadership factor, which may indicate that the management is not committed
enough to a wider usage of these tools and techniques among the employees. A higher
commitment to each of the TQM factors may lead the firm to use these tools and techniques to a higher extent. This could be due to the fact that a higher interest in TQM factors allows firms to understand the need for these tools and techni- ques, which are often required to develop thesefactors.
In order to verify Hypotheses 3 and 4, the TQMF and TQMR variables were used. We analyzed the existence of significant differences concerning the use of these tools and techniques in firms with a higher or lower TQM level and in
Table 7Correlation between critical factor-results of TQM and techniques and tools
TQMT
0.41a
0.40a
0.100.38a
0.21b
0.250.18d
0.31a
0.33a
0.47a
TQMFTQMRLeadershipEmployee management LearningQuality planning Suppliers management Customer focus Process managementContinuous improvement
c
a
po0:001:b
po0:05: c
Table 8Normality test
TQMF TQMR
Z (Kolmogorov–Smirnov)Sig. Mean MedianStandard deviationGroup 1: weak TQM environment
0.600.875.245.280.5450 (47%)
0.660.774.884.860.5256 (53%)
Group 2: strong TQM environment 56 (53%) 50 (47%)
test, which allows us to use the average to establishtwo groups of firms. The average value of TQMF is 5.24, which sets the boundary between those firms with a value lower than this and those with a value equal to or higher than 5.24. The two groups express a higher or lower TQM level in the firms studied. The same procedure is applied to the TQMR variable (Table 8).
Table 9 shows that those firms with a higher level of implementation of critical factors use the TQM tools and techniques to a higher extent, which has a positive influence upon TQM results, with significant differences in both cases. Such results confirm the previous statements, for a higher TQM level means a wider use of quality

J.J. Tar!ı, V. Sabater / Int. J. Production Economics 92 (2004) 267–280
277
Table 9Use of the tools and techniques in more and less TQM-advanced firms, and with more and less TQM performance (means) and differences between the two groups
TQMF TQMR
Mean Levene’s testF
T testt
Mean Levene’s testF
T testt
—3.83a —2.83b
TQMT Weak TQM environmentStrong TQM environment
4.306.21
0.58 4.636.08
0.54
a
po0:001:b po0:01:
improvement tools and techniques, which in turnallows firms to improve their TQM results. Therefore, Hypotheses 3 and 4 are validated.
2. There is no significant relationship between thetools and techniques and the leadership factor. In this respect, the most important factors in the successful implementation of these techni- ques are full management support and commit- ment and giving the correct training to the right people at the right time (McQuater et al., 1995; Bunney and Dale, 1997).
Therefore, the two main weaknesses detected in certified firms, which their managers must be aware of if they desire to successfully imple- ment quality programmes, are the limited use of basic tools and the low managerial commitment towards the usefulness of these tools. Thus, managers must understand the importance of their commitment in order to spread the use of these tools and techniques and to improve the TQM level and TQM results. However, tools alone cannot provide results by themselves. They must be developed to reflect the firm’s culture (Govers, 2001). Then, managers must use them in an integrated way, connected with the critical factors.
Once the management is aware of these two weaknesses, the most important issues that must be addressed for a successful implementation are the following (McQuater et al., 1995; Bunney and Dale, 1997):
5. Discussion
The results indicate that TQM tools andtechniques are, alongside critical factors, another important component of TQM, which emphasizes their importance for the improvement of TQM levels and results. Therefore, firms must develop both the hard and the soft parts of TQM in order to succeed. This may indicate that TQM is effective, which may lead to market orientation (Lai, 2003) and positive performance (Hendricks and Singhal, 1997).
A positive correlation has been found between these tools and techniques and the TQM level and TQM results of firms, and also that those firms with higher TQM levels and better results are those which most widely apply TQM tools and techniques. Therefore, these findings indicate that tools and techniques for quality improvement are necessary for TQM to succeed; and the manage- ment should also consider these tools and techni- ques in order to advance towards total quality. The results particularly seem to stress two aspects:
Ensure managerial understanding of and com-mitment to these techniques and tools. Training, which should be undertaken just in time and given in such a way that employees can practice what has been taught in a step-by- step manner.
*
1. All firms carry out quality audits, as part of theISO 9000 norm, and most of them use graphs. However, few firms use the basic tools, which is where most emphasis must be made by man- agers.
*

278 J.J. Tar!ı, V. Sabater / Int. J. Production Economics 92 (2004) 267–280
Using a planned approach for the applicationand use of tools and techniques. In these last two cases, the results of Table 7 show how personnel management (training, employee recognition and communication) and quality planning, correlate positively and significantly with the use of TQM tools and techniques.
which have not. In this respect, although theresults cannot be extrapolated statistically to other firms in Spain or in Europe, a logical extrapolation (i.e. a generalization based on qualitative criteria) can be made, since the factors identified agree with those established in the EFQM model and we have identified commonly used tools and techniques.
Therefore, the use of tools and techniques for quality improvement is necessary for quality improvement and, although not included in ISO 9000 and frequently disregarded, it is an important sign of TQM maturity, which managers must implement in their firms in order to improve their TQM level and results.
This means that many firms, when they begin their first steps towards TQM (ISO 9000) can use few tools (audits, graphics), and they may even be used only by quality managers or other managers. When they improve their TQM level, they tend to use other tools to a greater extent.
In addition, on the one hand, the weakness of certified firms is a lack of support for and commitment towards the use of tools and techni- ques for quality improvement, mainly regarding the basic tools; on the other hand, it must also be admitted that there are some companies that have not benefited from and improved their perfor- mance by using these techniques and tools. The solution can be found in a higher managerial commitment, promoting their use among all the employees, together with a planning and training process covering teamwork methods and the use of these tools and practices; this would increase the firm’s TQM maturity level and its TQM results. In other words, managers may encourage a higher number of employees to use these techniques in a way that benefits the whole firm.
Perhaps the most interesting point of this study lies in the fact that, having focused our attention on a group of certified firms, we have had the opportunity to offer empirical evidence about the importance of techniques and tools of TQM in the quality improvement process. Our work builds on previous studies in this area, and complements other research work which generally focused on techniques and tools of TQM. However, it presents new results evidencing the importance of these techniques and tools for quality management,
*
Considering the results for this study, therespondents’ opinions and our experience, we believe that techniques and tools can contribute to improving the level of TQM if a climate of managerial commitment is created. This means that techniques and tools are a reliable indicator of a superior level of TQM and therefore, of a superior performing company in terms of quality, cost, etc.
Finally, concerning the characteristics of certi- fied firms (size and sector), it can be observed that there are significant differences as regards the TQMT variable. As a rule, in the secondary sector TQM tools and techniques have a wider applica- tion (p ¼ 0:018), and smaller firms use the TQMtools and techniques to a lower extent (p ¼ 0:015).Therefore, managers of small and service firmsshould not forget the tools and techniques for quality improvement as an important part of TQM, and should not fail to encourage their use by a higher number of employees. This applies mostly to basic tools and techniques, which, as the results of our study seem to indicate, are the least
6. Conclusions
The results show that there is a positivecorrelation, on the one hand, between a firm’s TQM level and the use of tools and techniques for quality improvement, and on the other, between TQM results and such tools and techniques. When firms have a wider implementation of TQM critical factors, they are more interested in the usage of these tools and techniques, which may improve their TQM results. These results are applicable to certified firms in the Alicante area, because there are no significant differences between those firms which have been interviewed and those firms

J.J. Tar!ı, V. Sabater / Int. J. Production Economics 92 (2004) 267–280
279
and may be used by managers to discover thepotential benefits of the use of quality tools and techniques.
Finally, these contributions could be suitablycomplemented by future research work in three directions: studying these aspects in a larger firm sample, analyzing case studies in order to verify the use of these tools and techniques and studying companies which use a range of quality methods but are not certified.
Deming, W.E., 1982. Quality, Productivity and CompetitivePosition. MIT Center for Advanced Engineering, Cam- bridge, MA.
Easton, G.S., Jarrell, S.L., 1998. The effects of total quality management on corporate performance, an empirical investigation. Journal of Business 71 (2), 253–307.
Ebrahimpour, M., Withers, B.E., Hikmet, N., 1997. Experi-ences of US- and foreign-owned firms: A new perspective on ISO 9000 implementation. International Journal of Produc- tion Research 35 (2), 569–576.
Evans, J.R., Lindsay, W.M., 1999. The Management and Controlof Quality. South-Western College Publishing, Cincinnati, OH.
Feigenbaum, A.V., 1991. Total Quality Control. McGraw-Hill,New York.
Flynn, B.B., Schroeder, R.G., Sakakibara, S., 1994. A frame- work for quality management research and associated measurement instrument. Journal of Operations Manage- ment 11 (4), 339–366.
Goetsch, D.L., Davis, S.B., 1997. Introduction to TotalQuality, Quality Management for Production, Processing, and Services. Prentice-Hall, Englewood Cliffs, NJ.
Govers, C.P.M., 2001. QFD not just a tool but a way of quality
management. International Journal of Production Econom- ics 69 (2), 151–159.
Grandzol, J.R., Gershon, M., 1998. A survey instrument forstandardizing TQM modelling research. International Jour- nal of Quality Science 3 (1), 80–105.
Hellsten, U., Klefsjo. , B., 2000. TQM as a management system
consisting of values, techniques and tools. The TQM Magazine 12 (4), 238–244.
Hendricks, K., Singhal, V., 1997. Does implementing aneffective TQM program actually improve operating perfor- mance? Empirical evidence from firms that have won quality awards. Management Science 43 (9), 1258–1274.
Imai, M., 1986. Kaizen, the Key to Japan’s CompetitiveSuccess. McGraw-Hill, New York.
Ishikawa, K., 1985. What is Total Quality Control? The Japanese Way. Prentice-Hall, London.
Juran, J.M., 1988. On Planning for Quality. Collier Macmillan, London.
Kanji, G.K., 1998. An innovative approach to make ISO 9000 standards more effective. Total Quality Management 9 (1), 67–78.
Lai, K.-H., 2003. Market orientation in quality-orientedorganizations and its impact on their performance. Inter- national Journal of Production Economics 84 (1), 17–34.
Madu, C.N., 1998. An empirical assessment of quality, researchconsiderations. International Journal of Quality Science 3 (4), 348–355.
Mart!ınez, A.R., Gallego, A., Dale, B.G., 1998. Total quality
management and company characteristics: An examination. Quality Management Journal 5 (4), 59–71.
McConnell, J., 1989. The Seven Tools of TQC, 3rd edition. TheDelaware Group, NSW.
McQuater, R.E., Scurr, C.H., Dale, B.G., Hillman, P.G., 1995.
References
Adam, E., Corbett, L., Flores, B., Harrison, N., Lee, T., Rho,B., Ribera, J., Samson, D., Westbrook, R., 1997. An international study of quality improvement approach and firm performance. International Journal of Operations and Production Management 9 (17), 842–873.
Ahire, S.L., Golhar, D.Y., Waller, M.A., 1996. Developmentand validation of TQM implementation constructs. Deci- sion Sciences 27 (1), 23–56.
Badri, M.A., Davis, D., Davis, D., 1995. A study of measuring the critical factors of quality management. International Journal of Quality & Reliability Management 12 (2), 36–53.
Bayo-Moriones, A., Merino-D!ıaz, J., 2001. Quality manage-
ment and high performance work practice: Do they coexist? International Journal of Production Economics 73 (3), 251–259.
Black, S.A., Porter, L.J., 1995. An empirical model for total quality management. Total Quality Management 6 (2), 149–164.
Boje, D.M., Winsor, R.D., 1993. The resurrection of Taylorism: Total quality management’s hidden agenda. Journal of Organizational Change Management 6 (4), 57–70.
Bunney, H.S., Dale, B.G., 1997. The implementation of quality management tools and techniques: A study. The TQM Magazine 9 (3), 183–189.
Churchill, G.A., Peter, P., 1984. Research design effects on thereliability of rating scales: a meta-analysis. Journal of Marketing Research 21 (4), 98–104.
Crosby, P.B., 1979. Quality is Free, the Art of Making Quality Certain. Hodder & Stoughton, New York.
Dale, B.G., 1999. Managing Quality. Blackwell Publishers, Oxford.
Dale, B.G., McQuater, R., 1998. Managing Business Improve-ment & Quality: Implementing Key Tools and Techniques. Blackwell Business, Oxford.
Das, A., Handfield, R.B., Calantone, R.J., Ghosh, S., 2000. A contingent view of quality management—the impact of international competition on quality. Decision Sciences 31 (3), 649–690.
Dean, J.W., Evans, J.R., 1994. Total Quality, Management, Organization and Strategy. West Publishing Company, St. Paul, MN.

280 J.J. Tar!ı, V. Sabater / Int. J. Production Economics 92 (2004) 267–280
Peterson, R.A., 1994. A meta-analysis of cronbach’s coefficientalpha. Journal of Consumer Research 21 (2), 381–391.
Powell, T.C., 1995. Total quality management as competitive advantage, a review and empirical study. Strategic Manage- ment Journal 16 (1), 15–37.
Quazi, H.A., Jemangin, J., Kit, L.W., Kian, C.L., 1998. Critical factors in quality management and guidelines for self- assessment, the case of Singapore. Total Quality Manage- ment 9 (1), 35–55.
Rao, S.S., Solis, L.E., Raghunathan, T.S., 1999. A frameworkfor international quality management research: Develop- ment and validation of a measurement instrument. Total Quality Management 10 (7), 1047–1075.
Rayner, P., Porter, L.J., 1991. BS5750/ISO 9000—The experi-ence of small and medium sized firms. International Journal of Quality & Reliability Management 8 (6), 16–28.
Ritchie, L., Dale, B.G., 2000. Self-assessment using the business excellence model: A study of practice and process. Interna- tional Journal of Production Economics 66 (3), 241–254.
Saraph, J.V., Benson, P.G., Schroeder, R.G., 1989. An instrument for measuring the critical factors of quality management. Decision Sciences 20 (4), 810–829.
Sitkin, S.B., Sutcliffe, K.M., Schroeder, R.G., 1994. Distin- guishing control from learning in total quality management, a contingency perspective. Academy of Management Re- view 19 (3), 537–564.
Sohal, A.S., Ramsay, L., Samson, D., 1991. Quality manage- ment practices in Australian industry. Total Quality Management 3 (3), 283–299.
Sousa, R., Voss, C.A., 2002. Quality management re-visited: Areflective review and agenda for future research. Journal of Operations Management 20 (1), 91–109.
Spector, B., Beer, M., 1994. Beyond TQM programmes.Journal of Organizational Change Management 7 (2), 63–70.
Stephens, B., 1997. Implementation of ISO 9000 or Ford’s Q1award: Effects on organizational knowledge and application of TQM principles and quality tools. The TQM Magazine 9 (3), 190–200.
Van de Ven, A., Ferry, D., 1979. Measuring and Assessing Organizations. Wiley, New York.
Van der Wiele, A., Dale, B.G., Williams, A.R.T., 2000. ISO 9000 series and excellence models: Fad to fashion to fit. Journal of General Management 25 (3), 50–66.
Wilkinson, A., Redman, T., Snape, E., Marchington, M., 1998.Managing With Total Quality Management: Theory and Practice. MacMillan, London.
Withers, B.E., Ebrahimpour, M., 2001. Impacts of ISO 9000 registration on European firms: A case analysis. Integrated Manufacturing Systems 12 (2), 139–151.
Zackrisson, J., Franze!n, M., Melbin, M., Shahanavaz, H., 1995.
Quality by a step-by-step program in low scale industries. International Journal of Production Economics 41 (1–3), 419–427.
Zhang, Z., 2000. Developing a model for quality manage- ment methods and evaluating their effects on busi- ness performance. Total Quality Management 11 (1), 129–137.