evaluating a news-aware quantitative trader: the effect of ...robschumaker.com/publications/jasist -...
TRANSCRIPT

Evaluating a News-Aware Quantitative Trader: The Effect of Momentum and Contrarian Stock Selection Strategies Robert P. Schumaker and Hsinchun Chen Artificial Intelligence Lab, Department of Management Information Systems The University of Arizona, Tucson, Arizona 85721, USA {rschumak, hchen}@eller.arizona.edu
Word Count: 6717
Abstract We study the coupling of basic quantitative portfolio selection strategies with a financial
news article prediction system, AZFinText. By varying the degrees of portfolio formation time,
we found that a hybrid system using both quantitative strategy and a full set of financial news
articles, performed the best. With a 1-week portfolio formation period we achieved a 20.79%
trading return using a Momentum strategy and a 4.54% return using a Contrarian strategy over a
five-week holding period. It was also found that trader overreaction to these events led
AZFinText to capitalize on these short-term surges in price.
Keywords: Knowledge management, prediction from textual documents, quantitative funds

2
1. Introduction Predicting activity in the stock market has always had a certain appeal to researchers. While
numerous attempts have been made, the difficulty has always centered on the behaviors of
human traders within this socially constructed system. With behavioral parameters not fully
defined and constantly changing, making accurate predictions in this environment has been
difficult. To further create confusion, there are two diametrically opposed philosophies of stock
market research; fundamental and technical analysis techniques (Technical Analysis 2005).
While fundamental analysis leverages the security’s relative data, ratios and earnings, technical
analysis utilizes charts and modeling techniques based on historical trading volume and pricing.
The main issue between them becomes Can the market be timed or not?
Information technology and the desire for information are constantly changing the way
brokerage houses and securities analysts are approaching securities trading (Baldwin and Rice
1997). With the advent of cheaper processing and knowledge acquisition techniques, the roles of
computers in stock prediction has increased dramatically, where they have become mostly
automated versions of existing fundamental and/or technical strategies. Their goal is to achieve
better returns than their human counterparts by removing the elements of emotions and biases
from trading (Jelveh 2006). The downside of these systems is that they lack intuition and
context where they continue buying battered stocks even after unfavorable news events, such as
losing a costly court battle. These systems instead rely on news events being translated to
numeric data before appropriate decisions can be made. This problem introduces serious lag-
time into decisions and in some cases, trades must be overridden by human analysts.
The motivation of this paper is the following. We plan to build and test a hybrid quantitative
system that incorporates both traditional quantitative trading strategies and a financial news

3
article prediction piece. We plan to test various quantitative strategies and couple them with a
financial news article prediction engine to find an optimal trading system.
This paper is arranged as follows. Section 2 provides an overview of literature concerning
Stock Market prediction, textual representations and quantitative portfolio building techniques.
Sections 3 and 4 describe our proposed approaches and the AZFinText system respectively.
Section 5 provides an overview of our experimental design. Section 6 details our experimental
findings and discusses their impact on stock market prediction. Section 7 delivers our
conclusions and a brief discourse on future research directions.
2. Literature Review Within stock market research, there have been two theories that have had a significant impact
on predicting security prices; Efficient Market Hypothesis (EMH) and Random Walk Theory. In
Fama’s EMH, the price of a security is a reflection of complete market information and
whenever a change in financial outlook occurs, the market instantly adjusts the price of the
security to reflect this new information (Fama 1964). Within EMH the amount of information
can be varied to encompass three distinct levels; the weak form, the semi-strong and the strong
form. In weak EMH, only historical data is embedded within the current price. The semi-strong
form goes a bit farther by incorporating historical and current public information into its prices.
The strong form includes historical, current public information and private information, such as
Insider Trading. From this theory, it was believed that markets behaved efficiently and that
instantaneous price corrections would make prediction models useless.
Random Walk Theory is similar to the Semi-Strong EMH model where it is assumed that all
information is contained within the current price which makes it worthless for future prediction.
This theory is slightly different in its approach by insisting that short-term price movements are

4
indistinguishable from random activities (Malkiel 1973). This random activity produces
unpredictable prices and makes it impossible to consistently outperform the market.
Studying the decisions of traders and the micro-effects of trading behavior on the scale of a
market exchange is extremely difficult. However, to obviate this difficulty and test the impact of
fundamental and technical trading strategies, LeBaron created an artificial stock market with
simulated traders which can be dissected to inspect individual trading decisions (LeBaron,
Arthur et al. 1999). He introduced new pieces of information into the market and adjusted the
amount of time between when an individual trader would receive information and act upon it. It
was found that traders with longer waiting times would form fundamental strategies (latching
onto company performance data) while those that waited less time developed technical strategies
(such as timing trades). This study had a more important contribution because it discovered a lag
existed between the time that information was introduced to when the market would correct itself
to equilibrium. This apparent delay in market behavior helped to dispel the instantaneous
correction notions of EMH and lent support to the idea that the stock market could be forecast in
short durations following the introduction of new information. Subsequent research into how
long this short duration of time is, led to the discovery of a twenty minute window of opportunity
before and after a financial news article is released (Gidofalvi 2001). Within this window, weak
prediction of the direction of a stock price was found to be possible.
2.1 Financial News Articles The introduction of new information into the market happens all the time. While rumors,
eavesdropping and scandals can all move security prices, financial news articles are a more
stable and generally a more trustworthy source, which has prompted some to declare news to be
another form of commodity (Mowshowitz 1992) that can have differing values (Raban and

5
Rafaeli 2006). However, the exact relationship between financial news articles and stock price
movement is complex. While the information contained in financial news articles can have a
visible impact on a security’s price (Wuthrich, Cho et al. 1998; Lavrenko, Schmill et al. 2000a;
Gidofalvi 2001; Mittermayer 2004), sudden price movements can still occur from large
unexpected trades (Camerer and Weigelt 1991).
The first challenge of textual financial prediction is to process the large amounts of textual
information that exist for securities. This material includes required reports such as periodic
SEC filings, press releases and financial news articles reporting both unexpected events and
routine news. These documents can be automatically parsed using Natural Language Processing
(NLP) techniques and can identify the specific article terms most likely to cause dramatic share
price changes. This method can take advantage of arbitrage opportunities faster than human
counterparts by repeatedly forecasting price fluctuations and executing immediate trades.
Obtaining timely financial documents from Web sources is a critical step. Luckily there are a
variety of financial news aggregation sites that provide such services. One of which is Comtex
which offers real-time financial news in a subscription format. Another source is PRNewsWire
which offers free real-time and subscription-based services. By contrast, Yahoo Finance is a
compilation of 45 different news sources including the Associated Press, Financial Times and
PRNewsWire among others. This source provides a variety of perspectives and timely news
stories regarding financial markets.
2.2 Textual Representation Once we have gathered the financial news articles, we must ultimately represent their
important features in some machine-friendly form. This representation could take the form of
article summarization (McKeown 1995), event detection (Li, Wang et al. 2005) or tokenization.

6
One such tokenization technique is to use a Bag of Words approach which has been extensively
used in textual financial research (Lavrenko, Schmill et al. 2000a; Gidofalvi 2001). This process
involves removing the meaningless stopwords such as conjunctions and declaratives from the
text and using what remains as the textual representation. While this method has been popular, it
suffers from noise issues associated with seldom-used terms as well as problems of scalability
where immense computational power is required for large datasets. An improved
representational system which addresses a majority of these shortcomings is Noun Phrases. This
representation retains only the nouns and noun phrases within a document and has been found to
adequately represent the important article concepts (Tolle and Chen 2000). As a consequence,
this technique uses fewer terms and can handle article scaling better than Bag of Words. A third
representational technique is Named Entities, which is an extension of Noun Phrases. It
functions by selecting the proper nouns of an article that fall within well-defined categories.
This process uses a semantic lexical hierarchy (Sekine and Nobata 2004) as well as a
syntactic/semantic tagging process (McDonald, Chen et al. 2005) to assign candidate terms to
categories. Selected categorical definitions are prescribed by the Message Understanding
Conference (MUC-7) Information Retrieval task and they encompass the entities of date,
location, money, organization, percentage, person and time. This method allows for better
generalization of previously unseen terms. It also does not possess the scalability problems
associated with a semantics-only approach. A fourth representational technique is Proper Nouns
which functions as an intermediary between Noun Phrases and Named Entities. This
representation is a subset of Noun Phrases which selects specific nouns and is also a superset of
Named Entities, but without the constraint of pre-defined categories. This representation
removes the ambiguity associated with those particular proper nouns that could be represented

7
by more than one named entity category or fall outside one of the seven defined Named Entity
categories. In a comparison study using these four representational techniques, it was found that
Proper Noun representation was more effective in symbolizing financial news articles
(Schumaker and Chen 2006).
Simply assigning one representational mechanism is not sufficient to address the scalability
issues associated with large datasets. A common solution to this problem is to introduce a term
frequency threshold (Joachims 1998). This method uses a term frequency cut-off to represent
article terms that appear more frequently. This technique has the dual effect of eliminating noise
from lesser used terms and reducing the number of features that need to be represented.
Following this line of research, machine learning algorithms are unable to process raw article
terms and require an additional layer of representation. A popular method is to represent the
terms in binary where the term is either present or not in a given article (Joachims 1998). This
solution leads to sparse matrices where the number of represented terms throughout the dataset
will greatly outnumber the terms used in an individual article.
Once financial news articles are represented, computers can then begin the task of identifying
patterns of predictable behavior. One accepted method, Support Vector Regression (SVR), is a
regression equivalent of Support Vector Machines (SVM) but without the aspect of classification
(Vapnik 1995). Like SVM, SVR attempts to minimize its fitting error while maximizing its goal
function by fitting a regression estimate through a multi-dimensional hyperplane. This method is
also well-suited to handling textual input as binary representations and has been used in similar
financial news studies (Tay and Cao 2001; Schumaker and Chen 2006).

8
2.3 Quantitative Portfolio Building There is a variety of investor considerations involved in building a stock portfolio. In Figure
1, we illustrate a taxonomy of the major portfolio-building considerations partially based on the
works of Torre and Rudd (Torre and Rudd 2004).
Figure 1. A Taxonomy of Quantitative Portfolio Building
From this taxonomy, there are several investment considerations that can be used to filter the
number of stocks to choose from. These considerations could involve Social Responsibility,
such as the energy consumption or environmental practices of companies, diversification issues
where balancing portfolios in a mix of sectors may be a goal or asset liquidity where a high
degree of liquidity in investments is needed to manage cash flow or seizing upon opportunities.
Each of these filters can be particular to the goals of the investor.
Similarly, there are some factors worth considering in selecting a portfolio; investment risk,
the effect of taxes, and growth and value stock selection approaches.
Risk is the dimension of investment that focuses on the risk tolerance of the Investor. This is
usually a factor of age and/or investment goals, where low risk can provide a steady income and
high risk can lead to high payoffs or losses. Taxes involve the tax consequences of investments
and can sometimes play a role in asset selection. The choices between sheltered and non-
sheltered investments and the effects of estate and capital gains taxes can all be a factor in stock
selection.

9
While Risk level and Tax consequences are important factors in portfolio building, Growth
and Value form two major criterion for stock selection (Fama and French 1998). Growth looks
for above-average returns and a reasonable profit. Stocks under the Growth factor will generally
have Earning Per Share (EPS) of greater than 20%. On the other hand, Value looks for out of
favor stocks that are currently being ignored by the market. These stocks have low Price to
Earnings (P/E), low price to book and sometimes high dividends to attract buyers.
Both Growth and Value have differing stock selection strategies. One of the more common
approaches is the Securities Market Line (SML) approach which seeks to balance portfolio risk
and return through a mathematical process of stock selection. A variety of techniques have used
the SML approach and differ mainly in the exact mathematics used or external factors evaluated.
These strategies include Modern Portfolio Theory (MPT), Capital Asset Pricing Model (CAPM)
and Arbitrage Pricing Theory (APT).
In MPT, assets are priced by balancing the potential risk and return of adding one more stock
to an existing portfolio (Markowitz 1952). CAPM prices assets by discounting future cash flows
(Sharpe 1964) and APT prices assets by a function of risk and macro-economic factors (Ross
1976). APT further requires perfect competition which may not be an ideal choice for real-world
application.
There are other selection strategies that do not use the SML approach. These include Growth
at a Reasonable Price (GARP), Intrinsic Value and Momentum/Contrarian strategies. GARP
balances Growth and Value by selecting securities based on good growth (e.g., EPS > 20%) and
reasonable pricing (e.g., P/E < EPS growth rates). Intrinsic Value is a fundamental analysis of
stocks to derive what the price of the security should be. Another selection strategy that does not
use the SML approach is Momentum and Contrarian. In Momentum/Contrarian strategies,

10
stocks are selected based upon recent returns, with the expectation that past winning stocks will
continue to win and that past losers will continue to lose. This strategy is easy to implement, has
been widely studied and is susceptible to movement from financial news articles.
In the Momentum/Contrarian strategies, there is a portfolio formation period of f where
returns are analyzed and stocks are selected, and a holding period h where the stocks are
generating their returns. The first step involves analyzing the stock returns within period f. Step
two is a rank ordering of these returns. Then finally selecting the top fraction of stocks for
period h is a Momentum strategy while selecting the bottom fraction of stocks is a Contrarian
approach. From prior literature, it was found that past winning stocks will continue to
outperform in intermediate-term horizons of 3-12 months (Jegadeesh and Titman 1993), while
past losing stocks will turn-around and outperform in short-term horizons of weeks or months
(Jegadeesh 1990; Lehmann 1990) and longer-term horizons of 3-5 years (De Bondt and Thaler
1985; De Bondt and Thaler 1987).
In order to implement these strategies, a determination of the length of the formation period
and the exact threshold of stocks to use, must be determined. In selecting the period of f, there
have been several implementations. One of which is to assign f = h – 1 (Gervais, Kaniel et al.
2001), or make period f and h equivalent (Conrad and Kaul 1998), or even assign f to be a series
of values less than or equal to h (Kang, Liu et al. 2002), where the latter implementation provides
a more robust model of strategies.
As for determining the top/bottom fractional cutoff for portfolio selection, there have also
been several different instantiations. One is to assign the cutoff at 10% of stocks (Chan,
Jegadeesh et al. 1996), or the more typically used 20% threshold (Lo and MacKinlay 1990;
Jegadeesh and Titman 1993; Kang, Liu et al. 2002), and even 33% of stocks (Chan 2003).

11
While Momentum and Contrarian strategies are generally linked to price, there are several
approaches other than price. The first of which is earnings, where the momentum of earnings
surprises can have an effect on current estimates (Chan, Jegadeesh et al. 1996). Second, in using
a dividend contrarian strategy, Asness found a strong relation between dividend yield and the
contrarian returns (Asness 1997). Rouwenhorst studied the effects of market capitalization and
found that larger companies were more prone to Momentum because of their market exposure
(Rouwenhorst 1998). In terms of Volume, Gervais et. al., found that stocks with unusually high
or low trading volumes outperform those with normal trading volumes (Gervais, Kaniel et al.
2001). However, using price returns is the most common usage of these strategies.
The reason behind the success of Momentum and Contrarian strategies is mainly because of
investor’s under or overreaction to news events. Investors tend to overweight recent information
(overreaction) and underweight past information (underreaction) (De Bondt and Thaler 1985).
This overreaction was found to be a result of price shocks which cause excess trading volume
and volatility (Chan and Franklin 2003). Underreaction is when investors do not react quickly
enough to a news event (Forner and Marhuenda 2003). However, the reaction times are
generally measured in terms of weeks, months and years following a news event in which price
drift is evident and not in terms of minutes following a news release.
From this study of prior research, we identified several gaps which we plan to investigate.
While Momentum and Contrarian strategies are well-understood in horizons of weeks or longer,
short-term linkage to news event releases has not been studied. Will investors overreact to news
events within the minutes following the release of a news article? We can indirectly measure
this by applying basic quantitative strategies to an existing financial news prediction system and
predict where the stock should be according to the news article terms.

12
3. Research Questions From these gaps, we have formulated several research questions. The first of which is:
• What is the predictive effect of combining Quantitative strategies with a financial news article prediction system?
While we know from the literature that both Quantitative and financial news article systems
provide superior price predictions, combining the two may provide a better predictive
mechanism.
As a follow-up to this question, we also ask:
• Should a combined system use all financial news articles or only the articles of companies selected by the Quantitative strategy?
4. System Design In order to properly evaluate our research questions, we adapted the AZFinText system
(Schumaker and Chen 2007) to make predictions from a predetermined quantitative portfolio.
Figure 2 illustrates the AZFinText system design.
Figure 2. AZFinText system design
From the AZFinText system design in Figure 2, there are several major components to
describe in detail. The first component is Numerical Data which gathers stock price data in one

13
minute increments from a commercially available stock price database. The second component
is Textual Analysis. This component gathers financial news articles from Yahoo Finance and
represents them by their proper nouns. This module further limits extracted features to three or
more occurrences in any document, which cuts down the noise from rarely used terms (Joachims
1998).
For the textual analysis portion of AZFinText, we modified the Arizona Text Extractor
(AzTeK) system to extract the proper nouns from financial news articles (McDonald, Chen et al.
2005). Although the AzTeK system was selected due to availability, it was found to perform
adequately for proper noun extraction. There are many other such systems as reported in the
Message Understanding Conference (McDonald, Chen et al. 2005), that can be adopted for this
type of analysis.
Once this data has been gathered, AZFinText makes its predictions on each financial news
article. From prior empirical testing, we found that including the proper noun representations
and the stock price at the time the news article was released, provided AZFinText with superior
predictive performance compared to other textual representations and different pieces of price
information (Schumaker and Chen 2006).
Within the Model Building stage of AZFinText, we partitioned the data gathered in order to
best answer our research questions. In the cases of the Quantitative strategies, this involved
buying or shorting those stocks within the quantitative portfolio; Momentum and Contrarian.
For the machine learning algorithm we chose to implement the SVR Sequential Minimal
Optimization (Platt 1999) function through Weka (Witten and Eibe 2005). This function allows
for discrete numeric prediction instead of classification. In keeping with prior research, we
selected as parameters a linear kernel and ten-fold cross validation in our SVR algorithm

14
(Schumaker and Chen 2007). A similar prediction method was employed in the forecasting of
futures contracts (Tay and Cao 2001).
AZFinText is then trained on the data and issues price predictions for each financial news
article encountered. Evaluations are then made regarding the effect of stock returns in terms of
the quantitative models generated.
5. Experimental Design For our experiment, we selected a consecutive period of time to serve as our experimental
baseline. We selected a five-week research period of Oct. 26, 2005 to Nov. 28, 2005, which
incorporates twenty-three trading days. The five-week period of study was selected because it
gathered a comparable number of articles in comparison to prior studies: 6,602 for Mittermayer
(Mittermayer 2004) and 5,500 for Gidofalvi (Gidofalvi 2001). We also observe that the five-
week period chosen did not have unusual market conditions (e.g., sudden market or industry-
wide price fluctuations) which would be a good testbed for our evaluation and be generalizable
to other market periods. In order to identify companies with more financial news, we further
limited the scope of activity to focus on companies listed in the S&P 500 as of Oct. 3, 2005.
Articles gathered during this period were restricted to occur between the hours of 10:30am and
3:40pm. While trading starts at 9:30am, we felt it important to reduce the impact of overnight
news on stock prices and selected a period of one-hour to allow prices to adjust. The 3:40pm
cut-off for news articles was selected to disallow any +20 minute stock predictions to occur after
market hours. A further constraint was introduced to reduce the effects of confounding
variables, where two articles on the same company cannot exist within twenty minutes of each
other or both will be discarded. The above processes had filtered the 9,211 candidate news
articles gathered during this period to 2,809, where the majority of discarded articles occurred

15
outside of market hours. Similarly, 10,259,042 per-minute stock quotations, 302 analyst
recommendations and 3,937 insider transactions were gathered during this period. This large
testbed of time-tagged articles and fine-grain stock quotations allow us to perform our evaluation
systematically.
For our quantitative portfolio, we followed the work of Kang et. al., and used our study
period of Oct. 26 to Nov. 28 as our holding period h (Kang, Liu et al. 2002). Immediately
preceding this period is the portfolio formation period f, where stock price returns are rank
ordered and the top quintile of stocks becomes the Momentum portfolio while the bottom
quintile of stocks becomes the Contrarian portfolio. The length of f is varied in 1 week
increments up to 5 weeks in order to increase the model’s robustness.
To answer our first research question on finding the most profitable strategy in terms of
quantitative portfolios and financial news prediction, we created four models to test, as shown in
Figure 3.
Figure 3. Four models to analyze
From this figure, the first model utilizes quantitative strategies by themselves, by measuring
the returns of Momentum and Contrarian portfolios during the holding period under differing
formation periods. In this model, trading returns are simply the percentage difference between
the stock at the beginning and end of period h.

16
Our second and third models are hybrid systems incorporating both quantitative strategy and
financial news prediction. In these models, AZFinText is limited to performing trades on only
those companies within the Momentum or Contrarian portfolios. These models differ from one
another on the scope of financial news articles available for system training. Model two, or ‘Full
Article,’ uses all financial news articles regardless of whether they are in the quantitative
portfolio. Model three, or ‘Restricted Article,’ limits AZFinText to only those financial news
articles within the portfolio. This differentiation can help determine the value of using financial
news articles from peer organizations as a prediction tool.
The fourth model is the financial news prediction system, AZFinText, by itself. This model
is free to trade on all of the S&P500 stocks and uses all financial news articles at its disposal.
Prior research has also shown that grouping companies based on their industry sectors leads
to better results. One such grouping classification system is the Global Industrial Classification
System (GICS) which was developed by Morgan Stanley. This classification system was found
to be superior to other systems (Bhojraj, Lee et al. 2003) and is also best able to describe
analysts’ areas of expertise (Boni and Womack 2004). This method will be repeated on our
models using AZFinText, where articles are trained within each GICS Sector and then
aggregated together to determine trading returns.
While computing the trading returns of a quantitative-only strategy is straight-forward, for
the models incorporating AZFinText we utilize a modified version of Lavrenko’s Trading
Engine (Lavrenko, Schmill et al. 2000a) that examines the percentage return of the stock. When
a stock demonstrates an expected movement exceeding 1%, then $1,000 worth of that stock is
then either bought or shorted and then disposed of after twenty minutes. This modified version

17
differs from Lavrenko’s original design in regards to the dollar amount of stock bought. We
further assume zero transaction costs, consistent with Lavrenko.
An example of our system’s operation is shown in Figure 4.
Figure 4. Example of AZFinText Processing
The first part of operation is to extract financial news articles. The entire corpus of news
articles are represented by its Proper Nouns in binary as to whether or not that particular Proper
Noun feature is present in the article and then stored within the database. Concurrently, stock
quotations gathered on a per minute basis and are similarly stored. Analyst Recommendations
and Insider Transactions are also captured and stored. To build a model, we first pair together
the representational Proper Nouns and stock quotation at the time the article was released, for
each financial news article. Then, depending upon the particular model that is tested, data is
aggregated and passed to our machine learning component for training and testing. Stock price
predictions are then made for each financial news article and passed along to the evaluation
instruments.
18
In the example above, AZFinText derived a prediction price of $15.945 which is greater than
1% of the stock price at the time the article was released, $15.65. Our trading engine makes a
trade and disposes of it in twenty minutes time, for a trade return of $23.64 or 2.36%.
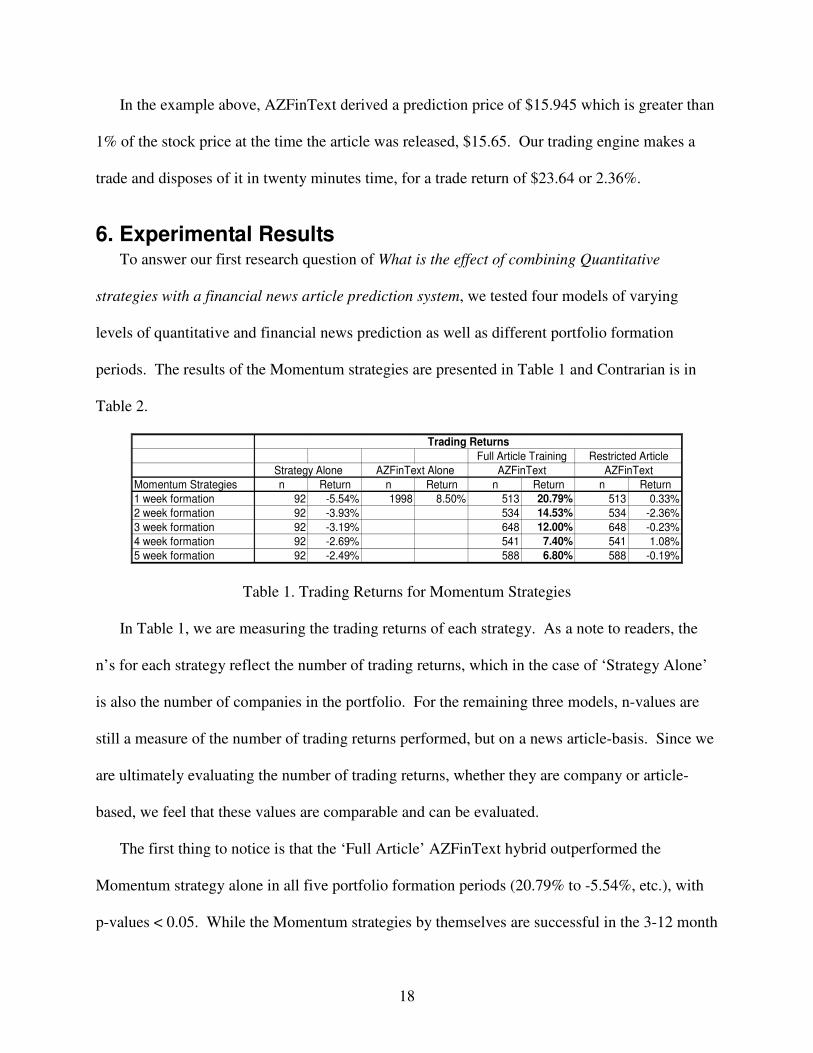
6. Experimental Results To answer our first research question of What is the effect of combining Quantitative
strategies with a financial news article prediction system, we tested four models of varying
levels of quantitative and financial news prediction as well as different portfolio formation
periods. The results of the Momentum strategies are presented in Table 1 and Contrarian is in
Table 2.
Momentum Strategies n Return n Return n Return n Return1 week formation 92 -5.54% 1998 8.50% 513 20.79% 513 0.33%2 week formation 92 -3.93% 534 14.53% 534 -2.36%3 week formation 92 -3.19% 648 12.00% 648 -0.23%4 week formation 92 -2.69% 541 7.40% 541 1.08%5 week formation 92 -2.49% 588 6.80% 588 -0.19%
Trading ReturnsFull Article Training Restricted Article
Strategy Alone AZFinText AZFinTextAZFinText Alone
Table 1. Trading Returns for Momentum Strategies
In Table 1, we are measuring the trading returns of each strategy. As a note to readers, the
n’s for each strategy reflect the number of trading returns, which in the case of ‘Strategy Alone’
is also the number of companies in the portfolio. For the remaining three models, n-values are
still a measure of the number of trading returns performed, but on a news article-basis. Since we
are ultimately evaluating the number of trading returns, whether they are company or article-
based, we feel that these values are comparable and can be evaluated.
The first thing to notice is that the ‘Full Article’ AZFinText hybrid outperformed the
Momentum strategy alone in all five portfolio formation periods (20.79% to -5.54%, etc.), with
p-values < 0.05. While the Momentum strategies by themselves are successful in the 3-12 month

19
horizon, they are not successful by themselves in the short-term, five week period of our study,
as evidenced by the negative trading returns for each of the five portfolio formation periods.
The second item of interest, is that ‘Full Article’ AZFinText outperformed ‘Restricted
Article’ AZFinText for all five portfolio formation periods (20.79% to 0.33%, etc.), p-values <
0.05. It would appear that AZFinText needs a breadth of articles from peer companies not in its
portfolio, to make better predictions.
Third, ‘Full Article’ AZFinText steadily loses returns with additional portfolio formation
time (20.79% to 14.53%, etc.), p-values < 0.05. This result most likely capitalizes on short-term
investor overreaction to news articles while the company is still in the headlines and
consequently in our portfolio. These results were not totally unexpected as Schiereck et. al.
found similar decreasing returns with increasing portfolio formation time (Schiereck, DeBondt et
al. 1999).
Fourth, in comparing ‘Full Article’ AZFinText to ‘AZFinText Alone,’ the hybrid system had
better returns for portfolio formation periods of three weeks or less (20.79% to 8.50%, etc), p-
values < 0.05. It seems that the incorporation of a Momentum strategy into AZFinText helped it
to achieve higher returns than would be ordinarily possible.
We present the results of the Contrarian strategy in Table 2.
Contrarian Strategies n Return n Return n Return n Return1 week formation 92 3.36% 1998 8.50% 505 4.54% 505 0.37%2 week formation 92 1.86% 541 13.18% 541 0.60%3 week formation 92 1.40% 432 4.87% 432 1.44%4 week formation 92 0.87% 497 11.65% 497 1.91%5 week formation 92 0.29% 490 11.94% 490 -0.08%
Trading Returns
Strategy Alone AZFinText AZFinTextFull Article Training Restricted Article
AZFinText alone
Table 2. Trading Returns for Contrarian Strategies

20
From this table, the first thing to note is that Contrarian ‘Strategy Alone’ outperformed
Momentum ‘Strategy Alone’ for all five portfolio formation periods. Prior studies noted that
Contrarian strategies by themselves are successful in the short-term (weekly, monthly) and long-
term (3-5 year) horizons. However, Contrarian’s best success of a 3.36% return was
overshadowed by an overall market return of 5.62%.
Second, ‘Full Article’ AZFinText outperformed the Contrarian ‘Strategy Alone’ for all five
formation periods (4.54% to 3.36%, etc.), p-values < 0.05. This result was similarly observed in
Momentum strategies and would imply that the addition of financial news article prediction has
helped the system achieve better returns.
Third, ‘Full Article’ again performed better than ‘Restricted Article’ for all five portfolio
formation periods (4.54% to 0.37%, etc.), p-values < 0.05. Again it would appear that
AZFinText needs a breadth of articles from companies not in its portfolio to make better
predictions.
The Contrarian ‘Full Article’ AZFinText did not perform as well against ‘AZFinText Alone’
(4.54% to 8.50%), p-value < 0.05. While the 2, 4 and 5 week portfolio formation returns of
13.18%, 11.65% and 11.94% performed better than the 8.50% of ‘AZFinText Alone,’ there was
no consistency in trading returns as a function of portfolio formation periods, as was observed in
Momentum.
In both Momentum and Contrarian, ‘Full Article’ AZFinText performed the best. However,
in comparing the two against one another, Momentum appeared stronger with sizably larger
returns. This may be from capitalizing on investor overreaction to news on companies that have
had recent success. Investors bid the stock price higher than it should be and AZFinText makes
a profit on it.

21
7. Conclusions From our investigations we found several valuable results. The first of which is that using a
Momentum strategy coupled with ‘Full Article’ training of AZFinText led to the best trading
returns. While the ‘Contrarian Alone’ strategy outperformed the ‘Momentum Alone’ strategy in
all five portfolio formation periods, coupling the financial news prediction system of AZFinText
to Momentum led to better overall performance on our five-week dataset. Furthermore, the one-
week portfolio formation time led to the best trading returns of 20.79% and most likely
capitalizes on the short-term overreaction to news articles while the company is still in the
headlines.
While more research on this phenomenon is definitely worth pursuing, we feel that our
system is taking advantage of current arbitrage opportunities that exists between the release of a
financial news article and the human analysts trading decisions. Extending our automation
process in a wide-spread fashion would limit these opportunities.
We would also suggest several future directions for this stream of research. The first of
which is to investigate the linguistic weighting of trained article terms. Within the machine
learning algorithm, certain article terms will be weighted higher than others, indicating their
prominence in predicting future prices. Investigating the impact of the most important terms will
provide insights into future tuning activities.
Second, an investigation into the type of financial news article being used would be essential.
Perhaps certain classes of news articles such as acquisitions, changes in directorships, etc. may
lead to trader sensitivity and further overreaction. Some article types may not provide additional
predictive capacity and may be omitted from prediction activity.
Third, the roles of market exchanges and market capitalization on the predictive abilities of a
financial news system is not known. Perhaps traders are more likely to pursue large-cap stocks

22
on particular exchanges and open profit-taking opportunities on the lesser traded stocks.
Analyzing these features may lead to better predictability and a better understanding of how a
financial news article system beats the market.

23
References
1. Asness, C., (1997), The Interaction of Value and Momentum Strategies. Financial Analysts Journal 53(2), 29-37.
2. Baldwin, N. and R. Rice, (1997), Information-seeking Behavior of Securities Analysts: Individuals and Institutional Influences, Information Sources and Channels, and Outcomes. Journal of the American Society for Information Science 48(8), 674-693.
3. Bhojraj, S., C. M. C. Lee, et al., (2003), What's My Line? A Comparison of Industry Classification Schemes for Capital Market Research. Journal of Accounting Research 41(5), 745-774.
4. Boni, L. and K. L. Womack, (2004), Industries, Analysts, and Price Momentum. Tuck School of Business Working Paper No. 03-12, Dartmouth College.
5. Camerer, C. and K. Weigelt, (1991), Information Mirages in Experimental Asset Markets. Journal of Business 64(4), 463-493.
6. Chan, L., N. Jegadeesh, et al., (1996), Momentum Strategies. The Journal of Finance 51(5), 1681-1713.
7. Chan, S. W. K. and J. Franklin, (2003), Dynamic Context Generation for Natural Language Understanding: A Multifaceted Knowledge Approach. IEEE Transactions on Systems, Man and Cybernetics, Part A 33(1), 23-41.
8. Chan, W., (2003), Stock Price Reaction to News and No-News: Drift and Reversal After Headlines. Journal of Financial Economics 70(2), 223-260.
9. Conrad, J. and G. Kaul, (1998), An Anatomy of Trading Strategies. The Review of Financial Studies 11(3), 489-519.
10. De Bondt, W. and R. H. Thaler, (1985), Does the Stock Market Overreact? The Journal of Finance 40(3), 793-805.
11. De Bondt, W. and R. H. Thaler, (1987), Further Evidence on Investor Overreaction and Stock Market Seasonality. The Journal of Finance 42(3), 557-581.
12. Fama, E., (1964), The Behavior of Stock Market Prices. The Journal of Business 38(1), 34-106.
13. Fama, E. and K. French, (1998), Value versus Growth: The International Evidence. The Journal of Finance 53(6), 1975-1999.
14. Forner, C. and J. Marhuenda, (2003), Contrarian and Momentum Strategies in the Spanish Stock Market. European Financial Management 9(1), 67-88.

24
15. Gervais, S., R. Kaniel, et al., (2001), The High-Volume Return Premium. The Journal of Finance 56(3), 877-919.
16. Gidofalvi, G., (2001), Using News Articles to Predict Stock Price Movements. Department of Computer Science and Engineering, University of California, San Diego.
17. Jegadeesh, N., (1990), Evidence of Predictable Behavior of Security Returns. The Journal of Finance 45(3), 881-898.
18. Jegadeesh, N. and S. Titman, (1993), Returns to Buying Winners and Selling Losers: Implications for Stock Market Efficiency. The Journal of Finance 48(1), 65-91.
19. Jelveh, Z., (2006), How a Computer Knows What Many Managers Don't. The New York Times, July 9.
20. Joachims, T., (1998). Text Categorization with Support Vector Machines: Learning with Many Relevant Features. European Conference on Machine Learning, Chemnitz, Germany.
21. Kang, J., M.-H. Liu, et al., (2002), Contrarian and Momentum Strategies in the China Stock Market: 1993-2000. Pacific-Basin Finance Journal 10(3), 243-265.
22. Lavrenko, V., M. Schmill, et al., (2000a). Language Models for Financial News Recommendation. International Conference on Information and Knowledge Management, Washington, DC.
23. LeBaron, B., W. B. Arthur, et al., (1999), Time Series Properties of an Artificial Stock Market. Journal of Economic Dynamics and Control 23(9-10), 1487-1516.
24. Lehmann, B., (1990), Fads, Martingales, and Market Efficiency. Quarterly Journal of Economics 105(1), 1-28.
25. Li, Z., B. Wang, et al., (2005). A Probabilistic Model for Retrospective News Event Detection. 28th Annual International ACM SIGIR Conference on Research and Development in Information Retrieval, Salvador, Brazil.
26. Lo, A. and C. MacKinlay, (1990), When are Contrarian Profits Due to Stock Market Overreaction? The Review of Financial Studies 3(2), 175-205.
27. Malkiel, B. G., (1973), A Random Walk Down Wall Street. New York, W.W. Norton & Company Ltd.
28. Markowitz, H., (1952), Portfolio Selection. The Journal of Finance 7(1), 77-91.
29. McDonald, D. M., H. Chen, et al., (2005). Transforming Open-Source Documents to Terror Networks: The Arizona TerrorNet. American Association for Artificial Intelligence Conference Spring Symposia, Stanford, CA.

25
30. McKeown, K., (1995). Generating Summaries of Multiple News Articles. 18th Annual International ACM SIGIR Conference on Research and Development in Information Retrieval, Seattle, WA.
31. Mittermayer, M., (2004). Forecasting Intraday Stock Price Trends with Text Mining Techniques. Hawaii International Conference on System Sciences, Kailua-Kona, HI.
32. Mowshowitz, A., (1992), On the Market Value of Information Commodities. The Nature of Information and Information Commodities. Journal of the American Society for Information Science 43(3), 225-232.
33. Platt, J. C., (1999), Fast Training of Support Vector Machines using Sequential Minimal Optimization. Advances in Kernel Methods: Support Vector Learning. B. Scholkopf, C. Burges and A. Smola. Cambridge, MA, MIT Press: 185-208.
34. Raban, D. and S. Rafaeli, (2006), The Effect of Source Nature and Status on the Subjective Value of Information. Journal of the American Society for Information Science and Technology 57(3), 321-329.
35. Ross, S., (1976), The Arbitrage Theory of Capital Asset Pricing. Journal of Economic Theory 13(3), 341-360.
36. Rouwenhorst, K., (1998), International Momentum Strategies. The Journal of Finance 53(1), 267-284.
37. Schiereck, D., W. DeBondt, et al., (1999), Contrarian and Momentum Strategies in Germany. Financial Analysts Journal 55(6), 104-116.
38. Schumaker, R. P. and H. Chen, (2006). Textual Analysis of Stock Market Prediction Using Financial News Articles. Americas Conference on Information Systems, Acapulco, Mexico.
39. Schumaker, R. P. and H. Chen, (2007), Textual Analysis of Stock Market Prediction Using Breaking Financial News: The AZFinText System. ACM Transactions on Information Systems Under Review.
40. Sekine, S. and C. Nobata, (2004). Definition, Dictionaries and Tagger for Extended Named Entity Hierarchy. Language Resources and Evaluation Conference, Lisbon, Portugal.
41. Sharpe, W., (1964), Capital Asset Prices: A Theory of Market Equilibrium Under Conditions of Risk. The Journal of Finance 19(3), 425-442.
42. Tay, F. and L. Cao, (2001), Application of Support Vector Machines in Financial Time Series Forecasting. Omega 29, 309-317.
43. Technical Analysis, The Trader's Glossary of Technical Terms and Topics. Retrieved on Mar. 15, 2005, from http://www.traders.com
26
44. Tolle, K. M. and H. Chen, (2000), Comparing Noun Phrasing Techniques for Use with Medical Digital Library Tools. JASIS 51(4), 352-370.
45. Torre, N. and A. Rudd, (2004), The Portfolio Management Problem of Individual Investors: A Quantitative Perspective. The Journal of Wealth Management 7(1), 56-64.
46. Vapnik, V., (1995), The Nature of Statistical Learning Theory. New York, Springer.
47. Witten, I. H. and F. Eibe, (2005), Data Mining: Practical Machine Learning Tools and Techniques. San Francisco, Morgan Kaufmann.
48. Wuthrich, B., V. Cho, et al., (1998). Daily Stock Market Forecast from Textual Web Data. IEEE International Conference on Systems, Man, and Cybernetics, San Diego, CA.