predicting the results of evaluation procedures of academics · (jasist, 2016) n.a. 280 computer...
TRANSCRIPT
Submitted 27 February 2019Accepted 18 May 2019Published 21 June 2019
Corresponding authorFrancesco Poggi, [email protected],[email protected]
Academic editorDiego Amancio
Additional Information andDeclarations can be found onpage 24
DOI 10.7717/peerj-cs.199
Copyright2019 Poggi et al.
Distributed underCreative Commons CC-BY 4.0
OPEN ACCESS
Predicting the results of evaluationprocedures of academicsFrancesco Poggi1, Paolo Ciancarini1,2, Aldo Gangemi3, Andrea GiovanniNuzzolese4, Silvio Peroni3 and Valentina Presutti4
1Department of Computer Science and Engineering (DISI), University of Bologna, Bologna, Italy2 Institute of Data Science and Artificial Intelligence, Innopolis University, Innopolis, Russia3Department of Classical Philology and Italian Studies, University of Bologna, Bologna, Italy4 STLab, Institute of Cognitive Science and Technologies, National Research Council, Roma, Italy
ABSTRACTBackground. The 2010 reform of the Italian university system introduced the NationalScientific Habilitation (ASN) as a requirement for applying to permanent professorpositions. Since the CVs of the 59,149 candidates and the results of their assessmentshave been made publicly available, the ASN constitutes an opportunity to performanalyses about a nation-wide evaluation process.Objective. The main goals of this paper are: (i) predicting the ASN results using theinformation contained in the candidates’ CVs; (ii) identifying a small set of quantitativeindicators that can be used to perform accurate predictions.Approach. Semantic technologies are used to extract, systematize and enrich theinformation contained in the applicants’ CVs, and machine learning methods are usedto predict the ASN results and to identify a subset of relevant predictors.Results. For predicting the success in the role of associate professor, our best modelsusing all and the top 15 predictors make accurate predictions (F-measure values higherthan 0.6) in 88% and 88.6% of the cases, respectively. Similar results have been achievedfor the role of full professor.Evaluation. The proposed approach outperforms the othermodels developed to predictthe results of researchers’ evaluation procedures.Conclusions. Such results allow the development of an automated system for support-ing both candidates and committees in the future ASN sessions and other scholars’evaluation procedures.
Subjects Data Science, Digital LibrariesKeywords Predictive Models, Scientometrics, Research Evaluation, Data Processing, ASN,Machine Learning, National Scientific Habilitation, Academic assessment, Science of Science,Informetrics
INTRODUCTIONQuantitative indicators have been extensively used for evaluating scientific performancesof a given research body. International institutions, national authorities, research andfunding bodies have an increasing interest on indicators, mainly based on bibliometric data,which can be used to algorithmically assess the performance of their institutions. SCImago(https://www.scimagojr.com/) (for journals), the Performance Ranking of Scientific Papersfor World Universities (http://nturanking.lis.ntu.edu.tw/) and the Academic Ranking of
How to cite this article Poggi F, Ciancarini P, Gangemi A, Nuzzolese AG, Peroni S, Presutti V. 2019. Predicting the results of evaluationprocedures of academics. PeerJ Comput. Sci. 5:e199 http://doi.org/10.7717/peerj-cs.199
World Universities (http://www.shanghairanking.com/) (for universities) are popularexamples of rankings that use bibliometric indicators to rate scientific performances.
Peer review is still the Holy Grail for research evaluation, but the pressure for morefrequent and extensive assessments of the performance of researchers, research groups andinstitutions makes bibliometry attractive. Currently, several countries use a combination ofpeer review and bibliometric indicators to allocate funding and evaluate the performanceof higher education institutions. Examples of this mixed strategy are the Excellence inResearch for Australia (ERA) and the Valutazione della Qualità della Ricerca (VQR)in Italy. The British Research Excellence Framework (REF), successor of the ResearchAssessment Exercise (RAE), is another example, in which experts can make use of citationdata as an additional input of their reviews. In many countries, bibliometric indicatorsare one of the factors that can be used for assessing individuals or institutions to allocatefunding at a national level. For instance, in Germany the impact factor of the publicationsis used in performance-based funding systems, in Finland, the reallocation system usesthe number of publications as one of the considered measures, in Norway, a two-levelbibliometric indicator is used for similar purposes, etc. (Vieira, Cabral & Gomes, 2014a).
The growing importance of quantitative indicators may be mainly explained by theiradvantages compared to peer review processes: objectivity, low time and implementationcosts, possibility of quick and cheap updates, ability to cover a large number of individuals,etc. However, in many cases peer review is still the only method available in practice, and ishence intensively used in many situations. We know that bibliometric indicators are moreaccepted in the assessment of large research bodies, but they are still used frequently forindividuals. It is, therefore, very important to benchmark bibliometric indicators againsttraditional peer assessments in real situations.
Some studies have been carried out in recent years with the main goal of finding arelation between the two methods at several levels. At national level, the relation betweenbibliometric indicators and the results of the Research Assessment Exercise (RAE) inBritain (Norris & Oppenheim, 2003; Taylor, 2011) or the Italian Triennial AssessmentExercise (VTR) (Abramo, D’Angelo & Caprasecca, 2009; Franceschet & Costantini, 2011)have been investigated. Other studies focused on the assessments of departments (Aksnes,2003) and research groups (Van Raan, 2006). Just a few works have been made at theindividual level (Nederhof & Van Raan, 1987; Bornmann & Daniel, 2006; Bornmann,Wallon & Ledin, 2008), while many analyzed the correlation between indicators andresearch performances (Leydesdorff, 2009; Franceschet, 2009). Recent works analyzed thecorrelation between traditional bibliometric indicators and altmetrics by also taking intoaccount quality assessment procedures performed by peers (Nuzzolese et al., 2019;Wouterset al., 2015; Bornmann & Haunschild, 2018). All these works share the general finding that apositive and significant correlation exists between peer review and bibliometric indicators,and suggest that indicators can be useful tools to support peer reviews.
In this work, we investigate the relation between quantitative indicators and peer reviewprocesses from a different perspective. The focus of the study is to analyze if and to whatextent quantitative indicators can be used to predict the results of peer reviews. Thisproblem is interesting for many different reasons. First of all, since a high number of
Poggi et al. (2019), PeerJ Comput. Sci., DOI 10.7717/peerj-cs.199 2/28

1The acronym ASN stands for AbilitazioneScientifica Nazionale. For the rest ofthe paper, all acronyms (e.g., ASN,MIUR, ANVUR, etc.) are based on theoriginal Italian names, since they arewell established in the Italian scientificcommunity. The English translationsare also provided for the benefit of theinternational readers.
factors are involved in peer review processes (e.g., cultural, social, contextual, scientific,etc.), the feasibility of reproducing such a complex human process through computationaland automatic methods is a relevant topic per se. Moreover, the possibility of predictinghuman assessments has many practical applications. Having an idea of the results of anevaluation procedure may be very useful for candidates (e.g., to understand if they arecompetitive for a given position, to decide to apply or not, etc.). Also, evaluators canbenefit from such information (e.g., for supporting a first screening of the candidates, forspotting possible errors to investigate, etc.). In other words, the final goal of our work is notsubstituting peer committees with automatic agents, but providing tools for supportingboth candidates and evaluators in their tasks.
This study analyzes the Italian National Scientific Habilitation (ASN1), a nation-wideresearch assessment procedure involving a large number of applicants from all academicareas. The ASN is one of the main novelties in the national university system introduced byLaw 240/2010 (Law, 2011), and it is similar to other habilitation procedures already in placein other countries (e.g., France and Germany) in that it is a prerequisite for becoming auniversity professor. The ASN is meant to attest that an individual has reached the scientificmaturity required for applying for a specific role (associate or full professor) in a givenscientific discipline; however, the qualification does not guarantee that a professorshipposition will eventually be granted. The assessments of the candidates of each discipline areperformed by committees composed of four full professors from Italian universities andone professor from a foreign research institution. The evaluation is performed consideringthe CVs submitted by the applicants and three quantitative indicators computed for eachcandidate.
The first session of the ASN started on November 2012 and received 59,149 applicationsspanning 184 Recruitment Fields (RFs), which correspond to scientific fields of study inwhich Scientific Areas (SAs) are organized. The curricula of all applicants, the values oftheir bibliometric indicators and the final reports of examination committees have beenmade publicly available. This work focuses on the analysis of applicants’ curricula. For thispurpose, we processed this vast text corpus, extracted the contained information and usedit to populate a Knowledge Graph by exploiting semantic technologies. This KnowledgeGraph contains a collection of relevant data for each applicant and it has then been usedto perform different kinds of analyses at the level of category of discipline (i.e., bibliometricand non-bibliometric), SA, and RF.
An approach based on machine learning techniques has been used to answer thefollowing research questions:
• RQ1: Is it possible to predict the results of the ASNusing only the information containedin the candidates’ CVs?
• RQ2: Is it possible to identify a small set of predictors that can be used to predict theASN results?
The rest of the work is organized as follows. ‘Related Work’ presents an overview of therelated work. ‘Methods and Material’ provides necessary background information aboutthe ASN, gives an overview of the ASN dataset, and describes the algorithms used in this
Poggi et al. (2019), PeerJ Comput. Sci., DOI 10.7717/peerj-cs.199 3/28

Table 1 Comparison of the related work with our study. Missing data are labeled with ‘‘n.a.’’. PoC stands for ‘‘Prediction of Citations’’, AoH for‘‘Analysis of H-index for peer judgements’’, and PoPJ for ‘‘Prediction of Peer Judgements’’.
Work Papers Authors Discipline Predictors Task Method
Ibáñez et al.(JASIST, 2016)
n.a. 280 Computer Science 12 PoC Gaussian Bayesian net-works
Danell(JASIST, 2011)
6,030 8,149 Neuroscience and Physics 2 PoC Quantile regression
Fu & Aliferis(Scientometrics, 2010)
3,788 n.a. Medicine 12(+ textual features)
PoC Support vector ma-chines
Lindahl(J. of Informetrics, 2018)
n.a. 406 Mathematics 4 PoC Logistic regression
Bornmann & Daniel(J. of Informetrics, 2007)
n.a. 414 Biomedicine 1 AoH Correlation analysis
Van Raan(Scientometrics, 2006)
n.a. 700 Chemistry 1 AoH Correlation and erroranalysis
Cronin & Meho(JASIST, 2006)
n.a. 31 Information Science 1 AoH Correlation analysis
Vieira, Cabral & Gomes(JASIST, 2014a)
7,654 174 Hard sciences 3(based on 12bibl. indices)
PoPJ Rank ordered logisticregression
Jensen, Rouquier & Croissant(Scientometrics, 2009)
n.a. 3,659 All 8 PoPJ Binomial regression
Tregellas et al.(PeerJ, 2018)
n.a. 363 Biomedicine 10 (3 for thebest model)
PoPJ Logistic regression,Support vector ma-chines
This work 1,910,873 59,149 All 326 PoPJ Support vector ma-chines (CFS for featureselection)
work. In ‘Results’ we describe the results of the analyses performed to answer the twoaforementioned research questions, and we evaluate our work by comparing the predictivepower of our approach with others at the state of the art. Finally, in the last two sectionswe discuss the results and draw some conclusions.
RELATED WORKQuantitative indicators have been extensively used for evaluating the scientific performanceof a given research body. Many recent studies have focused on the predictive power of suchindicators for different purposes. These works can be divided into two main groups: thosethat use bibliometric indicators to predict other indicators and those that use bibliometricindicators to predict the results of evaluation procedures performed through a peer reviewprocess or a mixed strategy (i.e., a combination of peer review and bibliometric indicators).We discuss themain recent works on this topic. To facilitate the readers, Table 1 summarizesthe main information about them and our study.
A first challenge concerns the problem of identifying a subset of bibliometric indicatorsfor predicting other bibliometric indices. Ibáñez et al. (2016) introduced an approachbased on Gaussian Bayesian networks to identify the best subset of predictive variables. The
Poggi et al. (2019), PeerJ Comput. Sci., DOI 10.7717/peerj-cs.199 4/28

approach has been tested on the data of 280 Spanish full professors of Computer Scienceusing 12 bibliometric indicators. The main drawback of the work is that no evaluation ispresented: only a test on a small sample composed of three cases is discussed in the paper.Other works focused on the prediction of papers citations. Danell (2011) used previouspublication volume and citation rate of authors to predict the impact of their articles. Theaim of this work is to investigate whether evaluations systems based on researchers’ trackrecords actually reward excellence. The study focused on two disciplines (i.e., episodicmemory research and Bose–Einstein condensate) and developed a quantile regressionmodel based on previous publication volume and citation rate to predict authors’ relativecitation rate. Anotherwork (Fu & Aliferis, 2010) faces the problemof predicting the numberof citations that a paper will receive using only the information available at publication time.The used model is based on support vector machines, and has been tested on a mixture ofbibliometric features and content-based features extracted from 3788 biomedical articles.A recent work (Lindahl, 2018) investigates the ability of four indices to predict whetheran author will attain excellence—operationalized by the indicator defined in (Bornmann,2013)—in the following four years. The developed model is based on logistic regressionand has been tested on a dataset composed of the track records of 406 mathematicians.
Only a few works focused on the problem of using bibliometric indicators to predictthe results of evaluation procedures performed through peer-review processes. Vieira,Cabral & Gomes (2014a) compare three models for predicting the success of applicants toacademic positions. The test dataset is composed of the track records of 174 candidates to27 selection processes for associate and full professor in hard sciences that took place inPortugal between 2007 and 2011. The areas of Chemistry, Physics, Biology, Mathematics,Mechanics, Geology, and Computer Science were considered. In all cases, candidates havebeen assessed by a panel of peers, producing a ranking of the applicants. Starting from 12bibliometric indicators (i.e., number of documents, percentage of cited, highly cited andciting documents, average number of authors, hnf -index, NIR, SNIP, SJR, percentage ofinternational collaborations, normalized impact and the number of Scimago’s Q1 journals)a few composite indices have been derived through a factor analysis. Following a discretechoice model, three predictive models based on Rank Ordered Logistic Regression (ROLR)have been defined. The best model is able to predict the applicants placed in the firstposition by peers in 56% of the cases. By considering the problem of predicting the relativeposition of two candidates (i.e., who will be ranked in the higher position), the best modelis able to predict 76% of the orderings. In another work (Vieira, Cabral & Gomes, 2014b),the performances of these models have been compared with a random model, observingthat in 78% of the cases the applicant placed in first position by peers has a probabilityof being placed first that is better than chance. The authors conclude that the predictionsprovided by the models are satisfactory, and suggest that they can be used as an auxiliaryinstrument to support peer judgments.
Another work tested the predictive power of eight indicators for predicting scientistspromotions (Jensen, Rouquier & Croissant, 2009). The dataset used in the study is composedof the track records of 3,659 CNRS researchers from all disciplines that have filled the CNRSreport between 2005 and 2008,whose data has been obtained by querying theWebof Science
Poggi et al. (2019), PeerJ Comput. Sci., DOI 10.7717/peerj-cs.199 5/28

database. In the same timespan, the promotions of about 600 CNRS researchers at all thefive CNRS levels have been considered. A binomial regression model (logit) has been usedto assess the overall relevance of eight quantitative indicators (h-index, normalized h-index,number of publications and citations, mean citations per paper, h-index per paper, age,gender) and to study their dependence. The results showed that the h-index is the best indexfor predicting the promotions, followed by the number of publications. Differences existbetween disciplines: in Engineering, for instance, the number of publications is the bestpredictor. A logit model based on the best overall predictor (i.e., h-index) has been testedfor each subdiscipline, leading to correct predictions in 48% of the cases. The authorsconclude that bibliometric indicators do much better than randomness, which wouldachieve 30% of guessed promotions.
A recent study (Tregellas et al., 2018) focused on the problem of predicting careeroutcomes of academics using the information in their publication records. The objectiveof the work is to identify the main factors that may predict the success of young researchersin obtaining tenure-track faculty research positions. The dataset used in this study iscomposed of the track records of 363 PhD graduates from biomedical sciences programs atthe University of Colorado from 2000 to 2015. The ratio of faculty/non-faculty members(i.e., individuals employed/not employed in faculty positions) is 12%. For each PhDgraduate, 10 indicators has been computed (i.e., sex, date of graduation, number offirst-author and non-first-author publications , average impact factor of first-author andnon-first-author publications, highest impact factor of first-author and non-first-authorpublications, weighted first-author and non-first-author publication count). Logisticregression models and support vector machines has been used to investigate and comparethe ability of the aforementioned indicators to predict career outcomes. The best predictionhas been performed by the logistic regression model using three predictors (i.e., sex, date ofgraduation, andweighted first-author publication count), showing 73% accuracy . A similarresult (i.e., 71% accuracy) has been obtained by the best model based on support vectormachines using the same predictors. The results suggest that, while sex and months sincegraduation also predict career outcomes, a strong predoctoral first-author publicationrecord may increase the likelihood of obtaining an academic faculty research position.The analysis of the results also showed for all models high negative predictive values(i.e., high accuracy in predicting those who will not obtain a faculty position), while lowpositive predictive values. This suggests that first-author publications are necessary but notsufficient for obtaining a faculty position. The main limitation of the study concerns thedataset size, since it was conducted on a small set of individuals at only one institution,focusing on a single discipline. The authors observe that it is then necessary to determinehow generalizable the current findings are. Finally, the fact that all the best models are lessthan 75% accurate suggests that variables other than those considered here are also likelyto be important factors in predicting future faculty status.
Other empirical studies focused on a single indicator (i.e., the h-index) to assess how itcorrelates with peer judgements. These works have the main limitation of being carried outon small samples for technical reasons (i.e., the difficulty of obtaining large sets of robustbibliometric data). In practice, they were generally limited to a single discipline: Bornmann
Poggi et al. (2019), PeerJ Comput. Sci., DOI 10.7717/peerj-cs.199 6/28

& Daniel (2007) studied 414 applications to long-term fellowships in biomedicine, VanRaan (2006) analyzed the evaluation of about 700 researchers in chemistry, Cronin & Meho(2006) studied 31 influential information scientists from the US.
To the best of our knowledge, no otherwork analyzed the predictive power of quantitativeindicators for predicting the results of peer judgments of researchers.
METHODS AND MATERIALThis section provides necessary background information about the ASN and describes theASN dataset, the techniques used to analyze this text corpus, and the ontology developed forstoring data in a semantic format. A description of the classification and feature selectionalgorithms used in the analyses presented in ‘‘Results’’ concludes the section.
Data from the Italian Scientific HabilitationBackgroundThe Italian Law 240/2010 (Law, 2011) introduced substantial changes in the nationaluniversity system. Before 2010, in the Italian universities there were three types of tenuredpositions: assistant professor, associate professor and full professor. The reform suppressedthe position of assistant professor and replaced it with two types of fixed term positionscalled type A and type B researcher. Type A positions last for three years and can be extendedfor other two years. Type B positions last for three years and have been conceived as astep for becoming tenured associate professor, since at the time of recruitment universitiesmust allocate resources and funding for the promotion. Each academic is bound to aspecific Recruitment Field (RF), which corresponds to a scientific field of study. RFsare organized in groups, which are in turn sorted into 14 Scientific Areas (SAs). In thistaxonomy defined by Decree 159 (Ministerial Decree 159, 2012), each of the 184 RFs isidentified by an alphanumeric code in the form AA/GF, where AA is the ID of the SA (inthe range 01-14), G is a single letter identifying the group of RFs, and F is a digit denotingthe RF. For example, the code of the RF ‘‘Neurology’’ is 06/D5, which belongs to the group‘‘Specialized Clinical Medicine’’ (06/D), which is part of the SA ‘‘Medicine’’ (06). The 14SAs are listed in Table 2, and the 184 RFs are listed in (Poggi et al., 2018b).
Under the new law, only people that attained the National Scientific Habilitation (ASN)can apply for tenured positions in the Italian university system. It is important to notethat an habilitation does not guarantee any position by itself. The ASN has indeed beenconceived to attest the scientific maturity of researchers and is a requirement for accessingto a professorship in a given RF. Each university is responsible for creating new positions fora given RF and professional level provided that financial and administrative requirementsare met, and handles the hiring process following local regulations and guidelines.
The first two sessions of the ASN took place in 2012 and 2013. Although the Law240/2010 prescribes that the ASN must be held at least once a year, the next sessionstook place in 2016 (1 session), 2017 (2 sessions) and 2018 (2 sessions). At the time ofthe writing of this article, the last session of the 2018 ASN was still in progress, and thedates of the next sessions have not yet been set. For each of the 184 RFs, the Ministry ofUniversity and Research (MIUR) appoints an examination committee for the evaluation of
Poggi et al. (2019), PeerJ Comput. Sci., DOI 10.7717/peerj-cs.199 7/28

Table 2 The 14 Italian scientific areas. For each we report the numeric ID, a three-letter code, the nameof the area and the number of RFs it contains.
ID Code Area name N. of recr.fields
01 MCS Mathematics and Computer Sciences 702 PHY Physics 603 CHE Chemistry 804 EAS Earth Sciences 405 BIO Biology 1306 MED Medical Sciences 2607 AVM Agricultural Sciences and Veterinary Medicine 1408 CEA Civil Engineering and Architecture 1209 IIE Industrial and Information Engineering 2010 APL Antiquities, Philology, Literary Studies, Art History 1911 HPP History, Philosophy, Pedagogy and Psychology 1712 LAW Law 1613 ECS Economics and Statistics 1514 PSS Political and Social Sciences 7
Total 184
the candidates. The committees are composed of five full professors who are responsible forthe evaluation of the applicants for associate and full professor. Committee members arerandomly selected from a list of eligible professors, for a total of 920 professors. Differentcommittees have been appointed for 2012, 2013 and 2016-18 sessions, respectively. In orderto apply to a session of the ASN, candidates have to submit a curriculum vitae with detailedinformation about their research activities. Although the ASN is bound to a specific RF andprofessional level, it is possible to apply in different RFs and roles. In 2012, for example,136/260 (52.3%) applicants for full professor in the RF 09/H1 (Information ProcessingSystems) also applied to 01/B1 (Informatics). Those who fail to get an habilitation cannotapply again to the same RF and level in the next session. Once acquired, an habilitationlasts for six years.
The ASN introduced two types of parameters called bibliometric and non-bibliometricindicators, respectively. Bibliometric indicators apply to scientific disciplines for whichreliable citation databases exist. The three bibliometric indicators are:
• Normalized number of journal papers• Total number of citations received• Normalized h-index.
Since citations and paper count increase over time, normalization based on the scientificage (the number of years since the first publication) is used to compute most of theindicators. The aforementioned indicators are used for all RFs belonging to the first nineSAs (01-09), with the exception of the RFs 08/C1, 08/D1, 08/E1, 08/E2, 08/F1 and thefour RFs belonging to the group Psichology (11/E). These RFs are collectively denoted asbibliometric disciplines.
Poggi et al. (2019), PeerJ Comput. Sci., DOI 10.7717/peerj-cs.199 8/28
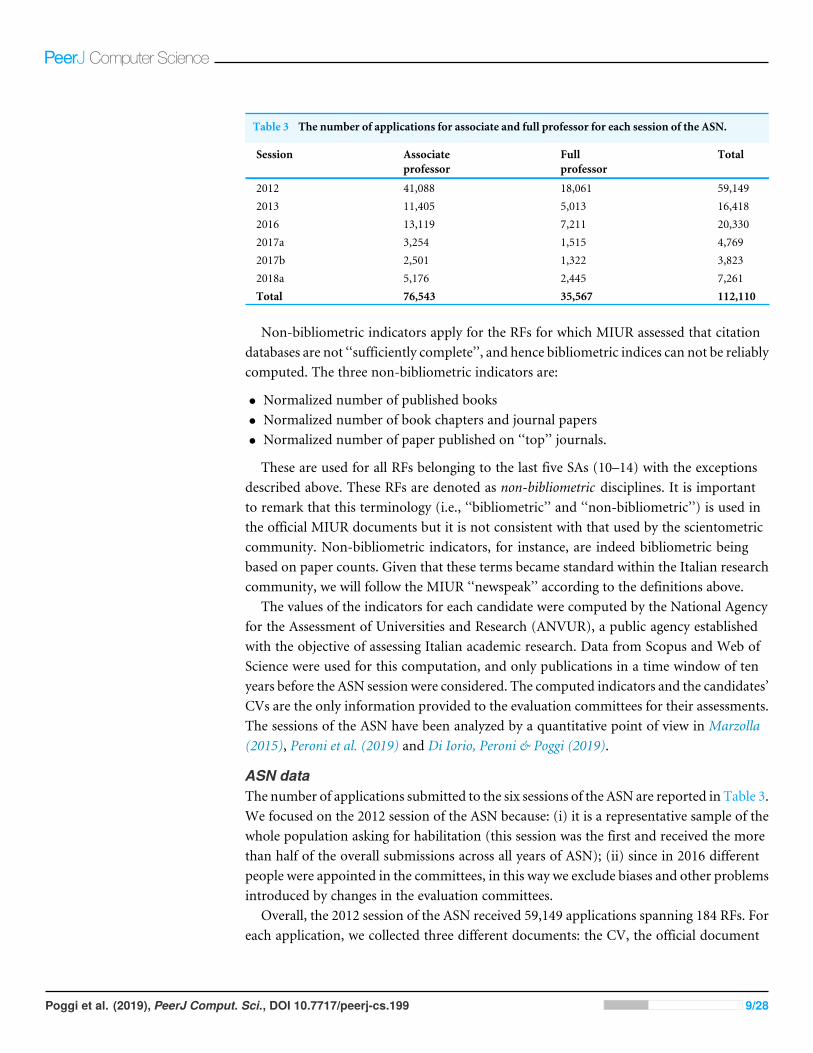
Table 3 The number of applications for associate and full professor for each session of the ASN.
Session Associateprofessor
Fullprofessor
Total
2012 41,088 18,061 59,1492013 11,405 5,013 16,4182016 13,119 7,211 20,3302017a 3,254 1,515 4,7692017b 2,501 1,322 3,8232018a 5,176 2,445 7,261Total 76,543 35,567 112,110
Non-bibliometric indicators apply for the RFs for which MIUR assessed that citationdatabases are not ‘‘sufficiently complete’’, and hence bibliometric indices can not be reliablycomputed. The three non-bibliometric indicators are:
• Normalized number of published books• Normalized number of book chapters and journal papers• Normalized number of paper published on ‘‘top’’ journals.
These are used for all RFs belonging to the last five SAs (10–14) with the exceptionsdescribed above. These RFs are denoted as non-bibliometric disciplines. It is importantto remark that this terminology (i.e., ‘‘bibliometric’’ and ‘‘non-bibliometric’’) is used inthe official MIUR documents but it is not consistent with that used by the scientometriccommunity. Non-bibliometric indicators, for instance, are indeed bibliometric beingbased on paper counts. Given that these terms became standard within the Italian researchcommunity, we will follow the MIUR ‘‘newspeak’’ according to the definitions above.
The values of the indicators for each candidate were computed by the National Agencyfor the Assessment of Universities and Research (ANVUR), a public agency establishedwith the objective of assessing Italian academic research. Data from Scopus and Web ofScience were used for this computation, and only publications in a time window of tenyears before the ASN session were considered. The computed indicators and the candidates’CVs are the only information provided to the evaluation committees for their assessments.The sessions of the ASN have been analyzed by a quantitative point of view in Marzolla(2015), Peroni et al. (2019) and Di Iorio, Peroni & Poggi (2019).
ASN dataThe number of applications submitted to the six sessions of the ASN are reported in Table 3.We focused on the 2012 session of the ASN because: (i) it is a representative sample of thewhole population asking for habilitation (this session was the first and received the morethan half of the overall submissions across all years of ASN); (ii) since in 2016 differentpeople were appointed in the committees, in this way we exclude biases and other problemsintroduced by changes in the evaluation committees.
Overall, the 2012 session of the ASN received 59,149 applications spanning 184 RFs. Foreach application, we collected three different documents: the CV, the official document
Poggi et al. (2019), PeerJ Comput. Sci., DOI 10.7717/peerj-cs.199 9/28

with the values of the three quantitative indicators described in the previous section andthe final reports of the examination committee. These documents are in PDF, and havebeen made publicly available on the ANVUR site for a short period of time. Some basicinformation and statistics about the 2012 ASN session are summarized in (Poggi et al.,2018b).
Since ANVUR did not provide a template for the habilitation, the CVs are veryheterogeneous, varying in terms of formatting, internal structure and organization. Thisheterogeneity and themassive amount of information contained in the 59,149 PDFs are twoof the main challenges faced in this work. In order to manage this problem, we developedan ontology which provides an uniform representation of the information and a referenceconceptual model. It is the basis of both the data processing and subsequent analyses, asdescribed in the following sections.
Ontology descriptionThe objective of the Academic Career (AC) ontology is to model the academic career ofscholars. AC is an OWL2 (W3C, 2012) ontology composed of fifteen modules, each ofwhich is responsible for representing a particular aspect of the scientific career of a scholar.The first two modules of the AC ontology concern personal information and publications.The next modules pertain to ten categories suggested by ANVUR:1. Participation to scientific events with specific roles (eg. speaker, organizer, attendee,
etc.)2. Involvement and roles in research groups (management, membership, etc.)3. Responsibility for studies and researches granted by qualified institutions4. Scientific responsibility for research projects5. Direction or participation to editorial committees6. Academic and professional roles7. Teaching or research assignments (fellowships) at qualified institutes8. Prizes and awards for scientific activities9. Results of technological transfer activities (e.g., spin-offs, patents, etc.)10. Other working and research experiences
The last threemodules concern scholars’ education, scientific qualifications, andpersonalskills and expertise.
Data processingThe processing of a vast set of documents such as the corpus of the ASN curricula is not atrivial task. The main issue to face in this process is the management and harmonization ofits heterogeneity in terms of kinds of information, structures (e.g., tables, lists, free text),styles, languages, just to cite a few. Nonetheless, the automatic extraction of informationfrom CVs and its systematization in a machine processable format is a fundamental stepfor this work, since all the analyses described in ‘‘Results’’ are based on these data. Forthis purpose, we developed PDF to Academic Career Ontology (PACO), a software toolthat is able to process the researchers’ CVs, extract the most relevant information, andproduce a Knowledge Graph that conforms to the AC ontology. The processing performed
Poggi et al. (2019), PeerJ Comput. Sci., DOI 10.7717/peerj-cs.199 10/28

Figure 1 An overview of the PACO toolchain composed of four sub-modules (circles). Artifacts (i.e.,inputs/outputs of the sub-modules) are depicted as rectangles.
Full-size DOI: 10.7717/peerjcs.199/fig-1
by PACO is composed of four consecutive steps, that correspond to the software modulesconstituting PACO’s architecture, as shown in Fig. 1. The processing of an applicant’s CVcan be summarized as follows:• HTML conversion: The PDF2HTML Converter takes as input a PDF and produces asoutput an HTML version of the CV composed of inline elements and presentationalelements. The structure of the document is not reconstructed in this phase. In particular,the containment relations between elements (e.g., cells in a table, items in a list, etc.)are missing. For instance, a table is converted into a series of rectangles with borders(the cells) followed by a series of inline elements (the text). All the elements are at thesame level in the output document hierarchy, and no explicit relation between them ismaintained.
• Structure re-construction: the Structure Builder uses the presentational informationcomputed in the previous phase to infer the structure of the document. Differentstrategies have been developed to recognize meaningful patterns in the presentationand reconstruct the document hierarchy. For example, a mark positioned near an inlineelement containing text is interpreted as a list item, a sequence of consecutive list itemsis interpreted as a list. The output is an XML document, in which the original textualcontent is organized in meaningful structural elements.
• Semantic analysis: the objective of the Semantic Analyzer is to annotate the output ofthe previous phase with information about its content. For example, it has to infer if alist is a list of publications, awards, projects, etc. A series of analyses is performed foreach element, from simple ones (e.g., to test if an element contains a name, surname,birth date, etc.) implemented through basic techniques such as the use of heuristicsor pattern matching, to more complex ones (e.g., to identify publications, roles, etc.)implemented using external tools and libraries. Another important technique is toleverage the homogeneity of structured elements (e.g., of all the items in a list or allthe cells of a column) to infer meaningful information about their content, usingthe approach described in (Poggi, Cigna & Nuzzolese, 2016). The basic idea is that, forinstance, if the majority of the elements of a list have been recognized as publications, itis then reasonable to conclude that also the others are publications. The output of thisphase is an XML document annotated with the results of the semantic analysis.
• Triplification: the Triplifier is responsible for populating a Knowledge Graph with theinformation inferred in the previous phase. The marked XML document is the input ofthis stage, and the output is a Knowledge Graph that conforms to the AC ontology.
Poggi et al. (2019), PeerJ Comput. Sci., DOI 10.7717/peerj-cs.199 11/28

2http://cercauniversita.cineca.it/ is aMIUR service that provides informationand statics about Italian professors,universities, degree programs, students,fundings, etc.
3TAking STock: external engagementby academics (TASTE) is an Europeanproject founded under the FP7 programthat developed a database with dataabout the relation between universitiesand enterprises in Italy—see https://eventi.unibo.it/taste.
4Semantic Scout is a service that providesCNR scientific and administrative data in asemantic format—see http://stlab.istc.cnr.it/stlab/project/semantic-scout/.
The data extracted from the applicants’ CVs by PACO have also been semanticallyenriched with information from the following external sources:
• Cercauniversita2 : for information about the candidates’ careers within the Italianuniversity system;
• TASTE database3 : for data about reserchers’ entrepreneurship and industrial activitiesfrom the TASTE database;
• Semantic Scout4 : for information about researchers of the Italian National Council ofResearch (CNR).
The final outcome of this process is the Knowledge Graph from which we computed thepredictors used in the analyses discussed in the following of this paper.
Identification of the prediction algorithmIn order to implement a supervised learning approach, we needed to create a training set inwhich the ground truth is obtained from the final reports of the examination committees.The instances of our dataset correspond to the 59,149 applications submitted to the 2012ASN. For each instance, we collected 326 predictors, 309 of which are numeric and 17are nominal. The only source of data used to build our dataset is the Knowledge Graphcontaining the data extracted from the applicants’ curricula and enriched with externalinformation.
The predictors that have been computed belong to one of the following two categories:
• numeric and nominal values extracted from the CVs (e.g., the number of publications)or derived from the CVs using external sources (e.g., the number of journal papers hasbeen computed using the publication list in the CVs and querying online databases likeScopus);
• quantitative values calculated using the values from the previous point. For example,we computed statistical indicators such as the variance of the number of journal papersfor each applicant in the last N years.
The aforementioned 326 predictors and the habilitation class feature are our startingpoint to investigate the performances of different machine learning approaches. Wedecided not to explicitly split the dataset in training and test sets, and systematically relyon cross-fold validation instead. In particular, the data reported in this work are related tothe 10-fold validation, but we have also performed a 3-fold one with very similar results.The following supervised machine learning algorithms have been tested:
• NB: Naïve Bayes (John & Langley, 1995)• KN: K-nearest neighbours classifier (K chosen using cross validation) (Aha, Kibler &Albert, 1991)
• C45: C4.5 decision tree (unpruned) (Quinlan, 2014)• RandF: Random Forest (Breiman, 2001)• SVM: Support Vector Machine trained with sequential minimal optimization (Keerthiet al., 2001).
Poggi et al. (2019), PeerJ Comput. Sci., DOI 10.7717/peerj-cs.199 12/28

Table 4 Performance of the machine learning algorithms investigated for the classification of the ap-plicants to the RF 11/E4 (level II). For each algorithm we report Precision, Recall and F-Measure values.
Precision Recall F-measure
NB 0.856 0.850 0.853KN 0.867 0.906 0.886C45 0.865 0.914 0.888RandF 0.844 1.000 0.916SVM 0.894 0.951 0.922
The rationale behind this choice is to have representatives for the main classificationmethods that have shown effectiveness in past research. All learners have been tuned usingcommon best practices. SVM has been tested with various kernels (in order to accountfor complex non-linear separating hyperplanes). However, the best results were obtainedwith a relatively simple polynomial kernel. The parameters for the resulting model havebeen tuned using the grid method (He & Garcia, 2009). We tested the learners on differentdata samples obtaining similar results for both bibliometric and non-bibliometric RFs. Forexample, Table 4 shows the results we obtained with these machine learning algorithmsfor the applicants to the RF 11/E4 (level II).
Notice that we tested the performances of the learners only with respect to the notqualified class. We do that because we are mainly interested in understanding if we canuse machine learning techniques to identify unsuccessful applicants who got not qualified.We are also reporting a limited amount of analysis data, specifically in this work we focuson precision and recall (and the related F-measure). Other aspects of the learners (suchas the ROC curve) have been analyzed in our tests but they were always aligned with theresults expressed by the three measures we are providing here. The results show that thebest classifiers are those known to perform better on feature-rich datesets. In particular,SVM outperforms the other classification methods, and for this reason has been used inthe rest of our analyses.
Feature selection algorithmIn this section we describe the technique we used to analyze the relevance of the variouspredictors for classification purposes. The task consists in identifying a small set ofpredictors that allows to perform accurate predictions of the ASN results (RQ2). In caseof a large number of predictors, several attribute engineering methods can be applied. Themost widely adopted is attribute selection, whose objective is identifying a representativeset of attributes from which to construct a classification model for a particular task. Thereduction of the number of attributes can help learners that do not perform well with alarge number of attributes. This also helps in reducing the computation time needed tocreate the predictive model.
Poggi et al. (2019), PeerJ Comput. Sci., DOI 10.7717/peerj-cs.199 13/28
There are two main classes of attribute selection algorithms: those who analyze theperformance of the learner in the selection process (i.e., wrappers) and those who do notuse the learner (i.e., filters). The first class is usually computationally expensive since thelearner runs continuously to check how it performs when changing the attributes in thedataset. That leads to computation times that are two or more orders of magnitude largercompared to the learner itself. For this reason, we did only some limited experiments withlearner-aware attribute selection. In our test cases, the results obtained were marginallybetter than those obtained with processes not using the learner. Consequently, we used afilter-based approach in our in-depth analysis.
We used Correlation-based Feature Selection (CFS) (Hall & Holmes, 2003), which is thefirst method that evaluates (and hence ranks) subsets of attributes rather than individualattributes. The central hypothesis of this approach is that good attribute sets containattributes that are highly correlated with the class, yet uncorrelated with each other. At theheart of the algorithm is a subset evaluation heuristic that takes into account the usefulnessof individual attributes for predicting the class along with the level of intercorrelationamong them. The aforementioned technique has been used in the analysis presented in‘‘Analysis of the Quantitative Indicators of Applicants’’.
RESULTSThe aim of the analyses presented in this section is to answer the two Research Questions(RQs) discussed in ‘‘Introduction’’. Given the huge amount of data provided by thecurricula of the applicants, we want to understand if machine learning techniques canbe used to effectively distinguish between candidates who got the habilitation and thosewho did not (RQ1). We are also interested in identifying a small set of predictors that canbe used to perform accurate predictions for the different RFs and scientific levels of theASN (RQ2). We conclude this section with an assessment of the predictive power of ourapproach, in which we compare our best models with those that have been proposed inthe literature to solve similar problems.
Analysis of the recruitment fields and areasThe objective of the first experiment is to predict the results of the ASN (RQ1). We usedSVM, which is the best machine learning algorithm emerged from the tests discussed in‘‘Identification of the Prediction Algorithm’’. We classified our dataset with respect to theclass of candidates who got the habilitation using the SVM learner. We first split the datasetinto two partitions containing the data about candidates for level I and level II, respectively.For each partition, we classified separately the applicants of each RF. The results of ouranalysis are published in Poggi et al. (2018a), and are summarized by the boxplots in Fig. 2.The boxplot is a method for graphically depicting the distribution of data through theirquartiles. The central rectangle spans the first quartile to the third quartile. The segmentinside the rectangle shows the median, and ‘‘whiskers’’ above and below the box show thelocations of the minimum and maximum.
From these results, we observe that the performance of the learners for bibliometric andnon-bibliometric RFs are very similar, and that they are distributed evenly (i.e., there is not
Poggi et al. (2019), PeerJ Comput. Sci., DOI 10.7717/peerj-cs.199 14/28

Figure 2 Boxplots depicting the performance of the SVM algorithm for academic level I and II. Preci-sion, Recall and F-measure values are reported for bibliometric (A, C) and non-bibliometric (B, D) RFs.
Full-size DOI: 10.7717/peerjcs.199/fig-2
a polarization of bibliometric and non-bibliometric RFs). Moreover, we note that 154/184(83.7%) and 162/184 (88%) RFs have F-measure scores higher than 0.6 for professionallevel I and II, respectively.
We also investigated the performance of the SVM learner on the data partitioned in thescientific areas in which RFs are organized. To do so, we split the dataset into 16 partitions:
Poggi et al. (2019), PeerJ Comput. Sci., DOI 10.7717/peerj-cs.199 15/28

nine for bibliometric SAs (01-09), one for the macro sector 11/E (Psicology) which isbibliometric, five for non-bibliometric SAs (10-14), and one for the RFs 08/C1, 08/D1,08/E1, 08/E2 and 08/F1 which are non-bibliometric.
The results for both professional levels are summarized in Fig. 3, and the whole dataare reported in Poggi et al. (2018a). Also in this case, results are very accurate for bothbibliometric and non-bibliometric disciplines, with F-measure scores spanning from aminimum of 0.622 (07-AVM) and 0.640 (02-PHY) for professionals level I and II, anda maximum of 0.820 (11-HPP) and 0.838 (14-PSS) for professional levels I and II. Weobserve that, at the associate professor level, the performance for non-bibliometric SAs(Fig. 3D) are significantly better than for bibliometric SAs (Fig. 3C). Moreover, the varianceof the values is much lower for non-bibliometric SAs, as showed by the boxplots which aresignificantly more compressed.
Analysis of the quantitative indicators of applicantsThe objective of the next experiment is to identify a small set of predictors that allowsto perform accurate predictions of the ASN results (RQ2). To this end, we analyzed therelevance of the various predictors for classification purposes using the CFS algorithmdescribed in ‘‘Feature Selection Algorithm’’. The first step of our investigation consists ofsplitting our training set into partitions corresponding to the two professional levels of theASN, and running the CFS filters on the data of each RF. We then produced a ranking ofthe selected predictors by counting the occurrences of each of them in the results of theprevious computation. Figure 4 reports the top 15 predictors for the two professional levelsconsidered.
We used the best overall learner emerged from the aforementioned tests (i.e., SVM)and applied it, for each academic level and RF, considering the top 15 predictors. Theresults of our analysis on the 184 RFs are summarized in Fig. 5, and the whole data arereported in Poggi et al. (2018a). We observe that there has been a slight improvement inperformances if compared to those obtained using all the predictors: 162/184 (88%) and163/184 (88.6%) RFs have F-measure scores higher than 0.6 for professional level I and II,respectively. Moreover, also in this case, the results for bibliometric and non-bibliometricRFs are similar. An analysis of the indicators selected as top 15 predictors is presented in‘Discussion’.
EvaluationIn order to assess the predictive power of our approach, in this section we compare ourbest models with those that have been proposed in the literature to solve similar problems.As discussed in ‘‘Related Work’’, three works are particularly relevant for this task: Vieira’smodel (2014a) based on rank ordered regression, Jensen’s binomial regression model(2009), and the models developed by Tregellas et al. (2018).
A first analysis can be performed comparing the information summarized in Table 1about the sizes of the datasets and the scopes of these works with our investigation. Byconsidering the number of authors and papers, we observe that our dataset is some ordersof magnitude greater than the others: i.e., 59,149 authors (our work) vs. 174 (Vieira), 3,659
Poggi et al. (2019), PeerJ Comput. Sci., DOI 10.7717/peerj-cs.199 16/28

Figure 3 Boxplots depicting the performance of the SVM algorithm for academic level I and II. Preci-sion, Recall and F-measure values are reported for bibliometric (A, C) and non-bibliometric (B, D) SAs.
Full-size DOI: 10.7717/peerjcs.199/fig-3
(Jensen) and 363 (Tregellas) authors; 1,910,873 papers (our work) vs. 7,654 papers (Vieira).We also remark that Vieira’s (2014a) and Tregellas’s (2018) work are limited to very smallsamples of researchers from Portugal and the United States, while our and Jensen’s worksanalyze a nationwide population. Moreover, while the other works focused on a limitedset of indicators (Vieira’s (2014a) model is based on three indicators, Jensen’s (2009) oneight and Tregellas’s (2018) on ten), we extracted a richer set of indicators from candidates’CVs (326 predictors). We also observe that, while our work and Jensen’s (2009) cover allthe disciplines, Vieira (2014a) limits the analysis to seven disciplines in hard sciences, and
Poggi et al. (2019), PeerJ Comput. Sci., DOI 10.7717/peerj-cs.199 17/28

Figure 4 Top 15 predictors selected by the CFS filter for professional level I (A) and II (B). The x-axisshows how many times the predictors have been chosen by the CFS algorithm.
Full-size DOI: 10.7717/peerjcs.199/fig-4
Tregellas (2018) to biomedical sciences. Overall, our dataset is very wide and rich, and lessexposed to issues (e.g., biases) than those used in the other three works.
In order to evaluate the predictive power of our approach, we have to compare itsperformances with those of the aforementioned works. For this purpose, all the proposedpredictive models must be tested on the same data. Since none of the datasets used inthe considered works are freely available, we decided to test the models on representativesamples extracted from our dataset, and compare the results with our approach.
The first model proposed by Vieira (2014a) is based on a composite predictor thatencompasses 12 standard bibliometric indicators and that is obtained through factoranalysis. Unfortunately, the authors don’t provide a definition of such compositepredictor, nor they discuss the details on how it has been computed. Given the lackof such information, we observed that is impossible to replicate the model and decided toexclude Vieira’s (2014a) model from this experiment.
Jensen’s (2009) model is a binomial regression model based on eight indicators: h,hy , number of publications and citations, mean citations/paper, h/number of papers,age and gender. We decided to focus this analysis on the applicants to the associateprofessor level for two RFs: Informatics (01/B1) and Economics (13/A1). Thesetwo RFs have been chosen as representatives of bibliometric and non-bibliometricrecruitments fields because they best meet two important criteria: (i) they received avery high number of applications; (ii) the two populations (i.e., those who attainedthe habilitation and those who did not attained it) are well balanced. For the same
Poggi et al. (2019), PeerJ Comput. Sci., DOI 10.7717/peerj-cs.199 18/28

Figure 5 Boxplots depicting the performance of the SVM algorithm for academic level I and II usingthe top 15 predictors. Precision, Recall and F-measure values are reported for bibliometric (A, C) andnon-bibliometric (B, D) RFs.
Full-size DOI: 10.7717/peerjcs.199/fig-5
reason we also considered the SAs ‘‘Mathematics and Computer Science’’ (MCS-01,bibliometric) and ‘‘Economics and Statistics’’ (ECS-13, non-bibliometric). In this waywe are able to assess the predictive power of the models at different levels of granularity,both for bibliometric and non-bibliometric RFs and SAs. Since the indicators used byJensen’s (2009) models that were not present in our dataset (i.e., mean citations/paper,h/number of papers) could be derived from our data, we computed and added them to
Poggi et al. (2019), PeerJ Comput. Sci., DOI 10.7717/peerj-cs.199 19/28
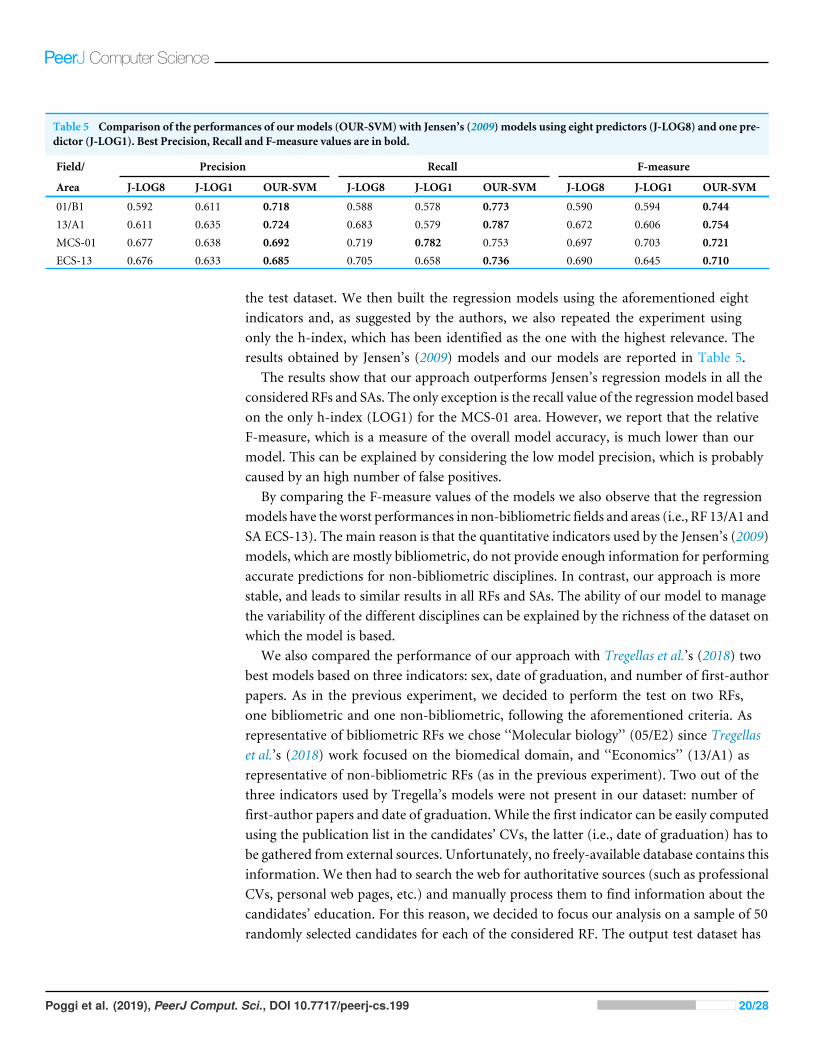
Table 5 Comparison of the performances of our models (OUR-SVM) with Jensen’s (2009) models using eight predictors (J-LOG8) and one pre-dictor (J-LOG1). Best Precision, Recall and F-measure values are in bold.
Field/ Precision Recall F-measure
Area J-LOG8 J-LOG1 OUR-SVM J-LOG8 J-LOG1 OUR-SVM J-LOG8 J-LOG1 OUR-SVM
01/B1 0.592 0.611 0.718 0.588 0.578 0.773 0.590 0.594 0.74413/A1 0.611 0.635 0.724 0.683 0.579 0.787 0.672 0.606 0.754MCS-01 0.677 0.638 0.692 0.719 0.782 0.753 0.697 0.703 0.721ECS-13 0.676 0.633 0.685 0.705 0.658 0.736 0.690 0.645 0.710
the test dataset. We then built the regression models using the aforementioned eightindicators and, as suggested by the authors, we also repeated the experiment usingonly the h-index, which has been identified as the one with the highest relevance. Theresults obtained by Jensen’s (2009) models and our models are reported in Table 5.
The results show that our approach outperforms Jensen’s regression models in all theconsidered RFs and SAs. The only exception is the recall value of the regressionmodel basedon the only h-index (LOG1) for the MCS-01 area. However, we report that the relativeF-measure, which is a measure of the overall model accuracy, is much lower than ourmodel. This can be explained by considering the low model precision, which is probablycaused by an high number of false positives.
By comparing the F-measure values of the models we also observe that the regressionmodels have theworst performances in non-bibliometric fields and areas (i.e., RF 13/A1 andSA ECS-13). The main reason is that the quantitative indicators used by the Jensen’s (2009)models, which are mostly bibliometric, do not provide enough information for performingaccurate predictions for non-bibliometric disciplines. In contrast, our approach is morestable, and leads to similar results in all RFs and SAs. The ability of our model to managethe variability of the different disciplines can be explained by the richness of the dataset onwhich the model is based.
We also compared the performance of our approach with Tregellas et al.’s (2018) twobest models based on three indicators: sex, date of graduation, and number of first-authorpapers. As in the previous experiment, we decided to perform the test on two RFs,one bibliometric and one non-bibliometric, following the aforementioned criteria. Asrepresentative of bibliometric RFs we chose ‘‘Molecular biology’’ (05/E2) since Tregellaset al.’s (2018) work focused on the biomedical domain, and ‘‘Economics’’ (13/A1) asrepresentative of non-bibliometric RFs (as in the previous experiment). Two out of thethree indicators used by Tregella’s models were not present in our dataset: number offirst-author papers and date of graduation. While the first indicator can be easily computedusing the publication list in the candidates’ CVs, the latter (i.e., date of graduation) has tobe gathered from external sources. Unfortunately, no freely-available database contains thisinformation. We then had to search the web for authoritative sources (such as professionalCVs, personal web pages, etc.) and manually process them to find information about thecandidates’ education. For this reason, we decided to focus our analysis on a sample of 50randomly selected candidates for each of the considered RF. The output test dataset has
Poggi et al. (2019), PeerJ Comput. Sci., DOI 10.7717/peerj-cs.199 20/28

Table 6 Comparison of the performances of our model (OUR-SVM) with Tregellas et al.’s (2018) two best models based on linear regression(T-LR) and support vector machines (T-SVM). Best Precision, Recall and F-measure values are in bold.
Field Precision Recall F-measure
T-LR T-SVM OUR-SVM T-LR T-SVM OUR-SVM T-LR T-SVM OUR-SVM
05/E2 0.649 0.628 0.750 0.750 0.844 0.750 0.696 0.720 0.75013/A1 0.440 0.550 0.690 0.393 0.393 0.645 0.415 0.458 0.667
been used for our experiment. The results of our model and Tregellas et al.’s (2018) modelsbased on linear regression and SVM classifiers are reported in Table 6.
The results show that overall our approach outperforms Tregella’s models. Also inthis case there is an exception: the recall value of Tregella’s model based on SVMs in RF05/E2. However, by analyzing the relative F-measure, we note that Tregella’s overall modelaccuracy is lower than our model: 0.720 for Tregella’s SVM-based model, and 0.750 forour model. This is caused by the high number of false positives produced by Tregella’spredictive model, which consequently results in lower precision and F-measure valuescompared to our model.
By comparing the F-measure values of the models we observe that Tregella’s modelshave very low performances in the non-bibliometric RF (13/A1). We also note that, evenconsidering the specific discipline for which Tregella’s models have been designed for (i.e.,RF 05/E2 - ‘‘Molecular biology’’, which is a discipline in the the biomedical domain), ourmodel has better performances than two Tregella’s regression models. This confirms thatour approach is more stable and general, being able to perform accurate predictions in verydifferent RFs and disciplines. As discussed in the previous experiment, the ability of ourmodels to manage the variability and specificity of different disciplines can be explainedby the richness of the features in our datasets, which have been automatically extractedfrom candidates’ CVs, and that are fundamental to accurately predict the result of complexhuman processes (such as evaluation procedures).
DISCUSSIONThis research has been driven by the two research questions described in the introduction,and that can be summarized as follows:
• RQ1: Is it possible to predict the results of the ASN using only the information containedin the candidates’ CVs?
• RQ2: Is it possible to identify a small set of predictors that can be used to predict theASN results?
The analyses presented in ‘Results’ show that machine learning techniques cansuccessfully resolve the binary classification problem of discerning between candidatesthat attained the habilitation and those who did not on the base of the huge amount ofquantitative data extracted from applicants’ CVs with a good accuracy. In fact, the results ofthe experiments for RQ1 have F-measure values higher 0.6 in 154/184 (83.7%) RFs and in162/184 (88%) RFs for academic levels I and II, respectively. Moreover, the performances
Poggi et al. (2019), PeerJ Comput. Sci., DOI 10.7717/peerj-cs.199 21/28

are very similar and uniform for both bibliometric and non-bibliometric disciplines, anddo not show a polarization of the results for the two classes of disciplines.
Through an attribute selection process we identified 15 top predictors, and the predictionmodels based on such predictors resulted to have F-measure values higher than 0.6in 162/184 (88%) RFs and 163/184 (88.6%) RFs for academic levels I and II, respectively(RQ2). Also in this case, the results are uniform and equally distributed among bibliometricand non-bibliometric disciplines.
Some interesting considerations can be made by analyzing and comparing the top 15predictors for the two academic levels (i.e., associate and full professor). First of all weremark that, as is obvious, many standard bibliometric indicators have been identified asrelevant. In particular, seven of them are shared by both associate and full professor levels:the number of publications with impact factor since ever (pub_IF_ALL) and since 2000(pub_IF_Y12), the number of publications with category (publication_with_category),the cumulative impact factor since ever (IF_ALL) and in 2008-12 (IF_Y5), and the numberof journal papers since ever (journal) and since 2000 (journal_Y12) - see Fig. 4. However,we note that the first predictor (i.e., the one selected by the feature selection algorithm formost of the RFs) for both levels is Y_affiliation_same (i.e., the maximum number ofyears with affiliation to the same university). This is a non-bibliometric indicator which hasnot been considered by any of the papers reviewed in the ‘Related Work’. We note that thisresult is coherent with the Italian model of academic careers, which is typically linear andinbreeding-based, meaning that most academics use to stay in the same university frombasic studies up to the research career (Aittola et al., 2009). We plan to further investigatethe correlation between working for the same institutions and the success to the ASN, andto analyze if there are differences among disciplines.
We also remark that there are interesting observations that concern each of the twolevels and highlight peculiar aspects of each of them. For instance, we note that the yearof birth (born_Y) is among the top 15 predictors for associate professors and not forfull professor, suggesting that the age may be a relevant feature for the success at thebeginning of an Italian scholar’s career. This result is analogous to the one presented inTregellas et al. (2018), in which a similar indicator (i.e., the date of graduation) is usedfor predicting career outcomes of young researchers. Conversely, years_no_pub (i.e., thenumber of years in which no papers written by the candidate has been published) is arelevant predictor for full professor and not for associate professor. An explanation of thisfact is that evaluation committees may have considered continuity in publications as arelevant factor in the evaluation of candidates to the full professor level (e.g., for discerningbetween candidates who have been active throughout their careers, and those who havenot always been productive). Also, in this case, we plan to perform a deeper analysis of thispoint as future work.
An evaluation of the predictive power of our approach has been performed by comparingthe results of our models with the best models that have been proposed in the literature topredict academic promotions. The comparison shows that our model outperforms Jensens’(2009) binomial regression models and Tregella’s models on both bibliometric and non-bibliometric disciplines. This outcome proves that it is possible to predict with a good
Poggi et al. (2019), PeerJ Comput. Sci., DOI 10.7717/peerj-cs.199 22/28

accuracy the results of complex human processes such as peer-review assessments throughcomputational methods. Moreover, the performance difference between the approachesis more evident for non-bibliometric disciplines. We observe that the outperformances ofour results (overall and for non-bibliometric disciplines) are a straight consequence of therichness and quality of the predictors extracted form candidates’ CVs. An explanation isthat models which are mostly based on bibliometric indicators are not able to fully catchand explain all the different factors (e.g., cultural, social, contextual, scientific, etc.) thatplay a key role in peer-review evaluation processes.
CONCLUSIONSThe results of this work are encouraging. We remark that the final goal of our work isnot substituting evaluation committees by algorithms, but providing tools for supportingcandidates, evaluators and policy makers involved in complex assessment processes such asthe ASN. A candidate may use our system to self-evaluate his/her CV. Committee memberscould evaluate the consistency of their decisions across different evaluation sessions. Incase of an appeal by rejected candidates to a higher panel, the panel itself could exploitour approach to analyze anomalies. Our system could also be useful for a foreign scholarwho could get insight about how his CV is competitive against the Italian benchmarks.Also, policy makers could benefit from a system based on machine learning techniquessuch as the one presented in this paper in their decisions. At the local level, departmentheads and university presidents may evaluate people to recruit by guessing if they would behabilitated, since there are incentives. At the national level, the government may considerthe results of our analysis to simplify the evaluation process. For instance, it could reducethe paperwork focusing on factors we identified as more relevant. Moreover, as alreadydiscussed, our approach would help committee members to minimize anomalies in theirdecisions. This would have the benefit of minimizing the number of requests of reviewsand appeals, saving the time of both academic and administrative staff. Future directions ofthis research line consists in extending our analysis to more recent sessions of the ASN, andto analyze the impact of mobility on the career of academics. It would also be interestingto consider the applicants that have not been correctly classified by the learner in order toimprove the approach and also have a more precise understanding of the factors that havebeen more relevant for assessments of academics performed by humans such as the ASN.
ACKNOWLEDGEMENTSWe thank Andrea Bonaccorsi (University of Pisa) and Riccardo Fini (University ofBologna), who provided important considerations and discussions on this work. Wewould also thank the reviewers for their insightful comments.
Poggi et al. (2019), PeerJ Comput. Sci., DOI 10.7717/peerj-cs.199 23/28
ADDITIONAL INFORMATION AND DECLARATIONS
FundingThis research has been supported by the Italian National Agency for the Assessment ofUniversities and Research (ANVUR) within the Uniform Representation of CurricularAttributes (URCA) project (see articolo 4 of the ‘Concorso Pubblico di Idee di Ricerca’ -bando ANVUR, 12 February 2015). Paolo Ciancarini was also supported by CINI (ENAVproject) and by CNR-ISTC. There was no additional external funding received for thisstudy. The funders had no role in study design, data collection and analysis, decision topublish, or preparation of the manuscript.
Grant DisclosuresThe following grant information was disclosed by the authors:Italian National Agency for the Assessment of Universities and Research (ANVUR).CINI (ENAV project).CNR-ISTC.
Competing InterestsSilvio Peroni is an Academic Editor for PeerJ Computer Science.
Author Contributions• Francesco Poggi conceived and designed the experiments, performed the experiments,analyzed the data, contributed reagents/materials/analysis tools, prepared figures and/ortables, performed the computation work, authored or reviewed drafts of the paper,approved the final draft. Francesco Poggi is the main contributor of this work and theprincipal investigator of the project URCA that supported the research presented in thispaper.
• Paolo Ciancarini and Silvio Peroni authored or reviewed drafts of the paper, approvedthe final draft.
• Aldo Gangemi analyzed the data, authored or reviewed drafts of the paper.• Andrea Giovanni Nuzzolese and Valentina Presutti authored or reviewed drafts of thepaper.
Data AvailabilityThe following information was supplied regarding data availability:
The following GitHub repository contains raw data and code:https://github.com/sosgang/asn2012-analysis.The data/input/ folder contains the input data, and the data/output/ folder contains the
output data of the analyses and experiments.The src/ folder contains the Java source code used to perform the analyses and
experiments discussed in the paper. The target folder contains a packaged runnableJAR to execute the analyses/experiments.
Poggi et al. (2019), PeerJ Comput. Sci., DOI 10.7717/peerj-cs.199 24/28

REFERENCESAbramo G, D’Angelo CA, Caprasecca A. 2009. Allocative efficiency in public
research funding: can bibliometrics help? Research Policy 38(1):206–215DOI 10.1016/j.respol.2008.11.001.
Aha DW, Kibler D, Albert MK. 1991. Instance-based learning algorithms.MachineLearning 6(1):37–66 DOI 10.1023/A:1022689900470.
Aittola H, Kiviniemi U, Honkimäki S, Muhonen R, HuuskoM, Ursin J. 2009. TheBologna process and internationalization—consequences for Italian academic life.Higher Education in Europe 34(3–4):303–312 DOI 10.1080/03797720903355521.
Aksnes D. 2003. A macro study of self-citation. Scientometrics 56(2):235–246DOI 10.1023/A:1021919228368.
Bornmann L. 2013.How to analyze percentile citation impact data meaningfully inbibliometrics: the statistical analysis of distributions, percentile rank classes, andtop-cited papers. Journal of the Association for Information Science and Technology64(3):587–595 DOI 10.1002/asi.22792.
Bornmann L, Daniel H-D. 2006. Selecting scientific excellence through committee peerreview—a citation analysis of publications previously published to approval or rejec-tion of post-doctoral research fellowship applicants. Scientometrics 68(3):427–440DOI 10.1007/s11192-006-0121-1.
Bornmann L, Daniel H-D. 2007. Convergent validation of peer review decisions usingthe h index: extent of and reasons for type I and type II errors. Journal of Informetrics1(3):204–213 DOI 10.1016/j.joi.2007.01.002.
Bornmann L, Haunschild R. 2018. Do altmetrics correlate with the quality of papers? Alarge-scale empirical study based on F1000Prime data. PLOS ONE 13(5):e0197133DOI 10.1371/journal.pone.0197133.
Bornmann L,Wallon G, Ledin A. 2008. Does the committee peer review select thebest applicants for funding? An investigation of the selection process for twoEuropean molecular biology organization programmes. PLOS ONE 3(10):e3480DOI 10.1371/journal.pone.0003480.
Breiman L. 2001. Random forests.Machine Learning 45(1):5–32DOI 10.1023/A:1010933404324.
Cronin B, Meho L. 2006. Using the h-index to rank influential information scientists.Journal of the Association for Information Science and Technology 57(9):1275–1278DOI 10.1002/asi.20354.
Danell R. 2011. Can the quality of scientific work be predicted using information onthe author’s track record? Journal of the Association for Information Science andTechnology 62(1):50–60 DOI 10.1002/asi.21454.
Di Iorio A, Peroni S, Poggi F. 2019. Open data to evaluate academic researchers: anexperiment with the Italian Scientific Habilitation. In: ISSI 2019-17th internationalconference on scientometrics and informetrics, conference proceedings.
Poggi et al. (2019), PeerJ Comput. Sci., DOI 10.7717/peerj-cs.199 25/28

Franceschet M. 2009. A cluster analysis of scholar and journal bibliometric indicators.Journal of the Association for Information Science and Technology 60(10):1950–1964DOI 10.1002/asi.21152.
Franceschet M, Costantini A. 2011. The first Italian research assessment exercise: abibliometric perspective. Journal of Informetrics 5(2):275–291DOI 10.1016/j.joi.2010.12.002.
Fu LD, Aliferis CF. 2010. Using content-based and bibliometric features for machinelearning models to predict citation counts in the biomedical literature. Scientometrics85(1):257–270 DOI 10.1007/s11192-010-0160-5.
Hall MA, Holmes G. 2003. Benchmarking attribute selection techniques for dis-crete class data mining. IEEE Transactions on Knowledge and Data Engineering15(6):1437–1447 DOI 10.1109/TKDE.2003.1245283.
HeH, Garcia EA. 2009. Learning from imbalanced data. IEEE Transactions on Knowledgeand Data Engineering 21(9):1263–1284 DOI 10.1109/TKDE.2008.239.
Ibáñez A, Armañanzas R, Bielza C, Larrañaga P. 2016. Genetic algorithms and GaussianBayesian networks to uncover the predictive core set of bibliometric indices.Journal of the Association for Information Science and Technology 67(7):1703–1721DOI 10.1002/asi.23467.
Jensen P, Rouquier J-B, Croissant Y. 2009. Testing bibliometric indicators by theirprediction of scientists promotions. Scientometrics 78(3):467–479DOI 10.1007/s11192-007-2014-3.
John GH, Langley P. 1995. Estimating continuous distributions in Bayesian classifiers.In: Proc. 11th conference on uncertainty in artificial intelligence. Burlington: MorganKaufmann, 338–345.
Keerthi SS, Shevade SK, Bhattacharyya C, Murthy KRK. 2001. Improvements to Platt’sSMO algorithm for SVM classifier design. Neural Computation 13(3):637–649DOI 10.1162/089976601300014493.
Law. 2011. Rules concerning the organization of the universities, academic employeesand recruitment procedures, empowering the government to foster the qualityand efficiency of the university system (Norme in materia di organizzazione delleuniversità, di personale accademico e reclutamento, nonche’ delega al Governoper incentivare la qualità e l’efficienza del sistema universitario), Gazzetta Ufficialen. 10 del 14 gennaio 2011 - Suppl. Ordinario n. 11. Available at http://www.gazzettaufficiale.it/ eli/ id/2011/01/14/011G0009/ sg (accessed on 17 March 2019).
Leydesdorff L. 2009.How are new citation-based journal indicators adding to the bib-liometric toolbox? Journal of the Association for Information Science and Technology60(7):1327–1336 DOI 10.1002/asi.21024.
Lindahl J. 2018. Predicting research excellence at the individual level: the impor-tance of publication rate, top journal publications, and top 10% publications inthe case of early career mathematicians. Journal of Informetrics 12(2):518–533DOI 10.1016/j.joi.2018.04.002.
Marzolla M. 2015. Quantitative analysis of the Italian national scientific qualification.Journal of Informetrics 9(2):285–316 DOI 10.1016/j.joi.2015.02.006.
Poggi et al. (2019), PeerJ Comput. Sci., DOI 10.7717/peerj-cs.199 26/28

Ministerial Decree 159. 2012. Redefinition of scientific disciplines (Rideterminazione deisettori concorsuali), Gazzetta Ufficiale Serie Generale n. 137 del 14-06-2012—Suppl.Ordinario n. 119). Available at http://www.gazzettaufficiale.it/ eli/ id/2012/06/14/12A06786/ sg (accessed on 17 March 2019).
Nederhof AJ, Van Raan AF. 1987. Peer review and bibliometric indicators of scientificperformance: a comparison of cum laude doctorates with ordinary doctorates inphysics. Scientometrics 11(5–6):333–350 DOI 10.1007/BF02279353.
Norris M, Oppenheim C. 2003. Citation counts and the Research Assessment ExerciseV: Archaeology and the 2001 RAE. Journal of Documentation 59(6):709–730DOI 10.1108/00220410310698734.
Nuzzolese AG, Ciancarini P, Gangemi A, Peroni S, Poggi F, Presutti V. 2019. Doaltmetrics work for assessing research quality? Scientometrics 118(2):539–562DOI 10.1007/s11192-018-2988-z.
Peroni S, Ciancarini P, Gangemi A, Nuzzolese AG, Poggi F, Presutti V. 2019. Thepractice of self-citations: a longitudinal study. ArXiv preprint. arXiv:1903.06142(accessed on 17 March 2019).
Poggi F, Ciancarini P, Gangemi A, Nuzzolese AG, Peroni S, Presutti V. 2018a. Pre-dicting the results of evaluation procedures of academics: additional materials.DOI 10.6084/m9.figshare.6814550.
Poggi F, Ciancarini P, Gangemi A, Nuzzolese AG, Peroni S, Presutti V. 2018b.Predicting the results of evaluation procedures of academics: appendices.DOI 10.6084/m9.figshare.6814502.
Poggi F, Cigna G, Nuzzolese AG. 2016. Enhancing open data to linked open data withODMiner. In: LD4IE@ISWC. 44–50. Available at http:// ceur-ws.org/Vol-1699/paper-06.pdf (accessed on 17 March 2019).
Quinlan JR. 2014. C4.5: programs for machine learning. San Mateo: Elsevier.Taylor J. 2011. The assessment of research quality in UK universities: peer review or
metrics? British Journal of Management 22(2):202–217DOI 10.1111/j.1467-8551.2010.00722.x.
Tregellas JR, Smucny J, Rojas DC, Legget KT. 2018. Predicting academic career out-comes by predoctoral publication record. PeerJ 6:e5707 DOI 10.7717/peerj.5707.
Van Raan AF. 2006. Comparison of the Hirsch-index with standard bibliometricindicators and with peer judgment for 147 chemistry research groups. Scientometrics67(3):491–502 DOI 10.1556/Scient.67.2006.3.10.
Vieira ES, Cabral JA, Gomes JA. 2014a. Definition of a model based on bibliometricindicators for assessing applicants to academic positions. Journal of the Associationfor Information Science and Technology 65(3):560–577 DOI 10.1002/asi.22981.
Vieira ES, Cabral JA, Gomes JA. 2014b.How good is a model based on bibliometricindicators in predicting the final decisions made by peers? Journal of Informetrics8(2):390–405 DOI 10.1016/j.joi.2014.01.012.
W3COWLWorking Group. 2012. OWL 2 Web Ontology Language. Available at https://www.w3.org/TR/owl2-overview/ (accessed on 17 March 2019).
Poggi et al. (2019), PeerJ Comput. Sci., DOI 10.7717/peerj-cs.199 27/28

Wouters P, Thelwall M, Kousha K,Waltman L, De Rijcke S, Rushforth A, FranssenT. 2015. The metric tide: Correlation analysis of REF2014 scores and metrics(Supplementary Report II to the Independent Review of the Role of Metrics inResearch Assessment and Management). London: Higher Education FundingCouncil for England (HEFCE) DOI 10.13140/RG.2.1.3362.4162.
Poggi et al. (2019), PeerJ Comput. Sci., DOI 10.7717/peerj-cs.199 28/28